integrated livelihood baseline and … livelihood baseline and impact assessment tool kit 4 ngo non-...
TRANSCRIPT
Integrated Livelihood Baseline and Impact Assessment Tool Kit
1
INTEGRATED LIVELIHOOD BASELINE AND
IMPACT ASSESSMENT (ILBIA) TOOL KIT
FOR CLIMATE RISK
MANAGEMENT
Food and Agriculture Organization of the United Nations
Selvaraju Ramasamy
2010
Integrated Livelihood Baseline and Impact Assessment Tool Kit
2
The designations employed and the presentation of material in this information
product do not imply the expression of any opinion whatsoever on the part of the
Food and Agriculture Organization of the United Nations (FAO) concerning the legal
or development status of any country, territory, city or area or of its authorities, or
concerning the delimitation of its frontiers or boundaries. The mention of specific
companies or products of manufacturers, whether or not these have been patented,
does not imply that these have been endorsed or recommended by FAO in preference
to others of a similar nature that are not mentioned. The views expressed in this
information product are those of the author(s) and do not necessarily reflect the views
of FAO.
Integrated Livelihood Baseline and Impact Assessment Tool Kit
3
Acronyms and Abbreviations
ABIS Agricultural Business Information Systems
ACA Agricultural Community Assessor
ADRM Agricultural Disaster Risk Management
AEO Agricultural Extension Officer
ALZ Agricultural Livelihood Zones
CBA Community Based Assessor
CARDI Caribbean Agricultural Research and Development Institute
CASE College of Agriculture, Science and Education
CBO Community Based Organization
CC Climate Change
CIB Coffee Industry Board
CPOA Closest point of approach
DLA Detailed Livelihood Assessment
DPM Deputy Parish Manager
DRM Disaster Risk Management
DRR Disaster Risk reduction
EA Extension Area
ECLAC Economic Commission for Latin America and the Caribbean
ED Electoral Division
EJASP Eastern Jamaica Agricultural Support Project
EOC Emergency Operations Centre
EU European Union
FAO Food and Agriculture Organization
FAO Food and Agriculture Organization of the United Nations
FHH Female Headed Household
GDP Gross Domestic Product
GIS Geographic Information Systems
GIS Geographical Information System
GOJ Government of Jamaica
GPS Global Positioning System
GPS Global Positioning System
HEART Human Employment and Resource Training (National
Training Agency)
HFA Hyogo Framework of Action
HH Household Head
ICTs Information and Communication Technologies
ILIA Initial Livelihood Impact Appraisal
ILO International Labour Organization
ISDR International Strategy for Disaster Reduction
JAS Jamaica Agricultural Society
LA Livelihood Assessment
LAT Livelihood Assessment Toolkit
LBA Livelihood Baseline Assessment
LICJ Land Information System of Jamaica
MDGs Millennium Development Goals
MOA Ministry of Agriculture
MOU Memorandum of Understanding
N&S “Necessary and Sufficient”
NADRM National Agriculture Disaster Risk Management
NAEOC National Agriculture Emergency Operations Centre
NC National Consultant
NDRM National Disaster Risk Management
NEOC National Emergency Operations Centre
Integrated Livelihood Baseline and Impact Assessment Tool Kit
4
NGO Non- Governmental Organization
NHMP National Hazard Mitigation Policy
NIC National Irrigation Commission
NSGP National School Garden Program
NWA National Works Agency
NYC National Youth Service
ODPEM Office of Disaster Preparedness and Emergency Management
PADRM Parish Agriculture Disaster Risk Management
PAEOC Parish Agriculture Emergency Operations Centre
PAM Parish Manager
PC Parish Council
PDC Parish Disaster Committee
PEOC Parish Emergency Operations Centre
PIOJ Planning Institute of Jamaica
PRA Participatory Rural Appraisal
RADA Rural Agricultural Development Authority
RPPU Rural Physical Planning Unit
SDC Social Development Commission
SOP Standard Operating Procedures
STATIN Statistical Institute of Jamaica
TCP Technical Cooperation Project
TOR Terms of Reference
TTTI Technology, Training and Technical Information
UNDP United Nations Development Programme
UTECH University of Technology
UWI University of the West Indies
Integrated Livelihood Baseline and Impact Assessment Tool Kit
5
Table of Contents
TABLE OF CONTENTS ....................................................................................................................... 5
INTRODUCTION .................................................................................................................................. 6
BACKGROUND ...................................................................................................................................... 6 Importance of livelihood baseline data ........................................................................................... 6 Purpose of the manual .................................................................................................................... 7
MANUAL DEVELOPMENT ...................................................................................................................... 8 How to use this manual? ................................................................................................................. 8 Structure of the Manual .................................................................................................................. 8 Assumptions .................................................................................................................................... 9
MODULE 1: NATIONAL CONTEXT ............................................................................................... 10
AGRICULTURE AND FOOD SECURITY PERSPECTIVES ........................................................................... 10 NATIONAL POLICY FRAMEWORKS ...................................................................................................... 11
Vision of the NDRM ...................................................................................................................... 11 Strategic Goals of the ADRM ........................................................................................................ 11 Roles and Responsibilities under the ADRM Plan ........................................................................ 12 Key components of ADRM Plan .................................................................................................... 13
MODULE 2: APPROACH AND METHODOLOGY ....................................................................... 17
THE LIVELIHOOD ASSESSMENT APPROACH ........................................................................................ 17 Livelihood Assessment Process ..................................................................................................... 17 Key Benefits of Livelihood Assessment tools................................................................................. 19
STEPS IN THE INTEGRATED LIVELIHOOD BASELINE AND IMPACT ASSESSMENT.................................... 19 DAMAGE AND LOSS ASSESSMENT METHODOLOGY .............................................................................. 20
Basic principles and definition ..................................................................................................... 20 Quantification of damage and loss ............................................................................................... 21 Damage to farmland ..................................................................................................................... 22 Damage to physical infrastructure................................................................................................ 22 Loss of production of field crops ................................................................................................... 22 Loss of production of plantation crops ......................................................................................... 23 Production loss to animals ............................................................................................................ 24 Production loss to inland fishery .................................................................................................. 24 Losses of stock .............................................................................................................................. 24
MODULE 3: LIVELIHOOD BASELINE ASSESSMENT .............................................................. 26
THE LIVELIHOOD BASELINE ASSESSMENT .......................................................................................... 26 The LB data collection .................................................................................................................. 26 Qualitative and Participatory Tools ............................................................................................. 28 Details of Investigation for the LBA.............................................................................................. 29 Steps in the Livelihood Baseline Process ...................................................................................... 29
MODULE 4: INITIAL LIVELIHOOD IMPACT ASSESSMENT (ILIA) ..................................... 36
OBJECTIVES AND SCOPE OF THE ILIA ................................................................................................ 36 When is an ILIA done? .................................................................................................................. 36 WHAT Does the ILIA Measure? ................................................................................................... 36 KEY USES and OUTPUTS of the ILIA ......................................................................................... 36
STEPS IN THE ILIA PROCESS ............................................................................................................... 37
MODULE 5: CONDUCTING THE DETAILED LIVELIHOOD IMPACT ASSESSMENT
(DLIA) ................................................................................................................................................... 46
DETAILED LIVELIHOOD IMPACT ASSESSMENT PROCESS .................................................................... 46 Overview of DLA process ............................................................................................................. 46 Selecting sites and Sampling ......................................................................................................... 47
Integrated Livelihood Baseline and Impact Assessment Tool Kit
6
Introduction
Background
As a tropical island, and like all other countries within CARICOM, Jamaica is prone to a
variety of natural and hydro-meteorological hazards such as hurricanes, floods, droughts, and
occasional intensive rainfall that can often result in landslides. Earthquakes and bush fires are
also hazards that are sometimes experienced and result in considerable damage to human life
and livelihoods.
While the safety of human life is paramount in the face of such events, minimizing their
impact on livelihoods is equally as critical. Table 1 provides a preliminary overview of the
type of impact that the agricultural sector has experienced in recent decades from hurricane
impact alone. As a primary employer of labour on the island, losses in the agricultural sector
not only directly affect the livelihoods of farm families and rural communities, but also
endanger the country’s national food security and the livelihoods of all the other agriculturally
related economic activities (such as post-harvesting operations, green house production,
marketing, export, input suppliers, and so forth).
Minimizing the impact of disasters on the agricultural and fisheries sector is especially
important for the small-scale farming sector. Jamaica’s farmers are in fact the most resource
deficient accounting for nearly 80 percent of all farms in Jamaica although having access to
less than 15% of total arable area (Spence, 2008:4). This means that these small farmers are
the most vulnerable to hydro-meteorological hazards and as such must be the main target of
interventions to mitigate impacts and promote sustainability of the sector.
As a result, over the past several years, Disaster Risk Management (DRM) approaches have
been emphasing preparedness and mitigation and have been putting more emphasis on
community-based disaster management planning.
According to Jamaica’s Office for Disaster Preparedness and Emergency Mitigation
(ODPEM), “ Disaster preparedness is a dynamic function, which includes the identification of
disaster threats and risks throughout the country and the formulation of plans to create a state
of readiness to meet the needs of victims when a disaster strikes”.
In order to minimize the impact on agricultural livelihoods, mitigation measures need to be
put in place before disastrous events occur, and timely livelihood response mechanisms need
to be activated immediately afterwards when they do, in order to provide opportunities for
speedy recovery. Such preparatory and readiness steps in turn require a full appreciation of
how agriculture, forestry and fisheries fit within an overall sustainable livelihood framework
and require specific tools and skills for collecting and analyzing livelihood data both before
and after such events take place.
Importance of livelihood baseline data
To be truly effective, both mitigation/preparation and response measures, require detailed
livelihood assessment tools that are specific for the sector. Responses can be quicker and
more targeted if it is known in advance, which rural households and persons are more likely
to be vulnerable and if it is possible to map out their location. Having sound quantifiable data
of existing agricultural assets and what might likely be damaged before a disaster strikes, is
also critical for putting in place appropriate mitigation measures and for planning appropriate
post-disaster compensation, as well as for improving coping mechanisms and recovery and
rebuilding efforts. To date, existing tools for assessing the economic and social impact of
Integrated Livelihood Baseline and Impact Assessment Tool Kit
7
disasters have been somewhat ad hoc or particularly weak with respect to agriculture, forestry
and fisheries.
For example, under Jamaica’s overall National Disaster Risk Mitigation (NDRM) plan, the
Office of Disaster Preparedness and Emergency Management (ODPEM) has adapted
assessment tools such as the “Handbook for Estimating the Socio-Economic and
Environmental Effects of Disasters” produced through the Economic Commission for Latin
America and the Caribbean (ECLAC).1 The ECLAC handbook is highly useful in suggesting
checklists for impact assessment of damage to homes, schools, hospitals and infrastructure.
Section Four, which deals with agriculture, is useful as a guide for identifying the types of
data and overall impact totals that are needed, but does not provide the detailed types of
checklists that agricultural specialists require in order to collect and produce accurate baseline
assessments or detailed post-disaster impact assessments. In other words, existing tools have
partly identified “what” needs to be collected, but do not suggest “how” this should be done.
Unlike the other sectors (business, health, education) which the ECLAC tools adequately
cover, the agricultural sector is very much a moving target with most small farmers changing
their cropping production patterns every 3-4 months, depending on what the market demands.
Trying to capture this fluid picture is far more difficult than assessing damage to fixed assets
such as schools, hospitals, clinics, for stores.
As a result, when disasters do strike the sector, impact is most often reported in estimated
percentage terms, but without accurate, quantifiable losses. This lack of robust baseline
information has in turn limited the sector’s ability to not only plan targeted mitigation
measures, but has also limited its ability to benefit from international assistance for short-term
recovery.
Purpose of the manual
In order to help the agricultural and fisheries sector truly mitigate and prepare rural
communities to better cope with hazards and disasters, high quality information is vital – both
before and after such events occur so that preparedness and mitigation steps that can be put in
place ahead of time to especially assist vulnerable households (HHs) in the agricultural sector
to become more resilient.
But it is equally as important that this information can be captured through the use of locally
relevant data gathering tools that are relatively easy and flexible to use, and through the
creation of data collection systems structures that make the best use of the human, financial
and physical resources that are available.
As a moving target, impact on the agricultural sector has been difficult to measure when
disasters have occurred. Small farmers change crops regularly according to market demands,
and extension staff have resource challenges that limit the extent to which they are physically
able to assess damage over wide geographical areas. Both better data collection and
assessment tools are needed, as are better reporting systems that maximize the use of human
resources at the local community level on up to the parish level office.
The current manual seeks to outline the tools, checklists, and systems needed to make such
data gathering and reporting possible.
1 Economic Commission for Latin America and the Caribbean (ECLAC). Handbook for Estimating the
Socio-Economic and Environmental Effects of Disasters.
(http://siteresources.worldbank.org/INTDISMGMT/Resources/intro.pdf)
Integrated Livelihood Baseline and Impact Assessment Tool Kit
8
Manual development
However, the present manual has also benefitted greatly from the testing of LAT tools that
were introduced to RADA extension officers during the months of February to April, 2009.
During a three month training programme, officers experimented with a variety of LAT tools
and checklists and were able provide critical feedback as their usefulness and relevance for
the Jamaican context. As a result, new checklists and procedures were generated with their
input, while others were found to be less useful.
It should be noted however, that livelihood assessment is still a new and evolving process in
the context of Jamaican agriculture. The manual should be treated as a “living document” that
provides a menu of options for RADA officers and their partners to use in doing such
assessments. It should therefore be revised on a regular basis as the tools are further refined in
the field, and as new needs come to light.
How to use this manual?
This manual has been designed as a guideline for use by staff of the Ministry of Agriculture
(MOA) and Agricultural Extension Officers (AEOs) of the Rural Agricultural Development
Authority (RADA) in conjunction with other team members and agencies who are involved in
livelihood impact assessment and disaster preparedness and mitigation.
It is meant to be as user friendly as possible and to provide the MOA and RADA with the
skills, tools, checklists, and operational procedures that are needed to ensure that the
agricultural sector is as resilient and as prepared as possible, should a disaster occur, and to
also make it as easy as possible to assess damage and to respond in the case of such an event.
Structure of the Manual
The manual has five components:
A theoretical component that:
explains the vision and policy behind the tool kit;
outlines the purpose and objective of the tool kit;
and explains how the tool kit facilitates Jamaica’s Agricultural Disaster Risk
Management (ADRM) plan in the context of the country’s overall National Disaster
Risk Management strategy
This component provides users with a clear understanding of what the tool kit is in the
context of the agricultural sector; why it is important; and how it contributes to mitigation and
preparedness.
The second component covers operational and procedural considerations, and:
defines the roles and responsibilities of RADA extension officers vis-à-vis other data
collection team members (who needs to be involved at each level);
outlines the various phases involved in doing Livelihood Assessment (LA) analyses.
The third component introduces the specific steps, tools and checklists for conducting three
main core types of livelihood assessments, including:
Livelihood Baseline Assessments;
Initial Impact Assessments and Flash Appeals; and
Detailed Livelihood Assessment.
Integrated Livelihood Baseline and Impact Assessment Tool Kit
9
Each of these are in turn essentially treated as stand alone and discrete “mini modules” and
introduce users to the specific set of skills and steps required to undertaken them properly. For
each module a set of question checklists and related planning and reporting templates are
provided.
A fourth component is essentially a tool box with a complete set of participatory tools that
can be mixed and matched for any of the above modules, if so desired. Examples of each are
provided along with blank templates for ease of use.
A fifth component lists additional resources and contact information that can be examined
for further consideration if so desired.
Assumptions
The manual has been designed to facilitate research and implementation of the ADRM. For
this reason, it has been designed to support the roles and responsibilities of RADA as have
been designated under the ADRM framework, but is especially meant to facilitate the
agricultural livelihood data collection work that needs to take place within each Agricultural
Extension Area (AEA) at the Parish level. In this context, it is further assumed however, that
three main conditions will be put in place as have been recommended under the ADRM plan
itself. These assumptions are as follows:
1. That RADA’s Zonal Managers and Parish Managers (PAMs) will also be trained in
Livelihood Assessment Analysis as they in turn need to support and sanction the
work of the AEOs in the field;
2. That a National ADRM Unit will be established within RADA to process parish level
LA reports once submitted by the PAMs and that the NADRM Unit will also assist in
generating appropriate response typologies on an annual basis;
3. That as has already been done by the Office of Disaster Preparedness and Emergency
Management (ODPEM), RADA will identify and train a set of community based
assessors (CBAs) to assist the AEOs with LA data collection and field work in
recognition that the extension areas are far too large for RADA staff alone to cover on
an timely basis;
4. That the sites to be included in the LA for each extension area will conducted
according to Electoral Divisions (EDs) so that the data collected through the
agricultural baseline assessment process can be harmonized with the data that is also
being collected by SDC and ODPEM for the creation of GIS hazard maps. It is
further assumed that this delineation process can be facilitated by the NADRM Unit
at RADA head office.
5. It is also assumed that the baseline assessment process will help promote and
document “good agricultural” practices and thus facilitate preparedness and
mitigation measures that will help to make rural communities become more resilient.
6. Lastly, it is understood that livelihood assessment needs to be kept current and
therefore baseline data will need to be updated on an annual basis.
Integrated Livelihood Baseline and Impact Assessment Tool Kit
10
Module 1: National Context
Agriculture and food security perspectives
The agricultural sector is particularly vulnerable to a variety of these hazards. Recent
experience with Hurricanes Gustav (2008), Dean (2007) and Ivan (2004) have only served to
heighten the country’s recollection of the devastation caused by hurricane Gilbert in 1988, for
which little was done to prepare, and which devastated the island’s agricultural industries.
But with global warming and climate change, such hydro-meteorological events are likely to
become more frequent. With them come not only loss of human life, but also land slides,
flooding, storm surges, loss of infrastructure, damage to essential utilities, pests and diseases,
among many other harmful effects.
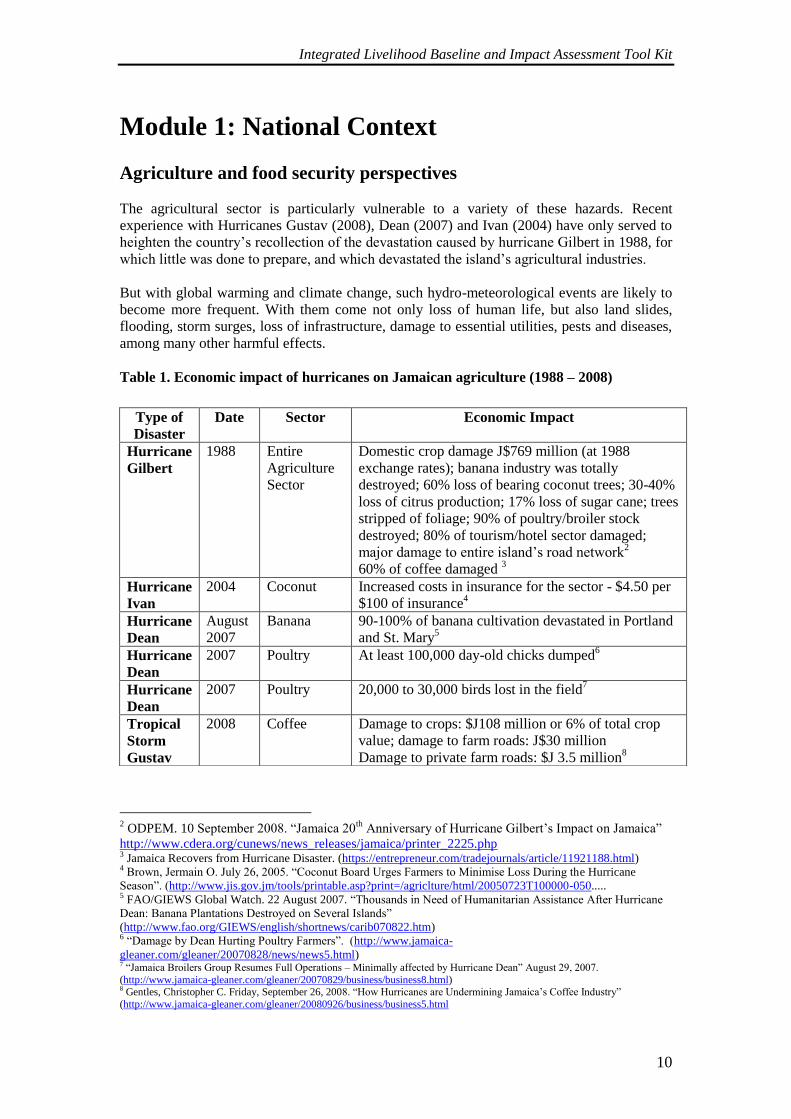
Table 1. Economic impact of hurricanes on Jamaican agriculture (1988 – 2008)
2 ODPEM. 10 September 2008. “Jamaica 20
th Anniversary of Hurricane Gilbert’s Impact on Jamaica”
http://www.cdera.org/cunews/news_releases/jamaica/printer_2225.php 3 Jamaica Recovers from Hurricane Disaster. (https://entrepreneur.com/tradejournals/article/11921188.html) 4 Brown, Jermain O. July 26, 2005. “Coconut Board Urges Farmers to Minimise Loss During the Hurricane
Season”. (http://www.jis.gov.jm/tools/printable.asp?print=/agriclture/html/20050723T100000-050..... 5 FAO/GIEWS Global Watch. 22 August 2007. “Thousands in Need of Humanitarian Assistance After Hurricane
Dean: Banana Plantations Destroyed on Several Islands”
(http://www.fao.org/GIEWS/english/shortnews/carib070822.htm) 6 “Damage by Dean Hurting Poultry Farmers”. (http://www.jamaica-
gleaner.com/gleaner/20070828/news/news5.html) 7 “Jamaica Broilers Group Resumes Full Operations – Minimally affected by Hurricane Dean” August 29, 2007.
(http://www.jamaica-gleaner.com/gleaner/20070829/business/business8.html) 8 Gentles, Christopher C. Friday, September 26, 2008. “How Hurricanes are Undermining Jamaica’s Coffee Industry”
(http://www.jamaica-gleaner.com/gleaner/20080926/business/business5.html
Type of
Disaster
Date Sector Economic Impact
Hurricane
Gilbert
1988 Entire
Agriculture
Sector
Domestic crop damage J$769 million (at 1988
exchange rates); banana industry was totally
destroyed; 60% loss of bearing coconut trees; 30-40%
loss of citrus production; 17% loss of sugar cane; trees
stripped of foliage; 90% of poultry/broiler stock
destroyed; 80% of tourism/hotel sector damaged;
major damage to entire island’s road network2
60% of coffee damaged 3
Hurricane
Ivan
2004 Coconut Increased costs in insurance for the sector - $4.50 per
$100 of insurance4
Hurricane
Dean
August
2007
Banana 90-100% of banana cultivation devastated in Portland
and St. Mary5
Hurricane
Dean
2007 Poultry At least 100,000 day-old chicks dumped6
Hurricane
Dean
2007 Poultry 20,000 to 30,000 birds lost in the field7
Tropical
Storm
Gustav
2008 Coffee Damage to crops: $J108 million or 6% of total crop
value; damage to farm roads: J$30 million
Damage to private farm roads: $J 3.5 million8
Integrated Livelihood Baseline and Impact Assessment Tool Kit
11
National Policy Frameworks
In a globally changing economic environment, Jamaica’s ability to mobilize external disaster
assistance will be diminished as international aid organizations and development partners
impose more stringent criteria for assistance owing to increasing costs associated with disaster
impacts globally. It is within this context that hazard mitigation is being promoted as a
priority in Jamaica’s policy agenda. There is increasing recognition that hazard mitigation,
through the implementation of risk-reduction measures, can play a significant role in
sustainable development.
Vision of the NDRM
The vision of the policy is to have a society in which hazard mitigation has evolved to
become part of everyday life. This vision recognizes that a community-based approach must
be the focus of any intervention. The Policy therefore promotes the active participation and
partnership of communities, governmental and non-governmental organizations, the private
sector and development partners in the conceptualization, design and implementation of
hazard mitigation measures.
While Jamaica has benefitted from having a well articulated overall National Disaster Risk
Management (NDRM) plan, until recently, there was no explicit comparable plan for the
agricultural sector. Food and Agricultural Organization of the United Nations (FAO)’s
Technical Assistance Project (TCP) TCP/JAM3202 (D) “National Disaster Preparedness
and Emergency Response Plan for the Agricultural Sector” in collaboration with
Government of Jamaica has developed the ADRM plan and is now in place which sees
agricultural livelihood assessment as fundamentally important for its successful
implementation.
In the long-run, the goal of the ADRM plan is to:
Increase resilience and reduce vulnerability in the agricultural sector
Overcome direct and indirect losses resulting from the impact of the hurricane on the
sector
Increasing preparedness against the reoccurrence of the event.
Strategic Goals of the ADRM
Strategic goals of the ADRM Plan include:
i) Strengthening of the capacity of RADA and other relevant institutions to fulfill
the requirements of ADRM by 2015.
ii) Institution of mechanisms and capacities to build resilience to natural hazards
(hurricanes, flood, droughts, crop and livestock disease and infestations) in the
agricultural sector.
iii) Incorporation of disaster risk reduction and risk management approaches into
disaster preparedness, mitigation, response, recovery and rehabilitation
programmes for the agricultural sector.
9 Damaged Roads, Drains from Tropical Storm Cited as Setbacks to Coffee Sector. September 23, 2008.
(http://www.jis.gov.jm/tools/printable.asp?print=/agriclture/html/20080923t100000-050
Tropical
Storm
Gustav
2008 Coffee 5-10 percent of production damage to coffee trees;
high increases in insurance costs and in pesticides and
farm chemicals9
Integrated Livelihood Baseline and Impact Assessment Tool Kit
12
Roles and Responsibilities under the ADRM Plan
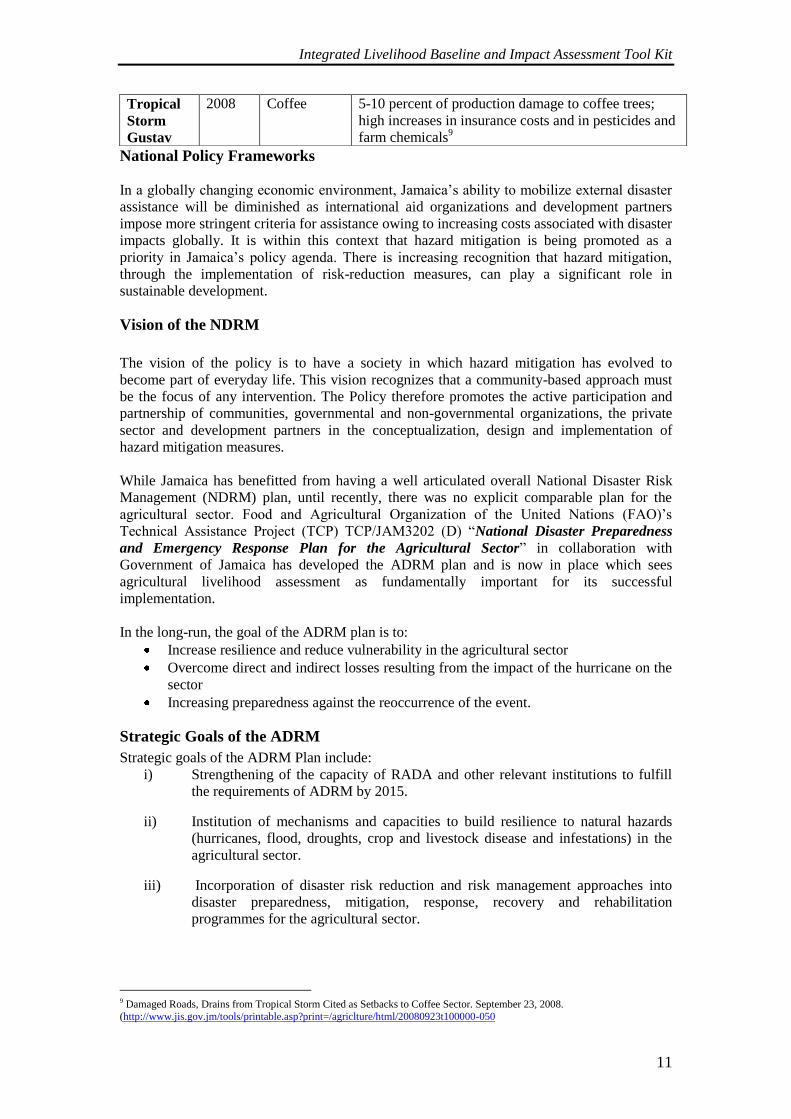
The ADRM Plan proposes a formal institutional framework and implementation mechanism
to achieve its risk reduction objectives (Figure 1).
Figure 1. Proposed Institutional Framework for Agricultural Disaster Risk
Management
It is proposed that the institutional framework for ADRM parallels but is linked to the
national disaster risk management framework in a complementary relationship. The Rural
Agricultural Development Authority within the Ministry of Agriculture has primary
responsibility for implementation of the Plan. Currently, initiatives and activities related to
ADRM falls within the portfolio of the Director of Technology, Training and Technical
Information within RADA, with ad hoc support from other units. Given the diverse scope of
this portfolio and the wide ranging actions and activities required for effective ADRM, it is
proposed that a dedicated unit be established within RADA to coordinate activities related to
ADRM. This National Agricultural Disaster Risk Management (NADRM) Unit will play a
coordinating role for all ADRM activities through constant liaison with the National
Agricultural Disaster Risk Management (NADRM) Committee. In addition, the NADRM
Unit should provide technical support for the DRM activities of RADA and is responsible for
overseeing implementation of preparedness, mitigation and prevention measure of the ADRM
Plan. The portfolio of the Unit is intended to complement that of the Director of the Director
of Technology, Training and Technical Information.
The NADRM Committee should represent all national agricultural stakeholders and other
relevant institutions. The proposed composition of the NADRM Committee is shown in
Annex 2. The NADRM Committee is linked to the NDRM Committee and subcommittees
through agricultural representation on the national body.
The NADRM Committee is mirrored at the parish level as the Parish Agricultural Disaster
Risk Management Committee (PADRM). This committee should constitute parish-level
Ministry of Agriculture
RADA
NDRM Committee & sub-
committees
PDCs
NADRM Unit
NADRM Committee
PADRM Committees
NGO & Civic
Groups
Integrated Livelihood Baseline and Impact Assessment Tool Kit
13
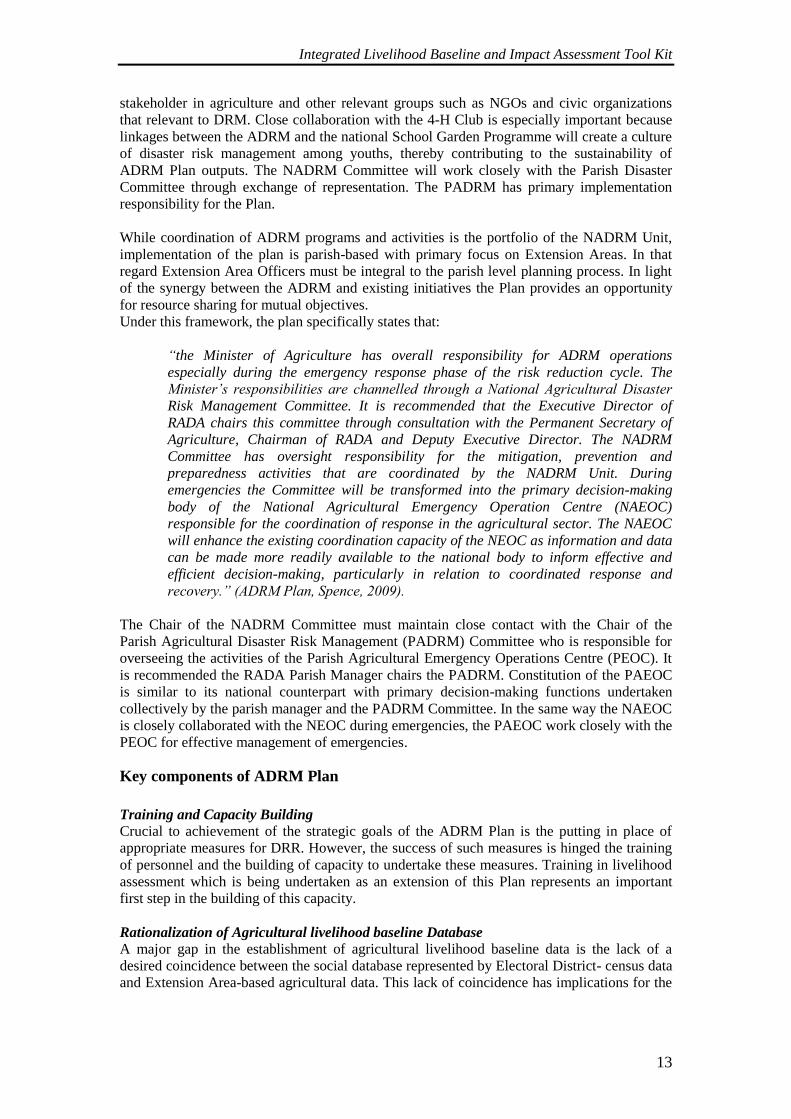
stakeholder in agriculture and other relevant groups such as NGOs and civic organizations
that relevant to DRM. Close collaboration with the 4-H Club is especially important because
linkages between the ADRM and the national School Garden Programme will create a culture
of disaster risk management among youths, thereby contributing to the sustainability of
ADRM Plan outputs. The NADRM Committee will work closely with the Parish Disaster
Committee through exchange of representation. The PADRM has primary implementation
responsibility for the Plan.
While coordination of ADRM programs and activities is the portfolio of the NADRM Unit,
implementation of the plan is parish-based with primary focus on Extension Areas. In that
regard Extension Area Officers must be integral to the parish level planning process. In light
of the synergy between the ADRM and existing initiatives the Plan provides an opportunity
for resource sharing for mutual objectives.
Under this framework, the plan specifically states that:
“the Minister of Agriculture has overall responsibility for ADRM operations
especially during the emergency response phase of the risk reduction cycle. The
Minister’s responsibilities are channelled through a National Agricultural Disaster
Risk Management Committee. It is recommended that the Executive Director of
RADA chairs this committee through consultation with the Permanent Secretary of
Agriculture, Chairman of RADA and Deputy Executive Director. The NADRM
Committee has oversight responsibility for the mitigation, prevention and
preparedness activities that are coordinated by the NADRM Unit. During
emergencies the Committee will be transformed into the primary decision-making
body of the National Agricultural Emergency Operation Centre (NAEOC)
responsible for the coordination of response in the agricultural sector. The NAEOC
will enhance the existing coordination capacity of the NEOC as information and data
can be made more readily available to the national body to inform effective and
efficient decision-making, particularly in relation to coordinated response and
recovery.” (ADRM Plan, Spence, 2009).
The Chair of the NADRM Committee must maintain close contact with the Chair of the
Parish Agricultural Disaster Risk Management (PADRM) Committee who is responsible for
overseeing the activities of the Parish Agricultural Emergency Operations Centre (PEOC). It
is recommended the RADA Parish Manager chairs the PADRM. Constitution of the PAEOC
is similar to its national counterpart with primary decision-making functions undertaken
collectively by the parish manager and the PADRM Committee. In the same way the NAEOC
is closely collaborated with the NEOC during emergencies, the PAEOC work closely with the
PEOC for effective management of emergencies.
Key components of ADRM Plan
Training and Capacity Building
Crucial to achievement of the strategic goals of the ADRM Plan is the putting in place of
appropriate measures for DRR. However, the success of such measures is hinged the training
of personnel and the building of capacity to undertake these measures. Training in livelihood
assessment which is being undertaken as an extension of this Plan represents an important
first step in the building of this capacity.
Rationalization of Agricultural livelihood baseline Database
A major gap in the establishment of agricultural livelihood baseline data is the lack of a
desired coincidence between the social database represented by Electoral District- census data
and Extension Area-based agricultural data. This lack of coincidence has implications for the
Integrated Livelihood Baseline and Impact Assessment Tool Kit
14
effectiveness of ADRM planning especially in relation to livelihood impact assessment and
appraisal of recovery and rehabilitation needs during a disaster.
In order to achieve rationalization of the agricultural livelihood database the utilization of a
GIS to align the social data of EDs with the boundaries of Extension Areas is proposed as a
fundamental exercise in the ADRM planning process. The GIS capacity of the RPPU and
Land Information Unit is ideally suited for this exercise and should be embarked upon as a
matter of urgency because improved integrity of baseline agricultural livelihood data is
hinged on this exercise.
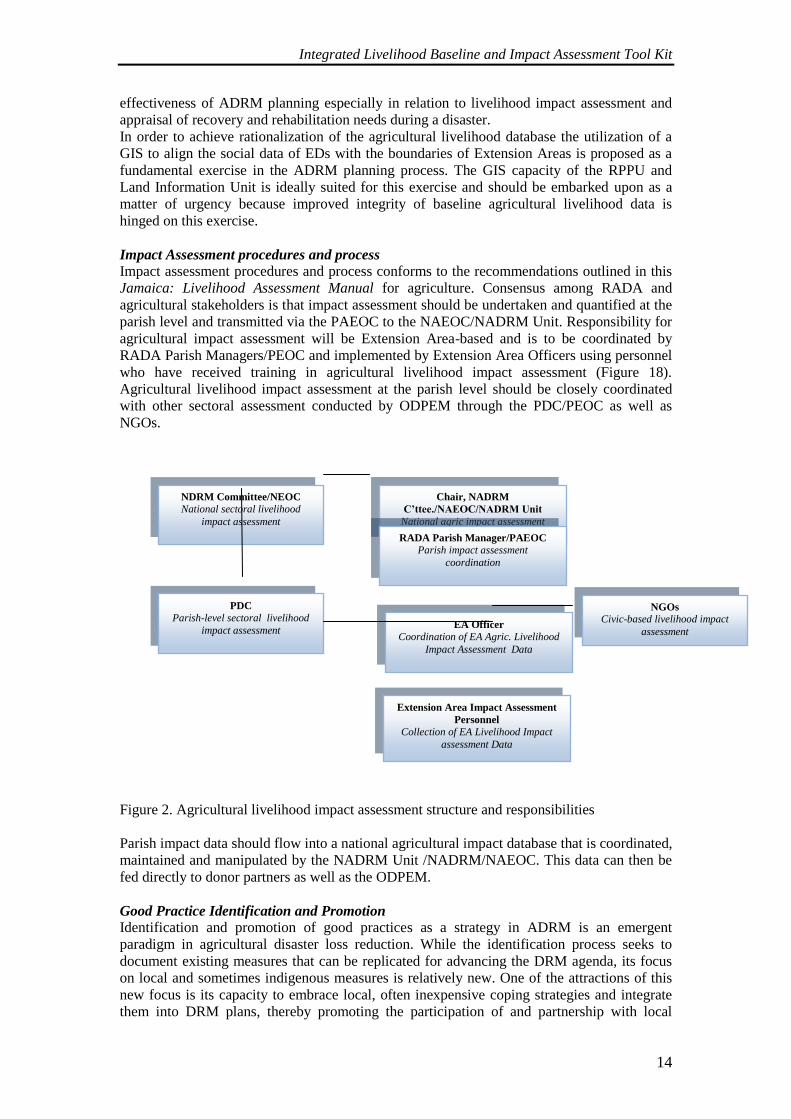
Impact Assessment procedures and process
Impact assessment procedures and process conforms to the recommendations outlined in this
Jamaica: Livelihood Assessment Manual for agriculture. Consensus among RADA and
agricultural stakeholders is that impact assessment should be undertaken and quantified at the
parish level and transmitted via the PAEOC to the NAEOC/NADRM Unit. Responsibility for
agricultural impact assessment will be Extension Area-based and is to be coordinated by
RADA Parish Managers/PEOC and implemented by Extension Area Officers using personnel
who have received training in agricultural livelihood impact assessment (Figure 18).
Agricultural livelihood impact assessment at the parish level should be closely coordinated
with other sectoral assessment conducted by ODPEM through the PDC/PEOC as well as
NGOs.
Figure 2. Agricultural livelihood impact assessment structure and responsibilities
Parish impact data should flow into a national agricultural impact database that is coordinated,
maintained and manipulated by the NADRM Unit /NADRM/NAEOC. This data can then be
fed directly to donor partners as well as the ODPEM.
Good Practice Identification and Promotion
Identification and promotion of good practices as a strategy in ADRM is an emergent
paradigm in agricultural disaster loss reduction. While the identification process seeks to
document existing measures that can be replicated for advancing the DRM agenda, its focus
on local and sometimes indigenous measures is relatively new. One of the attractions of this
new focus is its capacity to embrace local, often inexpensive coping strategies and integrate
them into DRM plans, thereby promoting the participation of and partnership with local
NDRM Committee/NEOC National sectoral livelihood
impact assessment
Chair, NADRM
C’ttee./NAEOC/NADRM Unit
National agric impact assessment
PDC
Parish-level sectoral livelihood
impact assessment
RADA Parish Manager/PAEOC Parish impact assessment
coordination
EA Officer Coordination of EA Agric. Livelihood
Impact Assessment Data
Extension Area Impact Assessment
Personnel
Collection of EA Livelihood Impact
assessment Data
NGOs
Civic-based livelihood impact
assessment
Integrated Livelihood Baseline and Impact Assessment Tool Kit
15
communities. It was in recognition of the potential benefits of this approach to ADRM and in
response to the onslaught of Hurricane Ivan on the agricultural sector of several Caribbean
countries in 2004, that the FAO in 2007, funded an initiative to provide Assistance to improve
local agricultural emergency preparedness in Caribbean countries highly prone to hydro-
meteorological hazards/disasters. The focus of the initiative was on the identification of good
practices that could be promoted for ADRM in Jamaica. The internal structure of RADA with
a strong parish focus makes this organization particularly suitable for the primary
implementation of these good practices.
Livelihood Protection
Livelihood protection has emerged a major strategy for promoting disaster lost reduction and
by extension, sustainable development. This is especially relevant to Jamaica’s ADRM
planning, owing to the large proportion of farmers who operate at the subsistence level and
whose loss of livelihood to disaster impacts can have social and economic repercussions
throughout the wider economy. Within the context of the economics of disaster preparedness
and mitigation, strategies for livelihood protection results on cost-savings in the emergency
response and recovery/rehabilitation phases of the DRR cycle. Protection of livelihoods is
therefore central to the objectives of the ADRM Plan. Aspects of livelihood protection are
implicit in the preceding discussions on good practice promotion but additional activities for
protecting agricultural livelihood from the impact especially hydro-meteorological hazards
are proposed in Table X.
Primary Roles and functions of RADA and other organizations
Roles and function of RADA and other organizations in emergency response have been
outline in terms of preparedness and mitigation function as well as emergency response. As
the primary implementing agency for the Plan, RADA has responsibility for development of
stakeholder partnerships and assignment of responsibilities for implementation of the Plan.
Recovery and Rehabilitation
The short-term recovery and more long-term rehabilitation phase of DRM is strongly
informed by the effectiveness of measures and activities that are implemented for mitigation,
prevention, preparedness and emergency response as well as the recovery and rehabilitation
strategy. Efficiency of the rehabilitation/recovery process is a function of the reliability of
the damage assessment process that informs short-term flash appeals and more long term
interventions for rebuilding livelihoods.
Damage and Loss Assessment
Damage and loss assessment in Jamaica’s DRM has been for the most part ad hoc but over
the last few years adoption of more comprehensive and standardized approaches have
occurred. Most notable are the ECLAC damage assessment approach and more recently the
Livelihood Assessment Tool-Kit developed and published by the FAO and the ILO. The
latter is being adopted for ADRM planning in Jamaica, but given the broad-brush
international focus of the tool-kit, a more tailored manual for effecting damage and loss
assessment in the agricultural sector is being developed as a part of this ADRM Plan. In that
regard a number of short-term measures are proposed to effect immediate damage and loss
assessment needs.
While RADA with support from the FAO has commenced training of a cadre of
institutional and parish-level personnel to undertake livelihood impact assessment
related to disasters, the effectiveness of this exercise is contingent on its integration
with the decision-making structure for DRM that is proposed in section 10.2.6.
Given the key decision-making responsibilities of RADA Parish Managers as well as
Integrated Livelihood Baseline and Impact Assessment Tool Kit
16
the parish-focus of the agricultural livelihood impact assessment process training of
all Parish Managers and their decision-making designates is a matter of urgency.
This will serve to fill a potential gap between the data collection process undertaken
by field officers and the ADRM decision-making structure of RADA and other
relevant institutions. Coordination of this activity should be a mandate of the
proposed NADRM Unit within RADA.
Scheduling of frequent livelihood assessment training refresher workshops to ensure
and maintain standardization and efficiency as well as appropriateness of flash
appeals and more long- term recovery/rehabilitation interventions.
Needs Assessment for Recovery
Needs assessment for recovery is implicit in the damage and loss assessment. It is envisaged
the a two-tiered approach to needs assessment for recovery will emerge from the livelihood
impact assessment approach being implemented for ADRM.
Tier 1: Flash Appeals – coordinated and prepared by parish level decision-makers to
effect immediate recovery needs and following the format proposed in the LAT/Livelihood
Assessment Manual. Synthesizing of these parish flash appeals into a national flash appeal
for the agricultural sector should be mandated to the NADRM Unit.
Tier 2: National Agricultural Sector Need – coordinated at the national level to
reflect more long-term recovery and rehabilitation needs. This activity should fall within the
portfolio of the NADRM Unit.
Assessment Data Flow
Preparation of Agricultural Recovery and Rehabilitation Strategy
A critical aspect of the recovery/rehabilitation component of the ADRM Plan is the
preparation of a recovery and rehabilitation strategy. This strategy must be informed by the
needs assessment process as well as the unique requirements of the specific hazard impact.
Generally though, the strategy must relate the guidelines of the flash appeal as well as
national agricultural sector needs and be implemented within the context of the ADRM
structure for the agricultural sector. The NADRM unit should have responsibility for
coordinating the strategy.
Integrated Livelihood Baseline and Impact Assessment Tool Kit
17
Module 2: Approach and Methodology
The Livelihood Assessment Approach
This manual specifically adopts the Livelihood Assessment approach that has been developed
by the FAO together with the International Labour Organization (ILO). Under the Livelihood
Assessment (LA) framework, the LA approach assesses the sector by viewing agricultural
livelihood activities through the following main lenses:
1. Livelihood assets and activities
2. Vulnerability and coping strategies
3. Policies, institutions and processes
4. Livelihood outcomes
It further provides precise methodologies and tools for completing three distinct LA
assessment processes or phases: (1) the Livelihood Baseline Assessment (LBA) for the pre-
disaster context; (2) the Initial Livelihood Impact Appraisal (ILIA) in the immediate post-
disaster context; and (3) the Detailed Livelihood Assessment (DLA) to be done within three
months of an event.
Livelihood Assessment Process
Livelihood Assessment is a process that looks the agricultural sector holistically. It seeks to
understand agricultural livelihood activities and to identify distinct livelihood zones and
patterns of activity based on the spatial agro-ecological resource base that exists, while also
being sensitive to local socio-economic and cultural considerations that are at play in any
particular area.
Key elements are considered to be critical for a full appreciation of how livelihoods composed
and function. These include consideration of livelihood assets; degree of vulnerability and
coping strategies – all of which must be assessed in order to develop strategies for protecting
livelihoods in the agricultural sector. An overview of these elements is provided here.
Disaster risk, vulnerability and livelihoods
While the linkages between the DRM and the SL frameworks are complex, they highlight a
number of key factors that determine the degree of vulnerability of different socio-economic
groups to disaster situations, as evidenced by the following examples:
Natural resources provide key livelihood assets and security, especially in rural areas
Disasters reduce household livelihood assets to different degrees depending on the
asset and type of disaster and lead to livelihood insecurity (and may result in death or
injury)
Policies and institutions influence household livelihood assets positively or negatively
Policies and institutions can increase or decrease vulnerability to disaster
Enabling institutions and diversified household assets widen livelihood options
Asset ownership decreases vulnerability and increases ability to withstand disaster
impacts
Integrated Livelihood Baseline and Impact Assessment Tool Kit
18
Livelihood outcomes depend on policies, institutions, processes and livelihood
strategies
Livelihood outcomes influence the ability to preserve and accumulate household
assets
Policies and institutions are thus key factors that influence access by different population
groups to assets and DRM technology, livelihood options and coping strategies as well as
key services to reduce the loss of lives and property in the aftermath of a disaster.
Assets are the resource base of a people and there are usually 5 categories:
Natural resources or natural capital
Physical reproducible goods or physical capital
Monetary resources such as financial capital
Manpower and skills (human resources/capital)
Social networks of various kinds (social capital)
Human capital: labour power, health and nutritional status, skills and knowledge
Natural capital: access to land, water, wildlife, flora, forest
Social capital: the social networks that people can draw upon to solve common problems.
Social capital can include family networks, group memberships, community networks,
business linkages, and so on.
Physical capital: includes houses, vehicles, equipment and machinery, livestock
Financial capital: savings, jewelry, access to regular income net access to credit, insurance
Vulnerability depends on the asset base that people have prior to the crisis and their ability to
engage in various coping strategies. Persons or households who have fewer assets are
generally more vulnerable to hazards and disasters, therefore assessing assets can help to
determine which groups are likely to be more vulnerable.
Vulnerable groups are those community groups, households and communities who are more
at risk or exposed to hazards also helps to identify those that may be likely to lose their
livelihoods and be more at risk of falling into poverty or destitution.
Resilient households are usually those with more livelihood assets. They may have enough
savings or assets to trade in for cash to buy food when crops fail, for example, or have enough
resources to get back on their feet quickly. Vulnerable households will have few assets at
their disposal to utilize in response to a disaster.
Coping strategies are short-term responses to events that threaten livelihoods and may serve
to either positively or negatively impact the long-term sustainability of the livelihood base.
Different coping strategies will have different advantages and disadvantages, or costs and
benefits.
Integrated Livelihood Baseline and Impact Assessment Tool Kit
19
Key Benefits of Livelihood Assessment tools
For the Jamaican agriculture, forestry and fisheries sector therefore, the livelihood assessment
approach offers several advantages over other types of assessment tools as follows:
a) For one, it allows for precise mapping of agricultural livelihood zones in relation
to specific hazard prone areas.
b) It further allows not only for the assessment of farm households who are registered
with ABIS, but also brings substantial value added through the provision of
assessment tools that can capture those who are most vulnerable, thereby making
the data that are collected much more meaningful and the findings easier to
prioritize. By identifying vulnerable communities ahead of time, and by
identificating their position vis-à-vis hazard prone areas, RADA can better help
these communities prepare for disasters and can more quickly respond to their
needs should a disaster take place.
c) In addition, by providing methods for assessing coping strategies, the methodology
can help to identify indigenous coping strategies and practices that are positive and
which can in turn lead to more informed response typologies and greater
preparedness and mitigation in the sector.
d) Lastly, livelihood assessment also provides guidelines and sampling methods to
help the sector collect and use qualitative data, but also shows how this data can
then be presented in quantifiable terms – making it far more accurate and
meaningful.
Steps in the integrated livelihood baseline and impact assessment
There are three (3) components to the Livelihood Assessment (LA) process each of which
utilizes specific tools or methods. These three steps or phases are:
Box 1. Guiding Principles of ILBIA approach
Although the Livelihood Assessment process delineates between these three distinct stages
they have much in common with each other. Specifically:
Tools and stages are meant to reinforce and complement each other even though they
can also stand alone and be used independently of one other as well (modular
approach);
Quantitative and qualitative tools are designed to be triangulated and used to verify
findings
Livelihood opportunities, capacities, coping strategies and strengths are also
examined and assessed, not only weaknesses and impact;
Data is tailored to fit the key programming mechanisms available in the country
Partnerships are emphasized – the ILBIA cannot be implemented effectively without
interagency cooperation and support including government mechanisms, private
sector, NGOs, donor community, farmer groups and other organizations;
Tools should be mainstreamed to work as much as possible in tandem with existing
data sources and collection methods;
It should fit into the country’s overall disaster mitigation and preparedness framework
as well as the national response mechanisms.
Integrated Livelihood Baseline and Impact Assessment Tool Kit
20
1. The Livelihood Baseline (LB)
Provides a solid ‘before’ picture of normal livelihood patterns, but is especially important for
assessing those areas that are most at risk to natural disasters. It produces detailed quantitative
and qualitative data on the number of persons, resources, and infrastructure that could be
damaged. The LBA allows for the preparation of a hazard-map of vulnerable areas and
appropriate contingency plans in the advance of a potential disaster. It also looks at relevant
survival strategies and coping mechanisms that could be replicated and helps to engage local
communities in disaster risk mitigation (DRM). It’s purpose is to identify – in advance – a
menu or typology of possible responses and activities that can make rural livelihoods less
vulnerable and more resilient to hazards and risks.
2. The Initial Livelihood Impact Appraisal (ILIA)
The ILIA is used to quickly do an initial assessment of impact at the local level should a
disaster unfortunately take place. It provides immediate, first hand information on the impact
the disaster on the livelihoods of the people affected. When used together with the LB data, it
can provide sound information for quick response and for early recovery actions or Flash
Appeals. The ILIA further provides sound data to donors for assistance and is done in the first
1-10 days after a disaster event.
3. Detailed Livelihood Assessment (DLA)
The DLA allows for more detailed assessment of the actual impact on livelihoods and the
opportunities, capacities and needs for recovery at the household, community, and local
economy levels. It provides more detailed information to rationalize longer-term actions,
programmes and Livelihood Recovery Strategies (LRS) as projects for funding. The DLA is
completed within 30-90 days of an event.
Damage and loss assessment methodology
Basic principles and definition
Agricultural sector is one of the most vulnerable sectors to high frequency natural disasters in
the tropical agro-eco systems. As more population is depending on agriculture and allied
sector, the magnitude of infrastructure and properties exposed to natural hazards are also
becoming higher. The impact of disasters in the form of direct damage to assets, infrastructure
and loss of production contributes heavily on macro-economic development of any region,
state or country. The impact is a function of damage to properties, assets, infrastructure and
loss to production in agricultural sector.
The damage refers to:
Total or partial destruction of assets, including buildings, infrastructure, stocks,
natural resources, etc.,
Damage occurs during or immediately after the disaster
Damage is measured in physical terms, and a monetary replacement value is assigned
to it
Integrated Livelihood Baseline and Impact Assessment Tool Kit
21
Time, months
Damage
Losses
5 yrs
Full
Reconstruction
and Economic
Recovery
Time, months
Damage
Losses
5 yrs
Full
Reconstruction
and Economic
Recovery
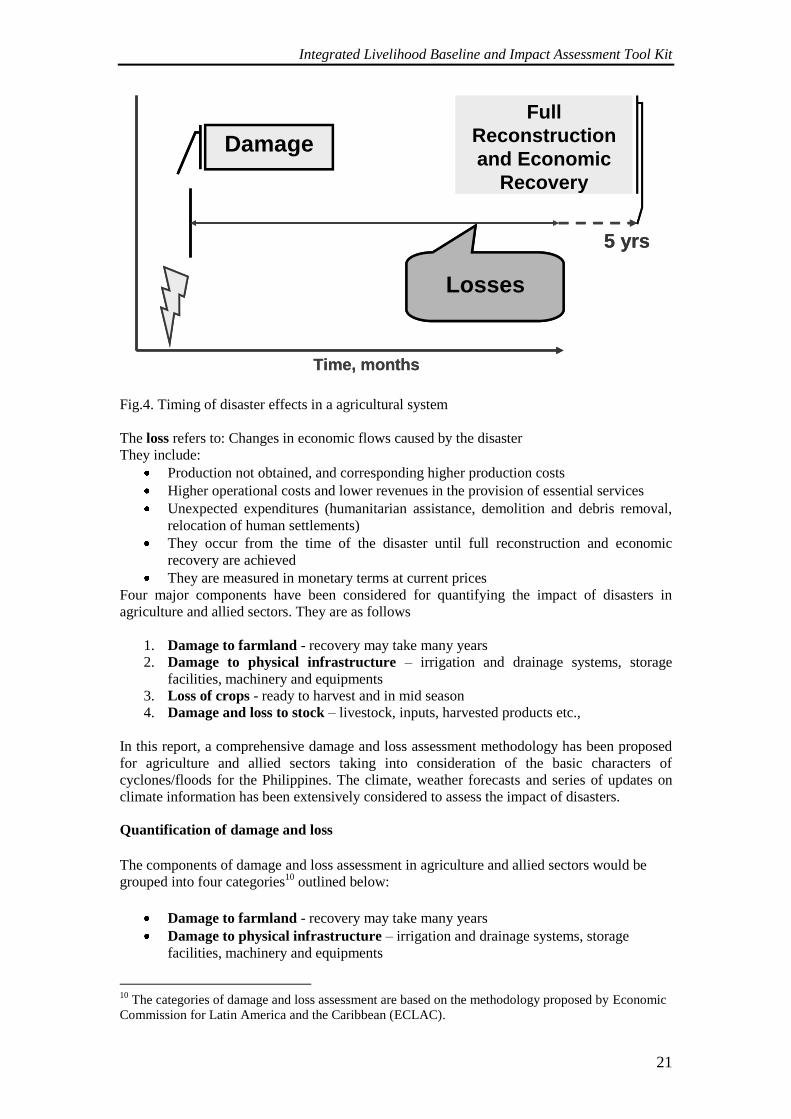
Fig.4. Timing of disaster effects in a agricultural system
The loss refers to: Changes in economic flows caused by the disaster
They include:
Production not obtained, and corresponding higher production costs
Higher operational costs and lower revenues in the provision of essential services
Unexpected expenditures (humanitarian assistance, demolition and debris removal,
relocation of human settlements)
They occur from the time of the disaster until full reconstruction and economic
recovery are achieved
They are measured in monetary terms at current prices
Four major components have been considered for quantifying the impact of disasters in
agriculture and allied sectors. They are as follows
1. Damage to farmland - recovery may take many years
2. Damage to physical infrastructure – irrigation and drainage systems, storage
facilities, machinery and equipments
3. Loss of crops - ready to harvest and in mid season
4. Damage and loss to stock – livestock, inputs, harvested products etc.,
In this report, a comprehensive damage and loss assessment methodology has been proposed
for agriculture and allied sectors taking into consideration of the basic characters of
cyclones/floods for the Philippines. The climate, weather forecasts and series of updates on
climate information has been extensively considered to assess the impact of disasters.
Quantification of damage and loss
The components of damage and loss assessment in agriculture and allied sectors would be
grouped into four categories10
outlined below:
Damage to farmland - recovery may take many years
Damage to physical infrastructure – irrigation and drainage systems, storage
facilities, machinery and equipments
10
The categories of damage and loss assessment are based on the methodology proposed by Economic
Commission for Latin America and the Caribbean (ECLAC).
Integrated Livelihood Baseline and Impact Assessment Tool Kit
22
Loss of crops - ready to harvest and in mid season
Loss to stock – livestock, inputs, harvested products etc.,
The assessment and quantification procedures are proposed by ADPC and was evaluated during
the workshop with national stakeholders during January 2006.
Damage to farmland
The disaster might cause complete degradation of productive land. The impact might be
complete erosion of productive land to the extent; the land can not be used for cultivation
further. The land might also be affected due to total sedimentation, which hinders production
for few years until it is restored. The value of damage may be calculated as follows:
Value = Area (ha) * Value of land (JM$./ha) (or)
Value = Area (ha) * Annual Productivity (kg/ha) * Farm gate price (JM$./kg) * 10 (ten
years)
Normally, 10 years is considered for the completely damaged land as the complete
rehabilitation and livelihood activities will be resumed only after this time period. If the land is
temporarily damaged due to the deposits of materials brought down by floods, then the value is
Value = Area (ha) * Average Annual Productivity (kg/ha)
If the land is partially eroded (reducing fertility), then the value is
Value = Area (ha) * Quantity of soil eroded (t/ha) * Cost of transportation (JM$/ t)
Damage to physical infrastructure
Damage to storage facilities, silos, and machinery, chicken sheds, aquaculture pools, fishing
port installations, and equipment is estimated on the basis of physical units affected, whether
totally or partially destroyed. It is required to estimate the extent of damage, using physical
units such as kilometers of farm roads, length of channels in meters, number of tractors etc.,
Monetary value may be determined for each of those items as described in Table 3. The present
replacement value might be considered for calculating the value of damage.
Loss of production of field crops
The loss of production from field crops can be considered as potential loss due to the impact of
disasters. Generally, the loss of production includes production ready to be harvested and at any
stage of growth at the time of the disaster is considered as loss. If there is re-planting
opportunity the cost of investment is considered as loss. If the disaster happens when annual
crops are still growing, there is a loss of investment – in labour and inputs invested by the
farmers must be taken into account.
Total loss just before harvest can be assessed based on the following relationships.
Value = Anticipated Area (ha) * Forecasted yield (or) yield in normal year (kg/ha) * Loss factor
(0-1)* farm gate price (JM$./kg)
For crops at various growth stages, the value of loss is worked out based on the relationships as
follows.
Integrated Livelihood Baseline and Impact Assessment Tool Kit
23
(i) Establishment stage (Chance to replant and subsequent crop will not be affected)
Value = Area (ha) * Cost of investment upto the stage of disaster (JM$./ha)
(ii) Vegetative, flowering and maturity stages (no chance for replanting)
Value = Anticipated Area (ha) * Loss factor (0-1) * Forecasted yield (or) yield in normal year
(kg/ha) * yield reduction factor (0-1) * farm gate price (JM$./kg)
Note: Yield reduction factor varies with stage of the crop and intensity of stress (flood / wind
speed etc.,)
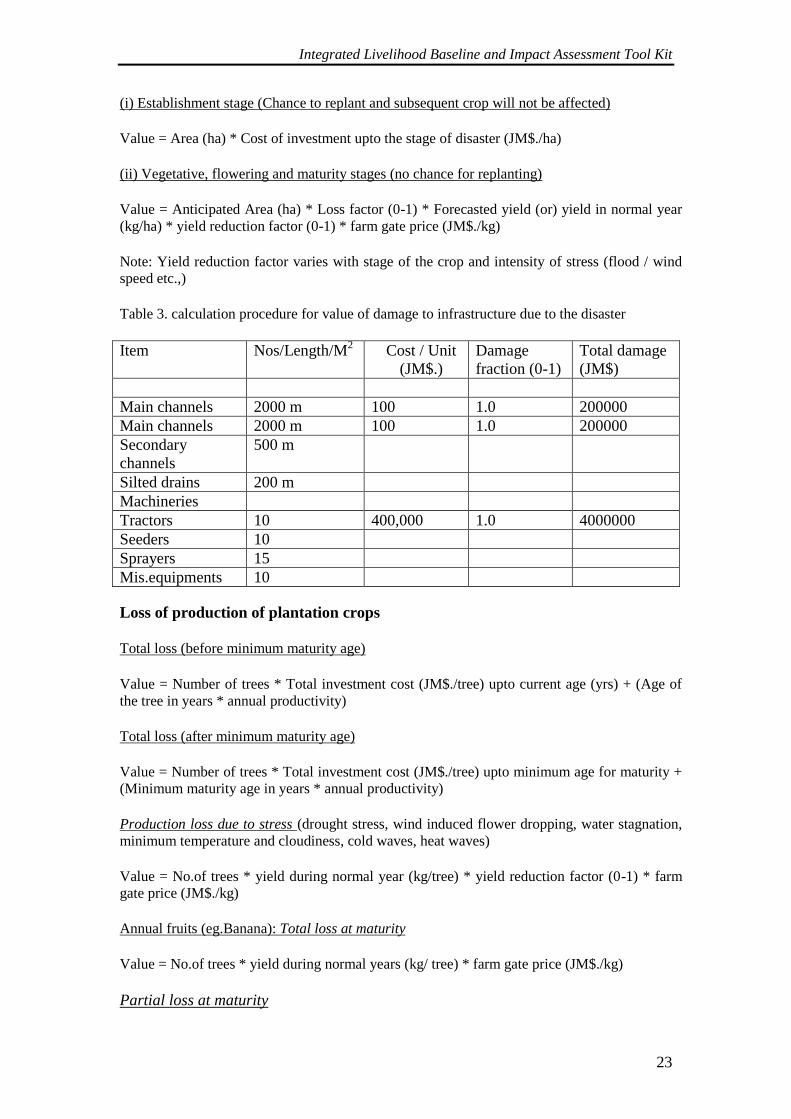
Table 3. calculation procedure for value of damage to infrastructure due to the disaster
Item Nos/Length/M2 Cost / Unit
(JM$.)
Damage
fraction (0-1)
Total damage
(JM$)
Main channels 2000 m 100 1.0 200000
Main channels 2000 m 100 1.0 200000
Secondary
channels
500 m
Silted drains 200 m
Machineries
Tractors 10 400,000 1.0 4000000
Seeders 10
Sprayers 15
Mis.equipments 10
Loss of production of plantation crops
Total loss (before minimum maturity age)
Value = Number of trees * Total investment cost (JM$./tree) upto current age (yrs) + (Age of
the tree in years * annual productivity)
Total loss (after minimum maturity age)
Value = Number of trees * Total investment cost (JM$./tree) upto minimum age for maturity +
(Minimum maturity age in years * annual productivity)
Production loss due to stress (drought stress, wind induced flower dropping, water stagnation,
minimum temperature and cloudiness, cold waves, heat waves)
Value = No.of trees * yield during normal year (kg/tree) * yield reduction factor (0-1) * farm
gate price (JM$./kg)
Annual fruits (eg.Banana): Total loss at maturity
Value = No.of trees * yield during normal years (kg/ tree) * farm gate price (JM$./kg)
Partial loss at maturity
Integrated Livelihood Baseline and Impact Assessment Tool Kit
24
Value = No.of trees * damage fraction (0-1) * yield in normal year (kg./tree) * farm gate price
(JM$./kg).
Production loss to animals
The production of livestock products decreases because of emotional stress on animals affected
by natural disturbance. With sever cyclonic storm or prolonged flood hens stop laying eggs,
cows lose weight and the milk production is reduced significantly. The indirect loss is difficult
to estimate, however, they are frequently calculated on the basis of decrease of up to 20% of
normal production. The number of days of production loss differs with the animal breed. For
example, in HF breed the number of days of production loss is about 90 days. But his may be
lesser for other indigenous breeds. The value of loss to production must be calculated as
follows.
Value = No.of animals affected * average production/day * yield reduction factor (0-1) * No.of
days of production loss + (Number of animal affected * investment cost to bring back to normal
condition (JM$./animal))
The cost of investment to bring back the animal to normal condition like investment on extra
feed and vaccination is considered under loss.
Production loss to inland fishery
There is a widespread interest currently for inland fisheries and hence there is a need to
establish standard methodology for assessment of production loss. The floods or high tides may
break the inland fisheries ponds or reservoirs. Normally cyclonic storms and associated floods
may cause substantial effects on the inland fisheries. During cyclones, the embankments of fish
ponds are being affected and hence the reconstruction cost is taken under damage to assets
under fisheries. Loss of small infrastructure and fishing equipments are to be considered under
direct damage. But the loss of fish due to flood is to be considered under loss component of
impact assessment. The loss can be calculated by knowing the average weight of the fish at the
time of disaster, number of fish lost and current market price.
Losses of stock
The value of loss to assets like cattle, poultry, and other animal are considered under direct
losses. In the case of livestock, when estimating the value of loss, a distinction must be made
between beef, dairy, and breeding cattle, because prices and unit values are different. The
production losses may be considered as under section 4.2.3. Stored produce already harvested
and inputs may be calculated based on their farm gate price (in case of the stored produce like
grains and other agricultural commodities. The value of loss caused to inputs can be calculated
based on their replacement value. The input includes the seeds, fertilizers, pesticides and other
soil amendments. The economic value of these types damages are calculated as follows.
Livestock
Value = No.of animals * unit value (Peso./animal) * production loss during the period of
absence (JM$./animal)
Stored produce
Value = Total quantity lost (kg) * fraction of loss (0-1)* farm gate price (JM$./kg)
Integrated Livelihood Baseline and Impact Assessment Tool Kit
25
Inputs
Value = Total quantity lost (kg) * loss factor (0-1)* Replacement value (JM$./kg)
Integrated Livelihood Baseline and Impact Assessment Tool Kit
26
Module 3: Livelihood Baseline Assessment
The livelihood Baseline Assessment
The main purpose of doing a Livelihood Baseline Assessment (LBA) is to enable RADA, the
Ministry of Agriculture and indeed all personnel who serve in the sector to assess its overall
and the state of agricultural livelihoods BEFORE a disaster takes place.
Knowing the current condition of the sector, and which agricultural livelihood areas are likely
to be more vulnerable to disasters, not only makes it easier to respond should a disaster occur,
it also makes it much easier to put in place mitigation and preparedness measures that will
help to make vulnerable areas more resilient.
As such, the LBA should be seen as an essential part of the MOA’s annual national disaster
preparedness measures and should be updated on a regular basis. Annual updates will also
make it possible for RADA to determine what good practices (as outlined in annex X) are
actually being adopted and can thus also serve as a monitoring tool.
Objectives of the LA:
To ensure that good baseline data is collected before a disaster occurs
To facilitate and ease comparison of the livelihood context, activities and outcomes
for families and communities before and after a disaster
To generate a potential menu of possible responses and actions (a response typology)
that can be planned out, costed, and thought through ahead of time
To provide a robust basis for making estimates of the livelihood impact of disasters
that can feed into a flash appeal should a disaster occur
To give a ‘head start’ to provide a basis for immediate post-disaster assessments
including the Initial Livelihood Impact Appraisal and
To provide a basis for a more in-depth Detailed Livelihood Assessment
But additionally, the LBA can also be done in order to:
To prepare farm households and to increase public awareness about disaster
preparedness and about the various “good practices” that can be put in place ahead of
time (as RADA is doing through the production of its various good practices
brochures).
To explore and understand coping and survival strategies that can be strengthened and
to discourage those that may be harmful or which would jeopardize agricultural
livelihoods
To identify and map out the location of high risk and hazard prone households and
communities as they relate to available hydro-meteorological and GIS hazard data
The LB data collection
It is important from the outset to stress that in order for the LBA to be conducted properly and
thoroughly, a strong team effort is required. While RADA must lead this effort at the parish
level, the data collection team should be composed of the following persons:
1. RADA – Leading the Process
2. SDC – supporting community involvement and facilitating community participation
3. Community Based Assessors (CBAs) – drawn from ODPEM, SDC Community
Representatives, JAS, 4H, local Livestock Association groups, Poultry Breeders
Integrated Livelihood Baseline and Impact Assessment Tool Kit
27
Association, Bee Keepers Association, Water User Associations, organic farmer
groups, and other local organizations.
Other potential partners can be drawn from:
ODPEM
Local government – parish councils and the parish development committees
Fisheries Division (MOA)
Forestry Division
National Works Agency
National Irrigation Commission
Ministry of Labour
Churches
NGOs
Research institutions such as CARDI, UWI, IICA
Water User Associations
Environmental Associations
Veterinary services
Community Participation
Under the new national Vision and Policy for disaster mitigation, it is essential that the
mitigation and preparedness process is driven from the community level. HOW the baseline
data is collected is just as important as WHAT is collected. The process is critical and must
encourage ownership and buy-in, not only of the partners and stakeholders that are most
likely to be involved in responding to a disaster (such as government agencies, key NGOs,
and U.N. agencies) but also the local people and key informants so that they can give their
stamp of approval and accept the results that are collected. Ultimately, ODPEM’s goal is to
have each community in all parishes develop their own overall disaster mitigation plans
which would in turn include local agricultural plans as well. To this extent, doing a LBA
involves community outreach and communication, as much as it involves ‘fact collecting’. So
it is essential the data collected through the LBA should be done through community
participation.
For this reason, for the country’s overall national DRM plan, ODPEM has already trained
community based assessors (CBAs) has them in place throughout many communities.
But encouraging a community-driven process is no less true for the Agricultural Disaster
Management planning process. For this reason, the MOA and RADA need to identify
appropriate persons to serve as community assessors for all communities covered in each
agricultural extension area (AEA). These persons may or may not be existing ODPEM CBAs,
but they can also be drawn from:
Jamaica 4H
Jamaica Agricultural Society (JAS)
College of Agriculture, Science and Education (CASE)
US Peace Corp
Farmer groups
Community based groups
NGOs
Service Clubs
Producer organizers
Among others.
Integrated Livelihood Baseline and Impact Assessment Tool Kit
28
Identifying, training and managing CBAs will also make the work of the AEOs much easier
and will see them serve as overall data collection managers, rather than field collectors alone.
Information Needed for the LBA
The LBA employs both Quantitative and Qualitative tools to generate the four (4) main types
of information needed to complete the LBA:
1. Published statistics covering areas such as demography, employment, land sizes,
cropping patterns and livestock numbers
2. Maps showing the geographical areas at risk with delineation of administrative
boundaries (agro-ecological zoning and resource and asset maps)
3. Reports and studies relating to livelihoods and hazards in the areas at risk (can be
project documents, government reports, NGO documents, university studies, etc.)
4. Qualitative information that engages local communities in the participatory rural
appraisal (PRA) collection of information: community mapping, historical timelines,
livelihood zoning, wealth ranking and seasonal calendars
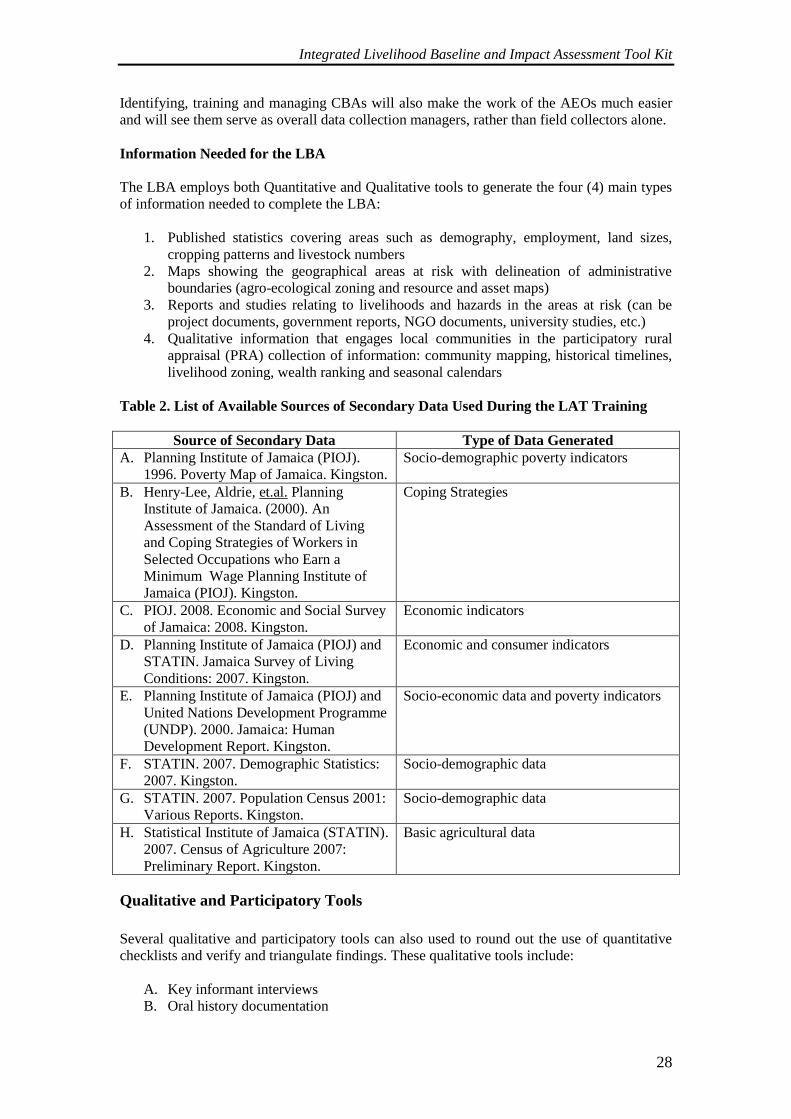
Table 2. List of Available Sources of Secondary Data Used During the LAT Training
Source of Secondary Data Type of Data Generated
A. Planning Institute of Jamaica (PIOJ).
1996. Poverty Map of Jamaica. Kingston.
Socio-demographic poverty indicators
B. Henry-Lee, Aldrie, et.al. Planning
Institute of Jamaica. (2000). An
Assessment of the Standard of Living
and Coping Strategies of Workers in
Selected Occupations who Earn a
Minimum Wage Planning Institute of
Jamaica (PIOJ). Kingston.
Coping Strategies
C. PIOJ. 2008. Economic and Social Survey
of Jamaica: 2008. Kingston.
Economic indicators
D. Planning Institute of Jamaica (PIOJ) and
STATIN. Jamaica Survey of Living
Conditions: 2007. Kingston.
Economic and consumer indicators
E. Planning Institute of Jamaica (PIOJ) and
United Nations Development Programme
(UNDP). 2000. Jamaica: Human
Development Report. Kingston.
Socio-economic data and poverty indicators
F. STATIN. 2007. Demographic Statistics:
2007. Kingston.
Socio-demographic data
G. STATIN. 2007. Population Census 2001:
Various Reports. Kingston.
Socio-demographic data
H. Statistical Institute of Jamaica (STATIN).
2007. Census of Agriculture 2007:
Preliminary Report. Kingston.
Basic agricultural data
Qualitative and Participatory Tools
Several qualitative and participatory tools can also used to round out the use of quantitative
checklists and verify and triangulate findings. These qualitative tools include:
A. Key informant interviews
B. Oral history documentation
Integrated Livelihood Baseline and Impact Assessment Tool Kit
29
C. Wealth ranking exercises
D. Community mapping
E. Transect walks
F. Digital photography documentation
G. Seasonal calendars
H. Historical calendars
Examples of these tools and templates for using them are provided in the tool kit in Section F.
Details of Investigation for the LBA
To complete the LBA, Four (4) key layers of investigation are usually required:
1. Farm Household Interviews using the checklist
2. Key informant interviews
3. Focus Group Discussions
4. Agricultural supply stores/traders and markets
Of these, the farm household level is the most critical and priority attention should be given to
ABIS-registered farmers.
Steps in the Livelihood Baseline Process
Broadly speaking the LBA process involves the following key steps or phases:
A. Preparation which includes review of secondary literature, identification and training
of community assessors, identification of sample sizes and sites, and notification of
communities that the LBA will be taking place.
B. Planning which involves development of an action plan and work schedule for each
agricultural extension area, determining team roles and responsibilities, and a possible
budget for field work. Specific tools (both quantitative and qualitative) are also
determined in this phase.
C. Field Work which includes all data collection activities for each AEA
D. Analysis which involves reviewing the data that is collected to ensure quality control
E. Parish Level Reporting which involves consolidating all the data from each AEA and
submitting it the Parish Manager for further consolidation of an overall parish report
that is submitted to the National ADRM Unit in RADA
F. Generation of potential Response Typologies which should be done at the Parish
Level and with input of the National ADRM Unit to confirm costs and budgetary
components
G. Sharing of LBA reports with the Parish disaster committee and with community
groups once completed.
Matrix C.1 outlines these steps in much greater detail and further identifies the tools,
resources, persons, time frame and outputs associated with each individual step. Use the
matrix as a tool to guide your planning and preparation process.
Integrated Livelihood Baseline and Impact Assessment Tool Kit
30
Form C.1 also provides a template for generating an action plan for each individual AEA.
Additional forms follow that provide question checklists for possible use at each level of
investigation.
Forms C2, C3, and C4 provide additional checklists for investigation with key informants,
community focus groups and traders and are to be used by the AEOs, the Community Based
Assessors and the LBA field work teams.
Once the extension area field work has been completed, Form C5 can be used to fill out an
overall AEA report for submission to the RADA Parish Manager who in turn may use Form
C6 to prepare an overall LBA report for the parish for submission to the NADRM unit at
RADA head office.
The forms are also colour coded to indicate which team members are responsible for using
them.
Green is for the AEOs and CBAs.
Blue is for submission to the Parish Manager
Red is for submission from the Parish Manager to the National ADRM Unit.
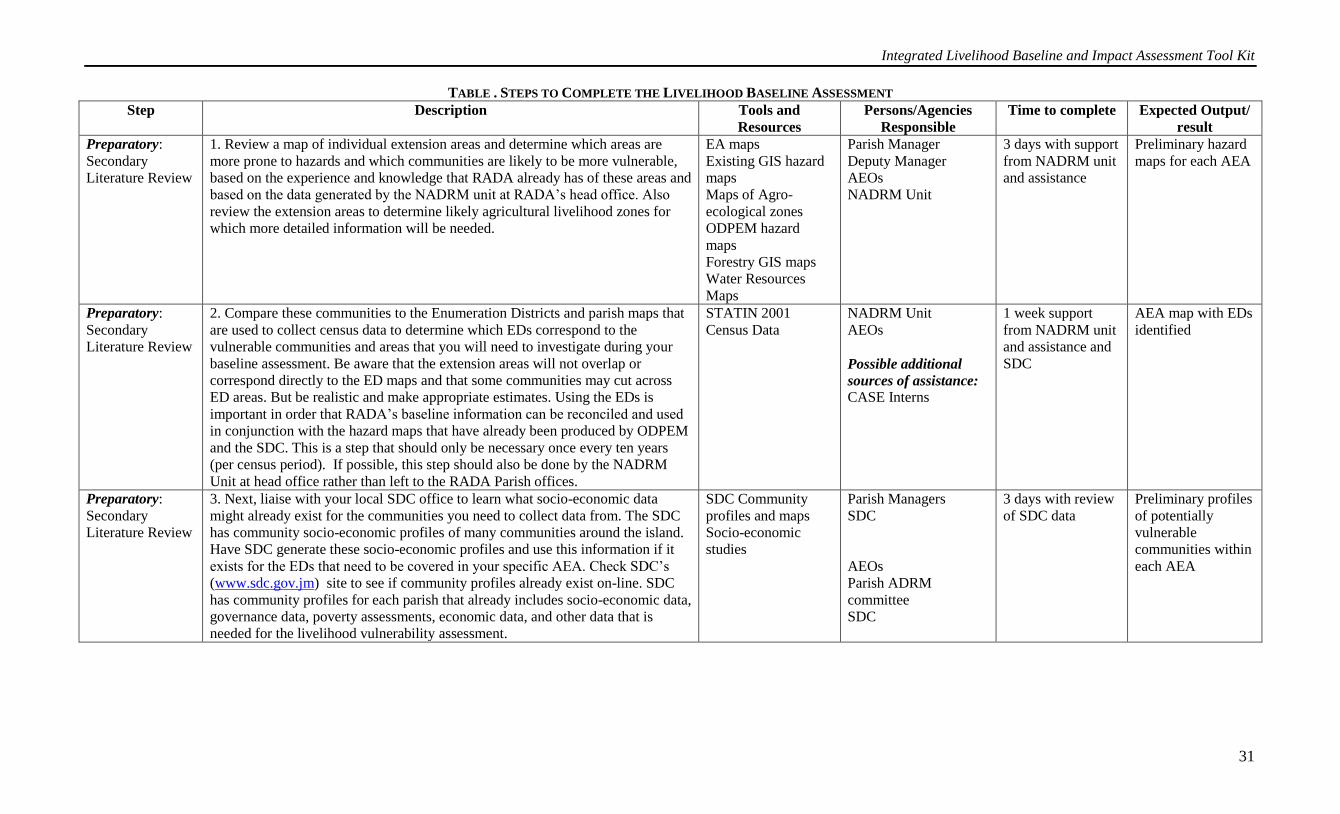
Integrated Livelihood Baseline and Impact Assessment Tool Kit
31
TABLE . STEPS TO COMPLETE THE LIVELIHOOD BASELINE ASSESSMENT
Step Description Tools and
Resources
Persons/Agencies
Responsible
Time to complete Expected Output/
result
Preparatory:
Secondary
Literature Review
1. Review a map of individual extension areas and determine which areas are
more prone to hazards and which communities are likely to be more vulnerable,
based on the experience and knowledge that RADA already has of these areas and
based on the data generated by the NADRM unit at RADA’s head office. Also
review the extension areas to determine likely agricultural livelihood zones for
which more detailed information will be needed.
EA maps
Existing GIS hazard
maps
Maps of Agro-
ecological zones
ODPEM hazard
maps
Forestry GIS maps
Water Resources
Maps
Parish Manager
Deputy Manager
AEOs
NADRM Unit
3 days with support
from NADRM unit
and assistance
Preliminary hazard
maps for each AEA
Preparatory:
Secondary
Literature Review
2. Compare these communities to the Enumeration Districts and parish maps that
are used to collect census data to determine which EDs correspond to the
vulnerable communities and areas that you will need to investigate during your
baseline assessment. Be aware that the extension areas will not overlap or
correspond directly to the ED maps and that some communities may cut across
ED areas. But be realistic and make appropriate estimates. Using the EDs is
important in order that RADA’s baseline information can be reconciled and used
in conjunction with the hazard maps that have already been produced by ODPEM
and the SDC. This is a step that should only be necessary once every ten years
(per census period). If possible, this step should also be done by the NADRM
Unit at head office rather than left to the RADA Parish offices.
STATIN 2001
Census Data
NADRM Unit
AEOs
Possible additional
sources of assistance: CASE Interns
1 week support
from NADRM unit
and assistance and
SDC
AEA map with EDs
identified
Preparatory:
Secondary
Literature Review
3. Next, liaise with your local SDC office to learn what socio-economic data
might already exist for the communities you need to collect data from. The SDC
has community socio-economic profiles of many communities around the island.
Have SDC generate these socio-economic profiles and use this information if it
exists for the EDs that need to be covered in your specific AEA. Check SDC’s
(www.sdc.gov.jm) site to see if community profiles already exist on-line. SDC
has community profiles for each parish that already includes socio-economic data,
governance data, poverty assessments, economic data, and other data that is
needed for the livelihood vulnerability assessment.
SDC Community
profiles and maps
Socio-economic
studies
Parish Managers
SDC
AEOs
Parish ADRM
committee
SDC
3 days with review
of SDC data
Preliminary profiles
of potentially
vulnerable
communities within
each AEA
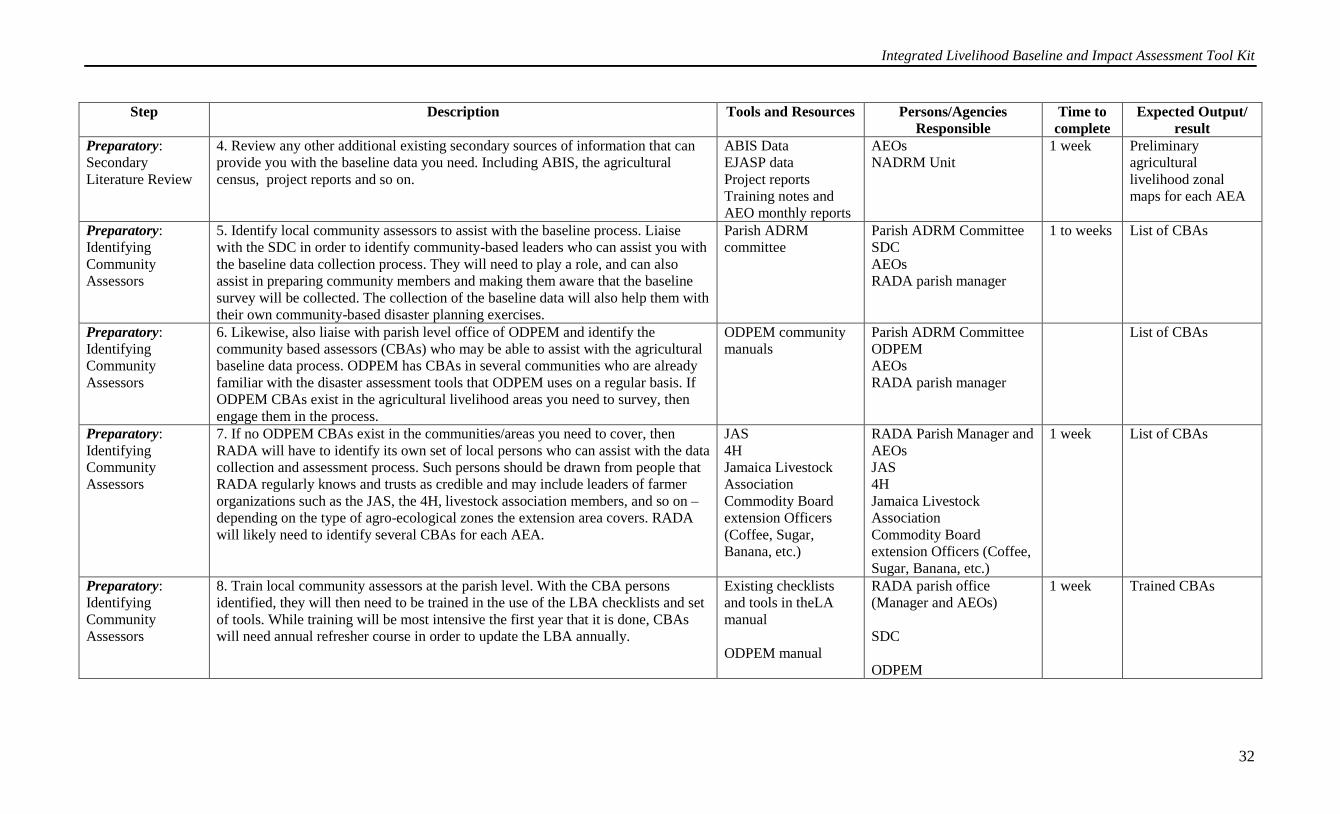
Integrated Livelihood Baseline and Impact Assessment Tool Kit
32
Step Description Tools and Resources Persons/Agencies
Responsible
Time to
complete
Expected Output/
result
Preparatory:
Secondary
Literature Review
4. Review any other additional existing secondary sources of information that can
provide you with the baseline data you need. Including ABIS, the agricultural
census, project reports and so on.
ABIS Data
EJASP data
Project reports
Training notes and
AEO monthly reports
AEOs
NADRM Unit
1 week Preliminary
agricultural
livelihood zonal
maps for each AEA
Preparatory:
Identifying
Community
Assessors
5. Identify local community assessors to assist with the baseline process. Liaise
with the SDC in order to identify community-based leaders who can assist you with
the baseline data collection process. They will need to play a role, and can also
assist in preparing community members and making them aware that the baseline
survey will be collected. The collection of the baseline data will also help them with
their own community-based disaster planning exercises.
Parish ADRM
committee
Parish ADRM Committee
SDC
AEOs
RADA parish manager
1 to weeks List of CBAs
Preparatory:
Identifying
Community
Assessors
6. Likewise, also liaise with parish level office of ODPEM and identify the
community based assessors (CBAs) who may be able to assist with the agricultural
baseline data process. ODPEM has CBAs in several communities who are already
familiar with the disaster assessment tools that ODPEM uses on a regular basis. If
ODPEM CBAs exist in the agricultural livelihood areas you need to survey, then
engage them in the process.
ODPEM community
manuals
Parish ADRM Committee
ODPEM
AEOs
RADA parish manager
List of CBAs
Preparatory:
Identifying
Community
Assessors
7. If no ODPEM CBAs exist in the communities/areas you need to cover, then
RADA will have to identify its own set of local persons who can assist with the data
collection and assessment process. Such persons should be drawn from people that
RADA regularly knows and trusts as credible and may include leaders of farmer
organizations such as the JAS, the 4H, livestock association members, and so on –
depending on the type of agro-ecological zones the extension area covers. RADA
will likely need to identify several CBAs for each AEA.
JAS
4H
Jamaica Livestock
Association
Commodity Board
extension Officers
(Coffee, Sugar,
Banana, etc.)
RADA Parish Manager and
AEOs
JAS
4H
Jamaica Livestock
Association
Commodity Board
extension Officers (Coffee,
Sugar, Banana, etc.)
1 week List of CBAs
Preparatory:
Identifying
Community
Assessors
8. Train local community assessors at the parish level. With the CBA persons
identified, they will then need to be trained in the use of the LBA checklists and set
of tools. While training will be most intensive the first year that it is done, CBAs
will need annual refresher course in order to update the LBA annually.
Existing checklists
and tools in theLA
manual
ODPEM manual
RADA parish office
(Manager and AEOs)
SDC
ODPEM
1 week Trained CBAs
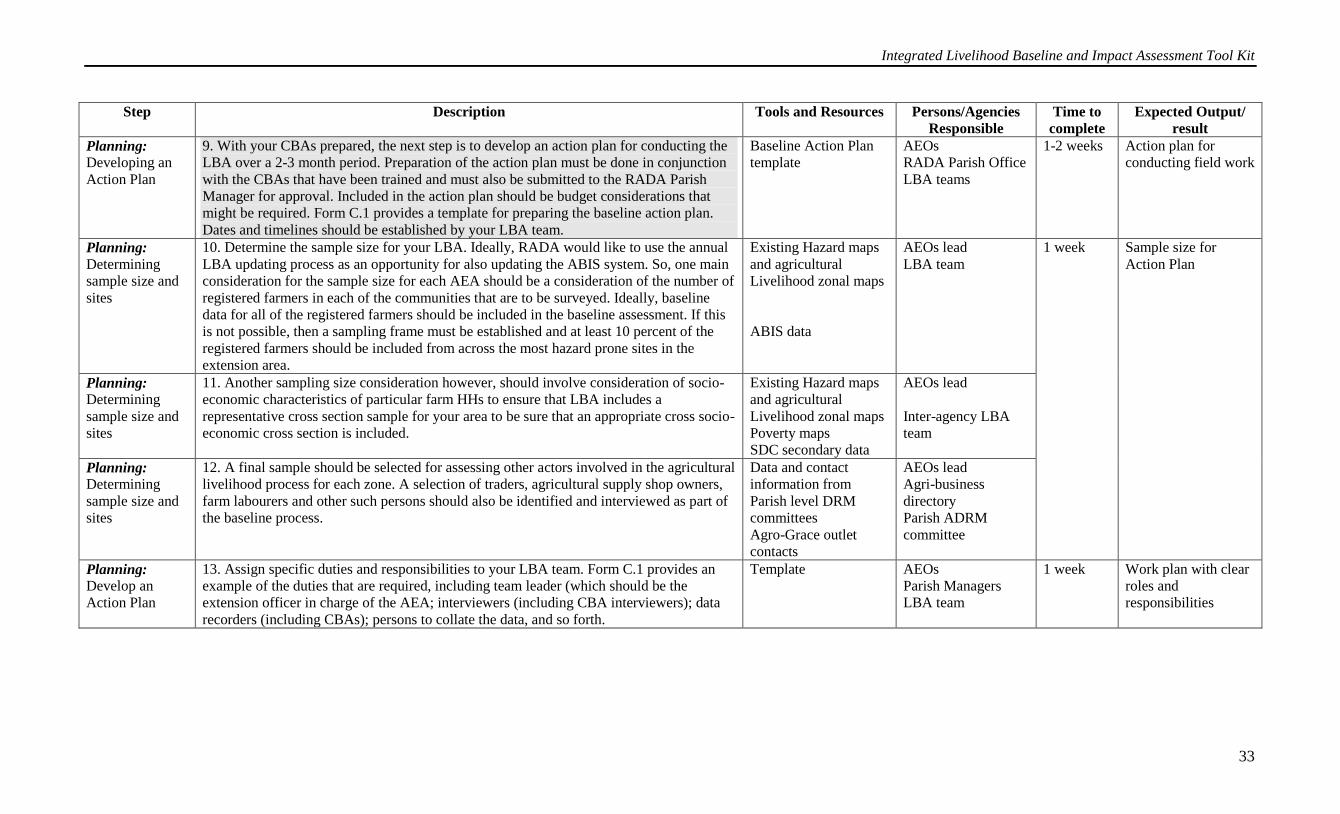
Integrated Livelihood Baseline and Impact Assessment Tool Kit
33
Step Description Tools and Resources Persons/Agencies
Responsible
Time to
complete
Expected Output/
result
Planning:
Developing an
Action Plan
9. With your CBAs prepared, the next step is to develop an action plan for conducting the
LBA over a 2-3 month period. Preparation of the action plan must be done in conjunction
with the CBAs that have been trained and must also be submitted to the RADA Parish
Manager for approval. Included in the action plan should be budget considerations that
might be required. Form C.1 provides a template for preparing the baseline action plan.
Dates and timelines should be established by your LBA team.
Baseline Action Plan
template
AEOs
RADA Parish Office
LBA teams
1-2 weeks Action plan for
conducting field work
Planning:
Determining
sample size and
sites
10. Determine the sample size for your LBA. Ideally, RADA would like to use the annual
LBA updating process as an opportunity for also updating the ABIS system. So, one main
consideration for the sample size for each AEA should be a consideration of the number of
registered farmers in each of the communities that are to be surveyed. Ideally, baseline
data for all of the registered farmers should be included in the baseline assessment. If this
is not possible, then a sampling frame must be established and at least 10 percent of the
registered farmers should be included from across the most hazard prone sites in the
extension area.
Existing Hazard maps
and agricultural
Livelihood zonal maps
ABIS data
AEOs lead
LBA team
1 week Sample size for
Action Plan
Planning:
Determining
sample size and
sites
11. Another sampling size consideration however, should involve consideration of socio-
economic characteristics of particular farm HHs to ensure that LBA includes a
representative cross section sample for your area to be sure that an appropriate cross socio-
economic cross section is included.
Existing Hazard maps
and agricultural
Livelihood zonal maps
Poverty maps
SDC secondary data
AEOs lead
Inter-agency LBA
team
Planning:
Determining
sample size and
sites
12. A final sample should be selected for assessing other actors involved in the agricultural
livelihood process for each zone. A selection of traders, agricultural supply shop owners,
farm labourers and other such persons should also be identified and interviewed as part of
the baseline process.
Data and contact
information from
Parish level DRM
committees
Agro-Grace outlet
contacts
AEOs lead
Agri-business
directory
Parish ADRM
committee
Planning:
Develop an
Action Plan
13. Assign specific duties and responsibilities to your LBA team. Form C.1 provides an
example of the duties that are required, including team leader (which should be the
extension officer in charge of the AEA; interviewers (including CBA interviewers); data
recorders (including CBAs); persons to collate the data, and so forth.
Template AEOs
Parish Managers
LBA team
1 week Work plan with clear
roles and
responsibilities

Integrated Livelihood Baseline and Impact Assessment Tool Kit
34
Step Description Tools and Resources Persons/Agencies
Responsible
Time to
complete
Expected
Output/ result
Planning:
Develop an Action
Plan with clear and
realistic timelines
14. Determine a precise timeline for completing all field work. Consider the
other RADA AEO duties that are also involved and be realistic. Explore
opportunities for how baseline data can be incorporated into existing duties,
farmer training days, farmer meetings, and so on. Identify opportunities for
delegating interviews and meetings to JAS and other agencies who also meet
with farmers regularly.
RADA work schedules
Scheduled farmer training days
Calendar of activities
Work plan with
realistic time lines
Planning:
Determining data
collection tools
15. Select the baseline tools that you will use to complete your baseline
assessment. Which set of interviewing tools will be selected? Will you do
transect walks? Focus group discussions? Venn Diagrams? Community
mapping, or other tools? Section F provides a complete tool kit of all the
assessment tools that you can consider. At the very least, the following tools
must be included in the baseline assessment:
Interviews with key informants (community leaders)
Interviews with traders and market people
Household level interviews
Use of specific checklists
Community leader interviews
Market level key informant
interviews
Trader interviews
Farm household level interviews
PRA tools
Digital cameras
AEOs
Parish Managers
LBA team
1 week Clear set of data
collection tools
Field Work 16. Notify the community ahead of time that your team will be conducting a
baseline assessment.
Community bulletin/fact sheets
Existing Community meetings
AEOs with CBAs
and other agencies
working in the
areas that are to be
assessed
SDC
1 week Community
notification
Field Work 17. Complete the BLA field work. Checklists included in the manual
(Forms C2, C3 and C4)
AEOs and entire
LBA team for each
AEA
3 months,
part-time
Field Data from
all sample sites
Analysis and
Reporting
18. Once all the field work has been done, review the completed checklists as a
team and verify results before submitting to PAM at Parish Office.
Data collected AEOs and entire
LBA team for each
AEA
1 week Reviewed field
data for
submission
Analysis and
Reporting
19. Submit completed checklists into RADA parish office for data entry and
preparation of baseline reports.
Field report
Form C5
AEOs and entire
LBA team for each
AEA
Analysis and
Reporting
20. With RADA head office, generate GIS hazard maps and ALZ profiles and a
complete baseline report for specific extension areas and for the parish as a
whole.
NADRM unit assistance
FORM C6
NADRM Unit
1 month Annual Parish
Baseline Report
(Form X)
Hazard maps
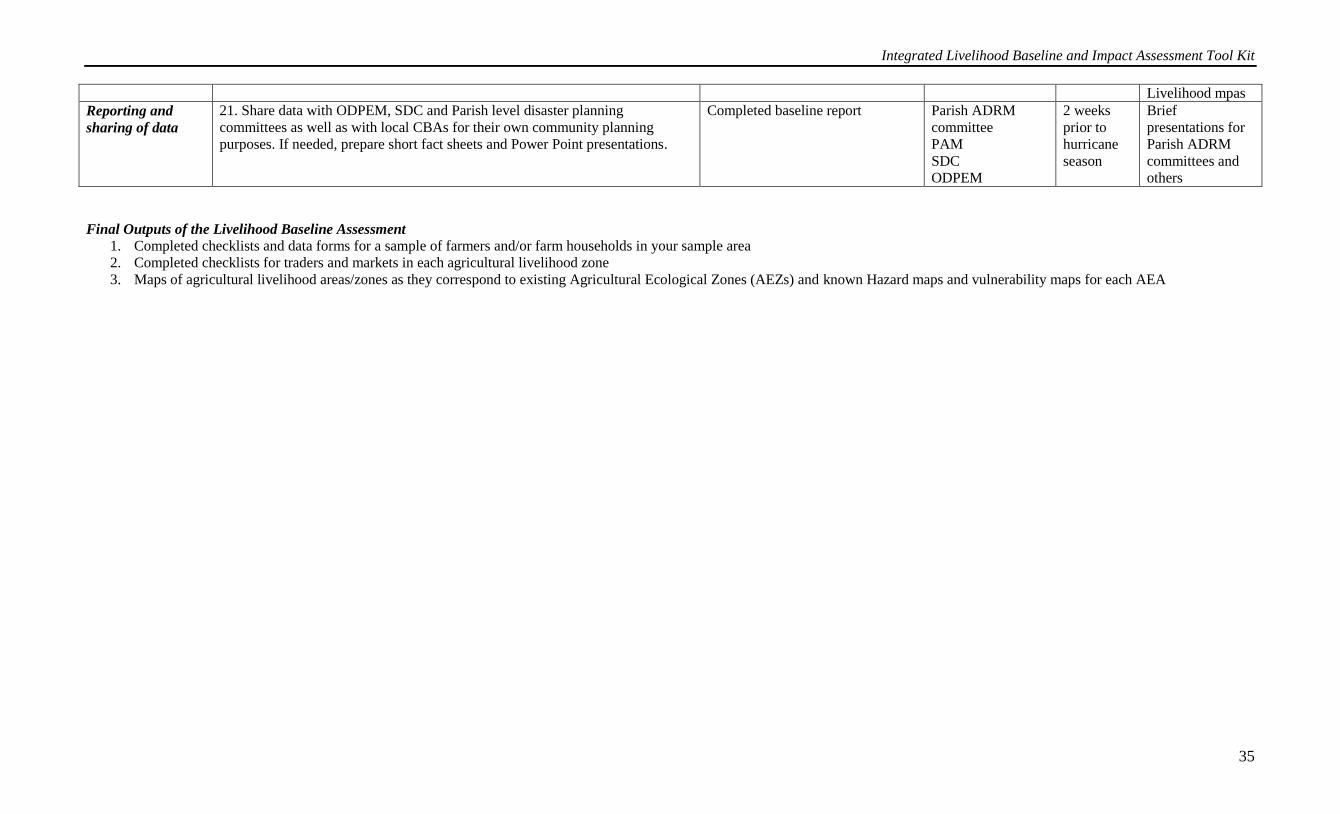
Integrated Livelihood Baseline and Impact Assessment Tool Kit
35
Livelihood mpas
Reporting and
sharing of data
21. Share data with ODPEM, SDC and Parish level disaster planning
committees as well as with local CBAs for their own community planning
purposes. If needed, prepare short fact sheets and Power Point presentations.
Completed baseline report Parish ADRM
committee
PAM
SDC
ODPEM
2 weeks
prior to
hurricane
season
Brief
presentations for
Parish ADRM
committees and
others
Final Outputs of the Livelihood Baseline Assessment
1. Completed checklists and data forms for a sample of farmers and/or farm households in your sample area
2. Completed checklists for traders and markets in each agricultural livelihood zone
3. Maps of agricultural livelihood areas/zones as they correspond to existing Agricultural Ecological Zones (AEZs) and known Hazard maps and vulnerability maps for each AEA
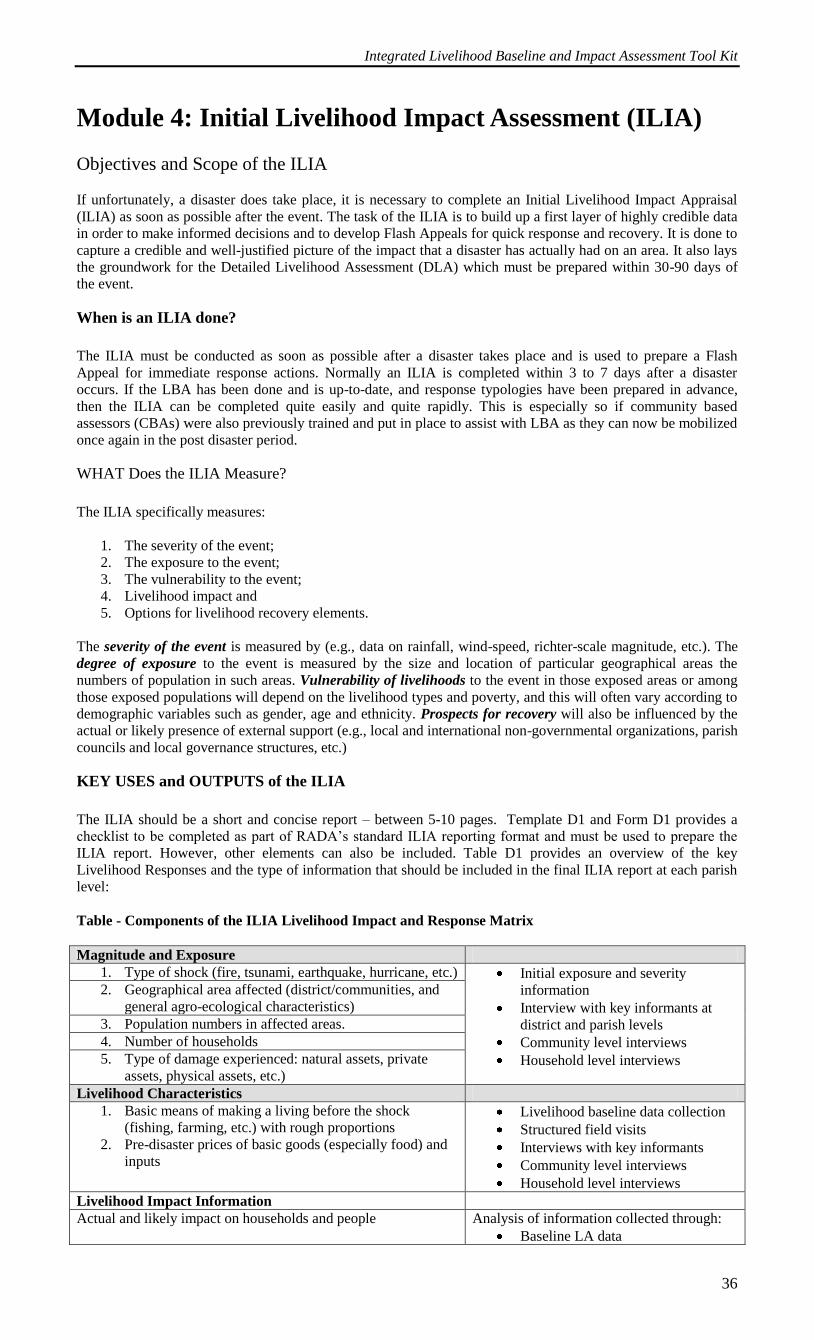
Integrated Livelihood Baseline and Impact Assessment Tool Kit
36
Module 4: Initial Livelihood Impact Assessment (ILIA)
Objectives and Scope of the ILIA
If unfortunately, a disaster does take place, it is necessary to complete an Initial Livelihood Impact Appraisal
(ILIA) as soon as possible after the event. The task of the ILIA is to build up a first layer of highly credible data
in order to make informed decisions and to develop Flash Appeals for quick response and recovery. It is done to
capture a credible and well-justified picture of the impact that a disaster has actually had on an area. It also lays
the groundwork for the Detailed Livelihood Assessment (DLA) which must be prepared within 30-90 days of
the event.
When is an ILIA done?
The ILIA must be conducted as soon as possible after a disaster takes place and is used to prepare a Flash
Appeal for immediate response actions. Normally an ILIA is completed within 3 to 7 days after a disaster
occurs. If the LBA has been done and is up-to-date, and response typologies have been prepared in advance,
then the ILIA can be completed quite easily and quite rapidly. This is especially so if community based
assessors (CBAs) were also previously trained and put in place to assist with LBA as they can now be mobilized
once again in the post disaster period.
WHAT Does the ILIA Measure?
The ILIA specifically measures:
1. The severity of the event;
2. The exposure to the event;
3. The vulnerability to the event;
4. Livelihood impact and
5. Options for livelihood recovery elements.
The severity of the event is measured by (e.g., data on rainfall, wind-speed, richter-scale magnitude, etc.). The
degree of exposure to the event is measured by the size and location of particular geographical areas the
numbers of population in such areas. Vulnerability of livelihoods to the event in those exposed areas or among
those exposed populations will depend on the livelihood types and poverty, and this will often vary according to
demographic variables such as gender, age and ethnicity. Prospects for recovery will also be influenced by the
actual or likely presence of external support (e.g., local and international non-governmental organizations, parish
councils and local governance structures, etc.)
KEY USES and OUTPUTS of the ILIA
The ILIA should be a short and concise report – between 5-10 pages. Template D1 and Form D1 provides a
checklist to be completed as part of RADA’s standard ILIA reporting format and must be used to prepare the
ILIA report. However, other elements can also be included. Table D1 provides an overview of the key
Livelihood Responses and the type of information that should be included in the final ILIA report at each parish
level:
Table - Components of the ILIA Livelihood Impact and Response Matrix
Magnitude and Exposure
1. Type of shock (fire, tsunami, earthquake, hurricane, etc.) Initial exposure and severity
information
Interview with key informants at
district and parish levels
Community level interviews
Household level interviews
2. Geographical area affected (district/communities, and
general agro-ecological characteristics)
3. Population numbers in affected areas.
4. Number of households
5. Type of damage experienced: natural assets, private
assets, physical assets, etc.)
Livelihood Characteristics
1. Basic means of making a living before the shock
(fishing, farming, etc.) with rough proportions
2. Pre-disaster prices of basic goods (especially food) and
inputs
Livelihood baseline data collection
Structured field visits
Interviews with key informants
Community level interviews
Household level interviews
Livelihood Impact Information
Actual and likely impact on households and people Analysis of information collected through:
Baseline LA data
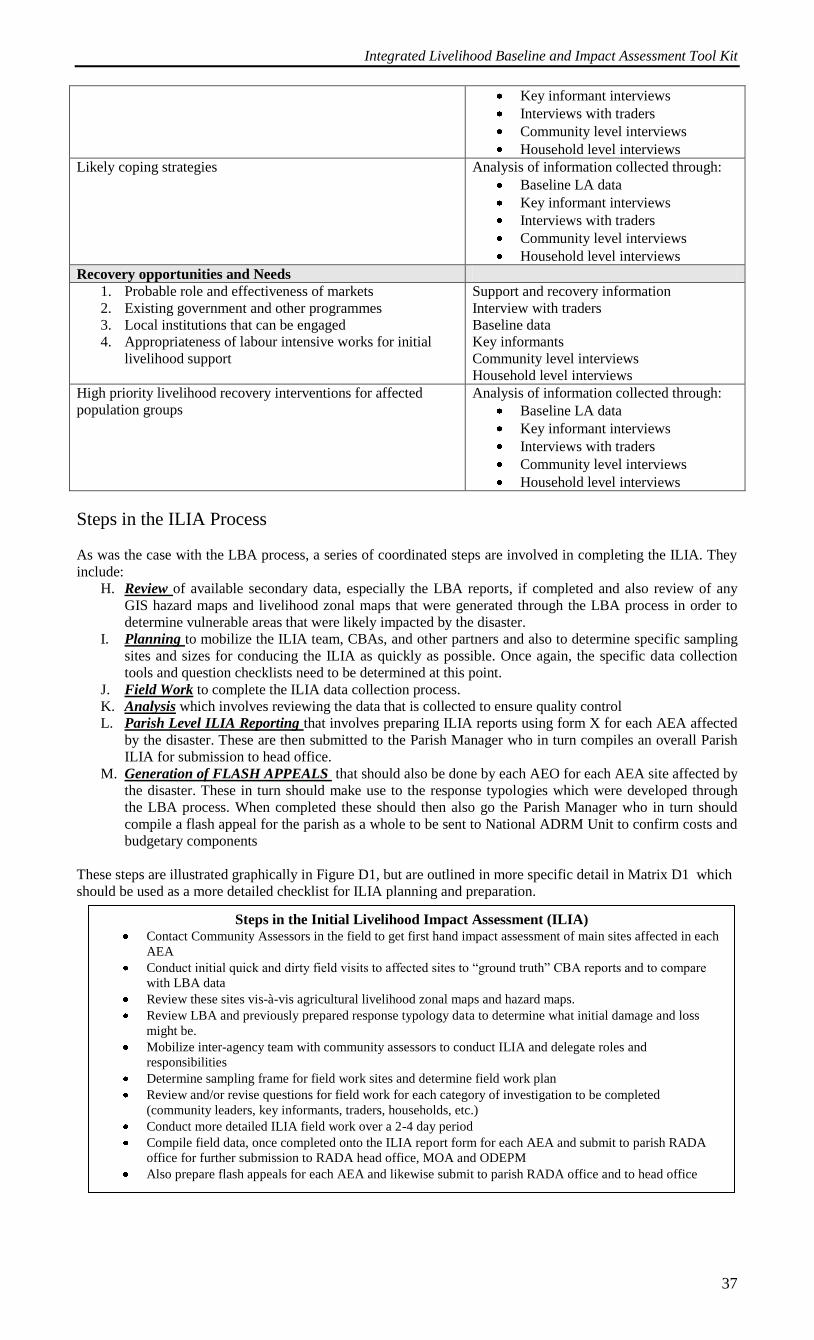
Integrated Livelihood Baseline and Impact Assessment Tool Kit
37
Key informant interviews
Interviews with traders
Community level interviews
Household level interviews
Likely coping strategies Analysis of information collected through:
Baseline LA data
Key informant interviews
Interviews with traders
Community level interviews
Household level interviews
Recovery opportunities and Needs
1. Probable role and effectiveness of markets
2. Existing government and other programmes
3. Local institutions that can be engaged
4. Appropriateness of labour intensive works for initial
livelihood support
Support and recovery information
Interview with traders
Baseline data
Key informants
Community level interviews
Household level interviews
High priority livelihood recovery interventions for affected
population groups
Analysis of information collected through:
Baseline LA data
Key informant interviews
Interviews with traders
Community level interviews
Household level interviews
Steps in the ILIA Process
As was the case with the LBA process, a series of coordinated steps are involved in completing the ILIA. They
include:
H. Review of available secondary data, especially the LBA reports, if completed and also review of any
GIS hazard maps and livelihood zonal maps that were generated through the LBA process in order to
determine vulnerable areas that were likely impacted by the disaster.
I. Planning to mobilize the ILIA team, CBAs, and other partners and also to determine specific sampling
sites and sizes for conducing the ILIA as quickly as possible. Once again, the specific data collection
tools and question checklists need to be determined at this point.
J. Field Work to complete the ILIA data collection process.
K. Analysis which involves reviewing the data that is collected to ensure quality control
L. Parish Level ILIA Reporting that involves preparing ILIA reports using form X for each AEA affected
by the disaster. These are then submitted to the Parish Manager who in turn compiles an overall Parish
ILIA for submission to head office.
M. Generation of FLASH APPEALS that should also be done by each AEO for each AEA site affected by
the disaster. These in turn should make use to the response typologies which were developed through
the LBA process. When completed these should then also go the Parish Manager who in turn should
compile a flash appeal for the parish as a whole to be sent to National ADRM Unit to confirm costs and
budgetary components
These steps are illustrated graphically in Figure D1, but are outlined in more specific detail in Matrix D1 which
should be used as a more detailed checklist for ILIA planning and preparation.
Steps in the Initial Livelihood Impact Assessment (ILIA) Contact Community Assessors in the field to get first hand impact assessment of main sites affected in each
AEA
Conduct initial quick and dirty field visits to affected sites to “ground truth” CBA reports and to compare
with LBA data
Review these sites vis-à-vis agricultural livelihood zonal maps and hazard maps.
Review LBA and previously prepared response typology data to determine what initial damage and loss
might be.
Mobilize inter-agency team with community assessors to conduct ILIA and delegate roles and
responsibilities
Determine sampling frame for field work sites and determine field work plan
Review and/or revise questions for field work for each category of investigation to be completed
(community leaders, key informants, traders, households, etc.)
Conduct more detailed ILIA field work over a 2-4 day period
Compile field data, once completed onto the ILIA report form for each AEA and submit to parish RADA
office for further submission to RADA head office, MOA and ODEPM
Also prepare flash appeals for each AEA and likewise submit to parish RADA office and to head office
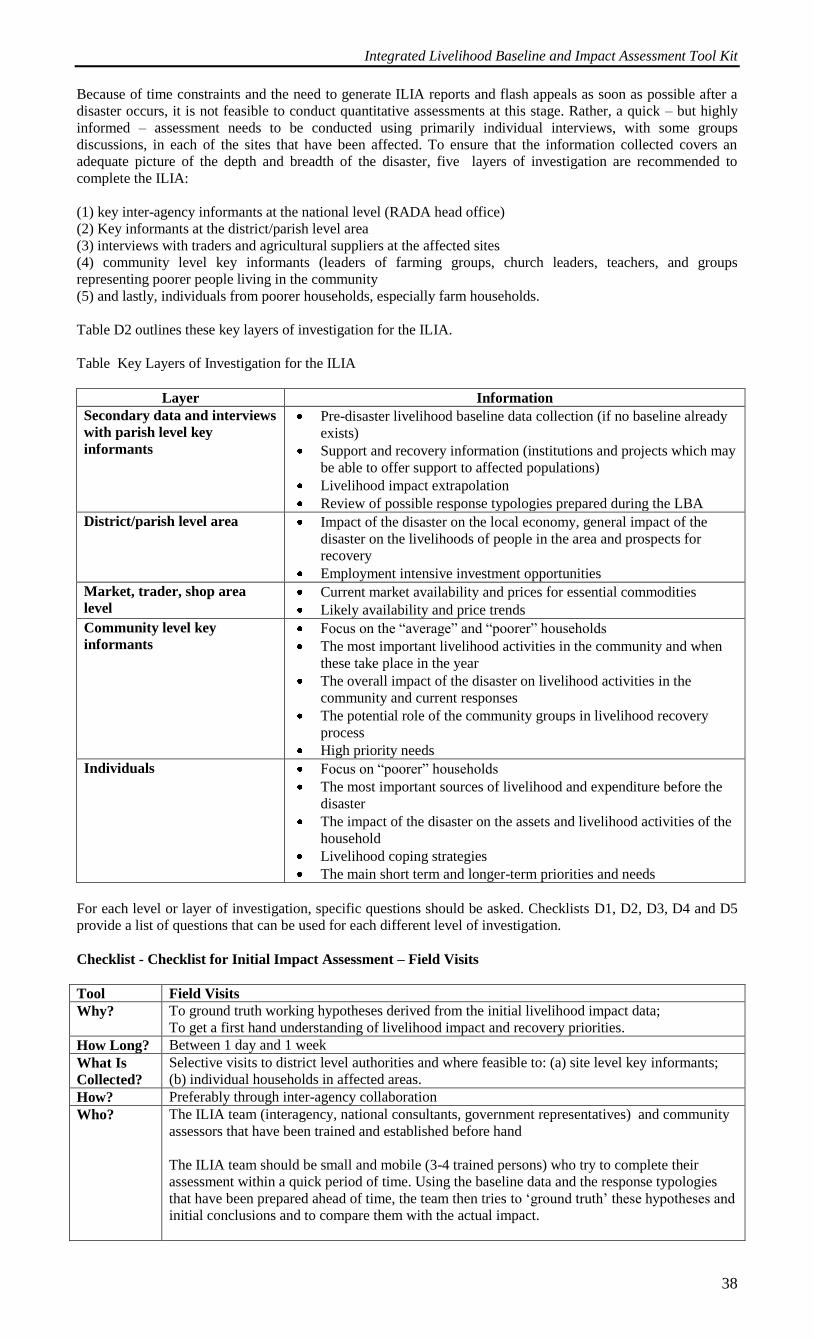
Integrated Livelihood Baseline and Impact Assessment Tool Kit
38
Because of time constraints and the need to generate ILIA reports and flash appeals as soon as possible after a
disaster occurs, it is not feasible to conduct quantitative assessments at this stage. Rather, a quick – but highly
informed – assessment needs to be conducted using primarily individual interviews, with some groups
discussions, in each of the sites that have been affected. To ensure that the information collected covers an
adequate picture of the depth and breadth of the disaster, five layers of investigation are recommended to
complete the ILIA:
(1) key inter-agency informants at the national level (RADA head office)
(2) Key informants at the district/parish level area
(3) interviews with traders and agricultural suppliers at the affected sites
(4) community level key informants (leaders of farming groups, church leaders, teachers, and groups
representing poorer people living in the community
(5) and lastly, individuals from poorer households, especially farm households.
Table D2 outlines these key layers of investigation for the ILIA.
Table Key Layers of Investigation for the ILIA
Layer Information
Secondary data and interviews
with parish level key
informants
Pre-disaster livelihood baseline data collection (if no baseline already
exists)
Support and recovery information (institutions and projects which may
be able to offer support to affected populations)
Livelihood impact extrapolation
Review of possible response typologies prepared during the LBA
District/parish level area Impact of the disaster on the local economy, general impact of the
disaster on the livelihoods of people in the area and prospects for
recovery
Employment intensive investment opportunities
Market, trader, shop area
level Current market availability and prices for essential commodities
Likely availability and price trends
Community level key
informants Focus on the “average” and “poorer” households
The most important livelihood activities in the community and when
these take place in the year
The overall impact of the disaster on livelihood activities in the
community and current responses
The potential role of the community groups in livelihood recovery
process
High priority needs
Individuals Focus on “poorer” households
The most important sources of livelihood and expenditure before the
disaster
The impact of the disaster on the assets and livelihood activities of the
household
Livelihood coping strategies
The main short term and longer-term priorities and needs
For each level or layer of investigation, specific questions should be asked. Checklists D1, D2, D3, D4 and D5
provide a list of questions that can be used for each different level of investigation.
Checklist - Checklist for Initial Impact Assessment – Field Visits
Tool Field Visits
Why? To ground truth working hypotheses derived from the initial livelihood impact data;
To get a first hand understanding of livelihood impact and recovery priorities.
How Long? Between 1 day and 1 week
What Is
Collected?
Selective visits to district level authorities and where feasible to: (a) site level key informants;
(b) individual households in affected areas.
How? Preferably through inter-agency collaboration
Who? The ILIA team (interagency, national consultants, government representatives) and community
assessors that have been trained and established before hand
The ILIA team should be small and mobile (3-4 trained persons) who try to complete their
assessment within a quick period of time. Using the baseline data and the response typologies
that have been prepared ahead of time, the team then tries to ‘ground truth’ these hypotheses and
initial conclusions and to compare them with the actual impact.
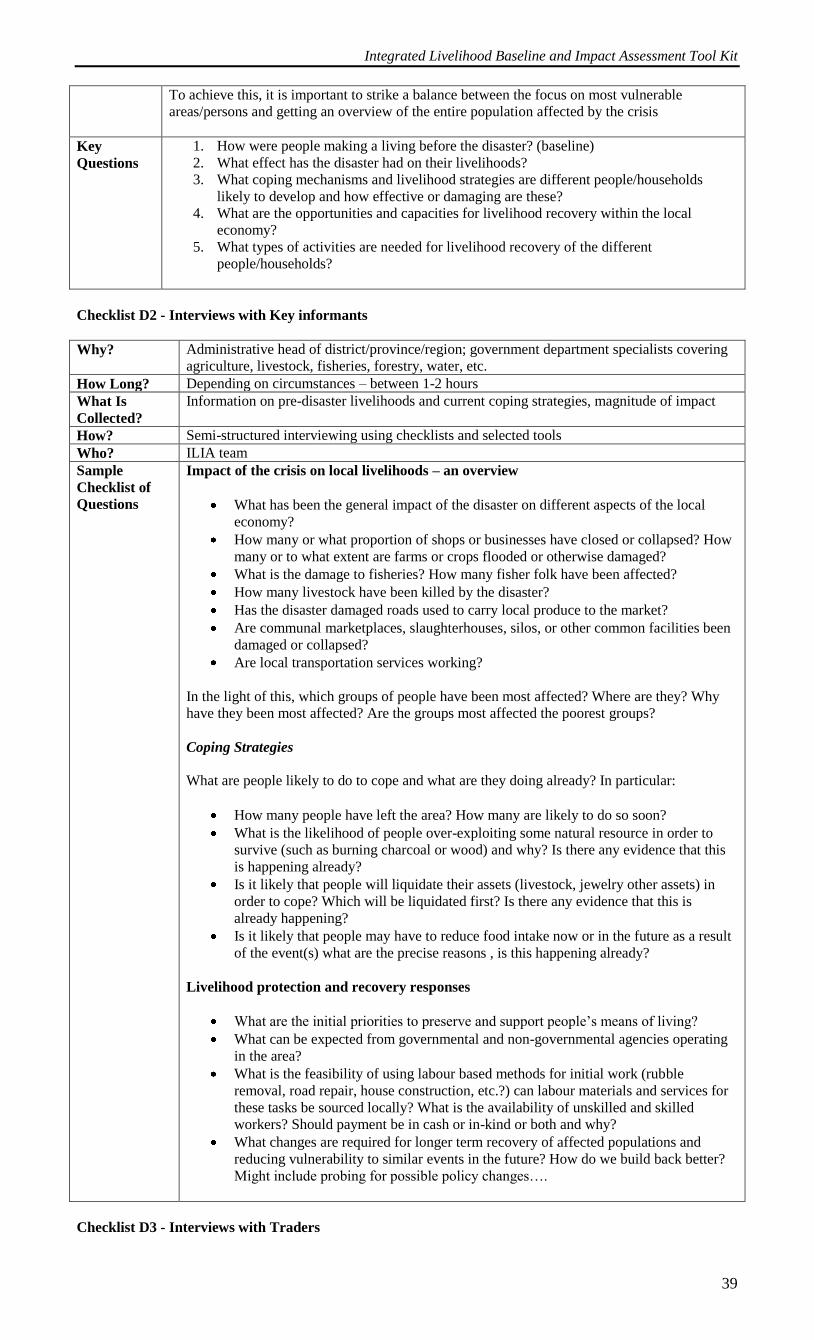
Integrated Livelihood Baseline and Impact Assessment Tool Kit
39
To achieve this, it is important to strike a balance between the focus on most vulnerable
areas/persons and getting an overview of the entire population affected by the crisis
Key
Questions
1. How were people making a living before the disaster? (baseline)
2. What effect has the disaster had on their livelihoods?
3. What coping mechanisms and livelihood strategies are different people/households
likely to develop and how effective or damaging are these?
4. What are the opportunities and capacities for livelihood recovery within the local
economy?
5. What types of activities are needed for livelihood recovery of the different
people/households?
Checklist D2 - Interviews with Key informants
Why? Administrative head of district/province/region; government department specialists covering
agriculture, livestock, fisheries, forestry, water, etc.
How Long? Depending on circumstances – between 1-2 hours
What Is
Collected?
Information on pre-disaster livelihoods and current coping strategies, magnitude of impact
How? Semi-structured interviewing using checklists and selected tools
Who? ILIA team
Sample
Checklist of
Questions
Impact of the crisis on local livelihoods – an overview
What has been the general impact of the disaster on different aspects of the local
economy?
How many or what proportion of shops or businesses have closed or collapsed? How
many or to what extent are farms or crops flooded or otherwise damaged?
What is the damage to fisheries? How many fisher folk have been affected?
How many livestock have been killed by the disaster?
Has the disaster damaged roads used to carry local produce to the market?
Are communal marketplaces, slaughterhouses, silos, or other common facilities been
damaged or collapsed?
Are local transportation services working?
In the light of this, which groups of people have been most affected? Where are they? Why
have they been most affected? Are the groups most affected the poorest groups?
Coping Strategies
What are people likely to do to cope and what are they doing already? In particular:
How many people have left the area? How many are likely to do so soon?
What is the likelihood of people over-exploiting some natural resource in order to
survive (such as burning charcoal or wood) and why? Is there any evidence that this
is happening already?
Is it likely that people will liquidate their assets (livestock, jewelry other assets) in
order to cope? Which will be liquidated first? Is there any evidence that this is
already happening?
Is it likely that people may have to reduce food intake now or in the future as a result
of the event(s) what are the precise reasons , is this happening already?
Livelihood protection and recovery responses
What are the initial priorities to preserve and support people’s means of living?
What can be expected from governmental and non-governmental agencies operating
in the area?
What is the feasibility of using labour based methods for initial work (rubble
removal, road repair, house construction, etc.?) can labour materials and services for
these tasks be sourced locally? What is the availability of unskilled and skilled
workers? Should payment be in cash or in-kind or both and why?
What changes are required for longer term recovery of affected populations and
reducing vulnerability to similar events in the future? How do we build back better?
Might include probing for possible policy changes….
Checklist D3 - Interviews with Traders
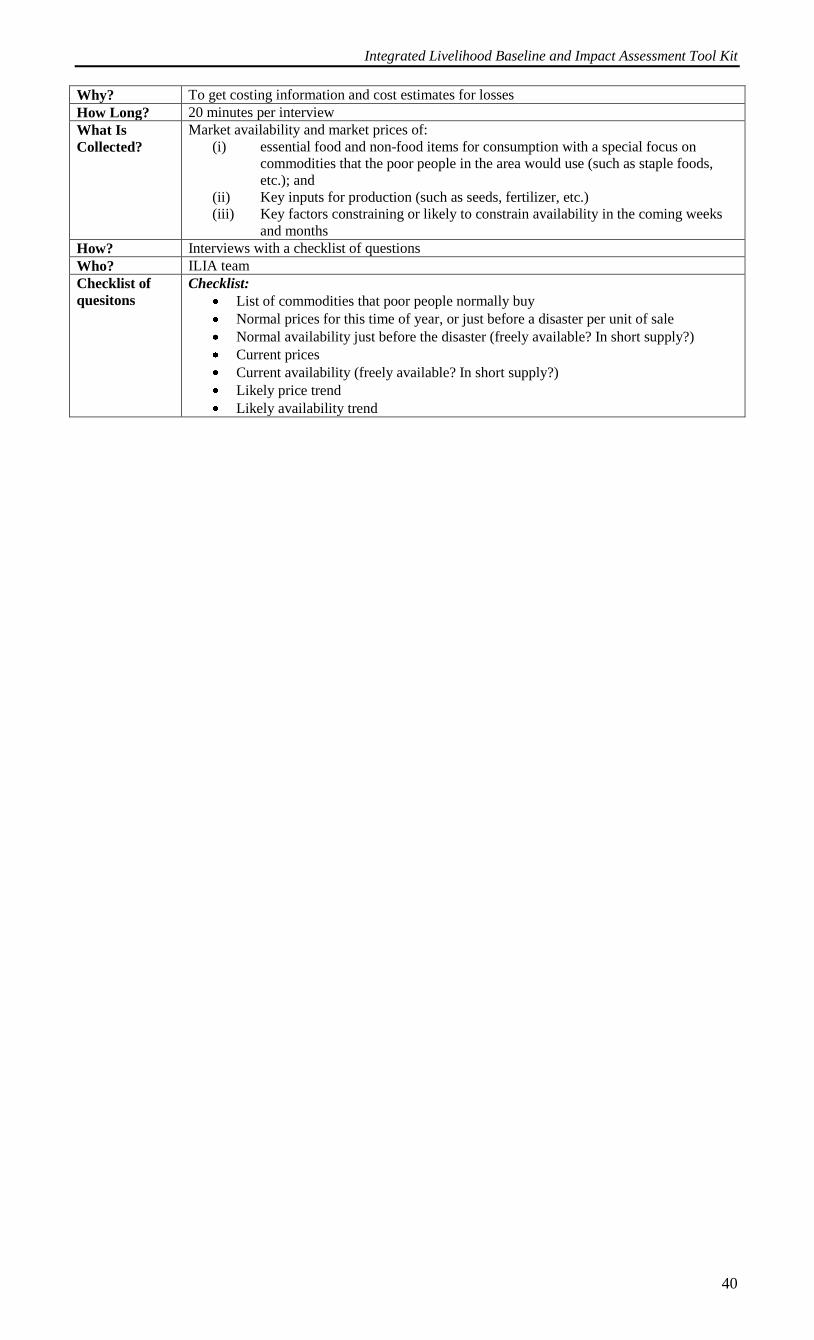
Integrated Livelihood Baseline and Impact Assessment Tool Kit
40
Why? To get costing information and cost estimates for losses
How Long? 20 minutes per interview
What Is
Collected?
Market availability and market prices of:
(i) essential food and non-food items for consumption with a special focus on
commodities that the poor people in the area would use (such as staple foods,
etc.); and
(ii) Key inputs for production (such as seeds, fertilizer, etc.)
(iii) Key factors constraining or likely to constrain availability in the coming weeks
and months
How? Interviews with a checklist of questions
Who? ILIA team
Checklist of
quesitons
Checklist:
List of commodities that poor people normally buy
Normal prices for this time of year, or just before a disaster per unit of sale
Normal availability just before the disaster (freely available? In short supply?)
Current prices
Current availability (freely available? In short supply?)
Likely price trend
Likely availability trend
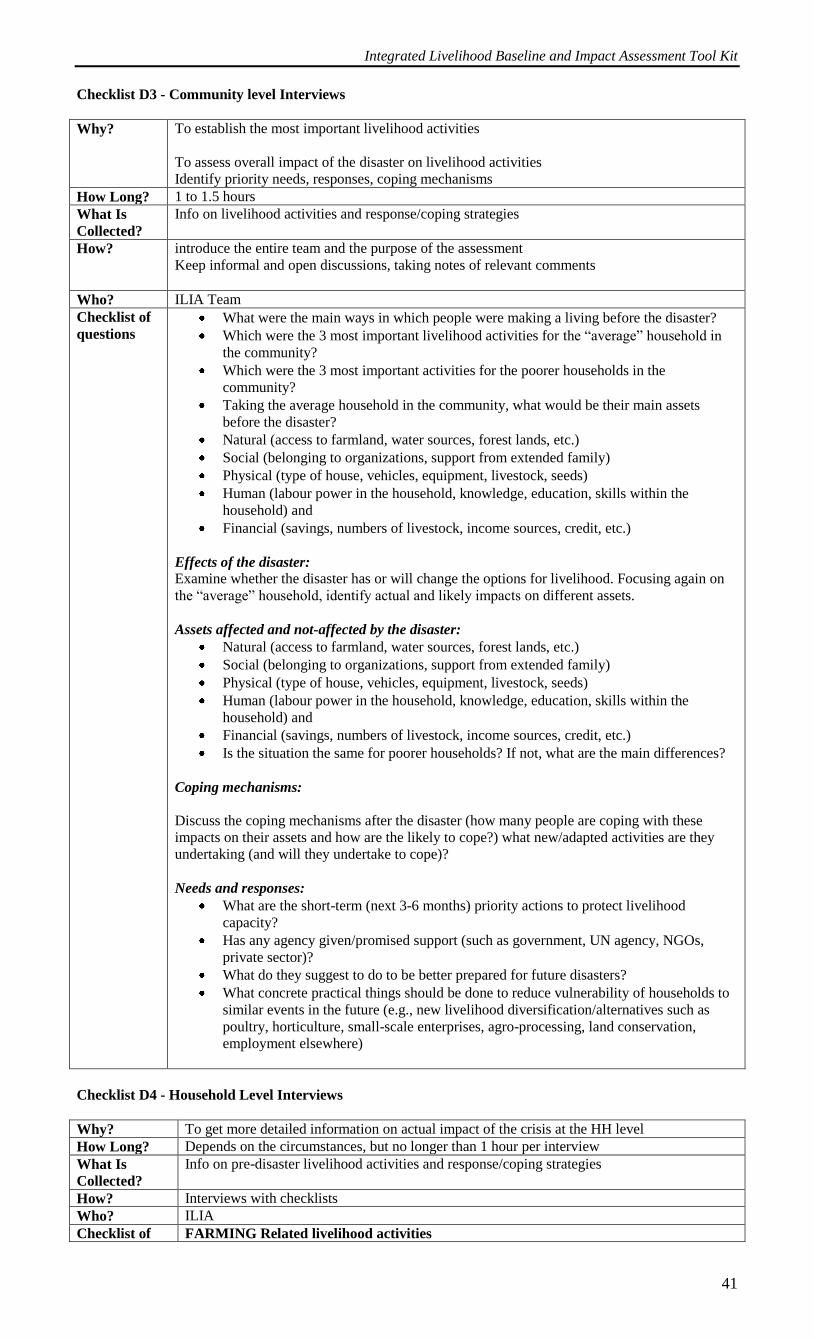
Integrated Livelihood Baseline and Impact Assessment Tool Kit
41
Checklist D3 - Community level Interviews
Why? To establish the most important livelihood activities
To assess overall impact of the disaster on livelihood activities
Identify priority needs, responses, coping mechanisms
How Long? 1 to 1.5 hours
What Is
Collected?
Info on livelihood activities and response/coping strategies
How? introduce the entire team and the purpose of the assessment
Keep informal and open discussions, taking notes of relevant comments
Who? ILIA Team
Checklist of
questions What were the main ways in which people were making a living before the disaster?
Which were the 3 most important livelihood activities for the “average” household in
the community?
Which were the 3 most important activities for the poorer households in the
community?
Taking the average household in the community, what would be their main assets
before the disaster?
Natural (access to farmland, water sources, forest lands, etc.)
Social (belonging to organizations, support from extended family)
Physical (type of house, vehicles, equipment, livestock, seeds)
Human (labour power in the household, knowledge, education, skills within the
household) and
Financial (savings, numbers of livestock, income sources, credit, etc.)
Effects of the disaster:
Examine whether the disaster has or will change the options for livelihood. Focusing again on
the “average” household, identify actual and likely impacts on different assets.
Assets affected and not-affected by the disaster:
Natural (access to farmland, water sources, forest lands, etc.)
Social (belonging to organizations, support from extended family)
Physical (type of house, vehicles, equipment, livestock, seeds)
Human (labour power in the household, knowledge, education, skills within the
household) and
Financial (savings, numbers of livestock, income sources, credit, etc.)
Is the situation the same for poorer households? If not, what are the main differences?
Coping mechanisms:
Discuss the coping mechanisms after the disaster (how many people are coping with these
impacts on their assets and how are the likely to cope?) what new/adapted activities are they
undertaking (and will they undertake to cope)?
Needs and responses:
What are the short-term (next 3-6 months) priority actions to protect livelihood
capacity?
Has any agency given/promised support (such as government, UN agency, NGOs,
private sector)?
What do they suggest to do to be better prepared for future disasters?
What concrete practical things should be done to reduce vulnerability of households to
similar events in the future (e.g., new livelihood diversification/alternatives such as
poultry, horticulture, small-scale enterprises, agro-processing, land conservation,
employment elsewhere)
Checklist D4 - Household Level Interviews
Why? To get more detailed information on actual impact of the crisis at the HH level
How Long? Depends on the circumstances, but no longer than 1 hour per interview
What Is
Collected?
Info on pre-disaster livelihood activities and response/coping strategies
How? Interviews with checklists
Who? ILIA
Checklist of FARMING Related livelihood activities
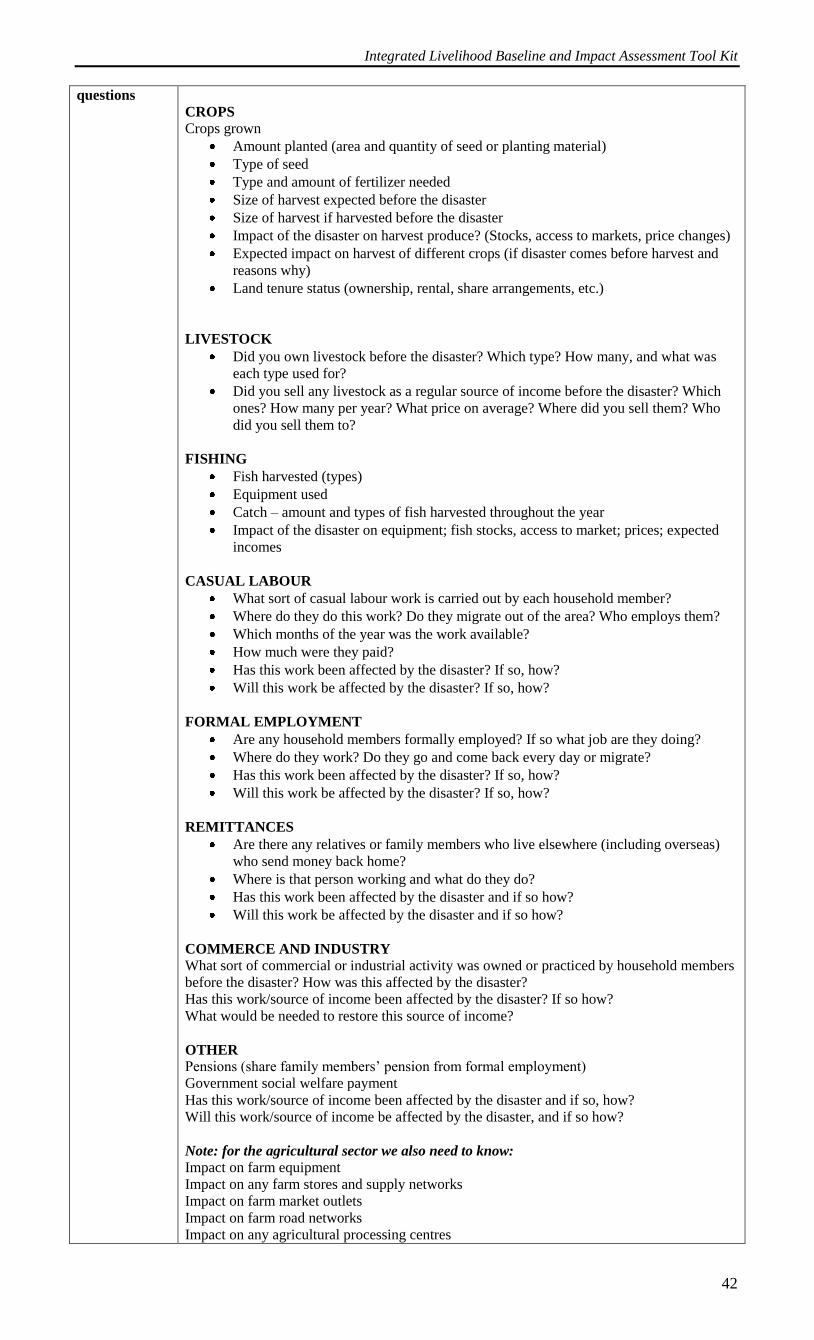
Integrated Livelihood Baseline and Impact Assessment Tool Kit
42
questions
CROPS
Crops grown
Amount planted (area and quantity of seed or planting material)
Type of seed
Type and amount of fertilizer needed
Size of harvest expected before the disaster
Size of harvest if harvested before the disaster
Impact of the disaster on harvest produce? (Stocks, access to markets, price changes)
Expected impact on harvest of different crops (if disaster comes before harvest and
reasons why)
Land tenure status (ownership, rental, share arrangements, etc.)
LIVESTOCK
Did you own livestock before the disaster? Which type? How many, and what was
each type used for?
Did you sell any livestock as a regular source of income before the disaster? Which
ones? How many per year? What price on average? Where did you sell them? Who
did you sell them to?
FISHING
Fish harvested (types)
Equipment used
Catch – amount and types of fish harvested throughout the year
Impact of the disaster on equipment; fish stocks, access to market; prices; expected
incomes
CASUAL LABOUR
What sort of casual labour work is carried out by each household member?
Where do they do this work? Do they migrate out of the area? Who employs them?
Which months of the year was the work available?
How much were they paid?
Has this work been affected by the disaster? If so, how?
Will this work be affected by the disaster? If so, how?
FORMAL EMPLOYMENT
Are any household members formally employed? If so what job are they doing?
Where do they work? Do they go and come back every day or migrate?
Has this work been affected by the disaster? If so, how?
Will this work be affected by the disaster? If so, how?
REMITTANCES
Are there any relatives or family members who live elsewhere (including overseas)
who send money back home?
Where is that person working and what do they do?
Has this work been affected by the disaster and if so how?
Will this work be affected by the disaster and if so how?
COMMERCE AND INDUSTRY
What sort of commercial or industrial activity was owned or practiced by household members
before the disaster? How was this affected by the disaster?
Has this work/source of income been affected by the disaster? If so how?
What would be needed to restore this source of income?
OTHER
Pensions (share family members’ pension from formal employment)
Government social welfare payment
Has this work/source of income been affected by the disaster and if so, how?
Will this work/source of income be affected by the disaster, and if so how?
Note: for the agricultural sector we also need to know:
Impact on farm equipment
Impact on any farm stores and supply networks
Impact on farm market outlets
Impact on farm road networks
Impact on any agricultural processing centres
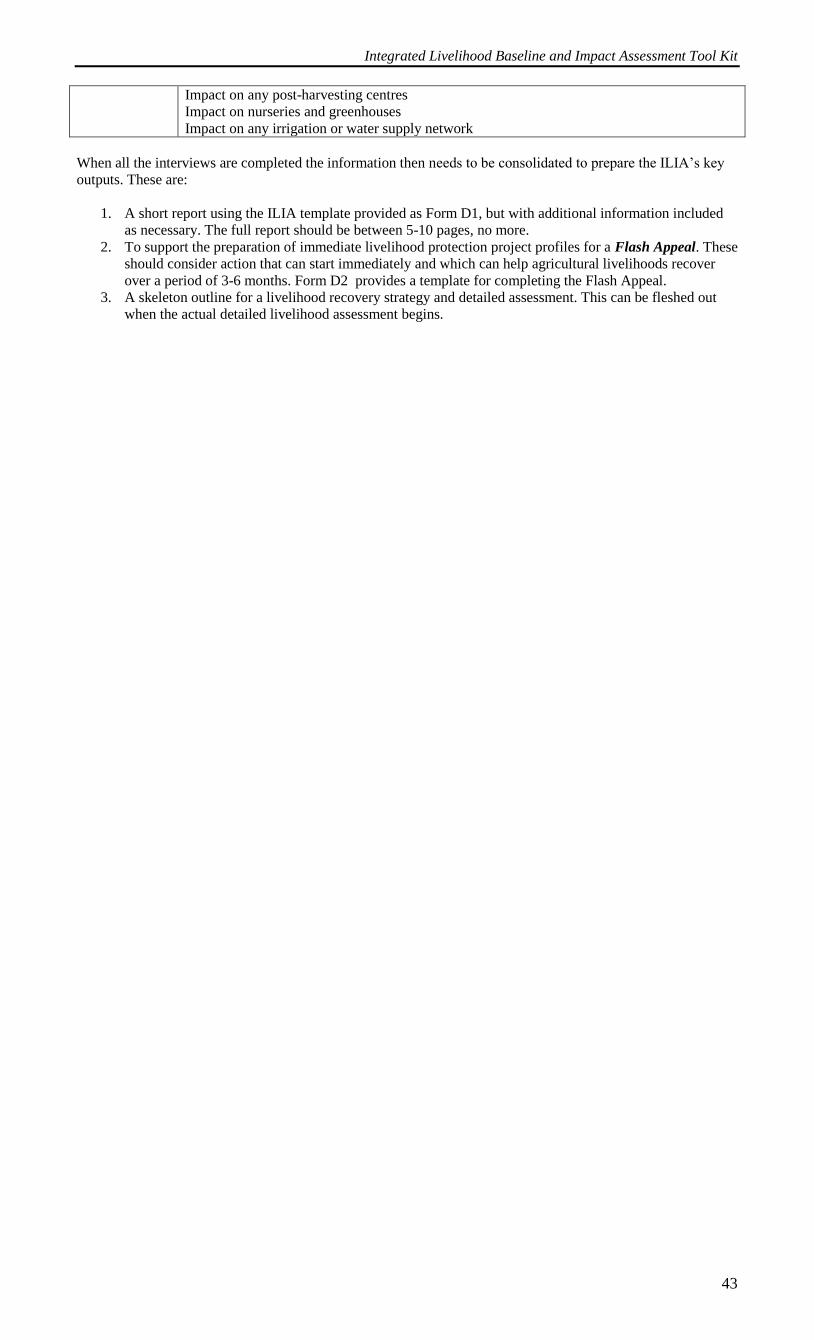
Integrated Livelihood Baseline and Impact Assessment Tool Kit
43
Impact on any post-harvesting centres
Impact on nurseries and greenhouses
Impact on any irrigation or water supply network
When all the interviews are completed the information then needs to be consolidated to prepare the ILIA’s key
outputs. These are:
1. A short report using the ILIA template provided as Form D1, but with additional information included
as necessary. The full report should be between 5-10 pages, no more.
2. To support the preparation of immediate livelihood protection project profiles for a Flash Appeal. These
should consider action that can start immediately and which can help agricultural livelihoods recover
over a period of 3-6 months. Form D2 provides a template for completing the Flash Appeal.
3. A skeleton outline for a livelihood recovery strategy and detailed assessment. This can be fleshed out
when the actual detailed livelihood assessment begins.
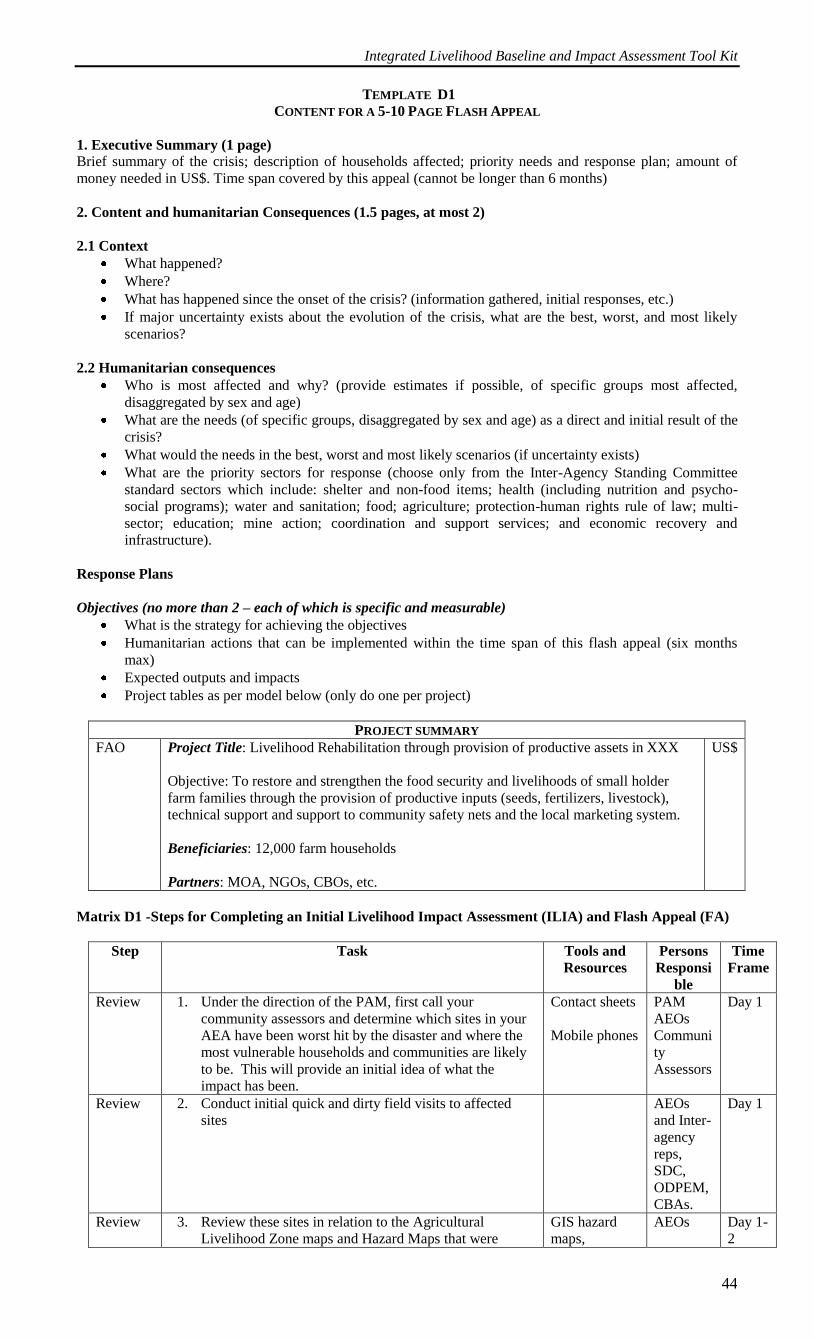
Integrated Livelihood Baseline and Impact Assessment Tool Kit
44
TEMPLATE D1
CONTENT FOR A 5-10 PAGE FLASH APPEAL
1. Executive Summary (1 page)
Brief summary of the crisis; description of households affected; priority needs and response plan; amount of
money needed in US$. Time span covered by this appeal (cannot be longer than 6 months)
2. Content and humanitarian Consequences (1.5 pages, at most 2)
2.1 Context
What happened?
Where?
What has happened since the onset of the crisis? (information gathered, initial responses, etc.)
If major uncertainty exists about the evolution of the crisis, what are the best, worst, and most likely
scenarios?
2.2 Humanitarian consequences
Who is most affected and why? (provide estimates if possible, of specific groups most affected,
disaggregated by sex and age)
What are the needs (of specific groups, disaggregated by sex and age) as a direct and initial result of the
crisis?
What would the needs in the best, worst and most likely scenarios (if uncertainty exists)
What are the priority sectors for response (choose only from the Inter-Agency Standing Committee
standard sectors which include: shelter and non-food items; health (including nutrition and psycho-
social programs); water and sanitation; food; agriculture; protection-human rights rule of law; multi-
sector; education; mine action; coordination and support services; and economic recovery and
infrastructure).
Response Plans
Objectives (no more than 2 – each of which is specific and measurable)
What is the strategy for achieving the objectives
Humanitarian actions that can be implemented within the time span of this flash appeal (six months
max)
Expected outputs and impacts
Project tables as per model below (only do one per project)
PROJECT SUMMARY
FAO Project Title: Livelihood Rehabilitation through provision of productive assets in XXX
Objective: To restore and strengthen the food security and livelihoods of small holder
farm families through the provision of productive inputs (seeds, fertilizers, livestock),
technical support and support to community safety nets and the local marketing system.
Beneficiaries: 12,000 farm households
Partners: MOA, NGOs, CBOs, etc.
US$
Matrix D1 -Steps for Completing an Initial Livelihood Impact Assessment (ILIA) and Flash Appeal (FA)
Step Task Tools and
Resources
Persons
Responsi
ble
Time
Frame
Review 1. Under the direction of the PAM, first call your
community assessors and determine which sites in your
AEA have been worst hit by the disaster and where the
most vulnerable households and communities are likely
to be. This will provide an initial idea of what the
impact has been.
Contact sheets
Mobile phones
PAM
AEOs
Communi
ty
Assessors
Day 1
Review 2. Conduct initial quick and dirty field visits to affected
sites
AEOs
and Inter-
agency
reps,
SDC,
ODPEM,
CBAs.
Day 1
Review 3. Review these sites in relation to the Agricultural
Livelihood Zone maps and Hazard Maps that were
GIS hazard
maps,
AEOs Day 1-
2
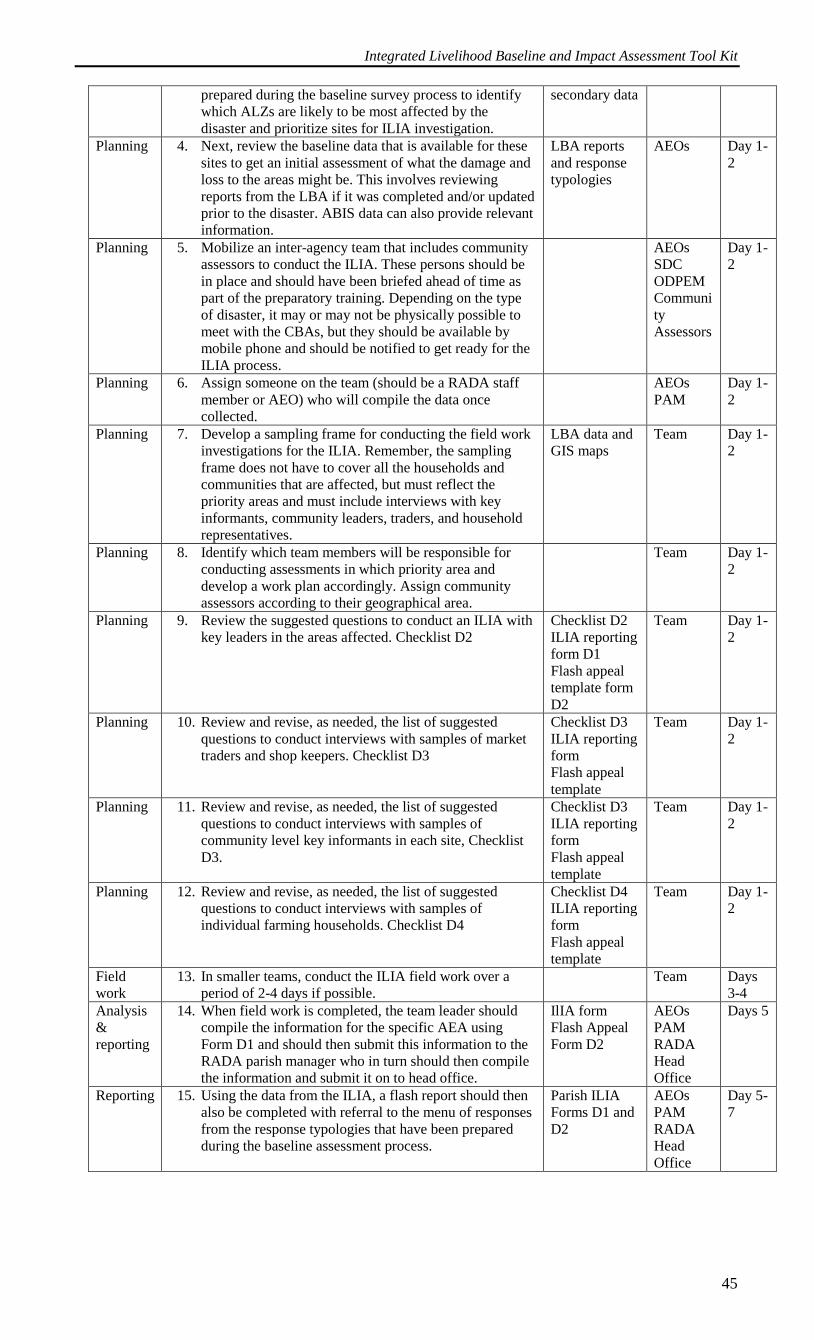
Integrated Livelihood Baseline and Impact Assessment Tool Kit
45
prepared during the baseline survey process to identify
which ALZs are likely to be most affected by the
disaster and prioritize sites for ILIA investigation.
secondary data
Planning 4. Next, review the baseline data that is available for these
sites to get an initial assessment of what the damage and
loss to the areas might be. This involves reviewing
reports from the LBA if it was completed and/or updated
prior to the disaster. ABIS data can also provide relevant
information.
LBA reports
and response
typologies
AEOs Day 1-
2
Planning 5. Mobilize an inter-agency team that includes community
assessors to conduct the ILIA. These persons should be
in place and should have been briefed ahead of time as
part of the preparatory training. Depending on the type
of disaster, it may or may not be physically possible to
meet with the CBAs, but they should be available by
mobile phone and should be notified to get ready for the
ILIA process.
AEOs
SDC
ODPEM
Communi
ty
Assessors
Day 1-
2
Planning 6. Assign someone on the team (should be a RADA staff
member or AEO) who will compile the data once
collected.
AEOs
PAM
Day 1-
2
Planning 7. Develop a sampling frame for conducting the field work
investigations for the ILIA. Remember, the sampling
frame does not have to cover all the households and
communities that are affected, but must reflect the
priority areas and must include interviews with key
informants, community leaders, traders, and household
representatives.
LBA data and
GIS maps
Team Day 1-
2
Planning 8. Identify which team members will be responsible for
conducting assessments in which priority area and
develop a work plan accordingly. Assign community
assessors according to their geographical area.
Team Day 1-
2
Planning 9. Review the suggested questions to conduct an ILIA with
key leaders in the areas affected. Checklist D2
Checklist D2
ILIA reporting
form D1
Flash appeal
template form
D2
Team Day 1-
2
Planning 10. Review and revise, as needed, the list of suggested
questions to conduct interviews with samples of market
traders and shop keepers. Checklist D3
Checklist D3
ILIA reporting
form
Flash appeal
template
Team Day 1-
2
Planning 11. Review and revise, as needed, the list of suggested
questions to conduct interviews with samples of
community level key informants in each site, Checklist
D3.
Checklist D3
ILIA reporting
form
Flash appeal
template
Team Day 1-
2
Planning 12. Review and revise, as needed, the list of suggested
questions to conduct interviews with samples of
individual farming households. Checklist D4
Checklist D4
ILIA reporting
form
Flash appeal
template
Team Day 1-
2
Field
work
13. In smaller teams, conduct the ILIA field work over a
period of 2-4 days if possible.
Team Days
3-4
Analysis
&
reporting
14. When field work is completed, the team leader should
compile the information for the specific AEA using
Form D1 and should then submit this information to the
RADA parish manager who in turn should then compile
the information and submit it on to head office.
IlIA form
Flash Appeal
Form D2
AEOs
PAM
RADA
Head
Office
Days 5
Reporting 15. Using the data from the ILIA, a flash report should then
also be completed with referral to the menu of responses
from the response typologies that have been prepared
during the baseline assessment process.
Parish ILIA
Forms D1 and
D2
AEOs
PAM
RADA
Head
Office
Day 5-
7
Integrated Livelihood Baseline and Impact Assessment Tool Kit
46
Module 5: Conducting the Detailed Livelihood Impact
Assessment (DLIA)
Detailed Livelihood Impact Assessment Process
Once the ILIA and flash reports have been completed and submitted, the assessment team then needs to begin
planning for a detailed livelihood assessment (DLA) of the affected areas that will generate proposals for longer
term response and recovery, as well as for improving resiliency.
Goals of the DLA
1. To gain a holistic picture of the extent of damage done to people’s livelihoods
2. To gain a picture of the capacities and opportunities for recovery and increased resilience at the
household, community and local area levels, in both rural and/or urban context as appropriate
Data collected during the DLA should be compared with that collected during the Baseline assessment.
Objectives of the DLA
1. To provide a thorough assessment of the impact of the disaster on livelihoods and to identify
opportunities and capacities for recovery at the household, community and local economic levels.
2. Needs to be completed within 30-90 days or 3 months.
One of the most important aims of the DLA is that it provides information of sufficient quantity and quality to
allow credible livelihood-related project proposals to be written.
Key Questions for the DLA:
1. How were people (male and females) making a living before the disaster?
2. What effect has the disaster had on their livelihoods?
3. What coping mechanisms and livelihood strategies have different people/households developed and how
effective/damaging are these?
4. What are the opportunities and capacities for livelihood recovery within the local economy?
5. What types of activities are needed for livelihood recovery of the different
people/households/communities?
How do the DLA and the LBA work together?
Ideally the DLA should be used in conjunction with the pre-prepared livelihood baseline. The DLA provides
important contextualization and quantification of the actual impact of the disaster. But if the baseline was not
completed, then the DLA must provide this information so that proper planning and identification of corrective
measures can be developed into detailed proposals.
The DLA should be done in conjunction with other assessment activities being completed by ODPEM and other
agencies (Post Disaster Needs Assessments – PDNA).
Who does the DLA?
The DLA should be completed by a team of people experienced in Participatory Rural Appraisal assessment
techniques.
The DLA has five sections, including:
1. Introduction and overview of the DLA process
2. Initial information collection, planning and training (Phase 1 of the DLA)
3. Conducting the DLA field work (Phase 2 of the DLA)
4. Analysis and presenting of information (Phase 3 of the DLA)
5. Key participatory tools
Overview of DLA process
There are always time and resource pressures when trying to complete a DLA, so compromises are inevitable.
Trade-offs will be necessary between the quality of the process and the need to get results quickly and to meet
deadlines imposed by the needs of the affected populations, governments and the international community.
The time frame for completing the DLA will depend on:
Integrated Livelihood Baseline and Impact Assessment Tool Kit
47
whether or not a baseline assessment was done previously
the existence of trained experts and experienced personnel to conduct the assessment can be mobilized
to do the DLA;
the results and quality of the data generated for the initial livelihood impact appraisal
the availability of funds and human resources to actually conducted the DLA
Time Frame: 5 weeks normally
Output – 30 or so page report for key decision-makers and a ‘road map’ for livelihood recovery including
relevant project profiles
Phase 1 – Start Up and Planning: Initial information collection and detailed planning (an intensive period of
information gathering using formal and informal sources of secondary data to get an initial picture. Involves a
lot of meetings to sort out logistics, and planning the field work and training. Usually involves identifying the
sample area, assembling the team and organizing logistics.
Phase 2 – Field work: To be based around semi-structured interview techniques and involving collation and
analysis of information in the field so that a picture of the situation can gradually be built up.
Phase 3 – Write up presentation and dissemination: the final stage consists of the final analysis and write up of
the actual assessment, presentation to government and dissemination; preparation of a road map (or logical
framework) and related project proposals.
Selecting sites and Sampling
The area targeted for the DLA obviously depends on which areas have been hardest hit. The ILIA will have
already identified these areas, but now the goal of the DLA is to get much more detailed information and to
generate a holistic picture of what has happened and the impact of damage done to people’s livelihoods, as well
as to gain a detailed understanding of the opportunities for recovery and increased resilience.
In order to do so, sampling and site selection are critical so that the survey results in high quality information
that truly reflects that impact and damage and loss that have occurred. A robust sampling process must involve
quantitative selection techniques and random sampling if the results are to be quantitative.
Once again, the sampling process first includes a review of exiting zonal maps (agricultural livelihood maps,
hazard maps, etc.). If the livelihood zones have already been mapped and compared with hazard areas, then this
is a good place to start determining areas for the DLA.
Once a zone or site has been identified, the next step is to choose sample sites within each zone. This involves
two steps:
Stage 1: defining an overall sampling frame
The sampling frame is the list of the overall number of sites from which the sample is drawn. In rural areas,
these will consist of rural communities or districts in the EDs. In the Jamaican context, it is critical to work with
the SDC to identify clear communities and areas, especially as ODPEM is also using the EDs for its own GIS
mapping systems. Ideally, determination of the EDs to be included in each AEA should have already been done
by the NADRM Unit prior the commencement of the LBA.
Stage 2: Once this list is drawn up, then sample sites will need to be selected. Depending on the zone and the
degree of exposure to the event, a decision about the number of households to be selected within it will need to
be made. This will depend totally on the geographical magnitude and severity of problem, accessibility, human
resources and time available.
After these factors have been taken into account and an overall sample size decided upon, it is next important to
select sites at random within each zone (adjusting for severity of exposure to decide on size of sample within
each zone) and then to use the knowledge of local people to ensure that obvious biases are avoided. For instance,
within a particular ED, 10 sites may have been affected, but it likely not be possible to conduct field visits
within all 10 sites. A decision therefore needs to be made to conduct a random sample of every second site, or
every third site, and so on, depending on resources and the scale of the disaster so that the findings will reflect a
true picture of the impact.
Levels of DLA inquiry
Just as was the case for both the LBA and ILIA, the DLA also involves different layers of investigation which
also have be considered in the sampling process. DLA data collection is targeted at five distinct levels as shown
in Table E1.
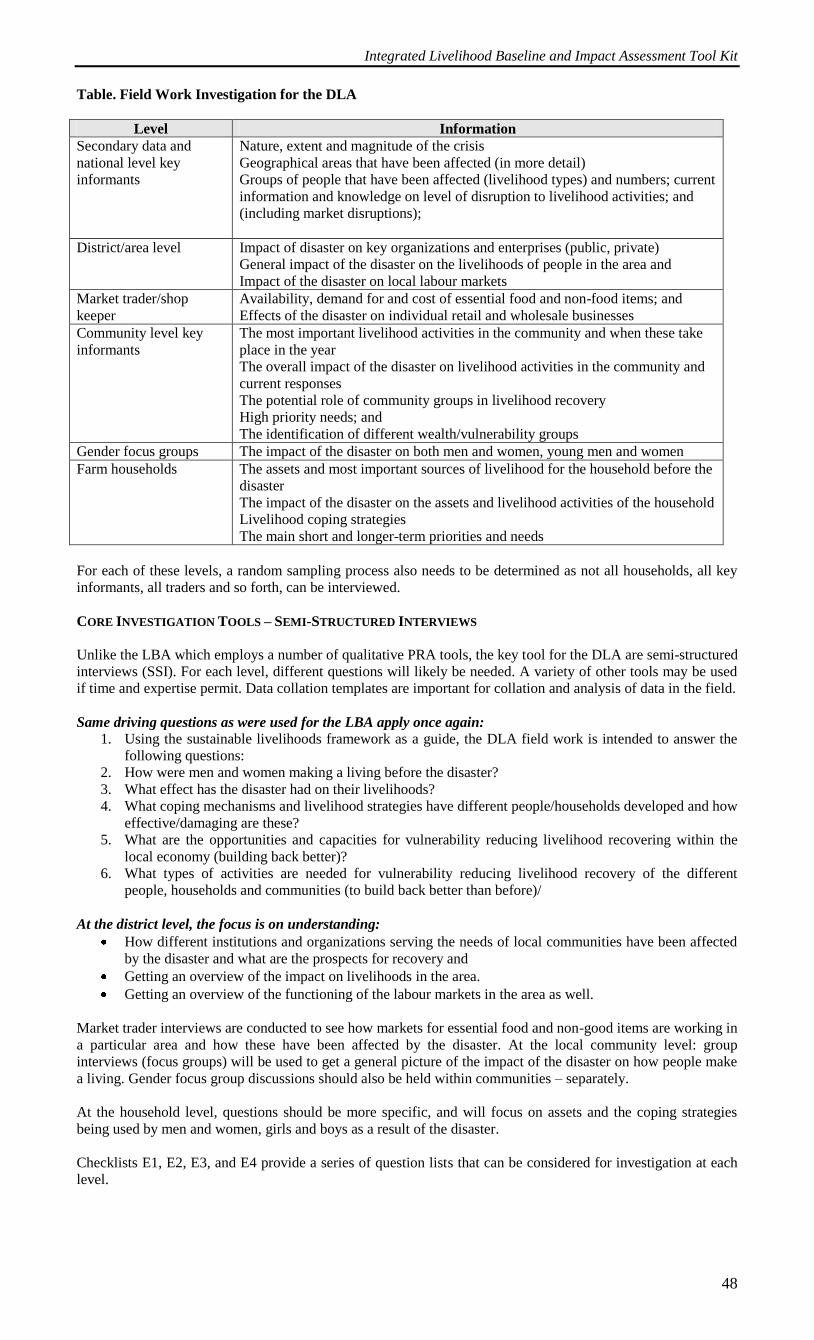
Integrated Livelihood Baseline and Impact Assessment Tool Kit
48
Table. Field Work Investigation for the DLA
Level Information
Secondary data and
national level key
informants
Nature, extent and magnitude of the crisis
Geographical areas that have been affected (in more detail)
Groups of people that have been affected (livelihood types) and numbers; current
information and knowledge on level of disruption to livelihood activities; and
(including market disruptions);
District/area level Impact of disaster on key organizations and enterprises (public, private)
General impact of the disaster on the livelihoods of people in the area and
Impact of the disaster on local labour markets
Market trader/shop
keeper
Availability, demand for and cost of essential food and non-food items; and
Effects of the disaster on individual retail and wholesale businesses
Community level key
informants
The most important livelihood activities in the community and when these take
place in the year
The overall impact of the disaster on livelihood activities in the community and
current responses
The potential role of community groups in livelihood recovery
High priority needs; and
The identification of different wealth/vulnerability groups
Gender focus groups The impact of the disaster on both men and women, young men and women
Farm households The assets and most important sources of livelihood for the household before the
disaster
The impact of the disaster on the assets and livelihood activities of the household
Livelihood coping strategies
The main short and longer-term priorities and needs
For each of these levels, a random sampling process also needs to be determined as not all households, all key
informants, all traders and so forth, can be interviewed.
CORE INVESTIGATION TOOLS – SEMI-STRUCTURED INTERVIEWS
Unlike the LBA which employs a number of qualitative PRA tools, the key tool for the DLA are semi-structured
interviews (SSI). For each level, different questions will likely be needed. A variety of other tools may be used
if time and expertise permit. Data collation templates are important for collation and analysis of data in the field.
Same driving questions as were used for the LBA apply once again:
1. Using the sustainable livelihoods framework as a guide, the DLA field work is intended to answer the
following questions:
2. How were men and women making a living before the disaster?
3. What effect has the disaster had on their livelihoods?
4. What coping mechanisms and livelihood strategies have different people/households developed and how
effective/damaging are these?
5. What are the opportunities and capacities for vulnerability reducing livelihood recovering within the
local economy (building back better)?
6. What types of activities are needed for vulnerability reducing livelihood recovery of the different
people, households and communities (to build back better than before)/
At the district level, the focus is on understanding:
How different institutions and organizations serving the needs of local communities have been affected
by the disaster and what are the prospects for recovery and
Getting an overview of the impact on livelihoods in the area.
Getting an overview of the functioning of the labour markets in the area as well.
Market trader interviews are conducted to see how markets for essential food and non-good items are working in
a particular area and how these have been affected by the disaster. At the local community level: group
interviews (focus groups) will be used to get a general picture of the impact of the disaster on how people make
a living. Gender focus group discussions should also be held within communities – separately.
At the household level, questions should be more specific, and will focus on assets and the coping strategies
being used by men and women, girls and boys as a result of the disaster.
Checklists E1, E2, E3, and E4 provide a series of question lists that can be considered for investigation at each
level.
Integrated Livelihood Baseline and Impact Assessment Tool Kit
49
Very important: for the farm household level of inquiry, in addition to semi-structured interviews, it is also
important to use Forms E1 and E2to get detailed damage and loss assessment information that compares with
the existing baseline data that exists.
Developing a DLA Field Work Plan
Once the sites, sampling sites and checklists have been determined, it is then critical to develop a DLA work
plan, just as was done for the LBA. Team members need to be assigned specific roles and responsibilities and
organized accordingly so that the field work can commence in an orderly way that makes maximum use of
existing time and resources. The DLA team should be divided so that different individuals or pairs focus on
different levels or types of questioning with pairs coming together to compare notes and analyze.
Matrix E1 provides a template for preparing a DLA work plan for each agricultural extension area.
Working in teams for the Field Work Process
With the work plan established, field work should be undertaken over the period of approximately 4 weeks. As
was the case with the LBA data collection process, the involvement of CBAs should be especially encouraged as
much as possible in each affected site as the CBAs will be able to collect far more information in the field than
will the AEOs or other inter-agency representatives. However, their work should be supervised by the AEOs
responsible for the area under investigation and the data cross checked and examined daily. It should be
compiled and collated daily by RADA personnel. Table X provides both an example and a template for how this
information can be collated.
DATA ANALYSIS
Once all the data has been collected, it is time to analyse results. Doing so with DLA data involves essentially
two steps: (1) Analysis of key trends that emerge from the data and (2) weighting of findings and results or
“quantifying of the qualified findings.” While this can be a team exercise, it is recommended that this step be the
primary responsibility of RADA officers.
KEY TRENDS
Every disaster affects different people in different ways and will also affect their livelihoods differently. But in
most instances, the livelihoods of different groups of people will be linked and it is quite likely that the domino
affect, or specific trends can be deduced based on the field results. It is important that analysis of the DLA
findings discern these trends and make conclusions about what the future impact may be on livelihoods as a
result of the damage that has occurred. There is a need to look for trends and interactions, puzzle pieces, or
“threads” by asking such questions as:
This has happened here, so the likely impact on this XXX will be YYYY.
In reviewing the data and analyzing results, it is important to aggregate data and summarizes the trends that have
been found in order to tell the story of what has happened. Trends can be found along different lines:
1. for specific types of households
2. for specific types of agricultural producers
3. for specific geographical areas
4. for specific populations
5. for specific types of assets
Trend analysis is critical for making sound recommendations for response and recovery measures.
QUANTIFYING “QUALITATIVE” FINDINGS
Weighting matters
Trend analysis alone however, is not sufficient. The DLA cannot be purely qualitative. The process of recovery
requires numbers – both absolute and proportional or ratios. The time pressure to complete a DLA calls for rapid
methods and this has consequences in terms of the precision by which findings are reported and representative
samples can be drawn. It is therefore often necessary to resort to “ad hoc” measures that cannot stand up to
random sampling analysis. However, even if in an approximate manner, these have to be expressed in
quantitative terms.
So how can this be done?
The various pieces of information collected will actually refer to realities of different size. For example, if one
community has 80 percent poor, 15 percent medium wealthy households, and 5 percent better off households,
Integrated Livelihood Baseline and Impact Assessment Tool Kit
50
the sample of 3, 2 and 1 households interviewed in that community should be weighted accordingly to avoid
giving too much weight to the wealthy HHs and too little to the poor.
In such a sample, of six (6) households – the poor are represented by 3 cases (50 percent) when in reality they
are 80 percent and the better off have 1/6 or 16.6 percent when in fact they are only 5 percent of the community.
The same is valid for communities and zones – if each of 2 zones have been represented by three communities,
but one of the zones is much larger, the 3 communities from that zone should receive more weight in any
assessment.
Even if the sample for the DLA is not strictly random, ignoring the weighting issue (i.e., giving every unit the
same weight) compounds the problem and amplifies any bias in the study. It is therefore recommended that
totals for each major zone and the total disaster area are obtained with due regard for weighting.
Using the Livelihood Assessment Data for Weighting and Extrapolating of Results
Once again, this is where having a good baseline ahead of time can help to give adequate weight to the rapid
assessments conducted during the DLA. On the one had, it gives us the basis for giving each finding a correct
“relative” weight – because we can correct for under or over representation in the sample. On the other hand, it
provides the basis for extrapolation to the scale of the whole area or population thus allowing for estimates of
the total size of the affected population or the total number of jobs lost or livelihoods destroyed.
OUTPUTS AND USES OF THE DLA
The immediate output of the DLA is an accessible and solid report of about 30 pages (excluding annexes of
data) that can be used to develop longer term proposals for recovery.
The key uses are:
1. To support the preparation of livelihood recovery project profiles
2. To provide the basis for the development of a livelihood recovery strategy for the affected area
3. To provide the basis for advocacy material directed at decision-makers and the general public so that the
longer term livelihood impacts of the crisis are properly understood.
Target Audiences for the DLA:
National government – MOA
ODPEM
Parishes – Local Government Plans
Community Development Plans and Committees
UN and Donor Community
NGOs
Elected Representatives
Etc.
Form E3 serves as a template for the type of content that the DLA needs to include as part of the
final DLA report.
In the rest of this section, the individual DLA investigations are now provided.
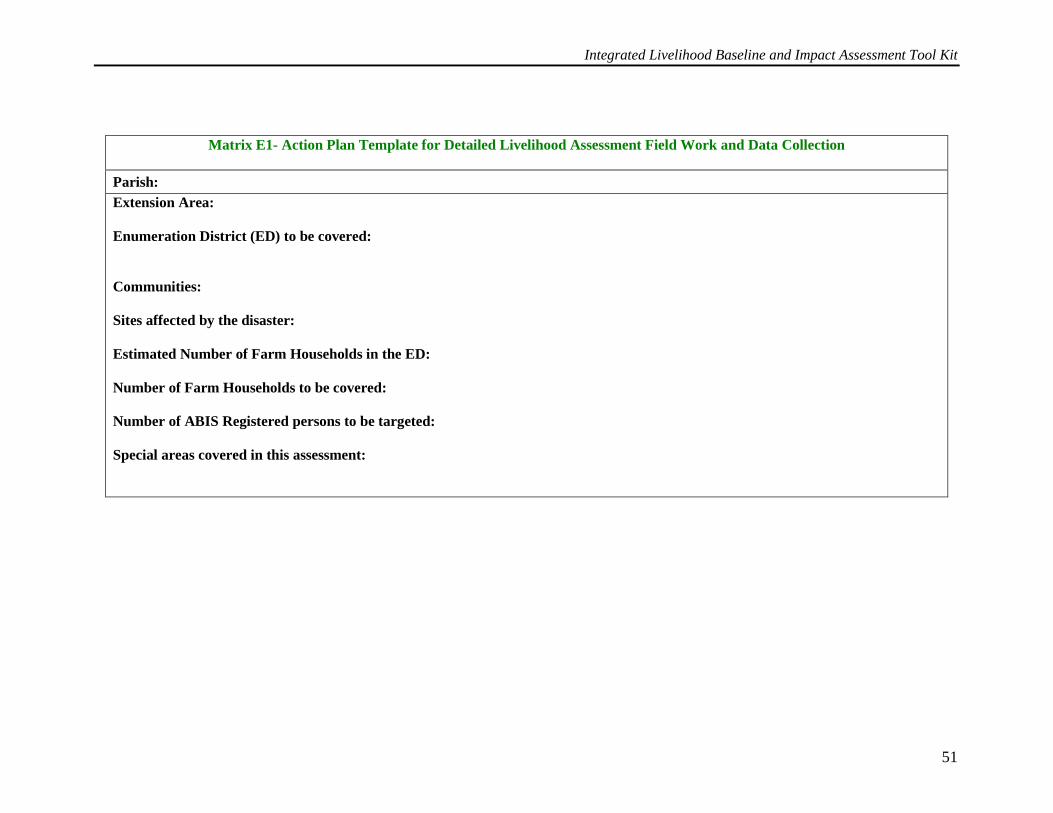
Integrated Livelihood Baseline and Impact Assessment Tool Kit
51
Matrix E1- Action Plan Template for Detailed Livelihood Assessment Field Work and Data Collection
Parish:
Extension Area:
Enumeration District (ED) to be covered:
Communities:
Sites affected by the disaster:
Estimated Number of Farm Households in the ED:
Number of Farm Households to be covered:
Number of ABIS Registered persons to be targeted:
Special areas covered in this assessment:
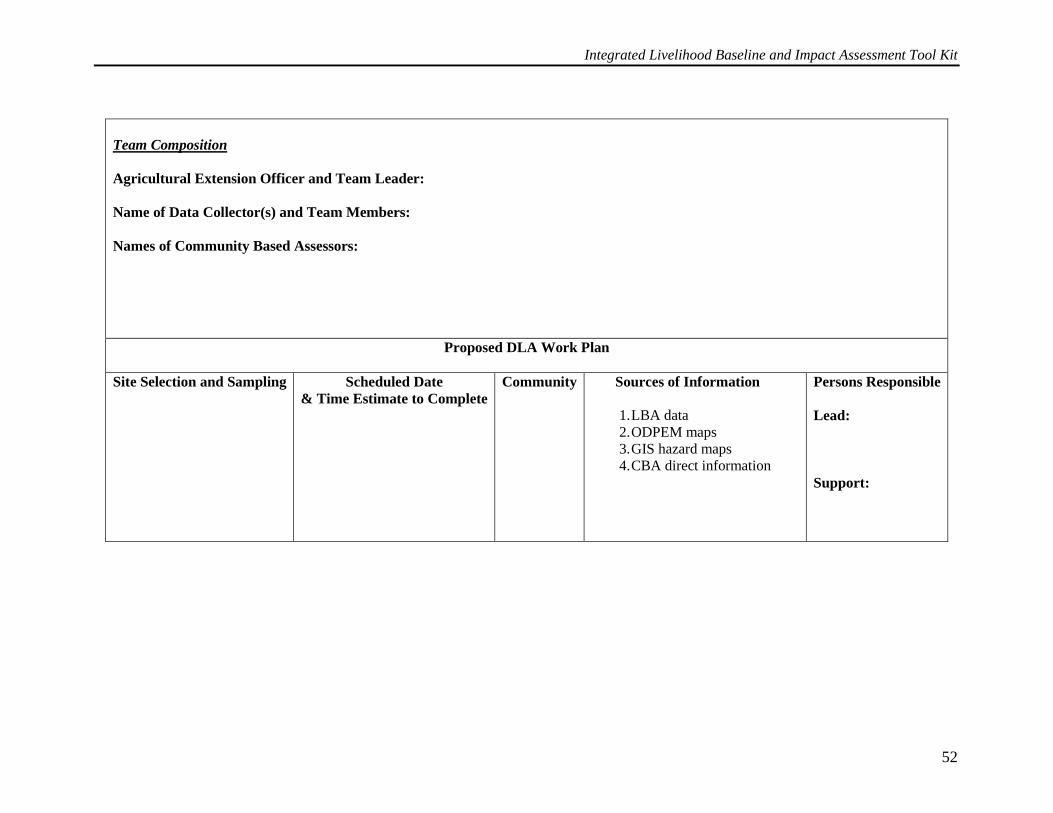
Integrated Livelihood Baseline and Impact Assessment Tool Kit
52
Team Composition
Agricultural Extension Officer and Team Leader:
Name of Data Collector(s) and Team Members:
Names of Community Based Assessors:
Proposed DLA Work Plan
Site Selection and Sampling Scheduled Date
& Time Estimate to Complete
Community Sources of Information
1. LBA data
2. ODPEM maps
3. GIS hazard maps
4. CBA direct information
Persons Responsible
Lead:
Support:
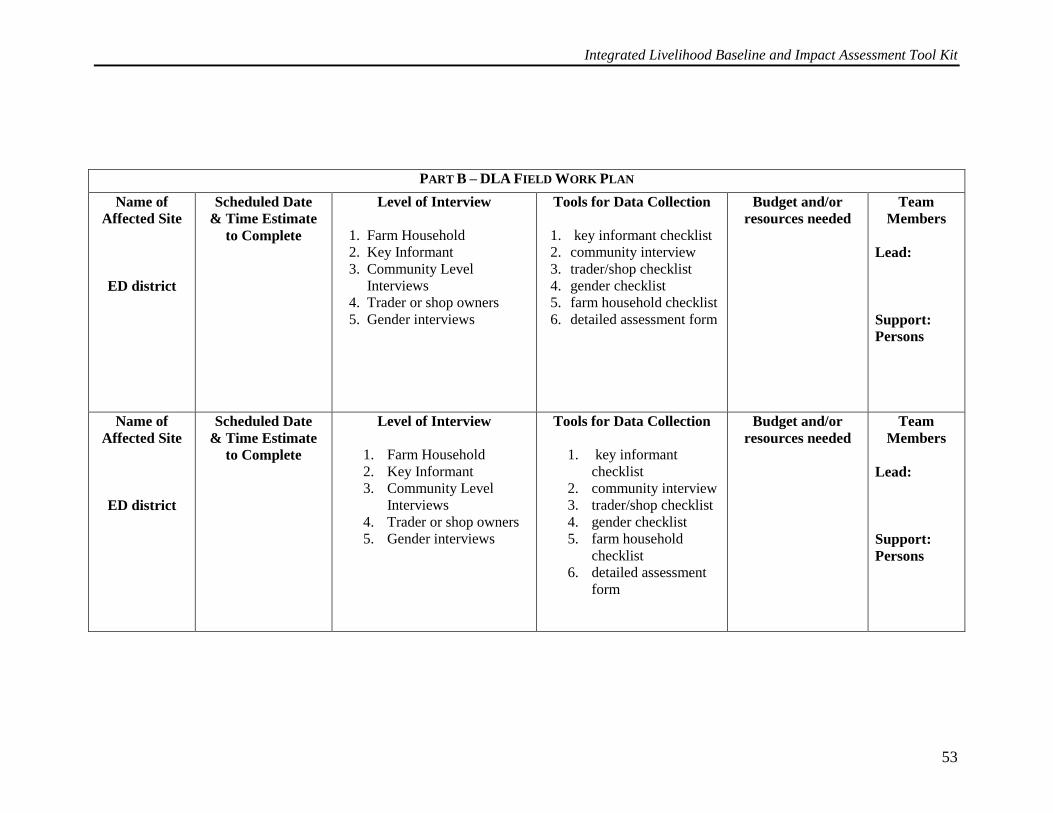
Integrated Livelihood Baseline and Impact Assessment Tool Kit
53
PART B – DLA FIELD WORK PLAN
Name of
Affected Site
ED district
Scheduled Date
& Time Estimate
to Complete
Level of Interview
1. Farm Household
2. Key Informant
3. Community Level
Interviews
4. Trader or shop owners
5. Gender interviews
Tools for Data Collection
1. key informant checklist
2. community interview
3. trader/shop checklist
4. gender checklist
5. farm household checklist
6. detailed assessment form
Budget and/or
resources needed
Team
Members
Lead:
Support:
Persons
Name of
Affected Site
ED district
Scheduled Date
& Time Estimate
to Complete
Level of Interview
1. Farm Household
2. Key Informant
3. Community Level
Interviews
4. Trader or shop owners
5. Gender interviews
Tools for Data Collection
1. key informant
checklist
2. community interview
3. trader/shop checklist
4. gender checklist
5. farm household
checklist
6. detailed assessment
form
Budget and/or
resources needed
Team
Members
Lead:
Support:
Persons
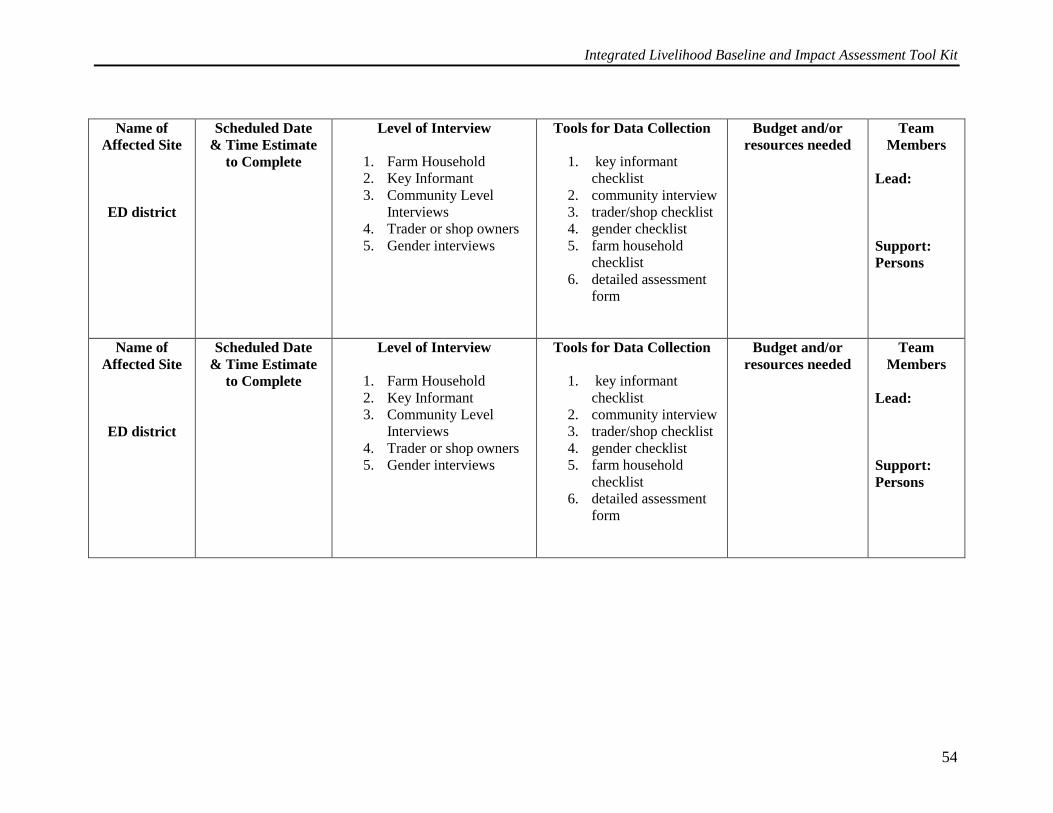
Integrated Livelihood Baseline and Impact Assessment Tool Kit
54
Name of
Affected Site
ED district
Scheduled Date
& Time Estimate
to Complete
Level of Interview
1. Farm Household
2. Key Informant
3. Community Level
Interviews
4. Trader or shop owners
5. Gender interviews
Tools for Data Collection
1. key informant
checklist
2. community interview
3. trader/shop checklist
4. gender checklist
5. farm household
checklist
6. detailed assessment
form
Budget and/or
resources needed
Team
Members
Lead:
Support:
Persons
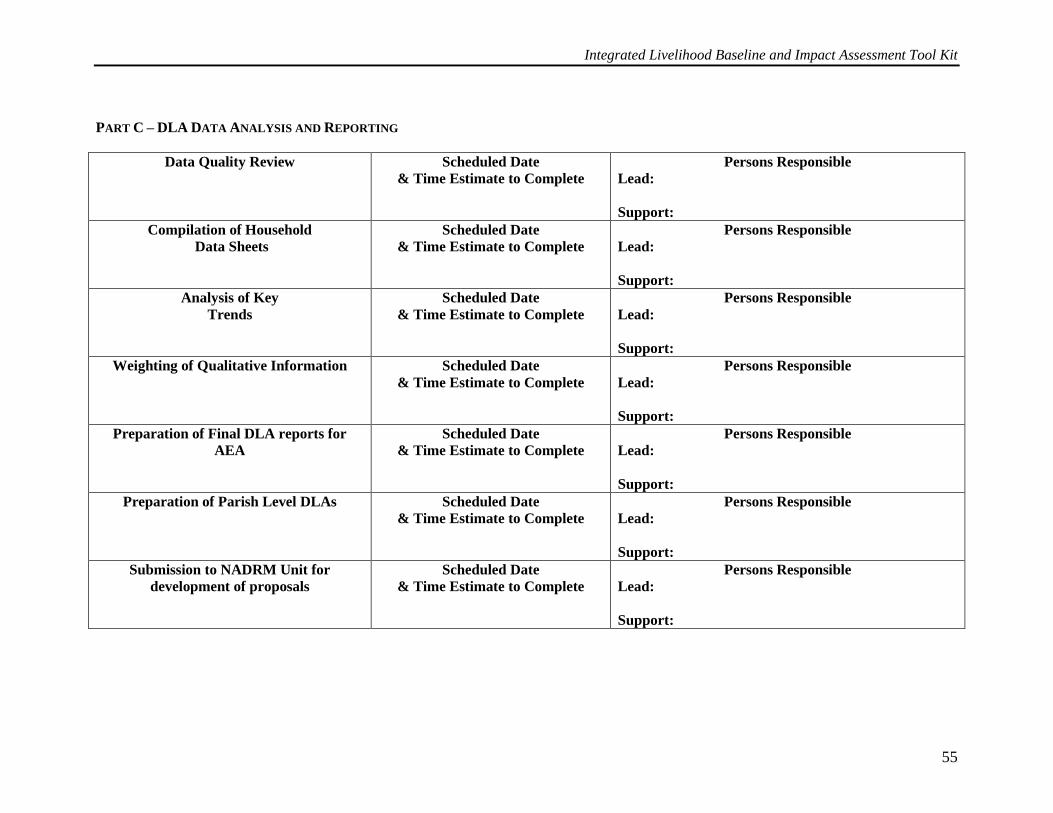
Integrated Livelihood Baseline and Impact Assessment Tool Kit
55
PART C – DLA DATA ANALYSIS AND REPORTING
Data Quality Review Scheduled Date
& Time Estimate to Complete
Persons Responsible
Lead:
Support:
Compilation of Household
Data Sheets
Scheduled Date
& Time Estimate to Complete
Persons Responsible
Lead:
Support:
Analysis of Key
Trends
Scheduled Date
& Time Estimate to Complete
Persons Responsible
Lead:
Support:
Weighting of Qualitative Information
Scheduled Date
& Time Estimate to Complete
Persons Responsible
Lead:
Support:
Preparation of Final DLA reports for
AEA
Scheduled Date
& Time Estimate to Complete
Persons Responsible
Lead:
Support:
Preparation of Parish Level DLAs Scheduled Date
& Time Estimate to Complete
Persons Responsible
Lead:
Support:
Submission to NADRM Unit for
development of proposals
Scheduled Date
& Time Estimate to Complete
Persons Responsible
Lead:
Support:
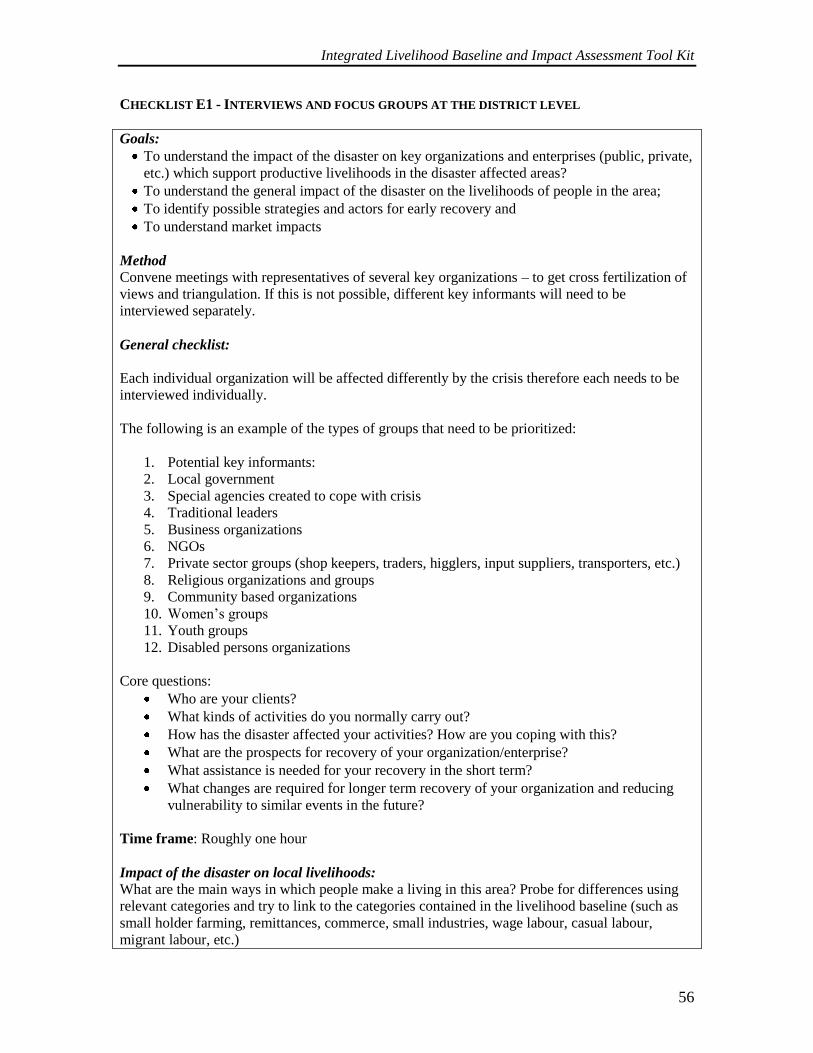
Integrated Livelihood Baseline and Impact Assessment Tool Kit
56
CHECKLIST E1 - INTERVIEWS AND FOCUS GROUPS AT THE DISTRICT LEVEL
Goals:
To understand the impact of the disaster on key organizations and enterprises (public, private,
etc.) which support productive livelihoods in the disaster affected areas?
To understand the general impact of the disaster on the livelihoods of people in the area;
To identify possible strategies and actors for early recovery and
To understand market impacts
Method
Convene meetings with representatives of several key organizations – to get cross fertilization of
views and triangulation. If this is not possible, different key informants will need to be
interviewed separately.
General checklist:
Each individual organization will be affected differently by the crisis therefore each needs to be
interviewed individually.
The following is an example of the types of groups that need to be prioritized:
1. Potential key informants:
2. Local government
3. Special agencies created to cope with crisis
4. Traditional leaders
5. Business organizations
6. NGOs
7. Private sector groups (shop keepers, traders, higglers, input suppliers, transporters, etc.)
8. Religious organizations and groups
9. Community based organizations
10. Women’s groups
11. Youth groups
12. Disabled persons organizations
Core questions:
Who are your clients?
What kinds of activities do you normally carry out?
How has the disaster affected your activities? How are you coping with this?
What are the prospects for recovery of your organization/enterprise?
What assistance is needed for your recovery in the short term?
What changes are required for longer term recovery of your organization and reducing
vulnerability to similar events in the future?
Time frame: Roughly one hour
Impact of the disaster on local livelihoods:
What are the main ways in which people make a living in this area? Probe for differences using
relevant categories and try to link to the categories contained in the livelihood baseline (such as
small holder farming, remittances, commerce, small industries, wage labour, casual labour,
migrant labour, etc.)
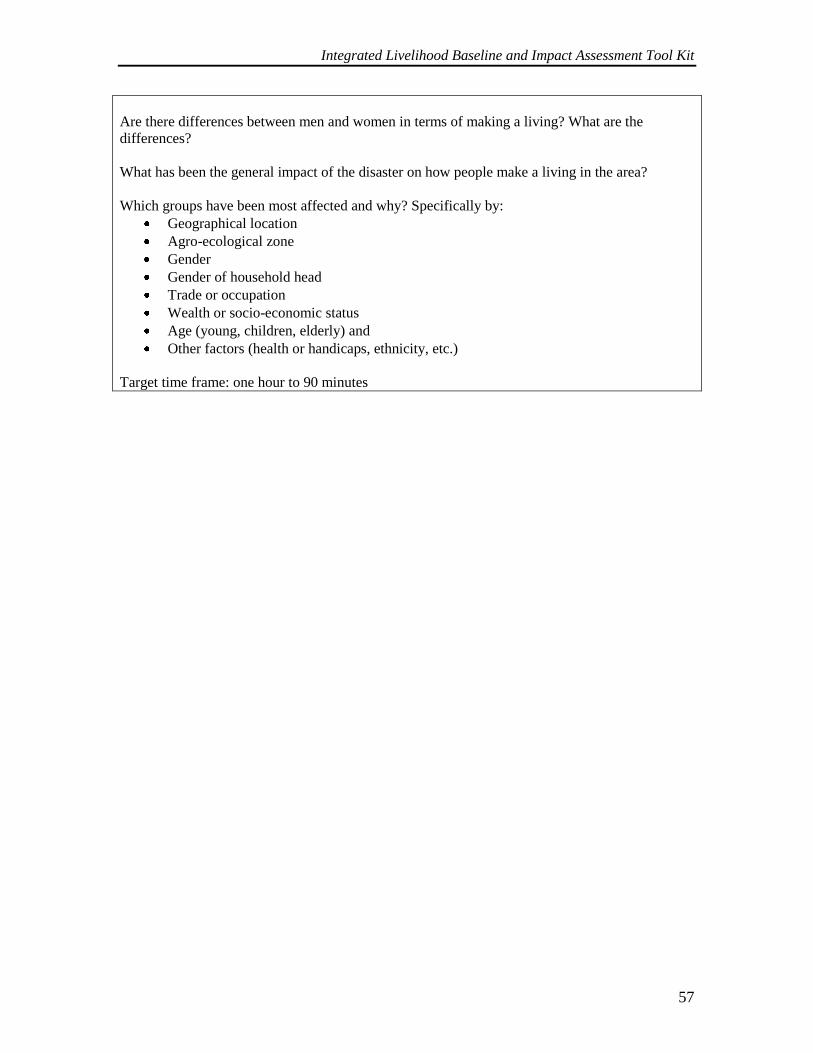
Integrated Livelihood Baseline and Impact Assessment Tool Kit
57
Are there differences between men and women in terms of making a living? What are the
differences?
What has been the general impact of the disaster on how people make a living in the area?
Which groups have been most affected and why? Specifically by:
Geographical location
Agro-ecological zone
Gender
Gender of household head
Trade or occupation
Wealth or socio-economic status
Age (young, children, elderly) and
Other factors (health or handicaps, ethnicity, etc.)
Target time frame: one hour to 90 minutes
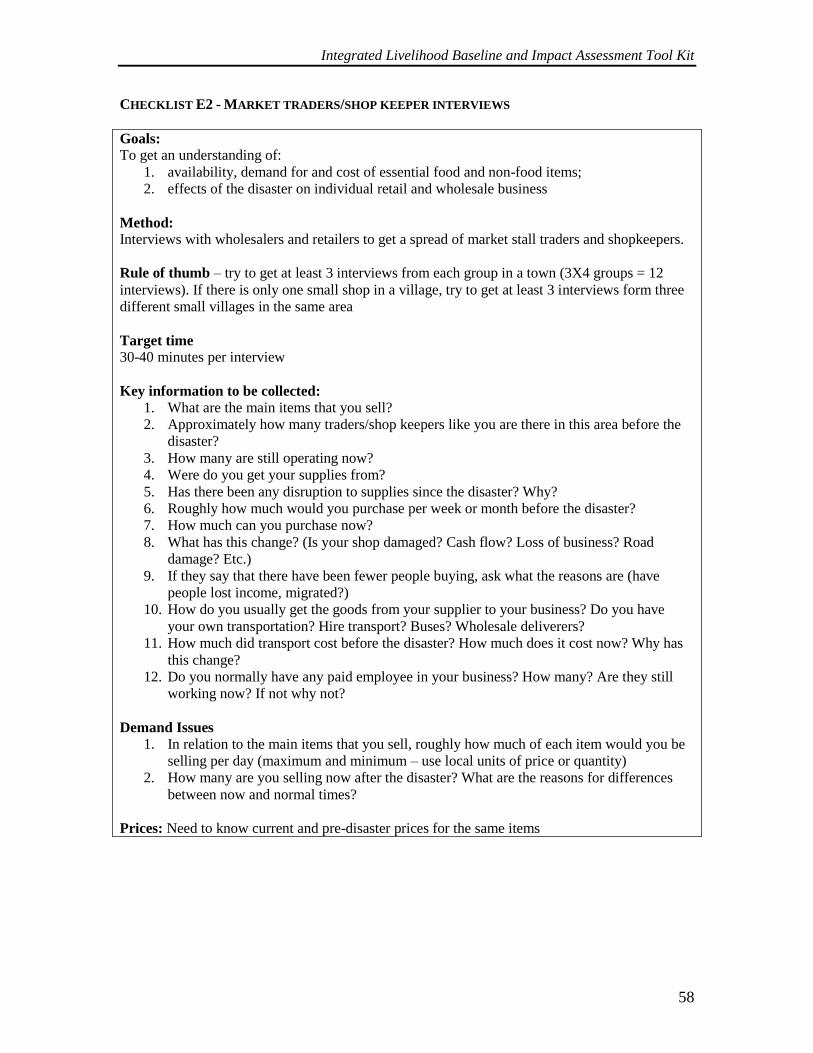
Integrated Livelihood Baseline and Impact Assessment Tool Kit
58
CHECKLIST E2 - MARKET TRADERS/SHOP KEEPER INTERVIEWS
Goals:
To get an understanding of:
1. availability, demand for and cost of essential food and non-food items;
2. effects of the disaster on individual retail and wholesale business
Method:
Interviews with wholesalers and retailers to get a spread of market stall traders and shopkeepers.
Rule of thumb – try to get at least 3 interviews from each group in a town (3X4 groups = 12
interviews). If there is only one small shop in a village, try to get at least 3 interviews form three
different small villages in the same area
Target time
30-40 minutes per interview
Key information to be collected:
1. What are the main items that you sell?
2. Approximately how many traders/shop keepers like you are there in this area before the
disaster?
3. How many are still operating now?
4. Were do you get your supplies from?
5. Has there been any disruption to supplies since the disaster? Why?
6. Roughly how much would you purchase per week or month before the disaster?
7. How much can you purchase now?
8. What has this change? (Is your shop damaged? Cash flow? Loss of business? Road
damage? Etc.)
9. If they say that there have been fewer people buying, ask what the reasons are (have
people lost income, migrated?)
10. How do you usually get the goods from your supplier to your business? Do you have
your own transportation? Hire transport? Buses? Wholesale deliverers?
11. How much did transport cost before the disaster? How much does it cost now? Why has
this change?
12. Do you normally have any paid employee in your business? How many? Are they still
working now? If not why not?
Demand Issues
1. In relation to the main items that you sell, roughly how much of each item would you be
selling per day (maximum and minimum – use local units of price or quantity)
2. How many are you selling now after the disaster? What are the reasons for differences
between now and normal times?
Prices: Need to know current and pre-disaster prices for the same items
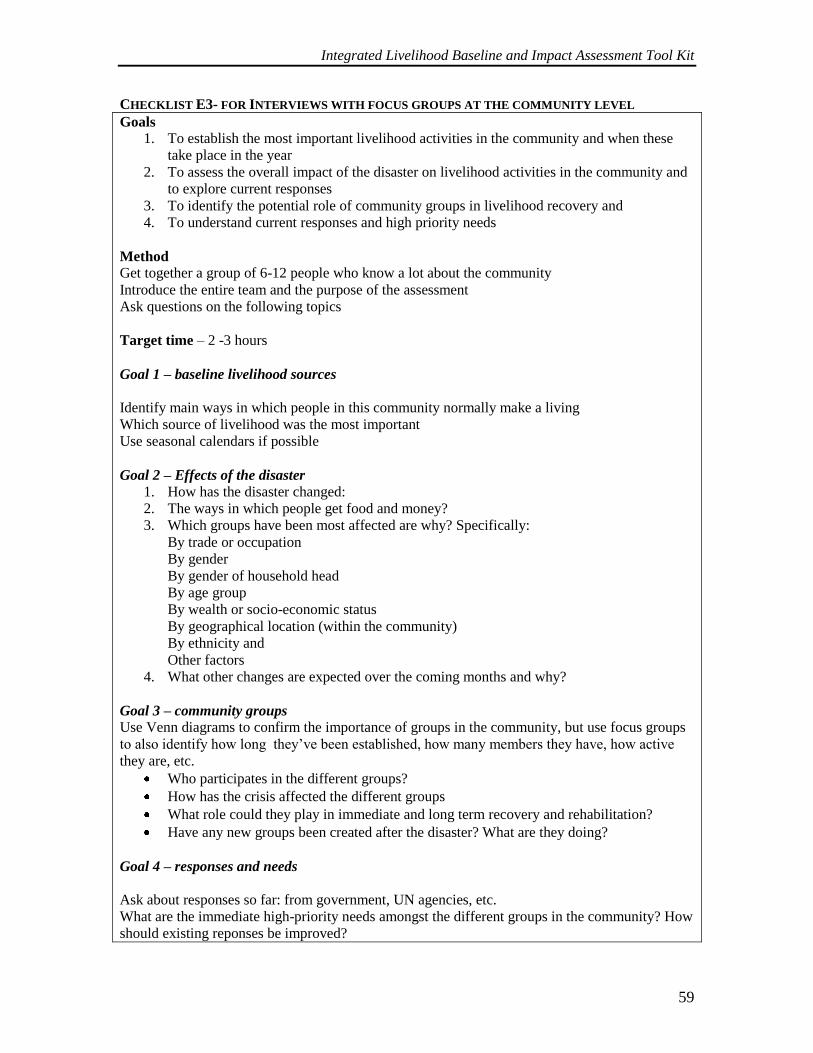
Integrated Livelihood Baseline and Impact Assessment Tool Kit
59
CHECKLIST E3- FOR INTERVIEWS WITH FOCUS GROUPS AT THE COMMUNITY LEVEL
Goals
1. To establish the most important livelihood activities in the community and when these
take place in the year
2. To assess the overall impact of the disaster on livelihood activities in the community and
to explore current responses
3. To identify the potential role of community groups in livelihood recovery and
4. To understand current responses and high priority needs
Method
Get together a group of 6-12 people who know a lot about the community
Introduce the entire team and the purpose of the assessment
Ask questions on the following topics
Target time – 2 -3 hours
Goal 1 – baseline livelihood sources
Identify main ways in which people in this community normally make a living
Which source of livelihood was the most important
Use seasonal calendars if possible
Goal 2 – Effects of the disaster
1. How has the disaster changed:
2. The ways in which people get food and money?
3. Which groups have been most affected are why? Specifically:
By trade or occupation
By gender
By gender of household head
By age group
By wealth or socio-economic status
By geographical location (within the community)
By ethnicity and
Other factors
4. What other changes are expected over the coming months and why?
Goal 3 – community groups
Use Venn diagrams to confirm the importance of groups in the community, but use focus groups
to also identify how long they’ve been established, how many members they have, how active
they are, etc.
Who participates in the different groups?
How has the crisis affected the different groups
What role could they play in immediate and long term recovery and rehabilitation?
Have any new groups been created after the disaster? What are they doing?
Goal 4 – responses and needs
Ask about responses so far: from government, UN agencies, etc.
What are the immediate high-priority needs amongst the different groups in the community? How
should existing reponses be improved?
Integrated Livelihood Baseline and Impact Assessment Tool Kit
60
What concrete and practical things should be prioritized for longer-term recovery of affected
populations and reducing vulnerability to similar events in the future.?
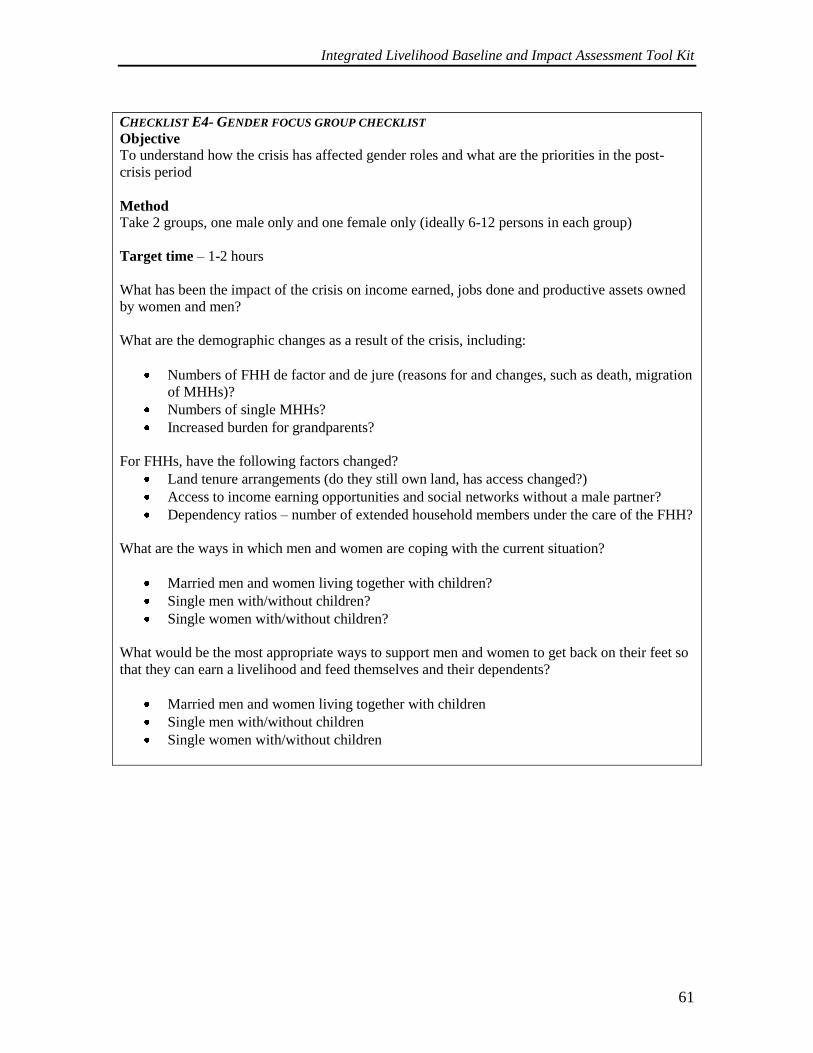
Integrated Livelihood Baseline and Impact Assessment Tool Kit
61
CHECKLIST E4- GENDER FOCUS GROUP CHECKLIST
Objective
To understand how the crisis has affected gender roles and what are the priorities in the post-
crisis period
Method
Take 2 groups, one male only and one female only (ideally 6-12 persons in each group)
Target time – 1-2 hours
What has been the impact of the crisis on income earned, jobs done and productive assets owned
by women and men?
What are the demographic changes as a result of the crisis, including:
Numbers of FHH de factor and de jure (reasons for and changes, such as death, migration
of MHHs)?
Numbers of single MHHs?
Increased burden for grandparents?
For FHHs, have the following factors changed?
Land tenure arrangements (do they still own land, has access changed?)
Access to income earning opportunities and social networks without a male partner?
Dependency ratios – number of extended household members under the care of the FHH?
What are the ways in which men and women are coping with the current situation?
Married men and women living together with children?
Single men with/without children?
Single women with/without children?
What would be the most appropriate ways to support men and women to get back on their feet so
that they can earn a livelihood and feed themselves and their dependents?
Married men and women living together with children
Single men with/without children
Single women with/without children
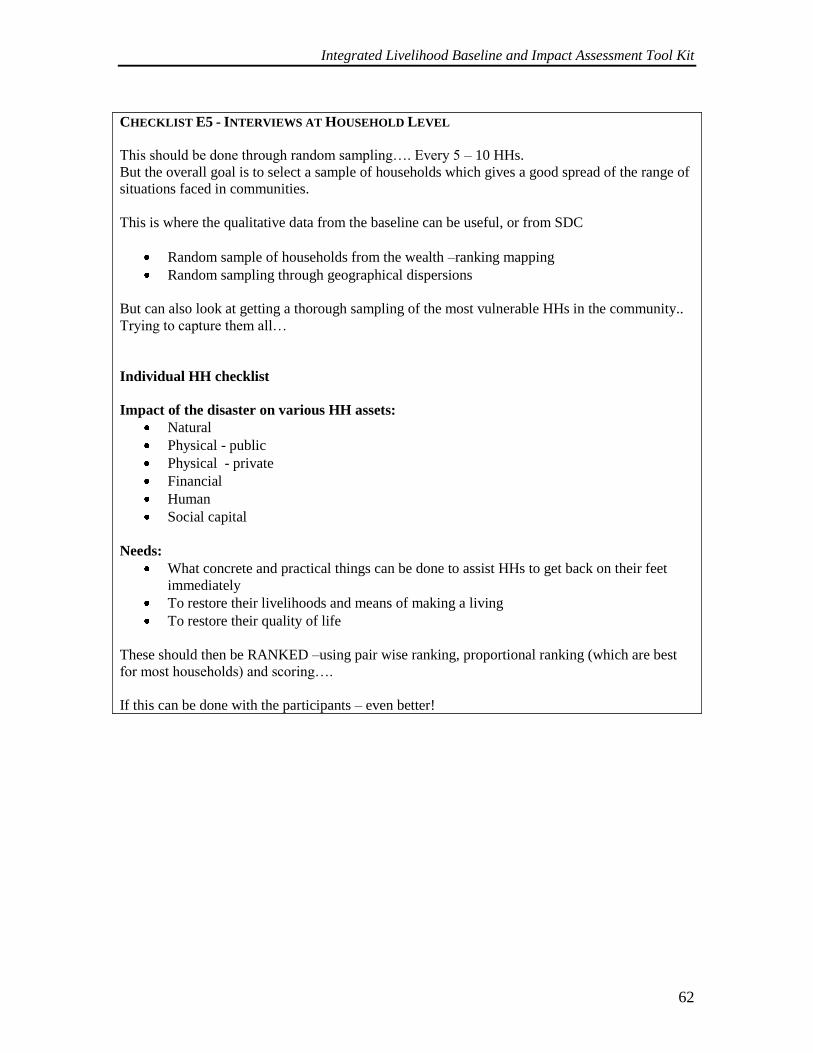
Integrated Livelihood Baseline and Impact Assessment Tool Kit
62
CHECKLIST E5 - INTERVIEWS AT HOUSEHOLD LEVEL
This should be done through random sampling…. Every 5 – 10 HHs.
But the overall goal is to select a sample of households which gives a good spread of the range of
situations faced in communities.
This is where the qualitative data from the baseline can be useful, or from SDC
Random sample of households from the wealth –ranking mapping
Random sampling through geographical dispersions
But can also look at getting a thorough sampling of the most vulnerable HHs in the community..
Trying to capture them all…
Individual HH checklist
Impact of the disaster on various HH assets:
Natural
Physical - public
Physical - private
Financial
Human
Social capital
Needs:
What concrete and practical things can be done to assist HHs to get back on their feet
immediately
To restore their livelihoods and means of making a living
To restore their quality of life
These should then be RANKED –using pair wise ranking, proportional ranking (which are best
for most households) and scoring….
If this can be done with the participants – even better!
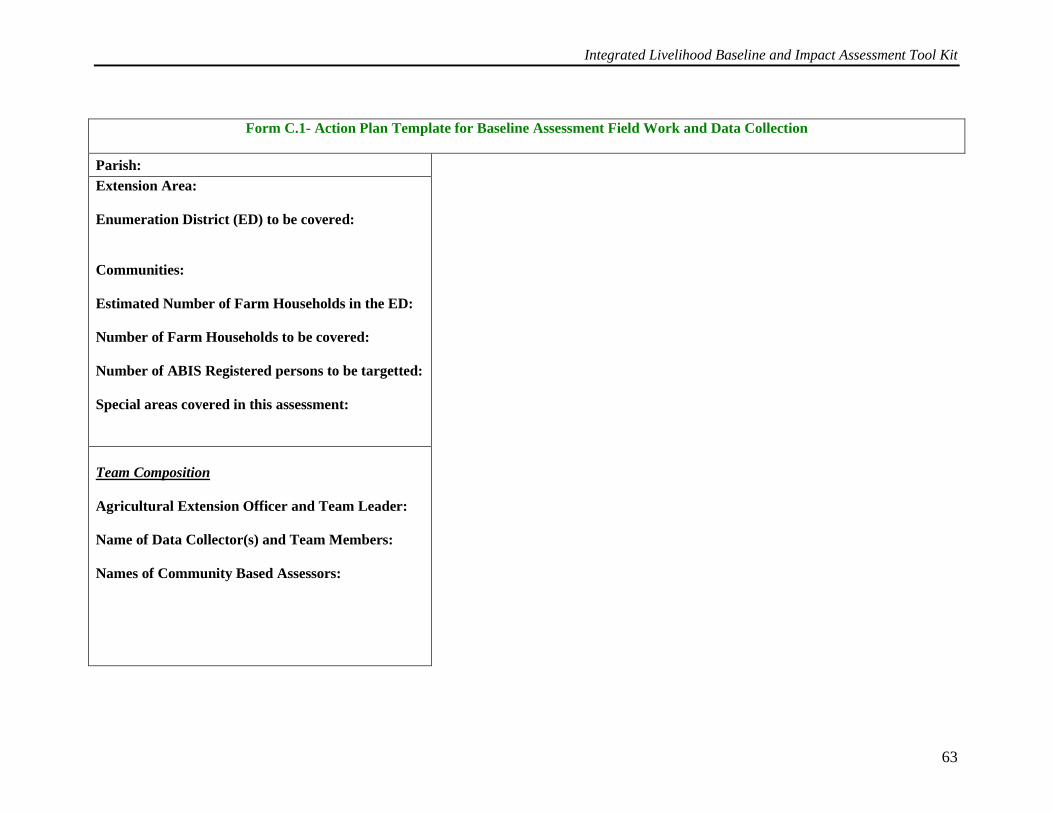
Integrated Livelihood Baseline and Impact Assessment Tool Kit
63
Form C.1- Action Plan Template for Baseline Assessment Field Work and Data Collection
Parish:
Extension Area:
Enumeration District (ED) to be covered:
Communities:
Estimated Number of Farm Households in the ED:
Number of Farm Households to be covered:
Number of ABIS Registered persons to be targetted:
Special areas covered in this assessment:
Team Composition
Agricultural Extension Officer and Team Leader:
Name of Data Collector(s) and Team Members:
Names of Community Based Assessors:
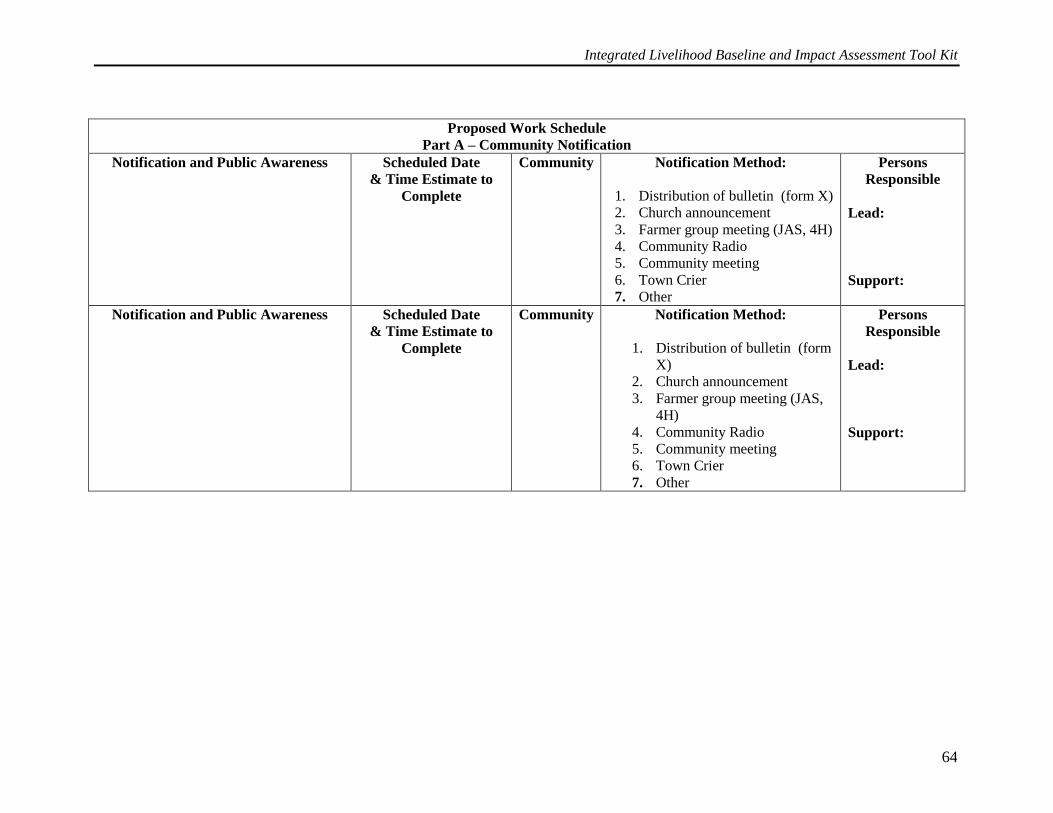
Integrated Livelihood Baseline and Impact Assessment Tool Kit
64
Proposed Work Schedule
Part A – Community Notification
Notification and Public Awareness Scheduled Date
& Time Estimate to
Complete
Community Notification Method:
1. Distribution of bulletin (form X)
2. Church announcement
3. Farmer group meeting (JAS, 4H)
4. Community Radio
5. Community meeting
6. Town Crier
7. Other
Persons
Responsible
Lead:
Support:
Notification and Public Awareness Scheduled Date
& Time Estimate to
Complete
Community Notification Method:
1. Distribution of bulletin (form
X)
2. Church announcement
3. Farmer group meeting (JAS,
4H)
4. Community Radio
5. Community meeting
6. Town Crier
7. Other
Persons
Responsible
Lead:
Support:
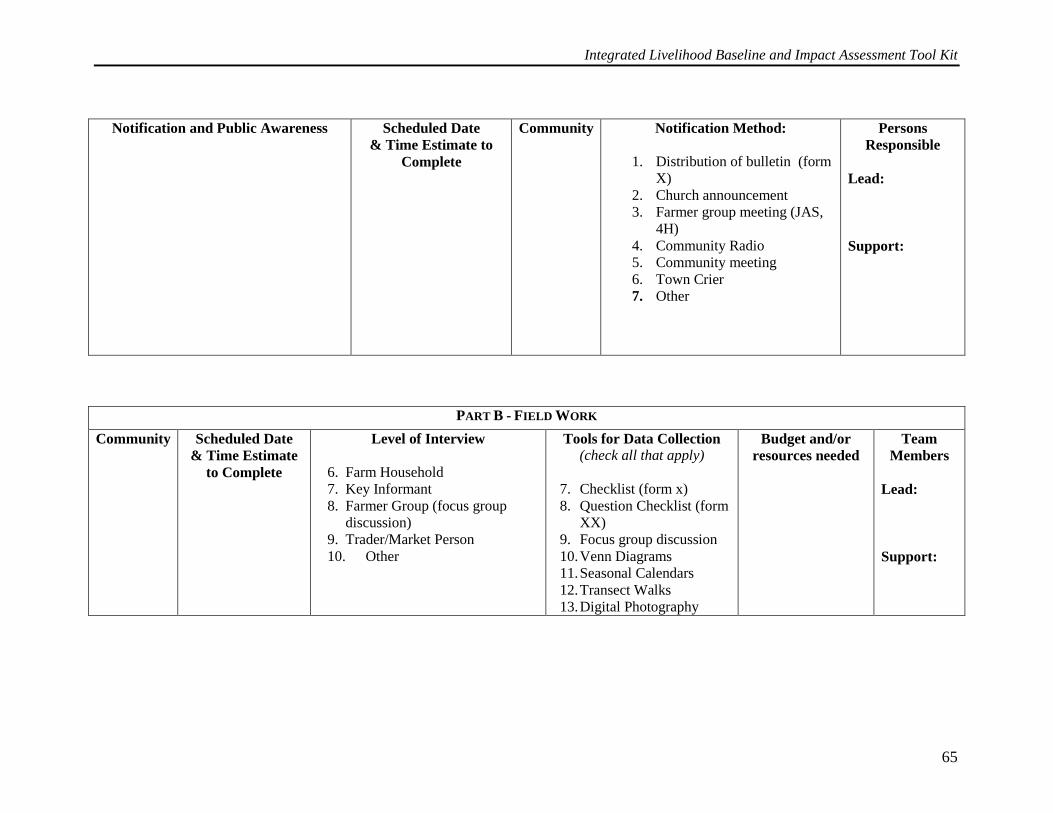
Integrated Livelihood Baseline and Impact Assessment Tool Kit
65
Notification and Public Awareness Scheduled Date
& Time Estimate to
Complete
Community Notification Method:
1. Distribution of bulletin (form
X)
2. Church announcement
3. Farmer group meeting (JAS,
4H)
4. Community Radio
5. Community meeting
6. Town Crier
7. Other
Persons
Responsible
Lead:
Support:
PART B - FIELD WORK
Community Scheduled Date
& Time Estimate
to Complete
Level of Interview
6. Farm Household
7. Key Informant
8. Farmer Group (focus group
discussion)
9. Trader/Market Person
10. Other
Tools for Data Collection (check all that apply)
7. Checklist (form x)
8. Question Checklist (form
XX)
9. Focus group discussion
10. Venn Diagrams
11. Seasonal Calendars
12. Transect Walks
13. Digital Photography
Budget and/or
resources needed
Team
Members
Lead:
Support:
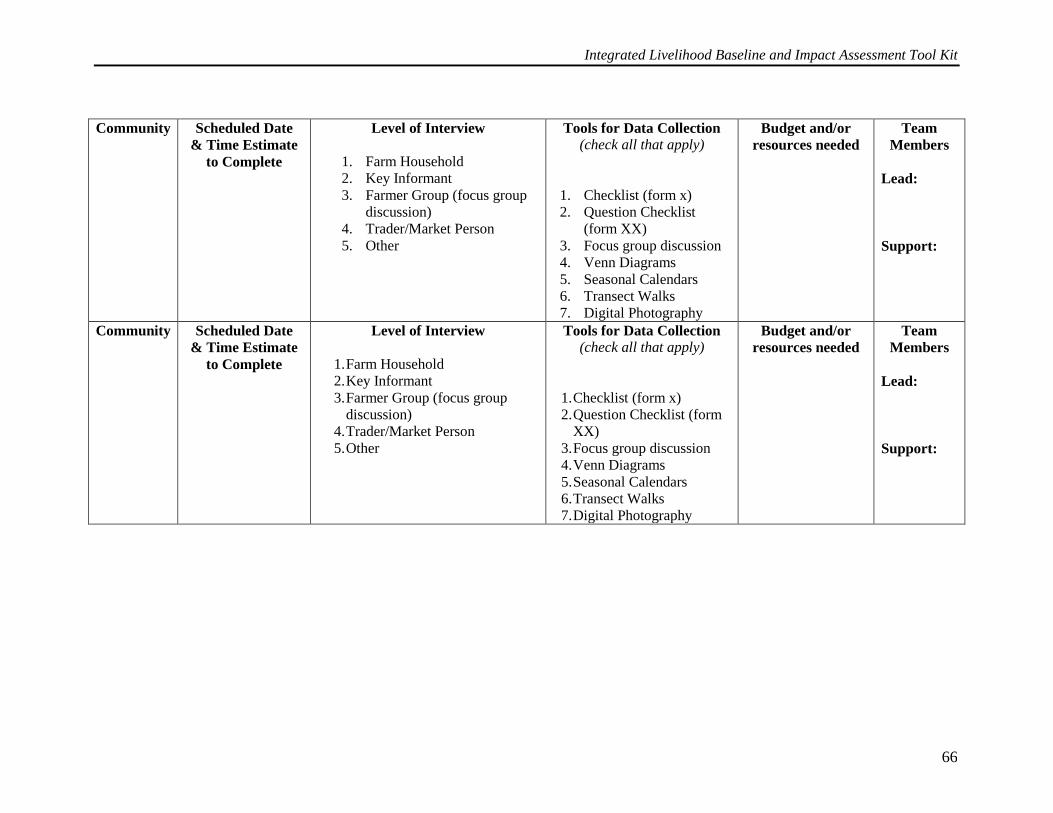
Integrated Livelihood Baseline and Impact Assessment Tool Kit
66
Community Scheduled Date
& Time Estimate
to Complete
Level of Interview
1. Farm Household
2. Key Informant
3. Farmer Group (focus group
discussion)
4. Trader/Market Person
5. Other
Tools for Data Collection (check all that apply)
1. Checklist (form x)
2. Question Checklist
(form XX)
3. Focus group discussion
4. Venn Diagrams
5. Seasonal Calendars
6. Transect Walks
7. Digital Photography
Budget and/or
resources needed
Team
Members
Lead:
Support:
Community Scheduled Date
& Time Estimate
to Complete
Level of Interview
1. Farm Household
2. Key Informant
3. Farmer Group (focus group
discussion)
4. Trader/Market Person
5. Other
Tools for Data Collection (check all that apply)
1. Checklist (form x)
2. Question Checklist (form
XX)
3. Focus group discussion
4. Venn Diagrams
5. Seasonal Calendars
6. Transect Walks
7. Digital Photography
Budget and/or
resources needed
Team
Members
Lead:
Support:
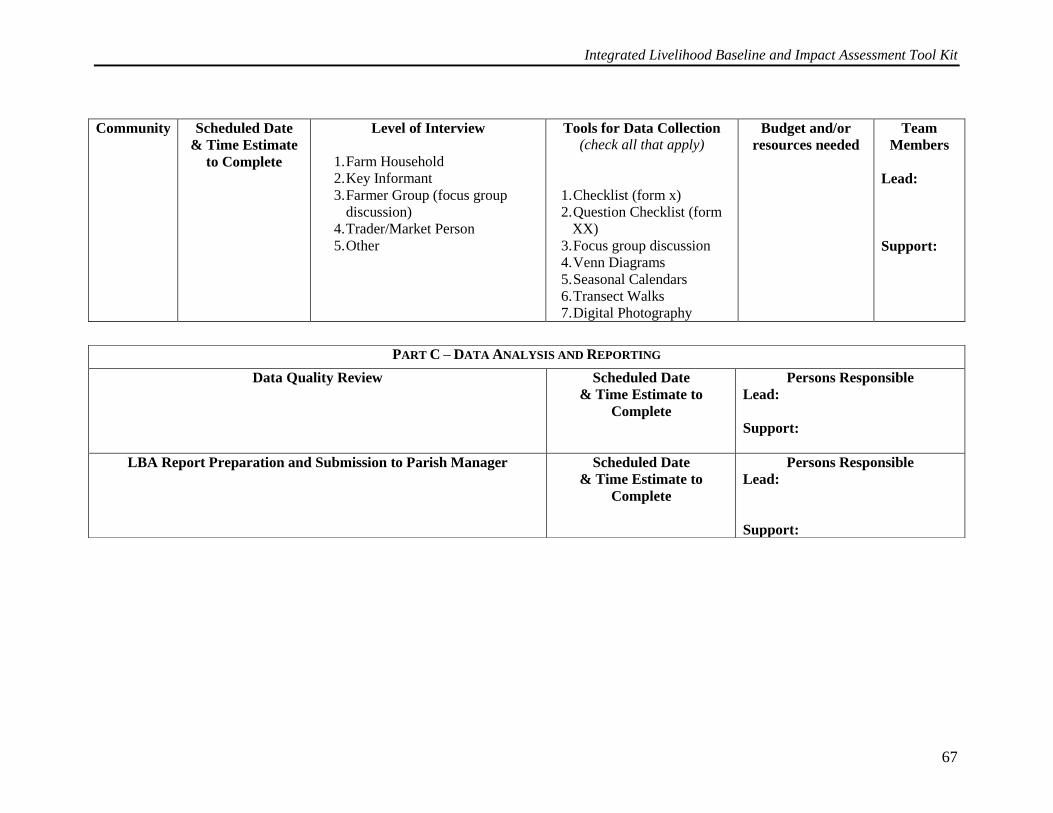
Integrated Livelihood Baseline and Impact Assessment Tool Kit
67
Community Scheduled Date
& Time Estimate
to Complete
Level of Interview
1. Farm Household
2. Key Informant
3. Farmer Group (focus group
discussion)
4. Trader/Market Person
5. Other
Tools for Data Collection (check all that apply)
1. Checklist (form x)
2. Question Checklist (form
XX)
3. Focus group discussion
4. Venn Diagrams
5. Seasonal Calendars
6. Transect Walks
7. Digital Photography
Budget and/or
resources needed
Team
Members
Lead:
Support:
PART C – DATA ANALYSIS AND REPORTING
Data Quality Review Scheduled Date
& Time Estimate to
Complete
Persons Responsible
Lead:
Support:
LBA Report Preparation and Submission to Parish Manager Scheduled Date
& Time Estimate to
Complete
Persons Responsible
Lead:
Support:
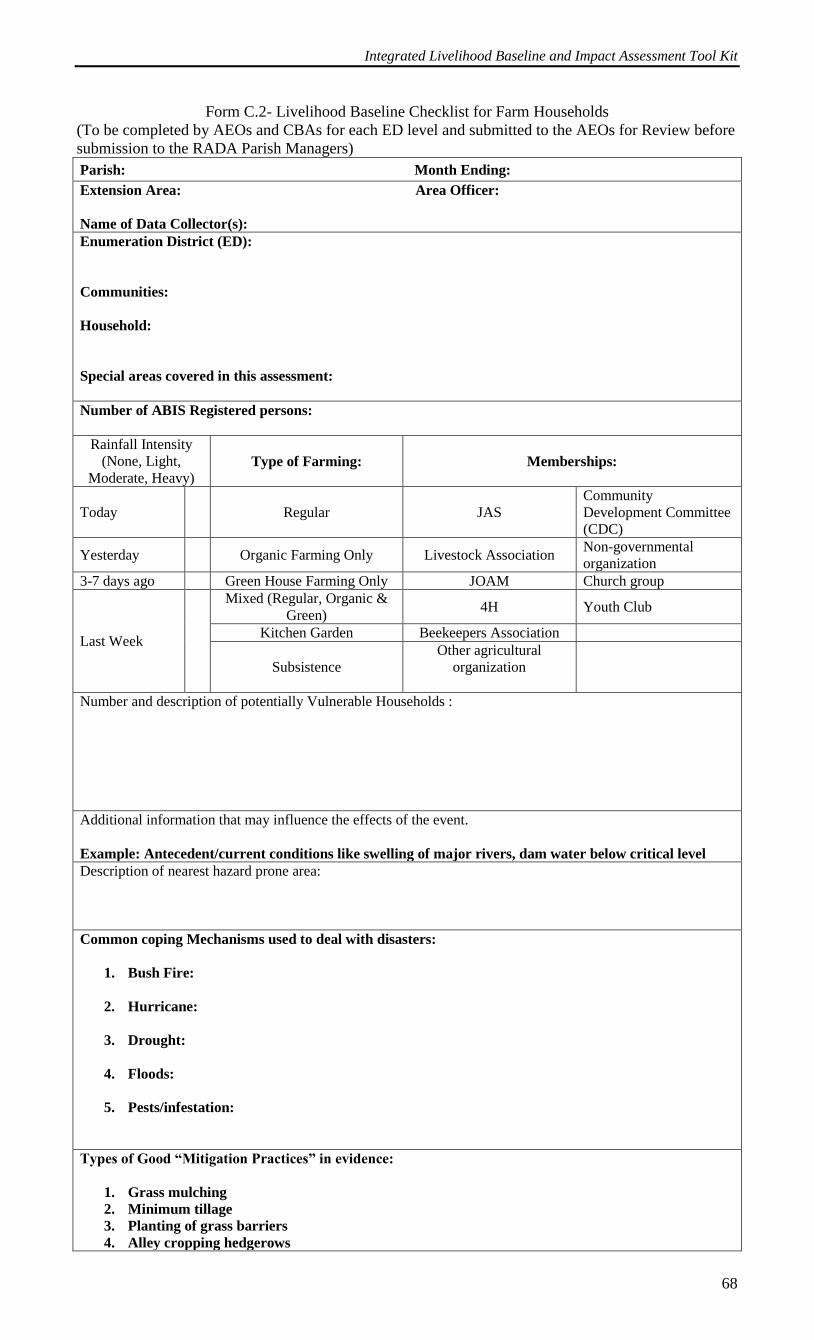
Integrated Livelihood Baseline and Impact Assessment Tool Kit
68
Form C.2- Livelihood Baseline Checklist for Farm Households
(To be completed by AEOs and CBAs for each ED level and submitted to the AEOs for Review before
submission to the RADA Parish Managers)
Parish: Month Ending:
Extension Area: Area Officer:
Name of Data Collector(s):
Enumeration District (ED):
Communities:
Household:
Special areas covered in this assessment:
Number of ABIS Registered persons:
Rainfall Intensity
(None, Light,
Moderate, Heavy) Type of Farming: Memberships:
Today Regular JAS
Community
Development Committee
(CDC)
Yesterday Organic Farming Only Livestock Association Non-governmental
organization
3-7 days ago Green House Farming Only JOAM Church group
Last Week
Mixed (Regular, Organic &
Green) 4H Youth Club
Kitchen Garden Beekeepers Association
Subsistence
Other agricultural
organization
Number and description of potentially Vulnerable Households :
Additional information that may influence the effects of the event.
Example: Antecedent/current conditions like swelling of major rivers, dam water below critical level
Description of nearest hazard prone area:
Common coping Mechanisms used to deal with disasters:
1. Bush Fire:
2. Hurricane:
3. Drought:
4. Floods:
5. Pests/infestation:
Types of Good “Mitigation Practices” in evidence:
1. Grass mulching
2. Minimum tillage
3. Planting of grass barriers
4. Alley cropping hedgerows
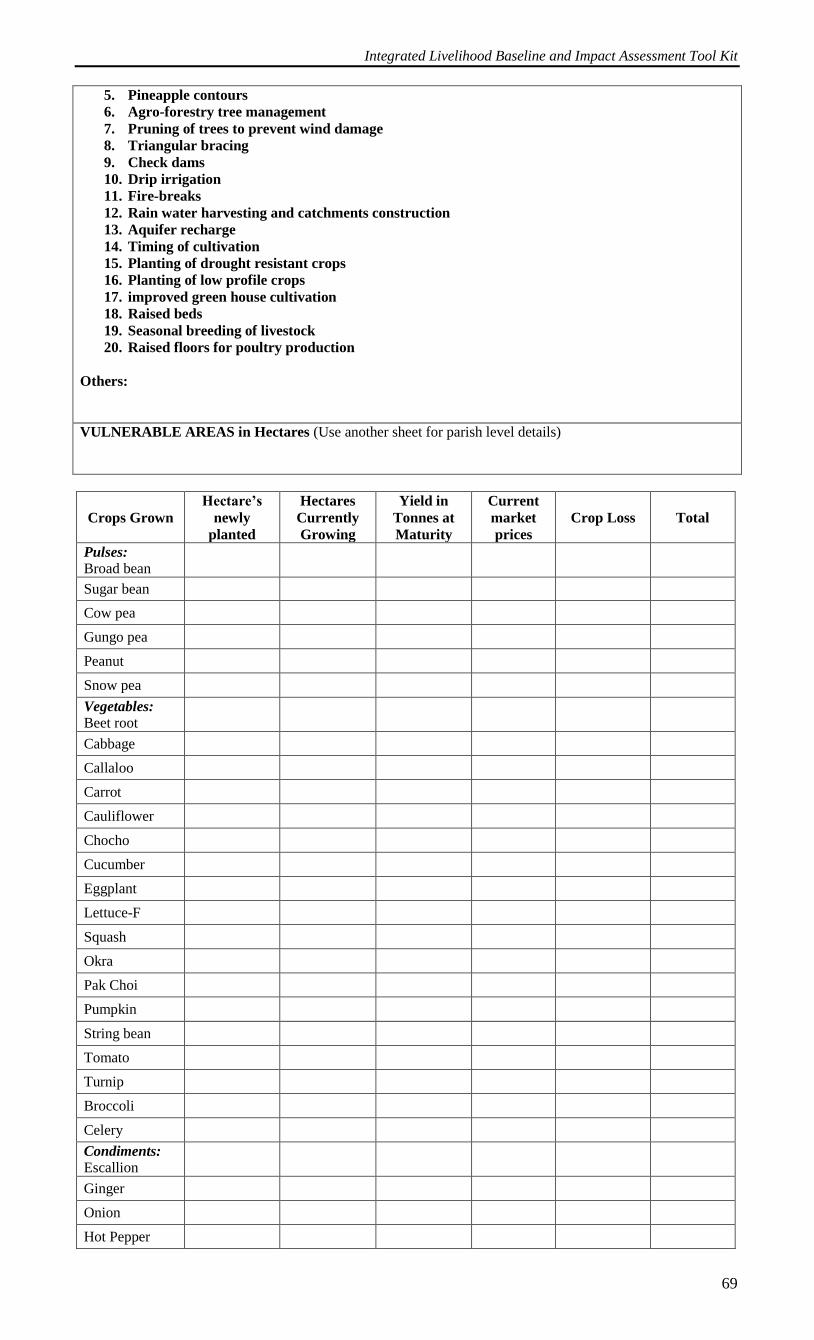
Integrated Livelihood Baseline and Impact Assessment Tool Kit
69
5. Pineapple contours
6. Agro-forestry tree management
7. Pruning of trees to prevent wind damage
8. Triangular bracing
9. Check dams
10. Drip irrigation
11. Fire-breaks
12. Rain water harvesting and catchments construction
13. Aquifer recharge
14. Timing of cultivation
15. Planting of drought resistant crops
16. Planting of low profile crops
17. improved green house cultivation
18. Raised beds
19. Seasonal breeding of livestock
20. Raised floors for poultry production
Others:
VULNERABLE AREAS in Hectares (Use another sheet for parish level details)
Crops Grown
Hectare’s
newly
planted
Hectares
Currently
Growing
Yield in
Tonnes at
Maturity
Current
market
prices
Crop Loss Total
Pulses:
Broad bean
Sugar bean
Cow pea
Gungo pea
Peanut
Snow pea
Vegetables:
Beet root
Cabbage
Callaloo
Carrot
Cauliflower
Chocho
Cucumber
Eggplant
Lettuce-F
Squash
Okra
Pak Choi
Pumpkin
String bean
Tomato
Turnip
Broccoli
Celery
Condiments:
Escallion
Ginger
Onion
Hot Pepper
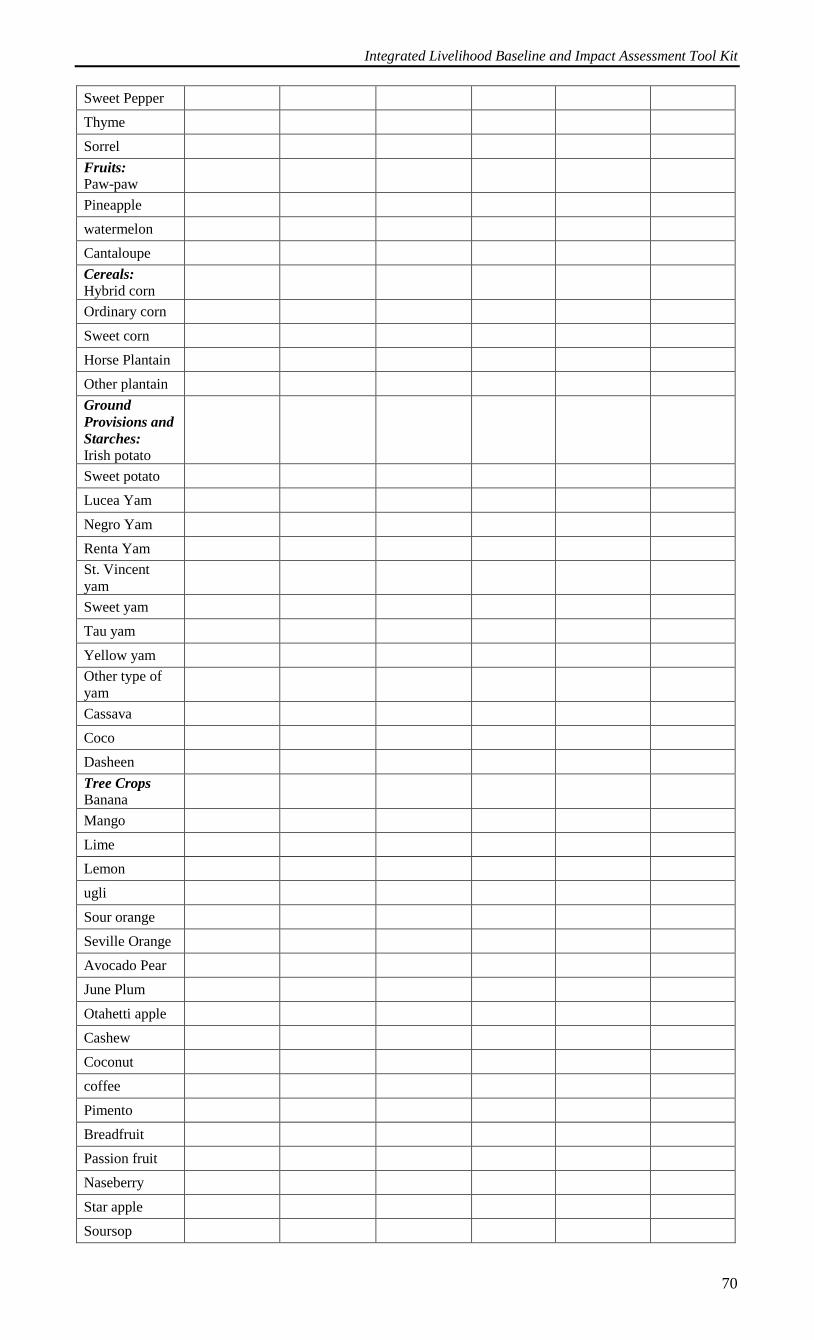
Integrated Livelihood Baseline and Impact Assessment Tool Kit
70
Sweet Pepper
Thyme
Sorrel
Fruits:
Paw-paw
Pineapple
watermelon
Cantaloupe
Cereals:
Hybrid corn
Ordinary corn
Sweet corn
Horse Plantain
Other plantain
Ground
Provisions and
Starches:
Irish potato
Sweet potato
Lucea Yam
Negro Yam
Renta Yam
St. Vincent
yam
Sweet yam
Tau yam
Yellow yam
Other type of
yam
Cassava
Coco
Dasheen
Tree Crops
Banana
Mango
Lime
Lemon
ugli
Sour orange
Seville Orange
Avocado Pear
June Plum
Otahetti apple
Cashew
Coconut
coffee
Pimento
Breadfruit
Passion fruit
Naseberry
Star apple
Soursop
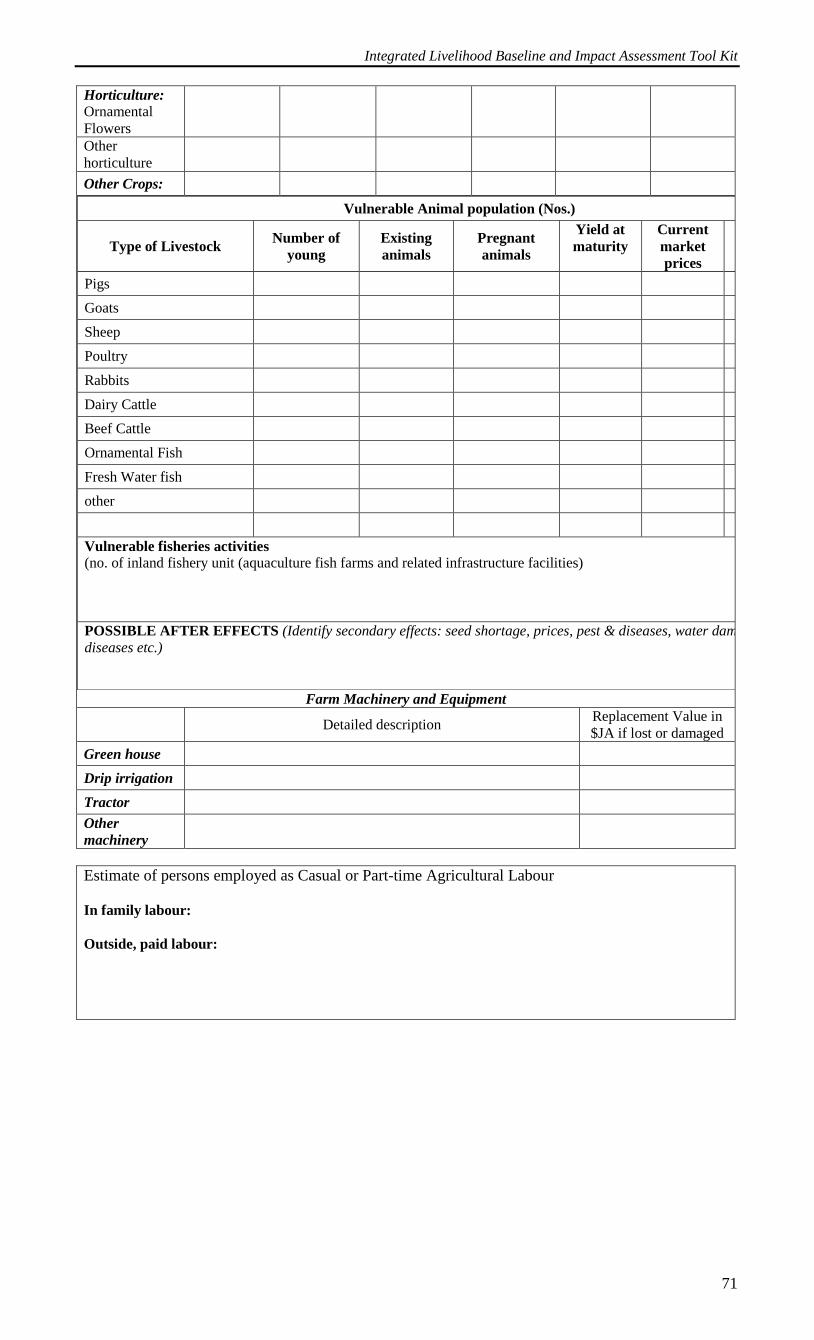
Integrated Livelihood Baseline and Impact Assessment Tool Kit
71
Horticulture:
Ornamental
Flowers
Other
horticulture
Other Crops:
Farm Machinery and Equipment
Vulnerable Animal population (Nos.)
Type of Livestock Number of
young
Existing
animals
Pregnant
animals
Yield at
maturity
Current
market
prices
totals
Pigs
Goats
Sheep
Poultry
Rabbits
Dairy Cattle
Beef Cattle
Ornamental Fish
Fresh Water fish
other
Vulnerable fisheries activities
(no. of inland fishery unit (aquaculture fish farms and related infrastructure facilities)
POSSIBLE AFTER EFFECTS (Identify secondary effects: seed shortage, prices, pest & diseases, water dam level, animal
diseases etc.)
Detailed description Replacement Value in
$JA if lost or damaged
Green house
Drip irrigation
Tractor
Other
machinery
Estimate of persons employed as Casual or Part-time Agricultural Labour
In family labour:
Outside, paid labour:
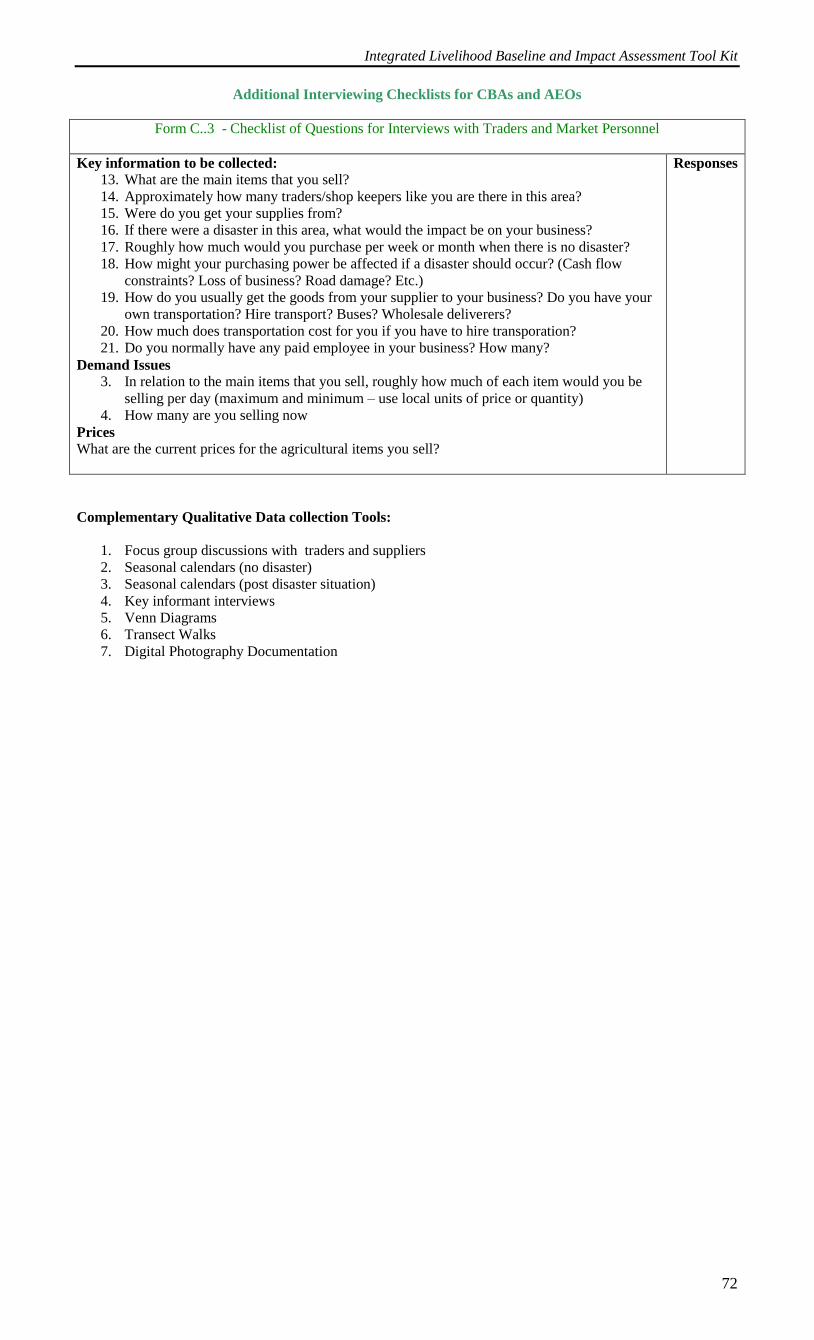
Integrated Livelihood Baseline and Impact Assessment Tool Kit
72
Additional Interviewing Checklists for CBAs and AEOs
Form C..3 - Checklist of Questions for Interviews with Traders and Market Personnel
Key information to be collected:
13. What are the main items that you sell?
14. Approximately how many traders/shop keepers like you are there in this area?
15. Were do you get your supplies from?
16. If there were a disaster in this area, what would the impact be on your business?
17. Roughly how much would you purchase per week or month when there is no disaster?
18. How might your purchasing power be affected if a disaster should occur? (Cash flow
constraints? Loss of business? Road damage? Etc.)
19. How do you usually get the goods from your supplier to your business? Do you have your
own transportation? Hire transport? Buses? Wholesale deliverers?
20. How much does transportation cost for you if you have to hire transporation?
21. Do you normally have any paid employee in your business? How many?
Demand Issues
3. In relation to the main items that you sell, roughly how much of each item would you be
selling per day (maximum and minimum – use local units of price or quantity)
4. How many are you selling now
Prices
What are the current prices for the agricultural items you sell?
Responses
Complementary Qualitative Data collection Tools:
1. Focus group discussions with traders and suppliers
2. Seasonal calendars (no disaster)
3. Seasonal calendars (post disaster situation)
4. Key informant interviews
5. Venn Diagrams
6. Transect Walks
7. Digital Photography Documentation
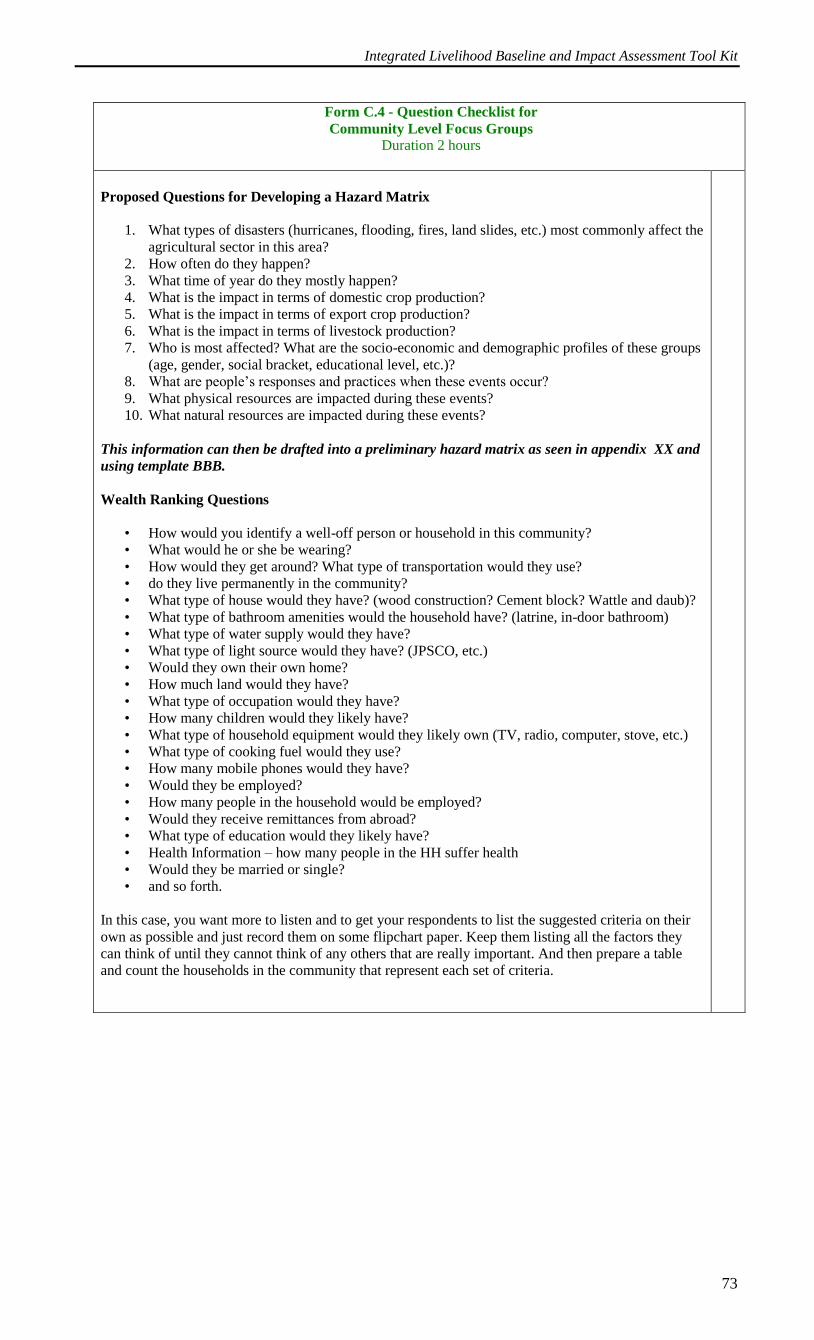
Integrated Livelihood Baseline and Impact Assessment Tool Kit
73
Form C.4 - Question Checklist for
Community Level Focus Groups
Duration 2 hours
Proposed Questions for Developing a Hazard Matrix
1. What types of disasters (hurricanes, flooding, fires, land slides, etc.) most commonly affect the
agricultural sector in this area?
2. How often do they happen?
3. What time of year do they mostly happen?
4. What is the impact in terms of domestic crop production?
5. What is the impact in terms of export crop production?
6. What is the impact in terms of livestock production?
7. Who is most affected? What are the socio-economic and demographic profiles of these groups
(age, gender, social bracket, educational level, etc.)?
8. What are people’s responses and practices when these events occur?
9. What physical resources are impacted during these events?
10. What natural resources are impacted during these events?
This information can then be drafted into a preliminary hazard matrix as seen in appendix XX and
using template BBB.
Wealth Ranking Questions
• How would you identify a well-off person or household in this community?
• What would he or she be wearing?
• How would they get around? What type of transportation would they use?
• do they live permanently in the community?
• What type of house would they have? (wood construction? Cement block? Wattle and daub)?
• What type of bathroom amenities would the household have? (latrine, in-door bathroom)
• What type of water supply would they have?
• What type of light source would they have? (JPSCO, etc.)
• Would they own their own home?
• How much land would they have?
• What type of occupation would they have?
• How many children would they likely have?
• What type of household equipment would they likely own (TV, radio, computer, stove, etc.)
• What type of cooking fuel would they use?
• How many mobile phones would they have?
• Would they be employed?
• How many people in the household would be employed?
• Would they receive remittances from abroad?
• What type of education would they likely have?
• Health Information – how many people in the HH suffer health
• Would they be married or single?
• and so forth.
In this case, you want more to listen and to get your respondents to list the suggested criteria on their
own as possible and just record them on some flipchart paper. Keep them listing all the factors they
can think of until they cannot think of any others that are really important. And then prepare a table
and count the households in the community that represent each set of criteria.
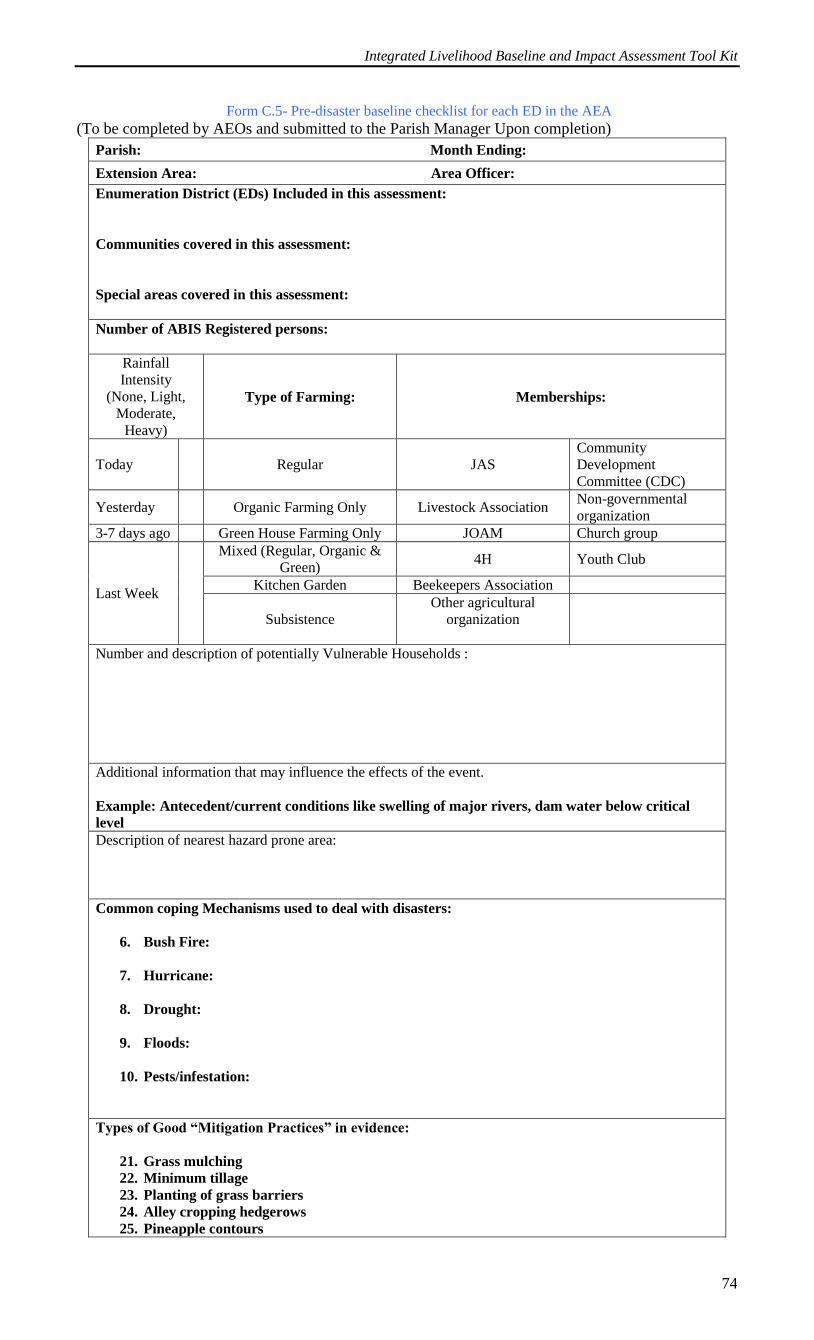
Integrated Livelihood Baseline and Impact Assessment Tool Kit
74
Form C.5- Pre-disaster baseline checklist for each ED in the AEA
(To be completed by AEOs and submitted to the Parish Manager Upon completion)
Parish: Month Ending:
Extension Area: Area Officer:
Enumeration District (EDs) Included in this assessment:
Communities covered in this assessment:
Special areas covered in this assessment:
Number of ABIS Registered persons:
Rainfall
Intensity
(None, Light,
Moderate,
Heavy)
Type of Farming: Memberships:
Today Regular JAS
Community
Development
Committee (CDC)
Yesterday Organic Farming Only Livestock Association Non-governmental
organization
3-7 days ago Green House Farming Only JOAM Church group
Last Week
Mixed (Regular, Organic &
Green) 4H Youth Club
Kitchen Garden Beekeepers Association
Subsistence
Other agricultural
organization
Number and description of potentially Vulnerable Households :
Additional information that may influence the effects of the event.
Example: Antecedent/current conditions like swelling of major rivers, dam water below critical
level
Description of nearest hazard prone area:
Common coping Mechanisms used to deal with disasters:
6. Bush Fire:
7. Hurricane:
8. Drought:
9. Floods:
10. Pests/infestation:
Types of Good “Mitigation Practices” in evidence:
21. Grass mulching
22. Minimum tillage
23. Planting of grass barriers
24. Alley cropping hedgerows
25. Pineapple contours
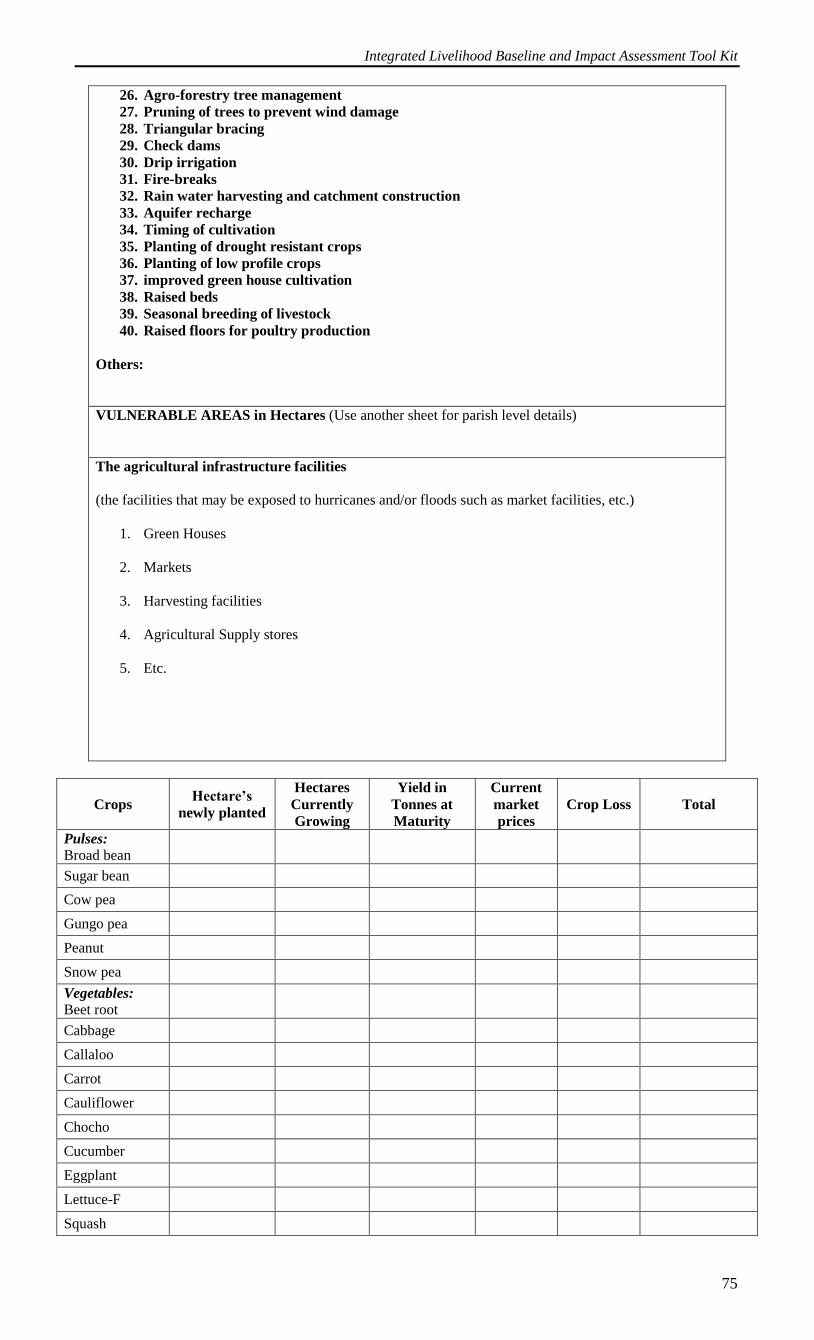
Integrated Livelihood Baseline and Impact Assessment Tool Kit
75
26. Agro-forestry tree management
27. Pruning of trees to prevent wind damage
28. Triangular bracing
29. Check dams
30. Drip irrigation
31. Fire-breaks
32. Rain water harvesting and catchment construction
33. Aquifer recharge
34. Timing of cultivation
35. Planting of drought resistant crops
36. Planting of low profile crops
37. improved green house cultivation
38. Raised beds
39. Seasonal breeding of livestock
40. Raised floors for poultry production
Others:
VULNERABLE AREAS in Hectares (Use another sheet for parish level details)
The agricultural infrastructure facilities
(the facilities that may be exposed to hurricanes and/or floods such as market facilities, etc.)
1. Green Houses
2. Markets
3. Harvesting facilities
4. Agricultural Supply stores
5. Etc.
Crops Hectare’s
newly planted
Hectares
Currently
Growing
Yield in
Tonnes at
Maturity
Current
market
prices
Crop Loss Total
Pulses:
Broad bean
Sugar bean
Cow pea
Gungo pea
Peanut
Snow pea
Vegetables:
Beet root
Cabbage
Callaloo
Carrot
Cauliflower
Chocho
Cucumber
Eggplant
Lettuce-F
Squash
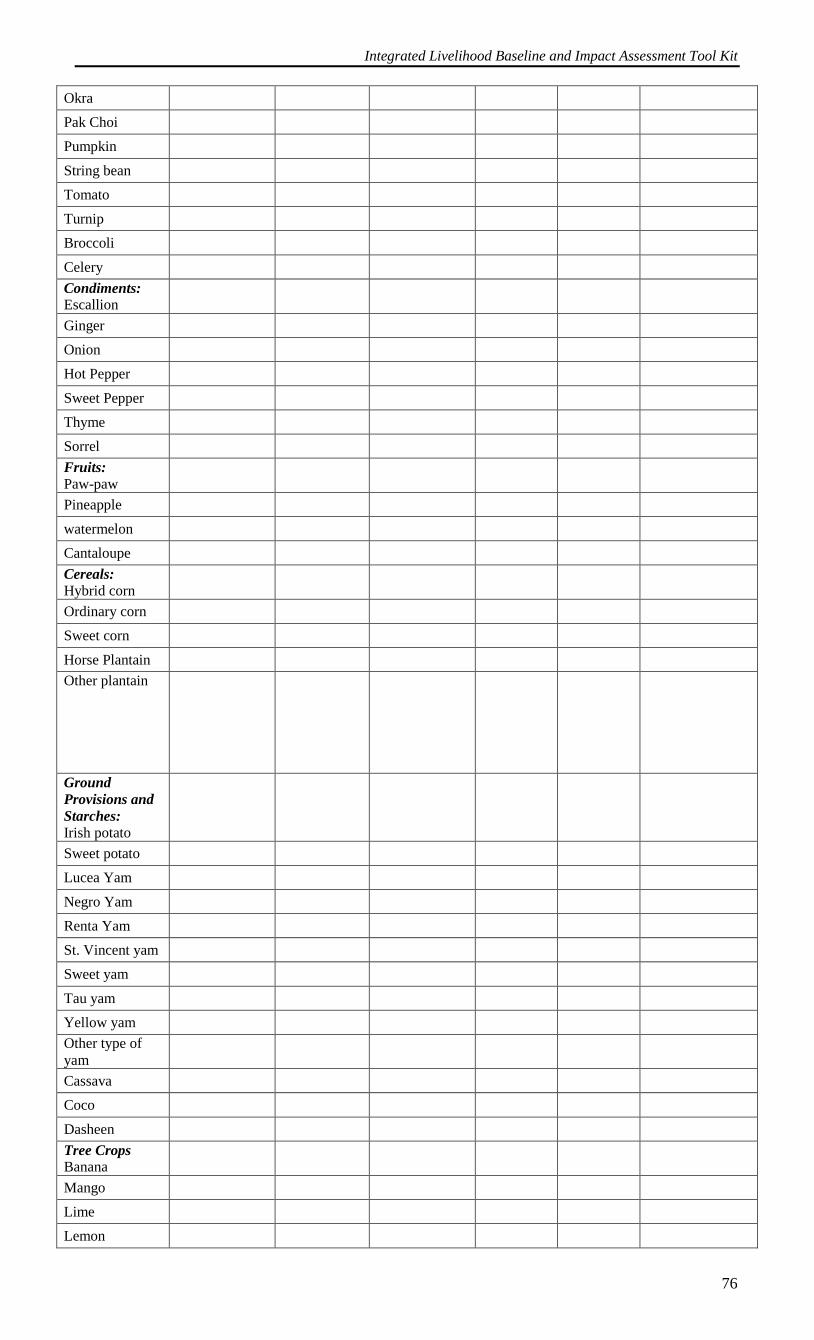
Integrated Livelihood Baseline and Impact Assessment Tool Kit
76
Okra
Pak Choi
Pumpkin
String bean
Tomato
Turnip
Broccoli
Celery
Condiments:
Escallion
Ginger
Onion
Hot Pepper
Sweet Pepper
Thyme
Sorrel
Fruits:
Paw-paw
Pineapple
watermelon
Cantaloupe
Cereals:
Hybrid corn
Ordinary corn
Sweet corn
Horse Plantain
Other plantain
Ground
Provisions and
Starches:
Irish potato
Sweet potato
Lucea Yam
Negro Yam
Renta Yam
St. Vincent yam
Sweet yam
Tau yam
Yellow yam
Other type of
yam
Cassava
Coco
Dasheen
Tree Crops
Banana
Mango
Lime
Lemon
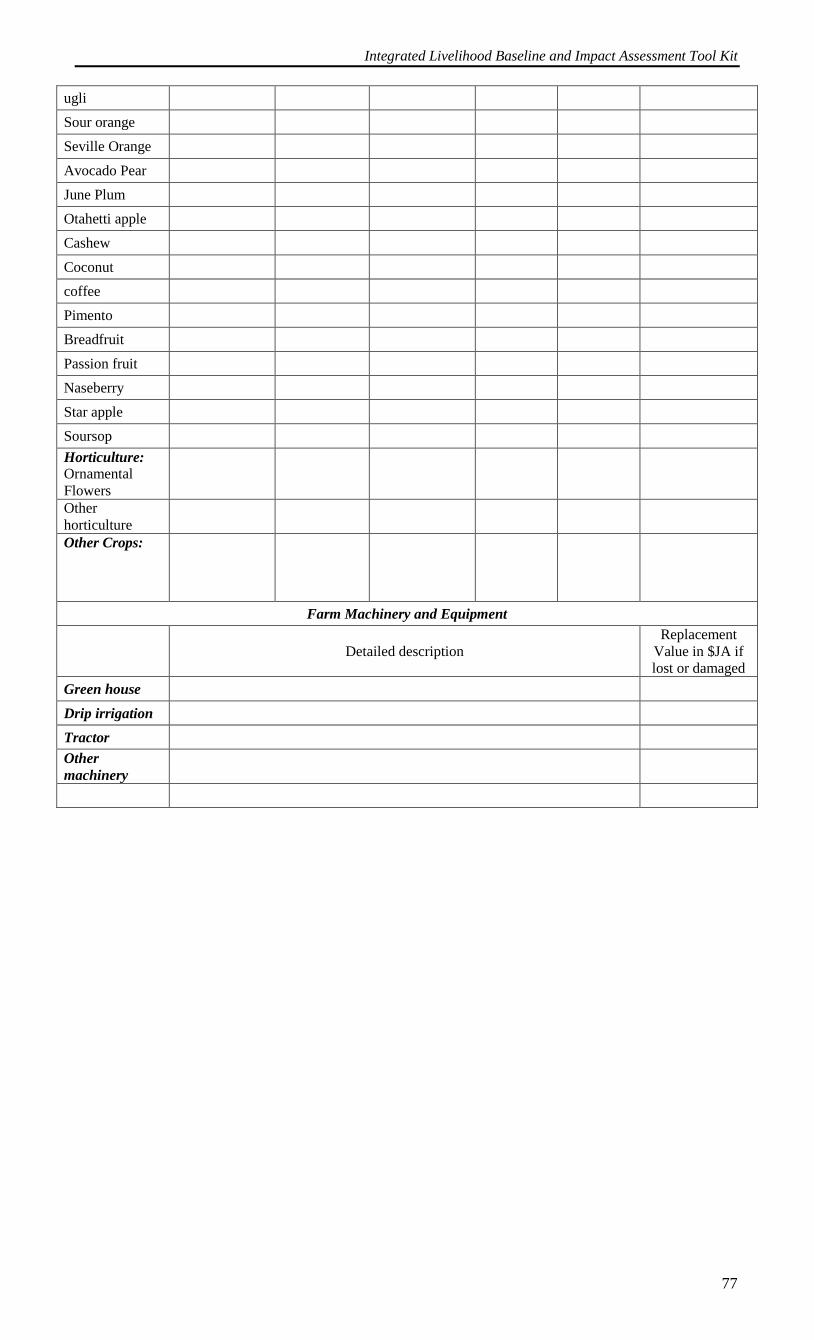
Integrated Livelihood Baseline and Impact Assessment Tool Kit
77
ugli
Sour orange
Seville Orange
Avocado Pear
June Plum
Otahetti apple
Cashew
Coconut
coffee
Pimento
Breadfruit
Passion fruit
Naseberry
Star apple
Soursop
Horticulture:
Ornamental
Flowers
Other
horticulture
Other Crops:
Farm Machinery and Equipment
Detailed description
Replacement
Value in $JA if
lost or damaged
Green house
Drip irrigation
Tractor
Other
machinery
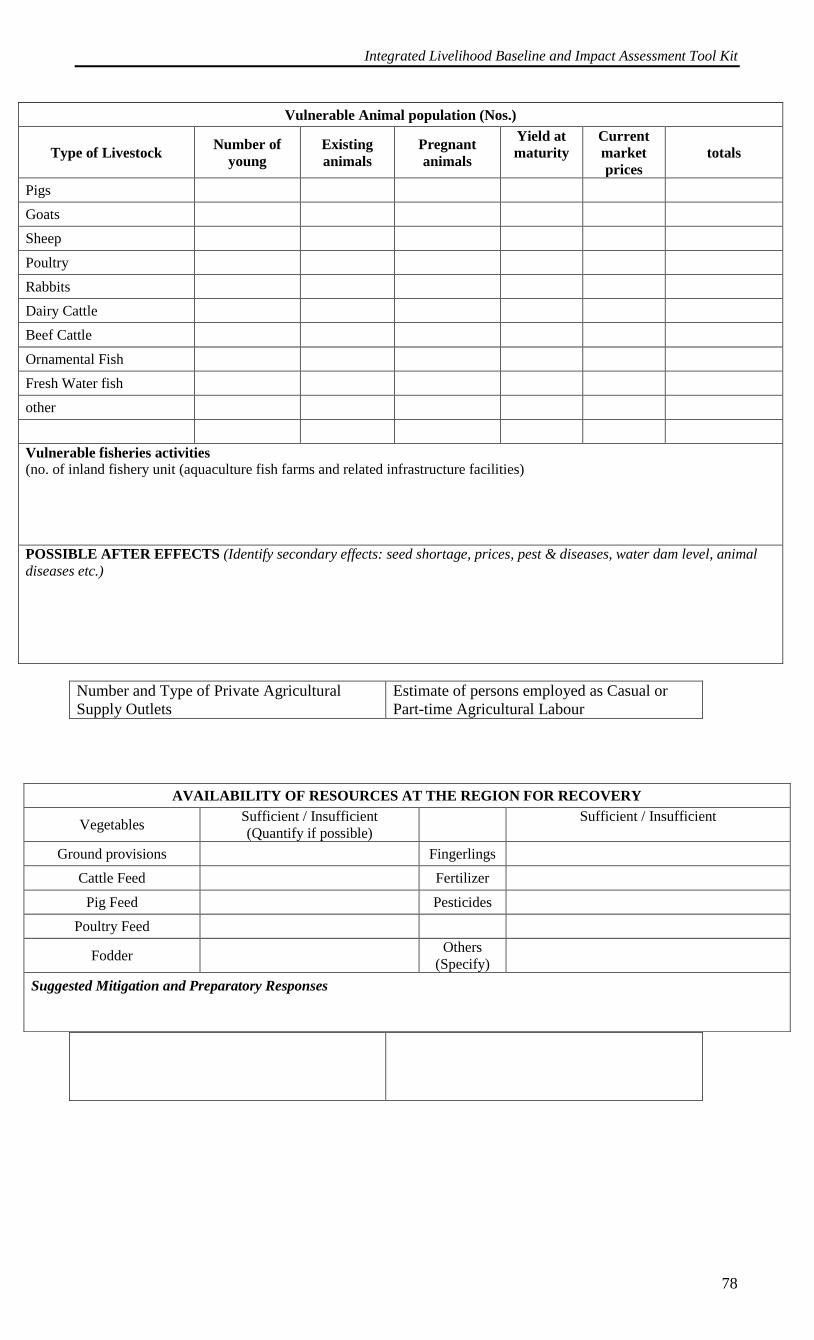
Integrated Livelihood Baseline and Impact Assessment Tool Kit
78
Vulnerable Animal population (Nos.)
Type of Livestock Number of
young
Existing
animals
Pregnant
animals
Yield at
maturity
Current
market
prices
totals
Pigs
Goats
Sheep
Poultry
Rabbits
Dairy Cattle
Beef Cattle
Ornamental Fish
Fresh Water fish
other
Vulnerable fisheries activities
(no. of inland fishery unit (aquaculture fish farms and related infrastructure facilities)
POSSIBLE AFTER EFFECTS (Identify secondary effects: seed shortage, prices, pest & diseases, water dam level, animal
diseases etc.)
Number and Type of Private Agricultural
Supply Outlets
Estimate of persons employed as Casual or
Part-time Agricultural Labour
AVAILABILITY OF RESOURCES AT THE REGION FOR RECOVERY
Vegetables Sufficient / Insufficient
(Quantify if possible)
Sufficient / Insufficient
Ground provisions Fingerlings
Cattle Feed Fertilizer
Pig Feed Pesticides
Poultry Feed
Fodder Others
(Specify)
Suggested Mitigation and Preparatory Responses
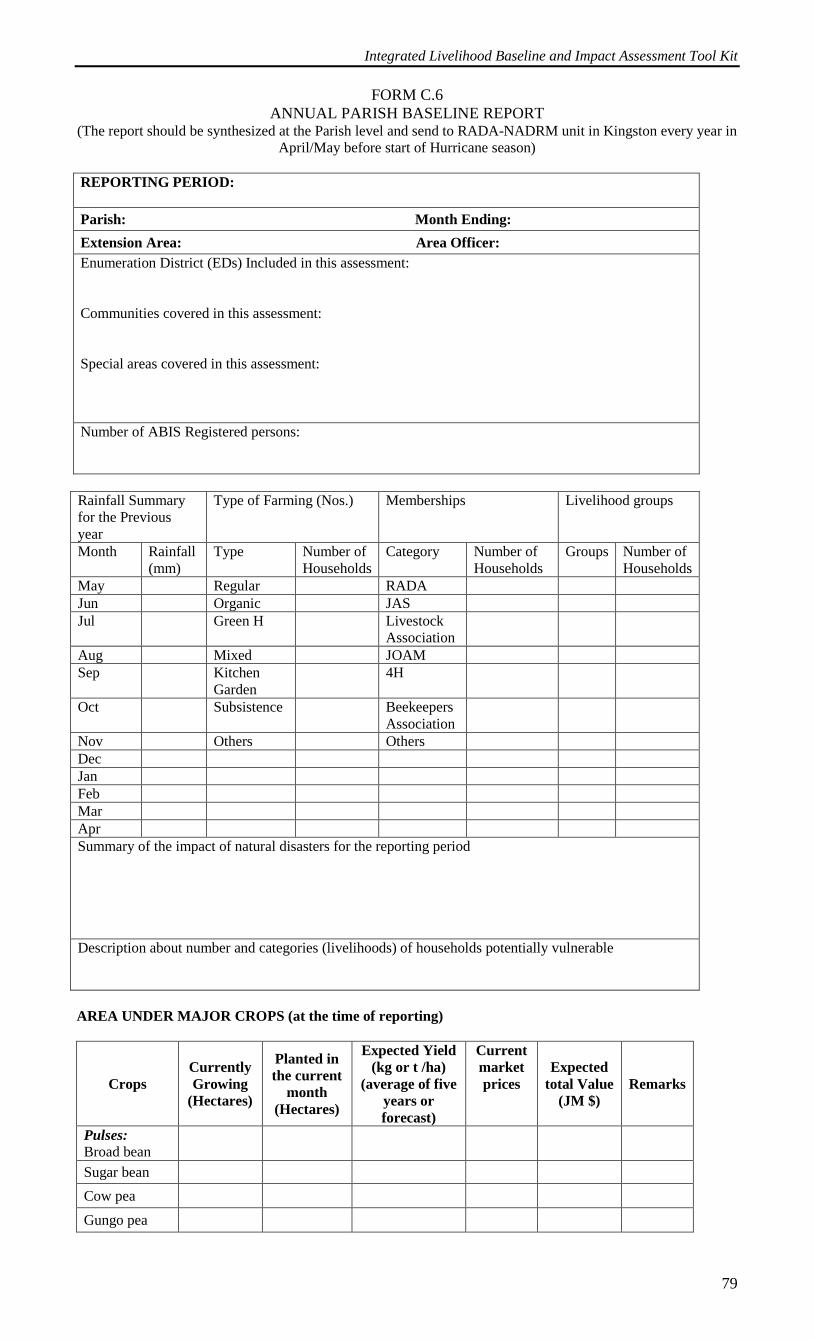
Integrated Livelihood Baseline and Impact Assessment Tool Kit
79
FORM C.6
ANNUAL PARISH BASELINE REPORT (The report should be synthesized at the Parish level and send to RADA-NADRM unit in Kingston every year in
April/May before start of Hurricane season)
REPORTING PERIOD:
Parish: Month Ending:
Extension Area: Area Officer:
Enumeration District (EDs) Included in this assessment:
Communities covered in this assessment:
Special areas covered in this assessment:
Number of ABIS Registered persons:
Rainfall Summary
for the Previous
year
Type of Farming (Nos.) Memberships Livelihood groups
Month Rainfall
(mm)
Type Number of
Households
Category Number of
Households
Groups Number of
Households
May Regular RADA
Jun Organic JAS
Jul Green H Livestock
Association
Aug Mixed JOAM
Sep Kitchen
Garden
4H
Oct Subsistence Beekeepers
Association
Nov Others Others
Dec
Jan
Feb
Mar
Apr
Summary of the impact of natural disasters for the reporting period
Description about number and categories (livelihoods) of households potentially vulnerable
AREA UNDER MAJOR CROPS (at the time of reporting)
Crops
Currently
Growing
(Hectares)
Planted in
the current
month
(Hectares)
Expected Yield
(kg or t /ha)
(average of five
years or
forecast)
Current
market
prices
Expected
total Value
(JM $)
Remarks
Pulses:
Broad bean
Sugar bean
Cow pea
Gungo pea
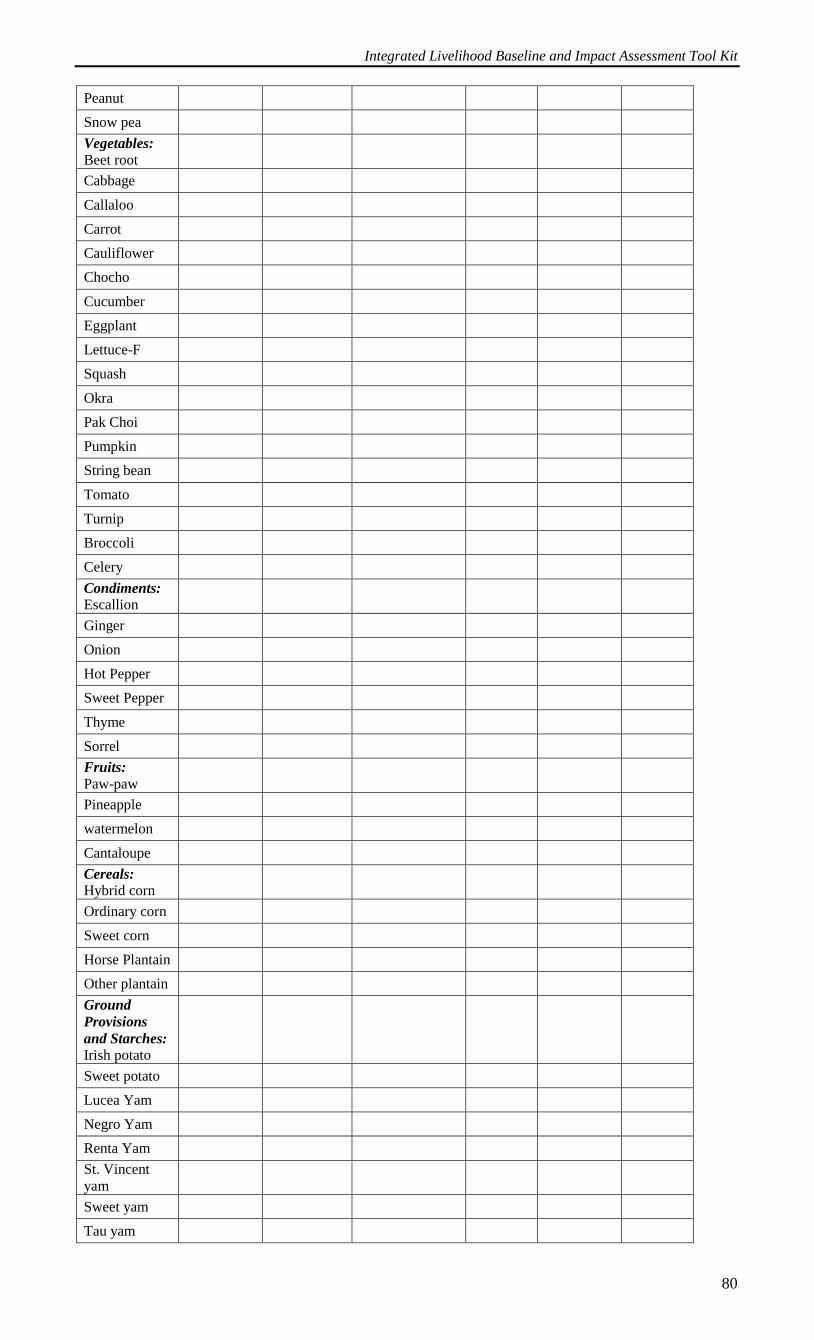
Integrated Livelihood Baseline and Impact Assessment Tool Kit
80
Peanut
Snow pea
Vegetables:
Beet root
Cabbage
Callaloo
Carrot
Cauliflower
Chocho
Cucumber
Eggplant
Lettuce-F
Squash
Okra
Pak Choi
Pumpkin
String bean
Tomato
Turnip
Broccoli
Celery
Condiments:
Escallion
Ginger
Onion
Hot Pepper
Sweet Pepper
Thyme
Sorrel
Fruits:
Paw-paw
Pineapple
watermelon
Cantaloupe
Cereals:
Hybrid corn
Ordinary corn
Sweet corn
Horse Plantain
Other plantain
Ground
Provisions
and Starches:
Irish potato
Sweet potato
Lucea Yam
Negro Yam
Renta Yam
St. Vincent
yam
Sweet yam
Tau yam
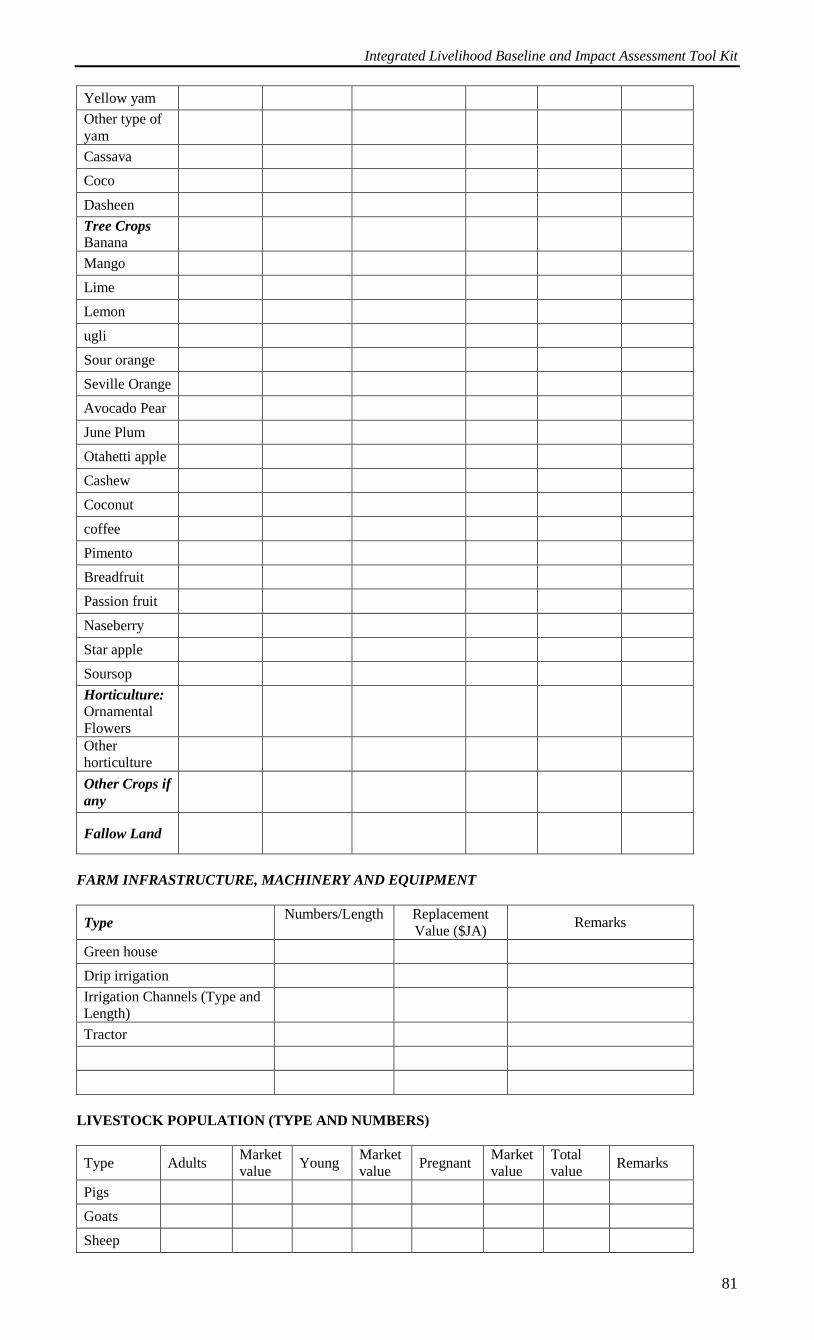
Integrated Livelihood Baseline and Impact Assessment Tool Kit
81
Yellow yam
Other type of
yam
Cassava
Coco
Dasheen
Tree Crops
Banana
Mango
Lime
Lemon
ugli
Sour orange
Seville Orange
Avocado Pear
June Plum
Otahetti apple
Cashew
Coconut
coffee
Pimento
Breadfruit
Passion fruit
Naseberry
Star apple
Soursop
Horticulture:
Ornamental
Flowers
Other
horticulture
Other Crops if
any
Fallow Land
FARM INFRASTRUCTURE, MACHINERY AND EQUIPMENT
Type Numbers/Length Replacement
Value ($JA) Remarks
Green house
Drip irrigation
Irrigation Channels (Type and
Length)
Tractor
LIVESTOCK POPULATION (TYPE AND NUMBERS)
Type Adults Market
value Young
Market
value Pregnant
Market
value
Total
value Remarks
Pigs
Goats
Sheep
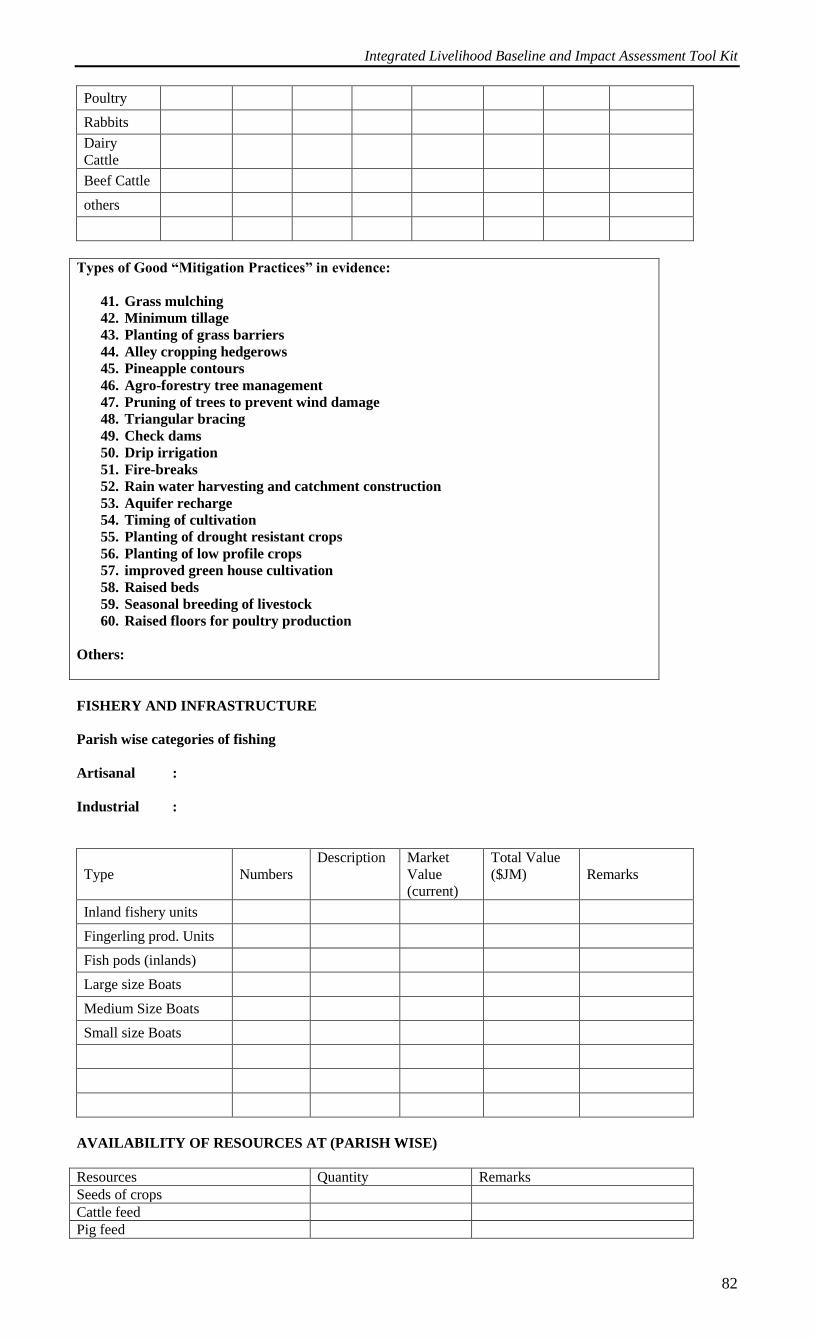
Integrated Livelihood Baseline and Impact Assessment Tool Kit
82
Poultry
Rabbits
Dairy
Cattle
Beef Cattle
others
Types of Good “Mitigation Practices” in evidence:
41. Grass mulching
42. Minimum tillage
43. Planting of grass barriers
44. Alley cropping hedgerows
45. Pineapple contours
46. Agro-forestry tree management
47. Pruning of trees to prevent wind damage
48. Triangular bracing
49. Check dams
50. Drip irrigation
51. Fire-breaks
52. Rain water harvesting and catchment construction
53. Aquifer recharge
54. Timing of cultivation
55. Planting of drought resistant crops
56. Planting of low profile crops
57. improved green house cultivation
58. Raised beds
59. Seasonal breeding of livestock
60. Raised floors for poultry production
Others:
FISHERY AND INFRASTRUCTURE
Parish wise categories of fishing
Artisanal :
Industrial :
Type Numbers
Description Market
Value
(current)
Total Value
($JM) Remarks
Inland fishery units
Fingerling prod. Units
Fish pods (inlands)
Large size Boats
Medium Size Boats
Small size Boats
AVAILABILITY OF RESOURCES AT (PARISH WISE)
Resources Quantity Remarks
Seeds of crops
Cattle feed
Pig feed
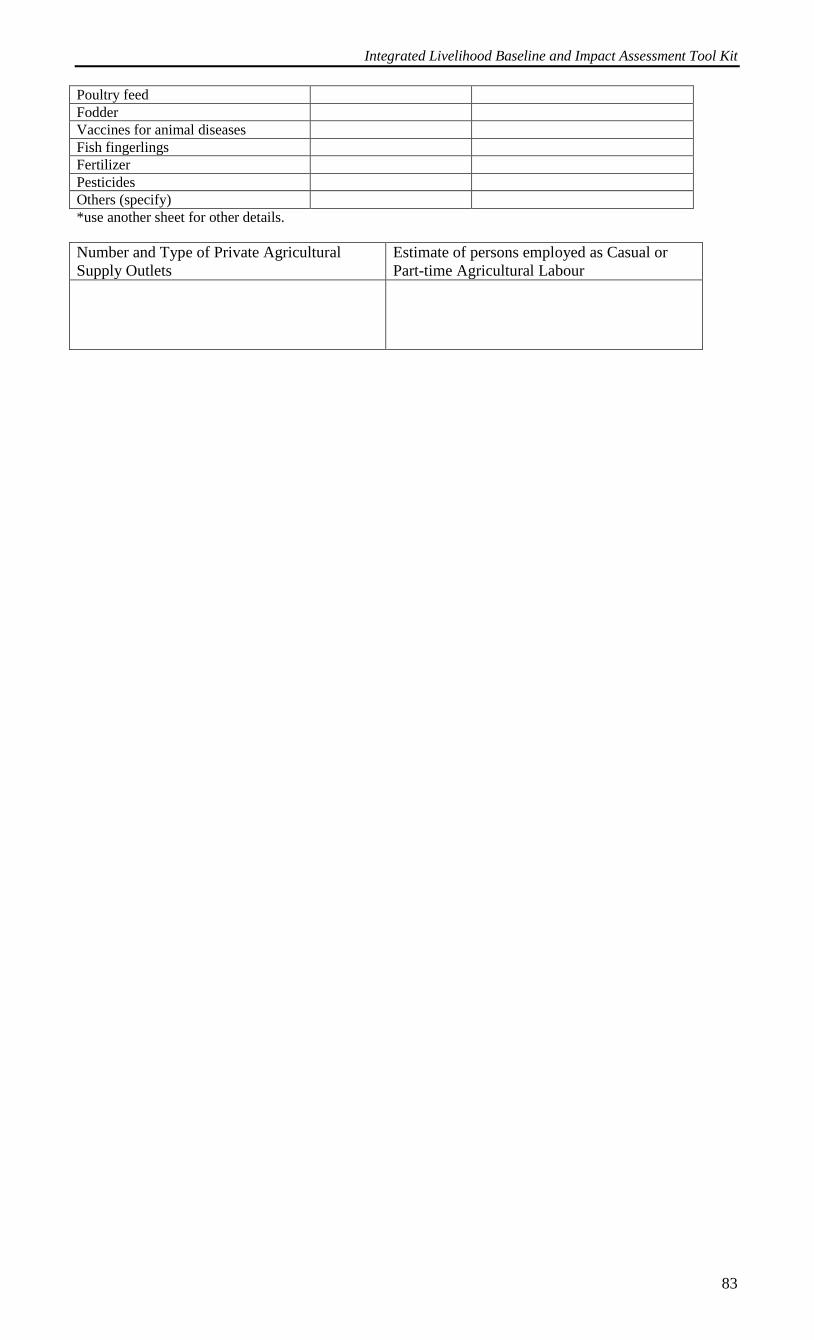
Integrated Livelihood Baseline and Impact Assessment Tool Kit
83
Poultry feed
Fodder
Vaccines for animal diseases
Fish fingerlings
Fertilizer
Pesticides
Others (specify)
*use another sheet for other details.
Number and Type of Private Agricultural
Supply Outlets
Estimate of persons employed as Casual or
Part-time Agricultural Labour
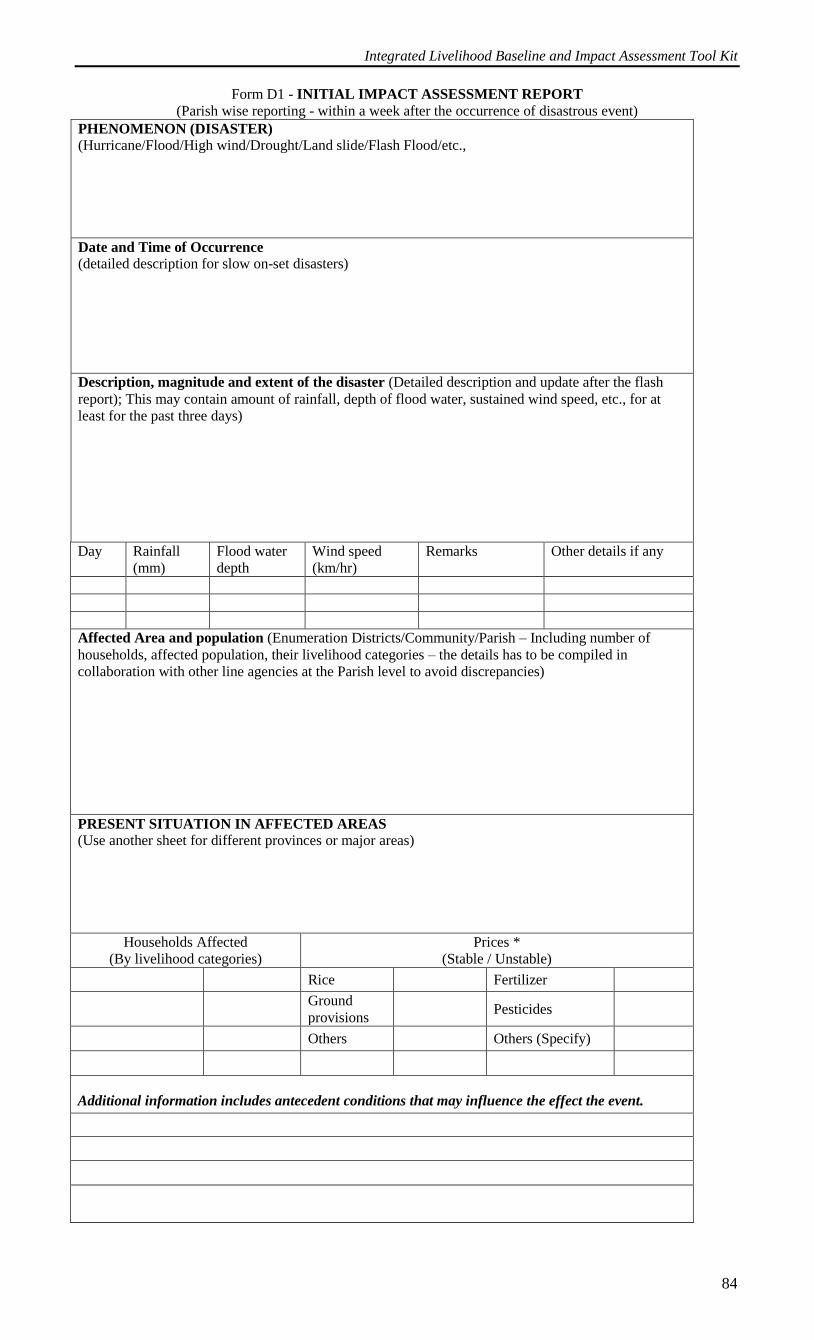
Integrated Livelihood Baseline and Impact Assessment Tool Kit
84
Form D1 - INITIAL IMPACT ASSESSMENT REPORT
(Parish wise reporting - within a week after the occurrence of disastrous event)
PHENOMENON (DISASTER)
(Hurricane/Flood/High wind/Drought/Land slide/Flash Flood/etc.,
Date and Time of Occurrence
(detailed description for slow on-set disasters)
Description, magnitude and extent of the disaster (Detailed description and update after the flash
report); This may contain amount of rainfall, depth of flood water, sustained wind speed, etc., for at
least for the past three days)
Day Rainfall
(mm)
Flood water
depth
Wind speed
(km/hr)
Remarks Other details if any
Affected Area and population (Enumeration Districts/Community/Parish – Including number of
households, affected population, their livelihood categories – the details has to be compiled in
collaboration with other line agencies at the Parish level to avoid discrepancies)
PRESENT SITUATION IN AFFECTED AREAS
(Use another sheet for different provinces or major areas)
Households Affected
(By livelihood categories)
Prices *
(Stable / Unstable)
Rice Fertilizer
Ground
provisions Pesticides
Others Others (Specify)
Additional information includes antecedent conditions that may influence the effect the event.
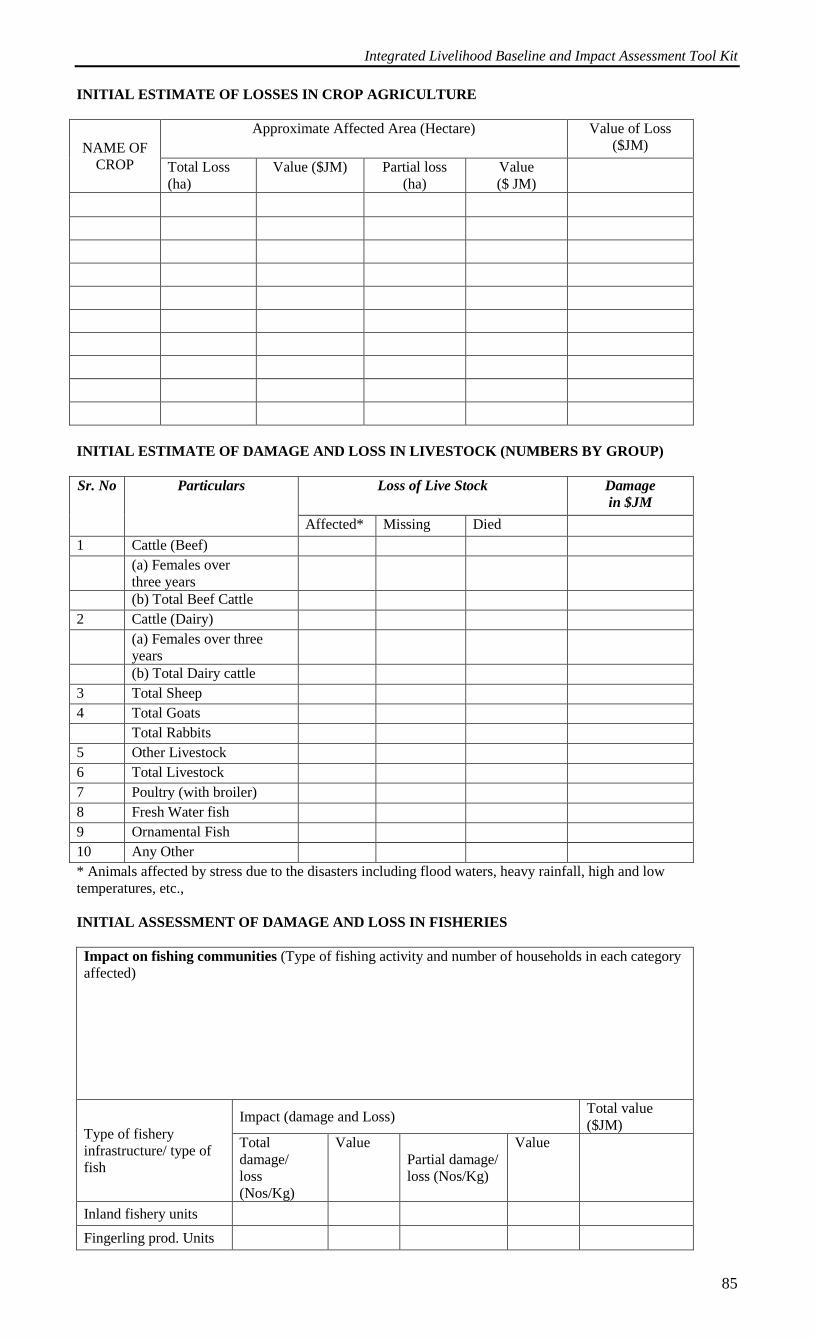
Integrated Livelihood Baseline and Impact Assessment Tool Kit
85
INITIAL ESTIMATE OF LOSSES IN CROP AGRICULTURE
NAME OF
CROP
Approximate Affected Area (Hectare) Value of Loss
($JM)
Total Loss
(ha)
Value ($JM) Partial loss
(ha)
Value
($ JM)
INITIAL ESTIMATE OF DAMAGE AND LOSS IN LIVESTOCK (NUMBERS BY GROUP)
Sr. No Particulars Loss of Live Stock Damage
in $JM
Affected* Missing Died
1 Cattle (Beef)
(a) Females over
three years
(b) Total Beef Cattle
2 Cattle (Dairy)
(a) Females over three
years
(b) Total Dairy cattle
3 Total Sheep
4 Total Goats
Total Rabbits
5 Other Livestock
6 Total Livestock
7 Poultry (with broiler)
8 Fresh Water fish
9 Ornamental Fish
10 Any Other
* Animals affected by stress due to the disasters including flood waters, heavy rainfall, high and low
temperatures, etc.,
INITIAL ASSESSMENT OF DAMAGE AND LOSS IN FISHERIES
Impact on fishing communities (Type of fishing activity and number of households in each category
affected)
Type of fishery
infrastructure/ type of
fish
Impact (damage and Loss) Total value
($JM)
Total
damage/
loss
(Nos/Kg)
Value
Partial damage/
loss (Nos/Kg)
Value
Inland fishery units
Fingerling prod. Units
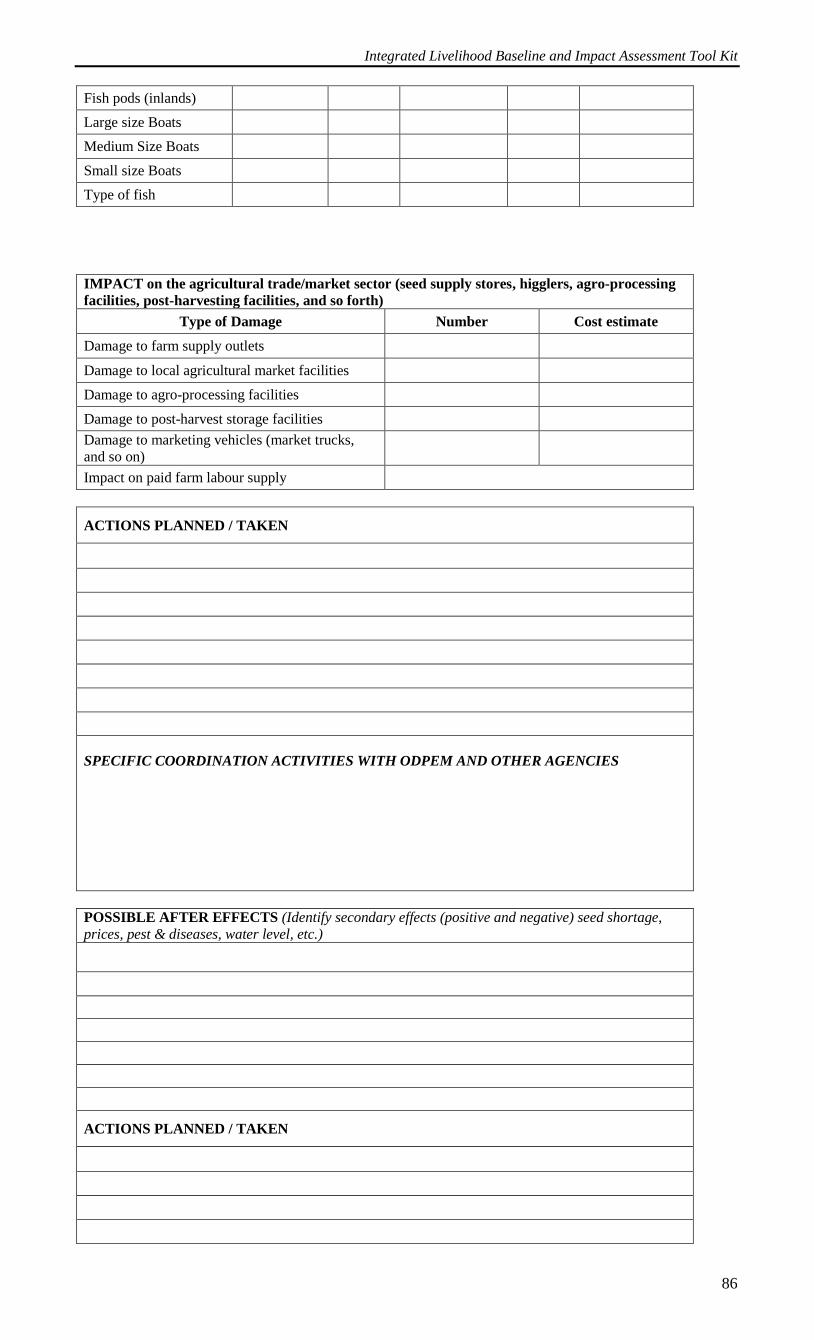
Integrated Livelihood Baseline and Impact Assessment Tool Kit
86
Fish pods (inlands)
Large size Boats
Medium Size Boats
Small size Boats
Type of fish
IMPACT on the agricultural trade/market sector (seed supply stores, higglers, agro-processing
facilities, post-harvesting facilities, and so forth)
Type of Damage Number Cost estimate
Damage to farm supply outlets
Damage to local agricultural market facilities
Damage to agro-processing facilities
Damage to post-harvest storage facilities
Damage to marketing vehicles (market trucks,
and so on)
Impact on paid farm labour supply
ACTIONS PLANNED / TAKEN
SPECIFIC COORDINATION ACTIVITIES WITH ODPEM AND OTHER AGENCIES
POSSIBLE AFTER EFFECTS (Identify secondary effects (positive and negative) seed shortage,
prices, pest & diseases, water level, etc.)
ACTIONS PLANNED / TAKEN
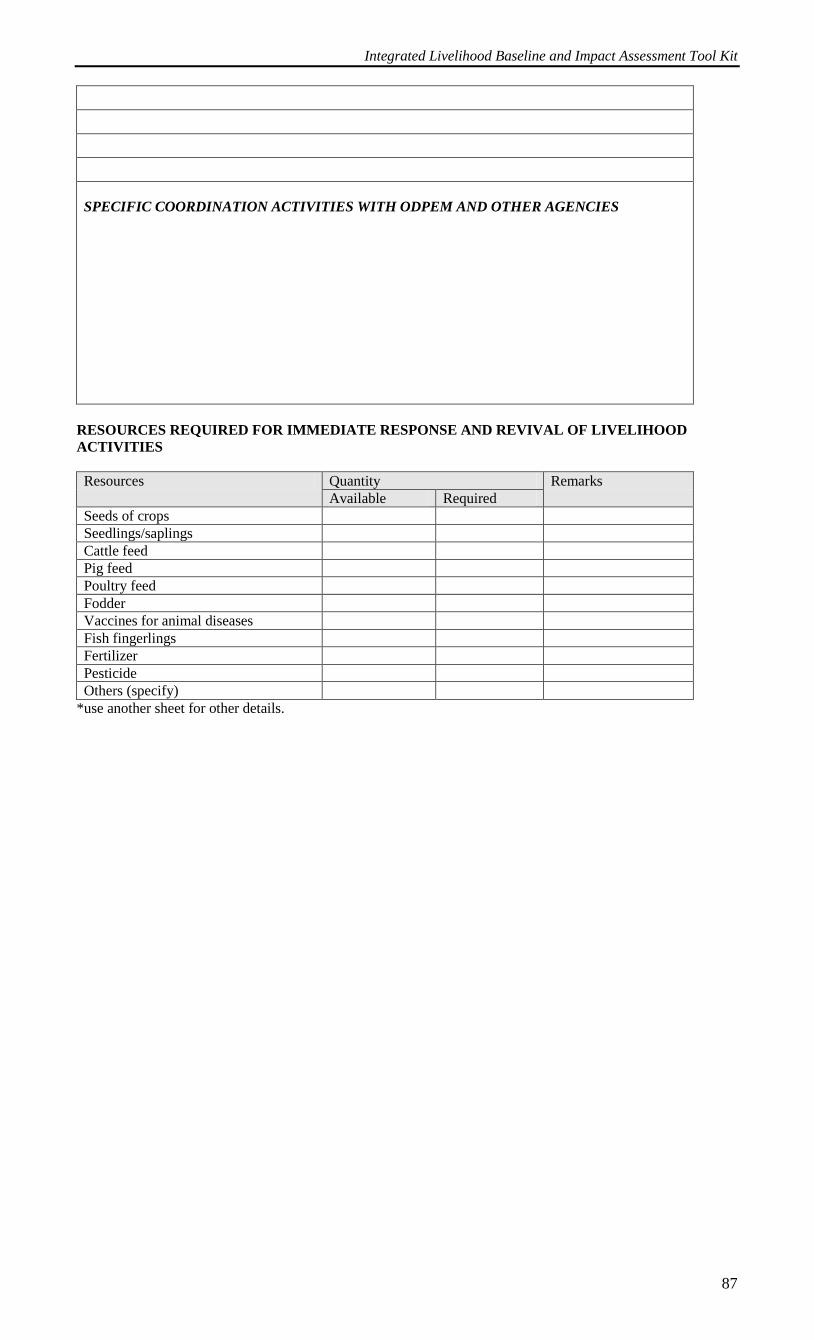
Integrated Livelihood Baseline and Impact Assessment Tool Kit
87
SPECIFIC COORDINATION ACTIVITIES WITH ODPEM AND OTHER AGENCIES
RESOURCES REQUIRED FOR IMMEDIATE RESPONSE AND REVIVAL OF LIVELIHOOD
ACTIVITIES
Resources Quantity Remarks
Available Required
Seeds of crops
Seedlings/saplings
Cattle feed
Pig feed
Poultry feed
Fodder
Vaccines for animal diseases
Fish fingerlings
Fertilizer
Pesticide
Others (specify)
*use another sheet for other details.
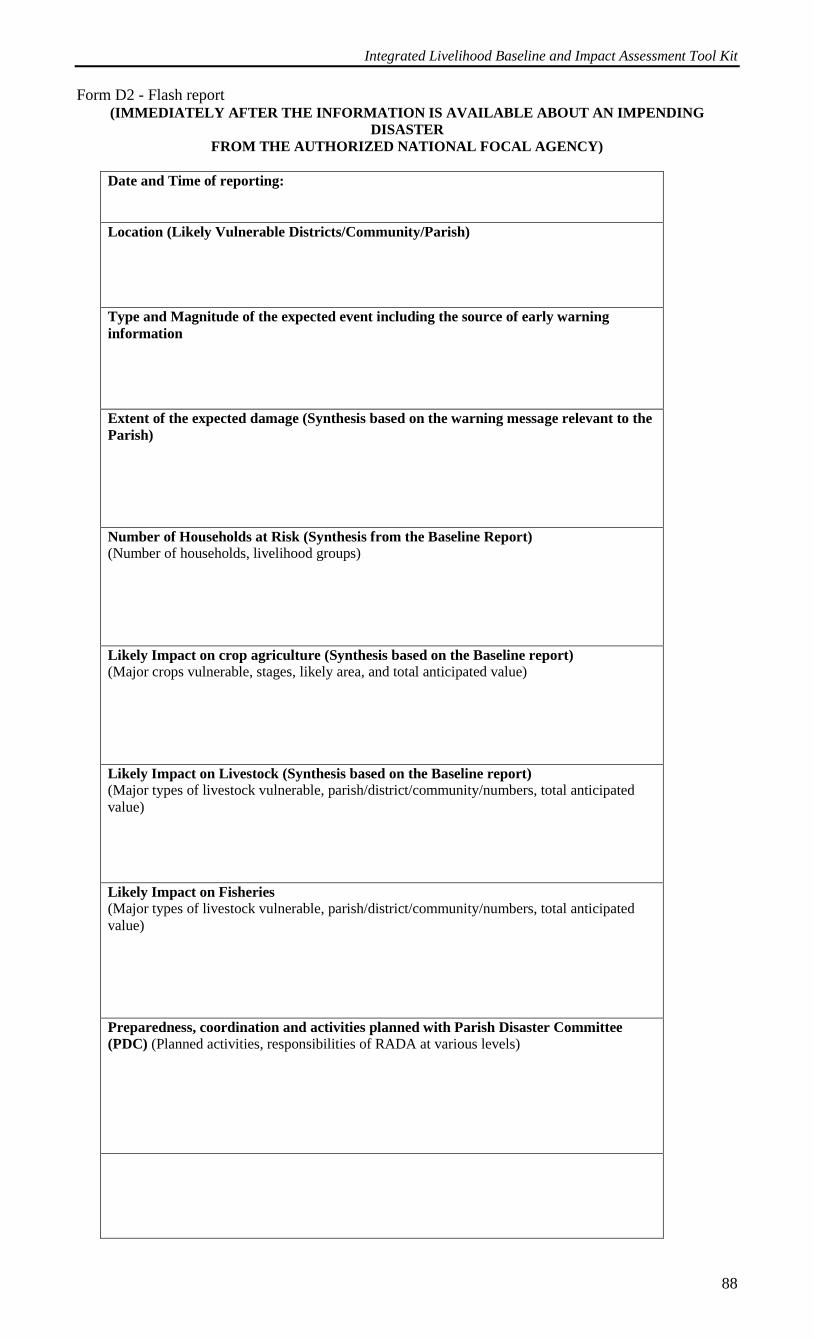
Integrated Livelihood Baseline and Impact Assessment Tool Kit
88
Form D2 - Flash report (IMMEDIATELY AFTER THE INFORMATION IS AVAILABLE ABOUT AN IMPENDING
DISASTER
FROM THE AUTHORIZED NATIONAL FOCAL AGENCY)
Date and Time of reporting:
Location (Likely Vulnerable Districts/Community/Parish)
Type and Magnitude of the expected event including the source of early warning
information
Extent of the expected damage (Synthesis based on the warning message relevant to the
Parish)
Number of Households at Risk (Synthesis from the Baseline Report)
(Number of households, livelihood groups)
Likely Impact on crop agriculture (Synthesis based on the Baseline report)
(Major crops vulnerable, stages, likely area, and total anticipated value)
Likely Impact on Livestock (Synthesis based on the Baseline report)
(Major types of livestock vulnerable, parish/district/community/numbers, total anticipated
value)
Likely Impact on Fisheries
(Major types of livestock vulnerable, parish/district/community/numbers, total anticipated
value)
Preparedness, coordination and activities planned with Parish Disaster Committee
(PDC) (Planned activities, responsibilities of RADA at various levels)
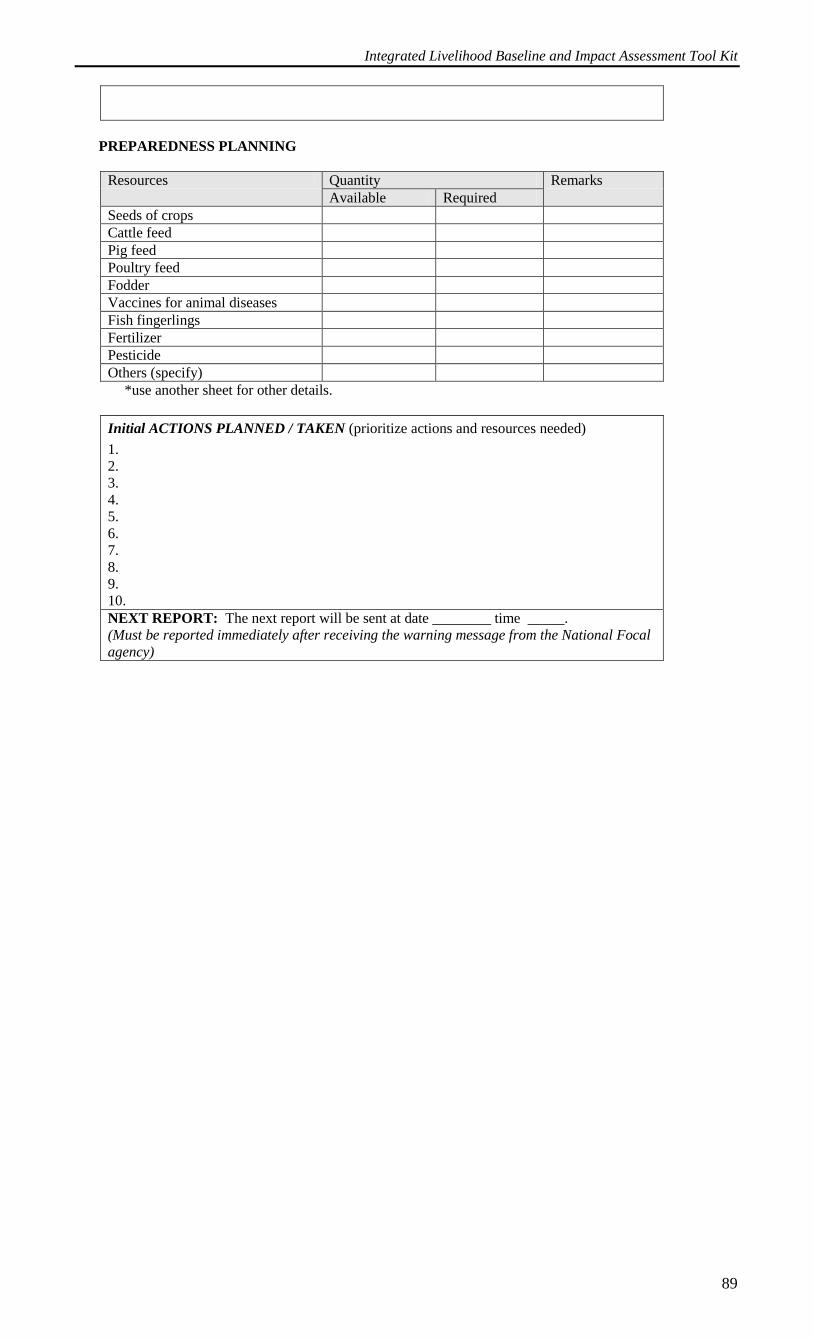
Integrated Livelihood Baseline and Impact Assessment Tool Kit
89
PREPAREDNESS PLANNING
Resources Quantity Remarks
Available Required
Seeds of crops
Cattle feed
Pig feed
Poultry feed
Fodder
Vaccines for animal diseases
Fish fingerlings
Fertilizer
Pesticide
Others (specify)
*use another sheet for other details.
Initial ACTIONS PLANNED / TAKEN (prioritize actions and resources needed)
1.
2.
3.
4.
5.
6.
7.
8.
9.
10.
NEXT REPORT: The next report will be sent at date ________ time _____.
(Must be reported immediately after receiving the warning message from the National Focal
agency)
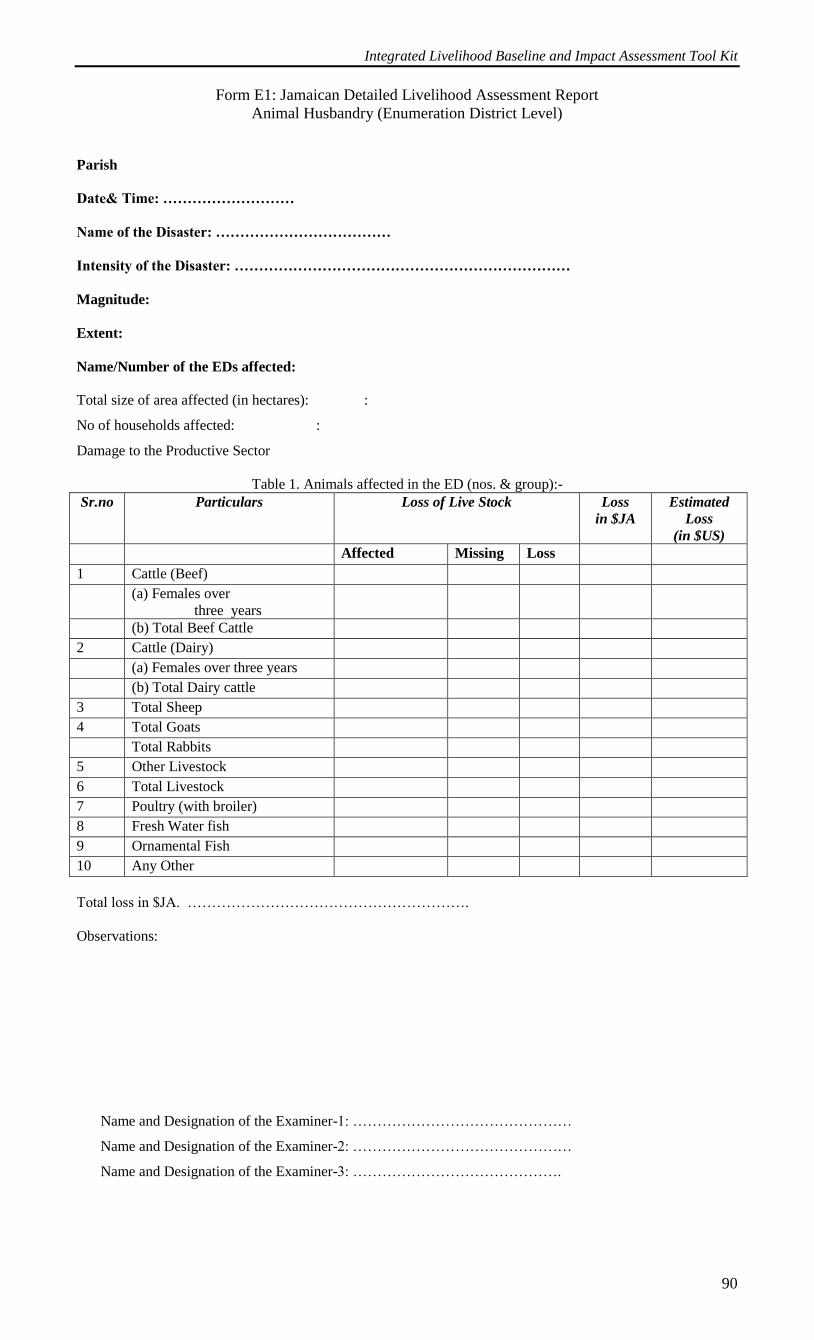
Integrated Livelihood Baseline and Impact Assessment Tool Kit
90
Form E1: Jamaican Detailed Livelihood Assessment Report
Animal Husbandry (Enumeration District Level)
Parish
Date& Time: ………………………
Name of the Disaster: ………………………………
Intensity of the Disaster: ……………………………………………………………
Magnitude:
Extent:
Name/Number of the EDs affected:
Total size of area affected (in hectares): :
No of households affected: :
Damage to the Productive Sector
Table 1. Animals affected in the ED (nos. & group):-
Sr.no Particulars Loss of Live Stock Loss
in $JA
Estimated
Loss
(in $US)
Affected Missing Loss
1 Cattle (Beef)
(a) Females over
three years
(b) Total Beef Cattle
2 Cattle (Dairy)
(a) Females over three years
(b) Total Dairy cattle
3 Total Sheep
4 Total Goats
Total Rabbits
5 Other Livestock
6 Total Livestock
7 Poultry (with broiler)
8 Fresh Water fish
9 Ornamental Fish
10 Any Other
Total loss in $JA. ………………………………………………….
Observations:
Name and Designation of the Examiner-1: ………………………………………
Name and Designation of the Examiner-2: ………………………………………
Name and Designation of the Examiner-3: …………………………………….

Integrated Livelihood Baseline and Impact Assessment Tool Kit
91
Animal Husbandry (Community/Special Level)
Community & Special Areas included:
Parish
Date& Time : ……………………… Name of the Disaster : …………….
Intensity of the Disaster :………………………………………………………………….
Name of the Community/Special Area: ………………
Sr.
No
Name
of
Owner
Loss of
Animals
Medical assistance given to the
Animals
Loss
Vaccina
tion
Primary
Treatment
Replaceme
nt cost
No of
animals
Missing
Animals
Cost of
treatmen
t
Estimated
value
($JA.)
Observations:
Name and Designation of the Examiner-1:……………………………………………………
Name and Designation of the Examiner-2:…………………………………………………
Name and Designation of the Examiner-3:……………………………………………………
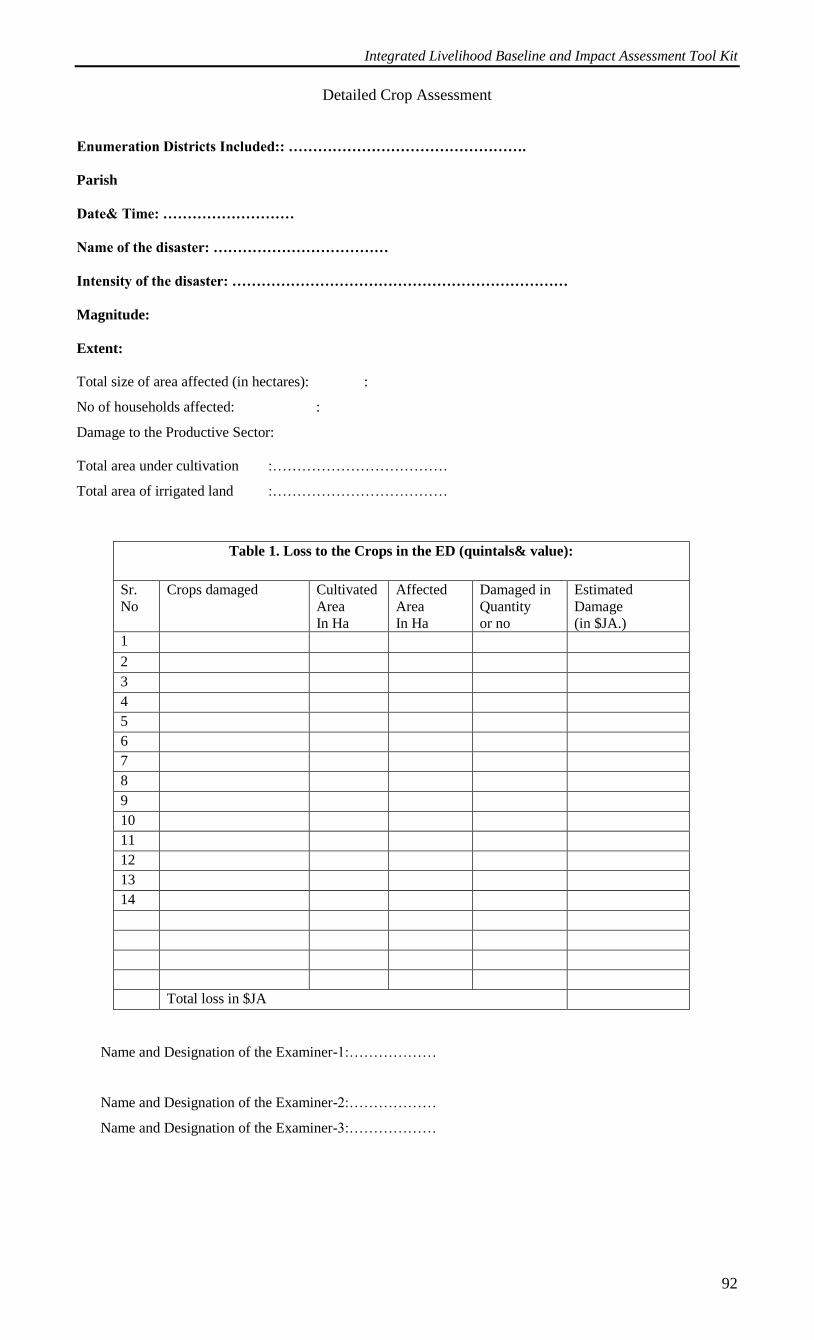
Integrated Livelihood Baseline and Impact Assessment Tool Kit
92
Detailed Crop Assessment
Enumeration Districts Included:: ………………………………………….
Parish
Date& Time: ………………………
Name of the disaster: ………………………………
Intensity of the disaster: ……………………………………………………………
Magnitude:
Extent:
Total size of area affected (in hectares): :
No of households affected: :
Damage to the Productive Sector:
Total area under cultivation :………………………………
Total area of irrigated land :………………………………
Table 1. Loss to the Crops in the ED (quintals& value):
Sr.
No
Crops damaged Cultivated
Area
In Ha
Affected
Area
In Ha
Damaged in
Quantity
or no
Estimated
Damage
(in $JA.)
1
2
3
4
5
6
7
8
9
10
11
12
13
14
Total loss in $JA
Name and Designation of the Examiner-1:………………
Name and Designation of the Examiner-2:………………
Name and Designation of the Examiner-3:………………
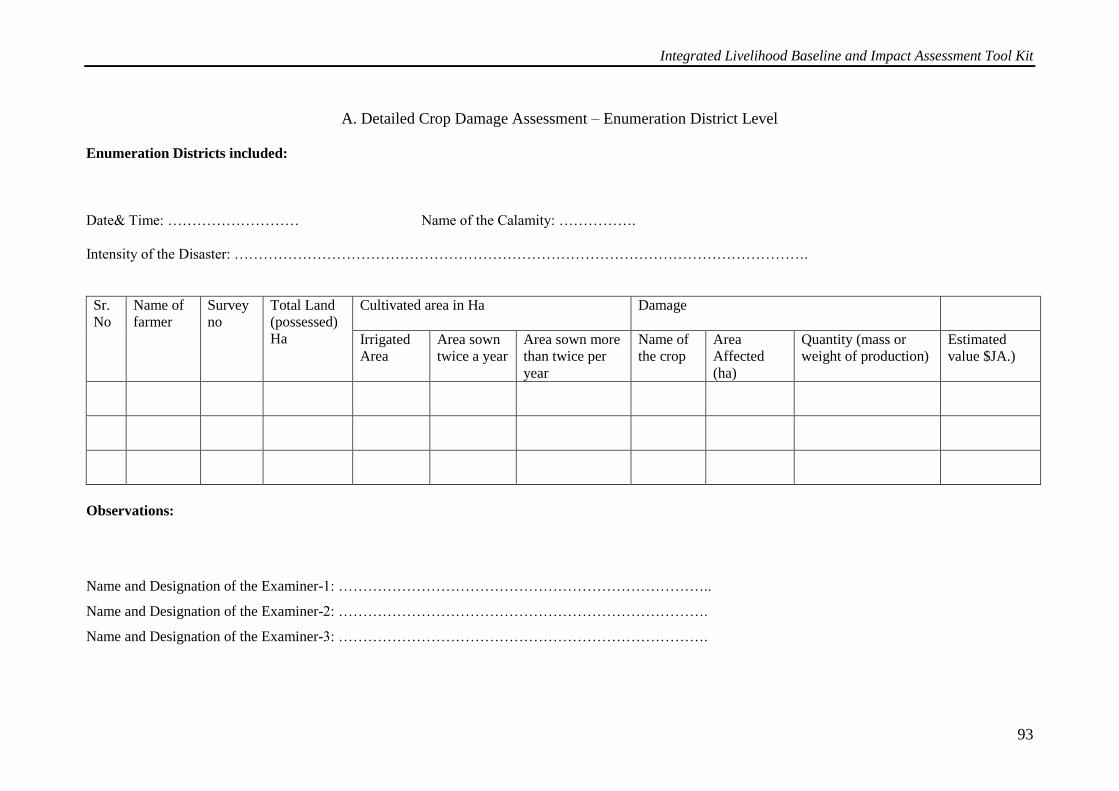
Integrated Livelihood Baseline and Impact Assessment Tool Kit
93
A. Detailed Crop Damage Assessment – Enumeration District Level
Enumeration Districts included:
Date& Time: ……………………… Name of the Calamity: …………….
Intensity of the Disaster: ……………………………………………………………………………………………………….
Sr.
No
Name of
farmer
Survey
no
Total Land
(possessed)
Ha
Cultivated area in Ha Damage
Irrigated
Area
Area sown
twice a year
Area sown more
than twice per
year
Name of
the crop
Area
Affected
(ha)
Quantity (mass or
weight of production)
Estimated
value $JA.)
Observations:
Name and Designation of the Examiner-1: …………………………………………………………………..
Name and Designation of the Examiner-2: ………………………………………………………………….
Name and Designation of the Examiner-3: ………………………………………………………………….
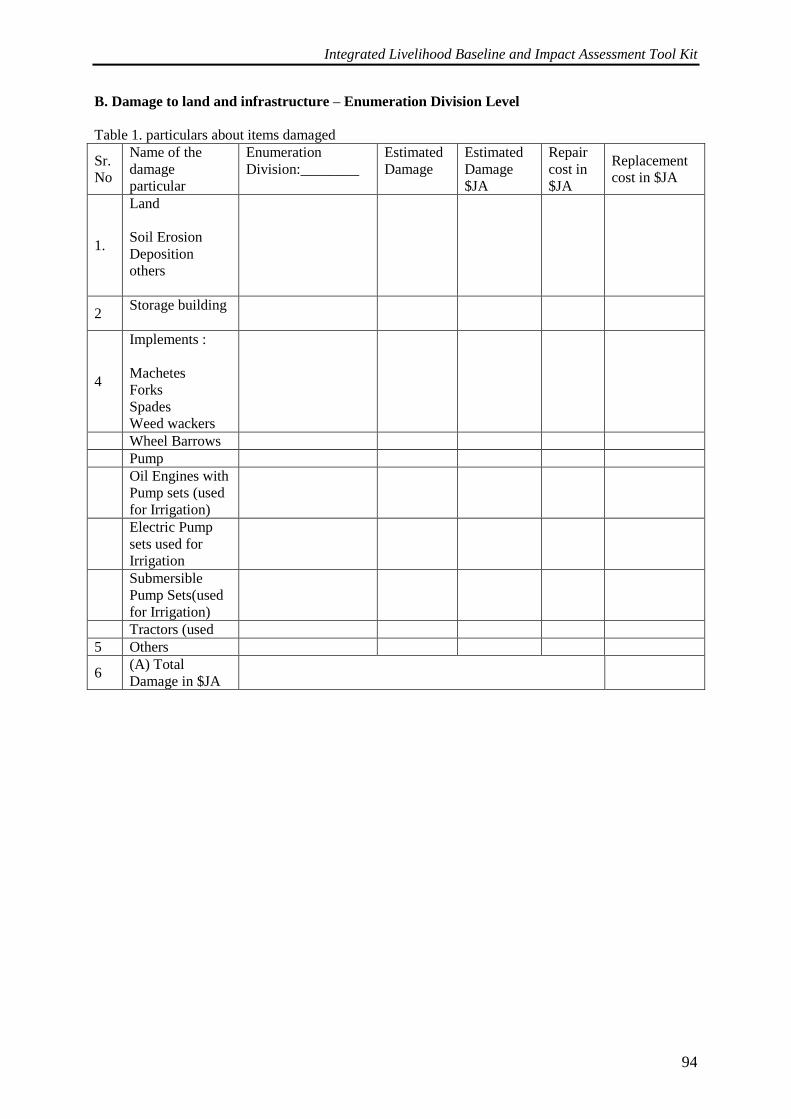
Integrated Livelihood Baseline and Impact Assessment Tool Kit
94
B. Damage to land and infrastructure – Enumeration Division Level
Table 1. particulars about items damaged
Sr.
No
Name of the
damage
particular
Enumeration
Division:________
Estimated
Damage
Estimated
Damage
$JA
Repair
cost in
$JA
Replacement
cost in $JA
1.
Land
Soil Erosion
Deposition
others
2 Storage building
4
Implements :
Machetes
Forks
Spades
Weed wackers
Wheel Barrows
Pump
Oil Engines with
Pump sets (used
for Irrigation)
Electric Pump
sets used for
Irrigation
Submersible
Pump Sets(used
for Irrigation)
Tractors (used
5 Others
6 (A) Total
Damage in $JA
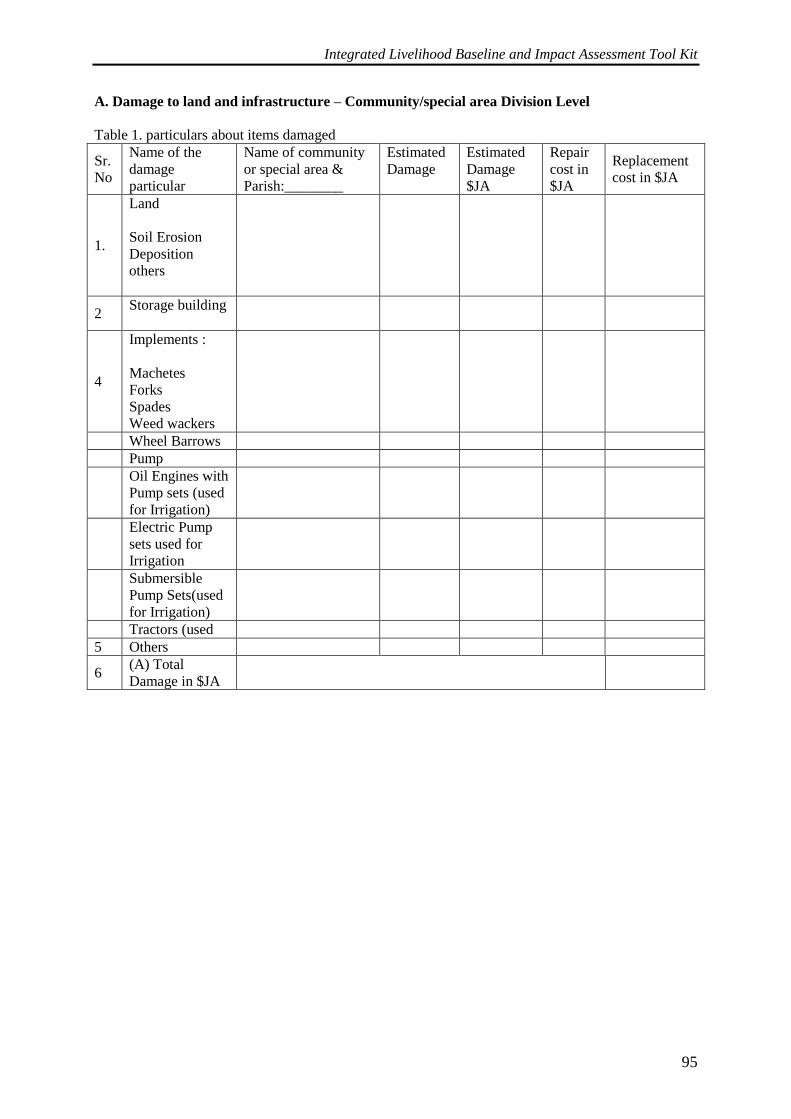
Integrated Livelihood Baseline and Impact Assessment Tool Kit
95
A. Damage to land and infrastructure – Community/special area Division Level
Table 1. particulars about items damaged
Sr.
No
Name of the
damage
particular
Name of community
or special area &
Parish:________
Estimated
Damage
Estimated
Damage
$JA
Repair
cost in
$JA
Replacement
cost in $JA
1.
Land
Soil Erosion
Deposition
others
2 Storage building
4
Implements :
Machetes
Forks
Spades
Weed wackers
Wheel Barrows
Pump
Oil Engines with
Pump sets (used
for Irrigation)
Electric Pump
sets used for
Irrigation
Submersible
Pump Sets(used
for Irrigation)
Tractors (used
5 Others
6 (A) Total
Damage in $JA
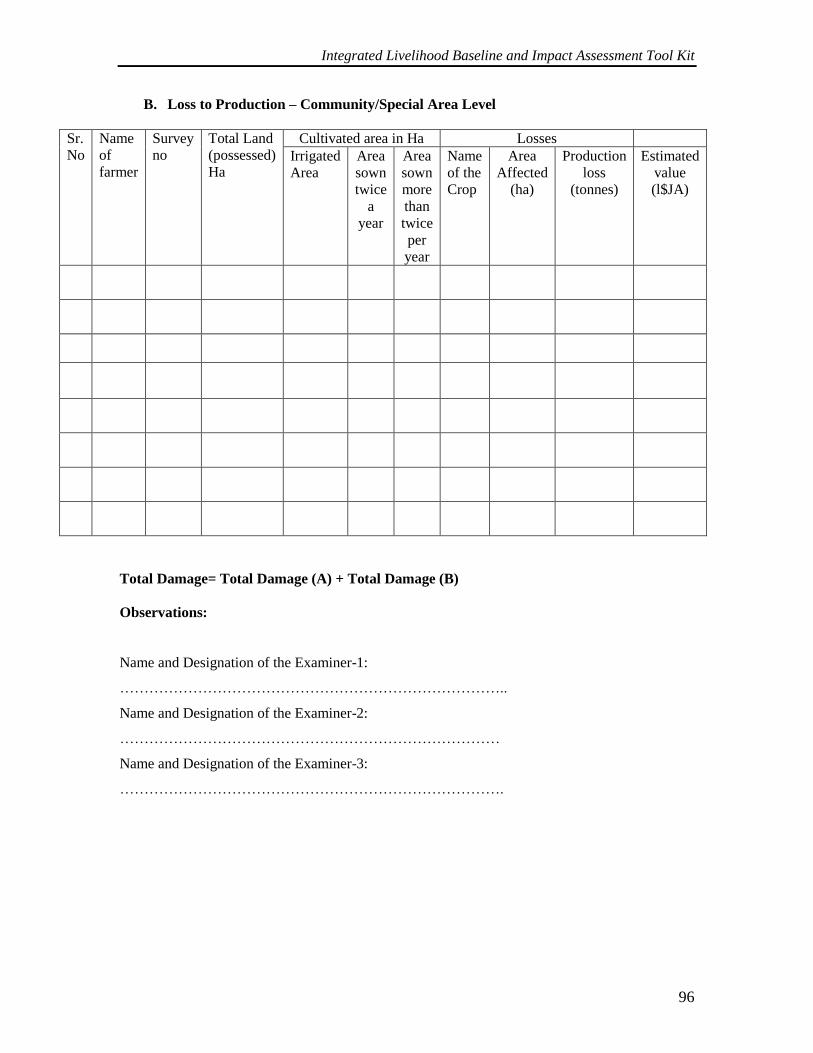
Integrated Livelihood Baseline and Impact Assessment Tool Kit
96
B. Loss to Production – Community/Special Area Level
Sr.
No
Name
of
farmer
Survey
no
Total Land
(possessed)
Ha
Cultivated area in Ha Losses
Irrigated
Area
Area
sown
twice
a
year
Area
sown
more
than
twice
per
year
Name
of the
Crop
Area
Affected
(ha)
Production
loss
(tonnes)
Estimated
value
(l$JA)
Total Damage= Total Damage (A) + Total Damage (B)
Observations:
Name and Designation of the Examiner-1:
……………………………………………………………………..
Name and Designation of the Examiner-2:
……………………………………………………………………
Name and Designation of the Examiner-3:
…………………………………………………………………….
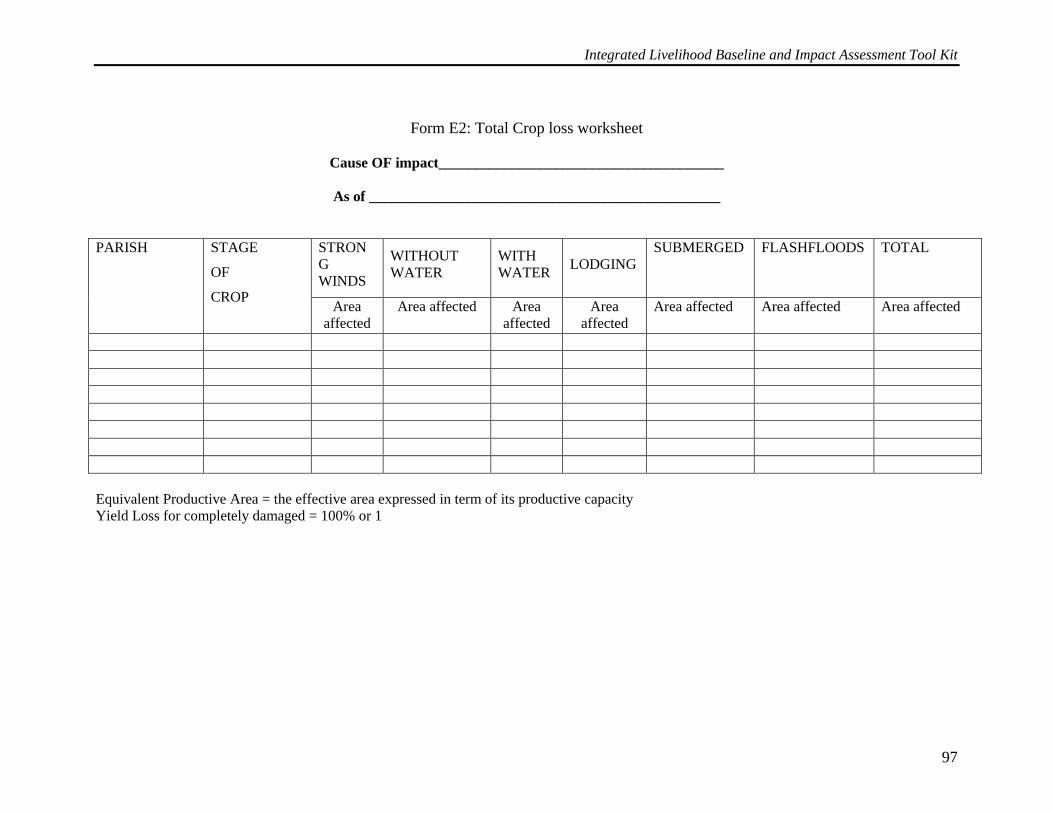
Integrated Livelihood Baseline and Impact Assessment Tool Kit
97
Form E2: Total Crop loss worksheet
Cause OF impact_______________________________________
As of ________________________________________________
PARISH STAGE
OF
CROP
STRON
G
WINDS
WITHOUT
WATER
WITH
WATER LODGING
SUBMERGED FLASHFLOODS TOTAL
Area
affected
Area affected Area
affected
Area
affected
Area affected Area affected Area affected
Equivalent Productive Area = the effective area expressed in term of its productive capacity
Yield Loss for completely damaged = 100% or 1
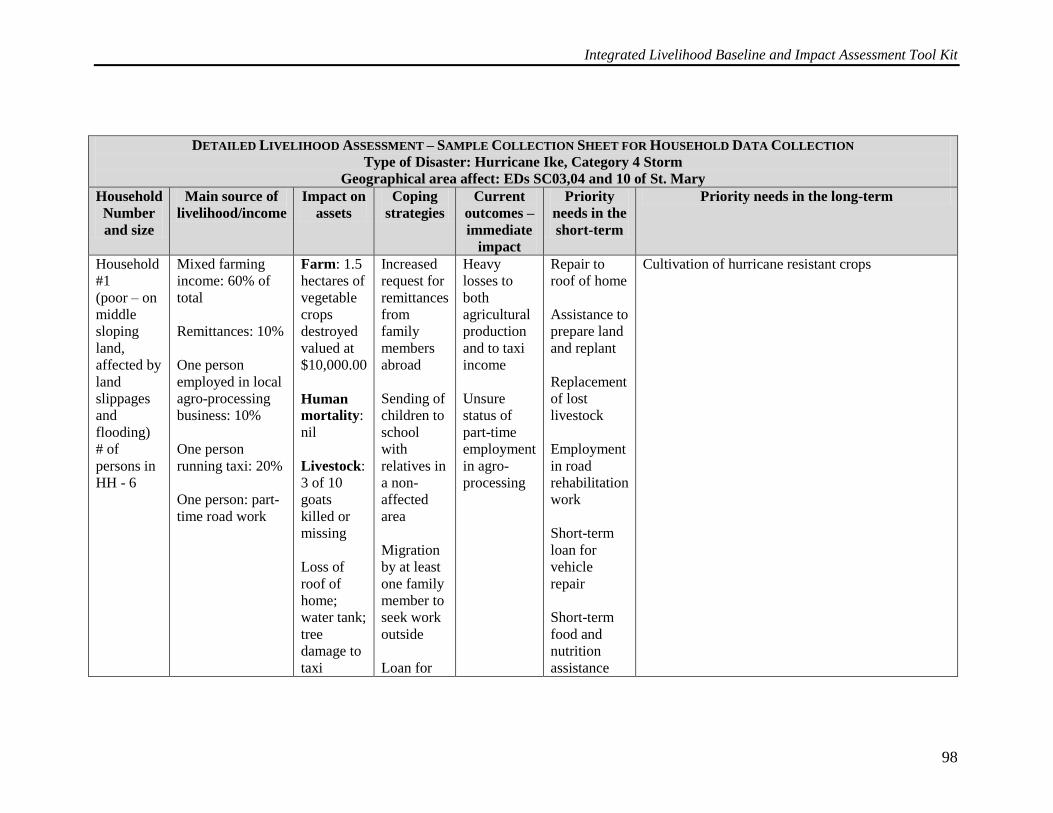
Integrated Livelihood Baseline and Impact Assessment Tool Kit
98
DETAILED LIVELIHOOD ASSESSMENT – SAMPLE COLLECTION SHEET FOR HOUSEHOLD DATA COLLECTION
Type of Disaster: Hurricane Ike, Category 4 Storm
Geographical area affect: EDs SC03,04 and 10 of St. Mary
Household
Number
and size
Main source of
livelihood/income
Impact on
assets
Coping
strategies
Current
outcomes –
immediate
impact
Priority
needs in the
short-term
Priority needs in the long-term
Household
#1
(poor – on
middle
sloping
land,
affected by
land
slippages
and
flooding)
# of
persons in
HH - 6
Mixed farming
income: 60% of
total
Remittances: 10%
One person
employed in local
agro-processing
business: 10%
One person
running taxi: 20%
One person: part-
time road work
Farm: 1.5
hectares of
vegetable
crops
destroyed
valued at
$10,000.00
Human
mortality:
nil
Livestock:
3 of 10
goats
killed or
missing
Loss of
roof of
home;
water tank;
tree
damage to
taxi
Increased
request for
remittances
from
family
members
abroad
Sending of
children to
school
with
relatives in
a non-
affected
area
Migration
by at least
one family
member to
seek work
outside
Loan for
Heavy
losses to
both
agricultural
production
and to taxi
income
Unsure
status of
part-time
employment
in agro-
processing
Repair to
roof of home
Assistance to
prepare land
and replant
Replacement
of lost
livestock
Employment
in road
rehabilitation
work
Short-term
loan for
vehicle
repair
Short-term
food and
nutrition
assistance
Cultivation of hurricane resistant crops
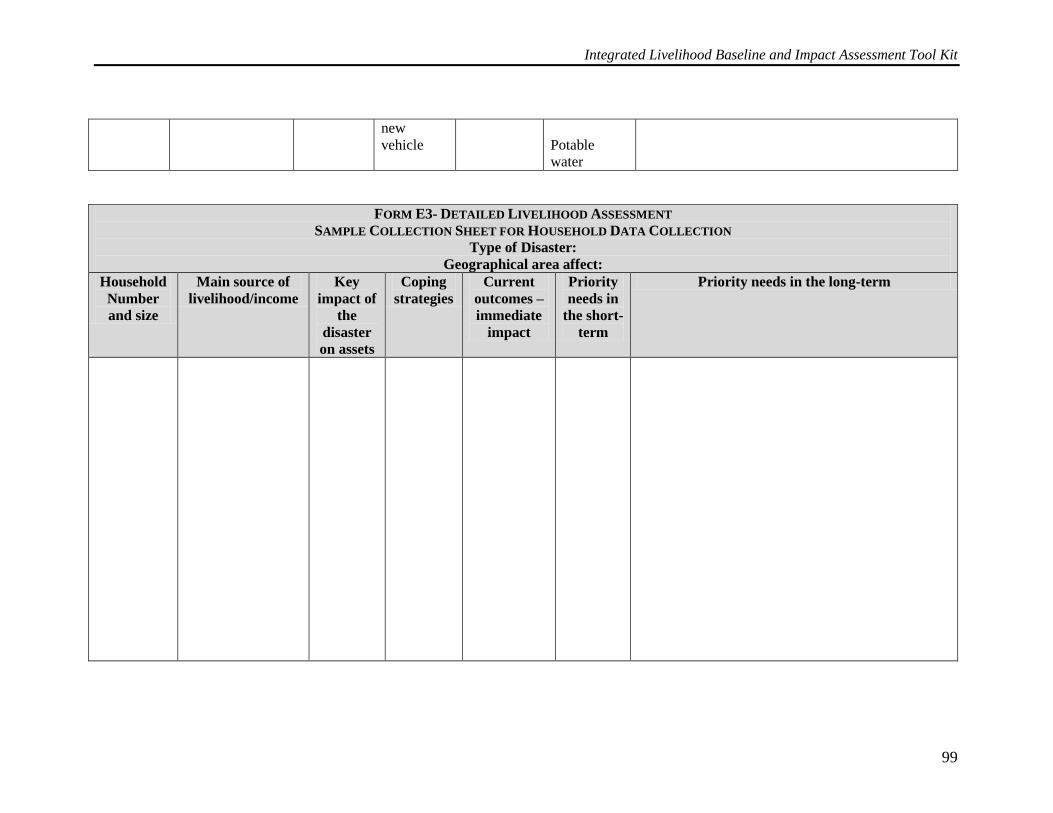
Integrated Livelihood Baseline and Impact Assessment Tool Kit
99
new
vehicle
Potable
water
FORM E3- DETAILED LIVELIHOOD ASSESSMENT
SAMPLE COLLECTION SHEET FOR HOUSEHOLD DATA COLLECTION
Type of Disaster:
Geographical area affect:
Household
Number
and size
Main source of
livelihood/income
Key
impact of
the
disaster
on assets
Coping
strategies
Current
outcomes –
immediate
impact
Priority
needs in
the short-
term
Priority needs in the long-term