intangible capital and labour productivity growth: a ... · whereas labour productivity growth...
TRANSCRIPT
GLOBALINTO Capturing the value of intangible assets in micro data to promote the EU’s Growth and Competitiveness
This project has received funding from the European Union’s Horizon 2020 programme for the GLOBALINTO project (Capturing the value of intangible assets in micro data to promote the EU’s growth and competitiveness, contract number 822259)).
Deliverable 2.1
Intangible Capital and Labour Productivity
Growth: A Review of the Literature
Due date of deliverable: 31.10.2019
Actual submission date: 30.11.2019
GLOBALINTO Identifier: WP2 Setting the conceptual framework for processing new data and value chains
Author(s) and company: Felix Roth (University of Hamburg)
Work package/deliverable: WP2 / D2.1 A working paper on defining key concepts for intangible assets and productivity
Document status: draft / final
Confidentiality: confidential / restricted / public
1
Intangible Capital and Labour Productivity
Growth: A Review of the Literature
Felix Roth*
Department of Economics, University of Hamburg, Hamburg
Abstract. This paper surveys a wide range of studies on the impact of capital investment in intangible
assets on labour productivity growth and highlights their main findings on. Surveying the literature
at the country, industry and firm level, this paper finds evidence of the increasing importance of
business investment in intangible assets in explaining the dynamics of labour productivity growth.
Moreover, the findings reported in the literature surveyed suggest that in order to fully reap the
benefits of investment in information and communication technology (ICT) and artificial intelligence
(AI), it is essential for businesses to make complementary investment in intangible assets. In addition,
the literature on the drivers of business capital investment in intangibles highlights the importance of
having in place a well-endowed infrastructure of public intangibles. Judging from the wide range of
economic literature surveyed, this paper finds that the contemporary economic debate now broadly
acknowledges the importance of intangibles for the transformation of developed economies towards
becoming fully-fledged knowledge economies.
Keywords. Intangible Capital, Labour Productivity Growth, Total Factor Productivity Growth,
Information and Communication Technology, Artificial Intelligence, European Union
1. Introduction
Labour productivity growth is one of the main contributors to an economy’s competitiveness
(Krugman, 1994) and rising prosperity (Heil, 2018). This applies to the country, industry and
firm level. The key concept of labour productivity growth can be defined as the ability of an
economy to increase its output per hours worked by a more efficient usage of a given level of
production inputs, such as tangible and intangible capital. The residual productivity component
within the production input factors is called total factor productivity (TFP). TFP reflects the
overall level of technology and other efficiency factors found in the realm of public intangibles,
such as the quantity and quality of a high-skilled labour force, well-functioning formal and
informal institutions and a well-designed policy framework. Differences in TFP explain a large
fraction of variance in the income and wealth disparities across countries (Hall and Jones, 1999;
World Bank, 2006), industries (Van Ark et al., 2008) and firms (Syverson, 2011). When
modelled as a Cobb-Douglass production function, labour productivity growth takes the
following form: 𝑞𝑖,𝑡 = 𝐴𝑖,𝑡𝑘𝑖,𝑡𝛼 𝑟𝑖,𝑡
𝛽𝜀𝑖,𝑡 where 𝑞 is labour productivity growth, 𝐴 is TFP, 𝑘 is
tangible capital deepening, 𝑟 is intangible capital deepening and ɛ is the error term in country i
at time t.
Recent research reports a disappointing performance in labour productivity growth among
OECD countries in the midst the ongoing revolution in ICT and AI (OECD, 2015). This is
partly due to mismeasurement of business intangibles in the official national accounting
framework, as highlighted by Corrado, Hulten and Sichel (hereafter CHS) (2005, 2009).
Mismeasurement, however, is not the only key to explaining the decline in labour productivity
* Corresponding author contact email: [email protected]. The author wishes to thank Simone Caliò and
Lukas Hofmann for excellent research assistance. Moreover, Dr. Roth is grateful for a grant received from the
European Commission under the Horizon 2020 programme for the GLOBALINTO project (Capturing the value
of intangible assets in micro data to promote the EU’s growth and competitiveness, contract number 822259).
2
growth (Syverson, 2017; Haskel and Westlake, 2018b). Three recent prominent contributions
have highlighted the contextual role of a decline in TFP in relation to the level of business
investments in intangibles.
First, Van Ark and O’Mahony, as well as Bounfour and Miyagawa argue that the decline in
labour productivity and TFP growth stems largely from a slower diffusion of technology and
innovation due to low growth rates of investments in ICT and complementary intangibles
(Bounfour and Miyagawa 2015; Van Ark and Jäger, 2017; Van Ark, 2016; Van Ark and
O’Mahony 2016). Second, Haskel and Westlake (2018a, b) highlight a reduction in the spill-
over effects of intangibles on TFP due to the widening gap of intangible investment between
leader and laggard firms. Third, Brynjolfson et al. (2017) argue that more investment in
complementary intangibles are needed to reap the full labour productivity growth benefits from
AI.
But does the existing literature support such claims of a pivotal role played by business
intangibles in labour productivity growth? Precisely what is the impact of business intangibles
on labour productivity growth? Although there exists a broad range of surveys on productivity
growth in general (Syverson, 2011) and on single business intangible capital dimensions, such
as R&D (Belz et al., 2016; Heil, 2018; Zuñiga-Vicente et al., 2012, there exists no individual
survey on the impact of investment in intangible assets on labour productivity growth. This gap
in the research is acknowledged by the existing surveys on labour productivity growth
(Syverson, 2011, p. 341; Heil, 2018, p. 1361). With the aim of closing this gap, this contribution
surveys the existing empirical evidence of the impact of capital investment by business in
intangible assets on labour productivity growth with respect to five distinct aspects of the
literature. It surveys studies that analyse: i) the country level, ii) the industry level, iii) the firm
level, iv) complementarity investments and spillover effects and v) drivers of business
intangibles.
The paper is structured in the following manner. Section 2 offers the most recent evidence
concerning the decline in labour productivity growth across OECD countries. Section 3
identifies the methodological framework of the paper. Section 4 discusses the CHS approach in
light of the existing business and economics literature. Section 5 surveys the literature on
intangible capital and labour productivity growth with respect to the five distinct aspects.
Section 6 concludes by discussing the implications and offering an outlook.
2. Declining Labour Productivity Growth
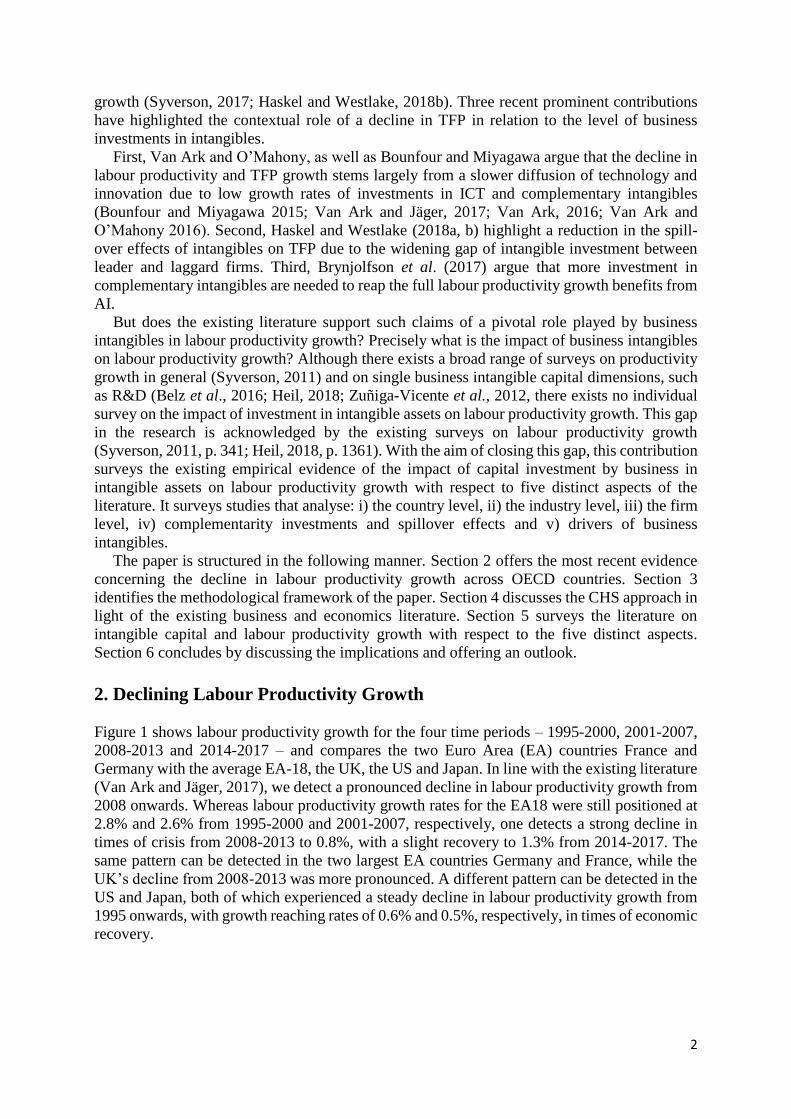
Figure 1 shows labour productivity growth for the four time periods – 1995-2000, 2001-2007,
2008-2013 and 2014-2017 – and compares the two Euro Area (EA) countries France and
Germany with the average EA-18, the UK, the US and Japan. In line with the existing literature
(Van Ark and Jäger, 2017), we detect a pronounced decline in labour productivity growth from
2008 onwards. Whereas labour productivity growth rates for the EA18 were still positioned at
2.8% and 2.6% from 1995-2000 and 2001-2007, respectively, one detects a strong decline in
times of crisis from 2008-2013 to 0.8%, with a slight recovery to 1.3% from 2014-2017. The
same pattern can be detected in the two largest EA countries Germany and France, while the
UK’s decline from 2008-2013 was more pronounced. A different pattern can be detected in the
US and Japan, both of which experienced a steady decline in labour productivity growth from
1995 onwards, with growth reaching rates of 0.6% and 0.5%, respectively, in times of economic
recovery.
3
Figure 1. Labour Productivity Growth, EA, UK, US and Japan, 1995-2017. Note: EA-18 uses a simple average, comprising all the 19 Euro Area countries except Malta.
Source: Own estimation based on EUKLEMS database (Stehrer et al., 2019).
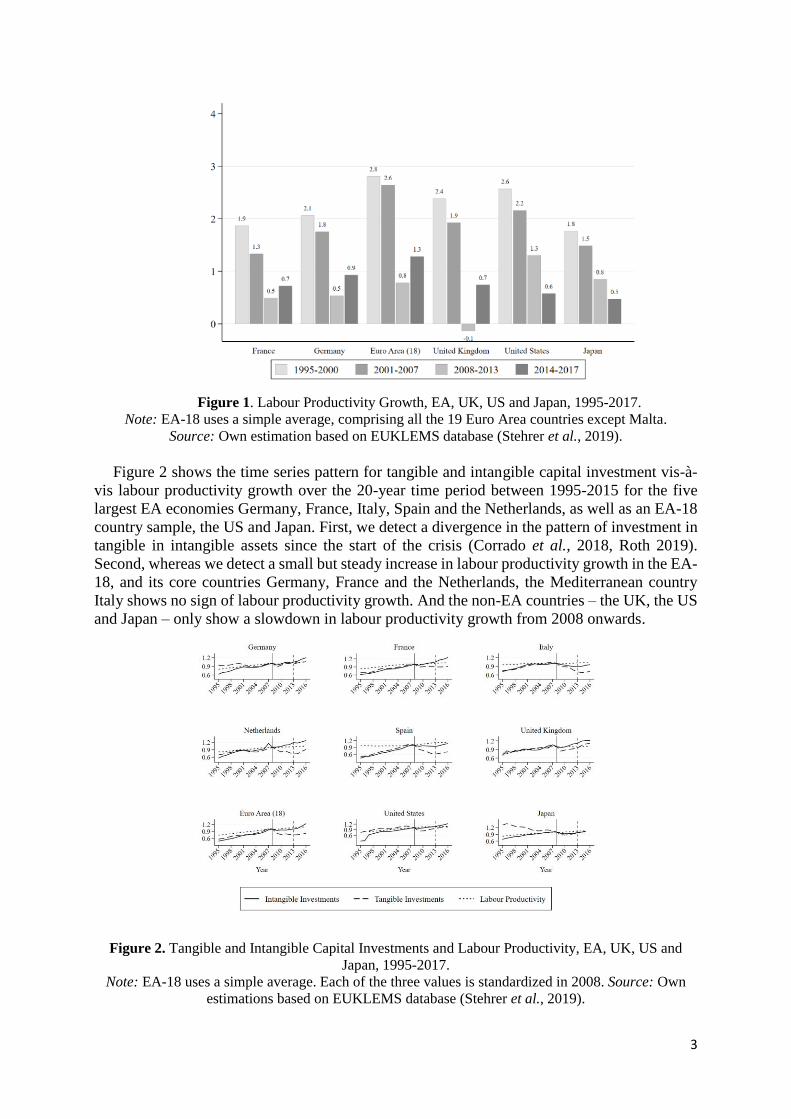
Figure 2 shows the time series pattern for tangible and intangible capital investment vis-à-
vis labour productivity growth over the 20-year time period between 1995-2015 for the five
largest EA economies Germany, France, Italy, Spain and the Netherlands, as well as an EA-18
country sample, the US and Japan. First, we detect a divergence in the pattern of investment in
tangible in intangible assets since the start of the crisis (Corrado et al., 2018, Roth 2019).
Second, whereas we detect a small but steady increase in labour productivity growth in the EA-
18, and its core countries Germany, France and the Netherlands, the Mediterranean country
Italy shows no sign of labour productivity growth. And the non-EA countries – the UK, the US
and Japan – only show a slowdown in labour productivity growth from 2008 onwards.
Figure 2. Tangible and Intangible Capital Investments and Labour Productivity, EA, UK, US and
Japan, 1995-2017.
Note: EA-18 uses a simple average. Each of the three values is standardized in 2008. Source: Own
estimations based on EUKLEMS database (Stehrer et al., 2019).
4
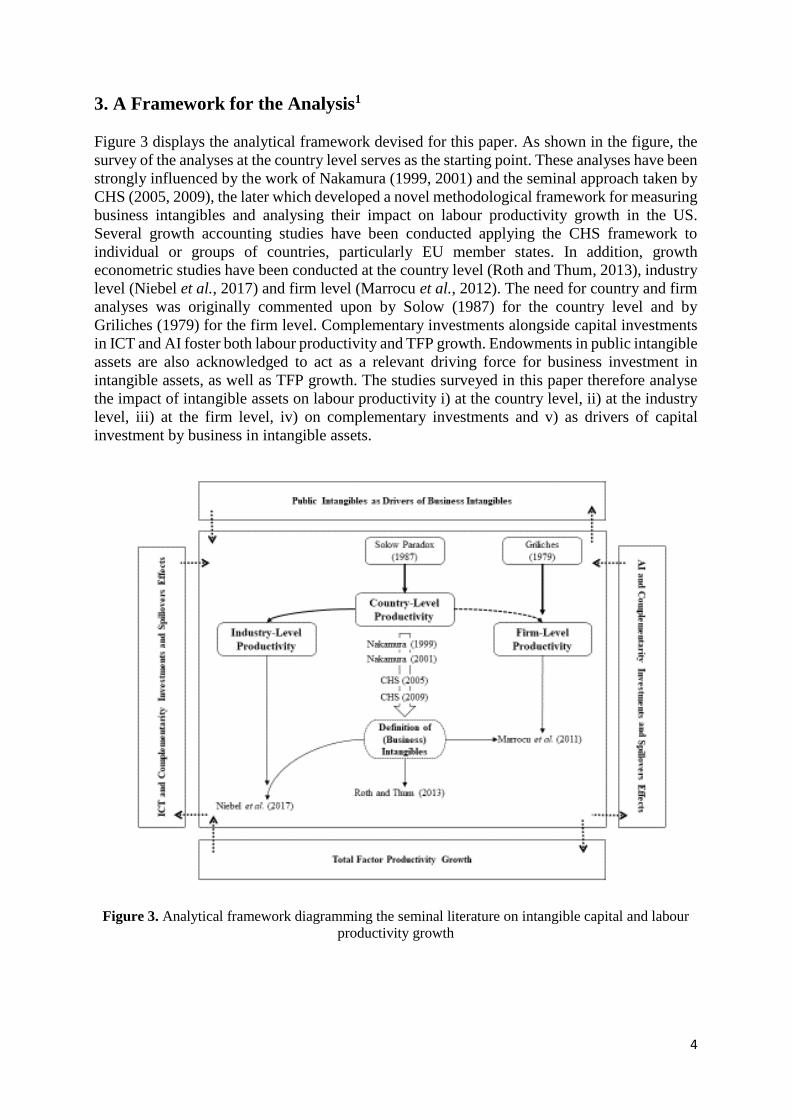
3. A Framework for the Analysis1
Figure 3 displays the analytical framework devised for this paper. As shown in the figure, the
survey of the analyses at the country level serves as the starting point. These analyses have been
strongly influenced by the work of Nakamura (1999, 2001) and the seminal approach taken by
CHS (2005, 2009), the later which developed a novel methodological framework for measuring
business intangibles and analysing their impact on labour productivity growth in the US.
Several growth accounting studies have been conducted applying the CHS framework to
individual or groups of countries, particularly EU member states. In addition, growth
econometric studies have been conducted at the country level (Roth and Thum, 2013), industry
level (Niebel et al., 2017) and firm level (Marrocu et al., 2012). The need for country and firm
analyses was originally commented upon by Solow (1987) for the country level and by
Griliches (1979) for the firm level. Complementary investments alongside capital investments
in ICT and AI foster both labour productivity and TFP growth. Endowments in public intangible
assets are also acknowledged to act as a relevant driving force for business investment in
intangible assets, as well as TFP growth. The studies surveyed in this paper therefore analyse
the impact of intangible assets on labour productivity i) at the country level, ii) at the industry
level, iii) at the firm level, iv) on complementary investments and v) as drivers of capital
investment by business in intangible assets.
Figure 3. Analytical framework diagramming the seminal literature on intangible capital and labour
productivity growth
5
4. Business Intangible Capital and the CHS Approach
4.1 Business Literature
Long before the economics literature turned its attention to the importance of investment in
intangible assets to achieve labour productivity growth and firm competitiveness, the question
had already been the focus of many influential studies in the business literature (see e.g. Teece,
1998; Webster, 2000; Lev and Radhakrishnan, 2003 and 2005; Cummins, 2005). A
comprehensive review of the business literature has been conducted by Cañibano et al. (2000).
Within their survey, Cañibano et al. (2000) stress the importance of economic competencies for
firms, here in particular the importance to adopt a reliable and trustworthy brand name and to
acquire adequate levels of firm-specific human capital. The former, according to Cañibano et
al. (2000), is a pivotal asset for extracting higher profit margins from competitive markets.
Firm-specific human capital, measured as the share of high-skilled workers within a firm, is
also a key asset for establishing a competitive advantage in the market and, thus, earning larger
profits (see also Abowd et al., 2005). Lev and Radhakrishnan (2005, p. 75) enrich the discussion
on single components of economic competencies by presenting the importance of
organizational capital for modern firms, defined as “an agglomeration of technologies –
business practices, processes and designs and incentive and compensation systems – that
together enable some firms to consistently and efficiently extract from a given level of physical
and human resources a higher value of product than other firms find possible to attain”. The
studies cited above- testify to the long-established acknowledgment of the importance of
intangible investments for firms competing in modern economies within the business literature,
well before the concept of business intangibles entered the scientific debate in the economics
field.
4.2 Origins of the thought in economics
Within the economics discipline, Griliches (1981, p.183) was amongst the first to use the term
“intangible capital”, intended to mean a broad “stock of knowledge” approximated by R&D
expenditures and patent applications. Following Griliches (1981), the term “intangible capital”
entered the economics literature to encompass a set of intangible assets that, together,
constitutes the firm’s knowledge stock. The pioneering studies from Brynjolfson and Hitt
(2000) and Brynjolfsson et al. (2002), from the microeconomic perspective, highlighted the
necessity of complementary intangible investments (in particular in skilled workforce and
organizational capital) alongside ICT and software investment to fully reap the benefits in terms
of labour productivity growth.
Within the macroeconomics literature, the academic debate around business intangible
investments was triggered by the famous 1987 quip from Robert Solow (1987) that “we can see
the computer revolution everywhere except in the productivity data”. The efforts at explaining
this paradox led to assessments – and gradually acknowledgements – of the importance of the
business investments in intangible assets from an economics perspective. While most studies
within the macroeconomics field focused on the relationship between R&D and labour
productivity growth (Lichtenberg, 1993; Coe and Helpman, 1995; Park, 1995; Guellec and van
Pottelsberghe de la Potterie, 2001), Nakamura (1999, 2001) represented a pivotal step in more
clearly defining a larger set of intangible investments and estimating, for the first time, the
magnitude of such investments in the US economy.
With reference to this substantial body of previous work, CHS (2005) developed a coherent
framework for business intangibles, which already included capitalized national account
intangible, and identified new intangibles that still needed to be incorporated into the national

6
accounts (NA) framework. In their book contribution, Haskel and Westlake (2018a) present
further arguments supporting the inclusion of the new intangibles into the national accounts.
They also give a brief historical account of the introduction of intangible assets into the
discipline of economics.
4.3 The CHS framework
In 2005, Carol A. Corrado, Charles R. Hulten and Daniel E. Sichel (CHS) developed the first
coherent framework to quantify data on business intangible capital. The three academics
grouped nine items, which constitute the knowledge of the firm, into three broad categories: i)
computerized information, ii) innovative property and iii) economic competencies. CHS (2005,
p. 23) defined computerized information as: “the knowledge embedded in computer programs
and computerized databases”. This category was further subdivided into computer software
and computerised databases. CHS (2005, p. 26) defined the category of innovative property as
“[…] not only the scientific knowledge embedded in patents, licenses and general know-how
(not patented) but also the innovative and artistic content in commercial copyrights, licenses
and designs”. The CHS definition of innovative properties, therefore, explicitly aims at creating
a broader category than simply R&D expenditures, to comprise science and engineering R&D,
mineral exploration, copyright and licensing costs and other product development, design and
research expenses. CHS (2005, p. 28) define the third category, economic competencies, as “the
value of brand names and other knowledge embedded in firm-specific human and structural
resources” and include the following three dimensions: brand names, firm-specific human
capital and organizational structure. CHS (2005) reports US investments in these nine
intangible items as representing some 10-12% of GDP, amounting to annual investments of $1
trillion per year. The precise definition of the nine business intangible items divided into three
categories and the first estimation of their sizable amount in the US economy opened-up the
research field, which is surveyed in the section 5 of this paper. Table 1 gives an overview of
the definitions of business intangibles in the CHS (2005) framework.
Category of intangible assets Definition by CHS (2005) Business intangible item Included in NA
Computerized information
“knowledge embedded in
computer programs and
computerized databases”
(P.23)
Computer software Yes
Computerised database Yes
Innovative property
“not only the scientific
knowledge embedded in
patents, licenses and general
know-how (not patented)
but also the innovative and
artistic content in
commercial copyrights,
licenses and designs” (P.26)
Science and engineering
R&D Yes
Mineral exploration Yes
Copyright and license costs Yes
Other product development,
design and research
expenses
No
(new intangible)
Economic competencies
“the value of brand names
and other knowledge
embedded in firm-specific
human and structural
resources” (P.28)
Brand equity No
(new intangible)
Firm-specific human capital No
(new intangible)
Organizational structure No
(new intangible)
Table 1. Overview of the definitions of business intangible assets in the CHS (2005) framework.
Note: NA=National Account.
Source: Own adaption of CHS (2005).
7
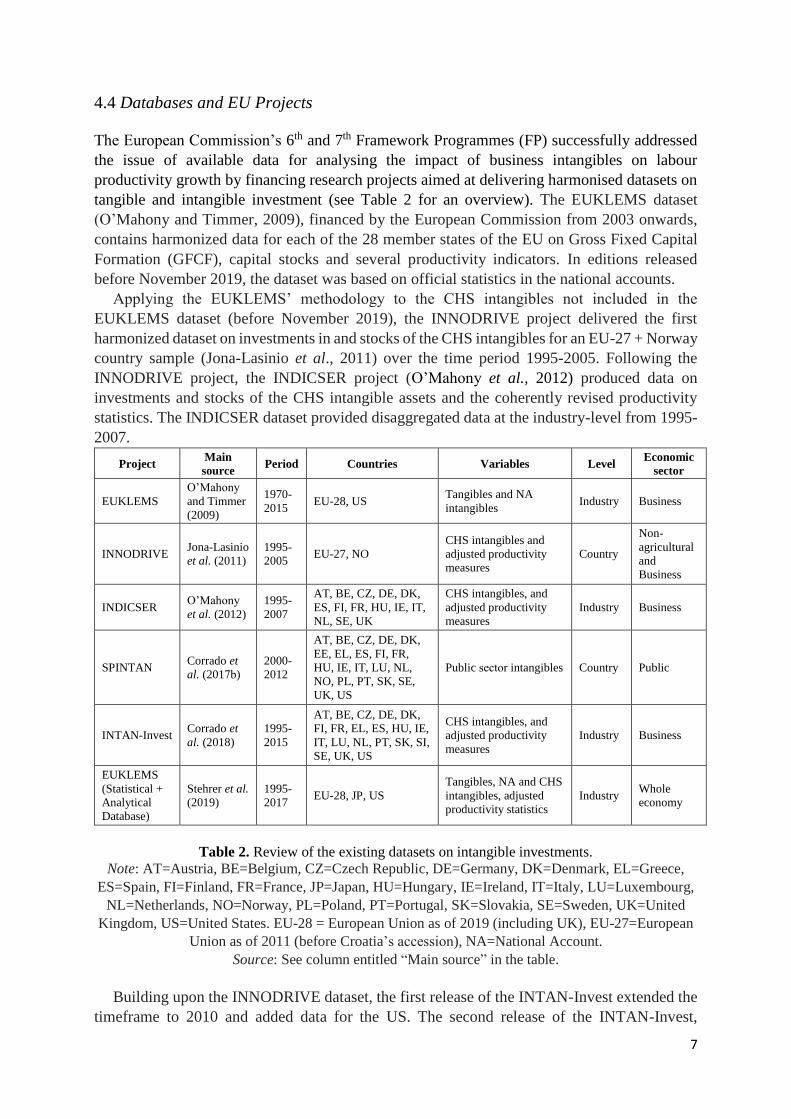
4.4 Databases and EU Projects
The European Commission’s 6th and 7th Framework Programmes (FP) successfully addressed
the issue of available data for analysing the impact of business intangibles on labour
productivity growth by financing research projects aimed at delivering harmonised datasets on
tangible and intangible investment (see Table 2 for an overview). The EUKLEMS dataset
(O’Mahony and Timmer, 2009), financed by the European Commission from 2003 onwards,
contains harmonized data for each of the 28 member states of the EU on Gross Fixed Capital
Formation (GFCF), capital stocks and several productivity indicators. In editions released
before November 2019, the dataset was based on official statistics in the national accounts.
Applying the EUKLEMS’ methodology to the CHS intangibles not included in the
EUKLEMS dataset (before November 2019), the INNODRIVE project delivered the first
harmonized dataset on investments in and stocks of the CHS intangibles for an EU-27 + Norway
country sample (Jona-Lasinio et al., 2011) over the time period 1995-2005. Following the
INNODRIVE project, the INDICSER project (O’Mahony et al., 2012) produced data on
investments and stocks of the CHS intangible assets and the coherently revised productivity
statistics. The INDICSER dataset provided disaggregated data at the industry-level from 1995-
2007.
Project Main
source Period Countries Variables Level
Economic
sector
EUKLEMS
O’Mahony
and Timmer
(2009)
1970-
2015 EU-28, US
Tangibles and NA
intangibles Industry Business
INNODRIVE Jona-Lasinio
et al. (2011)
1995-
2005 EU-27, NO
CHS intangibles and
adjusted productivity
measures
Country
Non-
agricultural
and
Business
INDICSER O’Mahony
et al. (2012)
1995-
2007
AT, BE, CZ, DE, DK,
ES, FI, FR, HU, IE, IT,
NL, SE, UK
CHS intangibles, and
adjusted productivity
measures
Industry Business
SPINTAN Corrado et
al. (2017b)
2000-
2012
AT, BE, CZ, DE, DK,
EE, EL, ES, FI, FR,
HU, IE, IT, LU, NL,
NO, PL, PT, SK, SE,
UK, US
Public sector intangibles Country Public
INTAN-Invest Corrado et
al. (2018)
1995-
2015
AT, BE, CZ, DE, DK,
FI, FR, EL, ES, HU, IE,
IT, LU, NL, PT, SK, SI,
SE, UK, US
CHS intangibles, and
adjusted productivity
measures
Industry Business
EUKLEMS
(Statistical +
Analytical
Database)
Stehrer et al.
(2019)
1995-
2017 EU-28, JP, US
Tangibles, NA and CHS
intangibles, adjusted
productivity statistics
Industry Whole
economy
Table 2. Review of the existing datasets on intangible investments.
Note: AT=Austria, BE=Belgium, CZ=Czech Republic, DE=Germany, DK=Denmark, EL=Greece,
ES=Spain, FI=Finland, FR=France, JP=Japan, HU=Hungary, IE=Ireland, IT=Italy, LU=Luxembourg,
NL=Netherlands, NO=Norway, PL=Poland, PT=Portugal, SK=Slovakia, SE=Sweden, UK=United
Kingdom, US=United States. EU-28 = European Union as of 2019 (including UK), EU-27=European
Union as of 2011 (before Croatia’s accession), NA=National Account.
Source: See column entitled “Main source” in the table.
Building upon the INNODRIVE dataset, the first release of the INTAN-Invest extended the
timeframe to 2010 and added data for the US. The second release of the INTAN-Invest,
8
published in 2017, provided data on the CHS Intangibles GFCF and the revised productivity
statistics at industry-level for the timeframe 1995-2015. The SPINTAN project attempted to fill
this gap by measuring the intangible investments undertaken by the public sector of most of the
EU countries between 2000-2012 (Corrado et al., 2017b).
The latest EUKLEMS release of 1 November 2019 (Stehrer et al., 2019), funded by the
European Commission, alongside the official national accounts fixed assets and productivity
estimates, provides also data on the remaining CHS intangible assets (namely, own account and
purchased organizational capital, marketing, advertising, branding and design expenditures and
vocational training). The dataset covers the years 1995-2017 and public-sector intangible
investments are also provided. As of today, the latest release of the EUKLEMS is the most up-
to-date and largest dataset (both for countries and for industries) on intangible and tangible
capital investments.
5. Capital Investment in Intangible Assets and Labour Productivity Growth
Empirical studies on the relationship between capital investment by business in intangible assets
and labour productivity growth have become progressively more sophisticated over the last two
decades. This section offers a survey of the latest academic literature investigating this
important question. The studies examined are grouped into the following five categories:
country-level (5.1), industry-level (5.2), firm-level (5.3), complementary investments and spill-
over effects (5.4) and the drivers of investment in intangible assets (5.5).
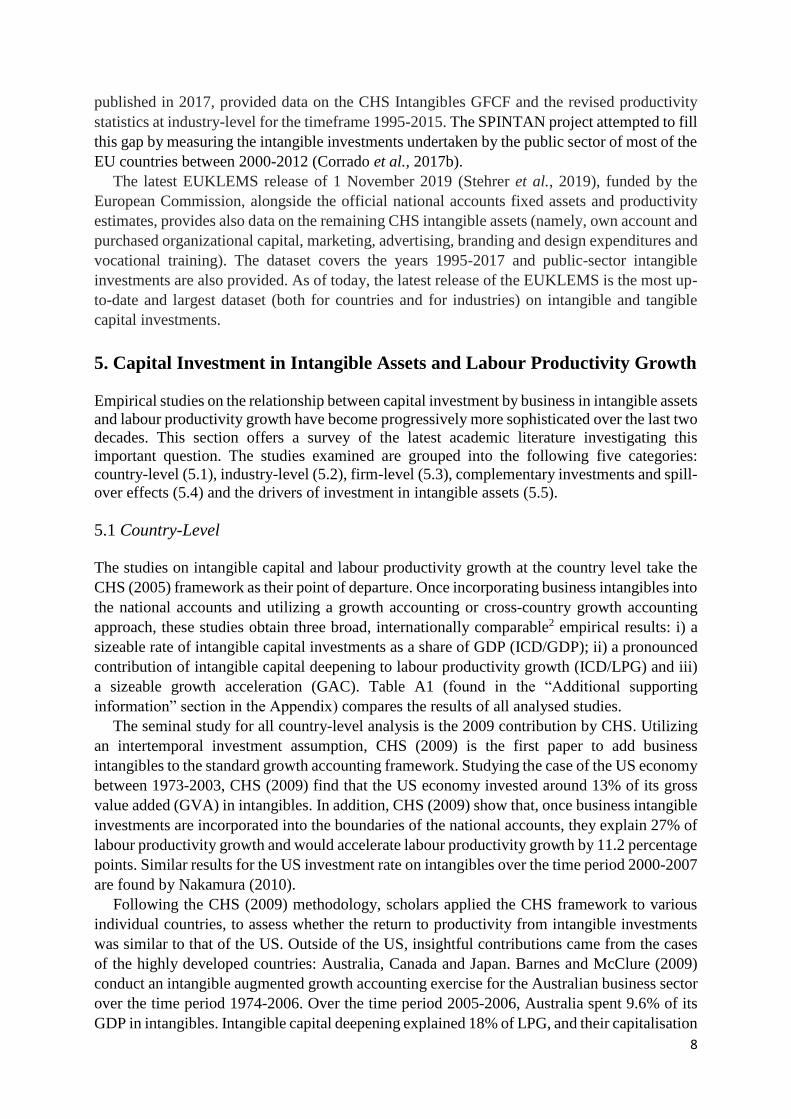
5.1 Country-Level
The studies on intangible capital and labour productivity growth at the country level take the
CHS (2005) framework as their point of departure. Once incorporating business intangibles into
the national accounts and utilizing a growth accounting or cross-country growth accounting
approach, these studies obtain three broad, internationally comparable2 empirical results: i) a
sizeable rate of intangible capital investments as a share of GDP (ICD/GDP); ii) a pronounced
contribution of intangible capital deepening to labour productivity growth (ICD/LPG) and iii)
a sizeable growth acceleration (GAC). Table A1 (found in the “Additional supporting
information” section in the Appendix) compares the results of all analysed studies.
The seminal study for all country-level analysis is the 2009 contribution by CHS. Utilizing
an intertemporal investment assumption, CHS (2009) is the first paper to add business
intangibles to the standard growth accounting framework. Studying the case of the US economy
between 1973-2003, CHS (2009) find that the US economy invested around 13% of its gross
value added (GVA) in intangibles. In addition, CHS (2009) show that, once business intangible
investments are incorporated into the boundaries of the national accounts, they explain 27% of
labour productivity growth and would accelerate labour productivity growth by 11.2 percentage
points. Similar results for the US investment rate on intangibles over the time period 2000-2007
are found by Nakamura (2010).
Following the CHS (2009) methodology, scholars applied the CHS framework to various
individual countries, to assess whether the return to productivity from intangible investments
was similar to that of the US. Outside of the US, insightful contributions came from the cases
of the highly developed countries: Australia, Canada and Japan. Barnes and McClure (2009)
conduct an intangible augmented growth accounting exercise for the Australian business sector
over the time period 1974-2006. Over the time period 2005-2006, Australia spent 9.6% of its
GDP in intangibles. Intangible capital deepening explained 18% of LPG, and their capitalisation

9
increased the GVA growth rate by 3.7%. Baldwin et al. (2009, 2012) report the evolution of
intangible investments in Canada’s non-financial market sectors between 1976-2008 and find
intangible investments of 13.2% of GDP. The contributions of intangible capital deepening to
the LPG reached 29% in the period 1976-2000. The growth acceleration was 13.3%. Fukao et
al. (2009) present the results of the growth accounting exercise carried out on the Japanese
market economy between 1985-2005. Similar to the actions taken by US, Australia and Canada,
Japan also spent a sizeable fraction (11.1%) of its GDP in intangibles. And again, in line with
the US and Canadian experience, intangible capital deepening in Japan explained up to 27% of
LPG and generated a faster GVA growth of up to 17.3%. While comparable to with the US
results reported by CHS (2009), Fukao et al. (2009) highlight how investments in intangible
assets slowed down in Japan between the late 1980s and the early 2000s, which may explain
the lower LPG rates in Japan in comparison to the US.
Replicating the CHS (2009) approach for the Finnish case, Jalava et al. (2007) report the
growth accounting results for the period 1995-2005. Similar to CHS, the authors find that the
Finnish non-financial business sectors invested 9.1% of the country’s GDP in intangible assets
in 2005. The resulting intangible capital deepening explained up to 30% of LPG in the sub-
period 2000-2005, and it triggered a growth acceleration of up to 13.2%. Edquist (2011)
presents the case of Sweden. Analysing data from the market sectors in the timeframe 1995-
2006 and comparing the results with those from CHS (2009), Edquist (2011) finds that the
Swedish economy, in 2006, invested 10% of its GDP in intangibles, one percentage point more
than Finland (Jalava et al., 2007). In terms of the positive return on LPG, similarly to Finland,
Sweden is reported to outperform the US, with 30% of LPG explained by intangible capital
deepening. This result is interpreted as the high effectiveness of the Swedish intangible
investments after the economic downturn of the late 1990s. Van Rooijen-Horsten et al. (2008),
carry out a descriptive statistical analysis to compare the levels of investments in intangible
assets in the Netherlands between 2001-2004. The authors find that the whole Dutch economy
(including the public sector) invested 8.3% of its GDP in intangible assets, highlighting a gap
with the Anglo-Saxon economies and with the other cases presented so far. In contrast to the
Netherlands and in line with the Scandinavian countries and the US, the UK stands as a
forerunner in the knowledge economy. Marrano et al. (2009) analyse the investments in
intangible assets carried out in the UK market economy between 1990-2004. The authors
provide evidence that the UK economy is a large investor in intangible assets, with investments
of up to 13% of its GDP, which are in line with those from CHS (2009) for the US. In terms of
the contribution of intangible capital deepening to LPG, the UK shows a lower impact of 20%,
compared to the US. The later publication from Goodridge et al. (2013), performing a
descriptive statistical analysis, confirmed the findings from Marrano et al. (2009) and further
corroborated them by reporting that the correct measurement of the knowledge economy would
explain around “5 percentage points of the 16 per cent [UK] productivity puzzle” (Goodridge
et al., 2013, p. 48).
Hao et al. (2009) is the first attempt at performing the growth accounting exercise on a group
of EU countries, namely France, Germany, Italy and Spain, compared to the US and the UK. A
situation of divergences between EU countries is depicted: Italy and Spain invest smaller shares
of their GDP, both of them 5.2%, in comparison to Germany and France (respectively, 7.1%
and 8.8%). Overall, the Anglo-Saxon countries invest higher shares of their GDP in intangibles,
with the UK reaching 10.1% and the US 12.1%. Coherently, these are the countries where
intangible capital deepening explains the higher shares of LPG. Van Ark et al. (2009) follow
the same rationale of including within the growth accounting exercise 10 EU countries and the
10
US. Their findings widely confirm those from Hao et al. (2009): the European economies invest
lower shares of their GDP in intangible assets compared to the US, with the UK being only
exception (the Scandinavian economies are not in the data sample). In particular, the US
invested around 12% of its GDP in intangible assets, and France, the largest EU investor after
the UK, only 7.9%. The authors reported a high volatility across the EU countries, with Italy
and Spain in particular investing less (around 5% of their GDP) and showing the lower values
of LPG.
Corrado et al. (2013) add to the existing growth accounting studies by considering a wider
sample size of 14 EU member states vis-à-vis Japan and the US and by using the first version
of the INTAN-Invest (Revision 1) dataset. Conducting an intangible augmented growth
accounting estimation over the period 1995-2007, the authors corroborate the finding of the EU
economies lagging behind the US both in terms of intangible investments over GDP (with 6.6%
being the EU-14 average against 10.6% for the US) and in terms of their return in higher LPG
(23.8% of LPG is explained by intangible capital deepening in the EU, 28.4% in the US). In a
similar vein, Corrado et al. (2018) conduct an intangible augmented growth accounting
estimation for an EU-18 country sample with the help of the updated INTAN-Invest dataset
over the time period 2000-2013, permitting them to compare a before-crisis with a crisis sample.
The authors’ analysis confirms the previous results showing the EU countries investing less in
intangible assets (and obtaining a lower return on LPG) than the US, with the Scandinavian
countries, France and the UK being the larger intangible investors in the EU. Interestingly, the
paper finds that during the global financial crisis 2008-2009 the intangible investments in the
EU experienced only a small drop and recovered more quickly than did tangible investments.
Overall, Corrado et al. (2018) report that intangible capital deepening explains 30% of LPG in
the EU14 countries.
In contrast to the growth accounting estimations described above, the contribution by Roth
and Thum (2013) is the first to introduce a growth econometric estimation approach in this field
of research. Utilizing the harmonized intangible capital macro dataset from the INNODRIVE
project, Roth and Thum (2013) apply a cross-country growth accounting (CCGA) estimation
approach to the CHS framework. The advantages of taking a CCGA estimation approach over
the traditional growth accounting approach are first, that output elasticities are estimated, rather
than imposed and second, that part of the model can be designed to explain the international
variance in TFP growth. The authors retrieve data on 13 European countries over the period
1998-2005 by merging the EUKLEMS dataset with the INNODRIVE database. The findings
by Roth and Thum (2013) corroborates most of the previously discussed findings using a simple
growth accounting estimation. Their results suggest i) a pronounced average investment rate of
intangible investment of 9.9% in the 13 EU countries, ii) a dominant contribution of intangible
capital deepening to labour productivity growth, thereby explaining a labour productivity share
as large as 50% and iii) a significant growth acceleration of 4.4%. The econometric results by
Roth and Thum (2013) remain robust when controlling for endogeneity. Whereas some
Scandinavian countries, e.g. Sweden, already outperform the US in terms of intangible
investments, the Mediterranean countries Spain and Italy are clearly lagging. Latest results by
Roth (2019), who replicated the study by Roth and Thum (2013) with the help of an EU-16
country sample over the time period 2000-2015, corroborate the findings of Roth and Thum
(2013). Roth (2019) finds an investment share for intangible assets over GVA of 11%, and
contributions to labour productivity growth and growth acceleration effects similar to the ones
reported by Roth and Thum (2013). Moreover, by differentiating a crisis from an economic
11
recovery period he finds that intangibles have remained positive throughout the crisis period
and are strongly positively related to labour productivity growth in times of economic recovery.
Finally, Chen (2018) empirically proves how the full inclusion of intangible capital as a
production factor explains up to 16 percentage points of cross-country income variation. This
finding, obtained on a sample of 60 countries over the timeframe 1995-2011, confirms –
interestingly, from a different viewpoint and with a different model – the theory that
investments in intangible capital explain the level of labour productivity, and particularly that
countries investing more in intangibles show higher average levels of output per worker.
5.2 Industry level
Surveying the studies at the industry level gives a deeper insight into how far the strong and
positive impact of business intangible investments on labour productivity growth at the country
level can be corroborated at a more disaggregated level. In contrast to the country level, the
majority of the papers surveyed at the industrial level use growth econometric techniques, to
adequately account for country-, and industry- and time-specific effects. Table A2 (found in the
“Additional supporting information” section in the Appendix) compares the results of all
analysed studies.
An early effort at applying the CHS framework to industry-level data came from Barnes
(2010), who analyses the Australian business sector economy from 1993-2006. While
confirming the general findings by Barnes and McClure (2009) at the country level, the authors
find that the manufacturing sector is the most intangible-intensive, with 65% of intangible over
tangible investments. The Australian services sector has the second-largest intangible over
tangible share, with 50%. Among papers that review extra-US and EU countries, Dutz et al.
(2012) presents the interesting case of the Brazilian economy between 2000-2008. From the
country perspective, in spite of showing an average share of intangible investment over GDP
of 4.72% (less than half of the values from the US, Japan and UK), the Brazilian economy
shows a positive causal relationship between intangible investments and TFP growth. The
medium/high-tech manufacturing sector is found to be the dominant intangible investor in the
Brazilian economy- and the only sector that invests more resources in intangible than in tangible
assets.
Miyagawa and Hisa (2013) analyse the Japanese business sector between 1981-2008,
deepening the research from Fukao et al. (2009) presented in the previous section. The authors
report a strong correlation between intangible investments and TFP growth, and interestingly
theorise that the general slowdown of the Japanese TFP growth can be related to the slowdown
of intangible capital deepening after the economic downturn of the early 2000s, especially in
the key IT manufacturing sector. This last hypothesis opens up a new interesting point of view
on the evolution of the Japanese economy in relation to its investments in intangible assets.
Chun and Nadiri (2016) perform the growth accounting exercise on the Korean economy in the
timeframe 1981-2008. The study reveals that intangible capital deepening switched from
explaining only 3% of LPG in the period 1981-2008, to explaining 15% in the period 2001-
2008. From the industry perspective, the Korean intangible-intensive industries have evolved
over time to account for more than 60% of the Korean economy’s real VA growth. Fleisher et
al. (2015) present another interesting case from Asia: the Chinese manufacturing sector
between 1999-2007. Retrieving data at industry level on VA and investments in innovative
properties, the authors find that the most productive manufacturing subsectors of the Chinese
economy are those that are investing higher shares in intangible capital. This result is interpreted
12
as evidence that China’s comparative advantage is shifting towards more innovative
production.
Revisiting the papers focusing on EU countries, analogous with the previous section 5.1, this
section examines the contributions from the industry-level literature, divided between single
EU country cases, and groups of EU countries cases. The paper from Dal Borgo et al. (2013)
applies the growth accounting framework to the UK economy between 2000-2008. The case is
of particular interest in the light of the results analysed in the previous section from Marrano et
al. (2009) and Goodridge et al. (2013). In line with those results, the authors find that as early
as 2008 the UK business sector economy invested the highest share of its GVA in intangible
assets (16% of GVA, against the 12% invested in tangible assets), testifying to the frontier role
played by the UK in the transition to the knowledge economy. The manufacturing sector is
found to be the most intangible-intensive also in the UK, accounting alone for 40% of total
innovation (intended as intangible capital deepening + TFP). The financial sector is found to be
also highly intangible-intensive, testifying to its high innovativeness in the UK economy. The
growth accounting exercise reported that intangible capital deepening constitutes 23% of GVA
growth in the timeframe 2000-2008. Crass et al. (2015) analyse the case of the German
economy between 1995 and 2006, using a growth accounting estimation technique. The
German country case study appears of particular interest in the EU scenario, in particular in
comparison to the UK. The paper finds that the German economy has increased its intangible
investments up to 89% of its tangible investments in 2006, in line with the UK economy. Almost
half of these intangible investments are carried out by manufacturing firms, which invest
heavily in R&D – more than twice as much as British manufacturing firms, as a share of gross
output – confirming the high innovativeness of the German manufacturing sector and the
concentration in this sector of the German investments in intangible assets (mostly R&D). In
terms of LPG acceleration, the authors find that the capitalization of all the intangible
investments would lead to up to 0.59 percentage points of growth acceleration in the
manufacturing sector. After the UK and German country case studies, Delbeque et al. (2015)
present an extensive review of the evolution of intangible investments in the French economy
(including the public sector) between 1980-2007. The authors find that the manufacturing sector
is also the forerunner in intangible investments in France and, similarly to what was observed
by Crass et al. (2015) in Germany, the highest share of spending in this sector is devoted to
R&D and engineering design. The econometric exercise, which used Fixed Effects and GMM-
DIFF estimators, confirms the causal relationship between intangible investments and
productivity growth, highlighting how the productivity of tangible capital and labour also
increases when levels of intangible investments are higher.
Corrado et al. (2016) is the first paper to conduct the growth accounting exercise at the
industry level for a group of 14 EU countries by using INTAN-Invest (first release) data. This
paper confirms, over the period 1995-2010, the findings on the higher intangible-intensity of
the manufacturing sector, which is, by far, the leader in R&D investments. The data presented
closely match those from Dal Borgo et al. (2013), Crass et al. (2015) and Delbeque et al. (2015).
In addition, the service sector of all EU countries – with Finland being the sole exception –
shows rates of growth in intangible investments that are higher than those of the manufacturing
sector, hinting to a catching-up of the former in innovation expenditures. Discussing LPG,
Corrado et al. (2016) report an average contribution of intangible capital deepening of 25%, in
both the services and manufacturing sectors. Similarly to Corrado et al. (2016), Niebel et al.
(2017) focus on the market sectors of ten EU countries between 1995 and 2007, retrieving data
on harmonised intangible investments and stocks from the INDICSER dataset. Applying the
13
growth accounting methodology, the authors report that the manufacturing and the financial
sectors are the most intangible-intensive among the European economies analyzed. Country-
wise, a wide dispersion is noted: highly innovative countries such as the UK and Finland, which
invest heavily in intangibles and have above-average LPG rates, co-exist with countries with
lower rates of intangible capital deepening and LPG, notably Italy and (on a smaller scale)
Spain and Germany. All the findings reported so far for Niebel et al. (2017) are in line with the
literature presented in this section, and notably with Corrado et al. (2016). The authors present
the growth econometric exercise as well: using a Fixed-Effects and a System GMM estimator,
they find a positive and significant effect of intangible capital (services) growth on VA growth.
Qualitatively, this result is in line with the contributions presented in the previous section (see
here Roth and Thum, 2013 and Roth, 2019), but the point estimates are more than halved.
Piekkola (2017) makes several steps forward by increasing considerably the sample size (all
EU-28 countries) and by focusing on the years of the eurozone crisis 2008-2013. The results of
the growth accounting and growth econometric exercises in this paper confirm previous
findings on intangible investments in the EU constituting a large share of VA (29.6%). The
LPG effect of intangible capital deepening between 2008 and 2013, however, is found to be
negative. The author attributes this important result to the decrease in the innovative base
between 2008 and 2013 (Piekkola, 2017, p. 391), intended as the contemporaneous increase in
unemployment and slowdown of intangible capital deepening. The economic sectors most
affected by the crisis, moreover, were those producing intangible assets/services. In this light,
the claim from Piekkola (2017) appears comparable to the Japanese case presented in
Miyagawa and Hisa (2013): the stagnation in LPG rates is linked to an even-deeper crisis of the
most innovative and productive sectors of the economy.
5.3 Firm Level
This section surveys studies that analyse the relationship between business intangibles and
labour productivity growth at the firm level. The larger sample sizes and the general availability
of information concerning the number of employees and the economic sector of the firm and of
panel observations permits the surveyed papers in this field to exploit both the between and
within variation of firms. Table A3 (found in the “Additional supporting information” section
in the Appendix) compares the results of all analysed studies.
Whereas the studies surveyed at the country and industry level were strongly influenced by
the seminal approach of CHS (2005), studies at the firm level have started analysing the impact
of intangible capital investments on labour productivity growth following the business literature
presented here in section 5.1. Thus, the present section will present both: i) papers that consider
a wider range of intangible assets, but outside the CHS frameworks; and ii) papers that followed
the CHS framework for the firm-level analysis.
Outside of the CHS (2005) framework, Ramirez and Hachiya (2008) focus on the
productivity effect of intangible capital investments of the Japanese firms listed in the Tokyo
Stock Exchange between 1997-2001. The paper considers as intangible assets the expenditures
in advertising and R&D and accounts for the firm-specific organizational capital. The authors
provide empirical evidence that, regardless of the size and the economic sector, intangible
capital investments positively affect the growth in sales. Among the intangible investments,
R&D positively affects only larger firms in the manufacturing sector, while advertising has a
more generalised positive effect. Battisti et al. (2015) retrieve firm-level data from the
Amadeus-2012 database for 20,793 firms from 16 European countries over the period 2003-
14
2009. The intangible investments from the CHS framework thereby analysed are those in R&D,
training and goodwill expenditures. Investments in intangible assets are found to have a positive
and significant effect on TFP. The paper assesses whether investing in intangibles increases the
probability that the firm will also investing in better technologies, finding evidences in support
of this hypothesis. Bontempi and Mairesse (2015) study a large sample of Italian manufacturing
firms between 1982-1999. The intangible assets included in their paper are R&D, patents,
trademarks and advertising, in line with Battisti et al. (2015). From the methodological point
of view, the paper by Bontempi and Mairesse (2015) has the interesting feature of comparing
the results from different specifications of the production function. The authors also find that
the productivity of Italian manufacturing firms is positively affected by investments in
intangible capital, quantifying for the median firm a return of €2-3 for each euro spent in
intangible assets. Among the assets, investment in intellectual capital has the highest return at
the (manufacturing) firm level. Shakina et al. (2016) present the interesting case of the gap in
intangible investments between Russian and European firms. The authors report both lower
levels of average productivity and of intangible investments in Russian firms, in comparison to
their European competitors. Carrying out an empirical exercise, the authors link the lower
productivity of the Russian firms to their lower levels of intangible investments, highlighting
the most important gaps in R&D spending in the manufacturing sector and in organizational
capital. Both these causes appear well in line with other results hereby presented: the
importance of R&D investments in the manufacturing sector is a recurrent motif in the industry-
level literature (e.g. Crass et al., 2015); the high relevance of organizational capital investments
at the firm-level is one of the main finding from Ilmakunnas and Piekkola (2014).
Görzig and Gornig (2013) assess the volatility of the rate of return on investments between
1999-2003 in German firms. This contribution is closer to CHS for the intangible assets
analysed, but it interprets them as the missing link to explain the high volatility in firms’ returns
on their investments. Once intangible assets are accounted, the dispersion in the rate of return
in investments observed is reduced strongly. The authors argue that German firms successfully
increase their productivity by investing in intangible assets, but if the accounting practices to
calculate the returns on investment do not consider the spending in intangible assets as capital
investments, then their outcome is more volatile and upwardly-biased, because a large share of
investments are not considered. Similar to Görzig and Gornig (2013), Piekkola (2016) retrieves
financial and investment data on Finnish firms between 1997-2011 to assess the patterns of
intangible investments and how they affect the firms’ market value. While observing that, by
the end of the timeframe, the amount of intangible capital investment has reached that of
investments in machinery and equipment, Piekkola (2016) reports a positive effect of a firm’s
intangible capital on that firm’s market value.
Among the papers more closely embedded in CHS, De and Dutta (2007) appears as the
earliest attempt to analyze the impact of investing in intangible assets on firms’ productivity.
The authors use data for Indian firms operating in the IT software industry between 1997-2005
and find a positive and significant effect of the investments in brand capital and organizational
capabilities on firms’ productivity. While the inclusion of firms belonging only to the IT
software industry strongly limits the external validity of the results, the main contribution of
this paper is to adapt the CHS framework to the firm-level analysis. Further evidence from India
is discussed in Goldar and Parida (2017). The authors analyse the data from around 3,200 Indian
firms in 2012 and 2013. Following the same approach of Bontempi and Mairesse (2015), Goldar
and Parida take important steps forward in capitalizing the intangible investments applying the
PIM to 10 years of prior investments, coherently with the country- and industry-level databases
15
presented in the previous sections. In line with the results from De and Dutta (2007), intangible
investments are found to have a strong and positive effect on Indian firms’ productivity, which
is even greater for firms operating in the manufacturing sectors and with higher stocks of ICT
capital. Moreover, similar to the Russian case presented in Shakina et al. (2016), Indian firms
appear to be investing lower shares of their VA in intangibles compared to EU and US firms,
thereby highlighting the big potential of intangible investments in India. Aiming at assessing
the state of the art of the New Zealander economy in the knowledge economy, Chappel and
Jaffe (2018) analyze a rich dataset of more than 12,500 New Zealand firms between 2005-2013,
having observations for all three dimensions of the CHS intangibles. Chappel and Jaffe (2018)
empirically test the effectiveness of intangible investments on a wider variety of firm indicators,
namely productivity, profitability, LPG and customers satisfaction. Surprisingly, the authors
find that intangible investments have a significant effect on the gross output growth and on
customers’ satisfaction, but not on the profitability or LPG. This finding, as the authors
themselves discuss, is at odd with the literature and may be related to biases in the dataset used
or hinting at limited productivity effects in the mature New Zealand economy.
Shifting the attention to papers embedded in the CHS framework that study EU countries’
cases, Marrocu et al. (2012) is hereby the most influential paper studying the effectiveness of
investments in intangible capital on productivity at the firm level. Moreover, this contribution
focuses on six of the largest EU countries, similarly to the empirical country- and industry-
level studies. Retrieving data from the BVD database for the timeframe 2002-2006, the authors
observe that there is an overall trend in raising the share of intangible over tangible capital. The
econometrics exercise reveals, coherently, that these investments in intangible capital are
enhancers for a firm’s productivity. Due to data limitations, Marrocu et al. (2012) does not
include data on organizational capital investments and excludes observations on German firms.
Notwithstanding these limits, this paper is a key contribution in bridging the country-level with
the firm-level analysis.
Crass and Peters (2014) follow closely the approach from Marrocu et al. (2012). The authors
analyse a panel dataset of only German companies between 2006-2010 retrieved from the
Mannheim Innovation Panel (MIP). This paper, thus, attempts to enrich Marrocu et al. (2012)
by addressing: i) the lack of observations on German firms and ii) the lack of variables
measuring the organizational capital. With regard to this latter issue, the authors retrieved only
qualitative information from the MIP (i.e., yes/no variables) about past changes in the business
processes or any new organization of the workplace. The results of Crass and Peters (2014)
widely confirm those of Marrocu et al. (2012): intangible capital investments have a positive
and significant effect on German firms’ productivity, with R&D, branding and firm-specific
human capital (training) expenditures having the strongest effect.
Consistent with Crass et al. (2015) presented in the previous section, the high-tech
manufacturing firms in Germany are the top investors in intangible assets. Ilmakunnas and
Piekkola (2014) analyse firm-level data for 1,714 Finnish firms between 1998-2008. This paper
exploits a labour-oriented perspective focused on the impact that workers engaged in intangible
activities (i.e. marketing, R&D and organisational matters) have on the firm’s TFP. The authors
find that the jobs related to managerial and marketing activities have the highest positive return
on TFP, followed by the R&D-related jobs. Organisational activities are reported to be even
more productivity-enhancing for the firms operating in the service sectors. Ilmakunnas and
Piekkola (2014), therefore, stress the importance of the organizational capital among all the
intangible assets, which indeed appears as one of the most debated topics within the strand of
literature reviewed in this contribution.
16
Verbič and Polanek (2014) follow a similar labour-oriented approach and analyse the impact
of R&D, firm-specific human capital and organizational capital investments on sales on a
sample of 3,370 firms in Slovenia between 1994 and 2005. Using a fixed effects estimator, the
authors find that investments in firm-specific human capital and R&D are the most beneficial
for sales’ growth. The effect of organizational capital is lower in Slovenia than in Finland
(Ilmakunnas and Piekkola, 2014), and driven by the initial years of the sample, i.e. those of the
transition following the dissolution of Yugoslavia. Lalovic and Koman (2018) review survey
data on intangible investment carried out by the largest manufacturing firms in Slovenia
between 2011 and 2014. Analogous to Chappel and Jaffe (2018), the authors include all three
dimensions of CHS intangible assets. Lalovic and Koman (2018) report that the most productive
firms in Slovenia are indeed those that are spending the most in intangible assets, specifically
in firm-specific human capital, organizational capital and marketing.
5.4 Complementary investments and spillover effects
This section surveys studies examining additional channels through which intangible
investments affect LPG. They focus on the existence of complementary intangible investments
that increase the effectiveness of ICT and AI capital investments, as well as on the spillover
effects generated by intangible investments. Table A4 (found in the “Additional supporting
information” section in the Appendix) compares the results of all analysed studies.
The idea that the knowledge economy benefits from complementary investment in intangible
capital aimed at ICT, in the form of firms’ organizational and firm-specific human capital, has
been prominently shown by Brynjolfsson and Hit (2000). The authors highlighted how
investment in ICT (the focus of their study) needs even higher commitments to modern forms
of firms’ organizational structure and to firm-specific human capital to be effective. The authors
estimate that the ratio between ICT and complementary intangible investments is 1:9. Chen et
al. (2016) fully embed the research on the complementarities between ICT and intangible
investments following on from Brynjolfsson and Hit (2000) within the CHS framework. The
authors retrieve data on gross value added (GVA), and on tangible and intangible investments
for ten EU countries over the period 1995-2007 from the INTAN-Invest (first release) and
EUKLEMS databases. After ranking the economic sectors by their ICT-intensity, the paper
provides an empirical analysis and finds that the most ICT-intensive sectors have the higher
return in productivity from intangible investments. This finding supports the hypothesis that
intangible and ICT are complementary in production and corroborate the early hypothesis from
Brynjolfsson and Hit (2000) concerning the pivotal role of organizational capital. Moreover,
Corrado et al. (2017a) retrieve data for 10 EU countries from 1998-2007 from the INTAN-
Invest (first release) and EUKLEMS databases and perform an empirical analysis to explore
the complementarity between ICT stocks and intangible investments. Using both country- and
industry-level data, the authors confirm the hypothesis of the complementarity between the
levels of ICT stocks and intangible investments. The authors also report evidence that intangible
capital investments trigger wider productivity effects.
The existence of spillover effects, stemming from investments in intangible assets, is another
topic of debate on intangible literature, before and after CHS. O’Mahony and Vecchi (2009) is
an early attempt to analyse spillover effects, at the firm level, stemming from investments in
R&D and a better-skilled workforce. Using data on five large OECD economies between 1988
and 1997, the authors find that the firms operating in the most R&D- and skill-intensive sectors
have from 2-5% higher productivity growth. This finding is interpreted as the spillover effect
17
that the sense of belonging to an intangible-intensive industry has on firms. Similarly, Elnasri
and Fox (2017) study the case of intangible investments in Australia between 1993-2013. The
authors find that private intangible investments have a general positive TFP effect in Australia,
interpreted as a spillover effect. Elnasri and Fox (2017) report the positive relationship between
higher educational levels, the presence of research agencies and TFP. Goodridge et al. (2017)
set an empirical exercise similar to that of Corrado et al. (2017a), but one focused on the effect
of the general “knowledge stock” on industries’ TFP growth.
The argument tested by the authors is that each industry receives a positive TFP effect from
the intangible capital accumulated in other industries, implying that intangible investments
carried out in one industry spill over into all the others. The authors argue, however, that outside
knowledge stock spillovers are not contemporaneous, but rather that they emerge within the
span of three periods. The empirical analysis widely supports this hypotheses, confirming the
existence of extra-industry knowledge spillovers over time. Keeping the focus on the UK,
Melachroinos and Spence (2019) make a pioneering attempt to study the effectiveness of
intangible investments on GVA, from the point of view of districts within the UK (the NUTS3
regions in the Eurostat’s nomenclature). Using a panel of 128 UK districts over the timeframe
1995-2007, the authors find that intangible investments are concentrated in some areas of the
country, mainly in London and the South-East. This finding carries two insights: firstly,
imbalances in intangible investments foster regional disparities within the UK, and secondly,
and most interestingly for this section, there is evidence of an agglomeration effect of the most
innovative firms in some areas of the UK. In combination with the outside knowledge stock
hypothesis from Goodridge et al. (2017), the agglomeration effect suggested by Melachroinos
and Spence (2019) hints at the existence of persistent spillover effects, concentrated in the main
intangible UK hubs (e.g., London).
Finally, it is worth mentioning some observations here related to the strand of literature
focusing on Artificial Intelligence (AI), and specifically on Brynjolfsson et al. (2017). The
authors argue that AI appears as a very promising general-purpose technology that will bring a
positive productivity shock to most economic sectors. However, similar to ICT capital, AI
capital will need complementary investments in intangible capital, such as complementary
investments in firm-specific human capital and organizational structures.
5.5 The Drivers of Intangible Investments
This section surveys the literature that analyses the drivers of business intangible investments,
focusing on the endowments of public intangibles, such the quantity and quality of a high-
skilled labour force, well-functioning formal and informal institutions and a well-designed
policy framework. Table A5 (found in the “Additional supporting information” section in the
Appendix) compares the results of all analysed studies.
From the perspective of what drives business intangibles at the firm level, Arrighetti et al.
(2014) present evidence for the Italian case. Using a panel dataset of Italian manufacturing firms
for the years 2001-2003, the authors find that a larger firm size, higher educational levels of the
workforce and higher stocks (and therefore, past levels) of intangible investments increase the
propensity of investing in intangible capital. The latter, among the three drivers identified by
the authors, has the strongest effect on intangible investments, being a key factor in explaining
the striking quantiles divergences observed (i.e. a few firms account for the highest share of
intangible investments). Yang et al. (2018) perform a firm-level exercise similar to that of
Arrighetti et al. (2014), retrieving cross-sectional data on a representative sample of Chinese
manufacturing firms in 2011. Similar to the Italian case, the authors find that the size of larger
18
firms and the higher education of their workforce increase the propensity to invest in intangible
assets. In addition, the authors find a negative correlation between the level of competitiveness
in the market and firms’ investments in intangible, observing that the firms operating in
oligopolies have the highest likelihoods of carrying over intangible investments. This last
finding seems to open up a new discussion within this strand of literature. Ahn (2019) has
studied the drivers of intangible investments in a large sample of quarterly observations taken
of US manufacturing firms between 1986 and 2016. Differently from Arrighetti et al. (2014)
and Yang et al. (2018), the focus in Ahn (2019) is on comparing the reaction of tangible and
intangible investments to exogenous shocks (as the 9/11 attacks) and to their own past levels.
An interesting finding of the paper is that the exogenous shocks have a negative impact only on
tangible investments, while intangible investments – proxied by R&D expenditures – are
positively driven by their own past values. The latter finding is in line with Arrighetti et al.
(2014) and corroborates the hypothesis that the firms are persistent in their choice of investing
(or not investing) in intangible assets.
The other viewpoint discussed in the literature about drivers of intangible investment
approaches the question from the country level, focusing on a country’s public intangible
endowments. Gros and Roth (2012) is an early attempt to setup an empirical framework to
highlight the key drivers at country level for intangible investments. Using INNODRIVE and
Eurostat data, their main finding, based on a sample consisting of all EU-27 countries between
1995-2005, is that government effectiveness acts as a significant driver of intangible
investments. Gros and Roth (2012) thus highlight the key role of efficient legislation on
intellectual property rights (IPR), copyright and trademarks in fostering investments in
intangible capital. Andrews and Criscuolo (2013) contributes to the discussion by analysing the
trends in intangible investments (as in CHS) and their drivers in the OECD countries. From a
legislative point of view, the authors confirm the findings by Gros and Roth (2012) that
effective IPR regulations are the key drivers of intangible investments and illustrate the
importance of adopting bankruptcy laws that do not over-penalise entrepreneurs for failure.
From a financial point of view, the authors stress the importance of well-functioning venture
capital markets to foster well-grounded and innovative firms. Demmou et al. (2019) perform
an extensive empirical analysis at industry level on a large panel of OECD countries, to assess
the impact of the financial development on productivity growth in intangible-intensive sectors.
The authors confirm the view of Andrews and Criscuolo (2013) about the importance of well-
functioning equity and venture capital markets and of not over-penalising bankruptcy laws, and
the finding by Gros and Roth (2012) on the general effectiveness of laws governing the
enforcement of contracts. Moreover, Demmou et al. (2019) stress the role, especially in
developing countries, of liberalised financial markets and competitive banking sectors to
improve the efficiency of capital allocation, thereby making them more open to opportunities
to finance intangible investments. Similar results are highlighted by Guo-Fitoussi et al. (2019),
who report that today’s top-innovative firms thrive from a combination of various IPR
applications (e.g. patents and trademark protection for the same product, as in the case of
smartphones), and hence underlining the high importance of effective IPR legislation.
Thum-Thysen et al. (2019) conducted an empirical analysis to test whether macro-economic
conditions, the regulatory framework, financial conditions and levels of human capital have an
impact on the level of intangible, tangible and total investments. The paper retrieves data for
15 EU countries from the INTAN-Invest database, EUKLEMS, OECD, World Bank and
Eurostat for the timeframe 1995-2013. The authors find that higher levels of tertiary education
and of public R&D expenditures drive higher intangible capital investments by businesses.
19
Similarly, better financial conditions (proxied by long-term interest rates and debt-to-equity
ratios) drive higher levels of intangible investments, in line with the findings from Demmou et
al. (2019). In contrast, more stringent employment protection legislation is negatively
correlated with intangible investments. A tighter labour market, according to the authors,
represents an obstacle for the most innovative and flexible firms and it acts as a brake on
intangible investments.
6. Conclusions, Implications and Outlook
6.1 Conclusions
This paper surveys a wide range of studies and highlighted the main findings of the existing
literature regarding the impact of business intangible capital on labour productivity growth.
Surveying the literature at the country, industry and firm level, this paper found evidence of the
increasing importance of business intangibles in explaining labour productivity growth
dynamics. Moreover, according to the results in the surveyed papers, in order to fully reap the
benefits of investment in Information and Communication Technology (ICT) and Artificial
Intelligence (AI), complementary investments in business intangibles are also essential. In
addition, the literature on the drivers of intangible capital held by the business sector highlights
the key importance of a well-endowed infrastructure of public intangibles. Judging from the
wide range of economic literature surveyed, this paper suggests that the contemporary
economic debate has now broadly acknowledged the importance of intangibles for the
transformation of developed economies towards fully-fledged knowledge economies.
6.2 Implications
The results of the surveyed papers clarified that investments in business intangibles have a
pronounced impact on labour productivity growth. This applies to the incorporation of the
complete framework of business intangibles, as well as the incorporation of three individual
dimensions: i) software, ii) innovative property and iii) economic competencies. An immediate
challenge for the responsible decision-makers in the statistical institutes is now of how to
adequately incorporate the new intangibles, such as branding, firm-specific human capital and
organizational capital, into the asset boundary of the national accounts. The results of surveyed
papers underline the necessity to incorporate intangibles into today’s national accounting
frameworks in order to correctly depict the levels of capital investment being made in
economies around the world. These levels are significantly higher than is currently reflected in
official statistics. As a consequence, labour productivity growth rates are underestimated.
6.3 Outlook
At the start of today’s digital and knowledge economy, the CHS (2005) framework successfully
managed, to better account for the inventories of intangible capital accumulated by
technological companies, resembling many of today’s world’s largest firms. They developed a
coherent framework for measuring investment in intangible capital, which has been identified
as a necessary complement to investment in ICT (Van Ark et al., 2008) and AI (Brynjolfson et
al., 2017), in order to reap the full benefit for labour productivity growth. The challenge now
will be to adequately account for the complementary public intangibles needed to maintain and
stimulate business intangibles (Haskel and Westlake, 2018a). A natural next step is to undertake
the wider adaptation of the national accounting framework to also reflect environmental,
educational, health and social capital in order to account for today’s knowledge economy.3
20
Notes
1. This paper follows the methodological approach suggested by Roth and Thum (2013) and
conceptualizes intangible capital as “an umbrella term for all those capital forms that are
theoretically important for productivity but are not tangible in nature”. As such the term
is used to include business intangibles as defined by CHS 2005 as well as public
intangibles, such as the quantity and quality of a highly-skilled labour force, well-
functioning formal and informal institutions and a well-designed policy framework (see
e.g. Aghion and Howitt, 2006; Hall and Jones, 1999). Using such a definition of intangible
capital also facilitates the awareness that the largest share of income and wealth of
advanced economies stems from services of intangible capital stocks (World Bank, 2006).
2. With the exception of the studies by Nakamura (2010) and Chen (2018).
3. It remains an open question which range of public intangible capital should be
incorporated into the asset boundary (Hill, 2009; Stiglitz et al., 2009).
References
Abowd, J.M., Haltiwanger, J., Jarmin, R., Lane, J., Lengermann, P., McCue, K., McKinney, K.
and Sandusky, K. (2005) The Relation among Human Capital, Productivity and Market
Value: Building Up from Micro Evidence. In C. Corrado, J. Haltiwanger and D. Sichel
(eds.), Measuring Capital in the New Economy (pp. 153–204). University of Chicago
Press, Chicago, IL.
Aghion, P. and Howitt, P. (2006) Joseph Schumpeter Lecture on Appropriate Growth Policy:
A Unifying Framework. Journal of the European Economic Association 4: 269-314.
Ahn, Y. (2019) Intangible capital, volatility shock, and the value premium. Financial Review
1: 1-23.
Andrews, D. and Criscuolo, C. (2013) Knowledge-based capital, innovation and resource
allocation. OECD Economics Department Working Papers No. 1046.
Arrighetti, A., Landini, F. and Lasagni, A. (2014) Intangible assets and firm heterogeneity:
Evidence from Italy. Research Policy 43: 202-213.
Baldwin, J., Gu, W., Lafrance, A. and Macdonald, R. (2009) Investment in Intangible Assets in
Canada: R&D, Innovation, Brand, and Mining, Oil and Gas Exploration Expenditures. The
Canadian Productivity Review, Research Paper, Statistics Canada, Ottawa.
Baldwin, J., Gu, W. and Macdonald, R. (2012) Intangible Capital and Productivity Growth in
Canada. The Canadian Productivity Review, Research Paper, Statistics Canada, Ottawa.
Barnes, P. and McClure, A. (2009) Investment in Intangible Assets and Australia’s Productivity
Growth. Productivity Commission Staff Working Paper, Canberra.
Barnes, P. (2010) Investment in Intangible Assets and Australia’s Productivity Growth -
Sectoral Estimates. Productivity Commission Staff Working Paper, Canberra.
Battisti, M., Belloc, F. and Del Gatto, M. (2015) Unbundling Technology Adoption and TFP at
the Firm Level: Do Intangibles Matter? Journal of Economics & Management Strategy 24:
390-414.
Belz, T., Von Hagen, D. and Steffens, C. (2016) R&D Intensity and the Effective Tax Rate: A
Meta- Regression Analysis. Journal of Economic Surveys 31: 988-1010
Bontempi, M.E. and Mairesse, J. (2015) Intangible capital and productivity at the firm level: A
panel data assessment. Economics of Innovation and New Technology 24: 22–51.
Bounfour, A. and Miyagawa, T. (2015) Intangibles, Market Failure and Innovation Growth.
Springer Verlag, Heidelberg, pp. 1-10.
21
Brynjolfsson, E. and Hitt, L.M. (2000) Beyond computation: Information technology,
organizational transformation and business performance. Journal of Economic
Perspectives 14: 23-48.
Brynjolfsson, E., Hitt, L.M. and Yang, S. (2002) Intangible Assets: Computers and
Organizational Capital. Brookings Papers on Economic Activity 1: 137–198.
Brynjolfsson, E., Rock, D. and Syverson, C. (2017) Artificial intelligence and the modern
productivity paradox: A clash of expectations and statistics. National Bureau of Economic
Research, US Department of Commerce, No. w24001.
Cañibano, L., Garcia-Ayuso, M. and Sánchez, P. (2000) Accounting for Intangibles: A
Literature Review. Journal of Accounting Literature 19: 102-130.
Chappell, N. and Jaffe, A. (2016) Intangible Investment and Firm Performance, Review of
Industrial Organization 52: 509–559.
Chen, W., Niebel, T. and Saam, M. (2016) Are intangibles more productive in ICT-intensive
industries? Evidence from EU countries. Telecommunications Policy 40: 471-484.
Chen, W. (2018) Cross‐Country Income Differences Revisited: Accounting for the Role of
Intangible Capital. The Review of Income and Wealth 64: 626-648.
Chun, H., and Nadiri, M.I. (2016) Intangible Investment and Changing Sources of Growth in
Korea. Japanese Economic Review 67: 50-76.
Coe, D.T. and Helpman, E. (1995) International R&D Spillovers. European Economic Review
39: 859–87.
Corrado, C., Haskel, J. and Jona-Lasinio, C. (2016) Intangibles, ICT and Industry Productivity
Growth: Evidence from the EU. In D.W. Jorgenson, K. Fukao and M.P. Timmer (eds.),
The World Economy: Growth or Stagnation? (pp. 319–346). Cambridge University Press,
Cambridge.
Corrado, C., Haskel, J., Jona-Lasinio, C. and Iommi, M. (2013) Innovation and intangible
investment in Europe, Japan, and the United States. Oxford Review of Economic Policy 29:
261-286.
Corrado, C., Haskel, J. and Jona‐Lasinio, C. (2017a) Knowledge spillovers, ICT and
productivity growth. Oxford Bulletin of Economics and Statistics 79: 592-618.
Corrado, C., Haskel, J. and Jona-Lasinio, C. (2017b) Public Intangibles: the Public Sector and
Economic Growth in the SNA.Review of Income and Wealth,
https://doi.org/10.1111/roiw.12325.
Corrado, C., Haskel, J. and Jona-Lasinio, C. (2018) Intangible investment in the EU and US
before and since the Great Recession and its contribution to productivity growth. Journal
of Infrastructure, Policy and Development 2: 1-26.
Corrado, C., Hulten, C. and Sichel, D. (2005) Measuring Capital and Technology: An Expanded
Framework. In C. Corrado, J. Haltiwanger and D. Sichel (eds.), Measuring Capital in the
New Economy (pp. 11-46).University of Chicago Press, Chicago, IL.
Corrado, C., Hulten, C. and Sichel, D. (2009) Intangible Capital and U.S. Economic Growth.
The Review of Income and Wealth 55: 661-685.
Crass, D., Licht, G. and Peters, B. (2015) Intangible Assets and Investments at the Sector Level:
Empirical Evidence for Germany. In A. Bounfour and T. Miyagawa (eds.), Intangibles,
Market Failure and Innovation Performance (pp. 57- 111). Springer, Cham.
Crass, D. and Peters, B. (2014) Intangible assets and firm-level productivity. Centre for
European Research Discussion Paper No. 14-120.
Cummins, J.G. (2005) A New Approach to the Valuation of Intangible Capital. In C. Corrado,
J. Haltiwanger and D. Sichel (eds.), Measuring Capital in the New Economy (pp. 47-72).
University of Chicago Press, Chicago, IL.
22
Dal Borgo, M., Goodridge, P., Haskel, J. and Pesole, A. (2013) Productivity and Growth in UK
Industries: An Intangible Investment Approach. Oxford Bulletin of Economics and
Statistics 75: 806-834.
De, S. and Dutta, D. (2007) Impact of intangible capital on productivity and growth: Lessons
from the Indian information technology software industry. Economic Record 83: 73-86.
Delbecque, V., Bounfour, A. and Barreneche, A. (2015) Intangibles and Value Creation at the
Industrial Level: Delineating Their Complementarities. In A. Bounfour and T. Miyagawa
(eds.), Intangibles, Market Failure and Innovation Performance (pp. 27-56). Springer,
Cham.
Demmou, L., Stefanescu, I. and Arquie, A. (2019) Productivity growth and finance: The role
of intangible assets-a sector level analysis. OECD Economics Department Working Papers
No. 1547.
Dutz, M., Kannebley, S., Scarpelli, M. and Sharma, S. (2012) Measuring intangible assets in an
emerging market economy: An application to Brazil. Policy Research Working Papers,
World Bank.
Edquist, H. (2011) Can Investment in Intangibles Explain the Swedish Productivity Boom in
the 1990s? The Review of Income and Wealth 57: 658-682.
Elnasri, A. and Fox, K.J. (2017) The contribution of research and innovation to productivity.
Journal of Productivity Analysis 47: 291-308.
Fleisher, B.M., McGuire, W.H., Smith, A.N., and Zhou, M. (2015) Knowledge capital,
innovation, and growth in China. Journal of Asian Economics 39: 31-42.
Fukao, K., Miyagawa, T., Mukai, K., Shinoda, Y. and Tonogi, K. (2009) Intangible Investment
in Japan: Measurement and Contribution to Economic Growth. The Review of Income and
Wealth 55: 717-736.
Görzig, B. and Gornig, M. (2013) Intangibles, Can They Explain the Dispersion in Return
Rates? The Review of Income and Wealth 59: 648-664.
Goldar, B. and Parida, Y. (2017) Intangible Capital and Firm Productivity: A Study of Indian
Corporate Sector Firms. South Asia Economic Journal 18: 246-275.
Goodridge, P., Haskel, J. and Wallis, G. (2013) Can intangible investment explain the UK
productivity puzzle? National Institute Economic Review 224: 48-58.
Goodridge, P., Haskel, J. and Wallis, G. (2017) Spillovers from R&D and other intangible
investment: evidence from UK industries. The Review of Income and Wealth 63: 22-48.
Guo-Fitoussi, L., Bounfour, A. and Rekik, S. (2019) Intellectual property rights,
complementarity and the firm's economic performance. International Journal of
Intellectual Property Management 9: 136-165.
Griliches, Z. (1979) Issues in assessing the contribution of research and development to
productivity growth. Bell Journal of economics 10: 92-116.
Griliches, Z. (1981) Market value, R&D, and patents. Economics letters 7: 183-187.
Gros, D. and Roth, F. (2012) The Europe 2020 strategy: Can it maintain the EU’s
competitiveness in the world? Centre for European Policy Studies, Brussels.
Guellec, D. and Van Pottelsberghe de la Potterie, B. (2001) R&D and Productivity Growth:
Panel Data Analysis of 16 OECD Countries. OECD Economic Studies 33: 103–126.
Hall, R. and Jones, I (1999) Why do some countries produce so much more output per worker
than others? Quarterly Journal of Economics 114: 83-116.
Hao, J. X., Manole, V. and Van Ark, B. (2009) Intangible Capital and Growth- An International
Comparison. COINVEST Working Paper D3.6.
Haskel, J. and Westlake, S. (2018a) Capitalism without Capital. Princeton University Press,
Princeton. NJ.

23
Haskel, J. and Westlake, S. (2018b) Productivity and secular stagnation in the intangible
economy. Vox.EU, 31 May, available at: https://voxeu.org/article/productivity-and-
secular-stagnation-intangible-economy.
Heil, M. (2018) Finance and Productivity: A Literature Review. Journal of Economic Surveys
32: 1355-1383.
Hill, R.J. (2009) Introduction to Special Section on Intangible Capital. The Review of Income
and Wealth 55: 658–660.
INNODRIVE Intangibles Database (2011) http://www.innodrive.org/.
Ilmakunnas, P. and Piekkola, H. (2014) Intangible investment in people and productivity.
Journal of Productivity Analysis 41: 443-456.
Jalava, J., Aulin-Ahmavaara, P. and Alanen, A. (2007) Intangible capital in the Finnish business
sector, 1975-2005. ETLA Discussion Papers, No. 1103, The Research Institute of the
Finnish Economy (ETLA), Helsinki.
Jona-Lasinio, C., Iommi, M. and Roth, F. (2011) National Measures of Intangible Capital in the
EU-27 and Norway. In H. Piekkola (eds.), Intangible Capital—Driver of Growth in Europe
(pp. 20–62). Proceedings of the University of Vaasa 167.
Krugman, P. (1994) Competitiveness: A Dangerous Obsession. Foreign Affairs 73: 28-44.
Lalovic, G. and Koman, M. (2018) Do Better Performing Companies Possess More Intangible
Assets: Case of Slovenia. Economic & Business Review 20: 5-50.
Lev, B. and Radhakrishnan, S. (2003) The Measurement of Firm-Specific Organization Capital.
NBER Working Paper No. 9581, National Bureau of Economic Research, Cambridge, MA.
Lev, B. and Radhakrishnan, S. (2005) The Valuation of Organizational Capital. In C. Corrado,
J. Haltiwanger and D. Sichel (eds.), Measuring Capital in the New Economy (pp. 73–110).
University Chicago Press, Chicago, IL.
Lichtenberg, F. (1993) R&D Investment and International Productivity Differences. In H.
Siebert (eds.), Economic Growth in the World Economy (pp. 89–110), J.C.B. Mohr,
Tuebingen.
Marrano, M.G., Haskel, J. and Wallis, G. (2009) What Happened to the Knowledge Economy?
ICT, Intangible Investment, and Britain’s Productivity Record Revisited. The Review of
Income and Wealth 55: 686-716.
Marrocu, E., Paci, R. and Pontis, M. (2012) Intangible capital and firms’ productivity.
Industrial and Corporate Change 21: 377–402.
Melachroinos, K.A. and Spence, N. (2019) The Spatial Footprint of the Knowledge Economy:
The Role of Intangible Investment in Shaping Regional Inequalities in Great Britain.
Tijdschrift voor economische en sociale geografie 110: 442-471.
Miyagawa, T. and Hisa, S. (2013) Estimates of Intangible Investment. Japanese Economic
Review 64: 42-72.
Nakamura, L.I. (1999) Intangibles: What Put the New in the New Economy? Business Review
July/August: 3-16.
Nakamura, L.I. (2001) What is the U.S. Gross Investment in Intangibles? (At Least) one Trillion
Dollars a Year! Federal Reserve Bank of Philadelphia Working Papers Research
Department, Working Paper No. 01-15, Philadelphia, PA.
Nakamura, L.I. (2010) Intangible Assets and National Income Accounting. The Review of
Income and Wealth 56: 55-135.
Niebel, T., O'Mahony, M. and Saam, M. (2017) The Contribution of Intangible Assets to
Sectoral Productivity Growth in the EU. The Review of Income and Wealth 63: 49-67.
OECD (2015), The future of productivity, Paris: OECD.
O’Mahony, M. and Timmer, M.P. (2009) Output, Input and Productivity Measures at the
Industry Level: The EU KLEMS Database. Economic Journal 119: 374– 403.
24
O´Mahony, M., Niebel, T. and Saam, M. (2012) Estimating Intangible Capital by Industry.
INDICSER Discussion Paper 33, Birmingham Business School, Zentrum fuer
Europaeische Wirtschaftsforschung (ZEW) Mannheim.
O’Mahony, M. and Vecchi, M. (2009) R&D, knowledge spillovers and company productivity
performance. Research Policy 38: 35-44.
Park, W.G. (1995) International R&D Spillovers and OECD Economic Growth. Economic
Inquiry 33: 91-571.
Piekkola, H. (2016) Intangible Investment and Market Valuation. Review of Income and Wealth
62: 28-51.
Piekkola, H. (2017) Broad-based intangibles as generators of growth in Europe. Economics of
Innovation and New Technology 27: 377-400.
Ramirez, P.G. and Hachiya, T. (2008) Measuring the contribution of intangibles to productivity
growth: a disaggregated analysis of Japanese firms. Review of Pacific Basin Financial
Markets and Policies 11: 151-186.
Roth, F. and Thum, A.-E. (2013) Intangible Capital and Labour Productivity Growth. Review
of Income and Wealth 59: 486-508.
Roth, F. (2019) Revisiting Intangible Capital and Labour Productivity Growth, 2000-2015:
Accounting for the Crisis and Economic Recovery in the EU. Hamburg Discussion Papers
in International Economics 3, University of Hamburg, Chair of International Economics,
Hamburg.
Shakina, E., Barajas, A., and Molodchik, M. (2017) Bridging the gap in competitiveness of
Russian companies with intangible bricks. Measuring Business Excellence 21: 86-100.
Solow, R.M. (1987) We'd better watch out, New York Times Book Review, 36.
Stehrer, R., Bykova, A., Jäger, K., Reiter, O. and Schwarzhappel, M. (2019) Industry level
growth and productivity data with special focus on intangible assets. Deliverable 3 for DG
ECFIN project Contract No. 2018 ECFIN-116/SI2.784491; forthcoming as wiiw Statistical
Report 8, Vienna Institute for International Economic Studies.
Stiglitz, J., Sen, A. and Fitoussi, J.-P. (2009) Report by the Commission on the Measurement
of Economic Performance and Social Progress (http://www.stiglitz-sen-fitoussi.fr).
Syverson, C. (2011) What Determines Productivity? Journal of Economic Literature 49: 326-
365.
Syverson, C. (2017) Challenges to mismeasurement explanations for the US productivity
slowdown. Journal of Economic Perspectives 31: 165-86.
Teece, D.J. (1998) Capturing Value from Knowledge Assets: The New Economy, Markets for
Know-How, and Intangible Assets. California Management Review 40: 55–79.
Timmer, M.P., Inklaar, R., O’Mahony, M. and van Ark, B. (2010) Economic Growth in Europe.
Cambridge University Press, Cambridge.
Thum-Thysen, A.-E., Voigt, P., Bilbao-Osorio, B., Maier, C. and Ognyanova, D. (2019)
Investment dynamics in Europe: Distinct drivers and barriers for investing in intangible
versus tangible assets? Structural Change and Economic Dynamics 51: 77-88.
Van Ark, B., O’Mahony, M. and Timmer, M.P. (2008) The Productivity Gap between Europe
and the United States: Trends and Causes. Journal of Economic Perspectives 22: 25-44.
Van Ark, B., Hao, J. X., Corrado, C. and Hulten, C. (2009) Measuring intangible capital and its
contribution to economic growth in Europe. European Investment Bank (EIB), Luxemburg,
EIB Papers 14: 62-93.
Van Ark, B. and Jäger, K. (2017) Recent Trends in Europe's Output and Productivity Growth
Performance at the Sector Level, 2002-2015. International Productivity Monitor 33: 8-23.
Van Ark, B. (2016) Europe's Productivity Slowdown Revisited: A comparative perspective to
the United States. In P. Askenazy, L. Bellmann, A. Bryson and E. Moreno Galbis (eds.),
Productivity Puzzles Across Europe. Oxford University Press, Oxford, pp. 26-48.
25
Van Ark, B. and O’Mahony, M. (2016), “Productivity Growth in Europe before and since the
2008/2009 economic and financial crisis”, in D. Jorgensen, K. Fukao and M.P. Timmer
(eds), The World Economy: Growth Stagnation (pp. 111-152). Cambridge University
Press, Cambridge.
Van Rooijen-Horsten, M., Van den Bergen, D. and Tanriseven, M. (2008) Intangible capital in
the Netherlands: A benchmark. Statistics Netherlands Discussion Paper No. 08001,
Voorburg.
Verbič, M., and Polanec, S. (2014) Innovativeness and intangibles in transition: the case of
Slovenia. Economic research-Ekonomska istraživanja 27: 67-85.
Webster, E. (2000) The Growth of Enterprise Intangible Investment in Australia. Information
Economics and Policy 12: 1–25.
World Bank (2006) Where is the Wealth of Nations? Measuring Capital for the 21st Century.
World Bank, Washington, DC.
Yang, S., Zhou, Y. and Song, L. (2018) Determinants of Intangible Investment and Its Impacts
on Firms' Productivity: Evidence from Chinese Private Manufacturing Firms. China &
World Economy 26: 1-26.
Zúñiga‐Vicente, J.A., Alonso‐Borrego, C., Forcadell, F.J. and Galán, J.I. (2012) Assessing the
effect of public subsidies on firm R&D Investment: A survey. Journal of Economic Surveys
28: 36- 67.
Supporting Information
Additional supporting information may be found online in the Supporting Information section
at the end of the article.
Table A1. Summary of the studies at the country level
Table A2. Summary of the studies at the industrial level
Table A3. Summary of the studies at the firm level
Table A4. Summary of studies on complementarity investments and spillover effects
Table A5. Summary of studies on drivers of business intangible investments
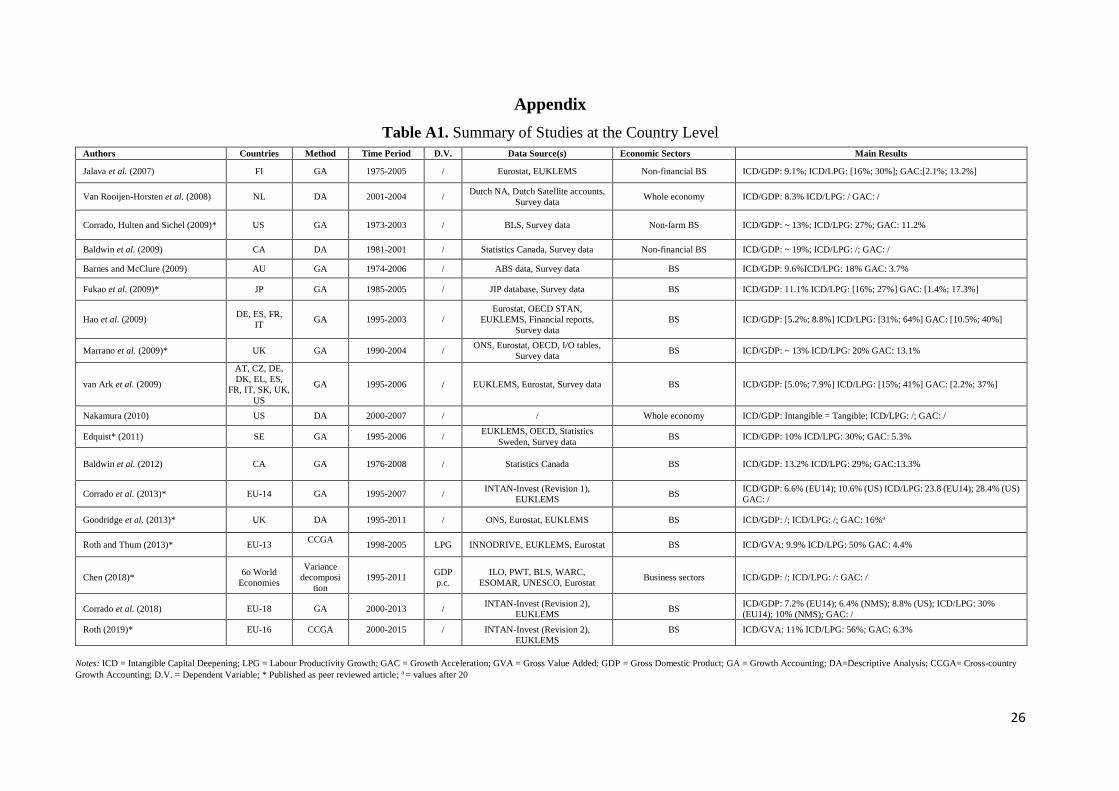
26
Appendix
Table A1. Summary of Studies at the Country Level
Authors Countries Method Time Period D.V. Data Source(s) Economic Sectors Main Results
Jalava et al. (2007) FI GA 1975-2005 / Eurostat, EUKLEMS Non-financial BS ICD/GDP: 9.1%; ICD/LPG: [16%; 30%]; GAC:[2.1%; 13.2%]
Van Rooijen-Horsten et al. (2008) NL DA 2001-2004 / Dutch NA, Dutch Satellite accounts,
Survey data Whole economy ICD/GDP: 8.3% ICD/LPG: / GAC: /
Corrado, Hulten and Sichel (2009)* US GA 1973-2003 / BLS, Survey data Non-farm BS ICD/GDP: ~ 13%; ICD/LPG: 27%; GAC: 11.2%
Baldwin et al. (2009) CA DA 1981-2001 / Statistics Canada, Survey data Non-financial BS ICD/GDP: ~ 19%; ICD/LPG: /; GAC: /
Barnes and McClure (2009) AU GA 1974-2006 / ABS data, Survey data BS ICD/GDP: 9.6%ICD/LPG: 18% GAC: 3.7%
Fukao et al. (2009)* JP GA 1985-2005 / JIP database, Survey data BS ICD/GDP: 11.1% ICD/LPG: [16%; 27%] GAC: [1.4%; 17.3%]
Hao et al. (2009) DE, ES, FR,
IT GA 1995-2003 /
Eurostat, OECD STAN,
EUKLEMS, Financial reports,
Survey data
BS ICD/GDP: [5.2%; 8.8%] ICD/LPG: [31%; 64%] GAC: [10.5%; 40%]
Marrano et al. (2009)* UK GA 1990-2004 / ONS, Eurostat, OECD, I/O tables,
Survey data BS ICD/GDP: ~ 13% ICD/LPG: 20% GAC: 13.1%
van Ark et al. (2009)
AT, CZ, DE,
DK, EL, ES,
FR, IT, SK, UK,
US
GA 1995-2006 / EUKLEMS, Eurostat, Survey data BS ICD/GDP: [5.0%; 7.9%] ICD/LPG: [15%; 41%] GAC: [2.2%; 37%]
Nakamura (2010) US DA 2000-2007 / / Whole economy ICD/GDP: Intangible = Tangible; ICD/LPG: /; GAC: /
Edquist* (2011) SE GA 1995-2006 / EUKLEMS, OECD, Statistics
Sweden, Survey data BS ICD/GDP: 10% ICD/LPG: 30%; GAC: 5.3%
Baldwin et al. (2012) CA GA 1976-2008 / Statistics Canada BS ICD/GDP: 13.2% ICD/LPG: 29%; GAC:13.3%
Corrado et al. (2013)* EU-14 GA 1995-2007 / INTAN-Invest (Revision 1),
EUKLEMS BS
ICD/GDP: 6.6% (EU14); 10.6% (US) ICD/LPG: 23.8 (EU14); 28.4% (US)
GAC: /
Goodridge et al. (2013)* UK DA 1995-2011 / ONS, Eurostat, EUKLEMS BS ICD/GDP: /; ICD/LPG: /; GAC: 16%a
Roth and Thum (2013)* EU-13 CCGA
1998-2005 LPG INNODRIVE, EUKLEMS, Eurostat BS ICD/GVA: 9.9% ICD/LPG: 50% GAC: 4.4%
Chen (2018)* 6o World
Economies
Variance
decomposi
tion
1995-2011 GDP
p.c.
ILO, PWT, BLS, WARC,
ESOMAR, UNESCO, Eurostat Business sectors ICD/GDP: /; ICD/LPG: /: GAC: /
Corrado et al. (2018) EU-18 GA 2000-2013 / INTAN-Invest (Revision 2),
EUKLEMS BS
ICD/GDP: 7.2% (EU14); 6.4% (NMS); 8.8% (US); ICD/LPG: 30%
(EU14); 10% (NMS); GAC: /
Roth (2019)* EU-16 CCGA 2000-2015 / INTAN-Invest (Revision 2),
EUKLEMS
BS ICD/GVA: 11% ICD/LPG: 56%; GAC: 6.3%
Notes: ICD = Intangible Capital Deepening; LPG = Labour Productivity Growth; GAC = Growth Acceleration; GVA = Gross Value Added; GDP = Gross Domestic Product; GA = Growth Accounting; DA=Descriptive Analysis; CCGA= Cross-country
Growth Accounting; D.V. = Dependent Variable; * Published as peer reviewed article; a = values after 20
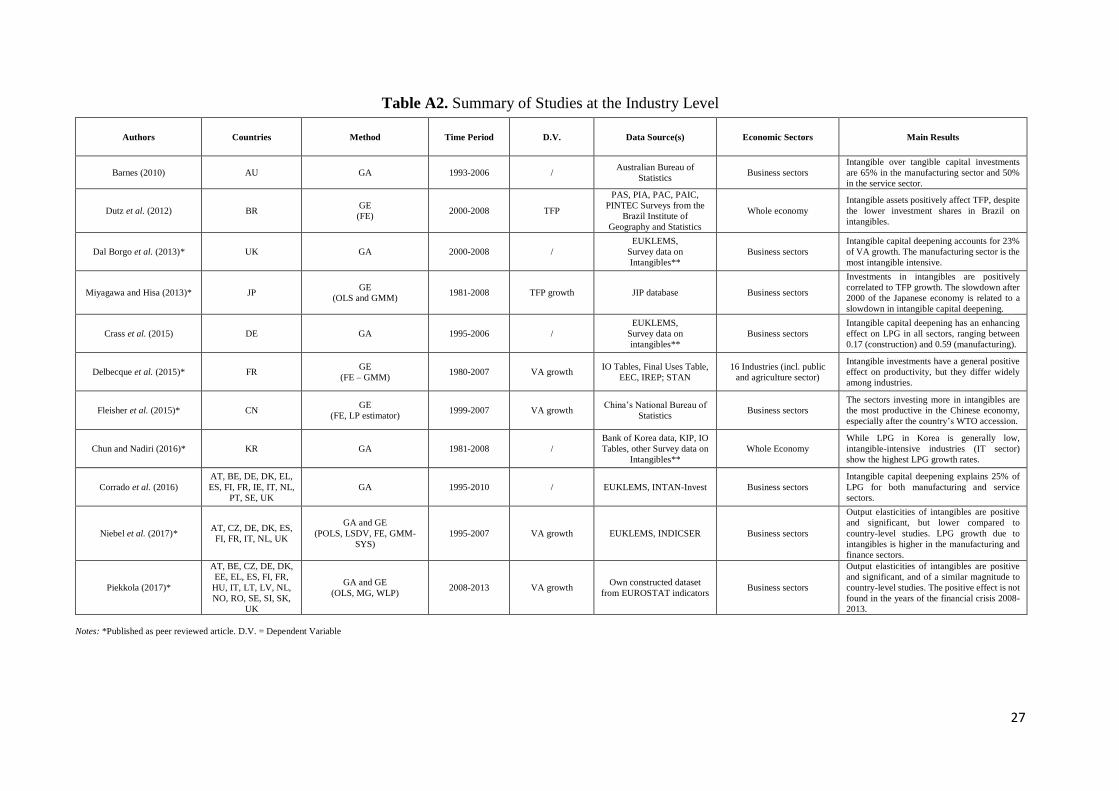
27
Table A2. Summary of Studies at the Industry Level
Authors Countries Method Time Period D.V. Data Source(s) Economic Sectors Main Results
Barnes (2010) AU GA 1993-2006 / Australian Bureau of
Statistics Business sectors
Intangible over tangible capital investments
are 65% in the manufacturing sector and 50%
in the service sector.
Dutz et al. (2012) BR GE
(FE) 2000-2008 TFP
PAS, PIA, PAC, PAIC,
PINTEC Surveys from the
Brazil Institute of
Geography and Statistics
Whole economy
Intangible assets positively affect TFP, despite
the lower investment shares in Brazil on
intangibles.
Dal Borgo et al. (2013)* UK GA 2000-2008 /
EUKLEMS,
Survey data on
Intangibles**
Business sectors
Intangible capital deepening accounts for 23%
of VA growth. The manufacturing sector is the
most intangible intensive.
Miyagawa and Hisa (2013)* JP GE
(OLS and GMM) 1981-2008 TFP growth JIP database Business sectors
Investments in intangibles are positively
correlated to TFP growth. The slowdown after
2000 of the Japanese economy is related to a
slowdown in intangible capital deepening.
Crass et al. (2015) DE GA 1995-2006 /
EUKLEMS,
Survey data on
intangibles**
Business sectors
Intangible capital deepening has an enhancing
effect on LPG in all sectors, ranging between
0.17 (construction) and 0.59 (manufacturing).
Delbecque et al. (2015)* FR GE
(FE – GMM) 1980-2007 VA growth
IO Tables, Final Uses Table,
EEC, IREP; STAN
16 Industries (incl. public
and agriculture sector)
Intangible investments have a general positive
effect on productivity, but they differ widely
among industries.
Fleisher et al. (2015)* CN GE
(FE, LP estimator) 1999-2007 VA growth
China’s National Bureau of
Statistics Business sectors
The sectors investing more in intangibles are
the most productive in the Chinese economy,
especially after the country’s WTO accession.
Chun and Nadiri (2016)* KR GA 1981-2008 /
Bank of Korea data, KIP, IO
Tables, other Survey data on
Intangibles**
Whole Economy
While LPG in Korea is generally low,
intangible-intensive industries (IT sector)
show the highest LPG growth rates.
Corrado et al. (2016)
AT, BE, DE, DK, EL,
ES, FI, FR, IE, IT, NL,
PT, SE, UK
GA 1995-2010 / EUKLEMS, INTAN-Invest Business sectors
Intangible capital deepening explains 25% of
LPG for both manufacturing and service
sectors.
Niebel et al. (2017)* AT, CZ, DE, DK, ES,
FI, FR, IT, NL, UK
GA and GE
(POLS, LSDV, FE, GMM-
SYS)
1995-2007 VA growth EUKLEMS, INDICSER Business sectors
Output elasticities of intangibles are positive
and significant, but lower compared to
country-level studies. LPG growth due to
intangibles is higher in the manufacturing and
finance sectors.
Piekkola (2017)*
AT, BE, CZ, DE, DK,
EE, EL, ES, FI, FR,
HU, IT, LT, LV, NL,
NO, RO, SE, SI, SK,
UK
GA and GE
(OLS, MG, WLP) 2008-2013 VA growth
Own constructed dataset
from EUROSTAT indicators Business sectors
Output elasticities of intangibles are positive
and significant, and of a similar magnitude to
country-level studies. The positive effect is not
found in the years of the financial crisis 2008-
2013.
Notes: *Published as peer reviewed article. D.V. = Dependent Variable
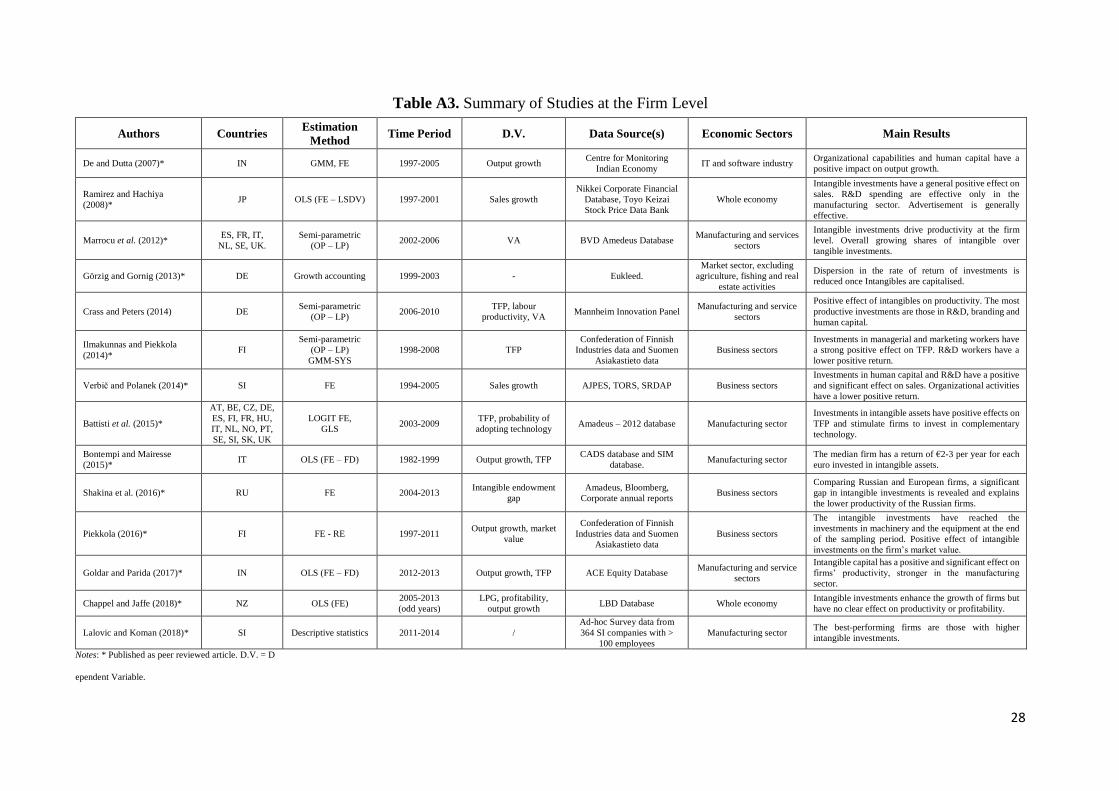
28
Table A3. Summary of Studies at the Firm Level
Authors Countries Estimation
Method Time Period D.V. Data Source(s) Economic Sectors Main Results
De and Dutta (2007)* IN GMM, FE 1997-2005 Output growth Centre for Monitoring
Indian Economy IT and software industry
Organizational capabilities and human capital have a
positive impact on output growth.
Ramirez and Hachiya
(2008)* JP OLS (FE – LSDV) 1997-2001 Sales growth
Nikkei Corporate Financial
Database, Toyo Keizai
Stock Price Data Bank
Whole economy
Intangible investments have a general positive effect on
sales. R&D spending are effective only in the
manufacturing sector. Advertisement is generally
effective.
Marrocu et al. (2012)* ES, FR, IT,
NL, SE, UK.
Semi-parametric
(OP – LP) 2002-2006 VA BVD Amedeus Database
Manufacturing and services
sectors
Intangible investments drive productivity at the firm
level. Overall growing shares of intangible over
tangible investments.
Görzig and Gornig (2013)* DE Growth accounting 1999-2003 - Eukleed.
Market sector, excluding
agriculture, fishing and real
estate activities
Dispersion in the rate of return of investments is
reduced once Intangibles are capitalised.
Crass and Peters (2014) DE Semi-parametric
(OP – LP) 2006-2010
TFP, labour
productivity, VA Mannheim Innovation Panel
Manufacturing and service
sectors
Positive effect of intangibles on productivity. The most
productive investments are those in R&D, branding and
human capital.
Ilmakunnas and Piekkola
(2014)* FI
Semi-parametric
(OP – LP)
GMM-SYS
1998-2008 TFP
Confederation of Finnish
Industries data and Suomen
Asiakastieto data
Business sectors
Investments in managerial and marketing workers have
a strong positive effect on TFP. R&D workers have a
lower positive return.
Verbič and Polanek (2014)* SI FE 1994-2005 Sales growth AJPES, TORS, SRDAP Business sectors
Investments in human capital and R&D have a positive
and significant effect on sales. Organizational activities
have a lower positive return.
Battisti et al. (2015)*
AT, BE, CZ, DE,
ES, FI, FR, HU,
IT, NL, NO, PT,
SE, SI, SK, UK
LOGIT FE,
GLS 2003-2009
TFP, probability of
adopting technology Amadeus – 2012 database Manufacturing sector
Investments in intangible assets have positive effects on
TFP and stimulate firms to invest in complementary
technology.
Bontempi and Mairesse
(2015)* IT OLS (FE – FD) 1982-1999 Output growth, TFP
CADS database and SIM
database. Manufacturing sector
The median firm has a return of €2-3 per year for each
euro invested in intangible assets.
Shakina et al. (2016)* RU FE 2004-2013 Intangible endowment
gap
Amadeus, Bloomberg,
Corporate annual reports Business sectors
Comparing Russian and European firms, a significant
gap in intangible investments is revealed and explains
the lower productivity of the Russian firms.
Piekkola (2016)* FI FE - RE 1997-2011 Output growth, market
value
Confederation of Finnish
Industries data and Suomen
Asiakastieto data
Business sectors
The intangible investments have reached the
investments in machinery and the equipment at the end
of the sampling period. Positive effect of intangible
investments on the firm’s market value.
Goldar and Parida (2017)* IN OLS (FE – FD) 2012-2013 Output growth, TFP ACE Equity Database Manufacturing and service
sectors
Intangible capital has a positive and significant effect on
firms’ productivity, stronger in the manufacturing
sector.
Chappel and Jaffe (2018)* NZ OLS (FE) 2005-2013
(odd years)
LPG, profitability,
output growth LBD Database Whole economy
Intangible investments enhance the growth of firms but
have no clear effect on productivity or profitability.
Lalovic and Koman (2018)* SI Descriptive statistics 2011-2014 /
Ad-hoc Survey data from
364 SI companies with >
100 employees
Manufacturing sector The best-performing firms are those with higher
intangible investments.
Notes: * Published as peer reviewed article. D.V. = D
ependent Variable.
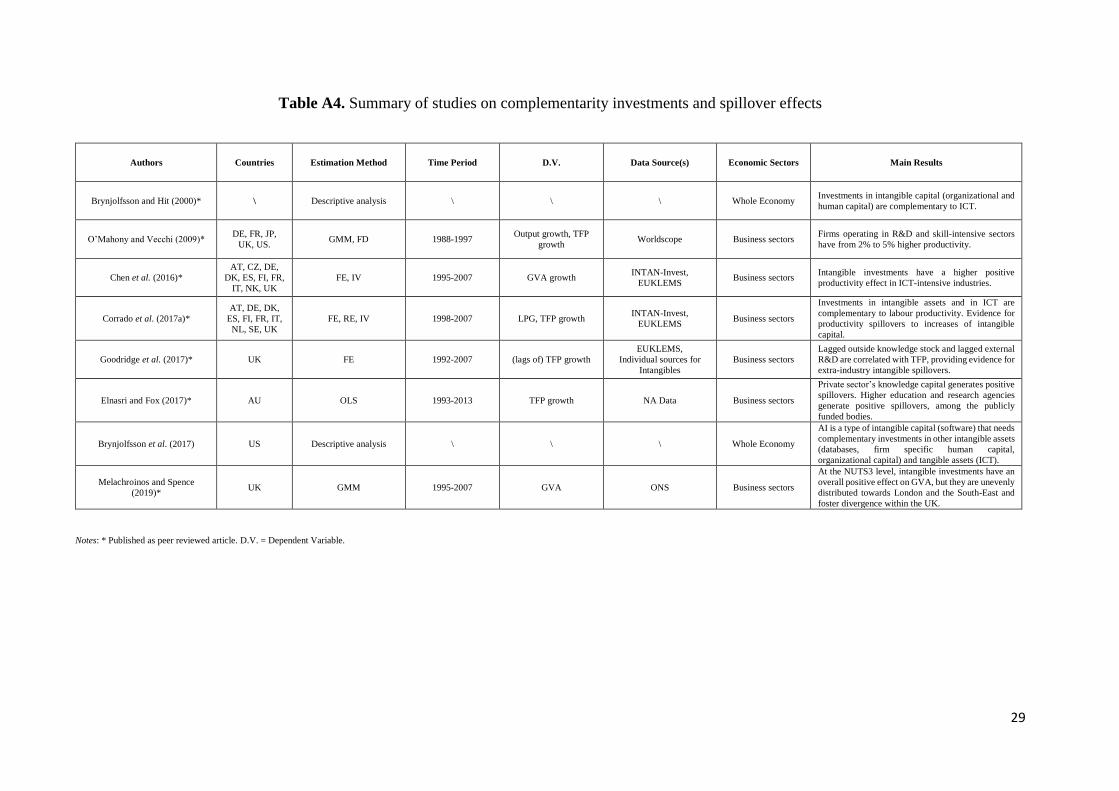
29
Table A4. Summary of studies on complementarity investments and spillover effects
Authors Countries Estimation Method Time Period D.V. Data Source(s) Economic Sectors Main Results
Brynjolfsson and Hit (2000)* \ Descriptive analysis \ \ \ Whole Economy Investments in intangible capital (organizational and
human capital) are complementary to ICT.
O’Mahony and Vecchi (2009)* DE, FR, JP,
UK, US. GMM, FD 1988-1997
Output growth, TFP
growth Worldscope Business sectors
Firms operating in R&D and skill-intensive sectors
have from 2% to 5% higher productivity.
Chen et al. (2016)*
AT, CZ, DE,
DK, ES, FI, FR,
IT, NK, UK
FE, IV 1995-2007 GVA growth INTAN-Invest,
EUKLEMS Business sectors
Intangible investments have a higher positive
productivity effect in ICT-intensive industries.
Corrado et al. (2017a)*
AT, DE, DK,
ES, FI, FR, IT,
NL, SE, UK
FE, RE, IV 1998-2007 LPG, TFP growth INTAN-Invest,
EUKLEMS Business sectors
Investments in intangible assets and in ICT are
complementary to labour productivity. Evidence for
productivity spillovers to increases of intangible
capital.
Goodridge et al. (2017)* UK FE 1992-2007 (lags of) TFP growth
EUKLEMS,
Individual sources for
Intangibles
Business sectors
Lagged outside knowledge stock and lagged external
R&D are correlated with TFP, providing evidence for
extra-industry intangible spillovers.
Elnasri and Fox (2017)* AU OLS 1993-2013 TFP growth NA Data Business sectors
Private sector’s knowledge capital generates positive
spillovers. Higher education and research agencies
generate positive spillovers, among the publicly
funded bodies.
Brynjolfsson et al. (2017) US Descriptive analysis \ \ \ Whole Economy
AI is a type of intangible capital (software) that needs
complementary investments in other intangible assets
(databases, firm specific human capital,
organizational capital) and tangible assets (ICT).
Melachroinos and Spence
(2019)* UK GMM 1995-2007 GVA ONS Business sectors
At the NUTS3 level, intangible investments have an
overall positive effect on GVA, but they are unevenly
distributed towards London and the South-East and
foster divergence within the UK.
Notes: * Published as peer reviewed article. D.V. = Dependent Variable.

30
Table A5. Summary of studies on drivers of business intangible investments
Authors Country(ies) Estimation
Method Time Period D.V. Data Source(s) Economic Sectors Main Results
Gros and Roth (2012) EU-27 OLS 1995-2005 Intangible capital
investments
INNODRIVE,
Eurostat, Governance
indicators
Business sectors
(without agriculture)
Better government effectiveness (efficient judicial
system, rule of law) enhance intangible investments.
Andrews and Criscuolo
(2013) OECD countries
Cross-country
analysis \ \ \ \
Policies designed to enhance knowledge-based capital
formation should target well-functioning labour and
venture capital markets, well defined intellectual
property rights and revisit bankruptcy laws.
Arrighetti et al. (2014)* IT Probit, IV 2001-2003
Probability of being in the
top decile of intangible
investors
Capitalia’s Survey on
Manufacturing firms
and AIDA database
Manufacturing
sector
Larger firm size, better educational skills of the
workforce and higher past levels of intangible
investments increase the likelihood of investing in
intangible assets.
Yang et al. (2018)* CN Probit, Tobit 2011 Intangible capital
investments
China Enterprise
Survey
Manufacturing
sector
Larger firm size and better educational skills of the
workforce increase the likelihood of investing in
intangible capital, while higher market competition
generally lowers it.
Demmou et al. (2019) OECD countries FE 1990-2014 LPG
OECD, IMF, Eurostat,
World Bank,
Compustat.
Whole economy
(excluding public
and financial sectors)
Intangible-intensive industries have the higher benefits
from financial development, from more access to
equity/venture capital and from more efficient
insolvency regimes.
Ahn (2019)* US FE 1986-2016 Tangible and intangible
investments
Compustat, S&P data,
Cboe
Manufacturing
sector
Intangible investments are less responsive to tangible
investments to external shocks, and strongly depends on
their own past levels.
Thum-Thysen et al. (2019)*
AT, BE, DK, FI, FR,
DE, EL, IE, IT, NL,
ES, SE, UK
FE, VIF 1995-2013 Tangible, intangible and
total investments
INTAN-Invest,
EUKLEMS, OECD,
Eurostat
Business sectors
A flexible regulatory framework, higher public R&D
spending, higher levels of Tertiary education are
enhancers of Intangible investments. More favorable
financial conditions enhance only tangible investments.
Notes: * Published as peer reviewed article. D.V. = Dependent Variable.