insurance australia group annual report 2015 - iag … · insurance australia group annual report...
TRANSCRIPT
INSURANCE AUSTRALIA GROUP LIMITED ABN 60 090 739 923
Insurance Australia Group Annual Report 2015
Insurance Australia G
roup Annual R
eport 2015

KEY DATES
2015 financial year end 30 June 2015
Full year results and dividend announcement 21 August 2015
Notice of meeting mailed to shareholders 7 September 2015
Final dividend for ordinary shares
Record date
Payment date
9 September 2015
7 October 2015
Annual general meeting 21 October 2015
Half year end 31 December 2015
Half year results and dividend announcement 18 February 2016*
Interim dividend for ordinary shares
Record date
Payment date
2 March 2016
30 March 2016
**
2016 financial year end 30 June 2016
Full year results and dividend announcement 19 August 2016*
* Please note: dates are subject to change. Any changes will be published via a notice to the Australian Securities Exchange (ASX)
CONTENTS
Five year financial summary 1
Directors’ report 2
Remuneration report 16
Lead auditor’s independence declaration 36
Financial statements 37
Directors’ declaration 98
Independent auditor’s report 99
Shareholder information 101
Corporate directory 104
2015 Annual General MeetingIAG’s 2015 annual general meeting will be held on Wednesday, 21 October 2015, at the City Recital Hall, Angel Place Sydney, commencing at 10.00am. Details of the meeting, including information about how to vote, will be contained in our notice of meeting, which will be mailed to shareholders, and available on line at www.iag.com.au, from Monday, 7 September 2015.
About this report The 2015 annual report of Insurance Australia Group Limited (IAG, or the Group) includes IAG’s full statutory accounts, along with the Directors’ and remuneration reports for the financial year 2015. This year’s corporate governance report is available in the About Us area of our website (www.iag.com.au).
This report should be read with the 2015 annual review, which provides a summary of IAG’s operating performance, including the Chairman’s, CEO’s and CFO’s reviews. If you do not receive a printed copy of the annual review, you can access an interactive version online from the home page of our website at www.iag.com.au.
This year’s annual review includes information about the Group’s shared value strategy and performance. Detailed information about IAG’s non-financial performance is available from www.iag.com.au.
If you would like to have a copy of the annual report or annual review mailed to you, contact IAG’s Share Registry using the contact details on page 104.
All figures are in Australian dollars unless otherwise stated.
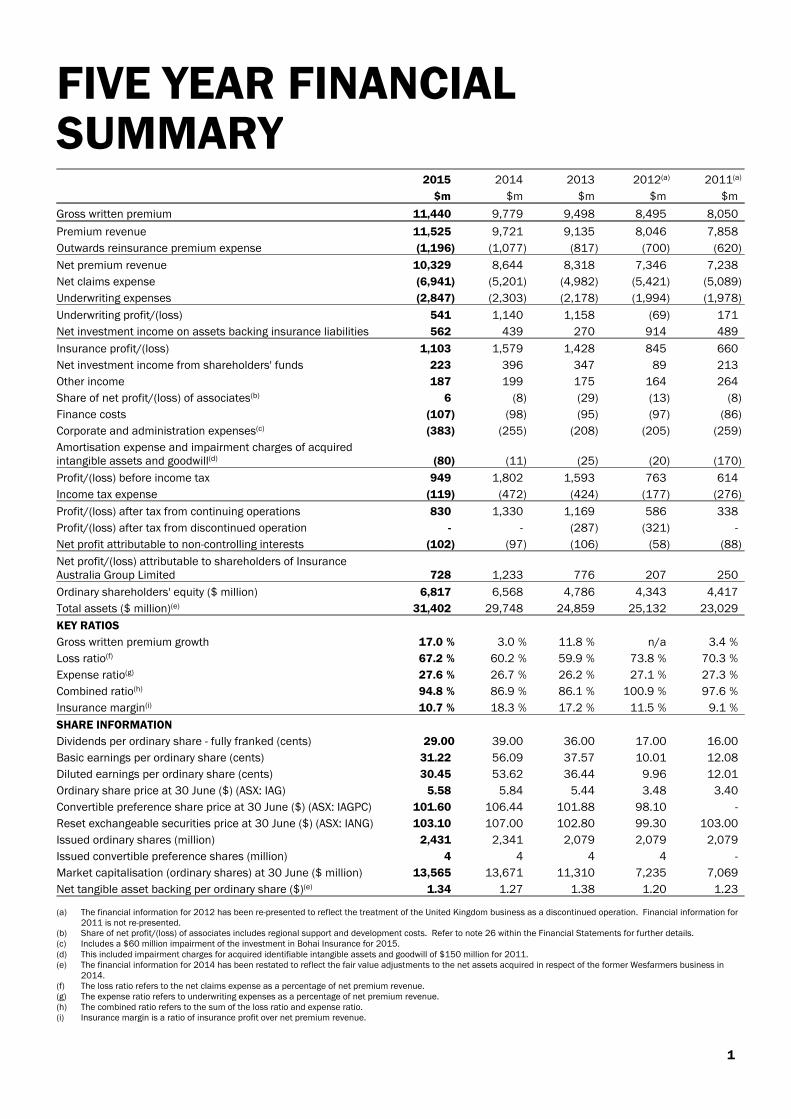
FIVE YEAR FINANCIALSUMMARY
2015 2014 2013 2012(a) 2011(a)
$m $m $m $m $m
Gross written premium 11,440 9,779 9,498 8,495 8,050
Premium revenue 11,525 9,721 9,135 8,046 7,858
Outwards reinsurance premium expense (1,196) (1,077) (817) (700) (620)
Net premium revenue 10,329 8,644 8,318 7,346 7,238
Net claims expense (6,941) (5,201) (4,982) (5,421) (5,089)
Underwriting expenses (2,847) (2,303) (2,178) (1,994) (1,978)
Underwriting profit/(loss) 541 1,140 1,158 (69) 171
Net investment income on assets backing insurance liabilities 562 439 270 914 489
Insurance profit/(loss) 1,103 1,579 1,428 845 660
Net investment income from shareholders' funds 223 396 347 89 213
Other income 187 199 175 164 264
Share of net profit/(loss) of associates(b) 6 (8) (29) (13) (8)
Finance costs (107) (98) (95) (97) (86)
Corporate and administration expenses(c) (383) (255) (208) (205) (259)
Amortisation expense and impairment charges of acquiredintangible assets and goodwill(d) (80) (11) (25) (20) (170)
Profit/(loss) before income tax 949 1,802 1,593 763 614
Income tax expense (119) (472) (424) (177) (276)
Profit/(loss) after tax from continuing operations 830 1,330 1,169 586 338
Profit/(loss) after tax from discontinued operation - - (287) (321) -
Net profit attributable to non-controlling interests (102) (97) (106) (58) (88)
Net profit/(loss) attributable to shareholders of InsuranceAustralia Group Limited 728 1,233 776 207 250
Ordinary shareholders' equity ($ million) 6,817 6,568 4,786 4,343 4,417
Total assets ($ million)(e) 31,402 29,748 24,859 25,132 23,029
KEY RATIOS
Gross written premium growth %17.0 %3.0 %11.8 n/a %3.4
Loss ratio(f) %67.2 %60.2 %59.9 %73.8 %70.3
Expense ratio(g) %27.6 %26.7 %26.2 %27.1 %27.3
Combined ratio(h) %94.8 %86.9 %86.1 %100.9 %97.6
Insurance margin(i) %10.7 %18.3 %17.2 %11.5 %9.1
SHARE INFORMATION
Dividends per ordinary share - fully franked (cents) 29.00 39.00 36.00 17.00 16.00
Basic earnings per ordinary share (cents) 31.22 56.09 37.57 10.01 12.08
Diluted earnings per ordinary share (cents) 30.45 53.62 36.44 9.96 12.01
Ordinary share price at 30 June ($) (ASX: IAG) 5.58 5.84 5.44 3.48 3.40
Convertible preference share price at 30 June ($) (ASX: IAGPC) 101.60 106.44 101.88 98.10 -
Reset exchangeable securities price at 30 June ($) (ASX: IANG) 103.10 107.00 102.80 99.30 103.00
Issued ordinary shares (million) 2,431 2,341 2,079 2,079 2,079
Issued convertible preference shares (million) 4 4 4 4 -
Market capitalisation (ordinary shares) at 30 June ($ million) 13,565 13,671 11,310 7,235 7,069
Net tangible asset backing per ordinary share ($)(e) 1.34 1.27 1.38 1.20 1.23
(a) The financial information for 2012 has been re-presented to reflect the treatment of the United Kingdom business as a discontinued operation. Financial information for2011 is not re-presented.
(b) Share of net profit/(loss) of associates includes regional support and development costs. Refer to note 26 within the Financial Statements for further details.(c) Includes a $60 million impairment of the investment in Bohai Insurance for 2015.(d) This included impairment charges for acquired identifiable intangible assets and goodwill of $150 million for 2011.(e) The financial information for 2014 has been restated to reflect the fair value adjustments to the net assets acquired in respect of the former Wesfarmers business in
2014.(f) The loss ratio refers to the net claims expense as a percentage of net premium revenue.(g) The expense ratio refers to underwriting expenses as a percentage of net premium revenue.(h) The combined ratio refers to the sum of the loss ratio and expense ratio.(i) Insurance margin is a ratio of insurance profit over net premium revenue.
1

DIRECTORS' REPORTThe Directors present their report together with the financial report of Insurance Australia Group Limited and the consolidated financialreport of Insurance Australia Group Limited and its subsidiaries for the financial year ended 30 June 2015 and the Auditor's Reportthereon.
The following terminology is used throughout the financial report: IAG, Parent or Company - Insurance Australia Group Limited; and
Group or Consolidated - the Consolidated entity consists of Insurance Australia Group Limited and its subsidiaries.
DIRECTORS OF INSURANCE AUSTRALIA GROUP LIMITEDThe names and details of the Company's Directors in office at any time during or since the end of the financial year are as follows.Directors were in office for the entire period unless otherwise stated.
CHAIRMANBRIAN (BM) SCHWARTZ AMFCA, FAICD, age 62 - Chairman and Independent Non-Executive DirectorINSURANCE INDUSTRY EXPERIENCEBrian was appointed a Director of IAG in January 2005 and became Chairman in August 2010. He is Chair of IAG's NominationCommittee and a member of the People and Remuneration Committee. He is also the Chairman of Insurance Manufacturers ofAustralia Pty Limited.
OTHER BUSINESS AND MARKET EXPERIENCEBrian is the Deputy Chairman of Westfield Corporation, Deputy Chairman of Scentre Group and the Deputy Chairman of the Board ofFootball Federation Australia Limited.
He was the Chief Executive of Investec Bank (Australia) Ltd from 2005 to 2009. Previously he was with Ernst & Young Australia from1979 to 2004, becoming its Chief Executive in 1998. He was a member of Ernst & Young's Global Board and Managing Partner of theOceania area.
Brian was appointed a member of the Order of Australia in 2004 for his services to business and the community and in 2001 he wasnamed Leading CEO for the Advancement of Women by the Equal Opportunity for Women in the Workplace Agency.
Directorships of other listed companies held in the past three years: Westfield Group, including Westfield Management Limited (which acts as the responsible entity of Carindale Property Trust), since
6 May 2009;
IAG Finance (New Zealand) Limited (a part of the Group), since 26 August 2010;
Scentre Group, since 20 June 2014; and
Brambles Limited (2009-2014).
MANAGING DIRECTORMICHAEL (MJ) WILKINSBCom, MBA, FCA, FAICD, age 58 - Managing Director and Chief Executive OfficerINSURANCE INDUSTRY EXPERIENCEMichael was appointed Managing Director and Chief Executive Officer of IAG in May 2008. He has more than 30 years experience inthe insurance and financial services sector and is a member of the Australian Government's Financial Sector Advisory Council.
Michael was formerly the Managing Director of Promina Group Limited (from 1999 to 2007), and Managing Director of TyndallAustralia Limited (from 1994 to 1999). He is a former Director and President of the Insurance Council of Australia and a formerDirector of the Investment and Financial Services Association (now the Financial Services Council).
OTHER BUSINESS AND MARKET EXPERIENCEIn May 2014, Michael was appointed as a Director of The Geneva Association, the leading international insurance think tank forstrategically important insurance and risk management issues. He is also a Director of Maple-Brown Abbott Limited.
Directorships of other listed companies held in the past three years: IAG Finance (New Zealand) Limited (a part of the Group), since 28 May 2008.
2 IAG ANNUAL REPORT 2015
OTHER DIRECTORSELIZABETH (EB) BRYAN AMBA (Econ), MA (Econ), age 68 - Deputy Chairman and Independent Non-Executive DirectorINSURANCE INDUSTRY EXPERIENCEElizabeth Bryan was appointed as a Director of IAG in December 2014, and as Deputy Chairman in June 2015. She is Chair of IAG'sPeople and Remuneration Committee and a member of the Nomination Committee.
OTHER BUSINESS AND MARKET EXPERIENCEElizabeth is Chairman of Caltex Australia Limited, Chairman of Virgin Australia Holdings Limited, a Director of Westpac BankingCorporation, a member of the Takeovers Panel, a member of the ASIC Director Advisory Panel and President of YWCA NSW.
She was previously the Chairman of UniSuper Limited, where she served as a Director from January 2002 to June 2011.
Elizabeth has extensive experience in the financial services industry and on the boards of companies and statutory organisations. Herexecutive career has included senior roles with a variety of financial institutions, including eight years as the Chief Executive ofDeutsche Asset Management and its predecessor organisation, NSW State Superannuation Investment and Management Corporation.
Directorships of other listed companies held in the past three years: Virgin Australia Holdings Limited, since 2015;
Westpac Banking Corporation, since 2006; and
Caltex Australia Limited, since 2002.
YASMIN (YA) ALLENBCom, FAICD, age 51 - Independent Non-Executive DirectorINSURANCE INDUSTRY EXPERIENCEYasmin Allen was appointed as a Director of IAG in November 2004. She is a member of IAG's People and Remuneration Committee,the Audit Committee and Risk Committee.
OTHER BUSINESS AND MARKET EXPERIENCEYasmin has extensive experience as a company director and as an executive in the investment banking industry. She is a Director ofCochlear Limited and Chairman of its Audit Committee. She is a Director of Santos Limited and a member of the Santos AuditCommittee and its Environment, Health, Safety and Sustainability Committee. Yasmin is a Director of ASX Limited, a member of itsClearing and Settlement Boards and a member of the ASX Audit Committee. She is also a National Director of the Australian Instituteof Company Directors, a Director of the George Institute for Global Health and of the National Portrait Gallery. Previous Non-ExecutiveDirector roles include Chairman of Macquarie Global Infrastructure Funds and a Director with Export Finance and InsuranceCorporation and Film Australia.
Yasmin was formerly a Vice President at Deutsche Bank AG, a Director at ANZ Investment Bank in Australia and an Associate Directorat James Capel UK Ltd (HSBC Group).
Directorships of other listed companies held in the past three years: ASX Limited, since 9 February 2015;
Santos Limited, since 22 October 2014; and
Cochlear Limited, since 2 August 2010.
ALISON (AC) DEANSBA, MBA, GAICD, age 47 - Independent Non-Executive DirectorINSURANCE INDUSTRY EXPERIENCEAlison was appointed as a Director of IAG in February 2013. She is a member of IAG's Audit Committee and Risk Committee.
OTHER BUSINESS AND MARKET EXPERIENCEAlison was formerly CEO of netus, a technology based investment company focused on building consumer web businesses in Australiaand acquired by Fairfax in 2012. She has over 20 years experience in general management and strategy consulting roles focused one-business and media/entertainment in Australia.
She was appointed as an Independent Non-Executive Director of Westpac Banking Corporation in April 2014, Kikki-K in October 2014and of Cochlear Limited in January 2015. Alison has also held Chief Executive roles at eBay Australia and New Zealand, eCorp andHoyts Cinemas.
She is a recipient of the Centenary Medal for services to the business community.
Directorships of other listed companies held in the past three years: Westpac Banking Corporation, since 1 April 2014; and
Cochlear Limited, since 1 January 2015.
3
HUGH (HA) FLETCHERBSc/BCom, MCom (Hons), MBA, age 67 - Independent Non-Executive DirectorINSURANCE INDUSTRY EXPERIENCEHugh was appointed as a Director of IAG in September 2007 and Chairman of IAG New Zealand Limited in September 2003. He is amember of IAG's Audit Committee and Risk Committee.
Hugh was formerly Chairman (and Independent Director since December 1998) of New Zealand Insurance Limited and CGNUAustralia.
OTHER BUSINESS AND MARKET EXPERIENCEHugh is a Non-Executive Director of Rubicon Limited and Vector Limited and a trustee of The University of Auckland Foundation.
Hugh was formerly Chief Executive Officer of Fletcher Challenge Limited, a New Zealand headquartered corporation with assets in theglobal building, energy, forestry and paper industries. He retired from an Executive position in December 1997 after 28 years as anExecutive, 11 of which he served as Chief Executive.
Hugh is a former Deputy Chairman of the Reserve Bank of New Zealand, former member of the Asia Pacific Advisory Committee of theNew York Stock Exchange, former Non-Executive Director of Fletcher Building Limited, and has been involved as an Executive and Non-Executive Director in many countries in Asia, including China, India, Singapore, Indonesia, Malaysia and Thailand.
Directorships of other listed companies held in the past three years: Rubicon Limited, since 23 March 2001;
Vector Limited, since 25 May 2007;
IAG Finance (New Zealand) Limited (a part of the Group), since 31 August 2008; and
Fletcher Building Limited (2001-2012).
RAYMOND (SKR) LIMBEcon, BA, LLM, age 56 - Independent Non-Executive DirectorINSURANCE INDUSTRY EXPERIENCERaymond was appointed as a Director of IAG in February 2013. He is a member of IAG's People and Remuneration Committee.
OTHER BUSINESS AND MARKET EXPERIENCERaymond is Chairman of APS Asset Management and Senior Advisor to the Swire Group. He also serves on several Boards includingthe GIC Pte Ltd, Hong Leong Finance and Raffles Medical Group. He is an adjunct professor at the Lee Kuan School of Public Policy,National University of Singapore and the Nanyang Centre for Public Administration, Nanyang Technological University, Singapore.
Raymond is a former Cabinet minister in the Singapore Government from 2001 to 2011.
Prior to that, he held various senior positions in the financial industry including as a Managing Director of Temasek Holdings, ChiefExecutive Officer of DBS Vickers Securities and Chief Economist of ABN AMRO Asia Securities.
He is a Rhodes Scholar and has degrees in economics and law from the universities of Adelaide, Oxford and Cambridge.
Directorships of other listed companies held in the past three years: Dart Energy Limited (2012-2013).
TOM (TW) POCKETTCA, BCom, age 57 - Independent Non-Executive DirectorINSURANCE INDUSTRY EXPERIENCETom was appointed as a Director of IAG, effective 1 January 2015. He is a member of IAG's Audit Committee and Risk Committee.
OTHER BUSINESS AND MARKET EXPERIENCETom is a Non-Executive Director of Stockland Corporation Limited, a Director of Sunnyfield Independence Association and of O'ConnellSt Associates. He previously spent over 11 years as Chief Financial Officer and over seven years as Finance Director with WoolworthsLimited, and retired from these roles in February 2014 and July 2014 respectively. He remains a Director of ALH Group Pty Ltd,Hydrox Holdings Pty Ltd and The Quantium Group Holdings Pty Limited. Tom has also held senior finance roles at the CommonwealthBank, Lend Lease Corporation and Deloitte.
Directorships of other listed companies held in the past three years: Stockland Corporation Limited, since 1 September 2014; and
Woolworths Limited (2006-2014).
4 IAG ANNUAL REPORT 2015
PHILIP (PJ) TWYMANBSc, MBA, FAICD, age 71 - Independent Non-Executive DirectorINSURANCE INDUSTRY EXPERIENCEPhilip was appointed as a Director of IAG in July 2008. He is Chair of IAG's Risk Committee, Chair of the Audit Committee, and amember of the Nomination Committee.
Philip was formerly Group Executive Director of Aviva plc, one of the world’s largest insurance groups, based in London. He has alsobeen Chairman of Morley Fund Management and Chief Financial Officer of General Accident plc, Aviva plc and AMP Group.
While at Aviva plc and its predecessor groups between 1996 and 2004, Philip had executive responsibility for the group’s insuranceoperations in Asia, Australia, Europe and North America. He has also been responsible for starting and nurturing new insurancebusinesses in China, India, Indonesia and Hong Kong. Overall, Philip has had over 20 years of both Board and Executive level generalinsurance experience.
Philip is on the Boards of Swiss Re in Australia. He was formerly an Independent Non-Executive Director of Perpetual Limited from2004 to 2012, Medibank Private Limited from 2007 to 2012 and Insurance Manufacturers of Australia Pty Limited, a generalinsurance underwriting joint venture with RACV, from April 2007 to July 2008.
OTHER BUSINESS EXPERIENCEPhilip is also on the Board of Tokio Marine Management (Australasia) Pty Ltd.
Directorships of other listed companies held in the past three years: Perpetual Limited (2004-2012).
DIRECTORS WHO CEASED DURING THE FINANCIAL YEAR Peter Bush was a Director from 7 December 2010 to 1 January 2015.
Dr Nora Scheinkestel was a Director from 1 July 2013 to 16 September 2014.
SECRETARY OF INSURANCE AUSTRALIA GROUP LIMITEDCHRIS (CJ) BERTUCHBEc, LLB, LLMChris Bertuch was appointed Group General Counsel & Company Secretary on 11 May 2011. Prior to joining IAG, he held the positionof Group General Counsel & Company Secretary at CSR Limited. Chris joined CSR as a corporate lawyer in 1993 and prior to that wasa partner in the law firm Gadens Lawyers in Sydney. He brings to IAG more than 28 years of experience in corporate, commercial andtrade practices law and dispute resolution. Chris has also completed the Advanced Management Program at Harvard BusinessSchool.
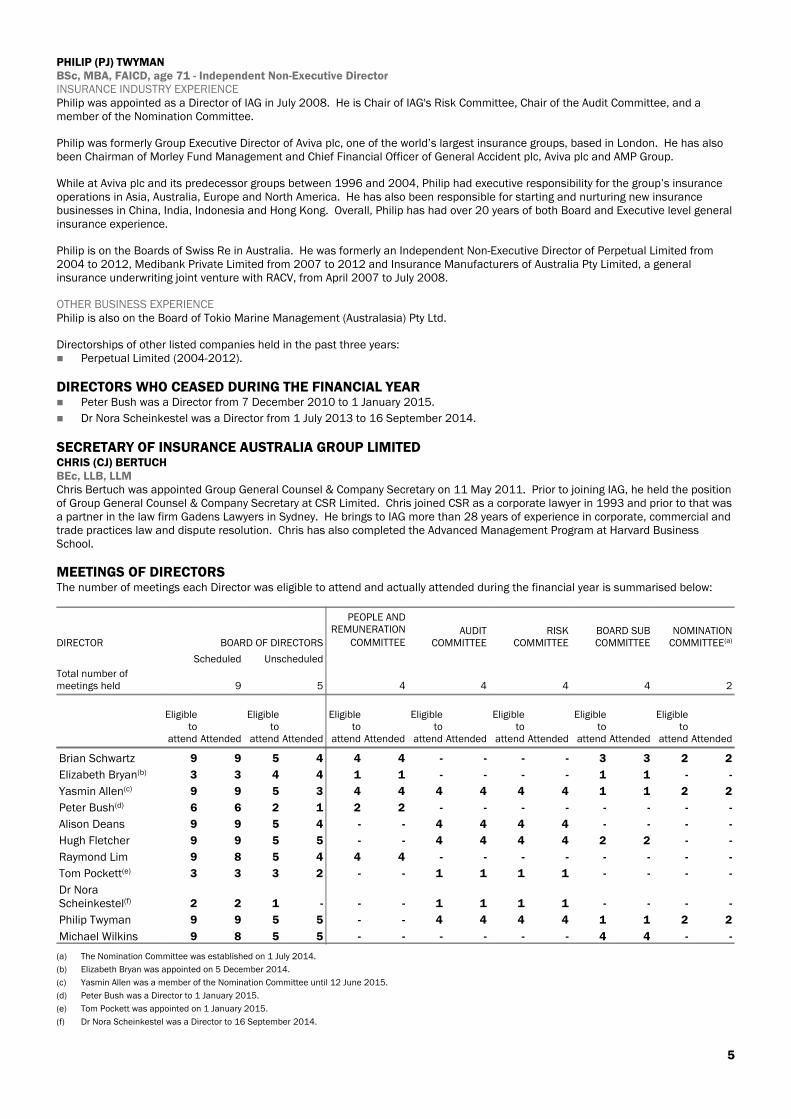
MEETINGS OF DIRECTORSThe number of meetings each Director was eligible to attend and actually attended during the financial year is summarised below:
DIRECTOR BOARD OF DIRECTORS
PEOPLE ANDREMUNERATION
COMMITTEEAUDIT
COMMITTEERISK
COMMITTEEBOARD SUBCOMMITTEE
NOMINATIONCOMMITTEE(a)
Scheduled Unscheduled
Total number ofmeetings held 9 5 4 4 4 4 2
Eligibleto
attend Attended
Eligibleto
attend Attended
Eligibleto
attend Attended
Eligibleto
attend Attended
Eligibleto
attend Attended
Eligibleto
attend Attended
Eligibleto
attend Attended
Brian Schwartz 9 9 5 4 4 4 - - - - 3 3 2 2
Elizabeth Bryan(b) 3 3 4 4 1 1 - - - - 1 1 - -
Yasmin Allen(c) 9 9 5 3 4 4 4 4 4 4 1 1 2 2
Peter Bush(d) 6 6 2 1 2 2 - - - - - - - -
Alison Deans 9 9 5 4 - - 4 4 4 4 - - - -
Hugh Fletcher 9 9 5 5 - - 4 4 4 4 2 2 - -
Raymond Lim 9 8 5 4 4 4 - - - - - - - -
Tom Pockett(e) 3 3 3 2 - - 1 1 1 1 - - - -
Dr NoraScheinkestel(f) 2 2 1 - - - 1 1 1 1 - - - -
Philip Twyman 9 9 5 5 - - 4 4 4 4 1 1 2 2
Michael Wilkins 9 8 5 5 - - - - - - 4 4 - -
(a) The Nomination Committee was established on 1 July 2014.
(b) Elizabeth Bryan was appointed on 5 December 2014.
(c) Yasmin Allen was a member of the Nomination Committee until 12 June 2015.
(d) Peter Bush was a Director to 1 January 2015.
(e) Tom Pockett was appointed on 1 January 2015.
(f) Dr Nora Scheinkestel was a Director to 16 September 2014.
5

PRINCIPAL ACTIVITYThe principal continuing activity of the Group is the underwriting of general insurance and related corporate services and investingactivities.
The Group reports its financial information under the following business division headings: Australia Personal Insurance – provides general insurance products to individuals throughout Australia primarily under the NRMA
Insurance, SGIO, SGIC and CGU brands, in Victoria under the RACV brand (via a distribution and underwriting relationship withRACV) and the Coles Insurance brand nationally (via a distribution agreement with Coles);
Australia Commercial Insurance - provides commercial insurance to business customers throughout Australia, predominantlyunder the CGU, WFI, and Swann Insurance brands through intermediaries including brokers, authorised representatives anddistribution partners;
New Zealand - comprises the general insurance business underwritten through subsidiaries in New Zealand. Insurance productsare sold directly to customers predominantly under the State and AMI brands, and through intermediaries (insurance brokers andauthorised representatives) predominantly under the NZI and Lumley Insurance brands. Personal and commercial products arealso distributed by corporate partners, such as large financial institutions, using third party brands;
Asia - comprises primarily the direct and intermediated insurance business underwritten through subsidiaries in Thailand, Vietnamand Indonesia and the share of the operating result from the investment in associates in Malaysia, India and China. Thebusinesses offer personal and commercial insurance products through local brands; and
Corporate and Other - comprises other activities, including corporate services, capital management activity, placement of theGroup's reinsurance program, inward reinsurance from associates and investment of the shareholders’ funds.
OPERATING AND FINANCIAL REVIEWOPERATING RESULT FOR THE FINANCIAL YEARInsurance Australia Group Limited has produced a sound operating performance in an environment of increasingly competitiveconditions, including a notably softer commercial market. This outcome attests to the strength of the Group’s core franchises inAustralia and New Zealand and the considerable improvement in their collective underlying performance in recent years.
Despite the cyclical industry pressures experienced, like-for-like business volumes and underlying profitability held up well, supportingdelivery of a cash return on equity (ROE) in excess of the Group’s through-the-cycle target of 15%. With a substantial portion of thebenefits from the integration of the former Wesfarmers business and the move to a new operating model in Australia yet to be realised,the Group is well-placed to absorb further competitive pressure and to respond to any cyclical improvement in the medium term.
While Australia and New Zealand are expected to represent the majority of the Group’s earnings base in the foreseeable future, a keyfacet of IAG’s strategy is its pursuit of the long term growth potential in Asia. The Group will continue to pursue appropriateopportunities within its target markets in the region, where low insurance penetration and rising middle class affluence andconsumption present compelling growth prospects. In particular, the Group has expressed an interest in gaining a national exposureto the Chinese market.
The Group's profit after tax for the financial year was $830 million (2014-$1,330 million). After adjusting for non-controlling interestsin the Group result, net profit attributable to the shareholders of the Company was $728 million (2014-$1,233 million). Reportedprofitability in the 2015 financial year was 41% lower than that of the prior year, largely owing to the severe incidence of net naturalperil claim costs, notably in the second half of the current year.
Total gross written premium (GWP) growth of 17.0% (2014-3.0%) primarily reflected the first-time inclusion of the former Wesfarmersbusiness, where related attrition levels remained at the upper end of the Group's 5-10% expectations over the course of the year. In alow growth environment, like-for-like GWP was relatively flat, incorporating: modest GWP growth in personal lines, driven by short tail motor and home products;
heightened competitive pressures in commercial lines, in both Australia and New Zealand, compared to the prior year;
the ongoing relative absence of input cost pressures, resulting in minimal cause for rate increases; and
the maintenance of underwriting discipline in the face of softer pricing, notably in commercial lines.
The reported insurance margin of 10.7% (2014-18.3%) incorporates: net natural peril claim costs of $1,048 million, which were $348 million higher than the related allowance and after exhaustion of
the $150 million reinsurance cover in excess of the current year perils allowance of $700 million;
a reduced favourable impact of $33 million from the narrowing of credit spreads, compared to $100 million in the prior year; and
Prior period net reserve releases of $167 million, inclusive of strengthening related to the New Zealand earthquakes in the 2011financial year. This is equivalent to 1.6% of net earned premium (NEP), down from $248 million (2014-2.9% of NEP) in the prioryear.
In the current financial year the Group materially strengthened its gross claim reserves in respect of the 2010 and 2011 Canterburyearthquake events in New Zealand. The main contributory factors were: the continuing notification of new household claims exceeding the Earthquake Commission’s (EQC) NZ$100,000 residential
dwelling limit;
an increase in forecast repair and rebuild costs; and
a series of adverse court judgements which have affected the insurance industry.
6 IAG ANNUAL REPORT 2015
The bulk of the gross earthquake claim reserve strengthening occurred at the end of the first half of the financial year. A more modestincrease was recognised at 30 June 2015, resulting in gross claim reserves for the February 2011 event exceeding the applicablereinsurance limit of NZ$4 billion and bringing the Group on risk. The loss estimates for the other major earthquake events remain wellbelow their respective reinsurance limits.
While the Group believes it has adopted an appropriate reserving position, given the complexity of the Canterbury earthquake eventsthere remains a degree of uncertainty as to the ultimate cost. As at 30 June 2015, 78% of all earthquake-related claims by numberhad been fully settled (2014-58%).
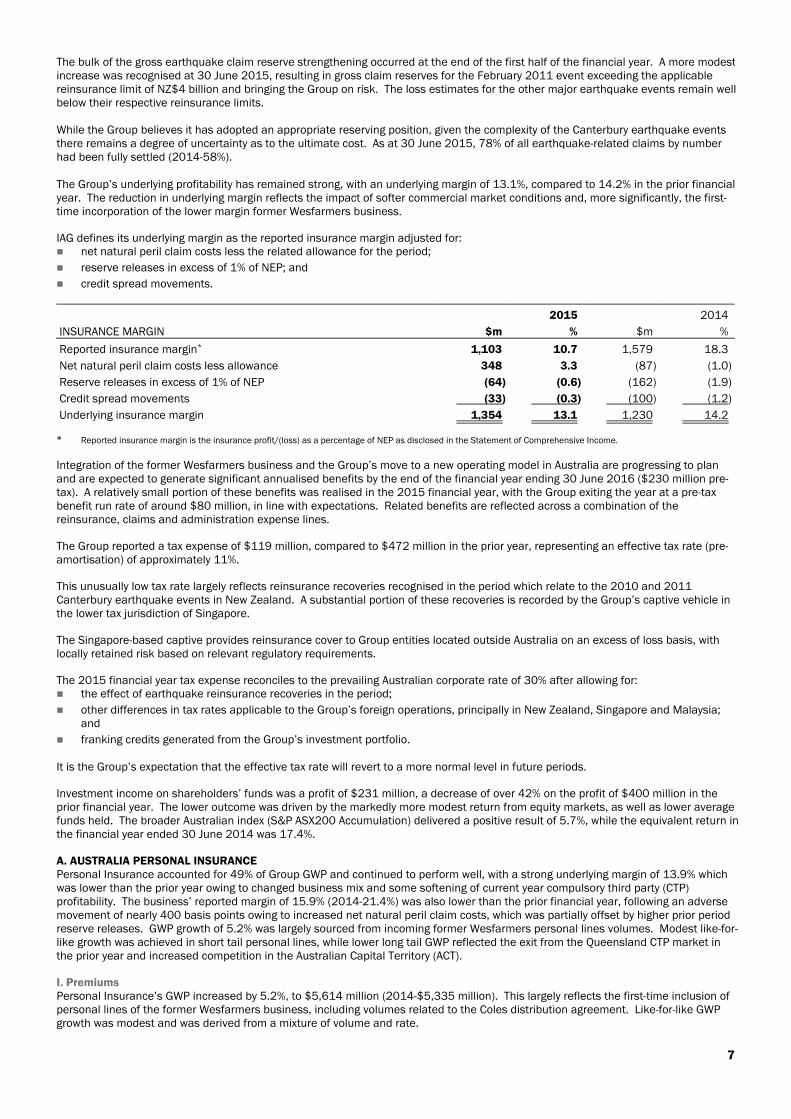
The Group’s underlying profitability has remained strong, with an underlying margin of 13.1%, compared to 14.2% in the prior financialyear. The reduction in underlying margin reflects the impact of softer commercial market conditions and, more significantly, the first-time incorporation of the lower margin former Wesfarmers business.
IAG defines its underlying margin as the reported insurance margin adjusted for: net natural peril claim costs less the related allowance for the period;
reserve releases in excess of 1% of NEP; and
credit spread movements.
2015 2014
INSURANCE MARGIN $m % $m %
Reported insurance margin* 1,103 10.7 1,579 18.3
Net natural peril claim costs less allowance 348 3.3 (87) (1.0)
Reserve releases in excess of 1% of NEP (64) (0.6) (162) (1.9)
Credit spread movements (33) (0.3) (100) (1.2)
Underlying insurance margin 1,354 13.1 1,230 14.2
* Reported insurance margin is the insurance profit/(loss) as a percentage of NEP as disclosed in the Statement of Comprehensive Income.
Integration of the former Wesfarmers business and the Group’s move to a new operating model in Australia are progressing to planand are expected to generate significant annualised benefits by the end of the financial year ending 30 June 2016 ($230 million pre-tax). A relatively small portion of these benefits was realised in the 2015 financial year, with the Group exiting the year at a pre-taxbenefit run rate of around $80 million, in line with expectations. Related benefits are reflected across a combination of thereinsurance, claims and administration expense lines.
The Group reported a tax expense of $119 million, compared to $472 million in the prior year, representing an effective tax rate (pre-amortisation) of approximately 11%.
This unusually low tax rate largely reflects reinsurance recoveries recognised in the period which relate to the 2010 and 2011Canterbury earthquake events in New Zealand. A substantial portion of these recoveries is recorded by the Group’s captive vehicle inthe lower tax jurisdiction of Singapore.
The Singapore-based captive provides reinsurance cover to Group entities located outside Australia on an excess of loss basis, withlocally retained risk based on relevant regulatory requirements.
The 2015 financial year tax expense reconciles to the prevailing Australian corporate rate of 30% after allowing for: the effect of earthquake reinsurance recoveries in the period;
other differences in tax rates applicable to the Group’s foreign operations, principally in New Zealand, Singapore and Malaysia;and
franking credits generated from the Group’s investment portfolio.
It is the Group’s expectation that the effective tax rate will revert to a more normal level in future periods.
Investment income on shareholders’ funds was a profit of $231 million, a decrease of over 42% on the profit of $400 million in theprior financial year. The lower outcome was driven by the markedly more modest return from equity markets, as well as lower averagefunds held. The broader Australian index (S&P ASX200 Accumulation) delivered a positive result of 5.7%, while the equivalent return inthe financial year ended 30 June 2014 was 17.4%.
A. AUSTRALIA PERSONAL INSURANCEPersonal Insurance accounted for 49% of Group GWP and continued to perform well, with a strong underlying margin of 13.9% whichwas lower than the prior year owing to changed business mix and some softening of current year compulsory third party (CTP)profitability. The business’ reported margin of 15.9% (2014-21.4%) was also lower than the prior financial year, following an adversemovement of nearly 400 basis points owing to increased net natural peril claim costs, which was partially offset by higher prior periodreserve releases. GWP growth of 5.2% was largely sourced from incoming former Wesfarmers personal lines volumes. Modest like-for-like growth was achieved in short tail personal lines, while lower long tail GWP reflected the exit from the Queensland CTP market inthe prior year and increased competition in the Australian Capital Territory (ACT).
I. PremiumsPersonal Insurance’s GWP increased by 5.2%, to $5,614 million (2014-$5,335 million). This largely reflects the first-time inclusion ofpersonal lines of the former Wesfarmers business, including volumes related to the Coles distribution agreement. Like-for-like GWPgrowth was modest and was derived from a mixture of volume and rate.
7
The division’s overall GWP performance continued to be characterised by high retention levels, coupled with good conversion of limitednew business opportunities. Notable enhancements to Personal Insurance’s overall customer offering during the financial year werethe release of new funeral and income protection products, both underwritten by a third party. The financial year results also benefitedfrom the new travel insurance product and improved loyalty scheme, both of which were launched late in the previous financial year.
II. Insurance profitPersonal Insurance reported an insurance profit of $788 million for the financial year ended 30 June 2015, compared to $1,016million in the previous year. This equates to a lower reported insurance margin of 15.9% (2014-21.4%).
The main influence on the lower reported margin was the significantly higher level of net natural peril claim costs, which resulted in a3.8% adverse margin effect after allowance, compared to the previous financial year. The combination of higher prior period reservereleases and a lower favourable credit spread effect had a mildly negative impact on the reported margin, compared to the prior year.
At an underlying level, Personal Insurance’s performance remained strong across the year. The lower current year underlying marginreflects the combination of: the first-time inclusion of lower margin former Wesfarmers business volumes, including Coles;
the increased reinvestment in the business; and
some deterioration of CTP profitability owing to the increased level of lower severity claims.
III. CTP adverse development cover (ADC)Effective 1 July 2014, the Group entered into an ADC in respect of its CTP portfolio, providing protection for 30% of any reservedeterioration above the central estimate for losses incurred prior to 30 June 2013. This complements the CTP quota sharearrangement which commenced on 1 July 2013, and has been concluded with the same counterparty. Both elements have beendriven by improved capital efficiency.
The cumulative impact of the CTP quota share and ADC arrangements has been a reduction of approximately $150 million in theGroup’s regulatory capital requirement, approximately $90 million of which was crystallised by the ADC on 1 July 2014.
B. AUSTRALIA COMMERCIAL INSURANCECommercial Insurance recorded GWP growth of over 40%, reflecting the addition of the former Wesfarmers business, where attritionremained of the order of 10%. Like-for-like (ex-Wesfarmers) GWP growth was modestly negative, owing to slightly lower average ratesand the maintenance of underwriting discipline in an increasingly competitive commercial market. The business maintained a doubledigit underlying margin, with the slightly reduced outcome compared to the prior year reflecting inclusion of the lower margin formerWesfarmers business and tougher market conditions. The reported margin of 3.0% was considerably lower than the prior year, largelyowing to an adverse effect of over 1,100 basis points from the combination of significantly higher net natural peril claim costs andlower reserve releases.
I. PremiumsCommercial Insurance GWP of $3,192 million represented growth of 40.7% over the prior financial year (2014-$2,268 million). Thisreflects the first-time inclusion of the former Wesfarmers business, which has delivered a market-leading position in the Australiancommercial insurance market.
Commercial Insurance encountered cyclically softer market conditions over the course of the financial year, resulting in a modestcontraction in reported GWP on a like-for-like (ex-Wesfarmers) basis. While partly reflecting lower input costs which have been passedon to customers, there has also been evidence that general business conditions have resulted in lower average premiums,predominantly on new business.
In all lines of business, Commercial Insurance has maintained a strategy to compete on the strength of its partnerships and the qualityof its service. As such, the business has continued to apply sound underwriting disciplines.
II. Insurance profitCommercial Insurance reported an insurance profit of $93 million, a substantial decrease compared to the previous financial year(2014-$371 million). This equates to a reported insurance margin of 3.0% (2014-18.3%).
The lower reported margin reflects the net effect of: a substantially higher net natural peril claim cost of $426 million, well in excess of allowance;
a $10 million reduction in prior period reserve releases;
a lower, but still favourable, credit spread movement of $14 million (2014-$35 million); and
the first-time inclusion of the lower margin former Wesfarmers business.
Commercial Insurance produced a satisfactory underlying margin of 10.5%, compared to 12.1% in the prior year. This decline is afunction of incorporating the lower margin former Wesfarmers business and the impact of softer commercial market conditions inAustralia.
III. Fee based businessCommercial Insurance generates fee income by acting as an agent under both the NSW and Victorian workers’ compensation schemesthat are underwritten by the respective State governments. Net income from fee based operations was $16 million, compared to $9million in the previous financial year.
8 IAG ANNUAL REPORT 2015
C. NEW ZEALANDNew Zealand continued to perform strongly at an underlying level, while the reported margin was slightly lower than the prior year. Thiswas after an earthquake-related net reserve strengthening which served to reduce the full year outcome by over 600 basis points,partially offset by a favourable natural perils experience, particularly in the first half of the year. The business has maintained itsmarket-leading position, with GWP growth of 22.8% derived from the former Wesfarmers business and a favourable foreign exchangetranslation effect. Modest like-for-like growth in direct personal lines was countered by tougher conditions in the commercial market,where underwriting discipline has been maintained.
I. PremiumsNew Zealand’s GWP of $2,267 million represented an increase of 22.8% over the prior year (2014-$1,846 million). This strong growthreflects the first contribution from Lumley Insurance (Lumley) following its acquisition as part of the Wesfarmers transaction and afavourable exchange rate effect compared to the prior year.
Excluding Lumley, local currency GWP fell slightly, reflecting: softening premium rates and additional capacity in commercial lines;
ongoing aggressive competition across the intermediated business;
a small reduction, primarily in the second half of the year, from the transfer of the health portfolio and the outsourcing of a largeportion of the travel portfolio to third parties; and
offsetting solid growth in direct personal lines, particularly in the home owner and private motor vehicle areas.
II. Insurance profitThe New Zealand business produced an insurance profit of $216 million (2014-$180 million), which was a strong result in acompetitive environment. The result equated to a reported insurance margin of 10.8% (2014-11.5%).
The slightly lower reported insurance margin reflects the combination of: continued focus on pricing and underwriting discipline, while balancing affordability for customers with availability of insurance
capacity;
ongoing operational improvements across the business and the realisation of initial benefits associated with the Lumleyintegration;
relatively benign natural peril activity, despite the pick-up in events in the second half of the financial year; and
reserve strengthening in respect of the 2011 financial year earthquakes, which has seen the Group exceed its reinsurance coverfor the February 2011 event.
The New Zealand business’ underlying margin was consistently strong across the financial year ended 30 June 2015, while absorbinghigh regulatory and reinsurance costs in an increasingly competitive environment.
III. Canterbury RebuildOver the course of the financial year, there was a significant increase in the expected final claim cost arising from the series ofearthquakes that affected the Canterbury region in 2010 and 2011. This was primarily driven by: the continuing notification of new household claims exceeding the Earthquake Commission’s (EQC) NZ$100,000 residential
dwelling limit;
an increase in forecast repair and rebuild costs; and
a series of adverse court judgements which have affected the insurance industry.
The bulk of the increase relates to the 22 February 2011 event. At 30 June 2015, gross claim reserves for the February 2011 eventnow exceed the applicable reinsurance limit of NZ$4 billion, bringing the Group on risk for any further development. Loss estimates forthe other major earthquake events are expected to settle well below respective reinsurance limits.
While the Group believes it has adopted an appropriate reserving position, given the complexity of the Canterbury earthquake eventsthere remains a degree of uncertainty as to the ultimate cost.
All earthquake settlement statistics exclude those related to the Lumley business. Although Lumley’s earthquake claims are beingmanaged by IAG, they are subject to indemnities from the previous owner which result in no future financial exposure for IAG.
D. ASIAIAG’s combined operation in Asia continues to make sound progress towards its long term goals, with the fundamental underwritingperformance of the established businesses remaining strong and developing markets progressing broadly to plan. Asia is expected tobe an important source of long term growth for the Group.
Asia achieved an improved operating performance in the financial year ended 30 June 2015 as it continues to accelerate itsoperational development and enhancement of risk management and governance.
A key milestone in the current financial year was the acquisition at the end of April 2015 of PT Asuransi Parolamas (Parolamas) inIndonesia, fulfilling IAG’s presence in its six target markets in the Asian region. IAG is now focused on securing a distributionagreement with a recognised local partner to capitalise on opportunities presented in a market with a low insurance penetration and agrowing middle-class.
During the year there was a $60 million writedown of the investment in Bohai Property Insurance Company Ltd (Bohai Insurance) inChina. This was influenced by a revision to the expected cash flows of the business, together with the indicated issue price of newshares in a capital raising in which IAG does not intend to participate.
9
I. Divisional resultThe division contributed a total profit of $21 million, including shares of associates and allocated costs. This compares to a $14million profit in the prior financial year, and comprises: strong underlying performances by the established businesses in Thailand and Malaysia;
an improved operating performance from each of the developing businesses in India, China and Vietnam;
a favourable movement in mark-to-market valuations of investments, including those within associates’ shareholders’ funds; and
modestly higher regional support and development costs of $32 million (2014-$31 million).
Asia saw strong growth in consolidated GWP of over 11%, driven by a resumption of growth in Thailand, as more stable politicalconditions benefited economic activity. IAG now participates in a gross regional annualised GWP pool of nearly $1.7 billion, anincrease of over 13% compared to the prior year.
II. Controlled entitiesGWP from the Group's controlled entities was $353 million, which was an increase of over 11% on the corresponding prior financialyear (2014-$317 million), within this: the Thai business (Safety Insurance) reported an increase in GWP of nearly 16% to $334 million from $288 million for the prior
year, reflecting increased focus on the used car market, improved renewal retention, softening rates in the commercial motor andproperty segments and improved domestic demand; and
AAA Assurance in Vietnam recorded GWP equivalent to $18 million (2014-$29 million). The decline of nearly 40% follows thedecision to withdraw from the distribution of loan protection insurance with a bank partner on profitability grounds, which tookeffect from the end of the first quarter of the financial year.
The insurance profit delivered by the controlled entities for the current year was $17 million (2014-$23 million) excluding allocatedcosts. Within this:
the Thai business reported an insurance profit of $15 million, compared to $28 million in the corresponding prior year. Thereduction was driven by a higher incidence of large fire losses, the absence of prior year reserve releases, and increasedcommission costs;
AAA Assurance contributed an insurance profit of $2 million (2014-$5 million loss); and
there was a negligible contribution from Parolamas in Indonesia, which was consolidated by IAG from May 2015. Parolamas hasa GWP base of approximately $12 million per annum.
III. Share of net profit/(loss) of associatesThe Group's share of associates was a profit of $36 million (2014-$22 million), excluding allocated costs and before amortisation.This result includes AmGeneral Holdings Berhad (AmGeneral) in Malaysia, SBI General Insurance Company Limited (SBI General) inIndia, and Bohai Insurance. AmGeneral accounts for the majority of the Group's share of net profit from associates. IAG’s share ofAmGeneral's profit for the current year increased by over 34% to $39 million (2014-$29 million), with higher prior period reservereleases, higher income owing to a favourable mark-to-market movement on the bond portfolio and lower mark-to-market lossesrecognised on the investments backing shareholders' funds all contributing.
E. CORPORATE AND OTHERRevenue has decreased from $411 million in the prior year to $249 million in the financial year ended 30 June 2015. A pre- tax lossof $189 million was reported, which compares to a profit of $209 million in the corresponding prior year. The movements arepredominantly due to lower investment income on shareholders’ funds, net of investment fees, and increased pre-tax net corporateexpenses. The current year result includes $155 million of costs, which primarily comprises restructuring costs in respect of the newoperating model in Australia (implemented from 1 July 2014) and integration costs associated with the acquisition of the formerWesfarmers business.
Further details on the operating segments are set out in the segment reporting note within the Financial Statements.
REVIEW OF FINANCIAL CONDITIONA. FINANCIAL POSITIONThe total assets of the Group as at 30 June 2015 were $31,402 million compared to $29,748 million at 30 June 2014. Movementswithin the overall increase of $1,654 million include: an increase in deferred reinsurance premium of $1,117 million, predominantly relating to recognition of the Berkshire Hathaway
quota share agreement for unearned premium ceded at reporting date;
an increase in reinsurance and other recoveries receivable of $465 million, mainly attributable to the Brisbane hail storm andNSW east coast low events; and
an increase in investments of $158 million from the funds inflow associated with the equity placement to Berkshire Hathaway inJune 2015 and strong investment returns achieved on the technical reserves portfolio, offset by claim payments from natural perilevents.
The total liabilities of the Group as at 30 June 2015 were $24,384 million compared to $22,954 million at 30 June 2014. Theincrease in liabilities of $1,430 million is mainly attributable to: a $681 million increase in gross outstanding claims, predominantly due to the heightened natural perils activity in Australia and
lower discount rates impacting claim reserves on long tail classes; and
an increase in reinsurance premium payable of $884 million, primarily as a result of the Berkshire Hathaway quota shareagreement.
10 IAG ANNUAL REPORT 2015
IAG shareholders’ equity (excluding non-controlling interests) increased from $6,568 million at 30 June 2014 to $6,817 million at 30June 2015, reflecting the combined effect of: the $500 million equity placement to Berkshire Hathaway in June 2015;
a sound operating earnings performance for the financial year, resulting in a net profit attributable to shareholders of $728million; and
payment of the 26 cents per share final dividend declared in respect of the 2014 financial year ($609 million) and the 13 centsper share interim dividend declared in respect of the first half of the 2015 financial year ($304 million).
B. CASH FROM OPERATIONSThe net cash inflows from operating activities for the financial year ended 30 June 2015 were $698 million compared to $1,077million for the prior financial year. The decrease is mainly attributable to the net effect of: an increase in claims costs paid of $1,838 million, mainly attributable to the former Wesfarmers business, natural peril events
and payment of New Zealand earthquake claims;
an increase in outwards reinsurance premium expense paid of $297 million, mainly attributable to additional cover purchased forthe former Wesfarmers business and CTP adverse development cover within Australia Personal Insurance;
a net increase in other operating payments over receipts of $343 million, primarily due to the addition of the former Wesfarmersbusiness; and partially offset by
an increase in premium received of $1,842 million, mainly attributable to the former Wesfarmers business; and
an increase in reinsurance and other recoveries received of $160 million, mainly attributable to the former Wesfarmers business.
C. INVESTMENTSThe Group’s investments totalled $15.5 billion as at 30 June 2015, excluding investments held in joint ventures and associates, withover 70% represented by the technical reserves portfolio. Total investments at 30 June 2014 were $15.4 billion.
As at 30 June 2015, the Group’s overall investment allocation remains conservatively positioned and the credit quality of theinvestment book remains strong, with 81% (2014-86%) of the fixed interest and cash portfolio rated in the 'AA' category or higher.
Technical reserves as at 30 June 2015 accounted for $11.0 billion (2014-$10.4 billion) of the Group's investments, and were entirelyinvested in fixed interest and cash. The current year saw the transfer of assets from shareholders’ funds to technical reserves tosupport earthquake-related liabilities.
The Group’s allocation to growth assets was 41% of the $4.5 billion of shareholders' funds at 30 June 2015 (2014-42%). Includedwithin the Group’s allocation to growth assets are Australian and international equities and alternative investments.
D. INTEREST BEARING LIABILITIESThe Group’s interest bearing liabilities stood at $1,762 million at 30 June 2015, compared to $1,752 million at 30 June 2014. Therewere no changes in composition over the period, with any movement driven by foreign exchange translation effects.
E. CAPITAL MIXThe Group measures its capital mix on a net tangible equity basis, i.e. after deduction of goodwill and intangibles, giving it strongalignment with regulatory and rating agency models. It is IAG’s intention to have a capital mix in the following ranges over the longerterm: ordinary equity (net of goodwill and intangibles) 60-70%; and
debt and hybrids 30-40%.
At 30 June 2015, the Group’s capital mix was in the lower half of the targeted range, with debt and hybrids representing 33.8% (2014-35.4%) of total tangible capitalisation.
F. CAPITAL MANAGEMENTThe Group remains strongly capitalised under APRA's Prudential Standards, with regulatory capital of $4,785 million at 30 June 2015(2014-$4,981 million). The Group has set the following related targeted benchmarks: a total capital position equivalent to 1.4 to 1.6 times the Prescribed Capital Amount (PCA), compared to a regulatory requirement
of 1.0 times; and
a Common Equity Tier 1 (CET1) target range of 0.9 to 1.1 times the PCA, compared to a regulatory requirement of 0.6 times.
At 30 June 2015, the Group had a PCA multiple of 1.70 (2014-1.72) and a CET1 multiple of 1.14 (2014-1.14).
Further capital management details are set out in the capital management note within the Financial Statements.
11
STRATEGYA. STRATEGIC PRIORITIESIAG’s strategic priorities are to:
I. Maintain its market leading position in personal and commercial insurance in Australia and New ZealandIAG is the market leader in personal and commercial insurance in Australia and New Zealand, following the acquisition of the formerWesfarmers business. IAG is focused on embedding and sustaining this position, while maintaining underwriting discipline.
Increased efficiency is being realised via the new operating model in Australia and through the integration of the former Wesfarmersbusiness. This includes the delivery of Enterprise Operations’ operating efficiency programmes and the consolidation of IAG’s ITplatforms and processes.
The new operating model allows IAG to better leverage its scale and market leadership position to deliver great experiences forcustomers and shared value for its partners, people, communities and shareholders.
II. Grow Asian footprint and its earnings contributionThe development of IAG’s business in Asia is progressing to plan, and it is now in the phase of accelerating operational developmentand enhancing risk management and governance. IAG has increased its capability in the region to ensure the potential of the broaderAsian platform is realised over the medium to longer term.
Expansion of IAG’s Asian footprint will result in a higher proportion of GWP coming from this region in the future, and more capitalbeing invested in higher growth insurance markets.
It will support IAG’s vision of being Asia Pacific’s most loved, most inventive and most successful insurer.
III. Accelerate digital transformationThe exponential adoption of new technology is rapidly changing customer and competitor behaviour and creating risks of disruption tothe insurance industry. It is also creating new growth opportunities for companies that embrace the changes to explore new ways tomeet emerging customer needs. IAG has established a new division, IAG Labs, to take advantage of digital opportunities and enablethe Group to become more innovative.
IAG Labs will help the organisation deliver great customer experiences by building the capacity and capability to rapidly develop andtest new customer product and service ideas. IAG Labs incorporates the Group’s core IT functions and is accountable for delivering in-flight strategic IT investments.
Bringing together IAG’s existing technology, digital and venturing teams with its customer insights and analytics teams allows IAG tobetter understand customer needs, deliver great customer outcomes and to innovate at scale. IAG Labs will create new ways ofworking and drive significant cultural change, resulting in a more dynamic and innovative environment.
IV. Create deeper customer insights and an agile responseCustomer needs and behaviours continue to evolve rapidly alongside changes in technology, creating a myriad of new opportunities forcustomers to interact with IAG.
IAG is investing in programmes to drive stronger customer-centricity, including research on customer insights, the development ofcustomer journey maps, and the deployment of human centred design to improve customer and partner experience. IAG is investing inits data and analytics capability to deepen its understanding of customers and their assets, to simplify customer engagementprocesses and to drive customer value by better understanding risk patterns and helping customers minimise the cost of managingrisk. This helps IAG strengthen its market leadership position by delivering superior value to customers.
The new operating model and the establishment of IAG Labs are important initiatives in supporting customer insights, designing bettercustomer experiences and building a more agile organisation.
B. BUSINESS RISK AND RISK MANAGEMENTManaging risk is central to the sustainability of IAG's business, its purpose and delivery of value to shareholders. IAG uses anenterprise approach to risk and its risk management framework is a core part of the governance structure and includes internalpolicies, key management processes and culture. The Risk Management Strategy (RMS) is reviewed annually or as required by theRisk Committee (RC) before being recommended for approval by the Board. IAG’s risk and governance function provides regularreports to the RC on the operation of IAG’s risk management framework, the status of key risks, risk and compliance incidents and riskframework changes. IAG’s Internal Audit function provides reports to the Audit Committee (AC) on significant audit findings and otheraudit related matters.
Roles and responsibilities of the Board and its standing committees, the AC, the RC, the People and Remuneration Committee (PARC)and the Nominations Committee, are set out in the Corporate Governance section of the IAG website.
12 IAG ANNUAL REPORT 2015
The Group is exposed to multiple risks relating to the conduct of its general insurance business. The following risks noted below arenot meant to represent an exhaustive list, but the risks faced by the Group that have been identified by the RMS process: strategic risk: the risk of not achieving corporate or strategic goals;
insurance risk: the risk that the Group is exposed to financial loss, as a result of inadequate or inappropriate underwriting,inadequate or inappropriate product pricing, unforeseen, unknown or unintended liabilities that may eventuate, inadequate orinappropriate claims management including reserving or insurance concentration risk (i.e. by locality, segment factor ordistribution);
reinsurance risk: the risk of insufficient or inappropriate reinsurance coverage, inadequate underwriting and pricing ofreinsurance exposures retained by IAG’s reinsurance captives, inadequate or inappropriate reinsurance recovery management,reinsurance arrangements not legally binding and reinsurance concentration risk;
financial risk: the risk of inadequate liquidity, adverse movements in market prices (equities, derivatives, interest rates, foreignexchange, etc) or inappropriate concentration within investment funds, a counterparty failing to meet its obligations and/orinappropriate capital management; and
operational risk: the risk of loss from inadequate or failed internal processes, people, systems and/or external events.
A disciplined approach to risk management has been adopted and IAG believes this approach provides the greatest long termlikelihood of being able to meet the objectives of all stakeholders, including policyholders, lenders, regulators and shareholders.
Detail of the Group's overall risk management framework, which is outlined in the RMS, is set out in the risk management note withinthe Financial Statements and in the Corporate Governance Statement, which is available on the IAG website.
CORPORATE GOVERNANCEIAG is committed to attaining the highest level of corporate governance to ensure the future sustainability of the organisation and tocreate long term value for its shareholders. To achieve this, IAG promotes a culture that rewards performance, integrity, respect and aconsidered sense of urgency.
IAG's Corporate Governance Statement has been approved by the Board. For the financial year ended 30 June 2015, IAG hascomplied with the Australian Securities Exchange Corporate Governance Council Principles and Recommendations (3rd edition) and iscompliant as at 21 August 2015. Further details on IAG's corporate governance practices and Corporate Governance Statement areavailable at www.iag.com.au/about-us/corporate-governance.
OUTLOOK The outlook for the financial year ending 30 June 2016 is one of relatively flat GWP, as the Group maintains its underwriting disciplinein the face of what is expected to remain a low growth environment, characterised by relatively challenging market conditions andsubdued inflationary pressures.
2016 financial year GWP expectations have been updated since the initial 2016 financial year guidance, of 0-3% growth, as providedon 16 June 2015. This minor revision accommodates the reported 2015 financial year outcome and recent foreign exchangemovements.
Underlying profitability is expected to remain strong, as further benefits from the integration of the former Wesfarmers business andthe move to the new operating model are realised, cushioning the effect of competitive pressures. In addition, implementation of thequota share agreement with Berkshire Hathaway from 1 July 2015 is expected to reduce earnings volatility applicable to 20% of theGroup’s business.
The Group’s reported insurance margin guidance for the 2016 financial year remains at 14-16%. This includes an at least 200 basispoints favourable effect from the implementation of the quota share.
Underlying assumptions behind the reported margin guidance are: net losses from natural perils in line with an allowance of $600 million;
prior period reserve releases of at least 1% of NEP; and
no material movement in foreign exchange rates or investment markets.
The 2016 financial year is also expected to see Asia report a stronger underlying performance, alongside progress in expanding theGroup’s regional footprint, including the dial-up of ownership in India to 49%.
DIVIDENDSDetails of dividends paid or determined to be paid by the Company and the dividend policy employed by the Group are set out in thedividends note within the Financial Statements.
Cash earnings are used for the purposes of targeted ROE and dividend payout policy and are defined as: net profit after tax attributable to IAG shareholders;
plus amortisation and impairment of acquired identifiable intangibles (post-tax); and
excluding any unusual items (non-recurring in nature, for example the expenses associated with restructuring) after tax.
13
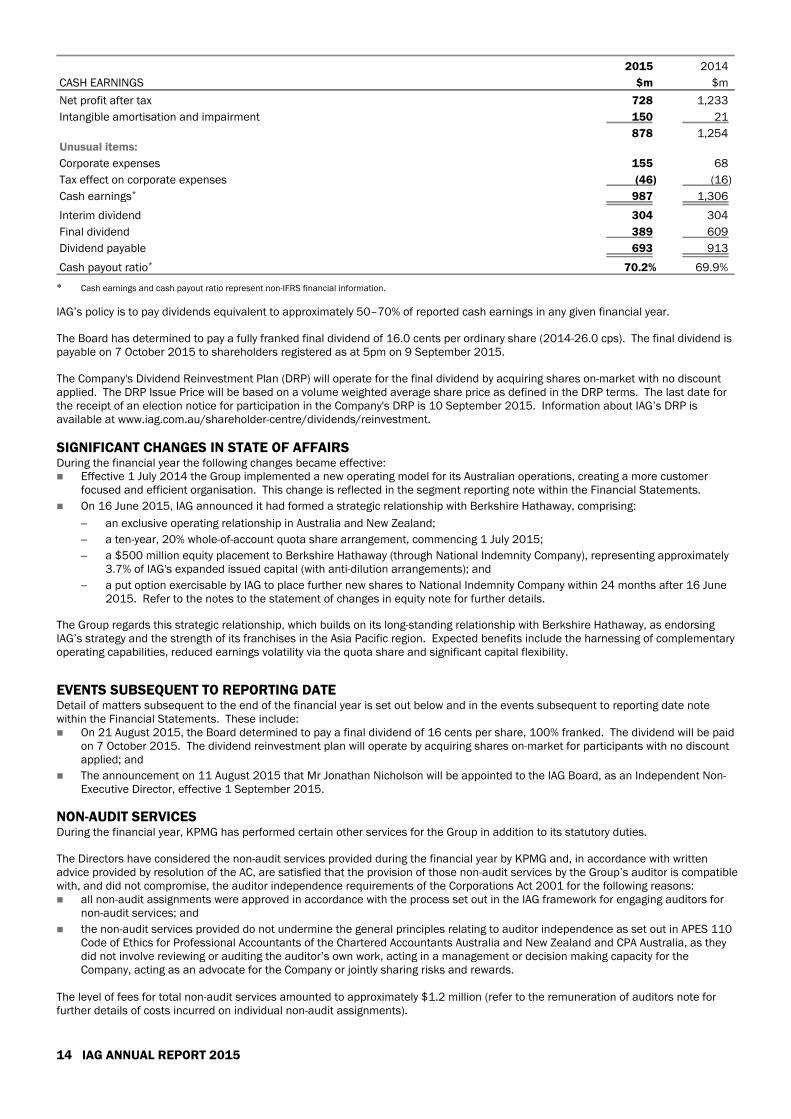
2015 2014
CASH EARNINGS $m $m
Net profit after tax 728 1,233
Intangible amortisation and impairment 150 21
878 1,254Unusual items:
Corporate expenses 155 68
Tax effect on corporate expenses (46) (16)
Cash earnings* 987 1,306
Interim dividend 304 304
Final dividend 389 609
Dividend payable 693 913
Cash payout ratio* 70.2% 69.9%
* Cash earnings and cash payout ratio represent non-IFRS financial information.
IAG’s policy is to pay dividends equivalent to approximately 50–70% of reported cash earnings in any given financial year.
The Board has determined to pay a fully franked final dividend of 16.0 cents per ordinary share (2014-26.0 cps). The final dividend ispayable on 7 October 2015 to shareholders registered as at 5pm on 9 September 2015.
The Company's Dividend Reinvestment Plan (DRP) will operate for the final dividend by acquiring shares on-market with no discountapplied. The DRP Issue Price will be based on a volume weighted average share price as defined in the DRP terms. The last date forthe receipt of an election notice for participation in the Company's DRP is 10 September 2015. Information about IAG’s DRP isavailable at www.iag.com.au/shareholder-centre/dividends/reinvestment.
SIGNIFICANT CHANGES IN STATE OF AFFAIRSDuring the financial year the following changes became effective: Effective 1 July 2014 the Group implemented a new operating model for its Australian operations, creating a more customer
focused and efficient organisation. This change is reflected in the segment reporting note within the Financial Statements.
On 16 June 2015, IAG announced it had formed a strategic relationship with Berkshire Hathaway, comprising:
an exclusive operating relationship in Australia and New Zealand;
a ten-year, 20% whole-of-account quota share arrangement, commencing 1 July 2015;
a $500 million equity placement to Berkshire Hathaway (through National Indemnity Company), representing approximately3.7% of IAG's expanded issued capital (with anti-dilution arrangements); and
a put option exercisable by IAG to place further new shares to National Indemnity Company within 24 months after 16 June2015. Refer to the notes to the statement of changes in equity note for further details.
The Group regards this strategic relationship, which builds on its long-standing relationship with Berkshire Hathaway, as endorsingIAG’s strategy and the strength of its franchises in the Asia Pacific region. Expected benefits include the harnessing of complementaryoperating capabilities, reduced earnings volatility via the quota share and significant capital flexibility.
EVENTS SUBSEQUENT TO REPORTING DATEDetail of matters subsequent to the end of the financial year is set out below and in the events subsequent to reporting date notewithin the Financial Statements. These include: On 21 August 2015, the Board determined to pay a final dividend of 16 cents per share, 100% franked. The dividend will be paid
on 7 October 2015. The dividend reinvestment plan will operate by acquiring shares on-market for participants with no discountapplied; and
The announcement on 11 August 2015 that Mr Jonathan Nicholson will be appointed to the IAG Board, as an Independent Non-Executive Director, effective 1 September 2015.
NON-AUDIT SERVICESDuring the financial year, KPMG has performed certain other services for the Group in addition to its statutory duties.
The Directors have considered the non-audit services provided during the financial year by KPMG and, in accordance with writtenadvice provided by resolution of the AC, are satisfied that the provision of those non-audit services by the Group’s auditor is compatiblewith, and did not compromise, the auditor independence requirements of the Corporations Act 2001 for the following reasons: all non-audit assignments were approved in accordance with the process set out in the IAG framework for engaging auditors for
non-audit services; and
the non-audit services provided do not undermine the general principles relating to auditor independence as set out in APES 110Code of Ethics for Professional Accountants of the Chartered Accountants Australia and New Zealand and CPA Australia, as theydid not involve reviewing or auditing the auditor’s own work, acting in a management or decision making capacity for theCompany, acting as an advocate for the Company or jointly sharing risks and rewards.
The level of fees for total non-audit services amounted to approximately $1.2 million (refer to the remuneration of auditors note forfurther details of costs incurred on individual non-audit assignments).
14 IAG ANNUAL REPORT 2015
LEAD AUDITOR'S INDEPENDENCE DECLARATION UNDER SECTION 307C OF THE CORPORATIONS ACT2001The lead auditor's independence declaration is set out on page 36 and forms part of the Directors' Report for the year ended 30 June2015.
INDEMNIFICATION AND INSURANCE OF DIRECTORS AND OFFICERSThe Company’s constitution contains an indemnity in favour of every person who is or has been: a Director of the Company or a subsidiary of the Company; or
a Secretary of the Company or of a subsidiary of the Company; or
a person making or participating in making decisions that affect the whole or a substantial part of the business of the Company orof a subsidiary of the Company; or
a person having the capacity to affect significantly the financial standing of the Company or of a subsidiary of the Company.
The indemnity applies to liabilities incurred by the person in the relevant capacity (except a liability for legal costs). That indemnity alsoapplies to legal costs incurred in defending or resisting certain legal proceedings. The indemnity does not apply where the Company isforbidden by statute or, if given, would be made void by statute.
In addition, the Company has granted deeds of indemnity to certain current and former Directors and Secretaries and members ofsenior management of the Company and its subsidiaries and associated companies. Under these deeds, the Company: indemnifies, to the maximum extent permitted by law, the former or current Directors or Secretaries or members of senior
management against liabilities incurred by the person in the relevant capacity. The indemnity does not apply where the liability isowed to the Company or any of its subsidiaries or associated companies, or (in general terms) where the liability arises out of alack of good faith, wilful misconduct, gross negligence, reckless misbehaviour or fraud; and
is also required to maintain and pay the premiums on a contract of insurance covering the current or former Directors ormembers of senior management against liabilities incurred in respect of the relevant office except as precluded by law. Theinsurance must be maintained until the seventh anniversary after the date when the relevant person ceases to hold office. Disclosure of the insurance premiums and the nature of liabilities covered by such insurance are prohibited by the relevantcontract of insurance.
ENVIRONMENTAL REGULATIONThe Group's operations are subject to environmental regulations under either Commonwealth or State legislation. These regulationsdo not have a significant impact on the Group's operations. The Board believes that the Group has adequate systems in place for themanagement of its environmental requirements and is not aware of any breach of those environmental requirements as they apply tothe Group.
15

REMUNERATION REPORTLETTER FROM THE PEOPLE AND REMUNERATION COMMITTEE CHAIRMAN
Dear Shareholder
IAG is pleased to present its Remuneration Report for the year ended 30 June 2015.
The People and Remuneration Committee (PARC) reaffirms its commitment to delivering remuneration outcomes that reflect bothbusiness performance and shareholder returns, as well as ensuring IAG is able to continue to attract and retain high qualityexecutives.
To achieve these objectives, IAG’s remuneration structure is underpinned by five key principles: to align remuneration with the interests of IAG’s shareholders;
to motivate employees to achieve superior and sustainable performance and discourage underperformance;
to remain market competitive to attract and retain high quality people;
to clearly communicate the remuneration policy; and
to encourage constructive behaviours and prudent risk taking that support long term financial soundness.
The following table provides a summary of some key highlights for the year ended 30 June 2015:
2015 HIGHLIGHTS SUMMARY
Fixed remuneration remainscompetitive
IAG assesses the fixed remuneration of its Executives against the market. IAG provided Executiveswith a 1.5% increase in the year ended 30 June 2015. On the recommendation of the Executiveteam and in recognition of the difficult market conditions in which we are operating, in August 2015 the PARC determined not to provide further fixed pay increases to our Executive team for the 2016financial year. Our goal continues to be to provide market competitive fixed remuneration that takesinto account an Executive's experience, skills, the internal relativities of IAG’s Executive team andcomparison with external roles.
Short term performance wassound
Short term performance for the year ended 30 June 2015 was sound. Despite a decline in insurancemargin due to adverse natural perils, IAG evolved its operating model in Australia and continued theintegration of the former Wesfarmers business to secure its leading position in both Australia andNew Zealand. Reflecting these achievements, the average Short Term Incentive (STI) payment was61% of the maximum achievable for the Group CEO and Group Executives.
IAG delivers sustained longterm performance
IAG once again exceeded its ROE and relative TSR targets. Based on three and four years of strongreturns as measured by the ROE and TSR components of the LTI plan, both hurdles were met and theLTI for the Group CEO and Executive team tested during the year ended 30 June 2015 vested in full.
Shareholder interests arealigned through a mandatoryshareholding requirement
IAG believes strongly in aligning the interests of Non-Executive Directors (NEDs) and Executives withthose of shareholders. To achieve this alignment, NEDs and Executives are required to hold asignificant number of IAG shares and all exceeded their requirement at 30 June 2015.
To satisfy IAG’s ongoing governance of reward and APRA regulations, we conducted an assessment to determine if any adjustment ofunvested or unexercised equity grants was required. The Board of Directors is satisfied that no adjustment is necessary.
The Board had an independent assessment of its remuneration undertaken. As a consequence, in the year ended 30 June 2015 theBoard increased the fees for the main Board and Committees by 3% to maintain its positioning against the market. In August 2015,the People and Remuneration Committee determined not to increase the main Board fees for the 2016 financial year, consistent withthe approach adopted for executive fixed remuneration. It was determined to increase Committee fees (excluding the NominationsCommittee) to better align these fees to the market.
IAG is committed to ensuring the Remuneration Report presents executive remuneration in a consistent, concise and simple manner,as well as complying with the Corporations Act 2001. As in previous years, in this report the company voluntarily discloses the actualremuneration received by Executives, in addition to meeting our statutory reporting obligations.
The People and Remuneration Committee is confident that IAG’s remuneration framework supports the Group’s financial and strategicgoals now and into the future.
Yours sincerely
Elizabeth BryanChairman - People and Remuneration Committee
16 IAG ANNUAL REPORT 2015
CONTENTS PAGE
A Remuneration explained 17
B 2015 snapshot 19
C Executive remuneration governance 21
D Executive remuneration structure 22
E Linking performance and reward 25
F Executive remuneration outcomes in detail 28
G Executive employment agreements 31
H Non-Executive Director remuneration 32
I Other benefits 33
J Related party interests 33
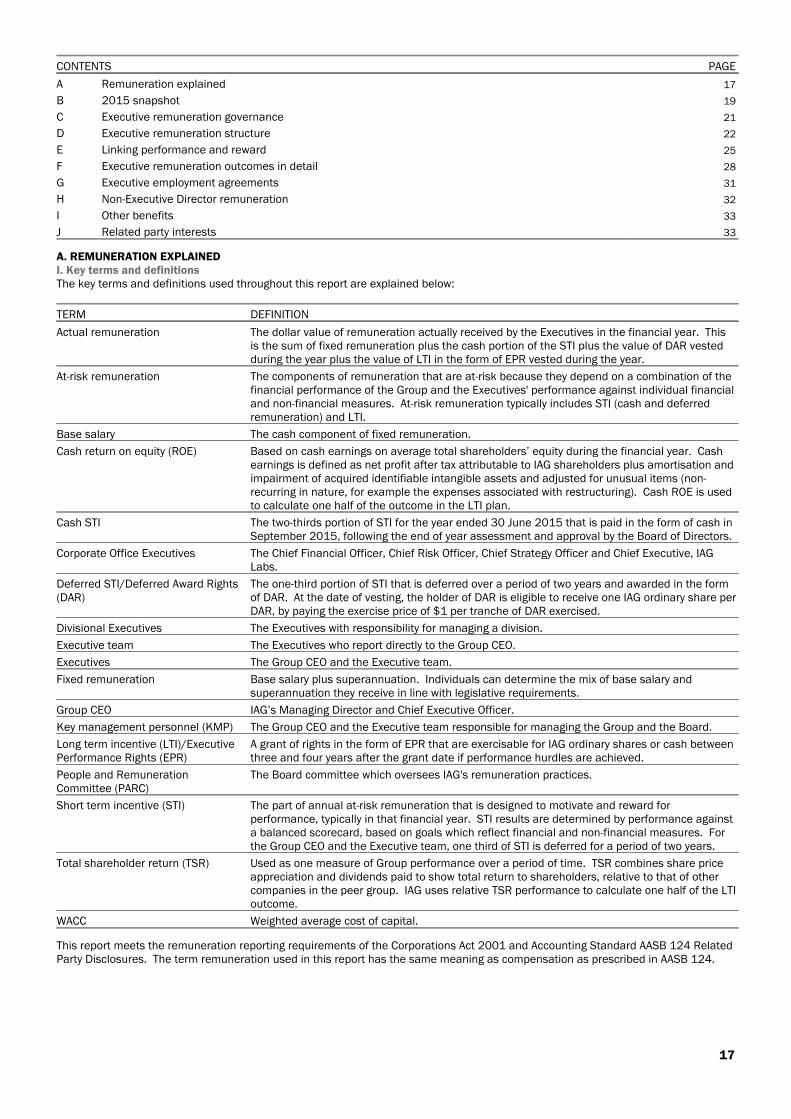
A. REMUNERATION EXPLAINEDI. Key terms and definitionsThe key terms and definitions used throughout this report are explained below:
TERM DEFINITION
Actual remuneration The dollar value of remuneration actually received by the Executives in the financial year. Thisis the sum of fixed remuneration plus the cash portion of the STI plus the value of DAR vestedduring the year plus the value of LTI in the form of EPR vested during the year.
At-risk remuneration The components of remuneration that are at-risk because they depend on a combination of thefinancial performance of the Group and the Executives' performance against individual financialand non-financial measures. At-risk remuneration typically includes STI (cash and deferredremuneration) and LTI.
Base salary The cash component of fixed remuneration.
Cash return on equity (ROE) Based on cash earnings on average total shareholders’ equity during the financial year. Cashearnings is defined as net profit after tax attributable to IAG shareholders plus amortisation andimpairment of acquired identifiable intangible assets and adjusted for unusual items (non-recurring in nature, for example the expenses associated with restructuring). Cash ROE is usedto calculate one half of the outcome in the LTI plan.
Cash STI The two-thirds portion of STI for the year ended 30 June 2015 that is paid in the form of cash inSeptember 2015, following the end of year assessment and approval by the Board of Directors.
Corporate Office Executives The Chief Financial Officer, Chief Risk Officer, Chief Strategy Officer and Chief Executive, IAGLabs.
Deferred STI/Deferred Award Rights(DAR)
The one-third portion of STI that is deferred over a period of two years and awarded in the formof DAR. At the date of vesting, the holder of DAR is eligible to receive one IAG ordinary share perDAR, by paying the exercise price of $1 per tranche of DAR exercised.
Divisional Executives The Executives with responsibility for managing a division.
Executive team The Executives who report directly to the Group CEO.
Executives The Group CEO and the Executive team.
Fixed remuneration Base salary plus superannuation. Individuals can determine the mix of base salary andsuperannuation they receive in line with legislative requirements.
Group CEO IAG’s Managing Director and Chief Executive Officer.
Key management personnel (KMP) The Group CEO and the Executive team responsible for managing the Group and the Board.
Long term incentive (LTI)/ExecutivePerformance Rights (EPR)
A grant of rights in the form of EPR that are exercisable for IAG ordinary shares or cash betweenthree and four years after the grant date if performance hurdles are achieved.
People and RemunerationCommittee (PARC)
The Board committee which oversees IAG's remuneration practices.
Short term incentive (STI) The part of annual at-risk remuneration that is designed to motivate and reward forperformance, typically in that financial year. STI results are determined by performance againsta balanced scorecard, based on goals which reflect financial and non-financial measures. Forthe Group CEO and the Executive team, one third of STI is deferred for a period of two years.
Total shareholder return (TSR) Used as one measure of Group performance over a period of time. TSR combines share priceappreciation and dividends paid to show total return to shareholders, relative to that of othercompanies in the peer group. IAG uses relative TSR performance to calculate one half of the LTIoutcome.
WACC Weighted average cost of capital.
This report meets the remuneration reporting requirements of the Corporations Act 2001 and Accounting Standard AASB 124 RelatedParty Disclosures. The term remuneration used in this report has the same meaning as compensation as prescribed in AASB 124.
17
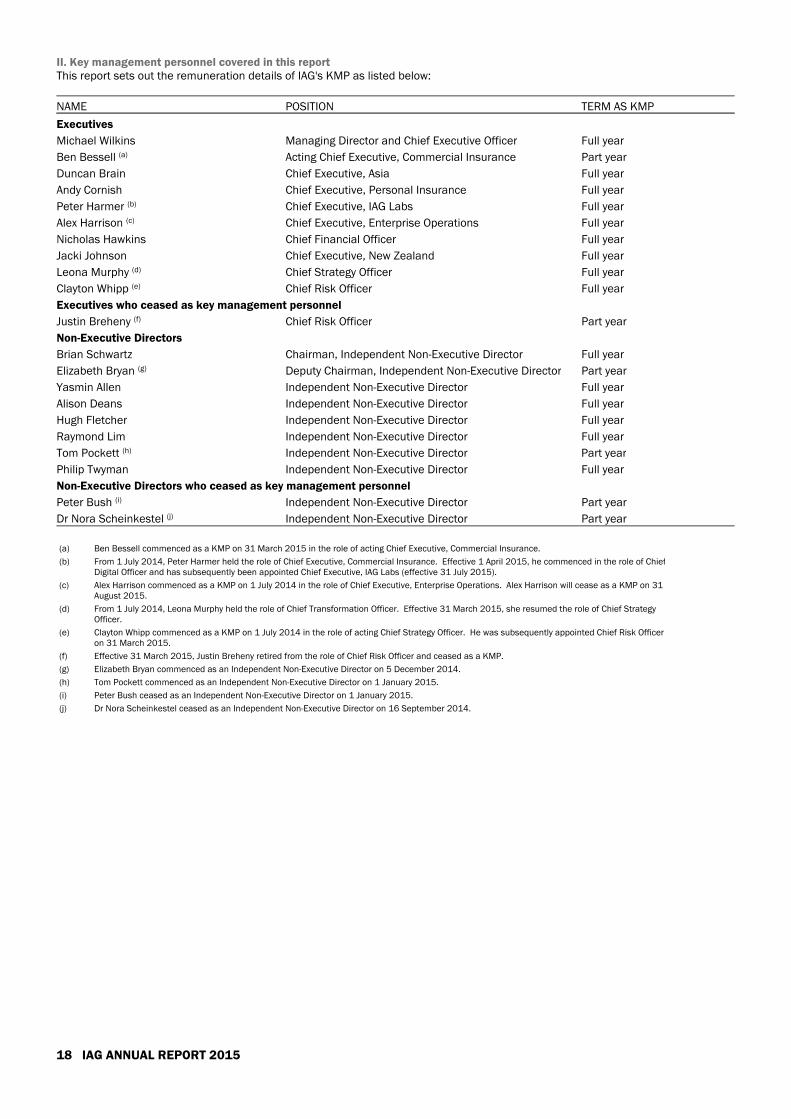
II. Key management personnel covered in this reportThis report sets out the remuneration details of IAG's KMP as listed below:
NAME POSITION TERM AS KMP
Executives
Michael Wilkins Managing Director and Chief Executive Officer Full year
Ben Bessell (a) Acting Chief Executive, Commercial Insurance Part year
Duncan Brain Chief Executive, Asia Full year
Andy Cornish Chief Executive, Personal Insurance Full year
Peter Harmer (b) Chief Executive, IAG Labs Full year
Alex Harrison (c) Chief Executive, Enterprise Operations Full year
Nicholas Hawkins Chief Financial Officer Full year
Jacki Johnson Chief Executive, New Zealand Full year
Leona Murphy (d) Chief Strategy Officer Full year
Clayton Whipp (e) Chief Risk Officer Full year
Executives who ceased as key management personnel
Justin Breheny (f) Chief Risk Officer Part year
Non-Executive Directors
Brian Schwartz Chairman, Independent Non-Executive Director Full year
Elizabeth Bryan (g) Deputy Chairman, Independent Non-Executive Director Part year
Yasmin Allen Independent Non-Executive Director Full year
Alison Deans Independent Non-Executive Director Full year
Hugh Fletcher Independent Non-Executive Director Full year
Raymond Lim Independent Non-Executive Director Full year
Tom Pockett (h) Independent Non-Executive Director Part year
Philip Twyman Independent Non-Executive Director Full year
Non-Executive Directors who ceased as key management personnel
Peter Bush (i) Independent Non-Executive Director Part year
Dr Nora Scheinkestel (j) Independent Non-Executive Director Part year
(a) Ben Bessell commenced as a KMP on 31 March 2015 in the role of acting Chief Executive, Commercial Insurance.
(b) From 1 July 2014, Peter Harmer held the role of Chief Executive, Commercial Insurance. Effective 1 April 2015, he commenced in the role of ChiefDigital Officer and has subsequently been appointed Chief Executive, IAG Labs (effective 31 July 2015).
(c) Alex Harrison commenced as a KMP on 1 July 2014 in the role of Chief Executive, Enterprise Operations. Alex Harrison will cease as a KMP on 31August 2015.
(d) From 1 July 2014, Leona Murphy held the role of Chief Transformation Officer. Effective 31 March 2015, she resumed the role of Chief StrategyOfficer.
(e) Clayton Whipp commenced as a KMP on 1 July 2014 in the role of acting Chief Strategy Officer. He was subsequently appointed Chief Risk Officeron 31 March 2015.
(f) Effective 31 March 2015, Justin Breheny retired from the role of Chief Risk Officer and ceased as a KMP.
(g) Elizabeth Bryan commenced as an Independent Non-Executive Director on 5 December 2014.
(h) Tom Pockett commenced as an Independent Non-Executive Director on 1 January 2015.
(i) Peter Bush ceased as an Independent Non-Executive Director on 1 January 2015.
(j) Dr Nora Scheinkestel ceased as an Independent Non-Executive Director on 16 September 2014.
18 IAG ANNUAL REPORT 2015

B. 2015 SNAPSHOTI. Actual remuneration received by ExecutivesThe actual remuneration paid to Executives during this and the previous financial year is set out below. IAG discloses actualremuneration voluntarily for increased transparency. Actual remuneration includes fixed remuneration, other benefits and leaveaccruals, termination payments and cash STI paid, as well as any deferred STI or LTI that vested in the relevant financial year. Forremuneration details provided in accordance with the Accounting Standards refer to Section F.
TABLE 1 - ACTUAL REMUNERATION RECEIVED IN 2015 AND 2014
NAMEFINANCIAL
YEAR FIXED PAY
OTHERBENEFITS AND
LEAVEACCRUALS
TERMINATIONPAYMENTS CASH STI
DEFERRED STIVESTED LTI VESTED
TOTAL ACTUALREMUNERATION
RECEIVED
$000 $000 $000 $000 $000 $000 $000
(1) (2) (3) (4) (5) (6) (7)
EXECUTIVES
Michael Wilkins 2015 2,112 232 - 1,314 1,232 5,514 10,404
2014 2,077 253 - 1,796 1,243 6,038 11,407
Ben Bessell(8) 2015 123 (7) - 65 - - 181
Duncan Brain(9) 2015 921 263 - 469 210 429 2,292
2014 679 378 - 347 - - 1,404
Andy Cornish(10) 2015 1,052 93 - 602 469 2,290 4,506
2014 879 (54) - 487 590 2,457 4,359
Peter Harmer 2015 1,012 (23) - 473 432 2,152 4,046
2014 995 (26) - 704 326 1,672 3,671
Alex Harrison(9) 2015 849 51 - 611 192 397 2,100
2014 218 (1) - 125 - - 342
Nicholas Hawkins 2015 1,012 56 - 603 463 2,198 4,332
2014 995 (11) - 731 489 2,342 4,546
Jacki Johnson(11) 2015 1,096 (43) - 418 398 1,949 3,818
2014 1,048 37 - 565 409 2,222 4,281
Leona Murphy 2015 910 38 - 505 411 1,981 3,845
2014 895 13 - 569 431 2,109 4,017
Clayton Whipp 2015 755 64 - 341 211 367 1,738
EXECUTIVES WHO CEASED AS KEY MANAGEMENT PERSONNEL
Justin Breheny(12) 2015 702 205 - 546 446 2,024 3,923
2014 915 193 - 579 490 2,222 4,399
TABLE NOTE
(1) Represents base salary plus superannuation and included an annual pay increase of 1.5% effective September 2014.
(2) Includes benefits such as a 30% tax rebate on car allowances and movements in annual leave and long service leave accruals during the relevant financial year. Detailsare provided in table 9 in Section F.
(3) No termination payments were made to Executives in the 2015 financial year.
(4) Represents two thirds of the STI for the relevant financial year. Details are provided in table 6 in Section E.
(5) Deferred STI that vested in the relevant financial year. Details are provided in table 10 in Section F. The five day weighted average share price used to value thedeferred STI at vesting date is $6.49 for awards vested on 1 September 2014. For the financial year ended 30 June 2014 the prices were $5.47 for awards vested on1 July 2013 and $5.78 for awards vested on 1 September 2013.
(6) LTI that vested in the relevant financial year. Details of the plan are provided in table 11 in Section F. The five day weighted average share price at vesting date is$6.27 for awards vested on 20 August 2014 and $6.18 for awards vested on 30 September 2014 (23 August 2013: $5.83 - 30 September 2013: $5.88).
(7) Total remuneration received in the relevant financial year (the sum of columns 1 to 6).
(8) Remuneration reported for Ben Bessell relates only to his role as Acting Chief Executive, Commercial Insurance, which commenced on 31 March 2015. Share basedremuneration provided in the current financial year did not relate to his role as Acting Chief Executive, Commercial Insurance and has not been disclosed.
(9) Remuneration for Duncan Brain and Alex Harrison has increased as for the first time both executives were KMP for the full period in the year ended 30 June 2015. Inthe 2014 financial year, no share based payments were disclosed for these executives as those payments were not related to their roles as KMP.
(10) Remuneration received by Andy Cornish was higher in the year ended 30 June 2015 than the previous financial year as he took a three-month period of unpaid leave inthe 2014 financial year.
(11) Remuneration for Jacki Johnson is determined in New Zealand dollars and reported in Australian dollars. Foreign exchange movements affect the value of remunerationdisclosed. The exchange rate used to report Jacki Johnson’s remuneration in the year ended 30 June 2015 was NZD1 = AUD0.93060 (2014-NZD1 = AUD0.90485).
(12) Other benefits received by Justin Breheny include the accrual of annual and long service leave, the value of the interest that would have accrued on his loan plus therelated FBT and accommodation allowance.
19
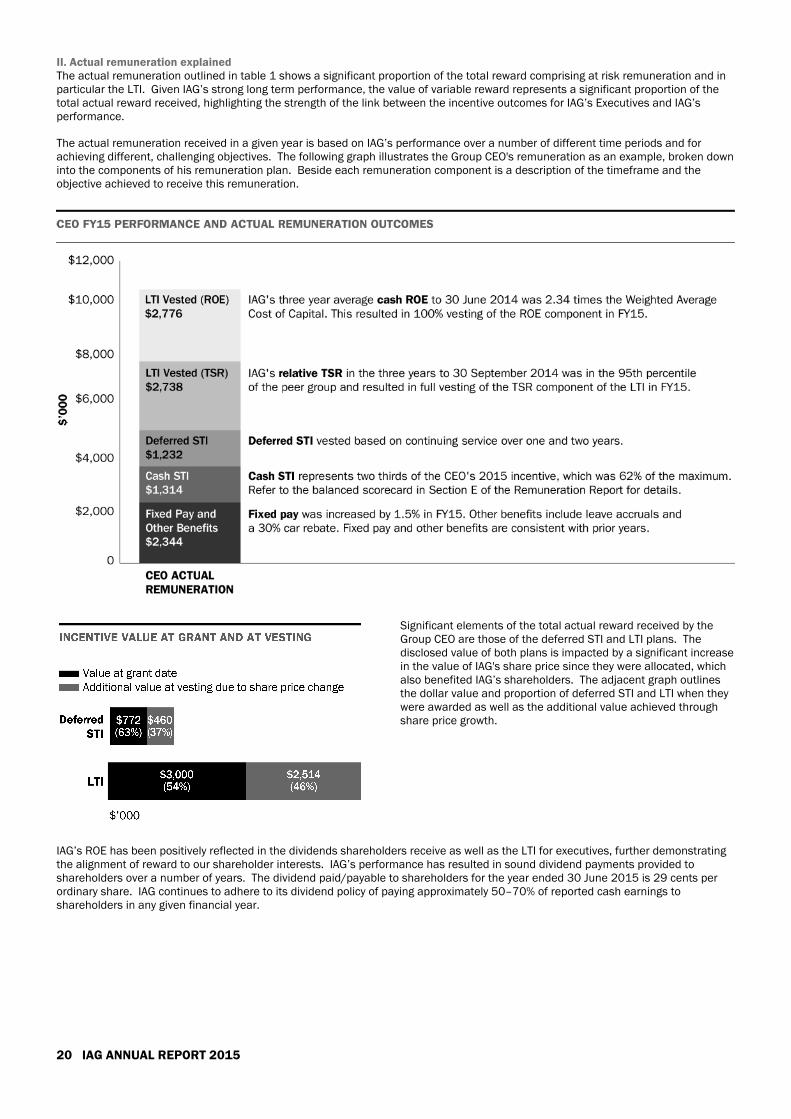
II. Actual remuneration explainedThe actual remuneration outlined in table 1 shows a significant proportion of the total reward comprising at risk remuneration and inparticular the LTI. Given IAG’s strong long term performance, the value of variable reward represents a significant proportion of thetotal actual reward received, highlighting the strength of the link between the incentive outcomes for IAG’s Executives and IAG’sperformance.
The actual remuneration received in a given year is based on IAG’s performance over a number of different time periods and forachieving different, challenging objectives. The following graph illustrates the Group CEO's remuneration as an example, broken downinto the components of his remuneration plan. Beside each remuneration component is a description of the timeframe and theobjective achieved to receive this remuneration.
Significant elements of the total actual reward received by theGroup CEO are those of the deferred STI and LTI plans. Thedisclosed value of both plans is impacted by a significant increasein the value of IAG's share price since they were allocated, whichalso benefited IAG’s shareholders. The adjacent graph outlinesthe dollar value and proportion of deferred STI and LTI when theywere awarded as well as the additional value achieved throughshare price growth.
IAG’s ROE has been positively reflected in the dividends shareholders receive as well as the LTI for executives, further demonstratingthe alignment of reward to our shareholder interests. IAG’s performance has resulted in sound dividend payments provided toshareholders over a number of years. The dividend paid/payable to shareholders for the year ended 30 June 2015 is 29 cents perordinary share. IAG continues to adhere to its dividend policy of paying approximately 50–70% of reported cash earnings toshareholders in any given financial year.
20 IAG ANNUAL REPORT 2015
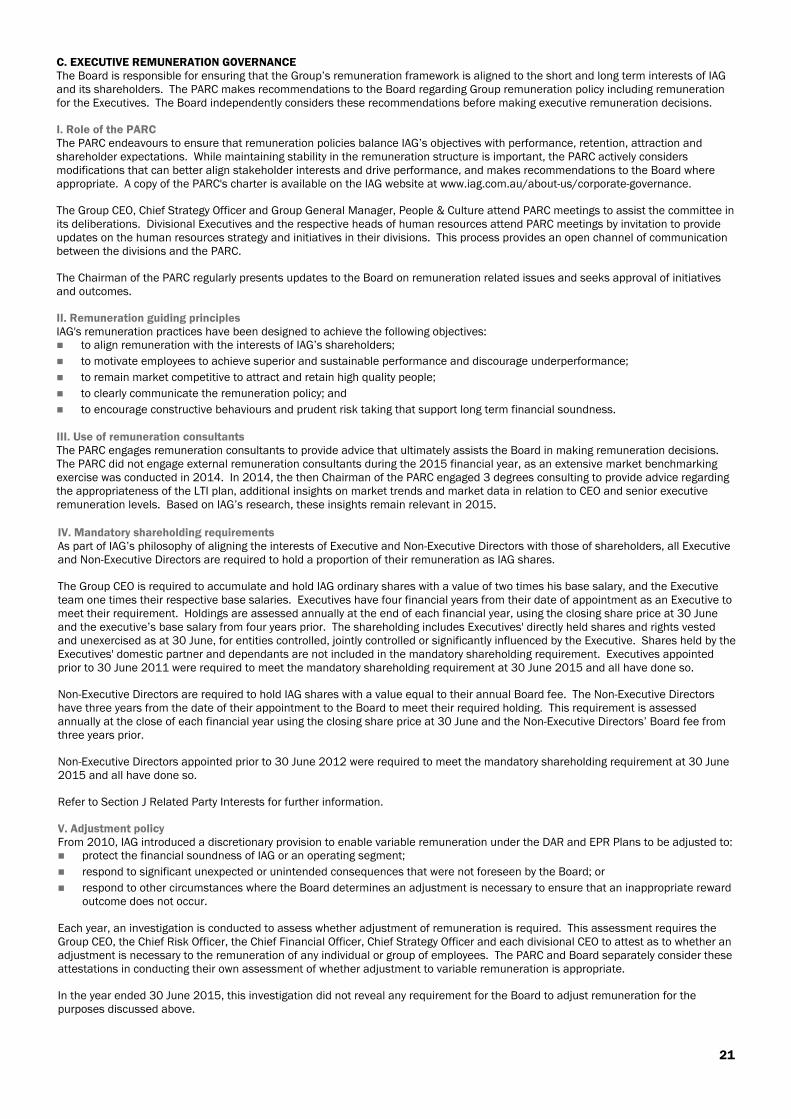
C. EXECUTIVE REMUNERATION GOVERNANCEThe Board is responsible for ensuring that the Group’s remuneration framework is aligned to the short and long term interests of IAGand its shareholders. The PARC makes recommendations to the Board regarding Group remuneration policy including remunerationfor the Executives. The Board independently considers these recommendations before making executive remuneration decisions.
I. Role of the PARCThe PARC endeavours to ensure that remuneration policies balance IAG’s objectives with performance, retention, attraction andshareholder expectations. While maintaining stability in the remuneration structure is important, the PARC actively considersmodifications that can better align stakeholder interests and drive performance, and makes recommendations to the Board whereappropriate. A copy of the PARC's charter is available on the IAG website at www.iag.com.au/about-us/corporate-governance.
The Group CEO, Chief Strategy Officer and Group General Manager, People & Culture attend PARC meetings to assist the committee inits deliberations. Divisional Executives and the respective heads of human resources attend PARC meetings by invitation to provideupdates on the human resources strategy and initiatives in their divisions. This process provides an open channel of communicationbetween the divisions and the PARC.
The Chairman of the PARC regularly presents updates to the Board on remuneration related issues and seeks approval of initiativesand outcomes.
II. Remuneration guiding principlesIAG's remuneration practices have been designed to achieve the following objectives: to align remuneration with the interests of IAG’s shareholders;
to motivate employees to achieve superior and sustainable performance and discourage underperformance;
to remain market competitive to attract and retain high quality people;
to clearly communicate the remuneration policy; and
to encourage constructive behaviours and prudent risk taking that support long term financial soundness.
III. Use of remuneration consultantsThe PARC engages remuneration consultants to provide advice that ultimately assists the Board in making remuneration decisions.The PARC did not engage external remuneration consultants during the 2015 financial year, as an extensive market benchmarkingexercise was conducted in 2014. In 2014, the then Chairman of the PARC engaged 3 degrees consulting to provide advice regardingthe appropriateness of the LTI plan, additional insights on market trends and market data in relation to CEO and senior executiveremuneration levels. Based on IAG’s research, these insights remain relevant in 2015.
IV. Mandatory shareholding requirementsAs part of IAG’s philosophy of aligning the interests of Executive and Non-Executive Directors with those of shareholders, all Executiveand Non-Executive Directors are required to hold a proportion of their remuneration as IAG shares.
The Group CEO is required to accumulate and hold IAG ordinary shares with a value of two times his base salary, and the Executiveteam one times their respective base salaries. Executives have four financial years from their date of appointment as an Executive tomeet their requirement. Holdings are assessed annually at the end of each financial year, using the closing share price at 30 Juneand the executive’s base salary from four years prior. The shareholding includes Executives' directly held shares and rights vestedand unexercised as at 30 June, for entities controlled, jointly controlled or significantly influenced by the Executive. Shares held by theExecutives' domestic partner and dependants are not included in the mandatory shareholding requirement. Executives appointedprior to 30 June 2011 were required to meet the mandatory shareholding requirement at 30 June 2015 and all have done so.
Non-Executive Directors are required to hold IAG shares with a value equal to their annual Board fee. The Non-Executive Directorshave three years from the date of their appointment to the Board to meet their required holding. This requirement is assessedannually at the close of each financial year using the closing share price at 30 June and the Non-Executive Directors’ Board fee fromthree years prior.
Non-Executive Directors appointed prior to 30 June 2012 were required to meet the mandatory shareholding requirement at 30 June2015 and all have done so.
Refer to Section J Related Party Interests for further information.
V. Adjustment policyFrom 2010, IAG introduced a discretionary provision to enable variable remuneration under the DAR and EPR Plans to be adjusted to: protect the financial soundness of IAG or an operating segment;
respond to significant unexpected or unintended consequences that were not foreseen by the Board; or
respond to other circumstances where the Board determines an adjustment is necessary to ensure that an inappropriate rewardoutcome does not occur.
Each year, an investigation is conducted to assess whether adjustment of remuneration is required. This assessment requires theGroup CEO, the Chief Risk Officer, the Chief Financial Officer, Chief Strategy Officer and each divisional CEO to attest as to whether anadjustment is necessary to the remuneration of any individual or group of employees. The PARC and Board separately consider theseattestations in conducting their own assessment of whether adjustment to variable remuneration is appropriate.
In the year ended 30 June 2015, this investigation did not reveal any requirement for the Board to adjust remuneration for thepurposes discussed above.
21
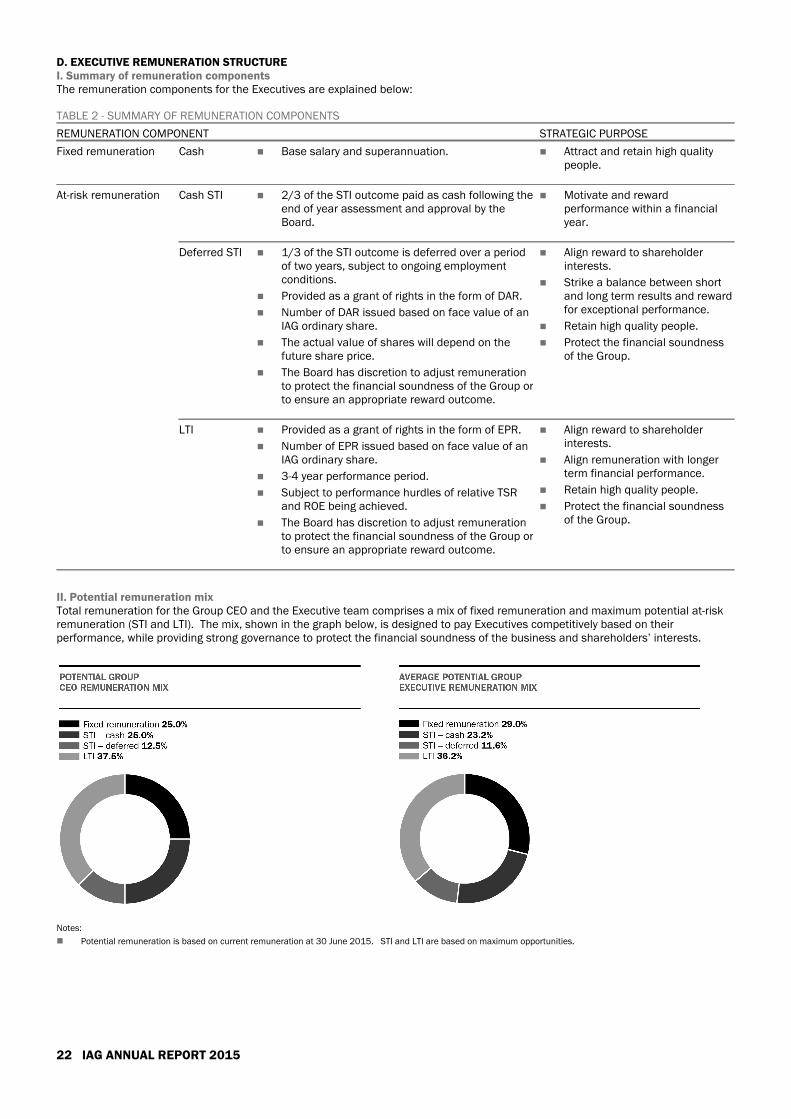
D. EXECUTIVE REMUNERATION STRUCTUREI. Summary of remuneration componentsThe remuneration components for the Executives are explained below:
TABLE 2 - SUMMARY OF REMUNERATION COMPONENTS
REMUNERATION COMPONENT STRATEGIC PURPOSE
Fixed remuneration Cash Base salary and superannuation. Attract and retain high qualitypeople.
At-risk remuneration Cash STI 2/3 of the STI outcome paid as cash following theend of year assessment and approval by theBoard.
Motivate and rewardperformance within a financialyear.
Deferred STI 1/3 of the STI outcome is deferred over a periodof two years, subject to ongoing employmentconditions.
Provided as a grant of rights in the form of DAR.
Number of DAR issued based on face value of anIAG ordinary share.
The actual value of shares will depend on thefuture share price.
The Board has discretion to adjust remunerationto protect the financial soundness of the Group orto ensure an appropriate reward outcome.
Align reward to shareholderinterests.
Strike a balance between shortand long term results and rewardfor exceptional performance.
Retain high quality people.
Protect the financial soundnessof the Group.
LTI Provided as a grant of rights in the form of EPR.
Number of EPR issued based on face value of anIAG ordinary share.
3-4 year performance period.
Subject to performance hurdles of relative TSRand ROE being achieved.
The Board has discretion to adjust remunerationto protect the financial soundness of the Group orto ensure an appropriate reward outcome.
Align reward to shareholderinterests.
Align remuneration with longerterm financial performance.
Retain high quality people.
Protect the financial soundnessof the Group.
II. Potential remuneration mixTotal remuneration for the Group CEO and the Executive team comprises a mix of fixed remuneration and maximum potential at-riskremuneration (STI and LTI). The mix, shown in the graph below, is designed to pay Executives competitively based on theirperformance, while providing strong governance to protect the financial soundness of the business and shareholders’ interests.
Notes:
Potential remuneration is based on current remuneration at 30 June 2015. STI and LTI are based on maximum opportunities.
22 IAG ANNUAL REPORT 2015

III. Remuneration components in detaila. FIXED REMUNERATIONIAG provides market competitive fixed remuneration given the roles’ experience, skills, the internal relativities of IAG’s Executive teamand market pay levels for external comparator roles. Fixed remuneration is reviewed regularly using independent remunerationbenchmarking data. The appropriate market benchmark is determined considering organisation size, industry and geographiclocation. For Australian-based Executives, positioning is determined by reference to a number of peer groups, including financialservices companies in the S&P/ASX 50 Index and companies that are of similar size to IAG. Relevant local market peer groups arereferenced for overseas based Executives.
The average fixed remuneration increase for the Executive team for the year ended 30 June 2015 was 1.5% effective September2014. In August 2015, the Board endorsed management’s recommendation not to increase the annual fixed remuneration for theExecutive team for the 2016 financial year.
b. AT-RISK REMUNERATIONThe Board strongly believes that the fundamental driver for executive remuneration should be long term financial performance thatgenerates value for IAG shareholders. The Board further recognises that executive remuneration is guided by regulation and marketforces and it benchmarks IAG’s executive remuneration to ensure IAG uses at-risk remuneration components to achieve itsremuneration and performance objectives.
i. Cash and deferred STIKey details of the STI plan are shown below:
TABLE 3 - STI PLAN
Description STI refers to the at-risk remuneration designed to motivate and reward for performance in a setfinancial year.
Potential maximum STIamount
The Group CEO can earn up to 150% of his annual fixed remuneration and members of the Executiveteam can earn up to 120% of their annual fixed remuneration.
Performance measuresand rationale
Performance is measured against a balanced scorecard that uses goals set against financial and non-financial measures (the balanced scorecard is discussed in more detail in table 5).
Financial measures make up 50% of the balanced scorecard objectives, with the remaining 50% basedon non-financial measures. This provides a balance between rewarding the achievement of financialtargets and non-financial objectives that drive the execution of IAG’s strategy.
The following table details the weighting of financial and non-financial performance measures for theSTI of the Group CEO and the Executive team in the year ended 30 June 2015.
ROLE FINANCIAL MEASURES NON-FINANCIALMEASURES
Group financialtargets
Division or businessfinancial targets
Group CEO 50% N/A 50%Divisional Executives 10% 40% 50%Corporate Office Executives 40% 10% 50%
Testing of performancemeasures
The Group CEO’s STI is recommended by the PARC based on his balanced scorecard performance andis approved by the Board.
The amount of STI paid to members of the Executive team is recommended by the Group CEO to thePARC based on the Executive team members' balanced scorecard performance and recommended bythe PARC for approval by the Board. The Board may apply discretion in determining the STI outcomesto ensure they are appropriate.
Instrument Two-thirds of the STI is paid as cash, with the remaining one-third deferred in the form of DAR that vestover two years.
Key terms of the deferredSTI
Deferred STI is issued in the form of DAR, which are rights over IAG ordinary shares which are held by atrustee. They are issued to Executives during the financial year at no cost, to the value of their deferredSTI amount. The number of DAR issued uses the face value of IAG ordinary shares at 30 June beforethe grant date. Executives who participate in this plan become eligible to receive one IAG ordinaryshare per DAR by paying an exercise price of $1 per tranche of DAR exercised, subject to theircontinuing employment with the Group for a period determined by the Board. No dividend is paid orpayable for any unvested or vested and unexercised DAR. Dividends are retained by the trustee andreinvested in the trust.
Forfeiture conditions The Board retains the discretion to adjust the unvested portion of any awards. DAR will be forfeited ifthe Executive resigns before the vesting date. When an Executive ceases employment in specialcircumstances, such as redundancy, any unvested rights may be retained on cessation of employment,subject to Board discretion.
23
ii. Long term incentiveKey details of the LTI plan are shown below:
TABLE 4 - LTI PLANDescription LTI grants are determined annually by the Board and are aligned to the Group’s strategic financial
targets. The grants are provided in the form of EPR and are based on an assessment of marketbenchmarks and performance.
Potential maximum LTI The maximum value of EPR granted to the Group CEO and Executive team under the LTI plan is 150%and 125% of their annual fixed remuneration, respectively.
The number of EPR granted is based on the face value of an IAG ordinary share at 30 June before thegrant date.
The EPR granted during the year will not vest and have no value unless the performance hurdles areachieved. No dividend is paid or payable for any unvested or vested and unexercised EPR.
Performance hurdles The LTI has two performance hurdles of ROE and TSR with 50% of each allocation subject to the ROEhurdle and 50% subject to the TSR hurdle: ROE is measured relative to IAG’s WACC. The ROE hurdle uses cash ROE to align with the reporting
of IAG’s financial performance to the external market and is used to determine the dividend. CashROE is reported ROE adjusted for amortisation and impairment of acquired identifiable intangibleassets and for unusual items; and
TSR is measured against that of the top 50 industrials within the S&P/ASX 100 Index. Anaveraging calculation is used for TSR over a 90-day period for start and test day values to reducethe impact of share price volatility.
Rationale for choosingperformance hurdles
The hurdles require superior financial performance over a 3-4 year period and are directly linked toIAG’s strategy.
ROE provides evidence of company growth in profitability and is linked to shareholder return. IAG usesROE as a key internal measure of the efficiency of its financial performance. IAG has a stretch strategictarget of achieving an ROE that is one and a half times greater than its WACC.
TSR provides a direct link between Executive reward and shareholder return by measuring the valuecreated for shareholders through the appreciation of the share price and the value of dividends. Thevalue created is compared to that of companies within IAG’s peer group. IAG has a strategic target ofproviding total shareholder returns in the top quartile of its peer group.
Testing of performancehurdles
ROEThe ROE portion of LTI is tested from 1 July of the grant year to 30 June three years later. The vestingschedule is shown below: no vesting below 1.2 x WACC;
minimum vesting at 1.2 x WACC (20% of ROE portion); and
maximum vesting at 1.6 x WACC (100% of ROE portion)
with straight line vesting in between.
TSRThe TSR portion of LTI is tested four years after the base date (being 30 September 2018 for theSeptember 2014 grant). The TSR portion of awards granted after 1 July 2013 is subject to a four yearperformance period with no additional opportunity for retesting. For EPR granted prior to 1 July 2013,the TSR portion of LTI is tested three years after the base date and then again at four years and fiveyears.
The vesting schedule is shown below: no vesting below 50th percentile of IAG’s performance measured against the top 50 industrials
within the S&P/ASX 100 Index;
minimum vesting at 50th percentile (50% of TSR portion); and
maximum vesting at or above 75th percentile (100% of TSR portion)
with straight line vesting in between.
Instrument Rights granted after 1 July 2013 may be settled with IAG ordinary shares or with cash if performancehurdles are achieved, as determined by the Board. Rights granted prior to 1 July 2013 are settled withIAG ordinary shares. These are exercisable for shares if performance hurdles are achieved.
Forfeiture conditions Under the terms of the LTI, if an Executive ceases employment with IAG voluntarily before theperformance hurdles are tested, the unvested EPR will generally lapse. In cases where the Executiveacts fraudulently or dishonestly or is, in the Board’s opinion, in breach of his or her obligations to theCompany, the unvested EPR will lapse.
24 IAG ANNUAL REPORT 2015
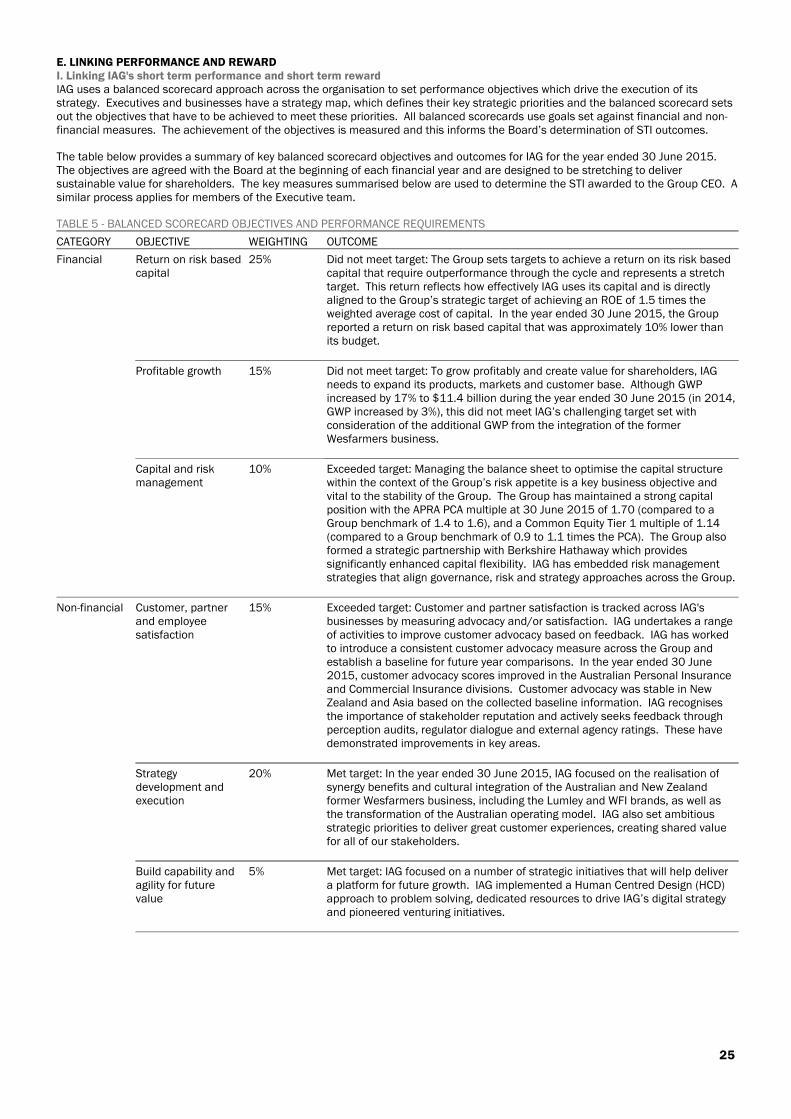
E. LINKING PERFORMANCE AND REWARDI. Linking IAG's short term performance and short term rewardIAG uses a balanced scorecard approach across the organisation to set performance objectives which drive the execution of itsstrategy. Executives and businesses have a strategy map, which defines their key strategic priorities and the balanced scorecard setsout the objectives that have to be achieved to meet these priorities. All balanced scorecards use goals set against financial and non-financial measures. The achievement of the objectives is measured and this informs the Board’s determination of STI outcomes.
The table below provides a summary of key balanced scorecard objectives and outcomes for IAG for the year ended 30 June 2015.The objectives are agreed with the Board at the beginning of each financial year and are designed to be stretching to deliversustainable value for shareholders. The key measures summarised below are used to determine the STI awarded to the Group CEO. Asimilar process applies for members of the Executive team.
TABLE 5 - BALANCED SCORECARD OBJECTIVES AND PERFORMANCE REQUIREMENTS
CATEGORY OBJECTIVE WEIGHTING OUTCOME
Financial Return on risk basedcapital
25% Did not meet target: The Group sets targets to achieve a return on its risk basedcapital that require outperformance through the cycle and represents a stretchtarget. This return reflects how effectively IAG uses its capital and is directlyaligned to the Group’s strategic target of achieving an ROE of 1.5 times theweighted average cost of capital. In the year ended 30 June 2015, the Groupreported a return on risk based capital that was approximately 10% lower thanits budget.
Profitable growth 15% Did not meet target: To grow profitably and create value for shareholders, IAGneeds to expand its products, markets and customer base. Although GWPincreased by 17% to $11.4 billion during the year ended 30 June 2015 (in 2014,GWP increased by 3%), this did not meet IAG’s challenging target set withconsideration of the additional GWP from the integration of the formerWesfarmers business.
Capital and riskmanagement
10% Exceeded target: Managing the balance sheet to optimise the capital structurewithin the context of the Group’s risk appetite is a key business objective andvital to the stability of the Group. The Group has maintained a strong capitalposition with the APRA PCA multiple at 30 June 2015 of 1.70 (compared to aGroup benchmark of 1.4 to 1.6), and a Common Equity Tier 1 multiple of 1.14(compared to a Group benchmark of 0.9 to 1.1 times the PCA). The Group alsoformed a strategic partnership with Berkshire Hathaway which providessignificantly enhanced capital flexibility. IAG has embedded risk managementstrategies that align governance, risk and strategy approaches across the Group.
Non-financial Customer, partnerand employeesatisfaction
15% Exceeded target: Customer and partner satisfaction is tracked across IAG'sbusinesses by measuring advocacy and/or satisfaction. IAG undertakes a rangeof activities to improve customer advocacy based on feedback. IAG has workedto introduce a consistent customer advocacy measure across the Group andestablish a baseline for future year comparisons. In the year ended 30 June2015, customer advocacy scores improved in the Australian Personal Insuranceand Commercial Insurance divisions. Customer advocacy was stable in NewZealand and Asia based on the collected baseline information. IAG recognisesthe importance of stakeholder reputation and actively seeks feedback throughperception audits, regulator dialogue and external agency ratings. These havedemonstrated improvements in key areas.
Strategydevelopment andexecution
20% Met target: In the year ended 30 June 2015, IAG focused on the realisation ofsynergy benefits and cultural integration of the Australian and New Zealandformer Wesfarmers business, including the Lumley and WFI brands, as well asthe transformation of the Australian operating model. IAG also set ambitiousstrategic priorities to deliver great customer experiences, creating shared valuefor all of our stakeholders.
Build capability andagility for futurevalue
5% Met target: IAG focused on a number of strategic initiatives that will help delivera platform for future growth. IAG implemented a Human Centred Design (HCD)approach to problem solving, dedicated resources to drive IAG’s digital strategyand pioneered venturing initiatives.
25
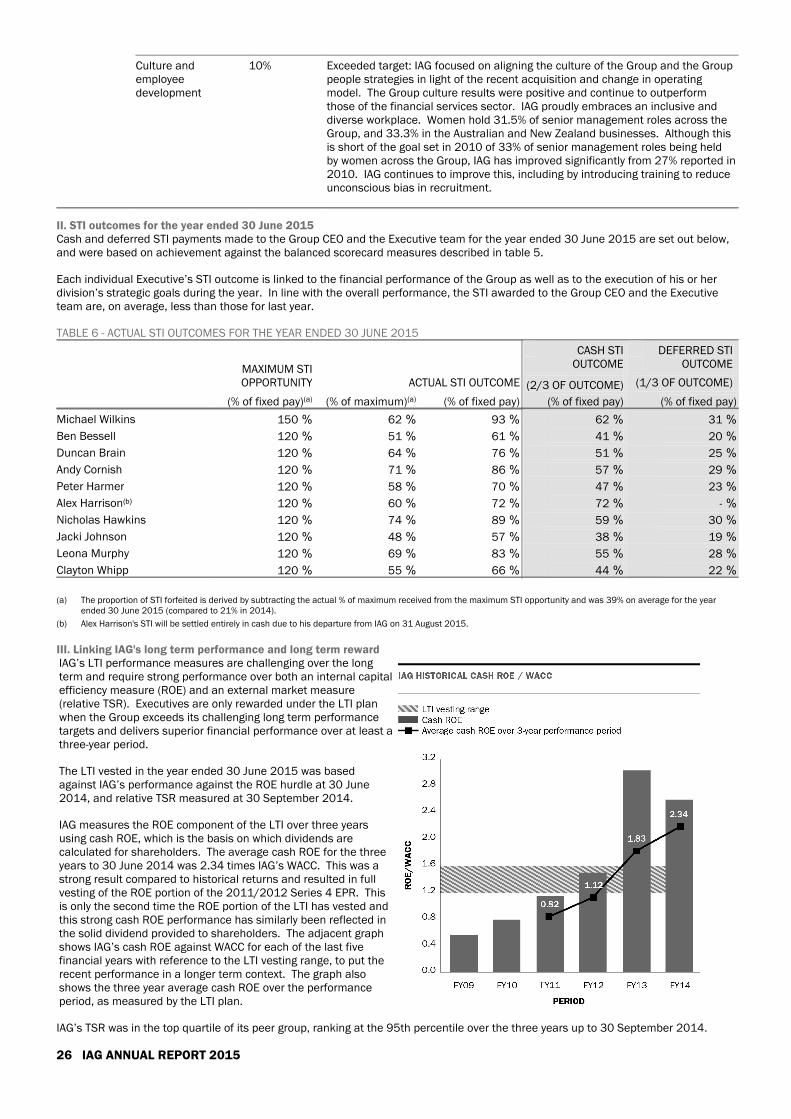
Culture andemployeedevelopment
10% Exceeded target: IAG focused on aligning the culture of the Group and the Grouppeople strategies in light of the recent acquisition and change in operatingmodel. The Group culture results were positive and continue to outperformthose of the financial services sector. IAG proudly embraces an inclusive anddiverse workplace. Women hold 31.5% of senior management roles across theGroup, and 33.3% in the Australian and New Zealand businesses. Although thisis short of the goal set in 2010 of 33% of senior management roles being heldby women across the Group, IAG has improved significantly from 27% reported in2010. IAG continues to improve this, including by introducing training to reduceunconscious bias in recruitment.
II. STI outcomes for the year ended 30 June 2015Cash and deferred STI payments made to the Group CEO and the Executive team for the year ended 30 June 2015 are set out below,and were based on achievement against the balanced scorecard measures described in table 5.
Each individual Executive’s STI outcome is linked to the financial performance of the Group as well as to the execution of his or herdivision’s strategic goals during the year. In line with the overall performance, the STI awarded to the Group CEO and the Executiveteam are, on average, less than those for last year.
TABLE 6 - ACTUAL STI OUTCOMES FOR THE YEAR ENDED 30 JUNE 2015
MAXIMUM STIOPPORTUNITY ACTUAL STI OUTCOME
CASH STIOUTCOME
(2/3 OF OUTCOME)
DEFERRED STIOUTCOME
(1/3 OF OUTCOME)
(% of fixed pay)(a) (% of maximum)(a) (% of fixed pay) (% of fixed pay) (% of fixed pay)
Michael Wilkins 150 % 62 % 93 % 62 % 31 %
Ben Bessell 120 % 51 % 61 % 41 % 20 %
Duncan Brain 120 % 64 % 76 % 51 % 25 %
Andy Cornish 120 % 71 % 86 % 57 % 29 %
Peter Harmer 120 % 58 % 70 % 47 % 23 %
Alex Harrison(b) 120 % 60 % 72 % 72 % - %
Nicholas Hawkins 120 % 74 % 89 % 59 % 30 %
Jacki Johnson 120 % 48 % 57 % 38 % 19 %
Leona Murphy 120 % 69 % 83 % 55 % 28 %
Clayton Whipp 120 % 55 % 66 % 44 % 22 %
(a) The proportion of STI forfeited is derived by subtracting the actual % of maximum received from the maximum STI opportunity and was 39% on average for the yearended 30 June 2015 (compared to 21% in 2014).
(b) Alex Harrison's STI will be settled entirely in cash due to his departure from IAG on 31 August 2015.
III. Linking IAG's long term performance and long term rewardIAG’s LTI performance measures are challenging over the longterm and require strong performance over both an internal capitalefficiency measure (ROE) and an external market measure(relative TSR). Executives are only rewarded under the LTI planwhen the Group exceeds its challenging long term performancetargets and delivers superior financial performance over at least athree-year period.
The LTI vested in the year ended 30 June 2015 was basedagainst IAG’s performance against the ROE hurdle at 30 June2014, and relative TSR measured at 30 September 2014.
IAG measures the ROE component of the LTI over three yearsusing cash ROE, which is the basis on which dividends arecalculated for shareholders. The average cash ROE for the threeyears to 30 June 2014 was 2.34 times IAG’s WACC. This was astrong result compared to historical returns and resulted in fullvesting of the ROE portion of the 2011/2012 Series 4 EPR. Thisis only the second time the ROE portion of the LTI has vested andthis strong cash ROE performance has similarly been reflected inthe solid dividend provided to shareholders. The adjacent graphshows IAG’s cash ROE against WACC for each of the last fivefinancial years with reference to the LTI vesting range, to put therecent performance in a longer term context. The graph alsoshows the three year average cash ROE over the performanceperiod, as measured by the LTI plan.
IAG’s TSR was in the top quartile of its peer group, ranking at the 95th percentile over the three years up to 30 September 2014.
26 IAG ANNUAL REPORT 2015
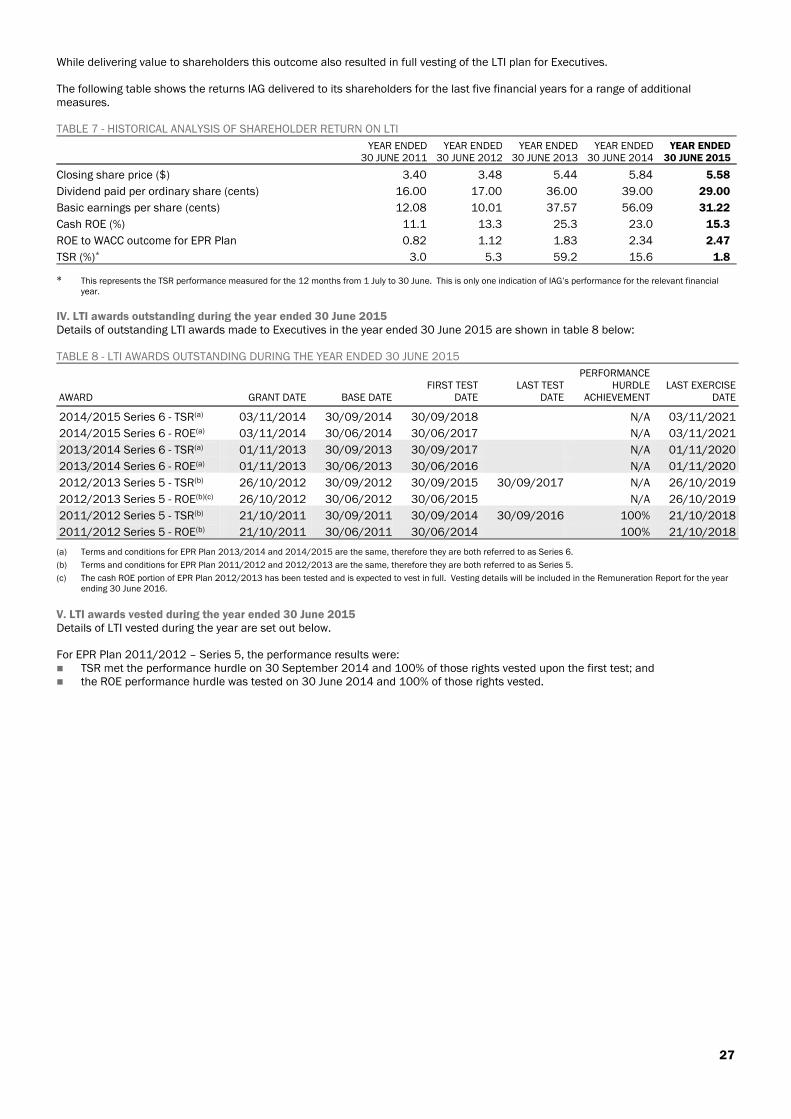
While delivering value to shareholders this outcome also resulted in full vesting of the LTI plan for Executives.
The following table shows the returns IAG delivered to its shareholders for the last five financial years for a range of additionalmeasures.
TABLE 7 - HISTORICAL ANALYSIS OF SHAREHOLDER RETURN ON LTI
YEAR ENDED30 JUNE 2011
YEAR ENDED30 JUNE 2012
YEAR ENDED30 JUNE 2013
YEAR ENDED30 JUNE 2014
YEAR ENDED30 JUNE 2015
Closing share price ($) 3.40 3.48 5.44 5.84 5.58
Dividend paid per ordinary share (cents) 16.00 17.00 36.00 39.00 29.00
Basic earnings per share (cents) 12.08 10.01 37.57 56.09 31.22
Cash ROE (%) 11.1 13.3 25.3 23.0 15.3
ROE to WACC outcome for EPR Plan 0.82 1.12 1.83 2.34 2.47
TSR (%)* 3.0 5.3 59.2 15.6 1.8
* This represents the TSR performance measured for the 12 months from 1 July to 30 June. This is only one indication of IAG’s performance for the relevant financialyear.
IV. LTI awards outstanding during the year ended 30 June 2015Details of outstanding LTI awards made to Executives in the year ended 30 June 2015 are shown in table 8 below:
TABLE 8 - LTI AWARDS OUTSTANDING DURING THE YEAR ENDED 30 JUNE 2015
AWARD GRANT DATE BASE DATEFIRST TEST
DATELAST TEST
DATE
PERFORMANCEHURDLE
ACHIEVEMENTLAST EXERCISE
DATE
2014/2015 Series 6 - TSR(a) 03/11/2014 30/09/2014 30/09/2018 N/A 03/11/2021
2014/2015 Series 6 - ROE(a) 03/11/2014 30/06/2014 30/06/2017 N/A 03/11/2021
2013/2014 Series 6 - TSR(a) 01/11/2013 30/09/2013 30/09/2017 N/A 01/11/2020
2013/2014 Series 6 - ROE(a) 01/11/2013 30/06/2013 30/06/2016 N/A 01/11/2020
2012/2013 Series 5 - TSR(b) 26/10/2012 30/09/2012 30/09/2015 30/09/2017 N/A 26/10/2019
2012/2013 Series 5 - ROE(b)(c) 26/10/2012 30/06/2012 30/06/2015 N/A 26/10/2019
2011/2012 Series 5 - TSR(b) 21/10/2011 30/09/2011 30/09/2014 30/09/2016 100% 21/10/2018
2011/2012 Series 5 - ROE(b) 21/10/2011 30/06/2011 30/06/2014 100% 21/10/2018
(a) Terms and conditions for EPR Plan 2013/2014 and 2014/2015 are the same, therefore they are both referred to as Series 6.
(b) Terms and conditions for EPR Plan 2011/2012 and 2012/2013 are the same, therefore they are both referred to as Series 5.
(c) The cash ROE portion of EPR Plan 2012/2013 has been tested and is expected to vest in full. Vesting details will be included in the Remuneration Report for the year ending 30 June 2016.
V. LTI awards vested during the year ended 30 June 2015Details of LTI vested during the year are set out below.
For EPR Plan 2011/2012 – Series 5, the performance results were: TSR met the performance hurdle on 30 September 2014 and 100% of those rights vested upon the first test; and the ROE performance hurdle was tested on 30 June 2014 and 100% of those rights vested.
27
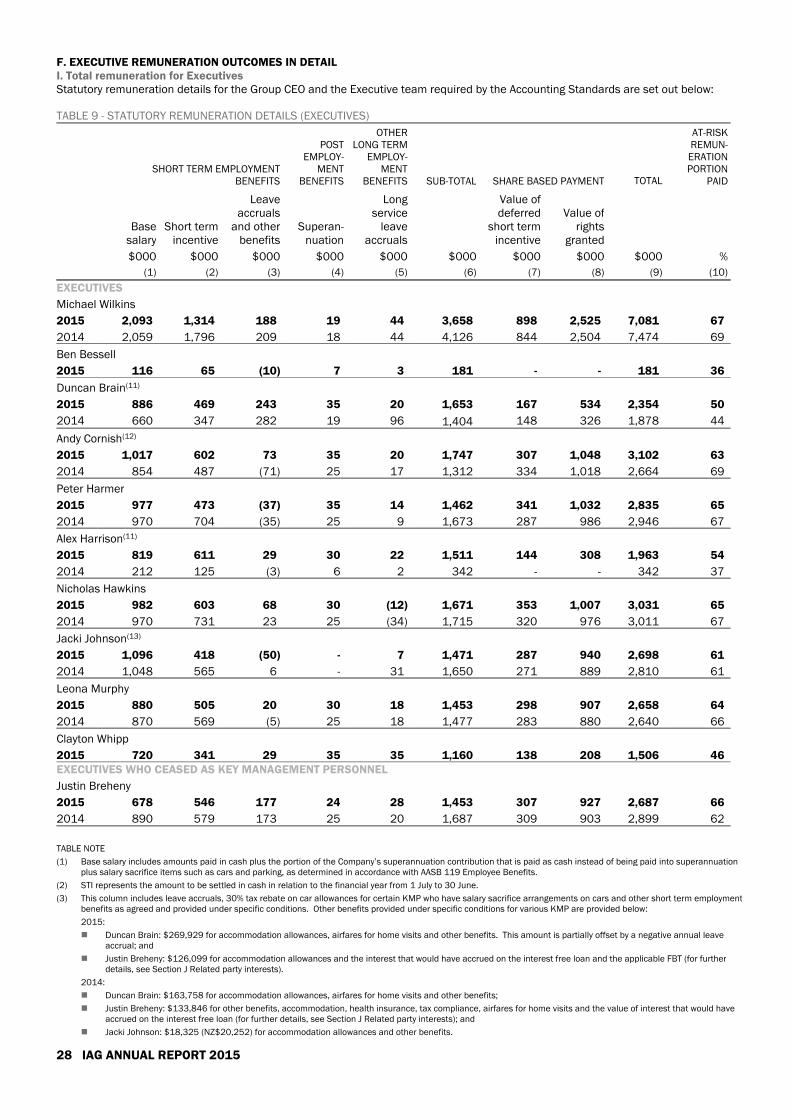
F. EXECUTIVE REMUNERATION OUTCOMES IN DETAILI. Total remuneration for ExecutivesStatutory remuneration details for the Group CEO and the Executive team required by the Accounting Standards are set out below:
TABLE 9 - STATUTORY REMUNERATION DETAILS (EXECUTIVES)
SHORT TERM EMPLOYMENTBENEFITS
POSTEMPLOY-
MENTBENEFITS
OTHERLONG TERM
EMPLOY-MENT
BENEFITS SUB-TOTAL SHARE BASED PAYMENT TOTAL
AT-RISKREMUN-ERATIONPORTION
PAID
Basesalary
Short termincentive
Leaveaccruals
and otherbenefits
Superan-nuation
Longservice
leaveaccruals
Value ofdeferred
short termincentive
Value ofrights
granted
$000 $000 $000 $000 $000 $000 $000 $000 $000 %
(1) (2) (3) (4) (5) (6) (7) (8) (9) (10)
EXECUTIVES
Michael Wilkins
2015 2,093 1,314 188 19 44 3,658 898 2,525 7,081 67
2014 2,059 1,796 209 18 44 4,126 844 2,504 7,474 69
Ben Bessell
2015 116 65 (10) 7 3 181 - - 181 36
Duncan Brain(11)
2015 886 469 243 35 20 1,653 167 534 2,354 50
2014 660 347 282 19 96 1,404 148 326 1,878 44
Andy Cornish(12)
2015 1,017 602 73 35 20 1,747 307 1,048 3,102 63
2014 854 487 (71) 25 17 1,312 334 1,018 2,664 69
Peter Harmer
2015 977 473 (37) 35 14 1,462 341 1,032 2,835 65
2014 970 704 (35) 25 9 1,673 287 986 2,946 67
Alex Harrison(11)
2015 819 611 29 30 22 1,511 144 308 1,963 54
2014 212 125 (3) 6 2 342 - - 342 37
Nicholas Hawkins
2015 982 603 68 30 (12) 1,671 353 1,007 3,031 65
2014 970 731 23 25 (34) 1,715 320 976 3,011 67
Jacki Johnson(13)
2015 1,096 418 (50) - 7 1,471 287 940 2,698 61
2014 1,048 565 6 - 31 1,650 271 889 2,810 61
Leona Murphy
2015 880 505 20 30 18 1,453 298 907 2,658 64
2014 870 569 (5) 25 18 1,477 283 880 2,640 66
Clayton Whipp
2015 720 341 29 35 35 1,160 138 208 1,506 46EXECUTIVES WHO CEASED AS KEY MANAGEMENT PERSONNEL
Justin Breheny
2015 678 546 177 24 28 1,453 307 927 2,687 66
2014 890 579 173 25 20 1,687 309 903 2,899 62
TABLE NOTE
(1) Base salary includes amounts paid in cash plus the portion of the Company’s superannuation contribution that is paid as cash instead of being paid into superannuationplus salary sacrifice items such as cars and parking, as determined in accordance with AASB 119 Employee Benefits.
(2) STI represents the amount to be settled in cash in relation to the financial year from 1 July to 30 June.
(3) This column includes leave accruals, 30% tax rebate on car allowances for certain KMP who have salary sacrifice arrangements on cars and other short term employmentbenefits as agreed and provided under specific conditions. Other benefits provided under specific conditions for various KMP are provided below:
2015:
Duncan Brain: $269,929 for accommodation allowances, airfares for home visits and other benefits. This amount is partially offset by a negative annual leaveaccrual; and
Justin Breheny: $126,099 for accommodation allowances and the interest that would have accrued on the interest free loan and the applicable FBT (for furtherdetails, see Section J Related party interests).
2014:
Duncan Brain: $163,758 for accommodation allowances, airfares for home visits and other benefits;
Justin Breheny: $133,846 for other benefits, accommodation, health insurance, tax compliance, airfares for home visits and the value of interest that would haveaccrued on the interest free loan (for further details, see Section J Related party interests); and
Jacki Johnson: $18,325 (NZ$20,252) for accommodation allowances and other benefits.
28 IAG ANNUAL REPORT 2015
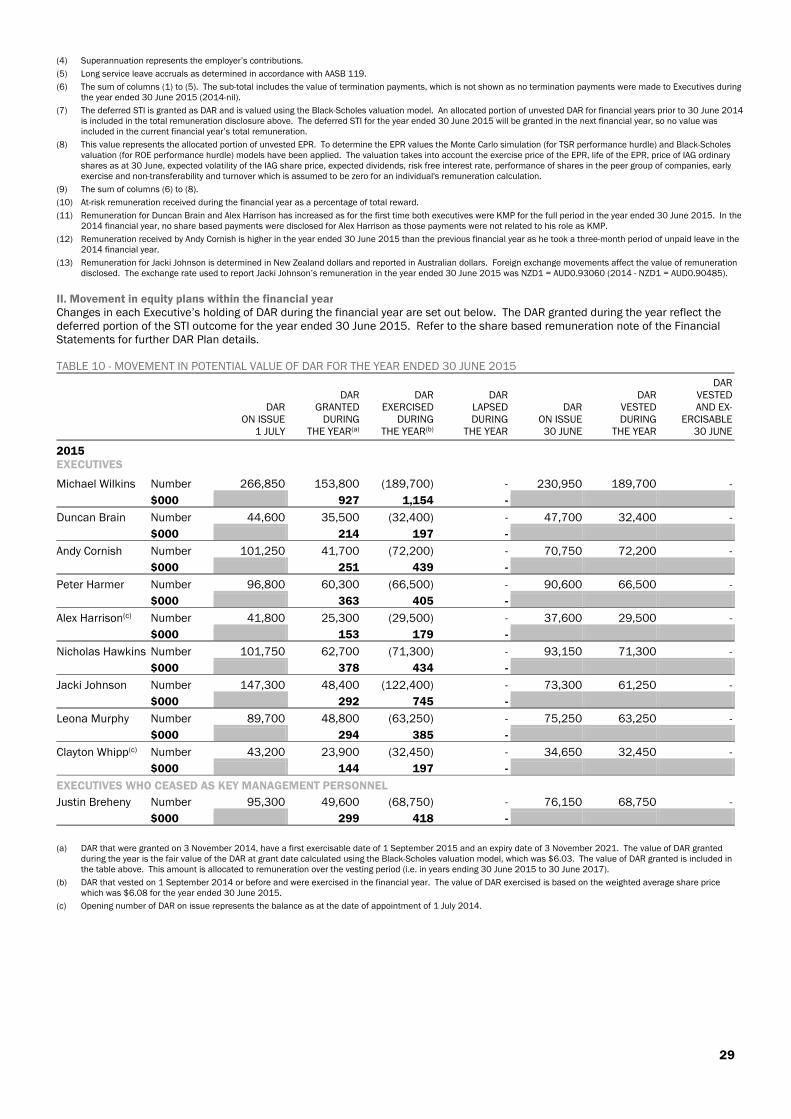
(4) Superannuation represents the employer’s contributions.
(5) Long service leave accruals as determined in accordance with AASB 119.
(6) The sum of columns (1) to (5). The sub-total includes the value of termination payments, which is not shown as no termination payments were made to Executives duringthe year ended 30 June 2015 (2014-nil).
(7) The deferred STI is granted as DAR and is valued using the Black-Scholes valuation model. An allocated portion of unvested DAR for financial years prior to 30 June 2014is included in the total remuneration disclosure above. The deferred STI for the year ended 30 June 2015 will be granted in the next financial year, so no value wasincluded in the current financial year’s total remuneration.
(8) This value represents the allocated portion of unvested EPR. To determine the EPR values the Monte Carlo simulation (for TSR performance hurdle) and Black-Scholesvaluation (for ROE performance hurdle) models have been applied. The valuation takes into account the exercise price of the EPR, life of the EPR, price of IAG ordinaryshares as at 30 June, expected volatility of the IAG share price, expected dividends, risk free interest rate, performance of shares in the peer group of companies, earlyexercise and non-transferability and turnover which is assumed to be zero for an individual's remuneration calculation.
(9) The sum of columns (6) to (8).
(10) At-risk remuneration received during the financial year as a percentage of total reward.
(11) Remuneration for Duncan Brain and Alex Harrison has increased as for the first time both executives were KMP for the full period in the year ended 30 June 2015. In the2014 financial year, no share based payments were disclosed for Alex Harrison as those payments were not related to his role as KMP.
(12) Remuneration received by Andy Cornish is higher in the year ended 30 June 2015 than the previous financial year as he took a three-month period of unpaid leave in the2014 financial year.
(13) Remuneration for Jacki Johnson is determined in New Zealand dollars and reported in Australian dollars. Foreign exchange movements affect the value of remunerationdisclosed. The exchange rate used to report Jacki Johnson’s remuneration in the year ended 30 June 2015 was NZD1 = AUD0.93060 (2014 - NZD1 = AUD0.90485).
II. Movement in equity plans within the financial yearChanges in each Executive’s holding of DAR during the financial year are set out below. The DAR granted during the year reflect thedeferred portion of the STI outcome for the year ended 30 June 2015. Refer to the share based remuneration note of the FinancialStatements for further DAR Plan details.
TABLE 10 - MOVEMENT IN POTENTIAL VALUE OF DAR FOR THE YEAR ENDED 30 JUNE 2015
DARON ISSUE
1 JULY
DARGRANTED
DURINGTHE YEAR(a)
DAREXERCISED
DURINGTHE YEAR(b)
DARLAPSEDDURING
THE YEAR
DARON ISSUE30 JUNE
DARVESTEDDURING
THE YEAR
DARVESTEDAND EX-
ERCISABLE30 JUNE
2015EXECUTIVES
Michael Wilkins Number 266,850 153,800 (189,700) - 230,950 189,700 -
$000 927 1,154 -
Duncan Brain Number 44,600 35,500 (32,400) - 47,700 32,400 -
$000 214 197 -
Andy Cornish Number 101,250 41,700 (72,200) - 70,750 72,200 -
$000 251 439 -
Peter Harmer Number 96,800 60,300 (66,500) - 90,600 66,500 -
$000 363 405 -
Alex Harrison(c) Number 41,800 25,300 (29,500) - 37,600 29,500 -
$000 153 179 -
Nicholas Hawkins Number 101,750 62,700 (71,300) - 93,150 71,300 -
$000 378 434 -
Jacki Johnson Number 147,300 48,400 (122,400) - 73,300 61,250 -
$000 292 745 -
Leona Murphy Number 89,700 48,800 (63,250) - 75,250 63,250 -
$000 294 385 -
Clayton Whipp(c) Number 43,200 23,900 (32,450) - 34,650 32,450 -
$000 144 197 -
EXECUTIVES WHO CEASED AS KEY MANAGEMENT PERSONNEL
Justin Breheny Number 95,300 49,600 (68,750) - 76,150 68,750 -
$000 299 418 -
(a) DAR that were granted on 3 November 2014, have a first exercisable date of 1 September 2015 and an expiry date of 3 November 2021. The value of DAR grantedduring the year is the fair value of the DAR at grant date calculated using the Black-Scholes valuation model, which was $6.03. The value of DAR granted is included inthe table above. This amount is allocated to remuneration over the vesting period (i.e. in years ending 30 June 2015 to 30 June 2017).
(b) DAR that vested on 1 September 2014 or before and were exercised in the financial year. The value of DAR exercised is based on the weighted average share pricewhich was $6.08 for the year ended 30 June 2015.
(c) Opening number of DAR on issue represents the balance as at the date of appointment of 1 July 2014.
29
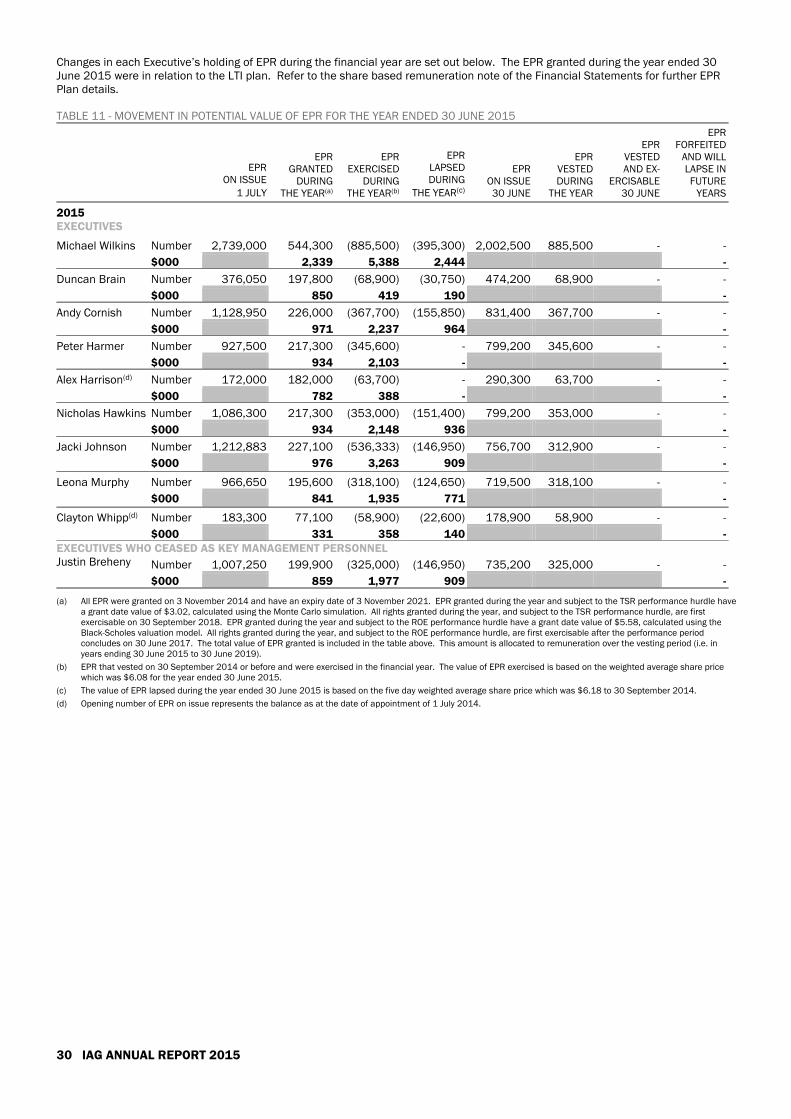
Changes in each Executive’s holding of EPR during the financial year are set out below. The EPR granted during the year ended 30June 2015 were in relation to the LTI plan. Refer to the share based remuneration note of the Financial Statements for further EPRPlan details.
TABLE 11 - MOVEMENT IN POTENTIAL VALUE OF EPR FOR THE YEAR ENDED 30 JUNE 2015
EPRON ISSUE
1 JULY
EPRGRANTED
DURINGTHE YEAR(a)
EPREXERCISED
DURINGTHE YEAR(b)
EPRLAPSEDDURING
THE YEAR(c)
EPRON ISSUE30 JUNE
EPRVESTEDDURING
THE YEAR
EPRVESTEDAND EX-
ERCISABLE30 JUNE
EPRFORFEITED
AND WILLLAPSE INFUTURE
YEARS
2015EXECUTIVES
Michael Wilkins Number 2,739,000 544,300 (885,500) (395,300) 2,002,500 885,500 - -
$000 2,339 5,388 2,444 -
Duncan Brain Number 376,050 197,800 (68,900) (30,750) 474,200 68,900 - -
$000 850 419 190 -
Andy Cornish Number 1,128,950 226,000 (367,700) (155,850) 831,400 367,700 - -
$000 971 2,237 964 -
Peter Harmer Number 927,500 217,300 (345,600) - 799,200 345,600 - -
$000 934 2,103 - -
Alex Harrison(d) Number 172,000 182,000 (63,700) - 290,300 63,700 - -
$000 782 388 - -
Nicholas Hawkins Number 1,086,300 217,300 (353,000) (151,400) 799,200 353,000 - -
$000 934 2,148 936 -
Jacki Johnson Number 1,212,883 227,100 (536,333) (146,950) 756,700 312,900 - -
$000 976 3,263 909 -
Leona Murphy Number 966,650 195,600 (318,100) (124,650) 719,500 318,100 - -
$000 841 1,935 771 -
Clayton Whipp(d) Number 183,300 77,100 (58,900) (22,600) 178,900 58,900 - -
$000 331 358 140 -EXECUTIVES WHO CEASED AS KEY MANAGEMENT PERSONNEL Justin Breheny Number 1,007,250 199,900 (325,000) (146,950) 735,200 325,000 - -
$000 859 1,977 909 -
(a) All EPR were granted on 3 November 2014 and have an expiry date of 3 November 2021. EPR granted during the year and subject to the TSR performance hurdle havea grant date value of $3.02, calculated using the Monte Carlo simulation. All rights granted during the year, and subject to the TSR performance hurdle, are firstexercisable on 30 September 2018. EPR granted during the year and subject to the ROE performance hurdle have a grant date value of $5.58, calculated using theBlack-Scholes valuation model. All rights granted during the year, and subject to the ROE performance hurdle, are first exercisable after the performance periodconcludes on 30 June 2017. The total value of EPR granted is included in the table above. This amount is allocated to remuneration over the vesting period (i.e. inyears ending 30 June 2015 to 30 June 2019).
(b) EPR that vested on 30 September 2014 or before and were exercised in the financial year. The value of EPR exercised is based on the weighted average share pricewhich was $6.08 for the year ended 30 June 2015.
(c) The value of EPR lapsed during the year ended 30 June 2015 is based on the five day weighted average share price which was $6.18 to 30 September 2014.
(d) Opening number of EPR on issue represents the balance as at the date of appointment of 1 July 2014.
30 IAG ANNUAL REPORT 2015

G. EXECUTIVE EMPLOYMENT AGREEMENTSAll employment agreements for the Group CEO and the Executive team are for unlimited terms but may be terminated by written noticefrom either party or by IAG making a payment in lieu of notice. The employment agreements outline the components of remunerationpaid to each Executive and require annual review of Executives’ remuneration, although the agreements do not require IAG to increasebase salary, pay STI or offer an LTI in any given year.
TABLE 12 - EXECUTIVE EMPLOYMENT AGREEMENTS
NAME NOTICE PERIOD FROMTHE RELEVANT COMPANY
NOTICE PERIOD FROMTHE EMPLOYEE TERMINATION PROVISIONS
Michael Wilkins 12 months 6 months 12 months fixed remuneration and STI thatwould have accrued for 12 months hadtermination not occurred. An additional sixmonths fixed remuneration is payable if IAGinvokes a restraint clause.
Duncan Brain 12 months 6 months 12 months base salary
Andy Cornish 12 months 3 months 12 months fixed remuneration
Peter Harmer 12 months 6 months 12 months base salary
Alex Harrison 12 months 6 months 12 months base salary
Nicholas Hawkins 12 months 3 months 12 months base salary
Jacki Johnson 12 months 3 months 12 months fixed remuneration
Leona Murphy 12 months 3 months 12 months base salary
Clayton Whipp 12 months 6 months 12 months base salary
Subject to the relevant legislation in the various jurisdictions, termination provisions may include the payment of annual leave and/orlong service leave for the Executives.
Executives are employed by Insurance Australia Group Services Pty Limited, except for Jacki Johnson who is employed by IAG NewZealand Limited.
I. RetrenchmentIn the event of retrenchment, the Executives listed above (except for Jacki Johnson) are entitled to the greater of: the written notice or payment in lieu of notice as provided in their employment agreement; or
the retrenchment benefits due under the Company retrenchment policy.
For Executives based in Australia, the minimum benefit under the retrenchment policy is 11 weeks of base salary and the maximumbenefit that can be received is 87 weeks of base salary. The maximum benefit is payable to employees with service of 25 years ormore.
For Jacki Johnson, the retrenchment payment is in accordance with the termination provisions specified in the table above.
II. Termination of employment without notice and without payment in lieu of noticeThe employment of an Executive may be terminated without notice and without payment in lieu of notice in some circumstances.Generally, this could occur where the Executive: is charged with a criminal offence that is capable of bringing the organisation into disrepute;
is declared bankrupt;
breaches a provision of their employment agreement;
is guilty of serious and wilful misconduct; or
unreasonably fails to comply with any material and lawful direction given by the relevant company.
III. Termination of employment with notice or payment in lieu of noticeThe employment of an Executive may be terminated at any time by the relevant company with notice or payment in lieu of notice. Theamount of notice the relevant company must provide or the payment in lieu of notice is specified above.
31
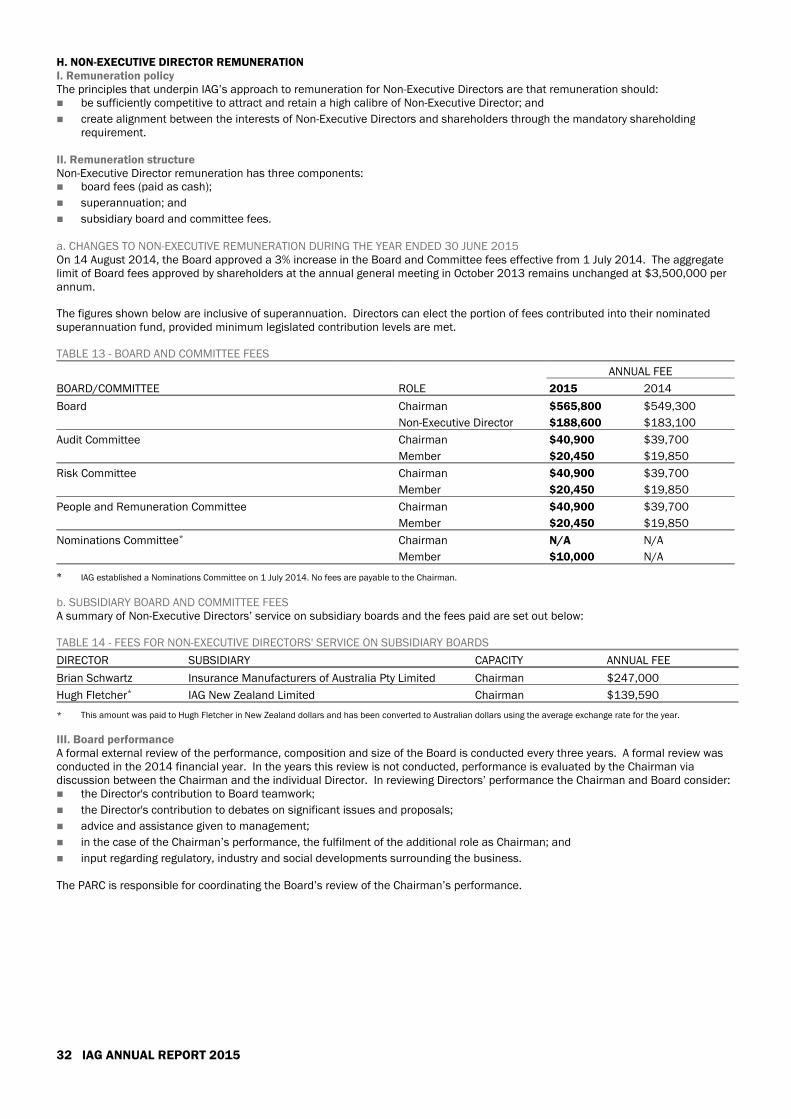
H. NON-EXECUTIVE DIRECTOR REMUNERATIONI. Remuneration policyThe principles that underpin IAG’s approach to remuneration for Non-Executive Directors are that remuneration should: be sufficiently competitive to attract and retain a high calibre of Non-Executive Director; and
create alignment between the interests of Non-Executive Directors and shareholders through the mandatory shareholdingrequirement.
II. Remuneration structureNon-Executive Director remuneration has three components: board fees (paid as cash);
superannuation; and
subsidiary board and committee fees.
a. CHANGES TO NON-EXECUTIVE REMUNERATION DURING THE YEAR ENDED 30 JUNE 2015On 14 August 2014, the Board approved a 3% increase in the Board and Committee fees effective from 1 July 2014. The aggregatelimit of Board fees approved by shareholders at the annual general meeting in October 2013 remains unchanged at $3,500,000 perannum.
The figures shown below are inclusive of superannuation. Directors can elect the portion of fees contributed into their nominatedsuperannuation fund, provided minimum legislated contribution levels are met.
TABLE 13 - BOARD AND COMMITTEE FEES
ANNUAL FEE
BOARD/COMMITTEE ROLE 2015 2014
Board Chairman $565,800 $549,300
Non-Executive Director $188,600 $183,100
Audit Committee Chairman $40,900 $39,700
Member $20,450 $19,850
Risk Committee Chairman $40,900 $39,700
Member $20,450 $19,850
People and Remuneration Committee Chairman
Member
$40,900
$20,450
$39,700
$19,850
Nominations Committee* Chairman
Member
N/A
$10,000
N/A
N/A
* IAG established a Nominations Committee on 1 July 2014. No fees are payable to the Chairman.
b. SUBSIDIARY BOARD AND COMMITTEE FEESA summary of Non-Executive Directors’ service on subsidiary boards and the fees paid are set out below:
TABLE 14 - FEES FOR NON-EXECUTIVE DIRECTORS' SERVICE ON SUBSIDIARY BOARDS
DIRECTOR SUBSIDIARY CAPACITY ANNUAL FEE
Brian Schwartz Insurance Manufacturers of Australia Pty Limited Chairman $247,000
Hugh Fletcher* IAG New Zealand Limited Chairman $139,590
* This amount was paid to Hugh Fletcher in New Zealand dollars and has been converted to Australian dollars using the average exchange rate for the year.
III. Board performanceA formal external review of the performance, composition and size of the Board is conducted every three years. A formal review wasconducted in the 2014 financial year. In the years this review is not conducted, performance is evaluated by the Chairman viadiscussion between the Chairman and the individual Director. In reviewing Directors’ performance the Chairman and Board consider: the Director's contribution to Board teamwork;
the Director's contribution to debates on significant issues and proposals;
advice and assistance given to management;
in the case of the Chairman’s performance, the fulfilment of the additional role as Chairman; and
input regarding regulatory, industry and social developments surrounding the business.
The PARC is responsible for coordinating the Board’s review of the Chairman’s performance.
32 IAG ANNUAL REPORT 2015
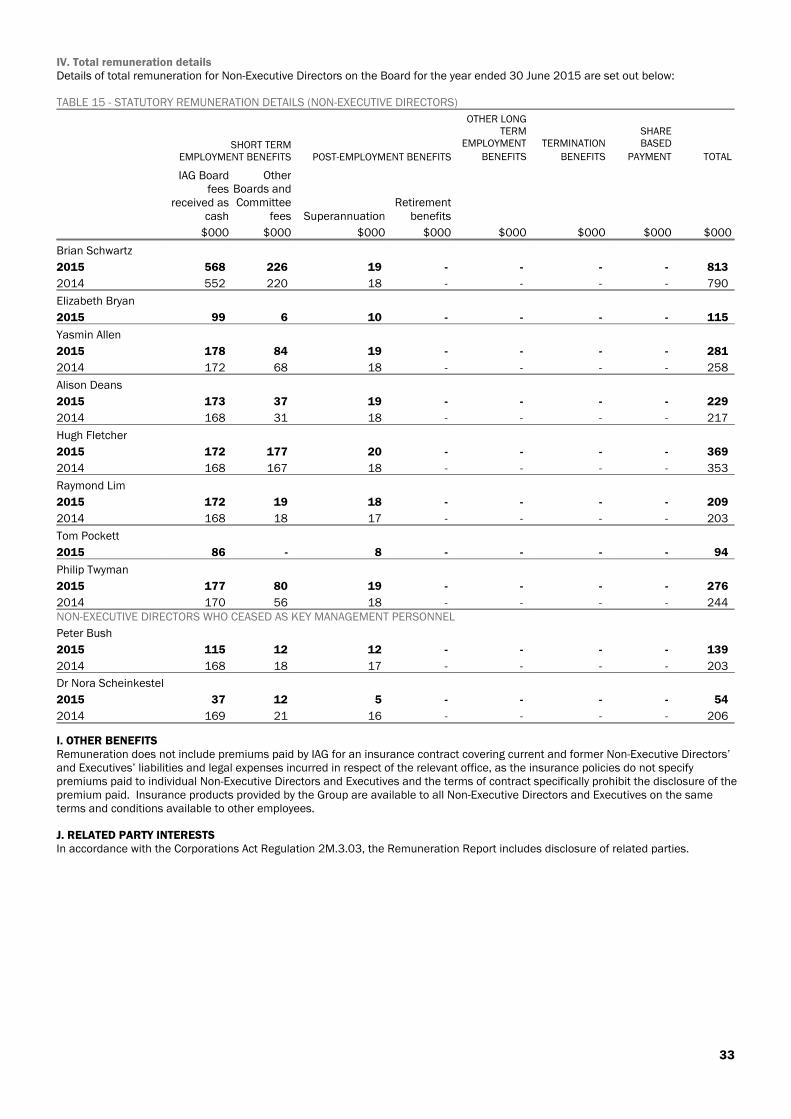
IV. Total remuneration detailsDetails of total remuneration for Non-Executive Directors on the Board for the year ended 30 June 2015 are set out below:
TABLE 15 - STATUTORY REMUNERATION DETAILS (NON-EXECUTIVE DIRECTORS)
SHORT TERMEMPLOYMENT BENEFITS POST-EMPLOYMENT BENEFITS
OTHER LONGTERM
EMPLOYMENT
BENEFITS
TERMINATION
BENEFITS
SHAREBASED
PAYMENT TOTAL
IAG Boardfees
received ascash
OtherBoards andCommittee
fees SuperannuationRetirement
benefits
$000 $000 $000 $000 $000 $000 $000 $000
Brian Schwartz
2015 568 226 19 - - - - 813
2014 552 220 18 - - - - 790
Elizabeth Bryan
2015 99 6 10 - - - - 115
Yasmin Allen
2015 178 84 19 - - - - 281
2014 172 68 18 - - - - 258
Alison Deans
2015 173 37 19 - - - - 229
2014 168 31 18 - - - - 217
Hugh Fletcher
2015 172 177 20 - - - - 369
2014 168 167 18 - - - - 353
Raymond Lim
2015 172 19 18 - - - - 209
2014 168 18 17 - - - - 203
Tom Pockett
2015 86 - 8 - - - - 94
Philip Twyman
2015 177 80 19 - - - - 276
2014 170 56 18 - - - - 244NON-EXECUTIVE DIRECTORS WHO CEASED AS KEY MANAGEMENT PERSONNEL
Peter Bush
2015 115 12 12 - - - - 139
2014 168 18 17 - - - - 203
Dr Nora Scheinkestel
2015 37 12 5 - - - - 54
2014 169 21 16 - - - - 206
I. OTHER BENEFITSRemuneration does not include premiums paid by IAG for an insurance contract covering current and former Non-Executive Directors’and Executives’ liabilities and legal expenses incurred in respect of the relevant office, as the insurance policies do not specifypremiums paid to individual Non-Executive Directors and Executives and the terms of contract specifically prohibit the disclosure of thepremium paid. Insurance products provided by the Group are available to all Non-Executive Directors and Executives on the sameterms and conditions available to other employees.
J. RELATED PARTY INTERESTSIn accordance with the Corporations Act Regulation 2M.3.03, the Remuneration Report includes disclosure of related parties.
33
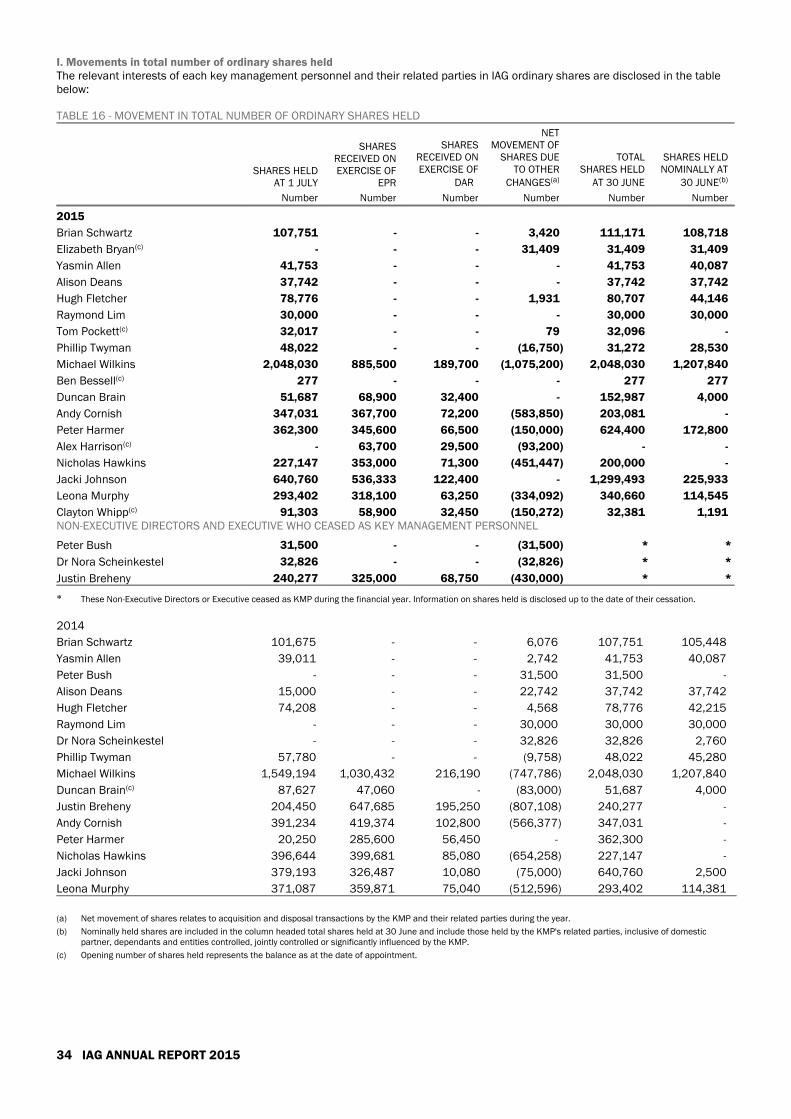
I. Movements in total number of ordinary shares heldThe relevant interests of each key management personnel and their related parties in IAG ordinary shares are disclosed in the tablebelow:
TABLE 16 - MOVEMENT IN TOTAL NUMBER OF ORDINARY SHARES HELD
SHARES HELDAT 1 JULY
SHARESRECEIVED ONEXERCISE OF
EPR
SHARESRECEIVED ONEXERCISE OF
DAR
NETMOVEMENT OF
SHARES DUETO OTHER
CHANGES(a)
TOTALSHARES HELD
AT 30 JUNE
SHARES HELDNOMINALLY AT
30 JUNE(b)
Number Number Number Number Number Number
2015
Brian Schwartz 107,751 - - 3,420 111,171 108,718
Elizabeth Bryan(c) - - - 31,409 31,409 31,409
Yasmin Allen 41,753 - - - 41,753 40,087
Alison Deans 37,742 - - - 37,742 37,742
Hugh Fletcher 78,776 - - 1,931 80,707 44,146
Raymond Lim 30,000 - - - 30,000 30,000
Tom Pockett(c) 32,017 - - 79 32,096 -
Phillip Twyman 48,022 - - (16,750) 31,272 28,530
Michael Wilkins 2,048,030 885,500 189,700 (1,075,200) 2,048,030 1,207,840
Ben Bessell(c) 277 - - - 277 277
Duncan Brain 51,687 68,900 32,400 - 152,987 4,000
Andy Cornish 347,031 367,700 72,200 (583,850) 203,081 -
Peter Harmer 362,300 345,600 66,500 (150,000) 624,400 172,800
Alex Harrison(c) - 63,700 29,500 (93,200) - -
Nicholas Hawkins 227,147 353,000 71,300 (451,447) 200,000 -
Jacki Johnson 640,760 536,333 122,400 - 1,299,493 225,933
Leona Murphy 293,402 318,100 63,250 (334,092) 340,660 114,545
Clayton Whipp(c) 91,303 58,900 32,450 (150,272) 32,381 1,191NON-EXECUTIVE DIRECTORS AND EXECUTIVE WHO CEASED AS KEY MANAGEMENT PERSONNEL
Peter Bush 31,500 - - (31,500) * *
Dr Nora Scheinkestel 32,826 - - (32,826) * *
Justin Breheny 240,277 325,000 68,750 (430,000) * *
* These Non-Executive Directors or Executive ceased as KMP during the financial year. Information on shares held is disclosed up to the date of their cessation.
2014
Brian Schwartz 101,675 - - 6,076 107,751 105,448
Yasmin Allen 39,011 - - 2,742 41,753 40,087
Peter Bush - - - 31,500 31,500 -
Alison Deans 15,000 - - 22,742 37,742 37,742
Hugh Fletcher 74,208 - - 4,568 78,776 42,215
Raymond Lim - - - 30,000 30,000 30,000
Dr Nora Scheinkestel - - - 32,826 32,826 2,760
Phillip Twyman 57,780 - - (9,758) 48,022 45,280
Michael Wilkins 1,549,194 1,030,432 216,190 (747,786) 2,048,030 1,207,840
Duncan Brain(c) 87,627 47,060 - (83,000) 51,687 4,000
Justin Breheny 204,450 647,685 195,250 (807,108) 240,277 -
Andy Cornish 391,234 419,374 102,800 (566,377) 347,031 -
Peter Harmer 20,250 285,600 56,450 - 362,300 -
Nicholas Hawkins 396,644 399,681 85,080 (654,258) 227,147 -
Jacki Johnson 379,193 326,487 10,080 (75,000) 640,760 2,500
Leona Murphy 371,087 359,871 75,040 (512,596) 293,402 114,381
(a) Net movement of shares relates to acquisition and disposal transactions by the KMP and their related parties during the year.
(b) Nominally held shares are included in the column headed total shares held at 30 June and include those held by the KMP's related parties, inclusive of domesticpartner, dependants and entities controlled, jointly controlled or significantly influenced by the KMP.
(c) Opening number of shares held represents the balance as at the date of appointment.
34 IAG ANNUAL REPORT 2015
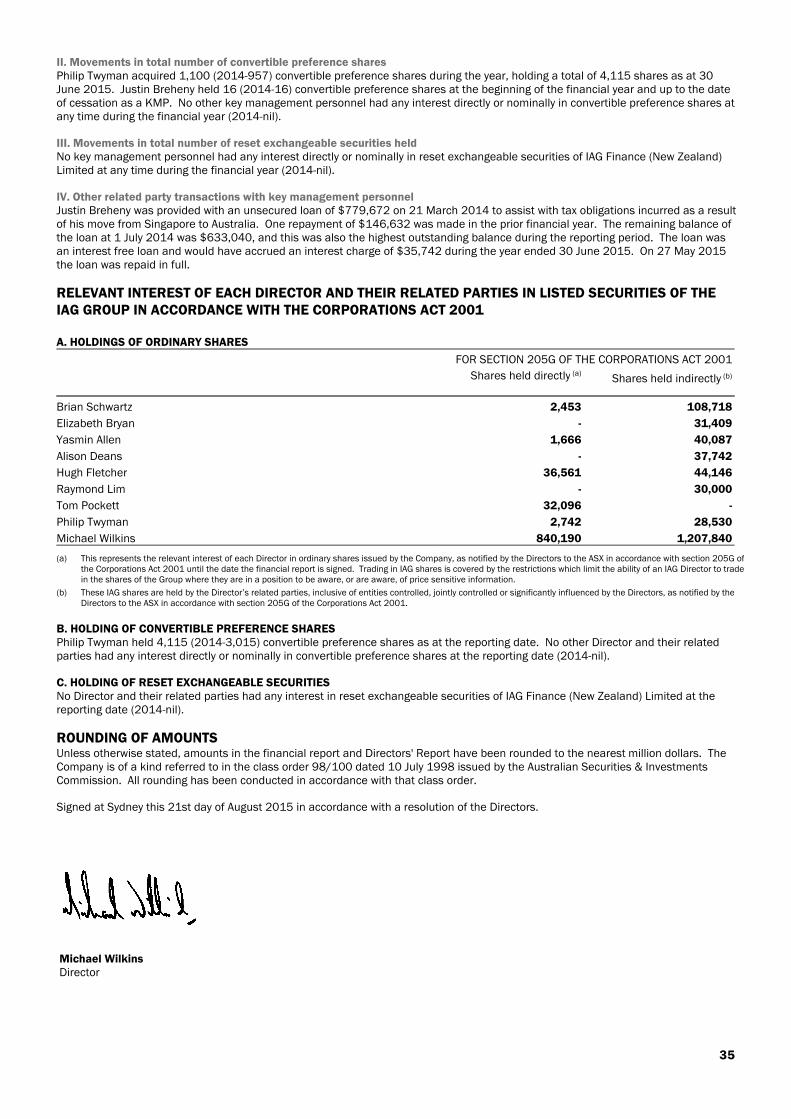
II. Movements in total number of convertible preference sharesPhilip Twyman acquired 1,100 (2014-957) convertible preference shares during the year, holding a total of 4,115 shares as at 30June 2015. Justin Breheny held 16 (2014-16) convertible preference shares at the beginning of the financial year and up to the dateof cessation as a KMP. No other key management personnel had any interest directly or nominally in convertible preference shares atany time during the financial year (2014-nil).
III. Movements in total number of reset exchangeable securities heldNo key management personnel had any interest directly or nominally in reset exchangeable securities of IAG Finance (New Zealand)Limited at any time during the financial year (2014-nil).
IV. Other related party transactions with key management personnelJustin Breheny was provided with an unsecured loan of $779,672 on 21 March 2014 to assist with tax obligations incurred as a resultof his move from Singapore to Australia. One repayment of $146,632 was made in the prior financial year. The remaining balance ofthe loan at 1 July 2014 was $633,040, and this was also the highest outstanding balance during the reporting period. The loan wasan interest free loan and would have accrued an interest charge of $35,742 during the year ended 30 June 2015. On 27 May 2015the loan was repaid in full.
RELEVANT INTEREST OF EACH DIRECTOR AND THEIR RELATED PARTIES IN LISTED SECURITIES OF THEIAG GROUP IN ACCORDANCE WITH THE CORPORATIONS ACT 2001
A. HOLDINGS OF ORDINARY SHARES
FOR SECTION 205G OF THE CORPORATIONS ACT 2001
Shares held directly (a)Shares held indirectly (b)
Brian Schwartz 2,453 108,718
Elizabeth Bryan - 31,409
Yasmin Allen 1,666 40,087
Alison Deans - 37,742
Hugh Fletcher 36,561 44,146
Raymond Lim - 30,000
Tom Pockett 32,096 -
Philip Twyman 2,742 28,530
Michael Wilkins 840,190 1,207,840
(a) This represents the relevant interest of each Director in ordinary shares issued by the Company, as notified by the Directors to the ASX in accordance with section 205G ofthe Corporations Act 2001 until the date the financial report is signed. Trading in IAG shares is covered by the restrictions which limit the ability of an IAG Director to tradein the shares of the Group where they are in a position to be aware, or are aware, of price sensitive information.
(b) These IAG shares are held by the Director’s related parties, inclusive of entities controlled, jointly controlled or significantly influenced by the Directors, as notified by theDirectors to the ASX in accordance with section 205G of the Corporations Act 2001.
B. HOLDING OF CONVERTIBLE PREFERENCE SHARESPhilip Twyman held 4,115 (2014-3,015) convertible preference shares as at the reporting date. No other Director and their relatedparties had any interest directly or nominally in convertible preference shares at the reporting date (2014-nil).
C. HOLDING OF RESET EXCHANGEABLE SECURITIESNo Director and their related parties had any interest in reset exchangeable securities of IAG Finance (New Zealand) Limited at thereporting date (2014-nil).
ROUNDING OF AMOUNTSUnless otherwise stated, amounts in the financial report and Directors' Report have been rounded to the nearest million dollars. TheCompany is of a kind referred to in the class order 98/100 dated 10 July 1998 issued by the Australian Securities & InvestmentsCommission. All rounding has been conducted in accordance with that class order.
Signed at Sydney this 21st day of August 2015 in accordance with a resolution of the Directors.
Michael WilkinsDirector
35
LEAD AUDITOR'SINDEPENDENCE DECLARATIONUNDER SECTION 307C OF THE CORPORATIONS ACT 2001
TO THE DIRECTORS OF INSURANCE AUSTRALIA GROUP LIMITED
I declare that, to the best of my knowledge and belief, in relation to the audit for the financial year ended 30 June 2015 there havebeen: no contraventions of the auditor independence requirements as set out in the Corporations Act 2001 in relation to the audit; and
no contraventions of any applicable code of professional conduct in relation to the audit.
KPMG
Dr Andries B TerblanchéPartner
Sydney21 August 2015
36 IAG ANNUAL REPORT 2015KPMG, an Australian partnership and a member firm of the KPMG network of independent member firms affiliated with KPMG International Cooperative ("KPMGInternational"), a Swiss entity. Liability limited by a scheme approved under Professional Standards Legislation.
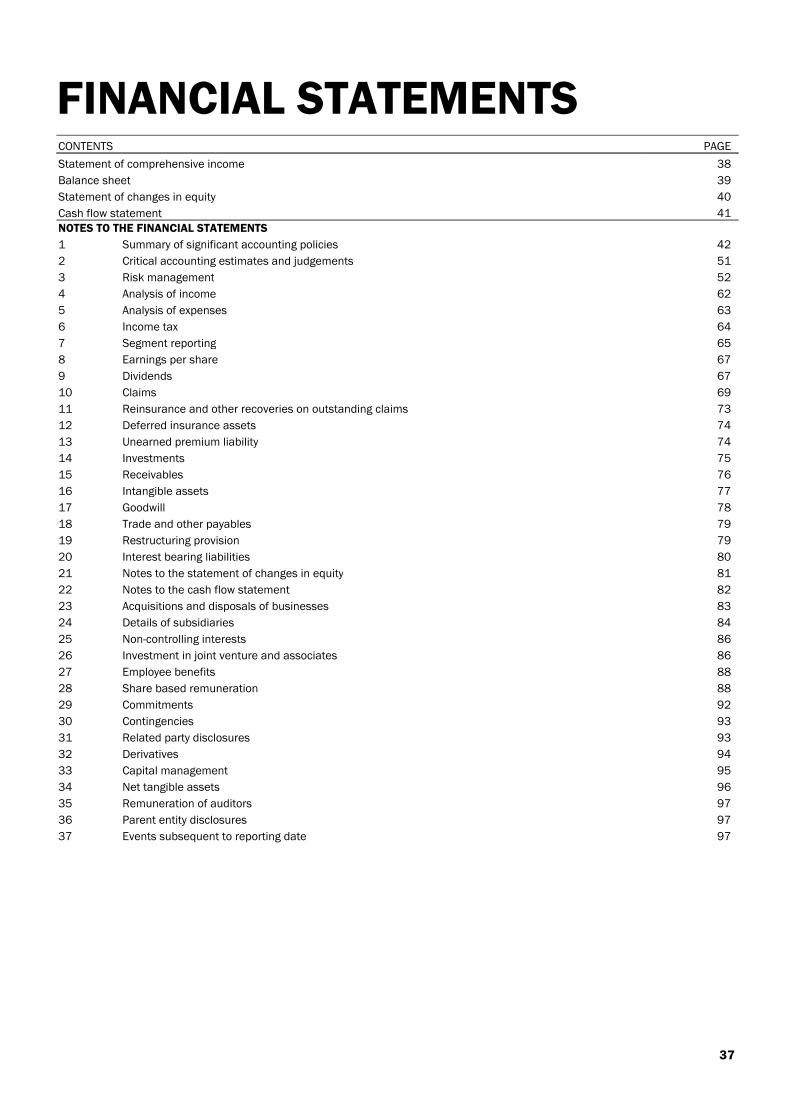
FINANCIAL STATEMENTSCONTENTS PAGE
Statement of comprehensive income 38
Balance sheet 39
Statement of changes in equity 40
Cash flow statement 41NOTES TO THE FINANCIAL STATEMENTS
1 Summary of significant accounting policies 42
2 Critical accounting estimates and judgements 51
3 Risk management 52
4 Analysis of income 62
5 Analysis of expenses 63
6 Income tax 64
7 Segment reporting 65
8 Earnings per share 67
9 Dividends 67
10 Claims 69
11 Reinsurance and other recoveries on outstanding claims 73
12 Deferred insurance assets 74
13 Unearned premium liability 74
14 Investments 75
15 Receivables 76
16 Intangible assets 77
17 Goodwill 78
18 Trade and other payables 79
19 Restructuring provision 79
20 Interest bearing liabilities 80
21 Notes to the statement of changes in equity 81
22 Notes to the cash flow statement 82
23 Acquisitions and disposals of businesses 83
24 Details of subsidiaries 84
25 Non-controlling interests 86
26 Investment in joint venture and associates 86
27 Employee benefits 88
28 Share based remuneration 88
29 Commitments 92
30 Contingencies 93
31 Related party disclosures 93
32 Derivatives 94
33 Capital management 95
34 Net tangible assets 96
35 Remuneration of auditors 97
36 Parent entity disclosures 97
37 Events subsequent to reporting date 97
37
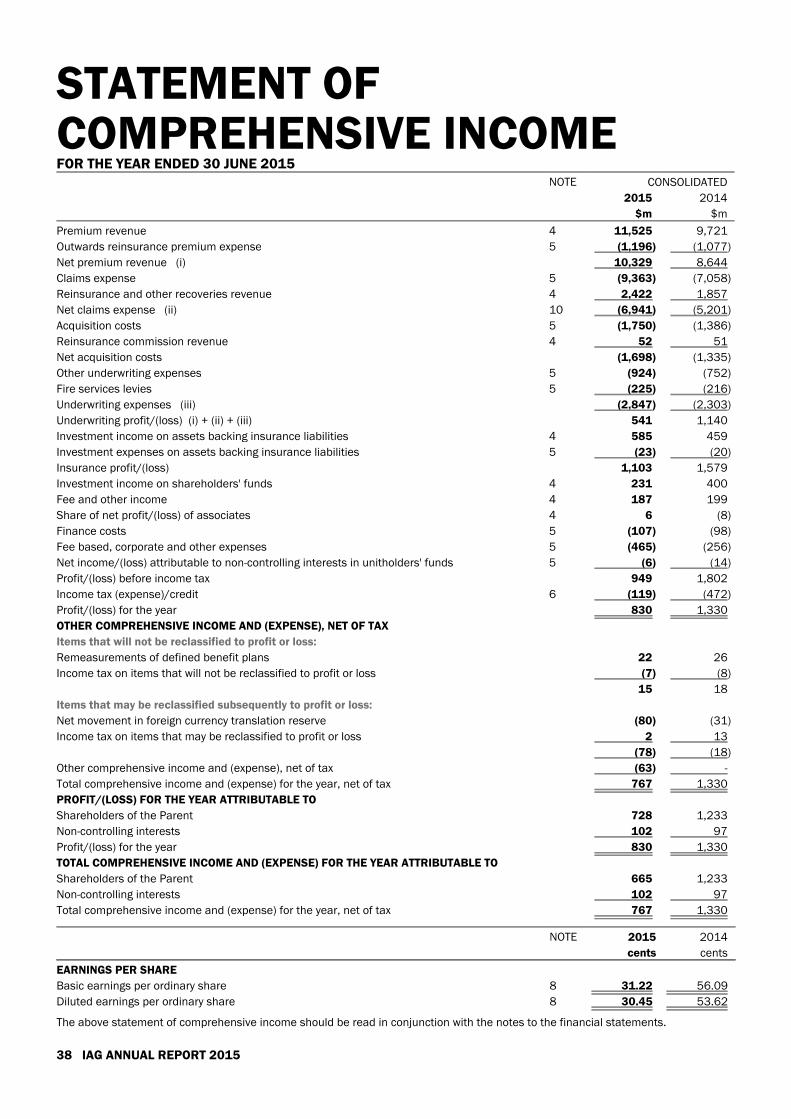
STATEMENT OFCOMPREHENSIVE INCOMEFOR THE YEAR ENDED 30 JUNE 2015
NOTE CONSOLIDATED
2015 2014
$m $m
Premium revenue 4 11,525 9,721
Outwards reinsurance premium expense 5 (1,196) (1,077)
Net premium revenue (i) 10,329 8,644
Claims expense 5 (9,363) (7,058)
Reinsurance and other recoveries revenue 4 2,422 1,857
Net claims expense (ii) 10 (6,941) (5,201)
Acquisition costs 5 (1,750) (1,386)
Reinsurance commission revenue 4 52 51
Net acquisition costs (1,698) (1,335)
Other underwriting expenses 5 (924) (752)
Fire services levies 5 (225) (216)
Underwriting expenses (iii) (2,847) (2,303)
Underwriting profit/(loss) (i) + (ii) + (iii) 541 1,140
Investment income on assets backing insurance liabilities 4 585 459
Investment expenses on assets backing insurance liabilities 5 (23) (20)
Insurance profit/(loss) 1,103 1,579
Investment income on shareholders' funds 4 231 400
Fee and other income 4 187 199
Share of net profit/(loss) of associates 4 6 (8)
Finance costs 5 (107) (98)
Fee based, corporate and other expenses 5 (465) (256)
Net income/(loss) attributable to non-controlling interests in unitholders' funds 5 (6) (14)
Profit/(loss) before income tax 949 1,802
Income tax (expense)/credit 6 (119) (472)
Profit/(loss) for the year 830 1,330
OTHER COMPREHENSIVE INCOME AND (EXPENSE), NET OF TAX
Items that will not be reclassified to profit or loss:
Remeasurements of defined benefit plans 22 26
Income tax on items that will not be reclassified to profit or loss (7) (8)
15 18
Items that may be reclassified subsequently to profit or loss:
Net movement in foreign currency translation reserve (80) (31)
Income tax on items that may be reclassified to profit or loss 2 13
(78) (18)
Other comprehensive income and (expense), net of tax (63) -
Total comprehensive income and (expense) for the year, net of tax 767 1,330
PROFIT/(LOSS) FOR THE YEAR ATTRIBUTABLE TO
Shareholders of the Parent 728 1,233
Non-controlling interests 102 97
Profit/(loss) for the year 830 1,330
TOTAL COMPREHENSIVE INCOME AND (EXPENSE) FOR THE YEAR ATTRIBUTABLE TO
Shareholders of the Parent 665 1,233
Non-controlling interests 102 97
Total comprehensive income and (expense) for the year, net of tax 767 1,330
NOTE 2015 2014
cents cents
EARNINGS PER SHARE
Basic earnings per ordinary share 8 31.22 56.09
Diluted earnings per ordinary share 8 30.45 53.62
The above statement of comprehensive income should be read in conjunction with the notes to the financial statements.
38 IAG ANNUAL REPORT 2015
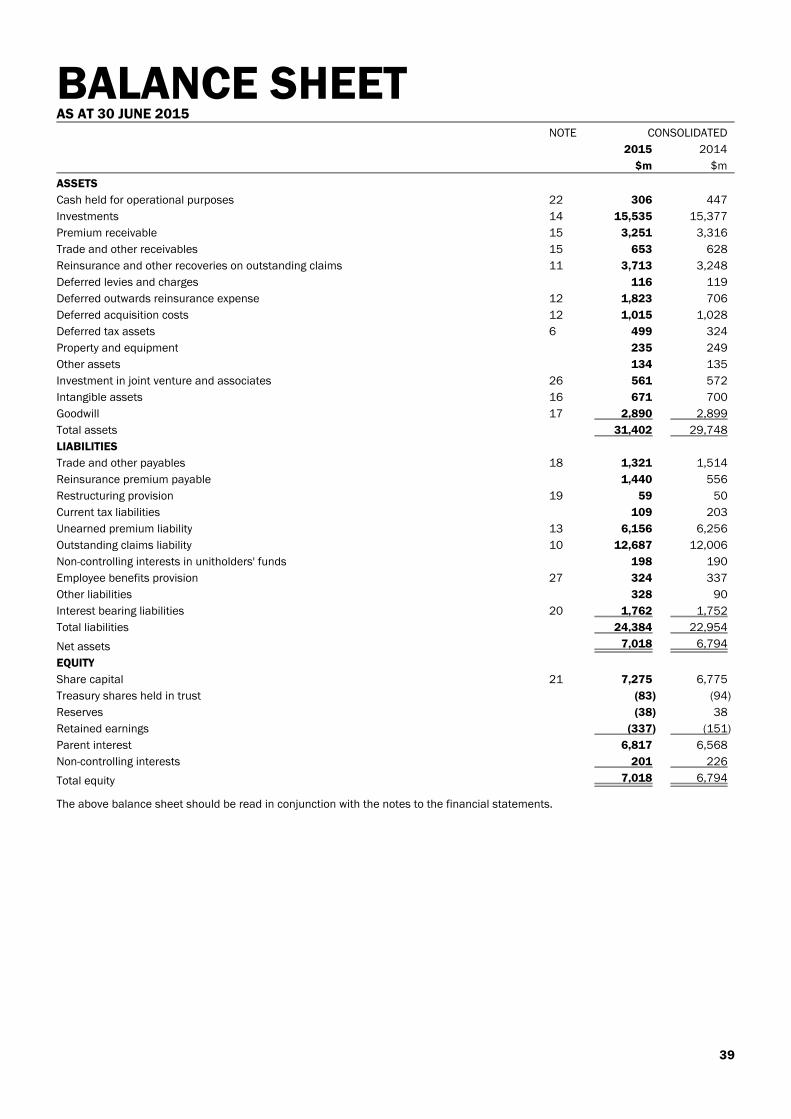
BALANCE SHEETAS AT 30 JUNE 2015
NOTE CONSOLIDATED
2015 2014
$m $m
ASSETS
Cash held for operational purposes 22 306 447
Investments 14 15,535 15,377
Premium receivable 15 3,251 3,316
Trade and other receivables 15 653 628
Reinsurance and other recoveries on outstanding claims 11 3,713 3,248
Deferred levies and charges 116 119
Deferred outwards reinsurance expense 12 1,823 706
Deferred acquisition costs 12 1,015 1,028
Deferred tax assets 6 499 324
Property and equipment 235 249
Other assets 134 135
Investment in joint venture and associates 26 561 572
Intangible assets 16 671 700
Goodwill 17 2,890 2,899
Total assets 31,402 29,748
LIABILITIES
Trade and other payables 18 1,321 1,514
Reinsurance premium payable 1,440 556
Restructuring provision 19 59 50
Current tax liabilities 109 203
Unearned premium liability 13 6,156 6,256
Outstanding claims liability 10 12,687 12,006
Non-controlling interests in unitholders' funds 198 190
Employee benefits provision 27 324 337
Other liabilities 328 90
Interest bearing liabilities 20 1,762 1,752
Total liabilities 24,384 22,954
Net assets 7,018 6,794
EQUITY
Share capital 21 7,275 6,775
Treasury shares held in trust (83) (94)
Reserves (38) 38
Retained earnings (337) (151)
Parent interest 6,817 6,568
Non-controlling interests 201 226
Total equity 7,018 6,794
The above balance sheet should be read in conjunction with the notes to the financial statements.
39
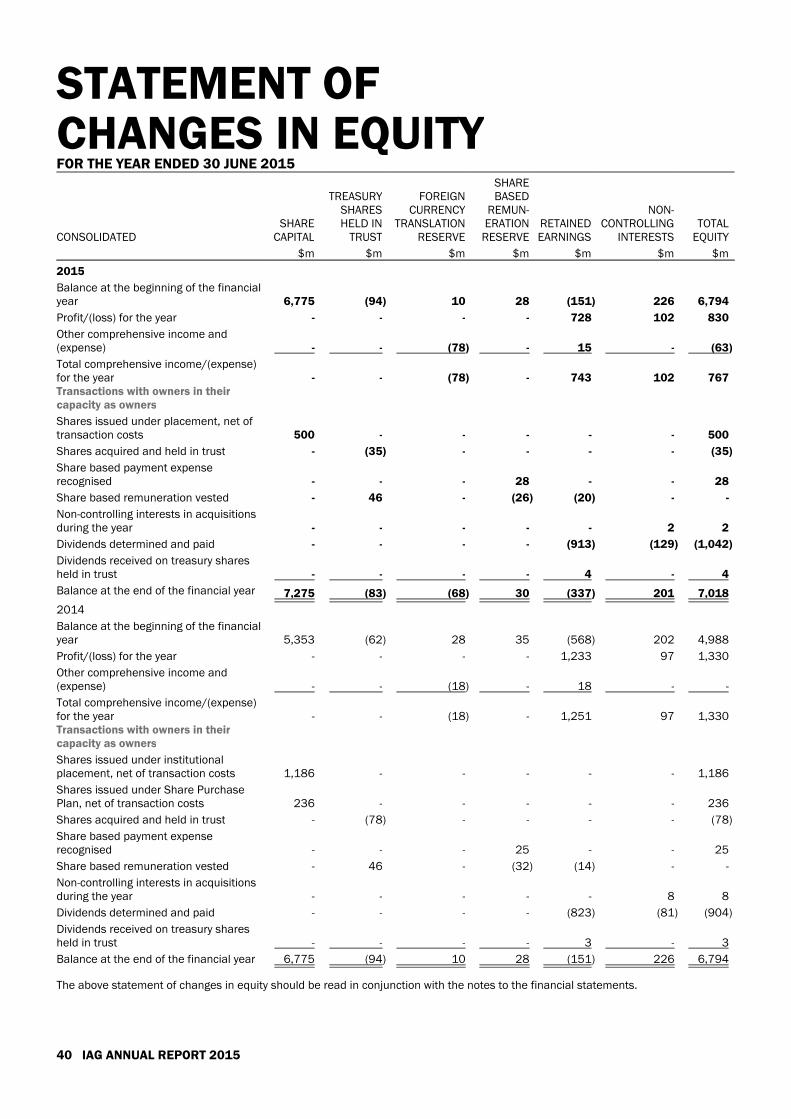
STATEMENT OFCHANGES IN EQUITYFOR THE YEAR ENDED 30 JUNE 2015
CONSOLIDATEDSHARE
CAPITAL
TREASURYSHARESHELD IN
TRUST
FOREIGNCURRENCY
TRANSLATIONRESERVE
SHAREBASED
REMUN-ERATION
RESERVERETAINEDEARNINGS
NON-CONTROLLING
INTERESTSTOTAL
EQUITY
$m $m $m $m $m $m $m
2015
Balance at the beginning of the financialyear 6,775 (94) 10 28 (151) 226 6,794
Profit/(loss) for the year - - - - 728 102 830
Other comprehensive income and(expense) - - (78) - 15 - (63)
Total comprehensive income/(expense)for the year - - (78) - 743 102 767Transactions with owners in theircapacity as owners
Shares issued under placement, net oftransaction costs 500 - - - - - 500
Shares acquired and held in trust - (35) - - - - (35)
Share based payment expenserecognised - - - 28 - - 28
Share based remuneration vested - 46 - (26) (20) - -
Non-controlling interests in acquisitionsduring the year - - - - - 2 2
Dividends determined and paid - - - - (913) (129) (1,042)
Dividends received on treasury sharesheld in trust - - - - 4 - 4
Balance at the end of the financial year 7,275 (83) (68) 30 (337) 201 7,018
2014
Balance at the beginning of the financialyear 5,353 (62) 28 35 (568) 202 4,988
Profit/(loss) for the year - - - - 1,233 97 1,330
Other comprehensive income and(expense) - - (18) - 18 - -
Total comprehensive income/(expense)for the year - - (18) - 1,251 97 1,330Transactions with owners in theircapacity as owners
Shares issued under institutionalplacement, net of transaction costs 1,186 - - - - - 1,186
Shares issued under Share PurchasePlan, net of transaction costs 236 - - - - - 236
Shares acquired and held in trust - (78) - - - - (78)
Share based payment expenserecognised - - - 25 - - 25
Share based remuneration vested - 46 - (32) (14) - -
Non-controlling interests in acquisitionsduring the year - - - - - 8 8
Dividends determined and paid - - - - (823) (81) (904)
Dividends received on treasury sharesheld in trust - - - - 3 - 3
Balance at the end of the financial year 6,775 (94) 10 28 (151) 226 6,794
The above statement of changes in equity should be read in conjunction with the notes to the financial statements.
40 IAG ANNUAL REPORT 2015
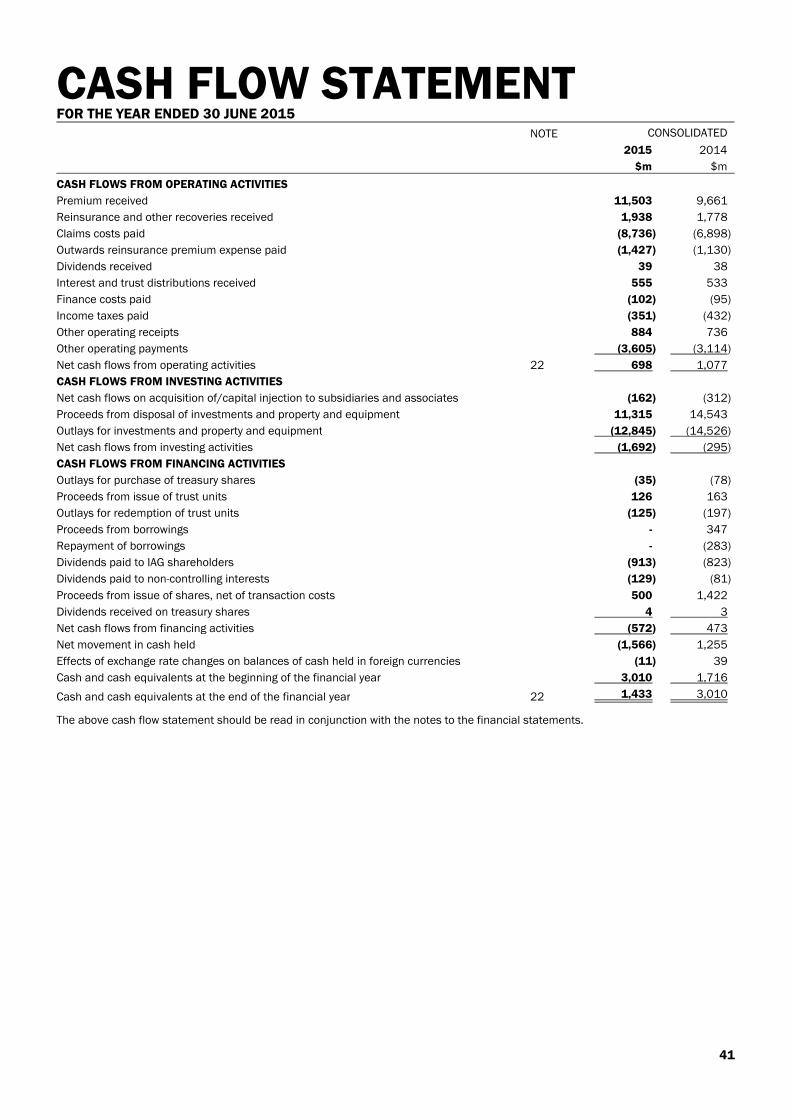
CASH FLOW STATEMENTFOR THE YEAR ENDED 30 JUNE 2015
NOTE CONSOLIDATED
2015 2014
$m $m
CASH FLOWS FROM OPERATING ACTIVITIES
Premium received 11,503 9,661
Reinsurance and other recoveries received 1,938 1,778
Claims costs paid (8,736) (6,898)
Outwards reinsurance premium expense paid (1,427) (1,130)
Dividends received 39 38
Interest and trust distributions received 555 533
Finance costs paid (102) (95)
Income taxes paid (351) (432)
Other operating receipts 884 736
Other operating payments (3,605) (3,114)
Net cash flows from operating activities 22 698 1,077
CASH FLOWS FROM INVESTING ACTIVITIES
Net cash flows on acquisition of/capital injection to subsidiaries and associates (162) (312)
Proceeds from disposal of investments and property and equipment 11,315 14,543
Outlays for investments and property and equipment (12,845) (14,526)
Net cash flows from investing activities (1,692) (295)
CASH FLOWS FROM FINANCING ACTIVITIES
Outlays for purchase of treasury shares (35) (78)
Proceeds from issue of trust units 126 163
Outlays for redemption of trust units (125) (197)
Proceeds from borrowings - 347
Repayment of borrowings - (283)
Dividends paid to IAG shareholders (913) (823)
Dividends paid to non-controlling interests (129) (81)
Proceeds from issue of shares, net of transaction costs 500 1,422
Dividends received on treasury shares 4 3
Net cash flows from financing activities (572) 473
Net movement in cash held (1,566) 1,255
Effects of exchange rate changes on balances of cash held in foreign currencies (11) 39
Cash and cash equivalents at the beginning of the financial year 3,010 1,716
Cash and cash equivalents at the end of the financial year 22 1,433 3,010
The above cash flow statement should be read in conjunction with the notes to the financial statements.
41
NOTES TO THEFINANCIAL STATEMENTSNOTE 1. SUMMARY OF SIGNIFICANT ACCOUNTING POLICIESInsurance Australia Group Limited (IAG, Parent or Company) is a company limited by shares, incorporated and domiciled in Australiawhose shares are publicly traded on the Australian Securities Exchange (ASX). Its registered office and principal place of business isLevel 26, 388 George Street, Sydney, NSW 2000, Australia. This financial report is for the reporting year ended 30 June 2015 and theconsolidated financial statements are for the Company and its subsidiaries (Group or Consolidated entity). The Group is a for-profitentity.
This general purpose financial report was authorised by the Board of Directors for issue on 21 August 2015.
A. STATEMENT OF COMPLIANCEThis general purpose financial report has been prepared in accordance with the Corporations Act 2001, Australian AccountingStandards (AASB) adopted by the Australian Accounting Standards Board, other authoritative pronouncements of the AustralianAccounting Standards Board and the ASX Listing Rules.
International Financial Reporting Standards (IFRS) refer to the overall framework of standards and pronouncements approved by theInternational Accounting Standards Board (IASB). IFRS forms the basis of the AASBs. This financial report of the Consolidated entitycomplies with IFRS.
The current IFRS standard for insurance contracts does not include a comprehensive set of recognition and measurement criteria. TheIASB continues to work on a project to issue a standard that does include such criteria. Until the issuance of that standard, thefinancial reports of insurers in different countries that comply with IFRS may not be comparable in terms of the recognition andmeasurement of insurance contracts.
B. BASIS OF PREPARATION OF THE FINANCIAL REPORT The significant accounting policies adopted in the preparation of this financial report are set out below. The accounting policiesadopted in the preparation of this financial report have been applied consistently by all entities in the Consolidated entity and are thesame as those applied for the previous reporting year unless otherwise noted. The financial statements have been prepared on thebasis of historical cost principles, as modified by certain exceptions noted in the financial report, with the principal exceptions for theConsolidated entity being the measurement of all investments and derivatives at fair value and the measurement of the outstandingclaims liability and related reinsurance and other recoveries at present value.
The presentation currency used for the preparation of this financial report is Australian dollars.
The balance sheet is prepared using the liquidity format in which the assets and liabilities are presented broadly in order of liquidity.The assets and liabilities comprise both current amounts (expected to be recovered or settled within 12 months after the reportingdate) and non-current amounts (expected to be recovered or settled more than 12 months after the reporting date). For those assetsand liabilities that comprise both current and non-current amounts, information regarding the amount of the item that is expected tobe outstanding longer than 12 months is included within the relevant note to the financial statements.
I. Australian Accounting Standards issued but not yet effectiveAs at the date of this financial report, there are a number of new and revised accounting standards published by the AustralianAccounting Standards Board for which the mandatory application dates fall after the end of this current reporting year.
None of these standards have been early adopted and applied in the current reporting year.
42 IAG ANNUAL REPORT 2015

TITLE DESCRIPTION OPERATIVE DATE NOTE
AASB 9 Financial Instruments 1 January 2018 B
AASB 2009-11 Amendments to Australian Accounting Standards arising from AASB 9 1 January 2018 B
AASB 2010-7 Amendments to Australian Accounting Standards arising from AASB 9 1 January 2018 B
AASB 2012-6 Amendments to Australian Accounting Standards - Mandatory Effective Dateof AASB 9 and Transition Disclosures
1 January 2015 B
AASB 2013-9 Amendments to Australian Accounting Standards – Conceptual Framework,Materiality and Financial Instruments: Part C
1 January 2018 A
AASB 15 Revenue from contracts with customers 1 January 2018 B
AASB 2014-1 Amendments to Australian Accounting Standards: Part E 1 January 2018 A
AASB 2014-3 Amendments to Australian Accounting Standards – Accounting forAcquisitions of Interests in Joint Operations
1 January 2016 A
AASB 2014-4 Amendments to Australian Accounting Standards – Clarification ofAcceptable Methods of Depreciation and Amortisation
1 January 2016 A
AASB 2014-5 Amendments to Australian Accounting Standards arising from AASB 15 1 January 2017 B
AASB 2014-7 Amendments to Australian Accounting Standards arising from AASB 9 1 January 2018 B
AASB 2014-8 Amendments to Australian Accounting Standards arising from AASB 9 1 January 2015 B
AASB 2014-9 Amendments to Australian Accounting Standards - Equity Method inSeparate Financial Statements
1 January 2016 A
AASB 2014-10 Amendments to Australian Accounting Standards - Sale or Contribution ofAssets between an Investor and its Associate or Joint Venture
1 January 2016 A
AASB 2015-1 Amendments to Australian Accounting Standards - Annual improvement toAustralian Accounting standards 2012-2014 Cycle
1 January 2016 A
AASB 2015-2 Amendments to Australian Accounting Standards - Disclosure Initiative:Amendment to AASB 101
1 January 2016 A
AASB 2015-3 Amendments to Australian Accounting Standards arising from theWithdrawal of AASB 1031 Materiality
1 July 2015 A
AASB 2015-4 Amendments to Australian Accounting Standards - Financial ReportingRequirements for Australian Groups with a Foreign Parent
1 July 2015 A
AASB 2015-5 Amendments to Australian Accounting Standards - Investment Entities:Applying the Consolidation Exception
1 January 2016 A
TABLE NOTE
A These changes are not expected to have a significant, if any, financial and disclosure impact.
B First time adoption of these standards may have a financial impact, but the potential effects are currently being assessed.
II. Changes in accounting policies There were a number of new Australian Accounting Standards and Interpretations applicable for the current reporting year. Theseincluded:
TITLE DESCRIPTION
AASB 2012-3 Amendments to Australian Accounting Standards arising from AASB 132 - Offsetting Financial Assets andFinancial Liabilities
AASB 2013-4 Amendments to Australian Accounting Standards – Novation of Derivatives and Continuation of HedgeAccounting
AASB 2013-5 Amendments to Australian Accounting Standards – Investment Entities
AASB 2013-9 Amendments to Australian Accounting Standards – Conceptual Framework, Materiality and FinancialInstruments: Part B
AASB 2014-1 Amendments to Australian Accounting Standards: Parts A - C
Adoption of the new and amended accounting standards had no material financial impact on the Group.
III. Changes to comparativesCertain items have been reclassified from the Consolidated entity's prior year financial report to conform to the current year'spresentation. The reclassifications are: During the year ended 30 June 2015, the acquisition accounting was finalised in respect of the acquisition of the former
Wesfarmers business during the prior financial year. The comparative consolidated balance sheet as at 30 June 2014 has beenrestated to reflect these adjustments, with no overall impact to the Group's net assets. The following balance sheet items havebeen restated accordingly: goodwill; deferred tax assets; other assets; trade and other payables; employee benefits provision;outstanding claims liability; and the net tangible assets per ordinary share. For further details refer to the acquisitions anddisposals of businesses note;
From 1 July 2014, a new Australian operating model came into effect resulting in changes to the reporting segments of theAustralian operations. Prior period segment related information has been re-presented accordingly in the segment and claimsnotes; and
Reclassification of $25 million of prior year trade and other payables to other liabilities to conform to current year presentation.
43

IV. RoundingAmounts in this financial report have been rounded to the nearest million dollars, unless otherwise stated. The Company is the kind ofcompany referred to in the class order 98/100 dated 10 July 1998 issued by the Australian Securities & Investments Commission. Allrounding has been conducted in accordance with that class order.
C. PRINCIPLES OF CONSOLIDATION I. SubsidiariesConsolidation is the incorporation of the assets and liabilities of the Parent and all subsidiaries as at the reporting date and the resultsof the Parent and all subsidiaries for the year then ended as if they had operated as a single entity. The balances and effects ofintragroup transactions are eliminated from the consolidation. Subsidiaries are those entities controlled by the Parent. An investorcontrols an investee if and only if the investor has power over the investee; exposure, or rights, to variable returns from its involvementwith the investee; and the ability to use its power over the investee to affect the amount of the investor's returns. Where an entityeither began or ceased to be controlled during a financial reporting year, the results are included only from the date controlcommenced or up to the date control ceased.
The financial information of all subsidiaries is prepared for consolidation for the same reporting year as the Parent, using consistentaccounting policies. The financial statements of entities operating outside Australia that maintain accounting records in accordancewith overseas accounting principles are adjusted where necessary to comply with the significant accounting policies of theConsolidated entity.
Where a subsidiary is less than wholly owned, the equity interests held by external parties are presented separately as non-controllinginterests on the consolidated balance sheet, except where the subsidiary is a trust or similar entity for which the third party interest ispresented separately on the consolidated balance sheet as a liability (this is the case with the IAG Asset Management WholesaleTrusts that are subsidiaries, refer to the details of subsidiaries note).
II. AssociatesAssociates, those entities over which significant influence is exercised but not joint control, and which are not intended for sale in thenear future, are accounted for using the equity accounting method. Significant influence is generally accompanying a shareholding ofbetween 20% and 50% of the voting rights of an entity, but can also arise where less than 20% is held through active involvement andinfluence of policy decisions affecting the entity. The investment in associates is initially recognised at cost (fair value of considerationprovided plus directly attributable costs) and is subsequently adjusted for the post-acquisition change in the investor’s share of netassets of the investee. The investor’s share of the profit or loss of the investee is included in the profit or loss of the Consolidatedentity and disclosed as a separate line in the statement of comprehensive income. Distributions received reduce the carrying amountof the investment and are not included as dividend revenue of the Consolidated entity. Movements in the total equity of the investeethat are not recognised in the profit or loss of the investee are recognised directly in equity of the Consolidated entity and disclosed inthe statement of changes in equity. The investments are reviewed annually for impairment.
Where an entity either began or ceased to be an associate during the current financial reporting year, the investment is equityaccounted from the date significant influence commenced or up to the date significant influence ceased.
The financial statements of associates are adjusted where necessary to comply with the significant accounting policies of theConsolidated entity.
When the investor’s share of losses exceeds its interest in the investee, the carrying amount of the investment is reduced to nil andrecognition of further losses is discontinued except to the extent that the investor has incurred obligations or made payments, onbehalf of the investee.
III. Joint arrangementA joint arrangement (joint operation or a joint venture) exists where parties are bound by a contractual arrangement, giving two ormore of the parties joint control of the arrangement and decisions about the relevant activities require unanimous consent of theparties that control the arrangement collectively.
Joint control is assessed by considering rights and obligations from the contractual arrangement, as well as arrangement structure,legal form and terms agreed. The investment in joint ventures is equity accounted from the date joint control commences during afinancial period.
SIGNIFICANT ACCOUNTING POLICIES RELATED TO GENERAL INSURANCE CONTRACTSAll of the general insurance products and reinsurance products on offer, or utilised, meet the definition of an insurance contract (acontract under which one party, the insurer, accepts significant insurance risk from another party, the policyholder, by agreeing tocompensate the policyholder if a specified uncertain future event, the insured event, adversely affects the policyholder) and none ofthe contracts contain embedded derivatives or are required to be unbundled. Insurance contracts that meet the definition of afinancial guarantee contract are accounted for as insurance contracts. This means that all of the general insurance products areaccounted for in the same manner.
D. PREMIUM REVENUEPremium revenue comprises amounts charged to policyholders (direct premium) or other insurers (inwards reinsurance premium) forinsurance contracts. Premium includes amounts collected for levies and charges for which the amount to be paid by the insurer doesnot depend on the amounts collected, such as for fire services levies in Australia, but excludes stamp duties and taxes collected onbehalf of third parties, including the goods and services tax (GST) in Australia.
44 IAG ANNUAL REPORT 2015
Premium is recognised as earned from the date of attachment of risk (generally the date a contract is agreed to but may be earlier ifpersuasive evidence of an arrangement exists) over the period of the related insurance contracts in accordance with the pattern of theincidence of risk expected under the contracts. The pattern of the risks underwritten is generally matched by the passing of time.Premium for unclosed business (business written close to reporting date where attachment of risk is prior to reporting date and thereis insufficient information to accurately identify the business) is brought to account based on previous experience with due allowancefor any changes in the pattern of new business and renewals. The unearned portion of premium is recognised as an unearnedpremium liability on the balance sheet.
Premium receivable is recognised as the amount due and is normally settled between 30 days and 12 months. The recoverability ofpremium receivable is assessed and provision is made for impairment based on objective evidence and having regard to past defaultexperience. Premium receivable is presented on the balance sheet net of any provision for impairment.
E. OUTWARDS REINSURANCEPremium ceded to reinsurers is recognised as an expense in accordance with the pattern of reinsurance service received. Accordingly,a portion of outwards reinsurance premium expense is treated as a prepayment and presented as deferred outwards reinsuranceexpense on the balance sheet at the reporting date.
F. CLAIMSThe outstanding claims liability is measured as the central estimate of the present value of expected future payments relating toclaims incurred at the reporting date with an additional risk margin to allow for the inherent uncertainty in the central estimate. Theliability is measured based on the advice of/valuations performed by, or under the direction of, the Appointed Actuary. The expectedfuture payments include those in relation to claims reported but not yet paid or not yet paid in full, claims incurred but not enoughreported (IBNER), claims incurred but not reported (IBNR) and the anticipated direct and indirect claims handling costs. The liability isdiscounted to present value using a risk free rate.
Claims expense represents claim payments adjusted for the movement in the outstanding claims liability.
The estimation of the outstanding claims liability involves a number of key assumptions and is the most critical accounting estimate.All reasonable steps are taken to ensure that the information used regarding claims exposures is appropriate. However, given theuncertainty in establishing the liability, it is likely that the final outcome will be different from the original liability established. Changesin claims estimates are recognised in profit or loss in the reporting year in which the estimates are changed.
G. REINSURANCE AND OTHER RECOVERIESReinsurance and other recoveries received or receivable on paid claims and on outstanding claims (notified and not yet notified) arerecognised as income. Reinsurance and other recoveries receivable include the net GST receivable on outstanding claims andrecoveries. Reinsurance recoveries on paid claims are presented as part of trade and other receivables net of any provision forimpairment based on objective evidence for individual receivables. All recoveries receivable on outstanding claims are measured asthe present value of the expected future receipts calculated on the same basis as the outstanding claims liability. Reinsurance doesnot relieve the originating insurer of its liabilities to policyholders and is presented separately on the balance sheet.
H. ACQUISITION COSTSCosts associated with obtaining and recording general insurance contracts are referred to as acquisition costs. These costs includeadvertising expenses, commissions or brokerage paid to agents or brokers, premium collection costs, risk assessment costs and otheradministrative costs. Such costs are capitalised where they relate to the acquisition of new business or the renewal of existingbusiness, are presented as deferred acquisition costs, and are amortised on the same basis as the earning pattern of the premiumover the period of the related insurance contracts. The balance of the deferred acquisition costs at the reporting date represents thecapitalised deferred acquisition costs relating to unearned premium.
I. LIABILITY ADEQUACY TESTThe liability adequacy test is an assessment of the carrying amount of the unearned premium liability and is conducted at eachreporting date. If current estimates of the present value of the expected future cash flows relating to future claims arising from therights and obligations under current general insurance contracts, plus an additional risk margin to reflect the inherent uncertainty inthe central estimate, exceed the unearned premium liability (net of reinsurance) less related deferred acquisition costs, then theunearned premium liability is deemed to be deficient. Any deficiency arising from the test is recognised in profit or loss with thecorresponding impact on the balance sheet recognised first through the write down of deferred acquisition costs for the relevantportfolio of contracts, with any remaining balance being recognised on the balance sheet as an unexpired risk liability. The test isperformed at the level of a portfolio of contracts that are subject to broadly similar risks and that are managed together as a singleportfolio.
J. LEVIES AND CHARGESLevies and charges for which the amount paid to regulatory bodies does not depend on the amounts collected from policyholders, as isthe case with fire services levies in Australia, are expensed on the same basis as the recognition of premium revenue. The portionrelating to unearned premium is treated as a prepayment and presented as deferred levies and charges on the balance sheet. Aliability for levies and charges payable is recognised on business written to the reporting date. Other levies and charges that aresimply collected on behalf of third parties are not recognised as income or expense in profit or loss.
SIGNIFICANT ACCOUNTING POLICIES APPLICABLE TO OTHER ACTIVITIESK. FEE AND OTHER INCOMEFee based revenue is brought to account on an accruals basis being recognised as revenue on a straight line basis in accordance withthe passage of time as the services are provided. Other income is recognised on an accruals basis.
45
L. LEASESThe majority of leases entered into are operating leases, where the lessor retains substantially all the risks and benefits of ownershipof the leased items. The majority of the lease arrangements are entered into as lessee for which the lease payments are recognisedas an expense on a straight line basis over the term of the lease. Certain sublease arrangements are entered into as the lessor forwhich the lease payments are recognised as revenue on a straight line basis over the term of the lease.
Lease incentives relating to the agreement of a new or renewed operating lease are recognised as an integral part of the netconsideration agreed for the use of the leased asset. Operating lease incentives received are initially recognised as a liability, arepresented as trade and other payables, and are subsequently reduced through recognition in profit or loss as an integral part of thetotal lease expense (lease payments are allocated between rental expense and reduction of the liability) on a straight line basis overthe period of the lease.
M. TAXATIONI. Income taxIncome tax expense for a reporting year comprises current and deferred tax. Income tax is recognised in profit or loss except to theextent that it relates to items recognised directly in equity, in which case it is recognised in equity.
Current tax expense is the expected tax payable on the taxable income for the year, using tax rates for each jurisdiction, and anyadjustment to tax payable in respect of previous financial periods. Deferred tax expense is the change in deferred tax assets andliabilities between the reporting years.
Deferred tax assets and liabilities are recognised using the balance sheet method for temporary differences between the carryingamounts of assets and liabilities for financial reporting purposes and the amounts used for taxation purposes, except in the followingcircumstances when no deferred tax asset or liability is recognised: temporary differences if they arose in a transaction, other than a business combination, that at the time of the transaction did not
affect either accounting profit or taxable profit or loss;
temporary differences between the carrying amount and tax bases of investments in subsidiaries where it is probable that thedifferences will not reverse in the foreseeable future; and
temporary differences relating to the initial recognition of goodwill.
The amount of deferred tax provided is based on the expected manner of realisation or settlement of the carrying amount of assetsand liabilities, using tax rates enacted or substantively enacted at reporting date. Deferred tax assets are recognised only to the extentthat it is probable that future taxable profits will be available against which the asset can be utilised.
II. Tax consolidationIAG and its Australian resident wholly owned subsidiaries adopted the tax consolidation legislation with effect from 1 July 2002 and aretherefore taxed as a single entity from that date. IAG is the head entity within the tax-consolidated group.
Any current tax liabilities (or assets) and deferred tax assets arising from unused tax losses of the subsidiaries are assumed by thehead entity in the tax-consolidated group and are recognised as amounts receivable/(payable) from/(to) other entities in the tax-consolidated group in conjunction with any tax funding arrangement amounts. Any difference between these amounts is recognised byIAG as an equity contribution or distribution.
All entities in the tax-consolidated group have entered into a tax sharing agreement which, in the opinion of the Directors, limits thejoint and several liabilities of the wholly owned entities in the case of a default by the head entity. The entities have also entered into atax funding agreement under which the wholly owned entities fully compensate the Company for any current tax payable assumed.
III. GSTRevenue, expenses and assets are recognised net of the amount of GST, except where the amount of GST incurred is not recoverable.In these circumstances GST is recognised as part of the cost of acquisition of the asset or as part of an item of expense.
Receivables and payables are stated inclusive of GST. Cash flows are included in the cash flow statement on a gross basis.
N. INVESTMENTSInvestments comprise assets held to back insurance liabilities (also referred to as technical reserves) and assets that representshareholders' funds. All investments are managed and performance evaluated on a fair value basis for both external and internalreporting purposes in accordance with a documented risk management strategy. The carrying values of investments are consideredidentical to the fair value.
All investments are designated as fair value through profit or loss upon initial recognition. They are initially recorded at fair value(being the cost of acquisition excluding transaction costs) and are subsequently remeasured to fair value at each reporting date.Changes in the fair value are recognised as realised or unrealised investment gains or losses in profit or loss. The Group recognisestransfers into and transfers out of fair value hierarchy levels as at the end of the reporting year. Purchases and sales of investmentsare recognised on a trade date basis, being the date on which a commitment is made to purchase or sell the asset. Transaction costsfor purchases of investments are expensed as incurred. Investments are derecognised when the rights to receive future cash flowsfrom the assets have expired, or have been transferred, and substantially all the risks and rewards of ownership have transferred.
46 IAG ANNUAL REPORT 2015
For securities traded in an active market, fair value is determined by reference to quoted mid-market prices at the current reportingdate. For securities traded in a market that is not active, valuation techniques are used based on market observable inputs. In alimited number of instances, valuation techniques are based on non-market observable inputs. The fair value of investments inunlisted managed investment schemes is determined on the basis of published redemption prices of those managed investmentschemes at the reporting date.
Investment revenue is brought to account on an accruals basis. Revenue on investments in equity securities and property trusts isdeemed to accrue on the date the dividends/distributions are declared, which for listed equity securities is deemed to be the ex-dividend date.
O. INVESTMENT IN SUBSIDIARIESInvestment in subsidiaries is initially recognised at cost (fair value of consideration provided plus directly attributable costs) and issubsequently carried at the lower of cost and recoverable amount by the Parent entity. Costs incurred in investigating and evaluatingan acquisition up to the point of formal commitment to an acquisition are expensed as incurred. Where the carrying value exceeds therecoverable amount, an impairment charge is recognised in profit or loss which can subsequently be reversed in certain conditions.
Where an additional interest is purchased in an existing subsidiary, the acquisition is treated as a transaction between owners and hasno impact on the statement of comprehensive income. Income from these investments, comprising dividends and trust distributions,is brought to account on an accruals basis. Dividend revenue is accrued on the date the dividends are declared.
P. INVESTMENT IN JOINT VENTURES AND ASSOCIATESInvestment in joint arrangements and associates is initially recognised at cost (fair value of consideration provided plus directlyattributable costs) by the entity holding the ownership interest, including attributed goodwill, and is subsequently carried in the entity’sfinancial statements at the lower of cost and recoverable amount.
Q. CASH AND CASH EQUIVALENTSCash and cash equivalents comprise cash on hand available on demand and deposits held at call with financial institutions. Cash andcash equivalents are measured at fair value, being the principal amount. For the purpose of the cash flow statement, cash alsoincludes other highly liquid investments not subject to significant risk of change in value, with short periods to maturity, net of anybank overdraft.
R. DERIVATIVESThe Group uses a variety of derivatives to manage various risks. Derivatives are used solely to manage risk exposure and are not usedfor trading or speculation.
I. Derivatives without hedge accounting appliedDerivatives are initially recognised at trade date at fair value excluding transaction costs. The fair value is determined by reference tocurrent market quotes or generally accepted valuation principles.
Transaction costs for purchases of derivatives are expensed as incurred.
For derivatives that do not qualify for hedge accounting, the changes in fair value are immediately recognised in profit or loss. Thederivatives in relation to the investment operations are presented together with the underlying investments, or as payables when thefair value is negative. The derivatives in relation to corporate treasury transactions are presented as receivables when the fair value ispositive, or as payables when the fair value is negative.
Where derivatives qualify for hedge accounting, the treatment is set out in section II.
II. Hedge accountingHedge accounting may be applied to derivatives designated as hedging instruments provided certain criteria are met. Certaintransactions have been designated as the following: Fair value hedge: hedge of a change in fair value of an asset or liability or an unrecognised firm commitment; or
Cash flow hedge: hedge of the exposure to the variability of cash flow attributable to a particular risk associated with a recognisedasset or liability, or an unrecognised firm commitment; or
Net investment hedge: hedge of a net investment in a foreign operation.
To qualify for hedge accounting, at the inception of the hedge and throughout its life, each hedge must be expected to be highlyeffective. Actual effectiveness in the range of 80% to 125% must also be demonstrated on an ongoing basis. When it is determinedthat a derivative for which hedge accounting has been designated is not (or ceases to be) effective, hedge accounting is discontinuedprospectively from the date of ineffectiveness.
a. FAIR VALUE HEDGE Changes in the fair value of the hedging instrument are recognised in profit or loss, together with changes in the fair value of thehedged asset or liability that are attributable to the hedged risk.
b. CASH FLOW HEDGE The effective portion of changes in the fair value of derivatives that are designated and qualify as cash flow hedges is recognised inreserves as part of equity. Any gain or loss relating to an ineffective portion is immediately recognised in profit or loss.
47
When the forecast transaction that is hedged results in the recognition of a financial asset or a financial liability, the associated gainsand losses that had been deferred in equity are transferred into profit or loss in the same period or periods when the hedged itemaffects profit or loss. When the forecast transaction that is hedged results in the recognition of a non-financial asset or a non-financialliability, the associated gains and losses that had been deferred in equity are transferred from equity and included in the initialmeasurement of the cost of the asset or liability.
c. NET INVESTMENT HEDGEHedges of net investments in foreign operations are accounted for similarly to cash flow hedges. Any gain or loss on the hedginginstrument relating to the effective portion of the hedge is recognised in equity while the gain or loss relating to the ineffective portionis immediately recognised in profit or loss. Gains and losses accumulated in the equity reserve are recognised in profit or loss uponthe disposal of the foreign operation.
III. Embedded derivativesDerivatives embedded in other financial instruments or other non-financial host contracts are treated separately when their risks andcharacteristics are not closely related to those of the host contract. Where an embedded derivative is required to be separated, it ismeasured at fair value and change in the fair value is recognised in profit or loss.
S. TRADE AND OTHER RECEIVABLESTrade and other receivables are stated at the amounts to be received in the future, less any impairment losses. The amounts arediscounted where the effect of the time value of money is material. The recoverability of debts is assessed on an ongoing basis andprovision for impairment is made based on objective evidence and having regard to past default experience. The impairment charge isrecognised in profit or loss. Debts which are known to be uncollectible are written off.
T. PROPERTY AND EQUIPMENTProperty and equipment is initially recorded at cost which is the fair value of consideration provided plus incidental costs directlyattributable to the acquisition.
All items of property and equipment are carried at cost less accumulated depreciation and accumulated impairment charges.Depreciation is calculated using the straight line method to allocate the cost of assets less any residual value over the estimateduseful economic life.
The carrying amount of property and equipment is reviewed at each reporting date. If any impairment is indicated or exists, the item istested for impairment by comparing the recoverable amount of the asset or the cash generating unit (CGU) it is included within to thecarrying value. Where an existing carrying value exceeds the recoverable amount, the difference is recognised in profit or loss.
The net gain or loss on disposal of property and equipment is recognised in profit or loss and is calculated as the difference betweenthe carrying amount of the asset at the time of disposal and the net proceeds.
U. BUSINESS COMBINATIONSBusiness combinations are accounted for using the acquisition method. The consideration transferred for the acquisition is the fairvalue of the assets transferred, the equity instruments issued and the liabilities incurred or assumed at the date of exchange. Theconsideration includes the fair value of any asset or liability resulting from a contingent consideration arrangement.
Identifiable assets acquired and liabilities and contingent liabilities assumed in a business combination are measured at fair value onthe acquisition date. The Group measures any non-controlling interest, on a transaction-by-transaction basis, either at fair value or atthe non-controlling interest’s proportionate share of the fair value of the identifiable assets and liabilities.
Acquisition related costs are expensed as incurred.
If the business combination is achieved in stages, the acquisition fair value of the acquirer’s previously held equity interest in theacquiree is remeasured to fair value at the acquisition date through profit or loss.
Where settlement of any part of cash consideration is contingent upon some future event or circumstance, the estimated amountspayable in the future are discounted to their present value at the date of exchange. When the contingent consideration is classified asa liability, the impact on any subsequent changes in fair value is recognised as profit or loss in the statement of comprehensiveincome.
Where the initial accounting for a business combination is determined only provisionally by the first reporting date after acquisitiondate, the business combination is accounted for using those provisional values. Any subsequent adjustments to those provisionalvalues are recognised within 12 months of the acquisition date and are applied effective from the acquisition date.
V. INTANGIBLE ASSETSI. Acquired intangible assetsAcquired intangible assets are initially recorded at their cost at the date of acquisition being the fair value of the considerationprovided and, for assets acquired separately, incidental costs directly attributable to the acquisition. Intangible assets with finiteuseful lives are amortised on a straight line basis (unless the pattern of usage of the benefits is significantly different) over theestimated useful lives of the assets being the period in which the related benefits are expected to be realised (shorter of legal durationand expected economic life). Amortisation rates and residual values are reviewed annually and any changes are accounted forprospectively.
48 IAG ANNUAL REPORT 2015
The carrying amount of intangible assets with finite useful lives is reviewed at each reporting date by determining whether there is anindication that the carrying value may be impaired. If any such indication exists, the item is tested for impairment by comparing therecoverable amount of the asset or the CGU it is included within to the carrying value. Where the recoverable amount is determined bythe value in use, the projected net cash flows are discounted using a pre-tax discount rate. For assets with indefinite useful lives, therecoverability of the carrying value of the assets is reviewed for impairment at each reporting date, or more frequently if events orchanges in circumstances indicate that it might be impaired. An impairment charge is recognised when the carrying value exceeds thecalculated recoverable amount. Impairment charges are recognised in profit or loss and may be reversed where there has been achange in the estimates used to determine the recoverable amount.
II. Software development expenditureSoftware development expenditure that meets the criteria for recognition as an intangible asset is capitalised on the balance sheetand amortised over its expected useful life, subject to impairment testing. Costs incurred in researching and evaluating a project up tothe point of formal commitment to a project are treated as research costs and are expensed as incurred.
The capitalised costs are amortised on a straight line basis over the period following completion of a project or implementation of partof a project. The recoverability of the carrying amount of the asset is assessed in the same manner as for acquired intangible assetswith finite useful lives.
W. GOODWILLGoodwill is initially measured as the excess of the purchase consideration over the fair value of the net identifiable assets andliabilities acquired and subsequently presented net of any impairment charges. Goodwill arising on acquisitions prior to 1 July 2004has been carried forward on the basis of its deemed cost being the net carrying amount as at that date.
For the purpose of impairment testing, goodwill is allocated to CGUs. The carrying value of goodwill is tested for impairment at eachreporting date. Where the carrying value exceeds the recoverable amount, an impairment charge is recognised in profit or loss andcannot subsequently be reversed. The recoverable amount of goodwill is determined by the present value of the estimated future cashflows by using a pre-tax discount rate that reflects current market assessment of the risks specific to the CGUs.
At the date of disposal of a business, attributed goodwill is used to calculate the gain or loss on disposal.
X. TRADE AND OTHER PAYABLESTrade and other payables are carried at cost, which is the fair value of the consideration to be paid in the future for goods and servicesreceived. The amounts are discounted where the effect of the time value of money is material.
Y. RESTRUCTURING PROVISIONA restructuring provision is recognised for the expected costs associated with restructuring where there is a detailed formal plan forrestructure and a valid expectation has been raised in those persons expected to be affected. The provision is based on the directexpenditure to be incurred which is both directly and necessarily caused by the restructuring, including termination benefits,decommissioning of information technology systems and exiting surplus premises and does not include costs associated with ongoingactivities. The adequacy of the provision is reviewed regularly and adjusted if required. Revisions in the estimated amount of arestructuring provision are reported in the period in which the revision in the estimate occurs. The provision is discounted using a pre-tax discount rate where the effect of the time value of money is material. Where discounting is applied, the increase in the provisiondue to the passage of time is recognised as a finance cost.
Z. LEASE PROVISIONCertain operating leases for property require that the land and/or building be returned to the lessor in its original condition, however,the related operating lease payments do not include an element for the cost this will involve. The present value of the estimated futurecost for the plant and equipment to be removed and the premises to be returned to the lessor in its original condition are recognisedas a lease provision when the relevant alterations are made to the premises. The costs are capitalised as part of the cost of propertyand equipment and then depreciated over the useful lives of the assets (refer to section T of the summary of significant accountingpolicies note).
AA. EMPLOYEE BENEFITSI. Wages and salaries, annual leave and sick leaveLiabilities for wages and salaries (including bonuses), annual leave and sick leave are recognised at the nominal amounts unpaid atthe reporting date using remuneration rates that are expected to be paid when these liabilities are settled, including on-costs. Aliability for sick leave is considered to exist only when it is probable that sick leave taken in the future will be greater than entitlementsthat will accrue in the future.
II. Long service leaveA liability for long service leave is recognised as the present value of estimated future cash outflows to be made in respect of servicesprovided by employees up to the reporting date. The estimated future cash outflows are discounted using corporate bond yields(2014-risk free interest rates) which have terms to maturity that match, as closely as possible, the estimated future cash outflows.Factors which affect the estimated future cash outflows such as expected future salary increases, experience of employee departuresand period of service, are incorporated in the measurement.
III. Share based incentive arrangementsShare based remuneration is provided in different forms to eligible employees and IAG Directors. All of the arrangements are equitysettled share based payments.
49

The fair value at grant date (the date at which the employer and the employee have a shared understanding of the terms andconditions of the arrangement) is determined for each equity settled share based payment using a valuation model which excludes theimpact of any non-market vesting conditions. This fair value does not change over the life of the instrument. At each reporting dateduring the vesting period (the period during which related employment services are provided) and upon the final vesting or expiry of theequity instruments, the total accumulated expense is revised based on the fair value at grant date and the latest estimate of thenumber of equity instruments that are expected to vest based on non-market vesting conditions only and taking into account theexpired portion of the vesting period. Changes in the total accumulated expense from the previous reporting date are recognised inprofit or loss with a corresponding movement in an equity reserve. Upon exercise of the relevant instruments, the balance of the sharebased remuneration reserve relating to those instruments is transferred within equity.
The different treatment of market and non-market vesting conditions means that if an equity instrument does not vest because aparticipant ceases relevant employment then the accumulated expense charged in relation to that participant is reversed, but if anequity instrument does not vest only because a market condition is not met, the expense is not reversed.
To satisfy obligations under the various share based remuneration plans, shares are generally bought on-market at or near grant dateof the relevant arrangement and held in trust. Shares held in trust that are controlled for accounting purposes are treated as treasuryshares held in trust (refer to section AG of the summary of significant accounting policies note).
IV. SuperannuationFor defined contribution superannuation plans, obligations for contributions are recognised in profit or loss as they become payable.For defined benefit superannuation plans, the net financial position of the plans is recognised on the balance sheet and the movementin the net financial position is recognised in profit or loss, except for remeasurements of defined benefit plans (experience adjustmentsand changes in actuarial assumptions), which are recognised directly in retained earnings.
AB. INTEREST BEARING LIABILITIES AND FINANCE COSTSInterest bearing liabilities are initially recognised at fair value less transaction costs that are directly attributable to the transaction.After initial recognition the liabilities are carried at amortised cost using the effective interest method.
Finance costs include interest, which is accrued at the contracted rate and included in payables, amortisation of transaction costswhich are capitalised, presented together with the borrowings, and amortised over the life of the borrowings or a shorter period ifappropriate, and amortisation of discounts or premiums (the difference between the original proceeds, net of transaction costs, andthe settlement or redemption value of borrowings) over the term of the liabilities. Where interest payments are subject to hedgeaccounting, they are recognised as finance costs net of any effect of the hedge.
AC. FOREIGN CURRENCYI. Functional and presentation currencyItems included in the financial records are measured using the currency of the primary economic environment in which the entityoperates (functional currency). The financial statements are presented in Australian dollars, which is the presentation currency of theCompany.
II. Translation of foreign currency transactionsForeign currency transactions are translated into the functional currency using the exchange rates prevailing at the dates of thetransactions. Monetary assets and liabilities denominated in foreign currencies at reporting date are translated to the functionalcurrency using reporting date exchange rates. Resulting exchange differences are recognised in profit or loss.
III. Translation of the financial results of foreign operationsThe financial position and performance of foreign operations with a functional currency other than Australian dollars are translated intothe presentation currency for inclusion in the consolidated financial statements. The assets and liabilities are translated usingreporting date exchange rates while equity items are translated using historical rates. Items from the statement of comprehensiveincome are translated using weighted average rates for the reporting year. Exchange rate differences arising from the translations arerecorded directly in equity in the foreign currency translation reserve. Goodwill and fair value adjustments arising on the acquisition ofa foreign operation are treated as assets and liabilities of the foreign operation and translated using reporting date exchange rates.
On the disposal of a foreign operation, the cumulative amount of the exchange differences deferred in the foreign currency translationreserve relating to that foreign operation is recognised in profit or loss.
IV. Principal exchange rates usedThe reporting date exchange rates for balance sheet translation and the annual average daily exchange rates for statement ofcomprehensive income and cash flow statement translation to Australian dollars are provided here for selected currencies as anindication of the rates used for the current year.
BALANCE SHEET STATEMENT OF COMPREHENSIVEINCOME AND CASH FLOW STATEMENT
2015 2014 2015 2014
New Zealand dollar 0.87848 0.92866 0.93060 0.90485
British pound 2.03934 1.81505 1.88818 1.77299
Thai baht 0.03833 0.03270 0.03676 0.03398
United States dollar 1.29618 1.06078 1.20200 1.08950
Malaysian ringgit 0.34331 0.33036 0.34745 0.33574
50 IAG ANNUAL REPORT 2015

AD. PROVISION FOR DIVIDENDSProvision for dividends is made in respect of ordinary shares where the dividends are declared on or before the reporting date but havenot yet been distributed at that date.
AE. EARNINGS PER SHAREI. Basic earnings per shareBasic earnings per share is determined by dividing the profit or loss attributable to shareholders of the Parent by the weighted averagenumber of shares of the Parent on issue during the reporting year, net of treasury shares held in trust.
II. Diluted earnings per shareDiluted earnings per share is determined by dividing the profit or loss attributable to shareholders of the Parent used in the calculationof basic earnings per share, adjusted for relevant costs associated with dilutive potential ordinary shares, by the weighted averagenumber of ordinary shares and dilutive potential ordinary shares.
AF. SHARE CAPITALShares are classified as equity when there is no obligation to transfer cash or other assets to the holder. Transaction costs directlyattributable to the issue of equity instruments are shown in equity as a deduction from the proceeds, net of tax.
AG. TREASURY SHARES HELD IN TRUSTOrdinary shares of IAG that are controlled for accounting purposes by share based remuneration trusts that are subsidiaries of theConsolidated entity, are presented on the balance sheet as treasury shares held in trust. The shares are measured at cost (totalamount paid to acquire the shares including directly attributable costs) and are presented as a deduction from equity until they areotherwise dealt with. No gain or loss is recognised in profit or loss on the sale, cancellation or reissue of the shares. The shares arederecognised as treasury shares held in trust when the shares vest or are released to the participant.
NOTE 2. CRITICAL ACCOUNTING ESTIMATES AND JUDGEMENTSIn the process of applying the significant accounting policies, certain critical accounting estimates and assumptions are used, andcertain judgements are made.
The estimates and related assumptions are based on experience and other factors that are considered to be reasonable, the results ofwhich form the basis for judgements about the carrying values of assets and liabilities. Actual results may differ from these estimates.The estimates and underlying assumptions are reviewed on an ongoing basis. Revisions to accounting estimates are recognised in theperiod in which the estimates are revised and future periods if relevant.
The areas where the estimates and assumptions involve a high degree of judgement or complexity and are considered significant tothe financial statements, listed together with reference to the notes to the financial statements where more information is provided,are: insurance contracts related:
claims, refer to note 10;
reinsurance and other recoveries on outstanding claims, refer to note 11; and
liability adequacy test, refer to note 13.B.
The estimation process of the gross cash flows for the 2011 financial year natural catastrophe events in New Zealand is conductedin a manner consistent with the preparation of accounts as described in the summary of significant accounting policies note 1.This estimate is subject to a high degree of uncertainty owing to the unique nature of the events. The uncertainties includeallocation of costs between the various earthquake events (September 2010, February 2011 and June 2011) for policies affectedby multiple events, under the Earthquake Commission (EQC) cap (NZ$100,000) claims which may subsequently exceed the cap,potential latent claims, outcomes of court cases and litigation, the impact of demand surge inflation, the interaction with the EQCand uncertainty relating to IAG's share of claim costs.
There are other amounts relating to insurance contracts that are based on allocation methodologies supported by assumptions(e.g. deferred acquisition costs). The estimates relate to past events, do not incorporate forward looking considerations and themethodology supporting them generally does not change from year to year.
other: intangible assets and goodwill impairment testing, refer to notes 16 and 17;
acquired intangible assets' initial measurement and determination of useful life, refer to notes 16 and 23;
income tax and related assets and liabilities, refer to note 6;
provisional accounting of business combinations, refer note 23; and
share based remuneration, refer to note 28.
51
NOTE 3. RISK MANAGEMENTA. RISK MANAGEMENT FRAMEWORKThe Group Chief Risk Officer oversees risk management across the Group. IAG has a Group Risk and Governance function responsiblefor setting risk strategy, the development of IAG's risk management framework, policies and standards and providing advice to the IAGExecutives and Board. Divisional Risk & Compliance teams deploy the risk management framework within their division. Applicationof the risk management framework provides reasonable assurance the Group’s material risks are prudently and soundly managed.IAG acknowledges all business activity entails risk. The Group mitigates this by focusing on the management of risk, not the avoidanceof risk. The framework is outlined in IAG's written Risk Management Strategy (RMS), which is in accordance with the AustralianPrudential Regulation Authority (APRA) prudential standards.
The RMS: is a high level, strategic document that articulates the risk management framework;
references other key documents and elements of the risk management framework; and
may be a key input into how regulators understand and assess the approach to risk management.
Compliance with the RMS is incorporated into the twice yearly declarations provided by Executives and senior management to theBoard.
The RMS includes clearly defined roles and responsibilities, details of the Group level risk management-related policies and the keyprocesses to identify, assess, monitor, report on and mitigate material risk. Group policies for the management of risk are to beapplied by all controlled entities consistently across the Group and take into consideration local circumstances in non-Australianjurisdictions. These policies are supported by associated Group frameworks and processes and Divisional processes.
The risk management framework is regularly reviewed so it remains appropriate and effective. The Group has an internal auditfunction which reviews various aspects of the risk management framework application in the business divisions.
The RMS is updated annually, or as required, and is approved by the Board, and resubmitted to APRA subsequent to material change.A Corporate Plan is also submitted to APRA after each annual review or following material change.
In addition to the RMS, the Group's risk framework includes the following documents: Reinsurance Management Strategy (REMS) - comprises key elements of the reinsurance management framework, processes for
setting and monitoring the insurance concentration risk charge (ICRC), processes for selecting, implementing, monitoring andreviewing reinsurance arrangements and identification of roles and responsibilities of those charged with managerialresponsibility for the reinsurance management framework. The REMS is in accordance with the prudential standards issued byAPRA. The REMS is updated annually and approved by the Board.
Group Risk Appetite Statement (RAS) – the Group RAS, together with the associated metrics, articulates the levels, boundariesand nature of risk the Board is willing to accept in pursuit of IAG’s strategic objectives.
Internal Capital Adequacy Assessment Process (ICAAP) – the ICAAP Summary Statement is a component of IAG’s riskmanagement framework summarising the Group’s risk assessment and processes for capital management, describing thestrategy for maintaining adequate capital over time. The ICAAP Annual Report is an annual report to the Board on the operation ofthe ICAAP over the prior 12 months and a forward looking view. IAG’s risk management framework includes a range of capitalmanagement initiatives and documents. Refer to the capital management note for further details.
B. RISK MANAGEMENT OVERVIEWThe risk management arrangements outlined above apply to all controlled entities within the Group. An overview of IAG's riskmanagement arrangements is included in the Directors' Report, with the governance arrangements and forums used to manage riskdetailed further in the Corporate Governance section of the IAG website. Refer to www.iag.com.au/about-us/corporate-governance forfurther details.
IAG's risk model covers all three lines of defence: risk owners, risk advisers and Internal Audit. IAG adopts an enterprise approach torisk arrangements, with five risk categories identified as follows:
RISK CATEGORIES DEFINITION OF RISKStrategic risk Strategic risk may arise from the following sub-categories:
Strategic objectives: flawed strategy or the failure to meet strategic initiatives due to capitalconstraints, divisional strategic misalignment, technology and other resource inhibitors;
Poor business decisions: failure to complete an appropriately detailed due diligence of thereasonably available information before making business decisions, or failing to take thereasonably available information into account;
Business environment changes: a lack of responsiveness to changes in the businessenvironment; and
Group contagion risk: the potential impact of risk events, of any nature, arising in or frommembership of the Group.
52 IAG ANNUAL REPORT 2015
Insurance risk Insurance risk may arise from the following sub-categories:
Product pricing: inadequate or inappropriate product pricing;
Product design: product defects due to inadequate product design, variation, delivery ormaintenance;
Reserving: inadequate or inappropriate reserving including unforeseen, unknown orunintended liabilities that may eventuate;
Claims management: inadequate or inappropriate claims management including overpayment,failure to collect recoveries, fraudulent misrepresentation or staff operating outside of theirauthority;
Underwriting: inadequate or inappropriate underwriting. For example, failure to comply withthe underwriting process, including staff operating outside their authority; and
Insurance concentration risk: adverse concentration exposure. For example, locationcatastrophe exposure, underwriting segment factor, industry or distribution channel.
Reinsurance risk Reinsurance risk may arise from the following sub-categories:
Coverage: insufficient or inappropriate reinsurance coverage arising as a result of:
incorrect use of models used to calculate amount of cover required;
the cover provided by the reinsurance program(s) does not align with original underwriting exposures; and
latent/emerging exposures.
Underwriting/pricing: inadequate underwriting and/or pricing of reinsurance exposuresretained by IAG's reinsurance captives;
Claims management: inadequate or inappropriate reinsurance recovery management;
Contract terms: reinsurance arrangements not legally binding or poor management ofreinsurance recoveries; and
Reinsurance concentration risk: over-exposure to insurance risks based on factors such asgeographical location, types of cover, industry types or a high reliance on a number ofreinsurers.
The credit counterparty concentration risk to reinsurers is covered under the financial risk – creditrisk category.
Financial risk Financial risk may arise from the following sub-categories:
Liquidity management: insufficient cash resources to meet financial obligations as and whenthey fall due (without affecting either the daily operations or the financial condition of theGroup);
Market risk:
asset concentration: risk of over-exposure to a particular asset class outside the Strategic Asset Allocation or the limits in the individual Investment ManagementAgreements;
foreign exchange: adverse exchange rate movements in unhedged foreign exchangeexposures;
asset prices: the risk an asset’s value will negatively change due to a change in theabsolute level of its market price;
interest rates: the risk an investment's value will negatively change due to a change in theabsolute level of interest rates, in the spread between two rates, in the shape of the yieldcurve or in any other interest rate relationship;
derivative exposures: movements in underlying positions not being matched by (opposite)movements in the value of the derivative positions;
Credit risk: the risk arising from a counterparty’s failure to meet its obligations in accordancewith the agreed terms. These counterparties include reinsurers, premium debtors and thoserelated to investments; and
Capital management risk: failure to maintain adequate regulatory capital to meet APRA'scapital requirements or the Group's internal capital target.
53
Operational risk Operational risk may arise from the following sub-categories:
Business continuity: unavailability of premises, systems and/or critical processes;
Internal fraud: any act or omission, by an internal staff member with or without collusion withan external party, made with dishonest or potentially illegal intent, to obtain a benefit oradvantage, for one’s self or any other person;
External fraud: any act or omission, by a third party, made with dishonest or potentially illegalintent, to obtain a benefit or advantage, for one’s self or any other person;
Cyber security: risk of loss or detriment to IAG and its customers as a result of actionscommitted or facilitated through the use of networked information systems;
Technology: failure to develop, deploy, maintain and operate, and recover stable and reliabletechnology services;
Compliance: failure or inability to comply with the applicable laws, regulations or codesexcluding failure of staff to adhere to internal policies/procedures;
People and safety: inadequate capabilities and/or capacity, retention, inappropriatebehaviours, and/or workplace safety;
Information management: inadequate protection of IAG's information in accordance with itsvalue and sensitivity;
Execution and delivery: inadequate processes and/or failure of staff to adhere topolicies/procedures; failures relating to project management and change programs; and
Supply and distribution chain: delivery failure of service provider/third party; disputes withservice provider/third party.
C. RISK MANAGEMENT CATEGORIES AND RISK MITIGATIONI. Strategic riskStrategic risk is managed by the IAG Executive team with Board oversight. Key elements in management of strategy and strategic riskinclude the strategic planning program and associated oversight arrangements. Progress against strategic priorities is regularlyconsidered. Strategic risks are included in IAG’s enterprise risk profile as appropriate.
II. Insurance riskA key risk from operating in the general insurance industry is the exposure to insurance risk arising from underwriting generalinsurance contracts. The insurance contracts transfer risk to the insurer by indemnifying the policyholders against adverse effectsarising from the occurrence of specified uncertain future events. There is a risk that the actual amount of claims to be paid in relationto contracts will be different to the amount estimated at the time a product was designed and priced. The Consolidated entity isexposed to this risk as the price for a contract must be set before the losses relating to the product are known. As such, the insurancebusiness involves inherent uncertainty. The Consolidated entity also faces other risks relating to the conduct of the general insurancebusiness including financial risks and capital risks (refer to the capital management note).
A fundamental part of the Group's overall risk management approach is the effective governance and management of the risks thatimpact the amount, timing and certainty of cash flows arising from insurance contracts. IAG has an appointed Chief UnderwritingOfficer to assist it to provide further oversight and management of insurance risk.
Insurance activities primarily involve the underwriting of risks and the management of claims as well as the product design, productpricing, reserving and concentration risk (refer below). A disciplined approach to risk management is adopted rather than a premiumvolume or market share orientated approach. IAG believes this approach provides the greatest long term likelihood of being able tomeet the objectives of all stakeholders, including policyholders, lenders, regulators and shareholders.
The level of risk accepted by IAG is formally documented in its Insurance Business Licences. Each operating division has an insurancelicence, or licences. The licences are reviewed annually or more frequently if required.
a. INSURANCE PROCESSESThe key processes to mitigate insurance risk include the following:
i. Acceptance and pricing of riskThe underwriting of large numbers of less than fully correlated individual risks, across a range of classes of insurance businesses indifferent regions, reduces the variability in overall claims experience over time. Business divisions are set underwriting criteriacovering the types of risks they are licensed to underwrite. Maximum limits are set for the acceptance of risk both on an individualcontract basis and for classes of business and specific risk groupings. Management information systems are to be maintained thatprovide up to date, reliable data on the risks to which the business is exposed at any point in time. Efforts are made, including plainlanguage policy terms, to ensure there is no misalignment between policyholders' perceived payment when a policy is initially sold andactual payment when a claim is made.
Statistical models that combine historical and projected data are used to calculate premiums and monitor claims patterns for eachclass of business. The data used includes historical pricing and claims analysis for each class of business as well as currentdevelopments in the respective markets and classes of business. All data used is subject to rigorous verification and reconciliationprocesses. The models incorporate consideration of prevailing market conditions.
54 IAG ANNUAL REPORT 2015
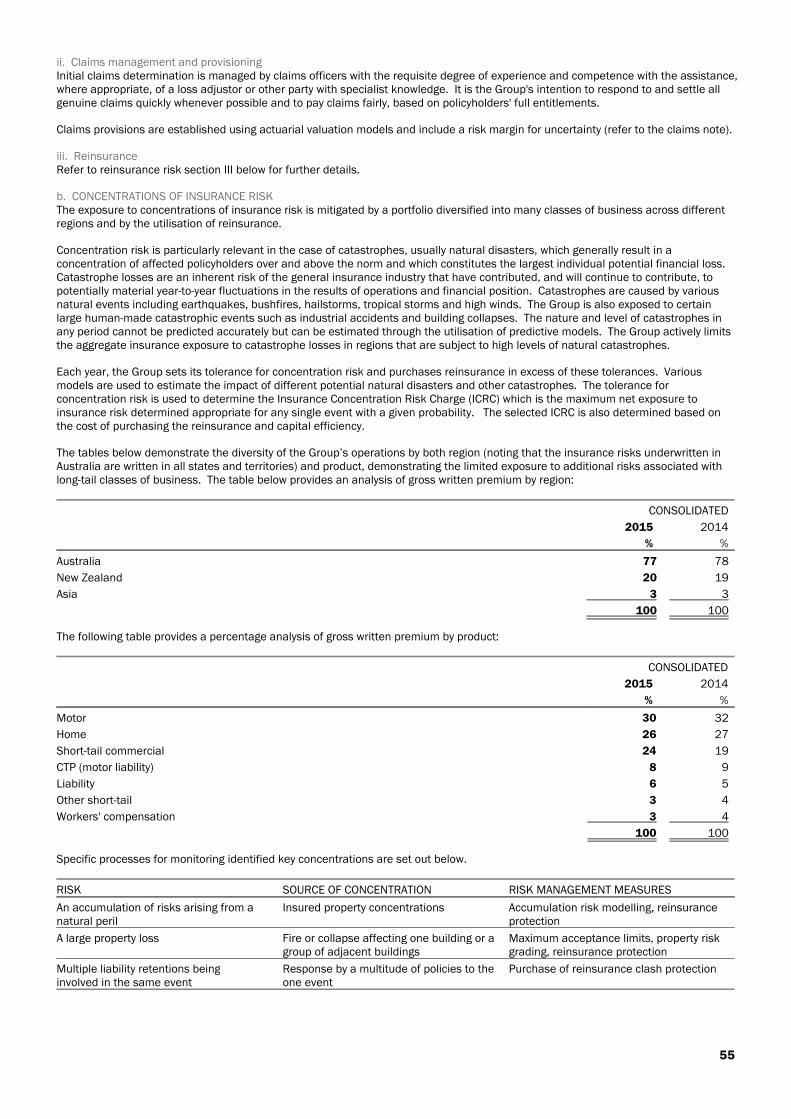
ii. Claims management and provisioningInitial claims determination is managed by claims officers with the requisite degree of experience and competence with the assistance,where appropriate, of a loss adjustor or other party with specialist knowledge. It is the Group's intention to respond to and settle allgenuine claims quickly whenever possible and to pay claims fairly, based on policyholders' full entitlements.
Claims provisions are established using actuarial valuation models and include a risk margin for uncertainty (refer to the claims note).
iii. ReinsuranceRefer to reinsurance risk section III below for further details.
b. CONCENTRATIONS OF INSURANCE RISKThe exposure to concentrations of insurance risk is mitigated by a portfolio diversified into many classes of business across differentregions and by the utilisation of reinsurance.
Concentration risk is particularly relevant in the case of catastrophes, usually natural disasters, which generally result in aconcentration of affected policyholders over and above the norm and which constitutes the largest individual potential financial loss.Catastrophe losses are an inherent risk of the general insurance industry that have contributed, and will continue to contribute, topotentially material year-to-year fluctuations in the results of operations and financial position. Catastrophes are caused by variousnatural events including earthquakes, bushfires, hailstorms, tropical storms and high winds. The Group is also exposed to certainlarge human-made catastrophic events such as industrial accidents and building collapses. The nature and level of catastrophes inany period cannot be predicted accurately but can be estimated through the utilisation of predictive models. The Group actively limitsthe aggregate insurance exposure to catastrophe losses in regions that are subject to high levels of natural catastrophes.
Each year, the Group sets its tolerance for concentration risk and purchases reinsurance in excess of these tolerances. Variousmodels are used to estimate the impact of different potential natural disasters and other catastrophes. The tolerance forconcentration risk is used to determine the Insurance Concentration Risk Charge (ICRC) which is the maximum net exposure toinsurance risk determined appropriate for any single event with a given probability. The selected ICRC is also determined based onthe cost of purchasing the reinsurance and capital efficiency.
The tables below demonstrate the diversity of the Group’s operations by both region (noting that the insurance risks underwritten inAustralia are written in all states and territories) and product, demonstrating the limited exposure to additional risks associated withlong-tail classes of business. The table below provides an analysis of gross written premium by region:
CONSOLIDATED
2015 2014
% %
Australia 77 78
New Zealand 20 19
Asia 3 3
100 100
The following table provides a percentage analysis of gross written premium by product:
CONSOLIDATED
2015 2014
% %
Motor 30 32
Home 26 27
Short-tail commercial 24 19
CTP (motor liability) 8 9
Liability 6 5
Other short-tail 3 4
Workers' compensation 3 4
100 100
Specific processes for monitoring identified key concentrations are set out below.
RISK SOURCE OF CONCENTRATION RISK MANAGEMENT MEASURES
An accumulation of risks arising from anatural peril
Insured property concentrations Accumulation risk modelling, reinsuranceprotection
A large property loss Fire or collapse affecting one building or agroup of adjacent buildings
Maximum acceptance limits, property riskgrading, reinsurance protection
Multiple liability retentions beinginvolved in the same event
Response by a multitude of policies to theone event
Purchase of reinsurance clash protection
55
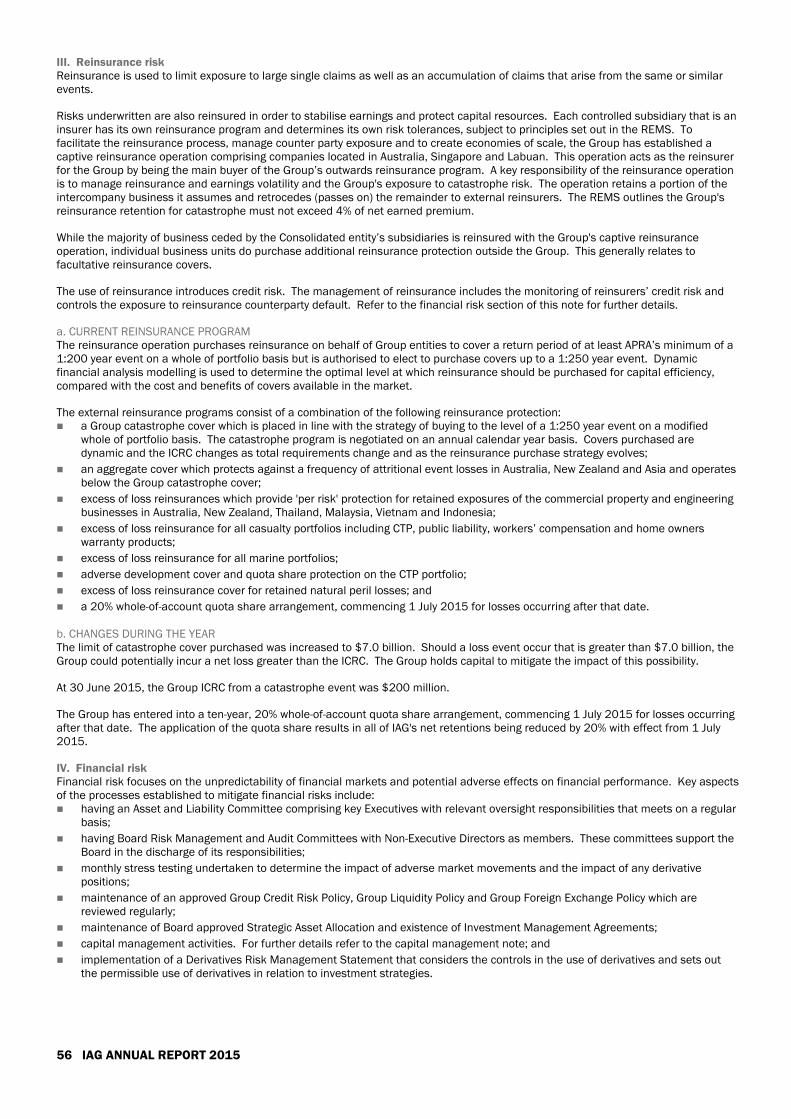
III. Reinsurance riskReinsurance is used to limit exposure to large single claims as well as an accumulation of claims that arise from the same or similarevents.
Risks underwritten are also reinsured in order to stabilise earnings and protect capital resources. Each controlled subsidiary that is aninsurer has its own reinsurance program and determines its own risk tolerances, subject to principles set out in the REMS. Tofacilitate the reinsurance process, manage counter party exposure and to create economies of scale, the Group has established acaptive reinsurance operation comprising companies located in Australia, Singapore and Labuan. This operation acts as the reinsurerfor the Group by being the main buyer of the Group’s outwards reinsurance program. A key responsibility of the reinsurance operationis to manage reinsurance and earnings volatility and the Group's exposure to catastrophe risk. The operation retains a portion of theintercompany business it assumes and retrocedes (passes on) the remainder to external reinsurers. The REMS outlines the Group'sreinsurance retention for catastrophe must not exceed 4% of net earned premium.
While the majority of business ceded by the Consolidated entity’s subsidiaries is reinsured with the Group's captive reinsuranceoperation, individual business units do purchase additional reinsurance protection outside the Group. This generally relates tofacultative reinsurance covers.
The use of reinsurance introduces credit risk. The management of reinsurance includes the monitoring of reinsurers’ credit risk andcontrols the exposure to reinsurance counterparty default. Refer to the financial risk section of this note for further details.
a. CURRENT REINSURANCE PROGRAMThe reinsurance operation purchases reinsurance on behalf of Group entities to cover a return period of at least APRA’s minimum of a1:200 year event on a whole of portfolio basis but is authorised to elect to purchase covers up to a 1:250 year event. Dynamicfinancial analysis modelling is used to determine the optimal level at which reinsurance should be purchased for capital efficiency,compared with the cost and benefits of covers available in the market.
The external reinsurance programs consist of a combination of the following reinsurance protection: a Group catastrophe cover which is placed in line with the strategy of buying to the level of a 1:250 year event on a modified
whole of portfolio basis. The catastrophe program is negotiated on an annual calendar year basis. Covers purchased aredynamic and the ICRC changes as total requirements change and as the reinsurance purchase strategy evolves;
an aggregate cover which protects against a frequency of attritional event losses in Australia, New Zealand and Asia and operatesbelow the Group catastrophe cover;
excess of loss reinsurances which provide 'per risk' protection for retained exposures of the commercial property and engineeringbusinesses in Australia, New Zealand, Thailand, Malaysia, Vietnam and Indonesia;
excess of loss reinsurance for all casualty portfolios including CTP, public liability, workers’ compensation and home ownerswarranty products;
excess of loss reinsurance for all marine portfolios;
adverse development cover and quota share protection on the CTP portfolio;
excess of loss reinsurance cover for retained natural peril losses; and
a 20% whole-of-account quota share arrangement, commencing 1 July 2015 for losses occurring after that date.
b. CHANGES DURING THE YEARThe limit of catastrophe cover purchased was increased to $7.0 billion. Should a loss event occur that is greater than $7.0 billion, theGroup could potentially incur a net loss greater than the ICRC. The Group holds capital to mitigate the impact of this possibility.
At 30 June 2015, the Group ICRC from a catastrophe event was $200 million.
The Group has entered into a ten-year, 20% whole-of-account quota share arrangement, commencing 1 July 2015 for losses occurringafter that date. The application of the quota share results in all of IAG's net retentions being reduced by 20% with effect from 1 July2015.
IV. Financial riskFinancial risk focuses on the unpredictability of financial markets and potential adverse effects on financial performance. Key aspectsof the processes established to mitigate financial risks include: having an Asset and Liability Committee comprising key Executives with relevant oversight responsibilities that meets on a regular
basis;
having Board Risk Management and Audit Committees with Non-Executive Directors as members. These committees support theBoard in the discharge of its responsibilities;
monthly stress testing undertaken to determine the impact of adverse market movements and the impact of any derivativepositions;
maintenance of an approved Group Credit Risk Policy, Group Liquidity Policy and Group Foreign Exchange Policy which arereviewed regularly;
maintenance of Board approved Strategic Asset Allocation and existence of Investment Management Agreements;
capital management activities. For further details refer to the capital management note; and
implementation of a Derivatives Risk Management Statement that considers the controls in the use of derivatives and sets outthe permissible use of derivatives in relation to investment strategies.
56 IAG ANNUAL REPORT 2015

MARKET RISKMarket risk is the risk of adverse financial impact due to changes in the value or future cash flows of financial instruments fromfluctuations in foreign currency exchange rates, interest rates and equity prices. Refer to the Risk Management Overview sectionabove.
a. FOREIGN EXCHANGE RISKi. Nature of the risk and how managedForeign exchange risk is the risk of loss arising from adverse exchange rate movements in unhedged foreign exchange exposures. TheConsolidated entity operates internationally and so is exposed to foreign exchange risk from various activities conducted in the normalcourse of business. Foreign exchange exposure is a centrally managed risk, with hedging coordinated by the Group's Corporate Office.Refer to the derivatives note for further details on the hedging arrangements used to manage foreign exchange risk.
The key foreign exchange risk exposures relate to the following: investment of shareholders' funds - the investment of shareholders’ funds in assets denominated in currencies different to the
functional currency. Assets held to back insurance liabilities are held in the same currency as the related insurance liabilities,mitigating any net foreign exchange exposure;
interest bearing liabilities - foreign currency denominated interest bearing liabilities are generally of a capital nature. Some aredesignated as hedging instruments to manage the foreign exchange risk associated with investments in foreign operations; and
investment in foreign operations - net investment in foreign operations through the translation of the financial position andperformance of foreign operations that have a functional currency other than the Australian dollar with the key currencies beingNew Zealand dollars, Indian rupees, Malaysian ringgit, Chinese renminbi, Vietnamese dong, Thai baht and Indonesian rupiah.
ii. Foreign exchange risk exposureThe financial impact from exposure to foreign exchange risk to the Group is primarily driven by: translation of foreign currency transactions - relating mainly to investments, directly recognised in profit or loss;
translation of the financial performance of foreign operations - recognised directly in profit or loss; and
translation of the financial position of foreign operations - recognised directly in equity in the foreign currency translation reserve.
iii. SensitivityThe following tables provide information regarding the exposure of the Consolidated entity to foreign exchange risk. The sensitivityanalysis provided in the following tables demonstrates the effect of a change in one key assumption while other assumptions remainunchanged. In reality, there is a correlation between the assumptions and other factors. The sensitivities do not includeinterdependencies among the currencies, but rather show isolated exchange rate movements. The sensitivity analysis does not takeinto consideration that the assets and liabilities are actively managed and assumes no action by management in response tomovements in the factor. Additionally, the financial position may vary at the time that any actual market movement occurs.
The impact on the measurement of various financial instruments held at reporting date of an instantaneous 10% depreciation of theAustralian dollar at reporting date compared with selected currencies, on profit after tax and equity, net of related derivatives, isprovided in the table below. An appreciation of the Australian dollar would predominantly have the opposite impact.
CONSOLIDATED
2015 2014
$m $m
Impact toprofit
Impact toprofit
Shareholders' funds including related derivatives
United States dollar 1 2
1 2
CONSOLIDATED
2015 2014
$m $m
Impactdirectly to
equity
Impactdirectly to
equityNet investments in foreign operations and related hedge arrangements
New Zealand dollar 87 74
Malaysian ringgit 15 16
Other currencies where considered significant 15 15
117 105
57
b. INTEREST RATE RISKi. Nature of the risks and how managedInterest rate risk is the risk of loss arising from an unfavourable movement in market interest rates. Fixed interest rate assets andliabilities are exposed to changes in market value derived from mark-to-market revaluations. Financial assets and liabilities withfloating interest rates create exposure to cash flow volatility.
Interest rate risk arises primarily from investments in interest bearing securities. Interest bearing liabilities are exposed to interest raterisk but as they are measured at amortised cost and are not traded they therefore do not expose the Group to fair value interest raterisk. In addition, interest bearing liabilities bearing fixed interest rates (subject to some reset conditions) reduce the Group's exposureto cash flow interest rate risk. Movements in market interest rates therefore impact the price of the securities (and hence their fairvalue measurement), however have a limited effect on the contractual cash flows of the securities.
Exposure to interest rate risk is monitored through several measures that include value-at-risk analysis, position limits, scenario testingand stress testing, and managed by asset and liability matching using measures such as duration. Derivatives are used to manageinterest rate risk. The interest rate risk arising from money market securities is managed using interest rate swaps and futures. Forinformation regarding the notional contract amounts associated with these derivative financial instruments together with a maturityprofile and reporting date fair values, refer to the derivatives note.
The underwriting of general insurance contracts creates exposure to the risk that interest rate movements may materially impact thevalue of the insurance liabilities. Movements in interest rates should have minimal impact on the insurance profit or loss due to theGroup’s policy of investing in assets backing insurance liabilities principally in fixed interest securities broadly matched to the expectedpayment pattern of the insurance liabilities. Movements in investment income on assets backing insurance liabilities broadly offsetthe impact of movements in discount rates on the insurance liabilities.
ii. SensitivityThe sensitivity analysis provided in the following table demonstrates the effect of a change in a key assumption while otherassumptions remain unchanged. In reality, there is a correlation between the assumptions and other factors. The sensitivities do notinclude interdependencies among variables, but rather show isolated interest rate movements.
The investments in interest bearing securities are recognised on the balance sheet at fair value. Movements in market interest ratesimpact the price of the securities (and hence their fair value measurement) and so would impact profit or loss. The impact on themeasurement of the interest bearing securities held at reporting date of a change in interest rates by +1% or -1% on profit before tax,net of related derivatives, is shown in the following table:
CONSOLIDATED
2015 2014
$m $m
Impact toprofit
Impact toprofit
Investments - interest bearing securities and related interest rate derivatives +1% (366) (328)
-1% 389 351
The majority of the interest bearing securities are expected to be held to maturity and so movements in the fair value are expected toreverse upon maturity of the instruments.
c. PRICE RISKi. Nature of the risk and how managedPrice risk is the risk that the fair value of future cash flows of a financial instrument will fluctuate due to changes in market prices(other than those arising from interest rate or foreign exchange risk), whether those changes are caused by factors specific to theindividual financial instrument or its issuer, or factors affecting all similar financial instruments traded on the market. The Group hasexposure to equity price risk through its investment in equities (both directly and through certain trusts) and the use of equity relatedderivative contracts.
Exposure to equity price risk is monitored through several measures that include value-at-risk analysis, position limits, scenario testingand stress testing.
For information regarding the notional amounts associated with equity related derivative contracts together with the associatedmaturity profiles and reporting date fair values, refer to the derivatives note.
ii. SensitivityThe impact on the measurement of the investments held at reporting date of a change in equity values by +10% or -10% on profitbefore tax, net of related derivatives, is shown in the table below:
CONSOLIDATED
2015 2014
$m $m
Investments – equity and trust securities and related equity derivatives +10%
-10%
115
(115)
138
(138)
58 IAG ANNUAL REPORT 2015

CREDIT RISKa. NATURE OF THE RISK AND HOW MANAGEDCredit risk is the risk of loss from a counterparty failing to meet their financial obligations. The Group's credit risk arises predominantlyfrom investment activities, reinsurance activities and dealings with intermediaries. The Group’s credit risk appetite is approved by theBoard and the Group has a Credit Risk Policy which is consistent with the Board's risk appetite and also approved by the Board. Thepolicy outlines the framework and procedures in place to ensure an adequate and appropriate level of monitoring and management ofcredit quality throughout the Group.
IAG Group Treasury is responsible for ensuring that the policies governing the management of credit quality risk are properlyimplemented. Any new or amended credit risk exposures must be approved in accordance with the Group’s approval authorityframework.
Concentrations of credit risk exist where a number of counterparties have similar economic characteristics. At reporting date, thereare material concentrations of credit risk to the banking sector, in particular the four major Australian banks, also to securitised assetsin Australia and to reinsurers in relation to the reinsurance recoverables. Credit exposures are, however, sufficiently diversified so asto avoid a concentration charge in the regulatory capital calculation (refer to the capital management note).
b. CREDIT RISK EXPOSUREi. Premium and reinsurance recoveries on paid claims receivableThe maximum exposure to credit risk as at reporting date is the carrying amount of the receivables on the balance sheet.
An ageing analysis for certain receivables balances is provided below. The other receivables balances have either no overdueamounts or an insignificant portion of overdue amounts. The amounts are aged according to their original due date. Receivables forwhich repayment terms have been renegotiated represent an insignificant portion of the balances.
CONSOLIDATED
NOT OVERDUE OVERDUE TOTAL
<30 days 30-120 days >120 days
$m $m $m $m $m
2015
Premium receivable 2,773 233 244 40 3,290
Provision for impairment - specific - (2) (5) (21) (28)
Provision for impairment - collective (5) (1) (1) (4) (11)
Net balance 2,768 230 238 15 3,251
Reinsurance recoveries on paid claims 176 87 10 27 300
Net balance 176 87 10 27 300
2014
Premium receivable 2,837 247 236 37 3,357
Provision for impairment - specific - (3) (5) (20) (28)
Provision for impairment - collective (7) (1) (1) (4) (13)
Net balance 2,830 243 230 13 3,316
Reinsurance recoveries on paid claims 153 29 14 34 230
Net balance 153 29 14 34 230
The majority of the premium receivable balance relates to policies which are paid on a monthly instalment basis. It is important tonote that the late payment of amounts due under such arrangements allows for the cancellation of the related insurance contracteliminating both the credit risk and insurance risk for the unpaid amounts. Upon cancellation of a policy the outstanding premiumreceivable and revenue is reversed.
ii. Reinsurance recoveries receivable on outstanding claimsReinsurance arrangements mitigate insurance risk but expose the Group to credit risk. Reinsurance is placed with companies basedon an evaluation of the financial strength of the reinsurers, terms of coverage and price. The Group has clearly defined credit policiesfor the approval and management of credit risk in relation to reinsurers. The Consolidated entity monitors the financial condition of itsreinsurers on an ongoing basis and periodically reviews the reinsurers’ ability to fulfil their obligations to the Consolidated entity underrespective existing and future reinsurance contracts. Some of the reinsurers are domiciled outside of the jurisdictions in which theGroup operates and so there is the potential for additional risk such as country risk and transfer risk.
The level and quality of reinsurance protection is an important element in understanding the financial strength of an insurer. Thefinancial condition of a reinsurer is a critical deciding factor when entering into a reinsurance agreement. The longer the tail of thedirect insurance, the more important is the credit rating of the reinsurer.
59
It is Group policy to only deal with reinsurers with credit ratings of at least Standard & Poor’s BBB+ (or other rating agency equivalent)without collateralisation other than a mandatory placement to meet local regulatory requirements. Where the credit rating of areinsurer falls below the required quality during the period of risk, a contractual right to replace the counterparty exists. Some of thereinsurance protection is purchased on a ‘collateralised’ basis, where reinsurers have deposited funds equivalent to their participationin a trust fund. The counterparty credit profile of the catastrophe reinsurance program currently has more than 89% of the limit for the2015 program (2014-89%) with parties rated by Standard & Poor’s as A+ or better. For long-tail reinsurance arrangements 98%(2014-100%) of the program is placed with parties rated by Standard & Poor's as A+ or better.
Having reinsurance protection with strong reinsurers also benefits the Consolidated entity in its regulatory capital calculations. Therisk charges vary with the grade of the reinsurers such that higher credit quality reinsurance counterparties incur lower APRAregulatory capital charges.
The following table provides information regarding the credit risk relating to the reinsurance recoveries receivable on the outstandingclaims balance, excluding other recoveries, based on Standard & Poor’s counterparty credit ratings. These rating allocations relate tobalances accumulated from reinsurance programs in place over a number of years and so will not necessarily align with the ratingallocations noted above for the current program.
CREDIT RATING CONSOLIDATED
2015 2014
$m $m
AAA 1 1
AA 1,501 1,159
A 905 901
BBB and below 19 12
Total 2,426 2,073
Of these, approximately $720 million (2014-$862 million) is secured directly as follows, which reduces the credit risk: deposits held in trust: $321 million (2014-$354 million);
letters of credit: $388 million (2014-$460 million); and
loss deposits: $11 million (2014-$48 million).
iii. InvestmentsThe Group is exposed to credit risk from investments in third parties where the Group holds debt and similar securities issued by thosecompanies.
The credit risk relating to investments is monitored and assessed and maximum exposures are limited. The maximum exposure tocredit risk loss as at reporting date is the carrying amount of the investments on the balance sheet as they are measured at fair value.The investments comprising assets backing insurance liabilities are restricted to investment grade securities.
The following table provides information regarding the credit risk relating to the interest bearing investments based on Standard &Poor’s counterparty credit ratings.
CREDIT RATING CONSOLIDATED
2015 2014
$m $m
AAA 5,821 5,153
AA 5,602 6,727
A 1,274 1,001
BBB and below 1,428 903
Total 14,125 13,784
LIQUIDITY RISKa. NATURE OF THE RISK AND HOW MANAGEDLiquidity risk is concerned with the risk that sufficient cash resources will not be available to meet payment obligations as they becomedue (without incurring significant additional costs). The liquidity position is derived from operating cash flows and access to liquiditythrough related bodies corporate. The Group complies with its liquidity risk management practices, which include a Group policy, andhas the framework and procedures in place to ensure an adequate and appropriate level of monitoring and management of liquidity.IAG also has an option to raise further share capital as part of the strategic relationship with Berkshire Hathaway Specialty InsuranceCompany, which provides IAG access to additional liquidity. See the notes to the statement of changes in equity for further details.
Underwriting insurance contracts exposes the Group to liquidity risk through the obligation to make payments of unknown amounts onunknown dates. The assets backing insurance liabilities consist of government securities and other quality securities which cangenerally be readily sold or exchanged for cash. The assets are managed so as to broadly match the interest rate sensitivity created bythe maturity profile of the expected pattern of the claims payments. The debt securities are restricted to investment grade securitieswith concentrations of investments managed by various criteria including: issuer, industry, geography and credit rating.
An additional source of liquidity risk for the Group relates to interest bearing liabilities. The management of this risk includes theissuance of a range of interest bearing liabilities denominated in different currencies with different maturities.
60 IAG ANNUAL REPORT 2015
b. LIQUIDITY RISK EXPOSUREi. Outstanding claims liability and investmentsThe breakdown of the fixed term investments are provided by expected maturity. Actual maturities may differ from expected maturitiesbecause certain counterparties have the right to call or prepay certain obligations with or without call or prepayment penalties.
A maturity analysis of the estimated net discounted outstanding claims liability based on the remaining term to payment at thereporting date and the investments that have a fixed term is provided in the table below.
This maturity profile is a tool used in the investment of assets backing insurance liabilities in accordance with the policy of broadlymatching the overall interest rate sensitivity of the assets with the overall interest rate sensitivity created by the maturity profile of theestimated pattern of claims payments.
CONSOLIDATED
MATURITY ANALYSIS
NET DISCOUNTEDOUTSTANDING CLAIMS
LIABILITY INVESTMENTS
2015 2014 2015 2014
$m $m $m $m
Floating interest rate (at call) - - 1,002 948
Within 1 year or less 3,836 3,400 3,058 4,042
Within 1 to 2 years 1,549 1,611 1,192 581
Within 2 to 3 years 946 1,039 2,804 1,340
Within 3 to 4 years 641 678 1,542 3,509
Within 4 to 5 years 433 441 1,674 1,424
Over 5 years 1,569 1,589 2,853 1,940
Total 8,974 8,758 14,125 13,784
Timing of future claim payments is inherently uncertain. The table above presents estimated timing.
ii. Interest bearing liabilitiesThe following table provides information about the residual maturity periods of the interest bearing liabilities of a capital nature basedon the contractual maturity dates of undiscounted cash flows. All of the liabilities have call, reset or conversion dates which occur priorto any contractual maturity.
CONSOLIDATED
CARRYINGVALUE
MATURITY DATES OF CONTRACTUAL UNDISCOUNTED CASHFLOWS
Within 1year 1 - 2 years 2 - 5 years
Over 5years Perpetual Total
$m $m $m $m $m $m $m
2015
Tier 1 regulatory capital(a) 927 - - - - 927 927
Tier 2 regulatory capital(a) 841 - - - 841 - 841
Contractual undiscounted interestpayments(b) 90 86 227 - - 403
Total contractual undiscounted payments 90 86 227 841 927 2,171
2014
Tier 1 regulatory capital(a) 927 - - - - 927 927
Tier 2 regulatory capital(a) 834 - - - 834 - 834
Contractual undiscounted interestpayments(b) 96 96 287 - - 479
Total contractual undiscounted payments 96 96 287 834 927 2,240
(a) These liabilities have call, reset or conversion dates upon which certain terms, including the interest or distribution rate, can be changed or the security may beredeemed or converted. The detailed descriptions of the instruments are provided in the interest bearing liabilities note. The classification of Tier 1 and Tier 2 is subjectto Life and General Insurance Capital transitional arrangements.
(b) Contractual undiscounted interest payments are calculated based on underlying fixed interest rates or prevailing market floating rates as applicable at the reportingdate. Interest payments have not been included beyond five years. Reporting date exchange rates have been used for interest projections for liabilities in foreigncurrencies.
61

CAPITAL MANAGEMENT RISKRefer to the capital management note for further details.
V. Operational riskOperational risk is the risk of loss resulting from inadequate or failed internal processes, people and systems or from external events.Operational risk can impact other risk categories. When controls fail, an operational risk incident can cause injury, damage toreputation, have legal or regulatory implications or can lead to financial loss. The Group does not aim to eliminate all operational risks,but manages these by initiating an appropriate control framework and by monitoring and managing potential risks.
IAG's Operational Risk Management Framework, inclusive of the Group Operational Risk Policy, operates within IAG’s Enterprise RiskFramework. IAG’s Operational Risk Management Framework articulates IAG’s key Operational Risk Management elements under itsRisk Framework and the operational risk management requirements of the Group. It aims to ensure that consistent governancemechanisms are in-place and that activities undertaken which involve Operational Risk are assessed and managed with appropriateregard to the Group’s Risk Appetite Statement and the achievement of IAG’s objectives. The Board and Executive team believe aneffective, documented and structured approach to operational risk is a key part of the broader risk management framework.
The Board has ultimate responsibility for risk management, including operational risk. The Board is responsible for oversight of theOperational Risk Framework and approval of the Operational Risk Management Policy, and any changes to it.
As outlined in IAG's RMS and in the Group Operational Risk Framework, Group Policy and the supporting Operational Risk Procedures,operational risk is to be identified and assessed on an ongoing basis. The Internal Capital Adequacy Assessment Process (ICAAP)includes consideration of operational risk. Management and staff are responsible for identifying, assessing and managing operationalrisks in accordance with their roles and responsibilities. The Group's Internal Audit function reviews the effectiveness of processes andprocedures surrounding operational risk.
The general insurance operations of the Group are subject to regulatory supervision in the jurisdictions in which they operate.Regulatory frameworks continue to evolve in a number of jurisdictions. The Group works closely with regulators and monitorsregulatory developments across its international operations to assess potential impacts on its ongoing ability to meet the variousregulatory requirements.
Throughout the current reporting year the Group has conformed with the requirements of its debt agreements, including all financialand non-financial covenants (2014-full conformance).
NOTE 4. ANALYSIS OF INCOMECONSOLIDATED
2015 2014
$m $m
A. GENERAL INSURANCE REVENUE
Gross written premium 11,440 9,779
Movement in unearned premium liability 85 (58)
Premium revenue 11,525 9,721
Reinsurance and other recoveries revenue 2,422 1,857
Reinsurance commission revenue 52 51
Total general insurance revenue 13,999 11,629
B. INVESTMENT INCOME
Dividend revenue 39 38
Interest revenue 517 511
Trust revenue 19 16
Total investment revenue 575 565
Net change in fair value of investments
Realised net gains and (losses) 227 (2)
Unrealised net gains and (losses) 14 296
Total investment income 816 859
Represented by
Investment income on assets backing insurance liabilities 585 459
Investment income on shareholders’ funds 231 400
816 859
C. FEE AND OTHER INCOME
Fee based revenue 132 125
Other income 55 74
Total fee and other income 187 199
D. SHARE OF NET PROFIT/(LOSS) OF ASSOCIATES 6 (8)
Total income 15,008 12,679
62 IAG ANNUAL REPORT 2015
NOTE 5. ANALYSIS OF EXPENSESCONSOLIDATED
2015 2014
$m $mA. EXPENSES AS PRESENTED IN THE STATEMENT OF COMPREHENSIVE INCOME
Outwards reinsurance premium expense 1,196 1,077
Claims expense 9,363 7,058
Acquisition costs 1,750 1,386
Other underwriting expenses 924 752
Fire services levies 225 216
Investment expenses on assets backing insurance liabilities 23 20
Finance costs 107 98
Net loss attributable to non-controlling interests in unitholders' funds 6 14
Fee based, corporate and other expenses 465 256
Total expenses 14,059 10,877
B. ANALYSIS OF EXPENSES BY FUNCTION
General insurance business expenses 13,481 10,509
Fee based business expenses 113 113
Investment and other expenses 12 21
Corporate and administration expenses 453 234
Total expenses 14,059 10,877
C. OTHER ITEMS
Disclosure of the following items is considered relevant in explaining the results for the financial year:
I. Depreciation and amortisation
Acquired intangible assets 80 11
Capitalised software development expenditure 59 38
Property and equipment 67 62
206 111
II. Employee benefits
Defined contribution superannuation plans 116 99
Defined benefit superannuation plans 10 12
Share based remuneration 28 25
Salaries and other employee benefits expense 1,605 1,313
1,759 1,449
III. Other
Restructuring provision and integration costs 155 50
Impairment in investment in associate 60 -
215 50
IV. Finance costs
Subordinated term notes interest paid/payable 30 26
Convertible preference share distributions paid/payable 18 18
Reset exchangeable securities interest paid/payable 25 26
Subordinated bonds interest paid/payable 23 22
Other debts of an operational nature, interest paid/payable 7 1
Amortisation of capitalised transaction costs 4 5
107 98
63
NOTE 6. INCOME TAXCONSOLIDATED
2015 2014
$m $mA. INCOME TAX EXPENSE
Current tax 332 427
Deferred tax (240) 51
(Over)/under provided in prior year 27 (6)
Income tax expense/(credit) 119 472
Deferred income tax expense/(credit) included in income tax comprises
(Increase)/decrease in deferred tax assets (191) (20)
Increase/(decrease) in deferred tax liabilities (49) 71
(240) 51
B. INCOME TAX RECONCILIATION
The income tax for the financial year differs from the amount calculated on the profit/(loss)before income tax. The differences are reconciled as follows:
Profit for the year before income tax 949 1,802
Income tax calculated at 30% (2014-30%) 285 541
Amounts which are not deductible/(taxable) in calculating taxable income
Difference in tax rate (205) (80)
Rebateable dividends (9) (6)
Amortisation and impairment charge on acquired intangible assets and goodwill 3 2
Interest on convertible preference shares and reset preference shares 5 5
Other 13 16
Income tax expense/(credit) applicable to current year 92 478
Adjustment relating to prior year 27 (6)
Income tax (credit)/expense attributable to profit/(loss) for the year after impact of taxconsolidation 119 472
C. DEFERRED TAX ASSETS
I. Composition
a. AMOUNTS RECOGNISED IN PROFIT
Property and equipment 75 66
Employee benefits 91 87
Insurance provisions 122 159
Investments 30 17
Tax losses 444 278
Other 11 23
773 630
b. AMOUNTS RECOGNISED DIRECTLY IN OTHER COMPREHENSIVE INCOME
Defined benefit superannuation plans 9 16
Other - 6
782 652
c. AMOUNTS SET-OFF AGAINST DEFERRED TAX LIABILITIES (283) (328)
499 324
II. Reconciliation of movements
Balance at the beginning of the financial year 652 561
Credited/(charged) to profit or loss 191 20
Credited/(charged) to equity (13) (2)
Additions through business acquisition - 60
Transfers - 2
Adjustments relating to prior year (23) -
Foreign exchange differences (25) 11
Balance at the end of the financial year prior to set-off 782 652
III. Tax lossesThe Consolidated entity has an unrecognised deferred tax asset of $11 million (2014-$14 million) in relation to discontinued operationtax losses.
64 IAG ANNUAL REPORT 2015
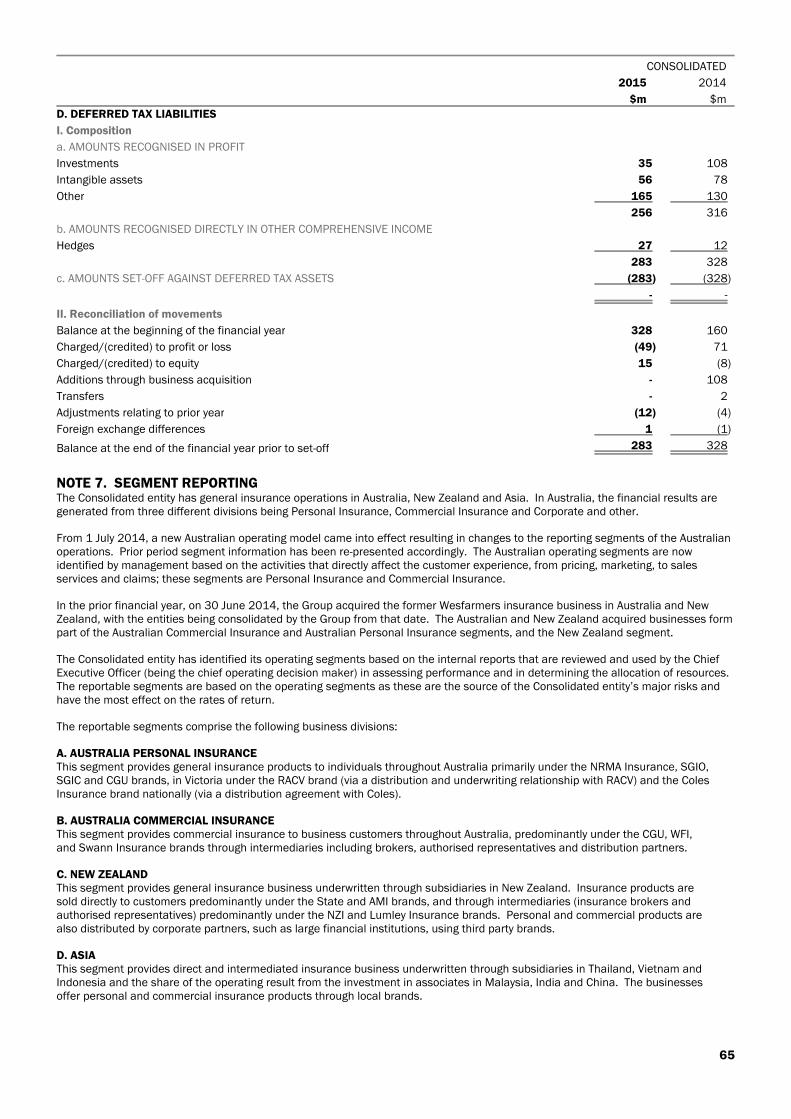
CONSOLIDATED
2015 2014
$m $mD. DEFERRED TAX LIABILITIES
I. Composition
a. AMOUNTS RECOGNISED IN PROFIT
Investments 35 108
Intangible assets 56 78
Other 165 130
256 316
b. AMOUNTS RECOGNISED DIRECTLY IN OTHER COMPREHENSIVE INCOME
Hedges 27 12
283 328
c. AMOUNTS SET-OFF AGAINST DEFERRED TAX ASSETS (283) (328)
- -
II. Reconciliation of movements
Balance at the beginning of the financial year 328 160
Charged/(credited) to profit or loss (49) 71
Charged/(credited) to equity 15 (8)
Additions through business acquisition - 108
Transfers - 2
Adjustments relating to prior year (12) (4)
Foreign exchange differences 1 (1)
Balance at the end of the financial year prior to set-off 283 328
NOTE 7. SEGMENT REPORTINGThe Consolidated entity has general insurance operations in Australia, New Zealand and Asia. In Australia, the financial results aregenerated from three different divisions being Personal Insurance, Commercial Insurance and Corporate and other.
From 1 July 2014, a new Australian operating model came into effect resulting in changes to the reporting segments of the Australianoperations. Prior period segment information has been re-presented accordingly. The Australian operating segments are nowidentified by management based on the activities that directly affect the customer experience, from pricing, marketing, to salesservices and claims; these segments are Personal Insurance and Commercial Insurance.
In the prior financial year, on 30 June 2014, the Group acquired the former Wesfarmers insurance business in Australia and NewZealand, with the entities being consolidated by the Group from that date. The Australian and New Zealand acquired businesses formpart of the Australian Commercial Insurance and Australian Personal Insurance segments, and the New Zealand segment.
The Consolidated entity has identified its operating segments based on the internal reports that are reviewed and used by the ChiefExecutive Officer (being the chief operating decision maker) in assessing performance and in determining the allocation of resources.The reportable segments are based on the operating segments as these are the source of the Consolidated entity’s major risks andhave the most effect on the rates of return.
The reportable segments comprise the following business divisions:
A. AUSTRALIA PERSONAL INSURANCEThis segment provides general insurance products to individuals throughout Australia primarily under the NRMA Insurance, SGIO,SGIC and CGU brands, in Victoria under the RACV brand (via a distribution and underwriting relationship with RACV) and the ColesInsurance brand nationally (via a distribution agreement with Coles).
B. AUSTRALIA COMMERCIAL INSURANCEThis segment provides commercial insurance to business customers throughout Australia, predominantly under the CGU, WFI,and Swann Insurance brands through intermediaries including brokers, authorised representatives and distribution partners.
C. NEW ZEALANDThis segment provides general insurance business underwritten through subsidiaries in New Zealand. Insurance products aresold directly to customers predominantly under the State and AMI brands, and through intermediaries (insurance brokers andauthorised representatives) predominantly under the NZI and Lumley Insurance brands. Personal and commercial products arealso distributed by corporate partners, such as large financial institutions, using third party brands.
D. ASIAThis segment provides direct and intermediated insurance business underwritten through subsidiaries in Thailand, Vietnam andIndonesia and the share of the operating result from the investment in associates in Malaysia, India and China. The businessesoffer personal and commercial insurance products through local brands.
65
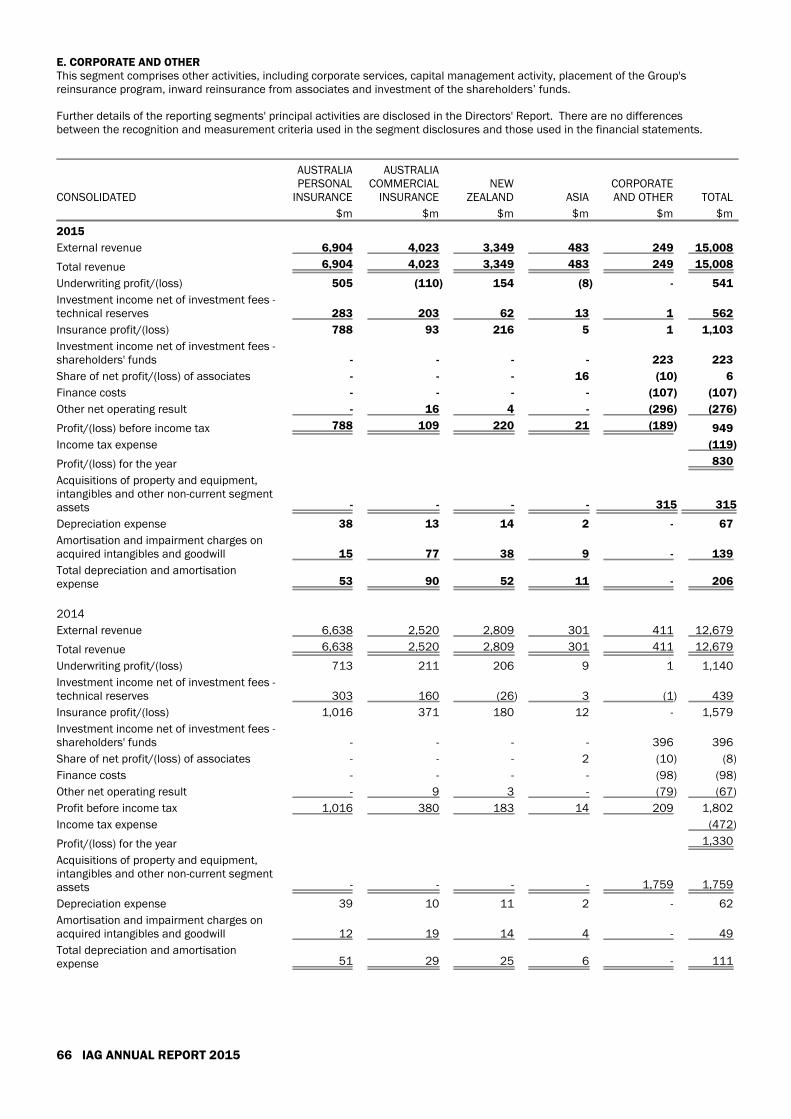
E. CORPORATE AND OTHERThis segment comprises other activities, including corporate services, capital management activity, placement of the Group'sreinsurance program, inward reinsurance from associates and investment of the shareholders’ funds.
Further details of the reporting segments' principal activities are disclosed in the Directors' Report. There are no differencesbetween the recognition and measurement criteria used in the segment disclosures and those used in the financial statements.
CONSOLIDATED
AUSTRALIAPERSONAL
INSURANCE
AUSTRALIACOMMERCIAL
INSURANCENEW
ZEALAND ASIACORPORATEAND OTHER TOTAL
$m $m $m $m $m $m
2015
External revenue 6,904 4,023 3,349 483 249 15,008
Total revenue 6,904 4,023 3,349 483 249 15,008
Underwriting profit/(loss) 505 (110) 154 (8) - 541
Investment income net of investment fees -technical reserves 283 203 62 13 1 562
Insurance profit/(loss) 788 93 216 5 1 1,103
Investment income net of investment fees -shareholders' funds - - - - 223 223
Share of net profit/(loss) of associates - - - 16 (10) 6
Finance costs - - - - (107) (107)
Other net operating result - 16 4 - (296) (276)
Profit/(loss) before income tax 788 109 220 21 (189) 949
Income tax expense (119)
Profit/(loss) for the year 830
Acquisitions of property and equipment,intangibles and other non-current segmentassets - - - - 315 315
Depreciation expense 38 13 14 2 - 67
Amortisation and impairment charges onacquired intangibles and goodwill 15 77 38 9 - 139
Total depreciation and amortisationexpense 53 90 52 11 - 206
2014
External revenue 6,638 2,520 2,809 301 411 12,679
Total revenue 6,638 2,520 2,809 301 411 12,679
Underwriting profit/(loss) 713 211 206 9 1 1,140
Investment income net of investment fees -technical reserves 303 160 (26) 3 (1) 439
Insurance profit/(loss) 1,016 371 180 12 - 1,579
Investment income net of investment fees -shareholders' funds - - - - 396 396
Share of net profit/(loss) of associates - - - 2 (10) (8)
Finance costs - - - - (98) (98)
Other net operating result - 9 3 - (79) (67)
Profit before income tax 1,016 380 183 14 209 1,802
Income tax expense (472)
Profit/(loss) for the year 1,330
Acquisitions of property and equipment,intangibles and other non-current segmentassets - - - - 1,759 1,759
Depreciation expense 39 10 11 2 - 62
Amortisation and impairment charges onacquired intangibles and goodwill 12 19 14 4 - 49
Total depreciation and amortisationexpense 51 29 25 6 - 111
66 IAG ANNUAL REPORT 2015
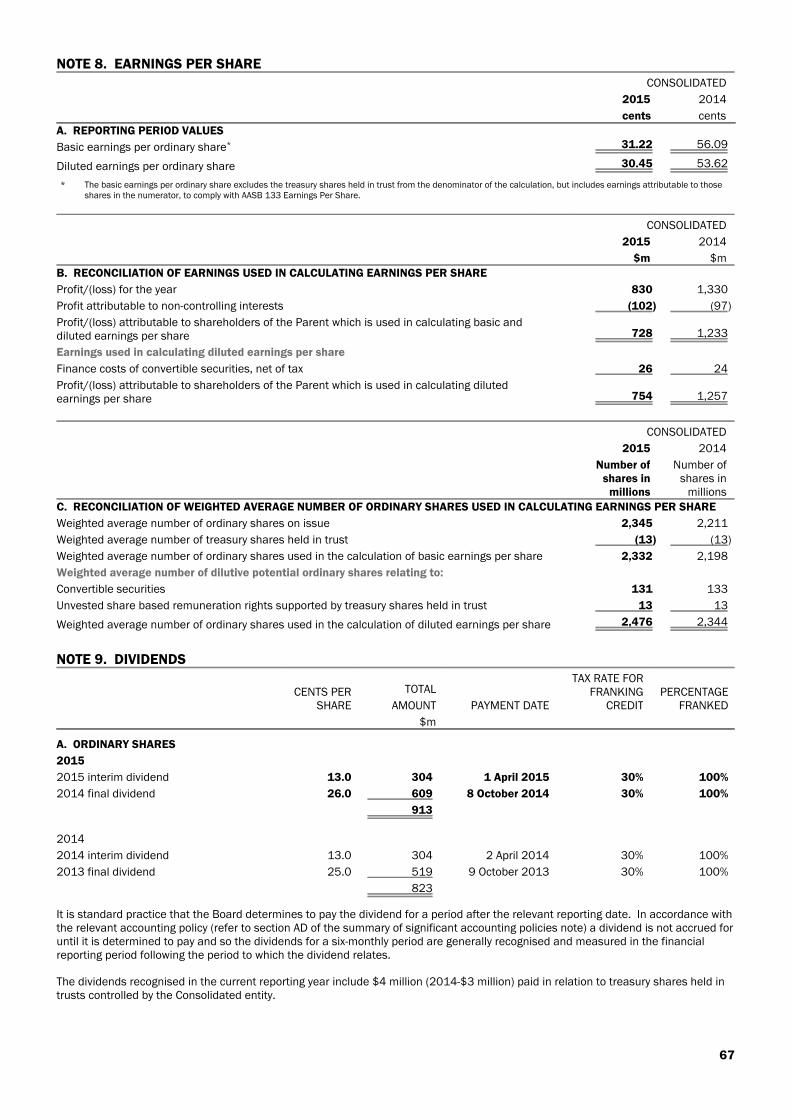
NOTE 8. EARNINGS PER SHARECONSOLIDATED
2015 2014
cents centsA. REPORTING PERIOD VALUES
Basic earnings per ordinary share* 31.22 56.09
Diluted earnings per ordinary share 30.45 53.62
* The basic earnings per ordinary share excludes the treasury shares held in trust from the denominator of the calculation, but includes earnings attributable to those shares in the numerator, to comply with AASB 133 Earnings Per Share.
CONSOLIDATED
2015 2014
$m $mB. RECONCILIATION OF EARNINGS USED IN CALCULATING EARNINGS PER SHARE
Profit/(loss) for the year 830 1,330
Profit attributable to non-controlling interests (102) (97)
Profit/(loss) attributable to shareholders of the Parent which is used in calculating basic anddiluted earnings per share 728 1,233
Earnings used in calculating diluted earnings per share
Finance costs of convertible securities, net of tax 26 24
Profit/(loss) attributable to shareholders of the Parent which is used in calculating dilutedearnings per share 754 1,257
CONSOLIDATED
2015 2014
Number ofshares in
millions
Number ofshares in
millionsC. RECONCILIATION OF WEIGHTED AVERAGE NUMBER OF ORDINARY SHARES USED IN CALCULATING EARNINGS PER SHARE
Weighted average number of ordinary shares on issue 2,345 2,211
Weighted average number of treasury shares held in trust (13) (13)
Weighted average number of ordinary shares used in the calculation of basic earnings per share 2,332 2,198
Weighted average number of dilutive potential ordinary shares relating to:
Convertible securities 131 133
Unvested share based remuneration rights supported by treasury shares held in trust 13 13
Weighted average number of ordinary shares used in the calculation of diluted earnings per share 2,476 2,344
NOTE 9. DIVIDENDS
CENTS PERSHARE
TOTAL
AMOUNT PAYMENT DATE
TAX RATE FORFRANKING
CREDITPERCENTAGE
FRANKED
$m
A. ORDINARY SHARES
2015
2015 interim dividend 13.0 304 1 April 2015 30% 100%
2014 final dividend 26.0 609 8 October 2014 30% 100%
913
2014
2014 interim dividend 13.0 304 2 April 2014 30% 100%
2013 final dividend 25.0 519 9 October 2013 30% 100%
823
It is standard practice that the Board determines to pay the dividend for a period after the relevant reporting date. In accordance withthe relevant accounting policy (refer to section AD of the summary of significant accounting policies note) a dividend is not accrued foruntil it is determined to pay and so the dividends for a six-monthly period are generally recognised and measured in the financialreporting period following the period to which the dividend relates.
The dividends recognised in the current reporting year include $4 million (2014-$3 million) paid in relation to treasury shares held intrusts controlled by the Consolidated entity.
67
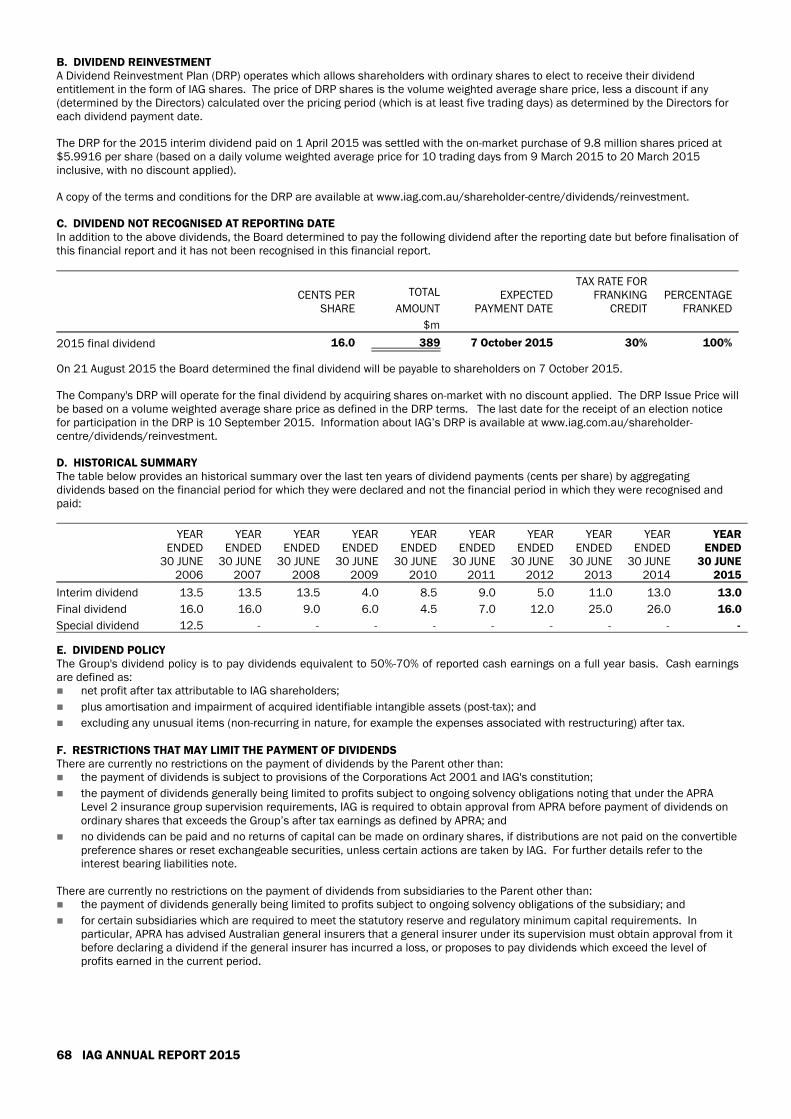
B. DIVIDEND REINVESTMENTA Dividend Reinvestment Plan (DRP) operates which allows shareholders with ordinary shares to elect to receive their dividendentitlement in the form of IAG shares. The price of DRP shares is the volume weighted average share price, less a discount if any(determined by the Directors) calculated over the pricing period (which is at least five trading days) as determined by the Directors foreach dividend payment date.
The DRP for the 2015 interim dividend paid on 1 April 2015 was settled with the on-market purchase of 9.8 million shares priced at$5.9916 per share (based on a daily volume weighted average price for 10 trading days from 9 March 2015 to 20 March 2015inclusive, with no discount applied).
A copy of the terms and conditions for the DRP are available at www.iag.com.au/shareholder-centre/dividends/reinvestment.
C. DIVIDEND NOT RECOGNISED AT REPORTING DATEIn addition to the above dividends, the Board determined to pay the following dividend after the reporting date but before finalisation ofthis financial report and it has not been recognised in this financial report.
CENTS PERSHARE
TOTAL
AMOUNTEXPECTED
PAYMENT DATE
TAX RATE FORFRANKING
CREDITPERCENTAGE
FRANKED
$m
2015 final dividend 16.0 389 7 October 2015 30% 100%
On 21 August 2015 the Board determined the final dividend will be payable to shareholders on 7 October 2015.
The Company's DRP will operate for the final dividend by acquiring shares on-market with no discount applied. The DRP Issue Price willbe based on a volume weighted average share price as defined in the DRP terms. The last date for the receipt of an election noticefor participation in the DRP is 10 September 2015. Information about IAG’s DRP is available at www.iag.com.au/shareholder-centre/dividends/reinvestment.
D. HISTORICAL SUMMARYThe table below provides an historical summary over the last ten years of dividend payments (cents per share) by aggregatingdividends based on the financial period for which they were declared and not the financial period in which they were recognised andpaid:
YEARENDED
30 JUNE2006
YEARENDED
30 JUNE2007
YEARENDED
30 JUNE2008
YEARENDED
30 JUNE2009
YEARENDED
30 JUNE2010
YEARENDED
30 JUNE2011
YEARENDED
30 JUNE2012
YEARENDED
30 JUNE2013
YEARENDED
30 JUNE2014
YEARENDED
30 JUNE2015
Interim dividend 13.5 13.5 13.5 4.0 8.5 9.0 5.0 11.0 13.0 13.0
Final dividend 16.0 16.0 9.0 6.0 4.5 7.0 12.0 25.0 26.0 16.0
Special dividend 12.5 - - - - - - - - -
E. DIVIDEND POLICYThe Group's dividend policy is to pay dividends equivalent to 50%-70% of reported cash earnings on a full year basis. Cash earningsare defined as: net profit after tax attributable to IAG shareholders;
plus amortisation and impairment of acquired identifiable intangible assets (post-tax); and
excluding any unusual items (non-recurring in nature, for example the expenses associated with restructuring) after tax.
F. RESTRICTIONS THAT MAY LIMIT THE PAYMENT OF DIVIDENDSThere are currently no restrictions on the payment of dividends by the Parent other than: the payment of dividends is subject to provisions of the Corporations Act 2001 and IAG's constitution;
the payment of dividends generally being limited to profits subject to ongoing solvency obligations noting that under the APRALevel 2 insurance group supervision requirements, IAG is required to obtain approval from APRA before payment of dividends onordinary shares that exceeds the Group’s after tax earnings as defined by APRA; and
no dividends can be paid and no returns of capital can be made on ordinary shares, if distributions are not paid on the convertiblepreference shares or reset exchangeable securities, unless certain actions are taken by IAG. For further details refer to theinterest bearing liabilities note.
There are currently no restrictions on the payment of dividends from subsidiaries to the Parent other than: the payment of dividends generally being limited to profits subject to ongoing solvency obligations of the subsidiary; and
for certain subsidiaries which are required to meet the statutory reserve and regulatory minimum capital requirements. Inparticular, APRA has advised Australian general insurers that a general insurer under its supervision must obtain approval from itbefore declaring a dividend if the general insurer has incurred a loss, or proposes to pay dividends which exceed the level ofprofits earned in the current period.
68 IAG ANNUAL REPORT 2015
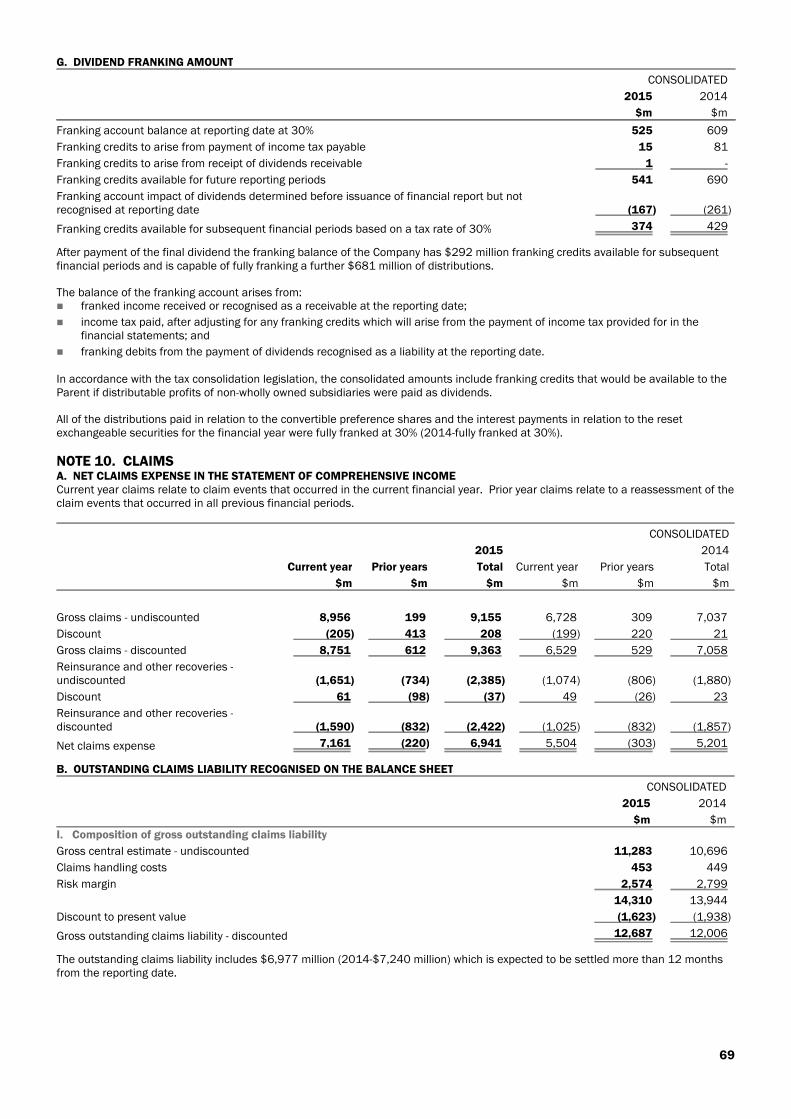
G. DIVIDEND FRANKING AMOUNT
CONSOLIDATED
2015 2014
$m $m
Franking account balance at reporting date at 30% 525 609
Franking credits to arise from payment of income tax payable 15 81
Franking credits to arise from receipt of dividends receivable 1 -
Franking credits available for future reporting periods 541 690
Franking account impact of dividends determined before issuance of financial report but notrecognised at reporting date (167) (261)
Franking credits available for subsequent financial periods based on a tax rate of 30% 374 429
After payment of the final dividend the franking balance of the Company has $292 million franking credits available for subsequentfinancial periods and is capable of fully franking a further $681 million of distributions.
The balance of the franking account arises from: franked income received or recognised as a receivable at the reporting date;
income tax paid, after adjusting for any franking credits which will arise from the payment of income tax provided for in thefinancial statements; and
franking debits from the payment of dividends recognised as a liability at the reporting date.
In accordance with the tax consolidation legislation, the consolidated amounts include franking credits that would be available to theParent if distributable profits of non-wholly owned subsidiaries were paid as dividends.
All of the distributions paid in relation to the convertible preference shares and the interest payments in relation to the resetexchangeable securities for the financial year were fully franked at 30% (2014-fully franked at 30%).
NOTE 10. CLAIMSA. NET CLAIMS EXPENSE IN THE STATEMENT OF COMPREHENSIVE INCOMECurrent year claims relate to claim events that occurred in the current financial year. Prior year claims relate to a reassessment of theclaim events that occurred in all previous financial periods.
CONSOLIDATED
2015 2014
Current year Prior years Total Current year Prior years Total
$m $m $m $m $m $m
Gross claims - undiscounted 8,956 199 9,155 6,728 309 7,037
Discount (205) 413 208 (199) 220 21
Gross claims - discounted 8,751 612 9,363 6,529 529 7,058
Reinsurance and other recoveries -undiscounted (1,651) (734) (2,385) (1,074) (806) (1,880)
Discount 61 (98) (37) 49 (26) 23
Reinsurance and other recoveries -discounted (1,590) (832) (2,422) (1,025) (832) (1,857)
Net claims expense 7,161 (220) 6,941 5,504 (303) 5,201
B. OUTSTANDING CLAIMS LIABILITY RECOGNISED ON THE BALANCE SHEET
CONSOLIDATED
2015 2014
$m $mI. Composition of gross outstanding claims liability
Gross central estimate - undiscounted 11,283 10,696
Claims handling costs 453 449
Risk margin 2,574 2,799
14,310 13,944
Discount to present value (1,623) (1,938)
Gross outstanding claims liability - discounted 12,687 12,006
The outstanding claims liability includes $6,977 million (2014-$7,240 million) which is expected to be settled more than 12 monthsfrom the reporting date.
69
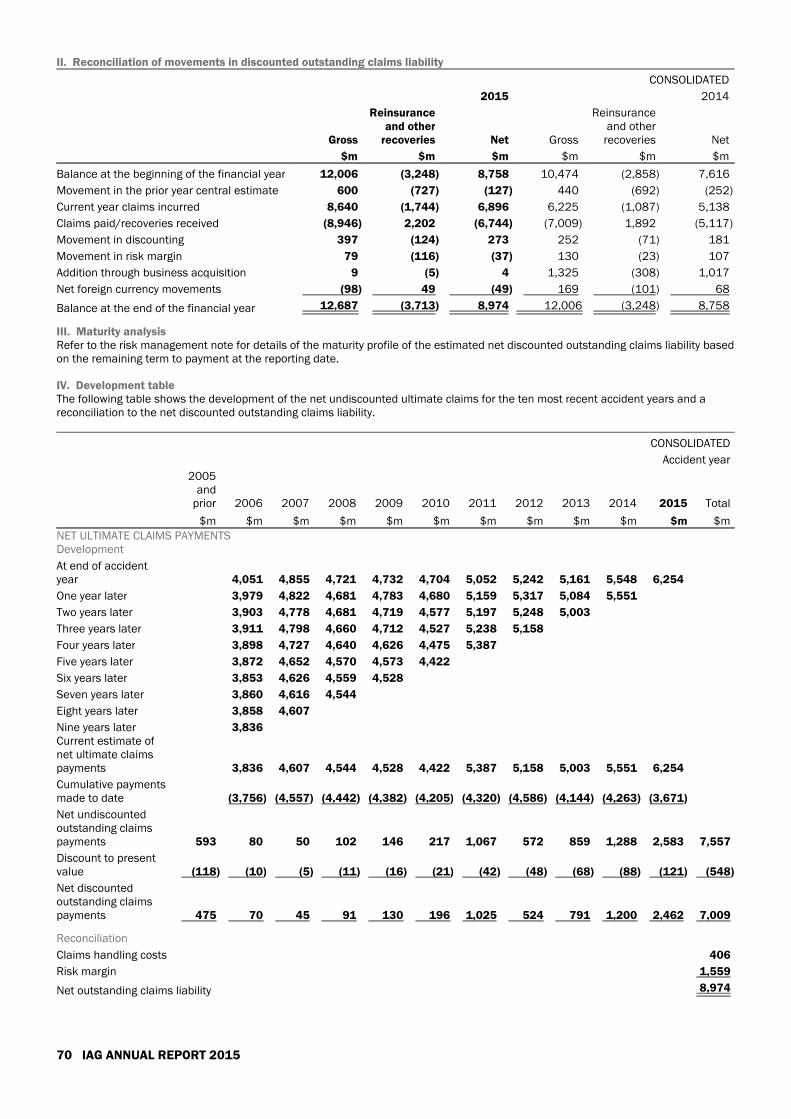
II. Reconciliation of movements in discounted outstanding claims liability
CONSOLIDATED
2015 2014
Gross
Reinsuranceand other
recoveries Net Gross
Reinsuranceand other
recoveries Net
$m $m $m $m $m $m
Balance at the beginning of the financial year 12,006 (3,248) 8,758 10,474 (2,858) 7,616
Movement in the prior year central estimate 600 (727) (127) 440 (692) (252)
Current year claims incurred 8,640 (1,744) 6,896 6,225 (1,087) 5,138
Claims paid/recoveries received (8,946) 2,202 (6,744) (7,009) 1,892 (5,117)
Movement in discounting 397 (124) 273 252 (71) 181
Movement in risk margin 79 (116) (37) 130 (23) 107
Addition through business acquisition 9 (5) 4 1,325 (308) 1,017
Net foreign currency movements (98) 49 (49) 169 (101) 68
Balance at the end of the financial year 12,687 (3,713) 8,974 12,006 (3,248) 8,758
III. Maturity analysisRefer to the risk management note for details of the maturity profile of the estimated net discounted outstanding claims liability basedon the remaining term to payment at the reporting date.
IV. Development tableThe following table shows the development of the net undiscounted ultimate claims for the ten most recent accident years and areconciliation to the net discounted outstanding claims liability.
CONSOLIDATED
Accident year
2005and
prior 2006 2007 2008 2009 2010 2011 2012 2013 2014 2015 Total
$m $m $m $m $m $m $m $m $m $m $m $mNET ULTIMATE CLAIMS PAYMENTSDevelopment
At end of accidentyear 4,051 4,855 4,721 4,732 4,704 5,052 5,242 5,161 5,548 6,254
One year later 3,979 4,822 4,681 4,783 4,680 5,159 5,317 5,084 5,551
Two years later 3,903 4,778 4,681 4,719 4,577 5,197 5,248 5,003
Three years later 3,911 4,798 4,660 4,712 4,527 5,238 5,158
Four years later 3,898 4,727 4,640 4,626 4,475 5,387
Five years later 3,872 4,652 4,570 4,573 4,422
Six years later 3,853 4,626 4,559 4,528
Seven years later 3,860 4,616 4,544
Eight years later 3,858 4,607
Nine years later 3,836Current estimate ofnet ultimate claimspayments 3,836 4,607 4,544 4,528 4,422 5,387 5,158 5,003 5,551 6,254
Cumulative paymentsmade to date (3,756) (4,557) (4,442) (4,382) (4,205) (4,320) (4,586) (4,144) (4,263) (3,671)
Net undiscountedoutstanding claimspayments 593 80 50 102 146 217 1,067 572 859 1,288 2,583 7,557
Discount to presentvalue (118) (10) (5) (11) (16) (21) (42) (48) (68) (88) (121) (548)
Net discountedoutstanding claimspayments 475 70 45 91 130 196 1,025 524 791 1,200 2,462 7,009
Reconciliation
Claims handling costs 406
Risk margin 1,559
Net outstanding claims liability 8,974
70 IAG ANNUAL REPORT 2015

Where an entity or business that includes an outstanding claims liability has been acquired the claims for the acquired businesses areincluded in the claims development table from and including the year of acquisition.
Conditions and trends that have affected the development of the liabilities in the past may or may not occur in the future. Accordinglyconclusions about future results may not necessarily be derived from the information presented in the tables above.
The development table shown above relates to both short-tail and long-tail claims.
The gross outstanding claims liability includes international operations. For ease of comparison within the claims development table,all payments not denominated in Australian dollars have been converted to Australian dollars using the exchange rates as at thereporting date. Therefore, the claims development table disclosed each reporting year cannot be reconciled directly to the equivalenttables presented in previous years' financial statements.
V. Central estimate and risk margina. REPORTING DATE VALUES
CONSOLIDATED
2015 2014
% %
The percentage risk margin applied to the net outstanding claims liability 21 23
The probability of adequacy of the risk margin 90 90
b. PROCESSThe outstanding claims liability is determined based on three building blocks being: a central estimate of the future cash flows;
discounting for the effect of the time value of money; and
a risk margin for uncertainty.
i. Future cash flowsThe estimation of the outstanding claims liability is based on a variety of actuarial techniques that analyse experience, trends andother relevant factors. The expected future payments include those in relation to claims reported but not yet paid or not yet paid in full,claims incurred but not enough reported (IBNER), claims incurred but not reported (IBNR) and the anticipated direct and indirectclaims handling costs.
The estimation process involves using the Consolidated entity’s specific data, relevant industry data and more general economic data.Each class of business is usually examined separately and the process involves consideration of a large number of factors. Thesefactors may include the risks to which the business is exposed at a point in time, claim frequencies and average claim sizes, historicaltrends in the incidence and development of claims reported and finalised, legal, social and economic factors that may impact uponeach class of business, the key actuarial assumptions set out in section VI and the impact of reinsurance and other recoveries.
Different actuarial valuation models are used for different claims types and lines of business. The selection of the appropriateactuarial model takes into account the characteristics of a claim type and class of business and the extent of the development of eachaccident period.
ii. DiscountingProjected future claims payments, both gross and net of reinsurance and other recoveries and associated claims handling costs arediscounted to a present value using appropriate risk free discount rates.
iii. Risk marginThe central estimate of the outstanding claims liability is an estimate which is intended to contain no deliberate or conscious over orunder estimation and is commonly described as providing the mean of the distribution of future cash flows. It is consideredappropriate to add a risk margin to the central estimate in order for the claims liability to have an increased probability of sufficiency.The risk margin refers to the amount by which the liability recognised in the financial statements is greater than the actuarial centralestimate of the liability.
Uncertainties surrounding the outstanding claims liability estimation process include those relating to the data, actuarial models andassumptions, the statistical uncertainty associated with a general insurance claims run-off process, and risks external to IAG, forexample the impact of future legislative reform. Uncertainty from these sources is examined for each class of business and expressedas a volatility measure relative to the net central estimate. The volatility measure for each class is derived after consideration ofstatistical modelling and benchmarking to industry analysis. Certain product classes may be subject to the emergence of new types oflatent claims and such uncertainties are considered when setting the volatility and hence the risk margin appropriate for thoseclasses.
The long-tail classes of business generally have the highest volatilities for outstanding claims as the longer average time for claims tobe reported and settled allows more time for sources of uncertainty to emerge. Short-tail classes generally have lower levels ofvolatility for outstanding claims.
The risk margin required to provide a given probability of adequacy for two or more classes of business or for two or more geographiclocations combined is likely to be less than the sum of the risk margins for the individual classes. This reflects the benefit ofdiversification. The level of diversification assumed between classes has due regard to industry analysis, historical experience and thejudgement of experienced and qualified actuaries.
71
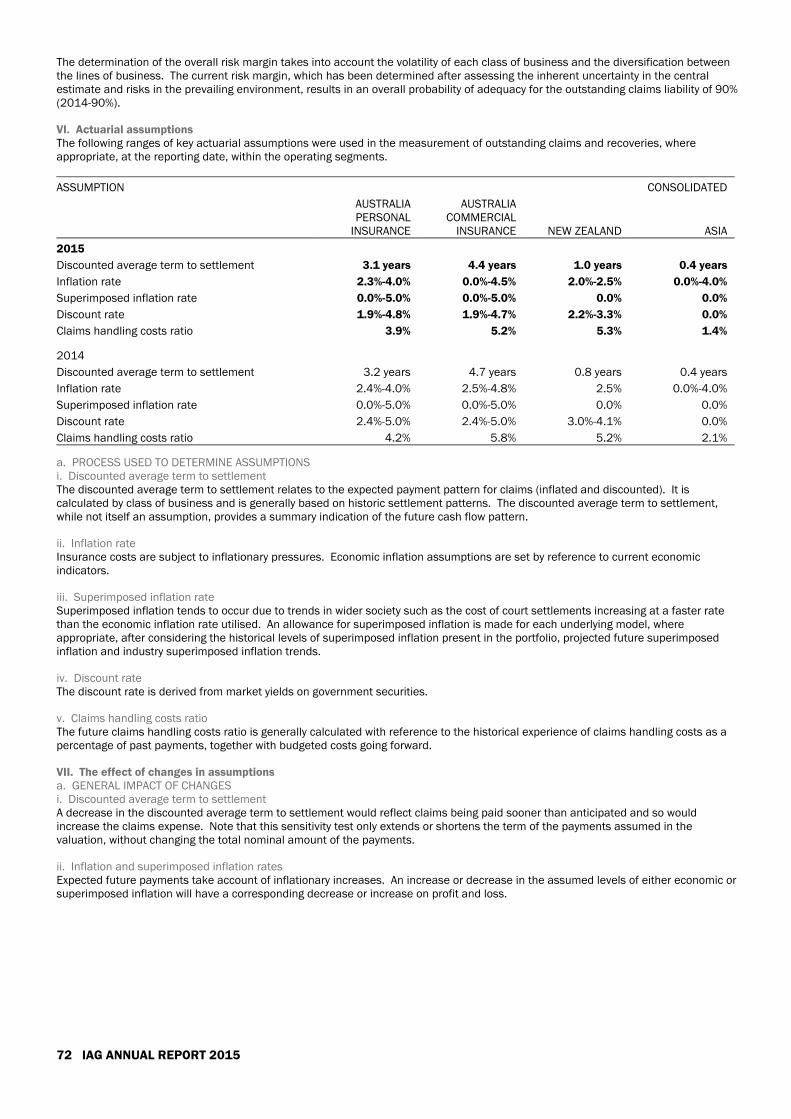
The determination of the overall risk margin takes into account the volatility of each class of business and the diversification betweenthe lines of business. The current risk margin, which has been determined after assessing the inherent uncertainty in the centralestimate and risks in the prevailing environment, results in an overall probability of adequacy for the outstanding claims liability of 90%(2014-90%).
VI. Actuarial assumptionsThe following ranges of key actuarial assumptions were used in the measurement of outstanding claims and recoveries, whereappropriate, at the reporting date, within the operating segments.
ASSUMPTION CONSOLIDATED
AUSTRALIAPERSONAL
INSURANCE
AUSTRALIACOMMERCIAL
INSURANCE NEW ZEALAND ASIA
2015
Discounted average term to settlement 3.1 years 4.4 years 1.0 years 0.4 years
Inflation rate 2.3%-4.0% 0.0%-4.5% 2.0%-2.5% 0.0%-4.0%
Superimposed inflation rate 0.0%-5.0% 0.0%-5.0% 0.0% 0.0%
Discount rate 1.9%-4.8% 1.9%-4.7% 2.2%-3.3% 0.0%
Claims handling costs ratio 3.9% 5.2% 5.3% 1.4%
2014
Discounted average term to settlement 3.2 years 4.7 years 0.8 years 0.4 years
Inflation rate 2.4%-4.0% 2.5%-4.8% 2.5% 0.0%-4.0%
Superimposed inflation rate 0.0%-5.0% 0.0%-5.0% 0.0% 0.0%
Discount rate 2.4%-5.0% 2.4%-5.0% 3.0%-4.1% 0.0%
Claims handling costs ratio 4.2% 5.8% 5.2% 2.1%
a. PROCESS USED TO DETERMINE ASSUMPTIONSi. Discounted average term to settlementThe discounted average term to settlement relates to the expected payment pattern for claims (inflated and discounted). It iscalculated by class of business and is generally based on historic settlement patterns. The discounted average term to settlement,while not itself an assumption, provides a summary indication of the future cash flow pattern.
ii. Inflation rateInsurance costs are subject to inflationary pressures. Economic inflation assumptions are set by reference to current economicindicators.
iii. Superimposed inflation rateSuperimposed inflation tends to occur due to trends in wider society such as the cost of court settlements increasing at a faster ratethan the economic inflation rate utilised. An allowance for superimposed inflation is made for each underlying model, whereappropriate, after considering the historical levels of superimposed inflation present in the portfolio, projected future superimposedinflation and industry superimposed inflation trends.
iv. Discount rateThe discount rate is derived from market yields on government securities.
v. Claims handling costs ratioThe future claims handling costs ratio is generally calculated with reference to the historical experience of claims handling costs as apercentage of past payments, together with budgeted costs going forward.
VII. The effect of changes in assumptionsa. GENERAL IMPACT OF CHANGESi. Discounted average term to settlementA decrease in the discounted average term to settlement would reflect claims being paid sooner than anticipated and so wouldincrease the claims expense. Note that this sensitivity test only extends or shortens the term of the payments assumed in thevaluation, without changing the total nominal amount of the payments.
ii. Inflation and superimposed inflation ratesExpected future payments take account of inflationary increases. An increase or decrease in the assumed levels of either economic orsuperimposed inflation will have a corresponding decrease or increase on profit and loss.
72 IAG ANNUAL REPORT 2015
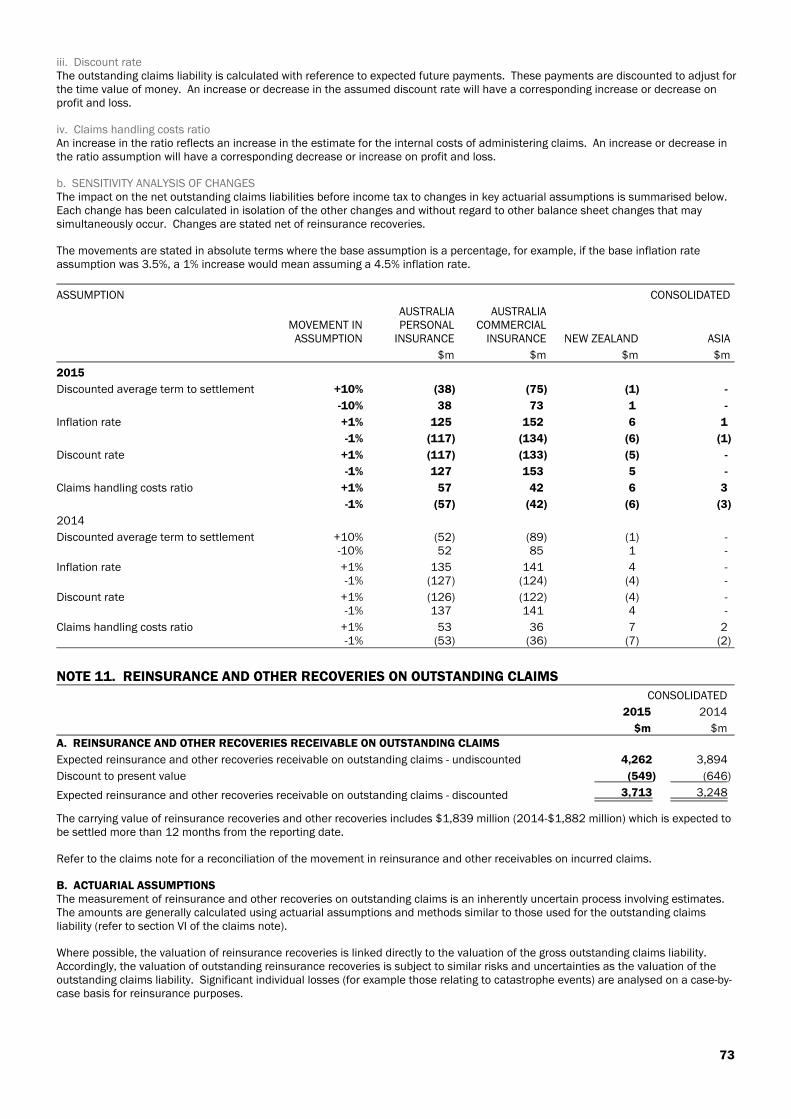
iii. Discount rateThe outstanding claims liability is calculated with reference to expected future payments. These payments are discounted to adjust forthe time value of money. An increase or decrease in the assumed discount rate will have a corresponding increase or decrease onprofit and loss.
iv. Claims handling costs ratioAn increase in the ratio reflects an increase in the estimate for the internal costs of administering claims. An increase or decrease inthe ratio assumption will have a corresponding decrease or increase on profit and loss.
b. SENSITIVITY ANALYSIS OF CHANGESThe impact on the net outstanding claims liabilities before income tax to changes in key actuarial assumptions is summarised below.Each change has been calculated in isolation of the other changes and without regard to other balance sheet changes that maysimultaneously occur. Changes are stated net of reinsurance recoveries.
The movements are stated in absolute terms where the base assumption is a percentage, for example, if the base inflation rateassumption was 3.5%, a 1% increase would mean assuming a 4.5% inflation rate.
ASSUMPTION CONSOLIDATED
MOVEMENT INASSUMPTION
AUSTRALIAPERSONAL
INSURANCE
AUSTRALIACOMMERCIAL
INSURANCE NEW ZEALAND ASIA
$m $m $m $m
2015
Discounted average term to settlement +10% (38) (75) (1) -
-10% 38 73 1 -
Inflation rate +1% 125 152 6 1
-1% (117) (134) (6) (1)
Discount rate +1% (117) (133) (5) -
-1% 127 153 5 -
Claims handling costs ratio +1% 57 42 6 3
-1% (57) (42) (6) (3)
2014
Discounted average term to settlement +10% (52) (89) (1) --10% 52 85 1 -
Inflation rate +1% 135 141 4 --1% (127) (124) (4) -
Discount rate +1% (126) (122) (4) --1% 137 141 4 -
Claims handling costs ratio +1% 53 36 7 2-1% (53) (36) (7) (2)
NOTE 11. REINSURANCE AND OTHER RECOVERIES ON OUTSTANDING CLAIMSCONSOLIDATED
2015 2014
$m $mA. REINSURANCE AND OTHER RECOVERIES RECEIVABLE ON OUTSTANDING CLAIMS
Expected reinsurance and other recoveries receivable on outstanding claims - undiscounted 4,262 3,894
Discount to present value (549) (646)
Expected reinsurance and other recoveries receivable on outstanding claims - discounted 3,713 3,248
The carrying value of reinsurance recoveries and other recoveries includes $1,839 million (2014-$1,882 million) which is expected tobe settled more than 12 months from the reporting date.
Refer to the claims note for a reconciliation of the movement in reinsurance and other receivables on incurred claims.
B. ACTUARIAL ASSUMPTIONSThe measurement of reinsurance and other recoveries on outstanding claims is an inherently uncertain process involving estimates.The amounts are generally calculated using actuarial assumptions and methods similar to those used for the outstanding claimsliability (refer to section VI of the claims note).
Where possible, the valuation of reinsurance recoveries is linked directly to the valuation of the gross outstanding claims liability.Accordingly, the valuation of outstanding reinsurance recoveries is subject to similar risks and uncertainties as the valuation of theoutstanding claims liability. Significant individual losses (for example those relating to catastrophe events) are analysed on a case-by-case basis for reinsurance purposes.
73
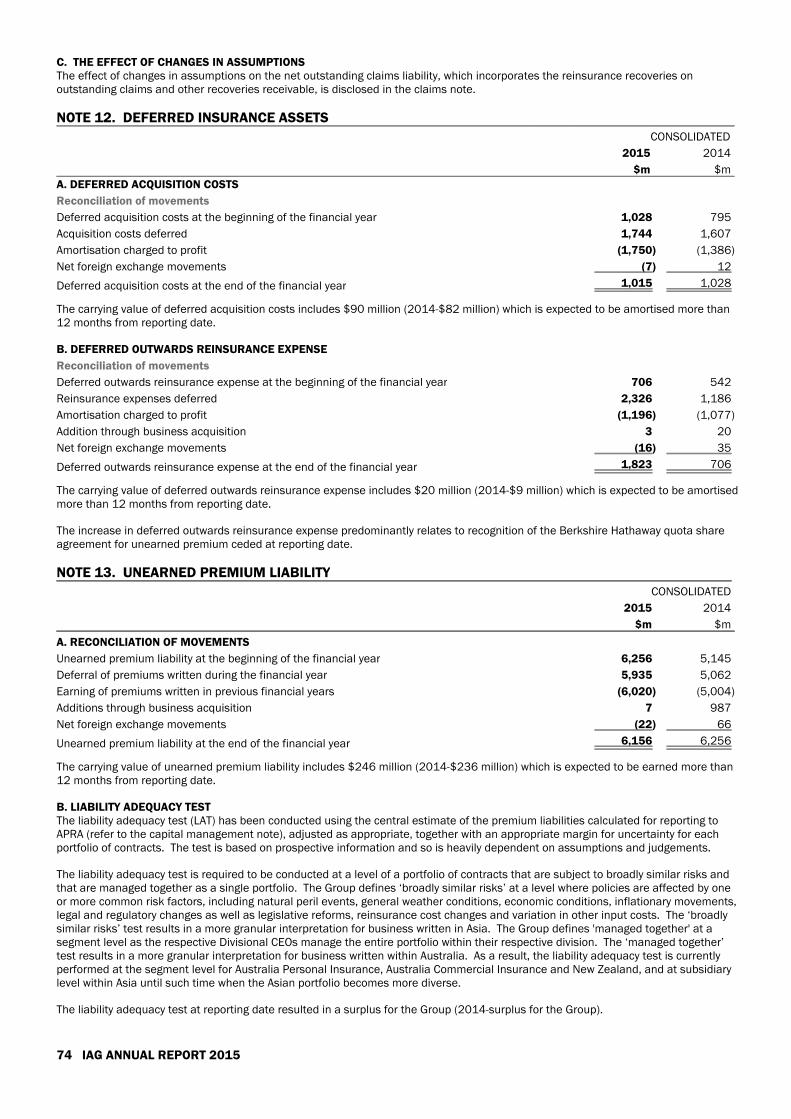
C. THE EFFECT OF CHANGES IN ASSUMPTIONSThe effect of changes in assumptions on the net outstanding claims liability, which incorporates the reinsurance recoveries onoutstanding claims and other recoveries receivable, is disclosed in the claims note.
NOTE 12. DEFERRED INSURANCE ASSETSCONSOLIDATED
2015 2014
$m $mA. DEFERRED ACQUISITION COSTS
Reconciliation of movements
Deferred acquisition costs at the beginning of the financial year 1,028 795
Acquisition costs deferred 1,744 1,607
Amortisation charged to profit (1,750) (1,386)
Net foreign exchange movements (7) 12
Deferred acquisition costs at the end of the financial year 1,015 1,028
The carrying value of deferred acquisition costs includes $90 million (2014-$82 million) which is expected to be amortised more than12 months from reporting date.
B. DEFERRED OUTWARDS REINSURANCE EXPENSE
Reconciliation of movements
Deferred outwards reinsurance expense at the beginning of the financial year 706 542
Reinsurance expenses deferred 2,326 1,186
Amortisation charged to profit (1,196) (1,077)
Addition through business acquisition 3 20
Net foreign exchange movements (16) 35
Deferred outwards reinsurance expense at the end of the financial year 1,823 706
The carrying value of deferred outwards reinsurance expense includes $20 million (2014-$9 million) which is expected to be amortisedmore than 12 months from reporting date.
The increase in deferred outwards reinsurance expense predominantly relates to recognition of the Berkshire Hathaway quota shareagreement for unearned premium ceded at reporting date.
NOTE 13. UNEARNED PREMIUM LIABILITYCONSOLIDATED
2015 2014
$m $m
A. RECONCILIATION OF MOVEMENTS
Unearned premium liability at the beginning of the financial year 6,256 5,145
Deferral of premiums written during the financial year 5,935 5,062
Earning of premiums written in previous financial years (6,020) (5,004)
Additions through business acquisition 7 987
Net foreign exchange movements (22) 66
Unearned premium liability at the end of the financial year 6,156 6,256
The carrying value of unearned premium liability includes $246 million (2014-$236 million) which is expected to be earned more than12 months from reporting date.
B. LIABILITY ADEQUACY TESTThe liability adequacy test (LAT) has been conducted using the central estimate of the premium liabilities calculated for reporting toAPRA (refer to the capital management note), adjusted as appropriate, together with an appropriate margin for uncertainty for eachportfolio of contracts. The test is based on prospective information and so is heavily dependent on assumptions and judgements.
The liability adequacy test is required to be conducted at a level of a portfolio of contracts that are subject to broadly similar risks andthat are managed together as a single portfolio. The Group defines ‘broadly similar risks’ at a level where policies are affected by oneor more common risk factors, including natural peril events, general weather conditions, economic conditions, inflationary movements,legal and regulatory changes as well as legislative reforms, reinsurance cost changes and variation in other input costs. The ‘broadlysimilar risks’ test results in a more granular interpretation for business written in Asia. The Group defines 'managed together' at asegment level as the respective Divisional CEOs manage the entire portfolio within their respective division. The ‘managed together’test results in a more granular interpretation for business written within Australia. As a result, the liability adequacy test is currentlyperformed at the segment level for Australia Personal Insurance, Australia Commercial Insurance and New Zealand, and at subsidiarylevel within Asia until such time when the Asian portfolio becomes more diverse.
The liability adequacy test at reporting date resulted in a surplus for the Group (2014-surplus for the Group).
74 IAG ANNUAL REPORT 2015
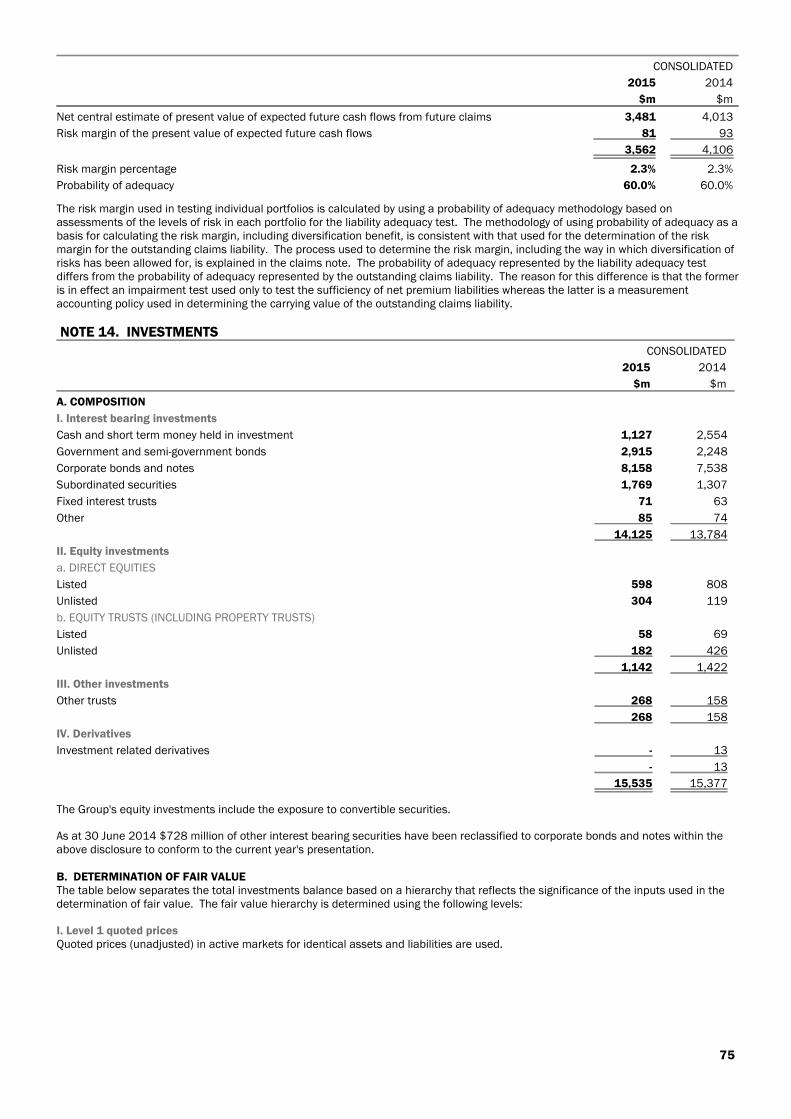
CONSOLIDATED
2015 2014
$m $m
Net central estimate of present value of expected future cash flows from future claims 3,481 4,013
Risk margin of the present value of expected future cash flows 81 93
3,562 4,106
Risk margin percentage 2.3% 2.3%
Probability of adequacy 60.0% 60.0%
The risk margin used in testing individual portfolios is calculated by using a probability of adequacy methodology based onassessments of the levels of risk in each portfolio for the liability adequacy test. The methodology of using probability of adequacy as abasis for calculating the risk margin, including diversification benefit, is consistent with that used for the determination of the riskmargin for the outstanding claims liability. The process used to determine the risk margin, including the way in which diversification ofrisks has been allowed for, is explained in the claims note. The probability of adequacy represented by the liability adequacy testdiffers from the probability of adequacy represented by the outstanding claims liability. The reason for this difference is that the formeris in effect an impairment test used only to test the sufficiency of net premium liabilities whereas the latter is a measurementaccounting policy used in determining the carrying value of the outstanding claims liability.
NOTE 14. INVESTMENTSCONSOLIDATED
2015 2014
$m $m
A. COMPOSITION
I. Interest bearing investments
Cash and short term money held in investment 1,127 2,554
Government and semi-government bonds 2,915 2,248
Corporate bonds and notes 8,158 7,538
Subordinated securities 1,769 1,307
Fixed interest trusts 71 63
Other 85 74
14,125 13,784
II. Equity investments
a. DIRECT EQUITIES
Listed 598 808
Unlisted 304 119
b. EQUITY TRUSTS (INCLUDING PROPERTY TRUSTS)
Listed 58 69
Unlisted 182 426
1,142 1,422
III. Other investments
Other trusts 268 158
268 158
IV. Derivatives
Investment related derivatives - 13
- 13
15,535 15,377
The Group's equity investments include the exposure to convertible securities.
As at 30 June 2014 $728 million of other interest bearing securities have been reclassified to corporate bonds and notes within theabove disclosure to conform to the current year's presentation.
B. DETERMINATION OF FAIR VALUEThe table below separates the total investments balance based on a hierarchy that reflects the significance of the inputs used in thedetermination of fair value. The fair value hierarchy is determined using the following levels:
I. Level 1 quoted pricesQuoted prices (unadjusted) in active markets for identical assets and liabilities are used.
75
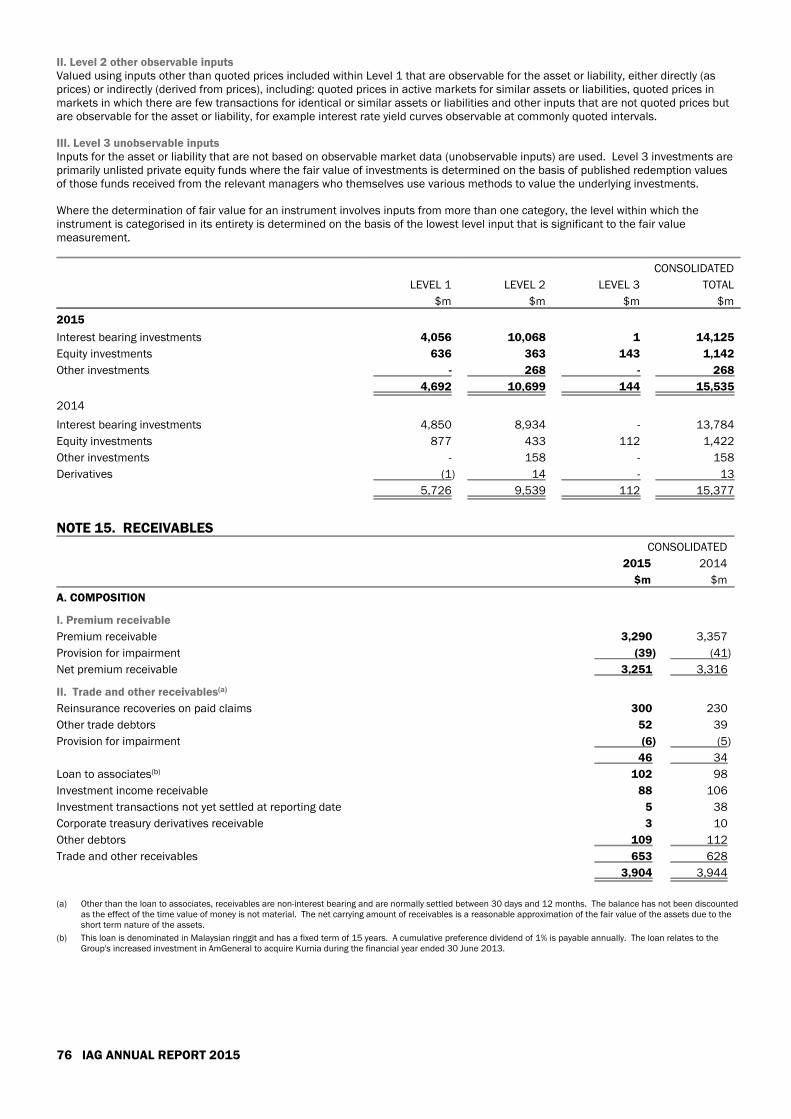
II. Level 2 other observable inputsValued using inputs other than quoted prices included within Level 1 that are observable for the asset or liability, either directly (asprices) or indirectly (derived from prices), including: quoted prices in active markets for similar assets or liabilities, quoted prices inmarkets in which there are few transactions for identical or similar assets or liabilities and other inputs that are not quoted prices butare observable for the asset or liability, for example interest rate yield curves observable at commonly quoted intervals.
III. Level 3 unobservable inputsInputs for the asset or liability that are not based on observable market data (unobservable inputs) are used. Level 3 investments areprimarily unlisted private equity funds where the fair value of investments is determined on the basis of published redemption valuesof those funds received from the relevant managers who themselves use various methods to value the underlying investments.
Where the determination of fair value for an instrument involves inputs from more than one category, the level within which theinstrument is categorised in its entirety is determined on the basis of the lowest level input that is significant to the fair valuemeasurement.
CONSOLIDATED
LEVEL 1 LEVEL 2 LEVEL 3 TOTAL
$m $m $m $m
2015
Interest bearing investments 4,056 10,068 1 14,125
Equity investments 636 363 143 1,142
Other investments - 268 - 268
4,692 10,699 144 15,535
2014
Interest bearing investments 4,850 8,934 - 13,784
Equity investments 877 433 112 1,422
Other investments - 158 - 158
Derivatives (1) 14 - 13
5,726 9,539 112 15,377
NOTE 15. RECEIVABLESCONSOLIDATED
2015 2014
$m $m
A. COMPOSITION
I. Premium receivable
Premium receivable 3,290 3,357
Provision for impairment (39) (41)
Net premium receivable 3,251 3,316
II. Trade and other receivables(a)
Reinsurance recoveries on paid claims 300 230
Other trade debtors 52 39
Provision for impairment (6) (5)
46 34
Loan to associates(b) 102 98
Investment income receivable 88 106
Investment transactions not yet settled at reporting date 5 38
Corporate treasury derivatives receivable 3 10
Other debtors 109 112
Trade and other receivables 653 628
3,904 3,944
(a) Other than the loan to associates, receivables are non-interest bearing and are normally settled between 30 days and 12 months. The balance has not been discountedas the effect of the time value of money is not material. The net carrying amount of receivables is a reasonable approximation of the fair value of the assets due to theshort term nature of the assets.
(b) This loan is denominated in Malaysian ringgit and has a fixed term of 15 years. A cumulative preference dividend of 1% is payable annually. The loan relates to theGroup's increased investment in AmGeneral to acquire Kurnia during the financial year ended 30 June 2013.
76 IAG ANNUAL REPORT 2015
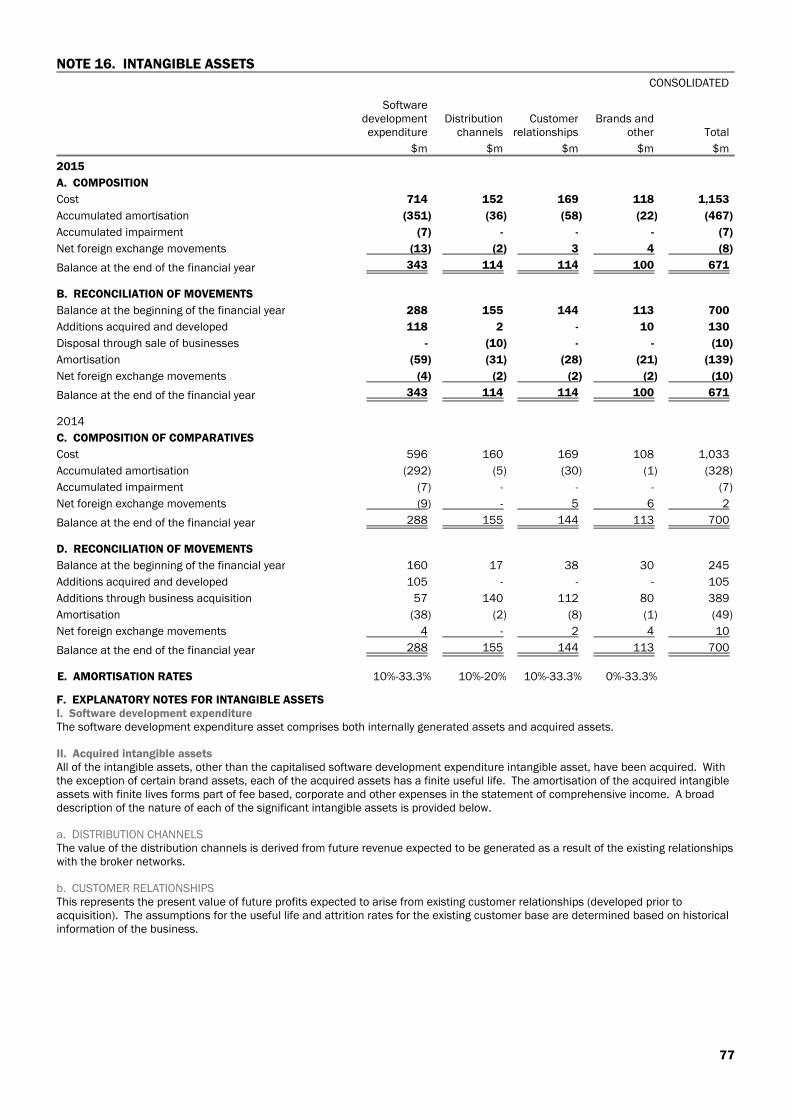
NOTE 16. INTANGIBLE ASSETSCONSOLIDATED
Softwaredevelopmentexpenditure
Distributionchannels
Customerrelationships
Brands andother Total
$m $m $m $m $m
2015
A. COMPOSITION
Cost 714 152 169 118 1,153
Accumulated amortisation (351) (36) (58) (22) (467)
Accumulated impairment (7) - - - (7)
Net foreign exchange movements (13) (2) 3 4 (8)
Balance at the end of the financial year 343 114 114 100 671
B. RECONCILIATION OF MOVEMENTS
Balance at the beginning of the financial year 288 155 144 113 700
Additions acquired and developed 118 2 - 10 130
Disposal through sale of businesses - (10) - - (10)
Amortisation (59) (31) (28) (21) (139)
Net foreign exchange movements (4) (2) (2) (2) (10)
Balance at the end of the financial year 343 114 114 100 671
2014
C. COMPOSITION OF COMPARATIVES
Cost 596 160 169 108 1,033
Accumulated amortisation (292) (5) (30) (1) (328)
Accumulated impairment (7) - - - (7)
Net foreign exchange movements (9) - 5 6 2
Balance at the end of the financial year 288 155 144 113 700
D. RECONCILIATION OF MOVEMENTS
Balance at the beginning of the financial year 160 17 38 30 245
Additions acquired and developed 105 - - - 105
Additions through business acquisition 57 140 112 80 389
Amortisation (38) (2) (8) (1) (49)
Net foreign exchange movements 4 - 2 4 10
Balance at the end of the financial year 288 155 144 113 700
E. AMORTISATION RATES 10%-33.3% 10%-20% 10%-33.3% 0%-33.3%
F. EXPLANATORY NOTES FOR INTANGIBLE ASSETSI. Software development expenditureThe software development expenditure asset comprises both internally generated assets and acquired assets.
II. Acquired intangible assetsAll of the intangible assets, other than the capitalised software development expenditure intangible asset, have been acquired. Withthe exception of certain brand assets, each of the acquired assets has a finite useful life. The amortisation of the acquired intangibleassets with finite lives forms part of fee based, corporate and other expenses in the statement of comprehensive income. A broaddescription of the nature of each of the significant intangible assets is provided below.
a. DISTRIBUTION CHANNELSThe value of the distribution channels is derived from future revenue expected to be generated as a result of the existing relationshipswith the broker networks.
b. CUSTOMER RELATIONSHIPSThis represents the present value of future profits expected to arise from existing customer relationships (developed prior toacquisition). The assumptions for the useful life and attrition rates for the existing customer base are determined based on historicalinformation of the business.
77
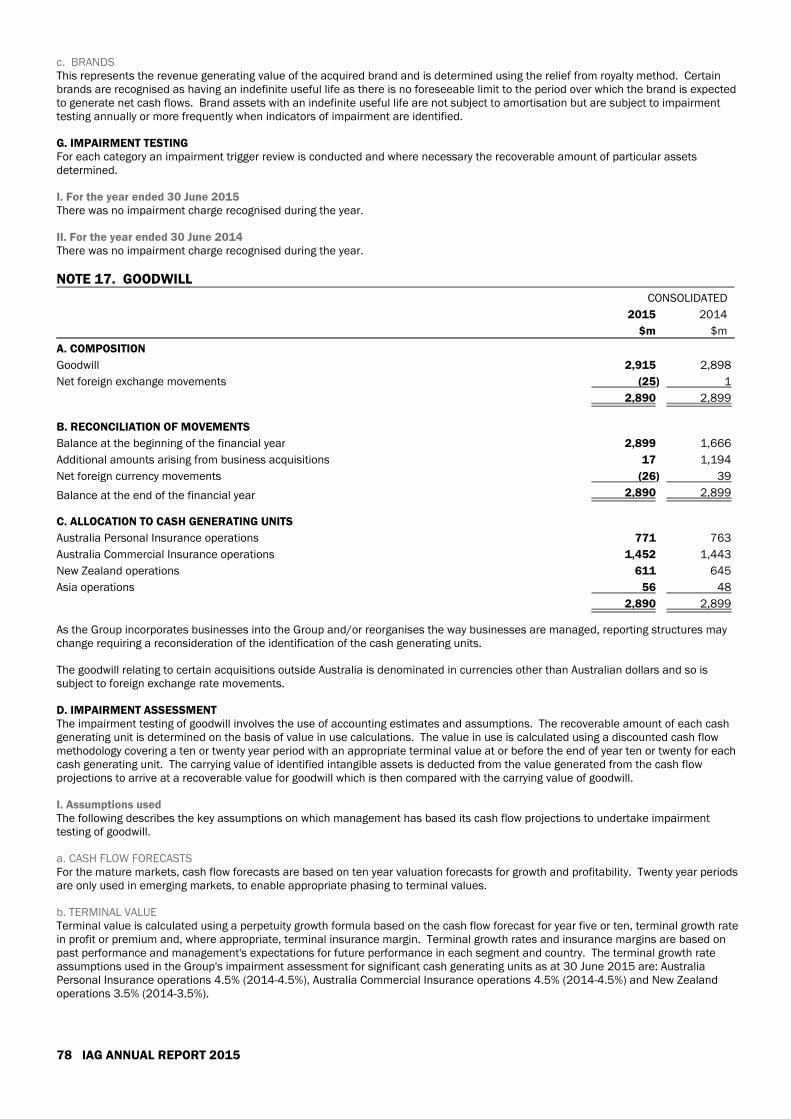
c. BRANDSThis represents the revenue generating value of the acquired brand and is determined using the relief from royalty method. Certainbrands are recognised as having an indefinite useful life as there is no foreseeable limit to the period over which the brand is expectedto generate net cash flows. Brand assets with an indefinite useful life are not subject to amortisation but are subject to impairmenttesting annually or more frequently when indicators of impairment are identified.
G. IMPAIRMENT TESTINGFor each category an impairment trigger review is conducted and where necessary the recoverable amount of particular assetsdetermined.
I. For the year ended 30 June 2015There was no impairment charge recognised during the year.
II. For the year ended 30 June 2014There was no impairment charge recognised during the year.
NOTE 17. GOODWILLCONSOLIDATED
2015 2014
$m $m
A. COMPOSITION
Goodwill 2,915 2,898
Net foreign exchange movements (25) 1
2,890 2,899
B. RECONCILIATION OF MOVEMENTS
Balance at the beginning of the financial year 2,899 1,666
Additional amounts arising from business acquisitions 17 1,194
Net foreign currency movements (26) 39
Balance at the end of the financial year 2,890 2,899
C. ALLOCATION TO CASH GENERATING UNITS
Australia Personal Insurance operations 771 763
Australia Commercial Insurance operations 1,452 1,443
New Zealand operations 611 645
Asia operations 56 48
2,890 2,899
As the Group incorporates businesses into the Group and/or reorganises the way businesses are managed, reporting structures maychange requiring a reconsideration of the identification of the cash generating units.
The goodwill relating to certain acquisitions outside Australia is denominated in currencies other than Australian dollars and so issubject to foreign exchange rate movements.
D. IMPAIRMENT ASSESSMENTThe impairment testing of goodwill involves the use of accounting estimates and assumptions. The recoverable amount of each cashgenerating unit is determined on the basis of value in use calculations. The value in use is calculated using a discounted cash flowmethodology covering a ten or twenty year period with an appropriate terminal value at or before the end of year ten or twenty for eachcash generating unit. The carrying value of identified intangible assets is deducted from the value generated from the cash flowprojections to arrive at a recoverable value for goodwill which is then compared with the carrying value of goodwill.
I. Assumptions usedThe following describes the key assumptions on which management has based its cash flow projections to undertake impairmenttesting of goodwill.
a. CASH FLOW FORECASTSFor the mature markets, cash flow forecasts are based on ten year valuation forecasts for growth and profitability. Twenty year periodsare only used in emerging markets, to enable appropriate phasing to terminal values.
b. TERMINAL VALUETerminal value is calculated using a perpetuity growth formula based on the cash flow forecast for year five or ten, terminal growth ratein profit or premium and, where appropriate, terminal insurance margin. Terminal growth rates and insurance margins are based onpast performance and management's expectations for future performance in each segment and country. The terminal growth rateassumptions used in the Group's impairment assessment for significant cash generating units as at 30 June 2015 are: AustraliaPersonal Insurance operations 4.5% (2014-4.5%), Australia Commercial Insurance operations 4.5% (2014-4.5%) and New Zealandoperations 3.5% (2014-3.5%).
78 IAG ANNUAL REPORT 2015
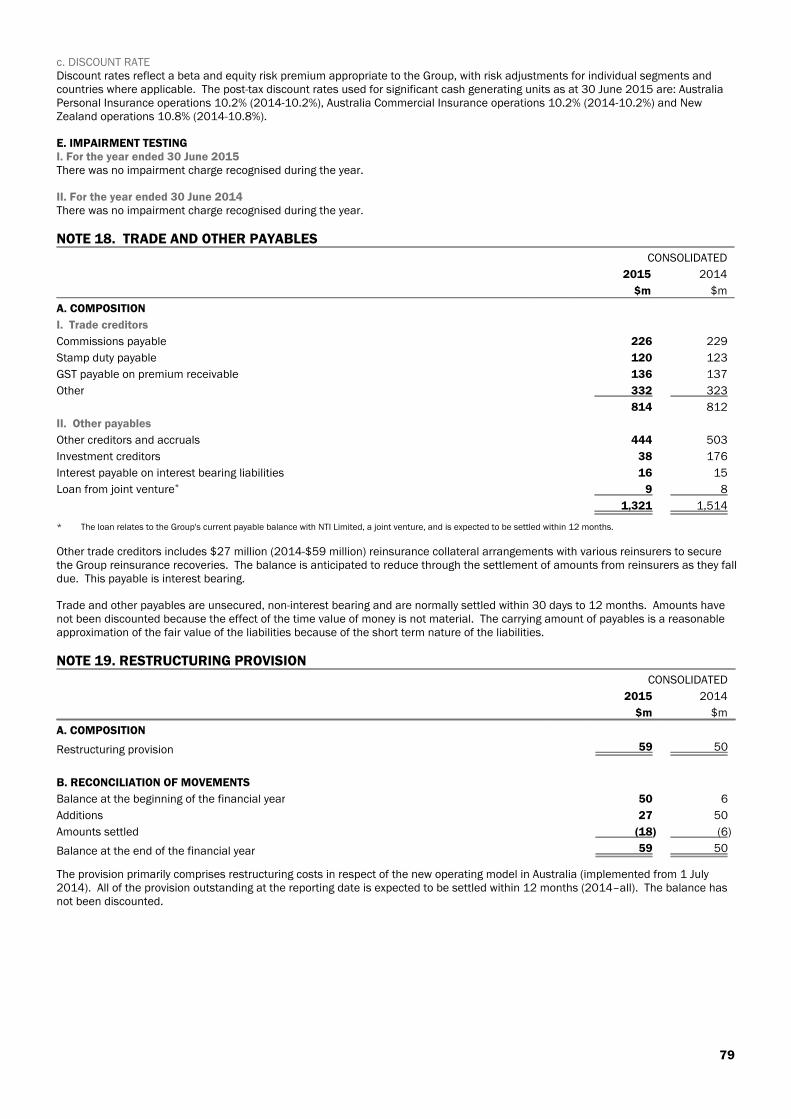
c. DISCOUNT RATEDiscount rates reflect a beta and equity risk premium appropriate to the Group, with risk adjustments for individual segments andcountries where applicable. The post-tax discount rates used for significant cash generating units as at 30 June 2015 are: AustraliaPersonal Insurance operations 10.2% (2014-10.2%), Australia Commercial Insurance operations 10.2% (2014-10.2%) and NewZealand operations 10.8% (2014-10.8%).
E. IMPAIRMENT TESTINGI. For the year ended 30 June 2015There was no impairment charge recognised during the year.
II. For the year ended 30 June 2014There was no impairment charge recognised during the year.
NOTE 18. TRADE AND OTHER PAYABLESCONSOLIDATED
2015 2014
$m $m
A. COMPOSITION
I. Trade creditors
Commissions payable 226 229
Stamp duty payable 120 123
GST payable on premium receivable 136 137
Other 332 323
814 812
II. Other payables
Other creditors and accruals 444 503
Investment creditors 38 176
Interest payable on interest bearing liabilities 16 15
Loan from joint venture* 9 8
1,321 1,514
* The loan relates to the Group's current payable balance with NTI Limited, a joint venture, and is expected to be settled within 12 months.
Other trade creditors includes $27 million (2014-$59 million) reinsurance collateral arrangements with various reinsurers to securethe Group reinsurance recoveries. The balance is anticipated to reduce through the settlement of amounts from reinsurers as they falldue. This payable is interest bearing.
Trade and other payables are unsecured, non-interest bearing and are normally settled within 30 days to 12 months. Amounts havenot been discounted because the effect of the time value of money is not material. The carrying amount of payables is a reasonableapproximation of the fair value of the liabilities because of the short term nature of the liabilities.
NOTE 19. RESTRUCTURING PROVISIONCONSOLIDATED
2015 2014
$m $m
A. COMPOSITION
Restructuring provision 59 50
B. RECONCILIATION OF MOVEMENTS
Balance at the beginning of the financial year 50 6
Additions 27 50
Amounts settled (18) (6)
Balance at the end of the financial year 59 50
The provision primarily comprises restructuring costs in respect of the new operating model in Australia (implemented from 1 July2014). All of the provision outstanding at the reporting date is expected to be settled within 12 months (2014–all). The balance hasnot been discounted.
79
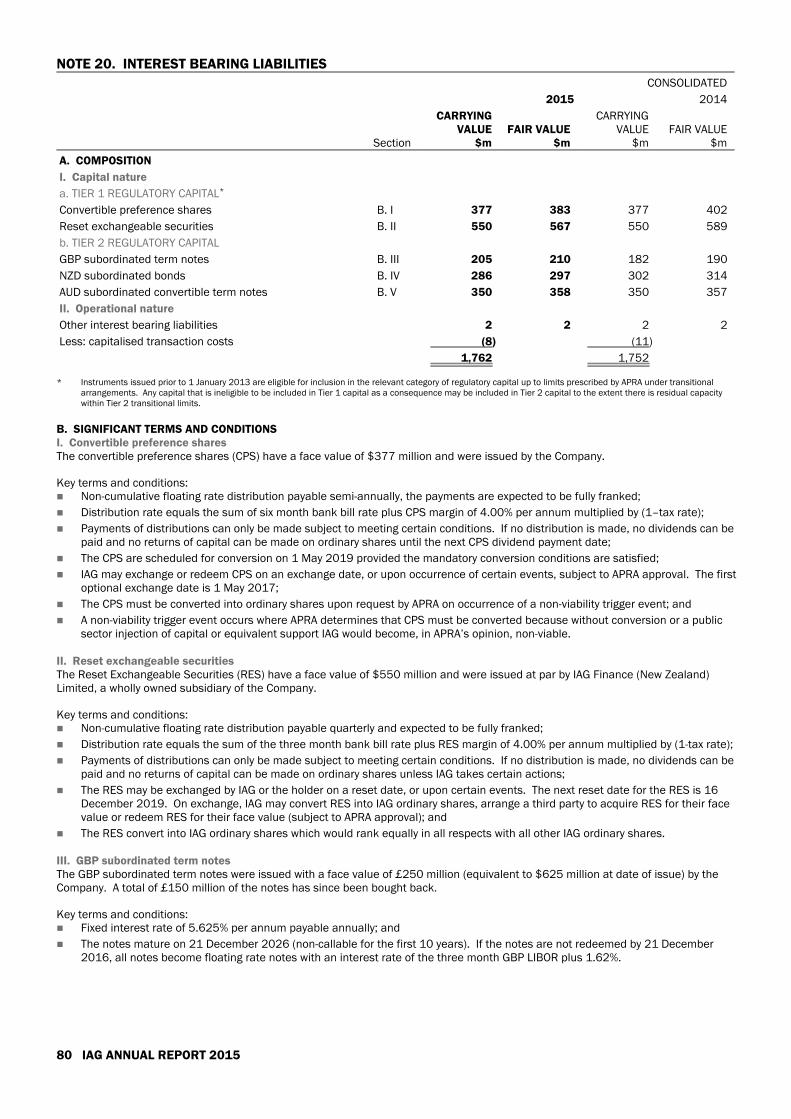
NOTE 20. INTEREST BEARING LIABILITIESCONSOLIDATED
2015 2014
Section
CARRYINGVALUE
$mFAIR VALUE
$m
CARRYINGVALUE
$mFAIR VALUE
$m
A. COMPOSITION
I. Capital nature
a. TIER 1 REGULATORY CAPITAL*
Convertible preference shares B. I 377 383 377 402
Reset exchangeable securities B. II 550 567 550 589
b. TIER 2 REGULATORY CAPITAL
GBP subordinated term notes B. III 205 210 182 190
NZD subordinated bonds B. IV 286 297 302 314
AUD subordinated convertible term notes B. V 350 358 350 357
II. Operational nature
Other interest bearing liabilities 2 2 2 2
Less: capitalised transaction costs (8) (11)
1,762 1,752
* Instruments issued prior to 1 January 2013 are eligible for inclusion in the relevant category of regulatory capital up to limits prescribed by APRA under transitionalarrangements. Any capital that is ineligible to be included in Tier 1 capital as a consequence may be included in Tier 2 capital to the extent there is residual capacitywithin Tier 2 transitional limits.
B. SIGNIFICANT TERMS AND CONDITIONSI. Convertible preference shares The convertible preference shares (CPS) have a face value of $377 million and were issued by the Company.
Key terms and conditions: Non-cumulative floating rate distribution payable semi-annually, the payments are expected to be fully franked;
Distribution rate equals the sum of six month bank bill rate plus CPS margin of 4.00% per annum multiplied by (1–tax rate);
Payments of distributions can only be made subject to meeting certain conditions. If no distribution is made, no dividends can bepaid and no returns of capital can be made on ordinary shares until the next CPS dividend payment date;
The CPS are scheduled for conversion on 1 May 2019 provided the mandatory conversion conditions are satisfied;
IAG may exchange or redeem CPS on an exchange date, or upon occurrence of certain events, subject to APRA approval. The firstoptional exchange date is 1 May 2017;
The CPS must be converted into ordinary shares upon request by APRA on occurrence of a non-viability trigger event; and
A non-viability trigger event occurs where APRA determines that CPS must be converted because without conversion or a publicsector injection of capital or equivalent support IAG would become, in APRA’s opinion, non-viable.
II. Reset exchangeable securitiesThe Reset Exchangeable Securities (RES) have a face value of $550 million and were issued at par by IAG Finance (New Zealand)Limited, a wholly owned subsidiary of the Company.
Key terms and conditions: Non-cumulative floating rate distribution payable quarterly and expected to be fully franked;
Distribution rate equals the sum of the three month bank bill rate plus RES margin of 4.00% per annum multiplied by (1-tax rate);
Payments of distributions can only be made subject to meeting certain conditions. If no distribution is made, no dividends can bepaid and no returns of capital can be made on ordinary shares unless IAG takes certain actions;
The RES may be exchanged by IAG or the holder on a reset date, or upon certain events. The next reset date for the RES is 16December 2019. On exchange, IAG may convert RES into IAG ordinary shares, arrange a third party to acquire RES for their facevalue or redeem RES for their face value (subject to APRA approval); and
The RES convert into IAG ordinary shares which would rank equally in all respects with all other IAG ordinary shares.
III. GBP subordinated term notesThe GBP subordinated term notes were issued with a face value of £250 million (equivalent to $625 million at date of issue) by theCompany. A total of £150 million of the notes has since been bought back.
Key terms and conditions: Fixed interest rate of 5.625% per annum payable annually; and
The notes mature on 21 December 2026 (non-callable for the first 10 years). If the notes are not redeemed by 21 December2016, all notes become floating rate notes with an interest rate of the three month GBP LIBOR plus 1.62%.
80 IAG ANNUAL REPORT 2015
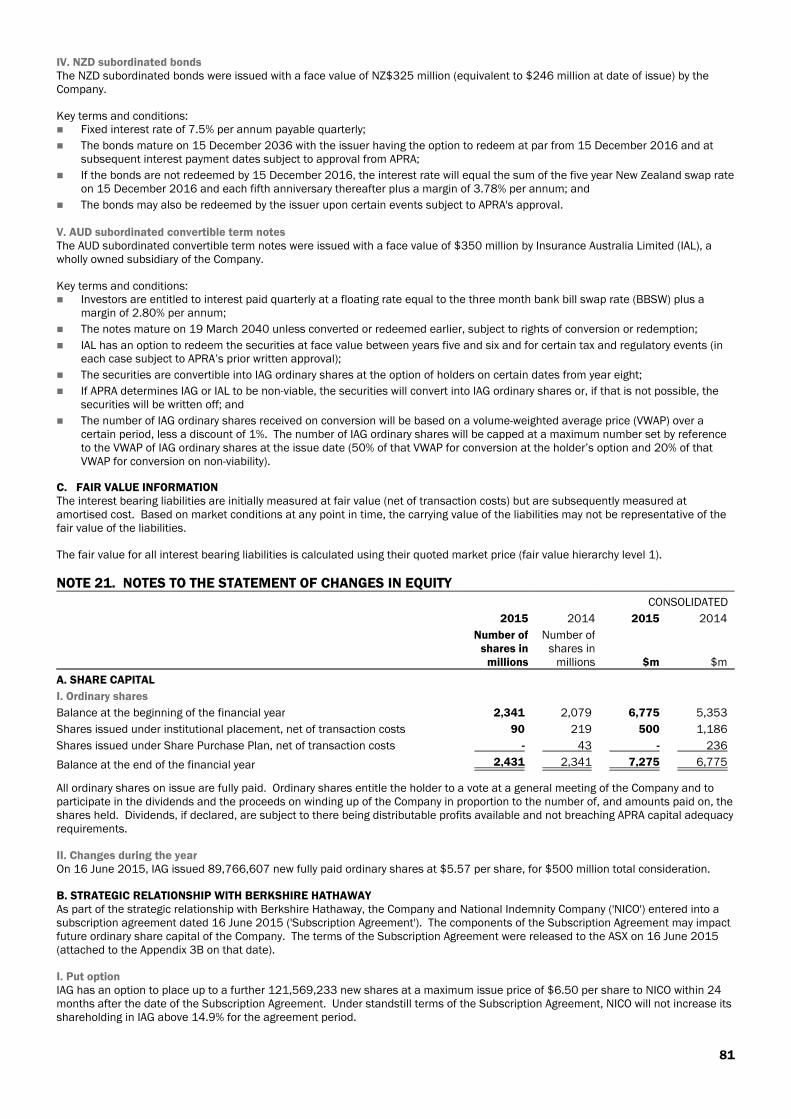
IV. NZD subordinated bondsThe NZD subordinated bonds were issued with a face value of NZ$325 million (equivalent to $246 million at date of issue) by theCompany.
Key terms and conditions: Fixed interest rate of 7.5% per annum payable quarterly;
The bonds mature on 15 December 2036 with the issuer having the option to redeem at par from 15 December 2016 and atsubsequent interest payment dates subject to approval from APRA;
If the bonds are not redeemed by 15 December 2016, the interest rate will equal the sum of the five year New Zealand swap rateon 15 December 2016 and each fifth anniversary thereafter plus a margin of 3.78% per annum; and
The bonds may also be redeemed by the issuer upon certain events subject to APRA's approval.
V. AUD subordinated convertible term notesThe AUD subordinated convertible term notes were issued with a face value of $350 million by Insurance Australia Limited (IAL), awholly owned subsidiary of the Company.
Key terms and conditions: Investors are entitled to interest paid quarterly at a floating rate equal to the three month bank bill swap rate (BBSW) plus a
margin of 2.80% per annum;
The notes mature on 19 March 2040 unless converted or redeemed earlier, subject to rights of conversion or redemption;
IAL has an option to redeem the securities at face value between years five and six and for certain tax and regulatory events (ineach case subject to APRA’s prior written approval);
The securities are convertible into IAG ordinary shares at the option of holders on certain dates from year eight;
If APRA determines IAG or IAL to be non-viable, the securities will convert into IAG ordinary shares or, if that is not possible, thesecurities will be written off; and
The number of IAG ordinary shares received on conversion will be based on a volume-weighted average price (VWAP) over acertain period, less a discount of 1%. The number of IAG ordinary shares will be capped at a maximum number set by referenceto the VWAP of IAG ordinary shares at the issue date (50% of that VWAP for conversion at the holder’s option and 20% of thatVWAP for conversion on non-viability).
C. FAIR VALUE INFORMATIONThe interest bearing liabilities are initially measured at fair value (net of transaction costs) but are subsequently measured atamortised cost. Based on market conditions at any point in time, the carrying value of the liabilities may not be representative of thefair value of the liabilities.
The fair value for all interest bearing liabilities is calculated using their quoted market price (fair value hierarchy level 1).
NOTE 21. NOTES TO THE STATEMENT OF CHANGES IN EQUITYCONSOLIDATED
2015 2014 2015 2014
Number ofshares in
millions
Number ofshares in
millions $m $m
A. SHARE CAPITAL
I. Ordinary shares
Balance at the beginning of the financial year 2,341 2,079 6,775 5,353
Shares issued under institutional placement, net of transaction costs 90 219 500 1,186
Shares issued under Share Purchase Plan, net of transaction costs - 43 - 236
Balance at the end of the financial year 2,431 2,341 7,275 6,775
All ordinary shares on issue are fully paid. Ordinary shares entitle the holder to a vote at a general meeting of the Company and toparticipate in the dividends and the proceeds on winding up of the Company in proportion to the number of, and amounts paid on, theshares held. Dividends, if declared, are subject to there being distributable profits available and not breaching APRA capital adequacyrequirements.
II. Changes during the year On 16 June 2015, IAG issued 89,766,607 new fully paid ordinary shares at $5.57 per share, for $500 million total consideration.
B. STRATEGIC RELATIONSHIP WITH BERKSHIRE HATHAWAYAs part of the strategic relationship with Berkshire Hathaway, the Company and National Indemnity Company ('NICO') entered into asubscription agreement dated 16 June 2015 ('Subscription Agreement'). The components of the Subscription Agreement may impactfuture ordinary share capital of the Company. The terms of the Subscription Agreement were released to the ASX on 16 June 2015(attached to the Appendix 3B on that date).
I. Put optionIAG has an option to place up to a further 121,569,233 new shares at a maximum issue price of $6.50 per share to NICO within 24months after the date of the Subscription Agreement. Under standstill terms of the Subscription Agreement, NICO will not increase itsshareholding in IAG above 14.9% for the agreement period.
81
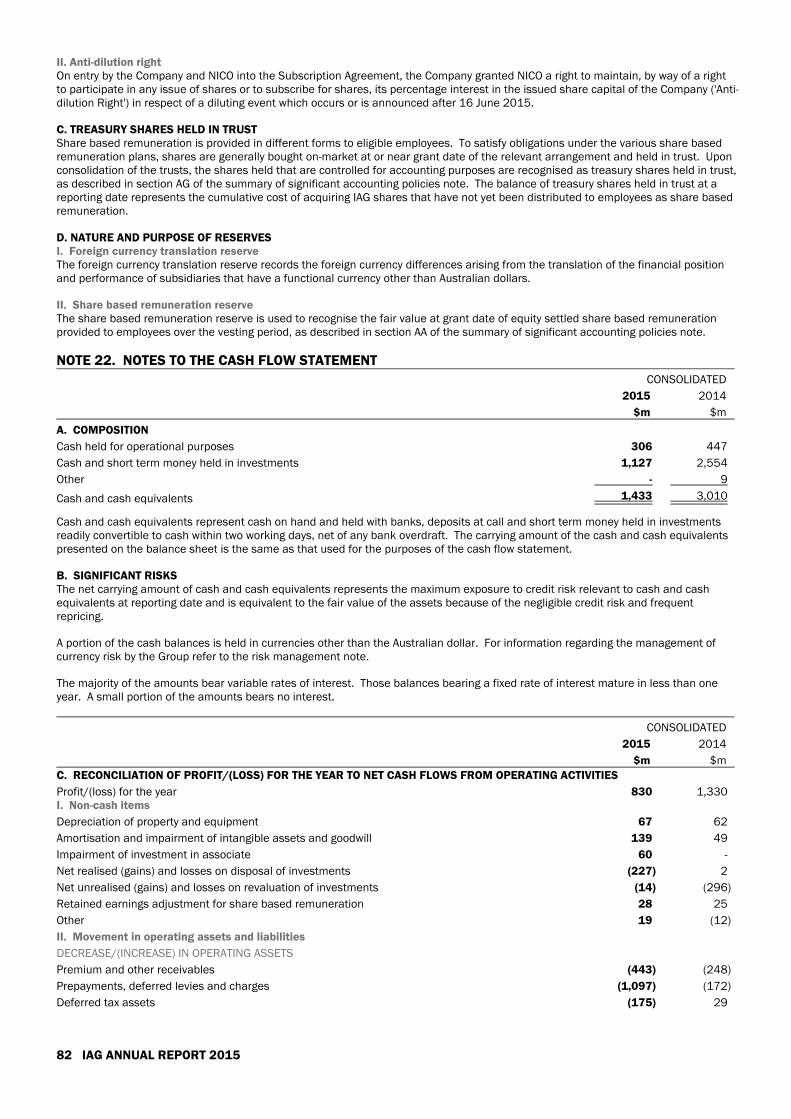
II. Anti-dilution rightOn entry by the Company and NICO into the Subscription Agreement, the Company granted NICO a right to maintain, by way of a rightto participate in any issue of shares or to subscribe for shares, its percentage interest in the issued share capital of the Company ('Anti-dilution Right') in respect of a diluting event which occurs or is announced after 16 June 2015.
C. TREASURY SHARES HELD IN TRUSTShare based remuneration is provided in different forms to eligible employees. To satisfy obligations under the various share basedremuneration plans, shares are generally bought on-market at or near grant date of the relevant arrangement and held in trust. Uponconsolidation of the trusts, the shares held that are controlled for accounting purposes are recognised as treasury shares held in trust,as described in section AG of the summary of significant accounting policies note. The balance of treasury shares held in trust at areporting date represents the cumulative cost of acquiring IAG shares that have not yet been distributed to employees as share basedremuneration.
D. NATURE AND PURPOSE OF RESERVESI. Foreign currency translation reserveThe foreign currency translation reserve records the foreign currency differences arising from the translation of the financial positionand performance of subsidiaries that have a functional currency other than Australian dollars.
II. Share based remuneration reserveThe share based remuneration reserve is used to recognise the fair value at grant date of equity settled share based remunerationprovided to employees over the vesting period, as described in section AA of the summary of significant accounting policies note.
NOTE 22. NOTES TO THE CASH FLOW STATEMENTCONSOLIDATED
2015 2014
$m $m
A. COMPOSITION
Cash held for operational purposes 306 447
Cash and short term money held in investments 1,127 2,554
Other - 9
Cash and cash equivalents 1,433 3,010
Cash and cash equivalents represent cash on hand and held with banks, deposits at call and short term money held in investmentsreadily convertible to cash within two working days, net of any bank overdraft. The carrying amount of the cash and cash equivalentspresented on the balance sheet is the same as that used for the purposes of the cash flow statement.
B. SIGNIFICANT RISKSThe net carrying amount of cash and cash equivalents represents the maximum exposure to credit risk relevant to cash and cashequivalents at reporting date and is equivalent to the fair value of the assets because of the negligible credit risk and frequentrepricing.
A portion of the cash balances is held in currencies other than the Australian dollar. For information regarding the management ofcurrency risk by the Group refer to the risk management note.
The majority of the amounts bear variable rates of interest. Those balances bearing a fixed rate of interest mature in less than oneyear. A small portion of the amounts bears no interest.
CONSOLIDATED
2015 2014
$m $mC. RECONCILIATION OF PROFIT/(LOSS) FOR THE YEAR TO NET CASH FLOWS FROM OPERATING ACTIVITIES
Profit/(loss) for the year 830 1,330I. Non-cash items
Depreciation of property and equipment 67 62
Amortisation and impairment of intangible assets and goodwill 139 49
Impairment of investment in associate 60 -
Net realised (gains) and losses on disposal of investments (227) 2
Net unrealised (gains) and losses on revaluation of investments (14) (296)
Retained earnings adjustment for share based remuneration 28 25
Other 19 (12)
II. Movement in operating assets and liabilities
DECREASE/(INCREASE) IN OPERATING ASSETS
Premium and other receivables (443) (248)
Prepayments, deferred levies and charges (1,097) (172)
Deferred tax assets (175) 29
82 IAG ANNUAL REPORT 2015
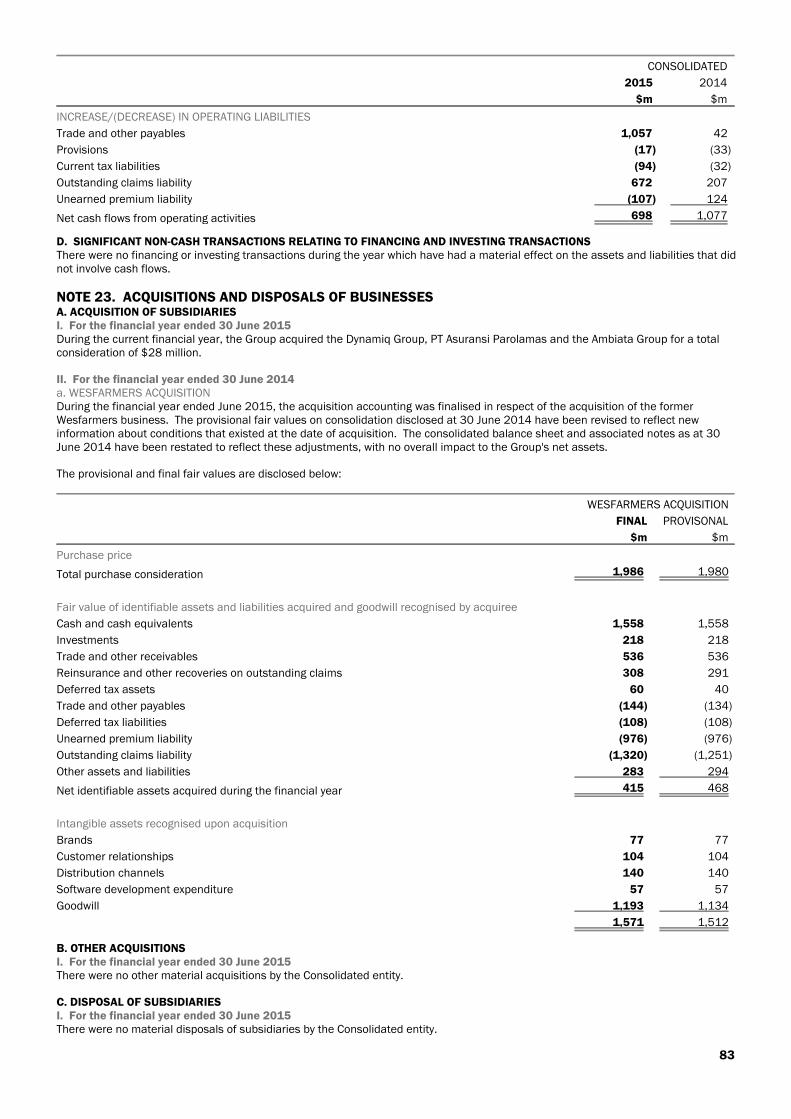
CONSOLIDATED
2015 2014
$m $m
INCREASE/(DECREASE) IN OPERATING LIABILITIES
Trade and other payables 1,057 42
Provisions (17) (33)
Current tax liabilities (94) (32)
Outstanding claims liability 672 207
Unearned premium liability (107) 124
Net cash flows from operating activities 698 1,077
D. SIGNIFICANT NON-CASH TRANSACTIONS RELATING TO FINANCING AND INVESTING TRANSACTIONSThere were no financing or investing transactions during the year which have had a material effect on the assets and liabilities that didnot involve cash flows.
NOTE 23. ACQUISITIONS AND DISPOSALS OF BUSINESSESA. ACQUISITION OF SUBSIDIARIESI. For the financial year ended 30 June 2015During the current financial year, the Group acquired the Dynamiq Group, PT Asuransi Parolamas and the Ambiata Group for a totalconsideration of $28 million.
II. For the financial year ended 30 June 2014a. WESFARMERS ACQUISITIONDuring the financial year ended June 2015, the acquisition accounting was finalised in respect of the acquisition of the formerWesfarmers business. The provisional fair values on consolidation disclosed at 30 June 2014 have been revised to reflect newinformation about conditions that existed at the date of acquisition. The consolidated balance sheet and associated notes as at 30June 2014 have been restated to reflect these adjustments, with no overall impact to the Group's net assets.
The provisional and final fair values are disclosed below:
WESFARMERS ACQUISITION
FINAL PROVISONAL
$m $m
Purchase price
Total purchase consideration 1,986 1,980
Fair value of identifiable assets and liabilities acquired and goodwill recognised by acquiree
Cash and cash equivalents 1,558 1,558
Investments 218 218
Trade and other receivables 536 536
Reinsurance and other recoveries on outstanding claims 308 291
Deferred tax assets 60 40
Trade and other payables (144) (134)
Deferred tax liabilities (108) (108)
Unearned premium liability (976) (976)
Outstanding claims liability (1,320) (1,251)
Other assets and liabilities 283 294
Net identifiable assets acquired during the financial year 415 468
Intangible assets recognised upon acquisition
Brands 77 77
Customer relationships 104 104
Distribution channels 140 140
Software development expenditure 57 57
Goodwill 1,193 1,134
1,571 1,512
B. OTHER ACQUISITIONSI. For the financial year ended 30 June 2015There were no other material acquisitions by the Consolidated entity.
C. DISPOSAL OF SUBSIDIARIESI. For the financial year ended 30 June 2015There were no material disposals of subsidiaries by the Consolidated entity.
83
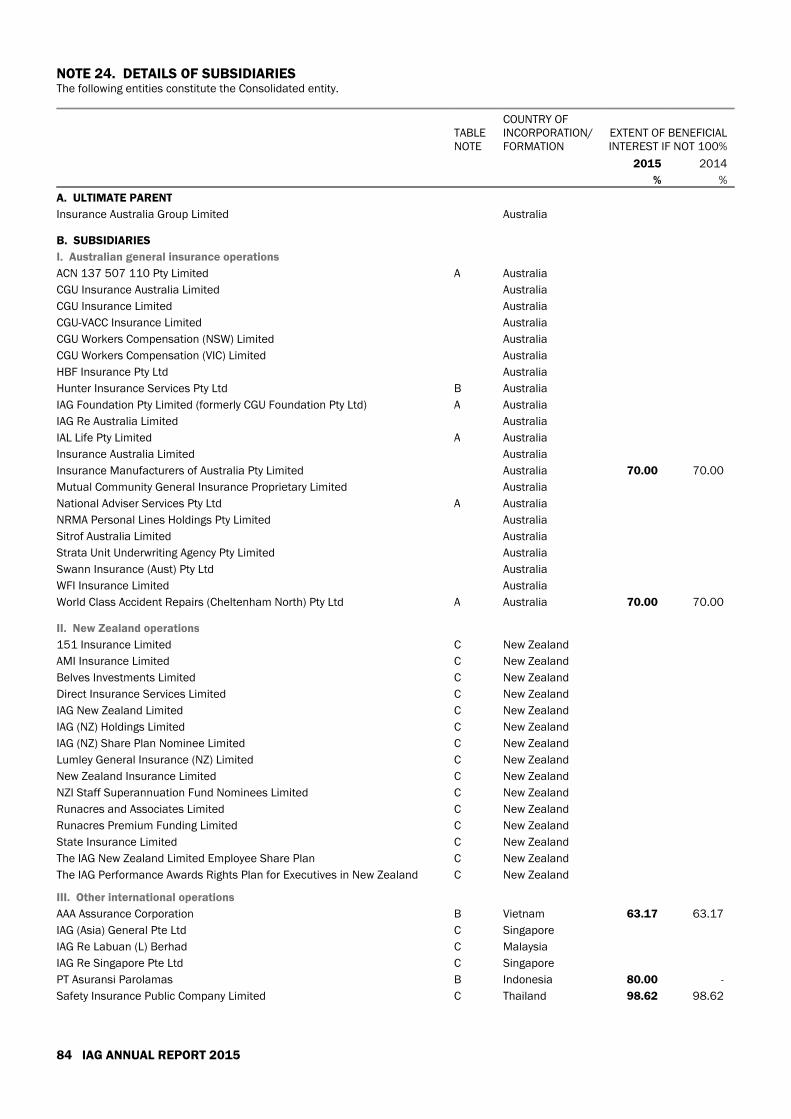
NOTE 24. DETAILS OF SUBSIDIARIESThe following entities constitute the Consolidated entity.
TABLENOTE
COUNTRY OFINCORPORATION/FORMATION
EXTENT OF BENEFICIALINTEREST IF NOT 100%
2015 2014
% %
A. ULTIMATE PARENT
Insurance Australia Group Limited Australia
B. SUBSIDIARIES
I. Australian general insurance operations
ACN 137 507 110 Pty Limited A Australia
CGU Insurance Australia Limited Australia
CGU Insurance Limited Australia
CGU-VACC Insurance Limited Australia
CGU Workers Compensation (NSW) Limited Australia
CGU Workers Compensation (VIC) Limited Australia
HBF Insurance Pty Ltd Australia
Hunter Insurance Services Pty Ltd B Australia
IAG Foundation Pty Limited (formerly CGU Foundation Pty Ltd) A Australia
IAG Re Australia Limited Australia
IAL Life Pty Limited A Australia
Insurance Australia Limited Australia
Insurance Manufacturers of Australia Pty Limited Australia 70.00 70.00
Mutual Community General Insurance Proprietary Limited Australia
National Adviser Services Pty Ltd A Australia
NRMA Personal Lines Holdings Pty Limited Australia
Sitrof Australia Limited Australia
Strata Unit Underwriting Agency Pty Limited Australia
Swann Insurance (Aust) Pty Ltd Australia
WFI Insurance Limited Australia
World Class Accident Repairs (Cheltenham North) Pty Ltd A Australia 70.00 70.00
II. New Zealand operations
151 Insurance Limited C New Zealand
AMI Insurance Limited C New Zealand
Belves Investments Limited C New Zealand
Direct Insurance Services Limited C New Zealand
IAG New Zealand Limited C New Zealand
IAG (NZ) Holdings Limited C New Zealand
IAG (NZ) Share Plan Nominee Limited C New Zealand
Lumley General Insurance (NZ) Limited C New Zealand
New Zealand Insurance Limited C New Zealand
NZI Staff Superannuation Fund Nominees Limited C New Zealand
Runacres and Associates Limited C New Zealand
Runacres Premium Funding Limited C New Zealand
State Insurance Limited C New Zealand
The IAG New Zealand Limited Employee Share Plan C New Zealand
The IAG Performance Awards Rights Plan for Executives in New Zealand C New Zealand
III. Other international operations
AAA Assurance Corporation B Vietnam 63.17 63.17
IAG (Asia) General Pte Ltd C Singapore
IAG Re Labuan (L) Berhad C Malaysia
IAG Re Singapore Pte Ltd C Singapore
PT Asuransi Parolamas B Indonesia 80.00 -
Safety Insurance Public Company Limited C Thailand 98.62 98.62
84 IAG ANNUAL REPORT 2015

TABLENOTE
COUNTRY OFINCORPORATION/FORMATION
EXTENT OF BENEFICIALINTEREST IF NOT 100%
2015 2014
% %
IV. Investment operations
Fixed Interest Shareholders Fund A Australia
Fixed Interest Technical Provisions Fund A Australia
IAG Asset Management Alternative Investment Trust A Australia
IAG Asset Management Cash Management Trust A Australia 90.83 86.20
IAG Asset Management Equity Trust A Australia
IAG Asset Management Limited Australia
IAG Asset Management Private Equity Trust A Australia 83.19 83.19
IAG Asset Management Sustainable Investment Trust A Australia 50.01 50.01
K2 Advisors Alpha Strategies Fund A Australia
V. Corporate operations
Ambiata Holdings Pty Ltd A Australia -
Ambiata Pty Ltd A Australia -
Dynamiq LLC USA -
Dynamiq MY SDN BHD Malaysia 60.00 -
Dynamiq People Pty Ltd Australia -
Dynamiq Pty Ltd Australia -
Dynamiq Strategy Pty Ltd Australia 55.00 -
Dynamiq US Pty Ltd Australia -
Empire Equity Australia Pty Ltd A Australia
EMQ Pty Ltd Australia 55.00 -
IAG International Pty Limited Australia
IAG & NRMA Superannuation Pty Limited A Australia
IAG Finance (New Zealand) Limited Australia
IAG Share Plan Nominee Pty Limited A Australia
IAG Share and Rights Plan Trust Australia
IAG UK Holdings Limited C United Kingdom
Insurance Australia Group Services Pty Limited Australia
Lumley Insurance Group Limited Australia
Lumley Technology Pty Ltd Australia
Safety Thailand Holding Pty Limited A Australia
Thailand Insurance Holdings Pty Limited A Australia
WFI Dormant Pty Ltd Australia
WFI Insurance Holdings Pty Ltd Australia
C. ENTITIES IN VOLUNTARY LIQUIDATION AT 30 JUNE 2015
Alba Group Pte Ltd C Singapore -
IAG Insurance (Thailand) Limited C Thailand -
Alba Underwriting Limited United Kingdom - -
AU No 2 Limited United Kingdom - -
B&BHL Limited United Kingdom - -
Diagonal Underwriting Agency Limited United Kingdom - -
EIGL Limited United Kingdom - -
NotesA Small proprietary companies, trusts or funds that are not required to prepare, and have not prepared, audited financial
statements.
B Audited by accounting firms not affiliated with KPMG.
C Audited by overseas KPMG firms.
85
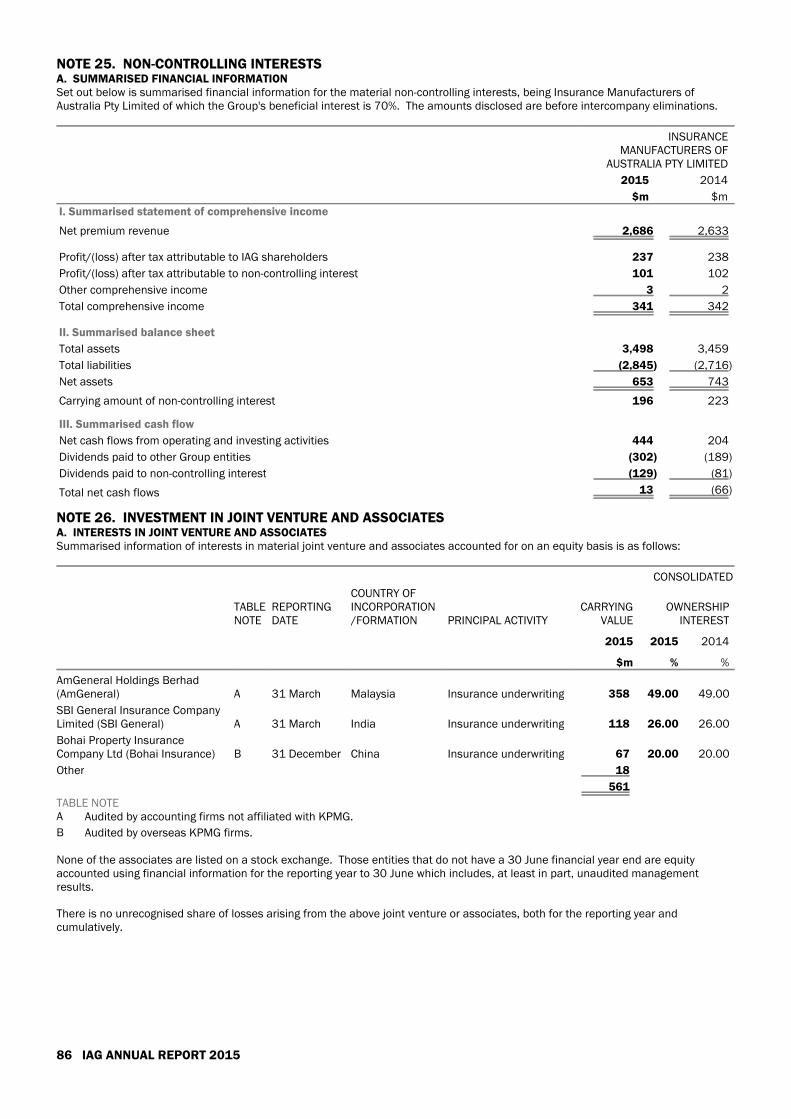
NOTE 25. NON-CONTROLLING INTERESTSA. SUMMARISED FINANCIAL INFORMATIONSet out below is summarised financial information for the material non-controlling interests, being Insurance Manufacturers ofAustralia Pty Limited of which the Group's beneficial interest is 70%. The amounts disclosed are before intercompany eliminations.
INSURANCEMANUFACTURERS OF
AUSTRALIA PTY LIMITED
2015 2014
$m $mI. Summarised statement of comprehensive income
Net premium revenue 2,686 2,633
Profit/(loss) after tax attributable to IAG shareholders 237 238
Profit/(loss) after tax attributable to non-controlling interest 101 102
Other comprehensive income 3 2
Total comprehensive income 341 342
II. Summarised balance sheet
Total assets 3,498 3,459
Total liabilities (2,845) (2,716)
Net assets 653 743
Carrying amount of non-controlling interest 196 223
III. Summarised cash flow
Net cash flows from operating and investing activities 444 204
Dividends paid to other Group entities (302) (189)
Dividends paid to non-controlling interest (129) (81)
Total net cash flows 13 (66)
NOTE 26. INVESTMENT IN JOINT VENTURE AND ASSOCIATESA. INTERESTS IN JOINT VENTURE AND ASSOCIATESSummarised information of interests in material joint venture and associates accounted for on an equity basis is as follows:
CONSOLIDATED
TABLENOTE
REPORTINGDATE
COUNTRY OFINCORPORATION/FORMATION PRINCIPAL ACTIVITY
CARRYINGVALUE
OWNERSHIPINTEREST
2015 2015 2014
$m % %
AmGeneral Holdings Berhad(AmGeneral) A 31 March Malaysia Insurance underwriting 358 49.00 49.00
SBI General Insurance CompanyLimited (SBI General) A 31 March India Insurance underwriting 118 26.00 26.00
Bohai Property InsuranceCompany Ltd (Bohai Insurance) B 31 December China Insurance underwriting 67 20.00 20.00
Other 18
561
TABLE NOTEA
B
Audited by accounting firms not affiliated with KPMG.
Audited by overseas KPMG firms.
None of the associates are listed on a stock exchange. Those entities that do not have a 30 June financial year end are equityaccounted using financial information for the reporting year to 30 June which includes, at least in part, unaudited managementresults.
There is no unrecognised share of losses arising from the above joint venture or associates, both for the reporting year andcumulatively.
86 IAG ANNUAL REPORT 2015

CONSOLIDATED
2015 2014
$m $mB. RECONCILIATION OF MOVEMENTS
Balance at the beginning of the financial year 572 577
Additional investment in existing associate 20 12
Disposal of investment in associate - (7)
Share of associates' net profit/(loss)* 26 12
Impairment of investment in associate (60) -
Net foreign exchange movements 49 (21)
Dividends received (46) (1)
Balance at the end of the financial year 561 572
* The contribution of Asian-based associates to the net profit/(loss) of the Group in the statement of comprehensive income includes regional support and developmentcosts of $20 million (2014-$20 million).
C. SUMMARISED FINANCIAL INFORMATION OF ASSOCIATESThese disclosures relate to the investment in Asia (AmGeneral, SBI General and Bohai Insurance) as all other investments inassociates are not significant.
The summarised financial information is shown on a 100% basis, and is prepared in accordance with IFRS under Group accountingpolicies, for the financial statements for the year ended 31 March 2015 for AmGeneral and SBI General and for the financial yearended 31 December 2014 for Bohai Insurance. Accordingly, the following summarised information represents the financial positionand performance of the entities as a whole and not just IAG's share.
2015 2014
AmGeneralHoldings
Berhad
SBI GeneralInsuranceCompany
Limited
BohaiProperty
InsuranceCompany Ltd
AmGeneralHoldings
Berhad
SBI GeneralInsuranceCompany
Limited
BohaiProperty
InsuranceCompany Ltd
$m $m $m $m $m $m
I. Summarised statement ofcomprehensive income
Revenue 588 345 433 617 236 347
Profit/(loss) after tax 82 (20) (13) 45 (17) (17)
Other comprehensive income 6 - 3 (6) - -
Total comprehensive income 88 (20) (10) 39 (17) (17)
Dividends received from associate 46 - - 1 - -
II. Summarised balance sheet
Total assets 1,939 622 717 1,690 334 634
Total liabilities (1,178) (445) (526) (1,073) (239) (445)
Net assets as at reporting date 761 177 191 617 95 189
Group's ownership interest 373 46 38 302 25 38
Other adjustments* (15) 72 29 50 62 69
Carrying value as at 30 June 358 118 67 352 87 107
* Other adjustments include IFRS adjustments, foreign exchange revaluations, goodwill, intangibles, and share of profit/(loss) from financial statement date to 30 June.
During the year there was a $60 million writedown of the investment in Bohai Insurance. This was influenced by a revision to theexpected cash flows of the business, together with the indicated issue price of new shares in a capital raising in which IAG does notintend to participate. The post-tax discount rate used was 13.5% (2014-13.5%).
87
NOTE 27. EMPLOYEE BENEFITSCONSOLIDATED
2015 2014
$m $mA. EMPLOYEE BENEFITS PROVISION
Annual leave 101 98
Long service leave 90 86
Cash based incentive arrangements 110 106
Defined benefit superannuation plans 16 39
Other employee benefits* 7 8
324 337
* There is one defined benefit pension arrangement in Australia with a discounted liability of $5 million as at the current reporting date (2014-$6 million) involving 50participants (2014-55) and one defined benefit pension arrangement in New Zealand with a discounted liability of $2 million as at the current reporting date (2014-$2 million) involving 32 participants (2014-34). These liabilities are met from general assets rather than assets being set aside in trust.
The employee benefits provision includes $79 million (2014-$95 million) which is expected to be settled after more than 12 monthsfrom reporting date.
B. CASH BASED INCENTIVE ARRANGEMENTSI. Short term incentive planThe short term incentive plan continued in operation during the current reporting year. Eligible employees have the capacity to earn aproportion of their base pay as a cash incentive annually. The incentive opportunity is set depending on an employee's role andresponsibilities. The majority of employees are on a 10%, 15% or 20% plan. The incentive payments are determined based on anassessment of individual performance and achievement of a range of business unit and individual goals.
NOTE 28. SHARE BASED REMUNERATIONThe provision of share based remuneration creates a link between shareholder value creation and rewarding employees. Share basedremuneration encourages employee share ownership, links employee reward to the performance of the Group and assists withretention of key personnel. This encourages employees to focus on creating shareholder value over the longer term.
The obligations under share based payment arrangements are covered by the on-market purchase of IAG ordinary shares which areheld in trust. The shares are purchased on or near grant date at the prevailing market price. The arrangements are managed using in-house trusts, one for Australia and one for New Zealand, which are controlled for accounting purposes and are subsidiaries of theConsolidated entity. The trustee for each trust is a subsidiary of the Consolidated entity. The trusts are administered externally.
The number of shares purchased to cover each allocation of rights is determined by the trustee based on independent actuarialadvice. The trusts allow for excess shares purchased in relation to one plan to be used to meet obligations of the other plans at thetrustee’s discretion. The average price per share at which the shares were purchased during the reporting period was $6.57 (2014-$6.07). The trusts held 14,784,403 shares as at 30 June 2015 (2014-16,547,487 shares) representing 0.61% (2014-0.71%) of theissued share capital. This includes shares that are not controlled for accounting purposes and so not recognised as treasury shares.
Trading in IAG ordinary shares that are awarded under the share based remuneration arrangements is covered by the samerestrictions that apply to all forms of share ownership by employees. These restrictions limit an employee trading in IAG ordinaryshares when they are in a position to be aware, or are aware, of price sensitive information.
Share based remuneration is provided through a range of different plans, each of which has different purposes and different rules.The share based remuneration expense amounts are included in the claims expense, other underwriting expenses and fee based,corporate and other expenses lines in the statement of comprehensive income.
A. SENIOR MANAGEMENT AND EXECUTIVE SHARE PLANSThe senior management and Executive share plan arrangements consist of two separate arrangements working together. These twoarrangements are the Deferred Award Rights Plan (DAR Plan) and Executive Performance Rights Plan (EPR Plan) which are detailedbelow. The PARC approves the participation of each individual in the plans. Certain other share plan arrangements remain in placebut are closed to new offers.
I. Deferred Award Rights PlanThe DAR Plan is the deferred portion of the short term incentive issued as rights over IAG ordinary shares.
Key terms and conditions: The rights are granted for nil consideration, are non-transferable, and can be settled only with existing IAG ordinary shares.
Holders do not receive dividends and do not have voting rights until the rights are exercised;
The vesting condition is not market-related and requires the participant to continue in relevant employment;
Where the rights vest (the holder becomes entitled to exercise the right), the plan entitles participating employees to acquire oneIAG ordinary share for each right. The exercise price of all vested rights is a nominal value of $1 per tranche of rights exercised;
The rights vest after a maximum two year period as determined by the Board subject to the participants continuing in relevantemployment for the full period. If there is a change of control of IAG, the Board has discretion to determine if and when rightsshould vest; and
If the vesting condition is not met then the rights lapse. The rights also lapse where the holder chooses to forgo the rights and allrights expire seven years from grant date where they have not previously lapsed or been exercised.
88 IAG ANNUAL REPORT 2015
The following information relates to the rights issued under the DAR Plan.
GRANT DATE
FAIRVALUE AT
GRANTDATE
RIGHTSON ISSUE AT
1 JULY
RIGHTSGRANTED
DURING THEYEAR
RIGHTSEXERCISED
DURING THEYEAR
RIGHTSLAPSED
DURING THEYEAR
NUMBER OF RIGHTS AT 30JUNE
On issue Exercisable
2015
19/12/2006 $5.354 33,279 - (8,625) - 24,654 24,654
27/09/2007 $4.820 128,020 - (39,200) - 88,820 88,820
18/09/2008 $3.668 276,600 - (74,700) - 201,900 201,900
27/02/2009 $3.397 10,000 - - - 10,000 10,000
25/09/2009 $3.600 108,900 - (33,500) - 75,400 75,400
25/03/2010 $3.780 3,200 - (3,200) - - -
06/10/2010 $3.532 162,540 - (54,320) - 108,220 108,220
03/03/2011 $3.467 4,200 - - - 4,200 4,200
21/10/2011 $2.880 204,600 - (87,850) - 116,750 116,750
26/10/2012 $4.291 1,706,800 - (1,516,150) (6,100) 184,550 184,550
25/02/2013* $5.467 22,950 - (18,950) - 4,000 4,000
25/02/2013* $5.511 10,700 - - - 10,700 10,700
01/11/2013* $5.684 2,358,300 - (1,102,000) (10,700) 1,245,600 119,950
01/11/2013* $5.876 11,200 - - - 11,200 11,200
11/03/2014 $5.083 7,600 - (3,800) - 3,800 -
02/04/2014 $5.216 21,100 - (10,550) - 10,550 -
03/11/2014* $6.028 - 2,382,100 (70,100) (24,400) 2,287,600 6,200
03/11/2014* $6.204 - 5,000 - - 5,000 -
17/03/2015 $5.819 - 4,600 - - 4,600 -
17/03/2015 $5.819 - 1,800 - - 1,800 -
5,069,989 2,393,500 (3,022,945) (41,200) 4,399,344 966,544
* Rights issued on the same grant date may have different fair values to reflect different vesting periods.
2014
19/12/2006 $5.354 51,465 - (18,186) - 33,279 33,279
27/09/2007 $4.820 213,790 - (85,770) - 128,020 128,020
18/09/2008 $3.668 472,820 - (196,220) - 276,600 276,600
27/02/2009 $3.397 10,000 - - - 10,000 10,000
25/09/2009 $3.600 238,280 - (129,380) - 108,900 108,900
25/03/2010 $3.780 6,100 - (2,900) - 3,200 3,200
06/10/2010 $3.532 698,340 - (535,800) - 162,540 162,540
03/03/2011 $3.467 9,600 - (5,400) - 4,200 4,200
21/10/2011 $2.880 1,560,200 - (1,347,600) (8,000) 204,600 204,600
17/02/2012 $2.740 17,800 - (17,800) - - -
26/10/2012* $4.291 3,171,500 - (1,398,400) (66,300) 1,706,800 241,450
26/10/2012* $4.360 13,400 - (13,400) - - -
25/02/2013* $5.467 41,100 - (18,150) - 22,950 5,600
25/02/2013* $5.511 10,700 - - - 10,700 10,700
01/11/2013* $5.684 - 2,431,600 (31,300) (42,000) 2,358,300 -
01/11/2013* $5.876 - 11,200 - - 11,200 -
11/03/2014 $5.083 - 7,600 - - 7,600 -
02/04/2014 $5.216 - 21,100 - - 21,100 -
6,515,095 2,471,500 (3,800,306) (116,300) 5,069,989 1,189,089
* Rights issued on the same grant date may have different fair values to reflect different vesting periods.
The weighted average share price for rights exercised for the year ended 30 June 2015 was $6.08 (2014-$5.74).
The fair value of the rights is calculated as at the grant date using a Black-Scholes valuation model.
89
SIGNIFICANT FACTORS AND ASSUMPTIONS
2015
Grant date 3/11/2014 17/03/2015
Share price on grant date ($) $6.51 $5.99
Exercise price ($) $1 per tranche exercised $1 per tranche exercised
Risk free interest rate (%) 2.80% 2.38%
Expected dividend yield (%) 5.82% 6.31%
Expected life of rights (years) 1 or 2 years 1 or 2 years
2014
Grant date 1/11/2013 11/03/2014 2/04/2014
Share price on grant date ($) $6.13 $5.41 $5.54
Exercise price ($) $1 per tranche exercised $1 per tranche exercised $1 per tranche exercised
Risk free interest rate (%) 3.25% 3.13% 3.24%
Expected dividend yield (%) 5.71% 6.44% 6.63%
Expected life of rights (years) 1 or 2 years 1 or 2 years 1 or 2 years
The volatility assumption has been set considering the Company’s historic share price. Some of the assumptions are based onhistorical data which is not necessarily indicative of future trends. Reasonable changes in these assumptions would not have amaterial impact on the amounts recognised in the financial statements.
II. Executive Performance Rights PlanThe EPR Plan is the Group's long term incentive plan issued as rights over IAG ordinary shares.
Key terms and conditions: The rights are granted for nil consideration, are non-transferable, and for Series 1 to 5 can be settled only with IAG ordinary
shares. From Series 6 onwards, the rights may be settled in cash or IAG ordinary shares, subject to Board discretion. Holders donot receive dividends and do not have voting rights until the rights are exercised.
Where the rights vest (the holder becomes entitled to exercise the right), the EPR Plan entitles participating employees to acquireeither one IAG ordinary share or its equivalent cash value as determined by the Board for each right. There is no exercise price.
Each allocation is split equally into two portions and is subject to different performance hurdles. The first vesting condition is notmarket-related and requires the participant to continue relevant employment. The second set of vesting conditions is as follows:
50% is subject to a return on equity hurdle (ROE allocation); and
50% is subject to a total shareholder return hurdle (TSR allocation).
If a participant ceases employment with IAG before the performance conditions are tested, their unvested rights will generally lapse.
Under the TSR allocation, IAG's TSR is assessed against the TSR of a peer group of entities. For allocations made prior to 30 June2009, the peer group consists of entities in the S&P/ASX 100 Index and for allocations made after 30 June 2009, the peer groupconsists of entities in the top 50 industrials within the S&P/ASX 100 Index. The performance hurdle is set with a tiered vestingscale:
Maximum vesting of 100% if IAG's relative TSR is equal or larger than the 75th percentile of the peer group; or
A vesting of 0% if IAG's TSR is below the 50th percentile of the peer group.
The ROE hurdle compares IAG's performance with IAG's weighted average cost of capital (WACC), where the Board determines theWACC. The tiered vesting scale is:
Maximum vesting of 100% if ROE is larger than 1.6 x WACC; or
A vesting at 0% if ROE is below 1.2 x WACC.
If there is a change of control of IAG, the Board has discretion to determine if and when rights should vest.
90 IAG ANNUAL REPORT 2015

The following information relates to the rights issued under the EPR Plan:
GRANT DATE
FAIR VALUEAT GRANT
DATE (TSR)
FAIR VALUEAT GRANT
DATE (ROE)
RIGHTS ONISSUE AT 1
JULY
RIGHTSGRANTED
DURING THEYEAR
RIGHTSEXERCISED
DURING THEYEAR
RIGHTSLAPSED
DURING THEYEAR
NUMBER OF RIGHTS AT 30JUNE
On issue Exercisable
2015
29/10/2007 $2.870 $4.310 4,100 - - - 4,100 4,100
18/09/2008 $2.530 $3.410 37,015 - (3,265) - 33,750 33,750
25/09/2009 $2.480 $3.480 1,248,830 - (79,330) (1,054,400) 115,100 31,350
24/11/2009 $2.590 $3.650 395,300 - - (395,300) - -
06/10/2010 $2.420 $3.380 242,300 - (175,200) - 67,100 67,100
21/10/2011 $1.860 $2.690 4,675,200 - (4,557,700) (8,500) 109,000 109,000
26/10/2012 $3.046 $4.085 4,888,400 - - - 4,888,400 -
25/02/2013 $3.977 $5.186 4,000 - - - 4,000 -
01/11/2013 $3.036 $5.266 3,221,400 - - - 3,221,400 -
11/03/2014 $1.920 $4.663 20,900 - - - 20,900 -
03/11/2014 $3.018 $5.578 - 3,592,600 - - 3,592,600 -
17/03/2015 $2.161 $5.185 - 83,000 - - 83,000 -
14,737,445 3,675,600 (4,815,495) (1,458,200) 12,139,350 245,300
2014
29/10/2007 $2.870 $4.310 97,940 - (93,840) - 4,100 4,100
13/03/2008 $1.630 $2.710 5,002 - (5,002) - - -
18/09/2008 $2.530 $3.410 1,934,290 - (315,025) (1,582,250) 37,015 37,015
27/02/2009 $2.570 $3.150 127,500 - (2,500) (125,000) - -
25/09/2009 $2.480 $3.480 2,386,676 - (777,346) (360,500) 1,248,830 110,680
24/11/2009 $2.590 $3.650 569,232 - (173,932) - 395,300 -
25/03/2010 $2.460 $3.600 148,608 - (17,908) (130,700) - -
06/10/2010 $2.420 $3.380 3,980,700 - (3,738,400) - 242,300 242,300
03/03/2011 $2.270 $3.300 530,600 - (530,600) - - -
21/10/2011 $1.860 $2.690 4,757,600 - - (82,400) 4,675,200 -
26/10/2012 $3.046 $4.085 4,973,700 - - (85,300) 4,888,400 -
25/02/2013 $3.977 $5.186 4,000 - - - 4,000 -
01/11/2013 $3.036 $5.266 - 3,221,400 - - 3,221,400 -
11/03/2014 $1.920 $4.663 - 20,900 - - 20,900 -
19,515,848 3,242,300 (5,654,553) (2,366,150) 14,737,445 394,095
The weighted average share price for rights exercised for the year ended 30 June 2015 was $6.08 (2014-$5.74).
The fair value of the rights is calculated as at the grant date using Black-Scholes (for ROE performance hurdle) and Monte Carlosimulation (for TSR performance hurdle) models. The valuations take into account the probability of achieving the market relatedperformance hurdle.
The volatility assumption has been set considering the Company’s historic share price. Some of the assumptions, including expectedshare price volatility, are based on historical data which is not necessarily indicative of future trends. Reasonable changes in theseassumptions would not have a material impact on the amounts recognised in the financial statements.
91
SIGNIFICANT FACTORS AND ASSUMPTIONS
2015
Grant date 3/11/2014 17/03/2015
Share price on grant date ($) $6.51 $5.99
Risk free interest rate (%) 2.80% 2.38%
Expected dividend yield (%) 5.82% 6.31%
Expected life of rights (years)* 3 or 4 years 3 or 4 years
2014
Grant date 1/11/2013 11/03/2014
Share price on grant date ($) $6.13 $5.41
Risk free interest rate (%) 5.71% 3.13%
Expected dividend yield (%) 3.25% 6.44%
Expected life of rights (years)* 3 or 4 years 3 or 4 years
* The expected life for the ROE rights is three years and four years for TSR rights.
B. EMPLOYEE SHARE PLANSOffers were made under the employee share plans during the year ended 30 June 2015 in Australia and New Zealand which gaveemployees the opportunity to own a stake in IAG and share in the Group's future success.
Under the plans, shares are purchased under salary sacrifice arrangements, allowing employees to acquire shares in a tax effectivemanner, and IAG contributes towards 10% of the cost of the share purchase. IAG ordinary shares taken up through the plans do notincur any brokerage. The salary sacrifice arrangements and structure of the plans differ between jurisdictions to comply with locallegislation and utilise tax concessions.
NOTE 29. COMMITMENTSCONSOLIDATED
2015 2014
$m $m
OPERATING LEASE COMMITMENTS
I. Property
Due within 1 year 130 134
Due within 1 to 2 years 113 118
Due within 2 to 5 years 192 263
Due after 5 years 40 85
II. Equipment
Due within 1 year 20 19
Due within 1 to 2 years 12 18
Due within 2 to 5 years 13 24
520 661
Certain property, motor vehicles and computer equipment are leased under non-cancellable operating leases. Most leases are subjectto annual reviews with increases subject to a set percentage or based on either movements in consumer price indices or operatingcriteria. Where appropriate, a right of renewal has been incorporated into the lease agreements at which time all terms and conditionsmay be renegotiated. There are no options to purchase the relevant assets on expiry of the lease.
92 IAG ANNUAL REPORT 2015
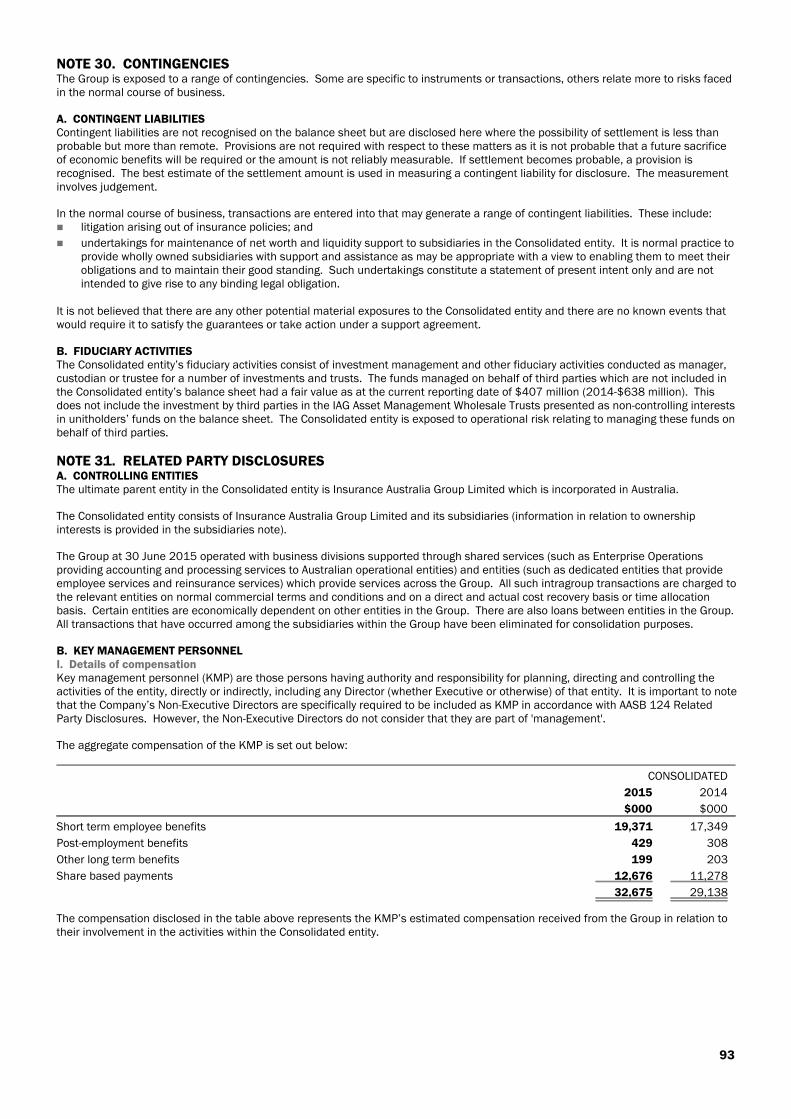
NOTE 30. CONTINGENCIESThe Group is exposed to a range of contingencies. Some are specific to instruments or transactions, others relate more to risks facedin the normal course of business.
A. CONTINGENT LIABILITIESContingent liabilities are not recognised on the balance sheet but are disclosed here where the possibility of settlement is less thanprobable but more than remote. Provisions are not required with respect to these matters as it is not probable that a future sacrificeof economic benefits will be required or the amount is not reliably measurable. If settlement becomes probable, a provision isrecognised. The best estimate of the settlement amount is used in measuring a contingent liability for disclosure. The measurementinvolves judgement.
In the normal course of business, transactions are entered into that may generate a range of contingent liabilities. These include: litigation arising out of insurance policies; and
undertakings for maintenance of net worth and liquidity support to subsidiaries in the Consolidated entity. It is normal practice toprovide wholly owned subsidiaries with support and assistance as may be appropriate with a view to enabling them to meet theirobligations and to maintain their good standing. Such undertakings constitute a statement of present intent only and are notintended to give rise to any binding legal obligation.
It is not believed that there are any other potential material exposures to the Consolidated entity and there are no known events thatwould require it to satisfy the guarantees or take action under a support agreement.
B. FIDUCIARY ACTIVITIESThe Consolidated entity’s fiduciary activities consist of investment management and other fiduciary activities conducted as manager,custodian or trustee for a number of investments and trusts. The funds managed on behalf of third parties which are not included inthe Consolidated entity’s balance sheet had a fair value as at the current reporting date of $407 million (2014-$638 million). Thisdoes not include the investment by third parties in the IAG Asset Management Wholesale Trusts presented as non-controlling interestsin unitholders’ funds on the balance sheet. The Consolidated entity is exposed to operational risk relating to managing these funds onbehalf of third parties.
NOTE 31. RELATED PARTY DISCLOSURESA. CONTROLLING ENTITIESThe ultimate parent entity in the Consolidated entity is Insurance Australia Group Limited which is incorporated in Australia.
The Consolidated entity consists of Insurance Australia Group Limited and its subsidiaries (information in relation to ownershipinterests is provided in the subsidiaries note).
The Group at 30 June 2015 operated with business divisions supported through shared services (such as Enterprise Operationsproviding accounting and processing services to Australian operational entities) and entities (such as dedicated entities that provideemployee services and reinsurance services) which provide services across the Group. All such intragroup transactions are charged tothe relevant entities on normal commercial terms and conditions and on a direct and actual cost recovery basis or time allocationbasis. Certain entities are economically dependent on other entities in the Group. There are also loans between entities in the Group.All transactions that have occurred among the subsidiaries within the Group have been eliminated for consolidation purposes.
B. KEY MANAGEMENT PERSONNELI. Details of compensationKey management personnel (KMP) are those persons having authority and responsibility for planning, directing and controlling theactivities of the entity, directly or indirectly, including any Director (whether Executive or otherwise) of that entity. It is important to notethat the Company’s Non-Executive Directors are specifically required to be included as KMP in accordance with AASB 124 RelatedParty Disclosures. However, the Non-Executive Directors do not consider that they are part of 'management'.
The aggregate compensation of the KMP is set out below:
CONSOLIDATED
2015 2014
$000 $000
Short term employee benefits 19,371 17,349
Post-employment benefits 429 308
Other long term benefits 199 203
Share based payments 12,676 11,278
32,675 29,138
The compensation disclosed in the table above represents the KMP’s estimated compensation received from the Group in relation totheir involvement in the activities within the Consolidated entity.
93
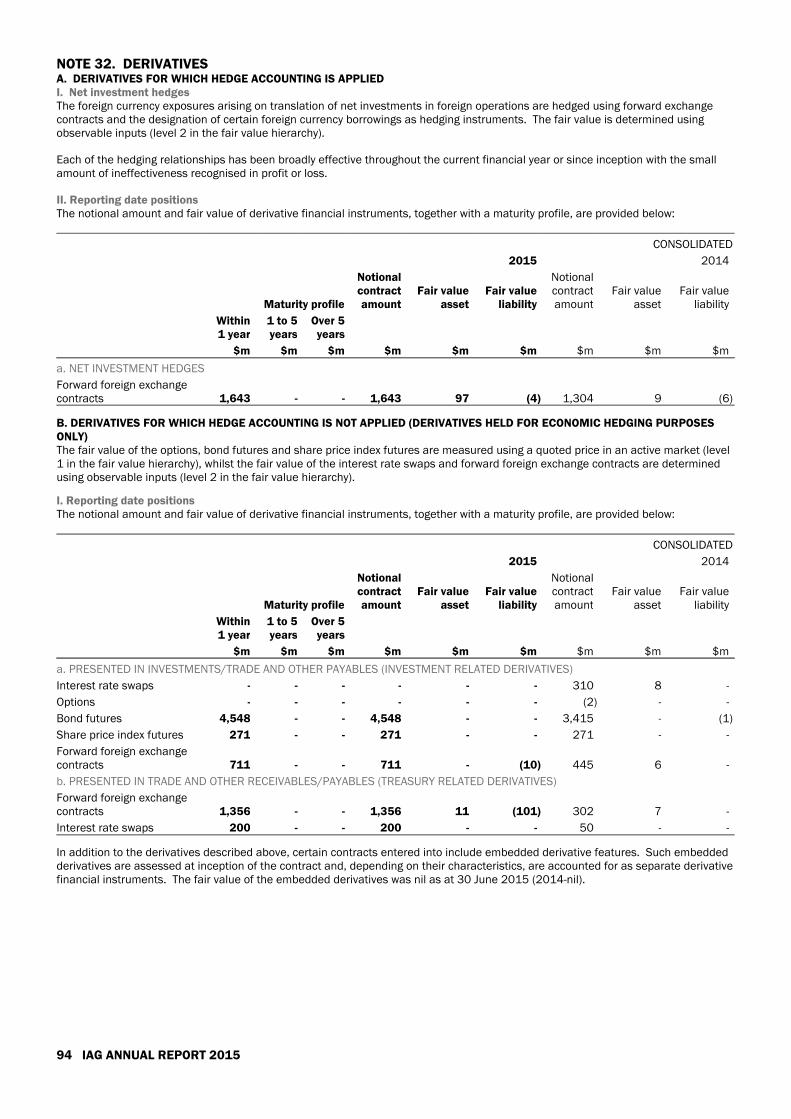
NOTE 32. DERIVATIVESA. DERIVATIVES FOR WHICH HEDGE ACCOUNTING IS APPLIEDI. Net investment hedgesThe foreign currency exposures arising on translation of net investments in foreign operations are hedged using forward exchangecontracts and the designation of certain foreign currency borrowings as hedging instruments. The fair value is determined usingobservable inputs (level 2 in the fair value hierarchy).
Each of the hedging relationships has been broadly effective throughout the current financial year or since inception with the smallamount of ineffectiveness recognised in profit or loss.
II. Reporting date positionsThe notional amount and fair value of derivative financial instruments, together with a maturity profile, are provided below:
CONSOLIDATED
2015 2014
Maturity profile
Notionalcontractamount
Fair valueasset
Fair valueliability
Notionalcontractamount
Fair valueasset
Fair valueliability
Within1 year
$m
1 to 5years
$m
Over 5years
$m $m $m $m $m $m $m
a. NET INVESTMENT HEDGES
Forward foreign exchangecontracts 1,643 - - 1,643 97 (4) 1,304 9 (6)
B. DERIVATIVES FOR WHICH HEDGE ACCOUNTING IS NOT APPLIED (DERIVATIVES HELD FOR ECONOMIC HEDGING PURPOSESONLY)The fair value of the options, bond futures and share price index futures are measured using a quoted price in an active market (level1 in the fair value hierarchy), whilst the fair value of the interest rate swaps and forward foreign exchange contracts are determinedusing observable inputs (level 2 in the fair value hierarchy).
I. Reporting date positionsThe notional amount and fair value of derivative financial instruments, together with a maturity profile, are provided below:
CONSOLIDATED
2015 2014
Maturity profile
Notionalcontractamount
Fair valueasset
Fair valueliability
Notionalcontractamount
Fair valueasset
Fair valueliability
Within1 year
$m
1 to 5years
$m
Over 5years
$m $m $m $m $m $m $m
a. PRESENTED IN INVESTMENTS/TRADE AND OTHER PAYABLES (INVESTMENT RELATED DERIVATIVES)
Interest rate swaps - - - - - - 310 8 -
Options - - - - - - (2) - -
Bond futures 4,548 - - 4,548 - - 3,415 - (1)
Share price index futures 271 - - 271 - - 271 - -
Forward foreign exchangecontracts 711 - - 711 - (10) 445 6 -
b. PRESENTED IN TRADE AND OTHER RECEIVABLES/PAYABLES (TREASURY RELATED DERIVATIVES)
Forward foreign exchangecontracts 1,356 - - 1,356 11 (101) 302 7 -
Interest rate swaps 200 - - 200 - - 50 - -
In addition to the derivatives described above, certain contracts entered into include embedded derivative features. Such embeddedderivatives are assessed at inception of the contract and, depending on their characteristics, are accounted for as separate derivativefinancial instruments. The fair value of the embedded derivatives was nil as at 30 June 2015 (2014-nil).
94 IAG ANNUAL REPORT 2015
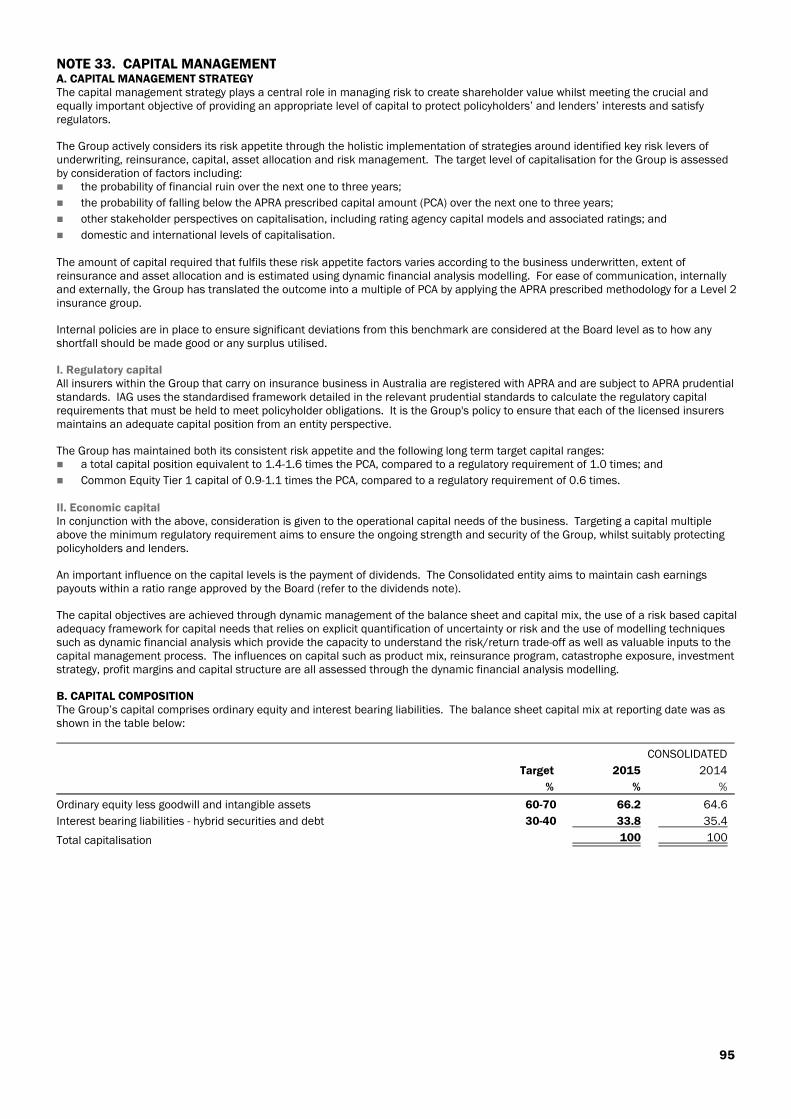
NOTE 33. CAPITAL MANAGEMENTA. CAPITAL MANAGEMENT STRATEGYThe capital management strategy plays a central role in managing risk to create shareholder value whilst meeting the crucial andequally important objective of providing an appropriate level of capital to protect policyholders’ and lenders’ interests and satisfyregulators.
The Group actively considers its risk appetite through the holistic implementation of strategies around identified key risk levers ofunderwriting, reinsurance, capital, asset allocation and risk management. The target level of capitalisation for the Group is assessedby consideration of factors including: the probability of financial ruin over the next one to three years;
the probability of falling below the APRA prescribed capital amount (PCA) over the next one to three years;
other stakeholder perspectives on capitalisation, including rating agency capital models and associated ratings; and
domestic and international levels of capitalisation.
The amount of capital required that fulfils these risk appetite factors varies according to the business underwritten, extent ofreinsurance and asset allocation and is estimated using dynamic financial analysis modelling. For ease of communication, internallyand externally, the Group has translated the outcome into a multiple of PCA by applying the APRA prescribed methodology for a Level 2insurance group.
Internal policies are in place to ensure significant deviations from this benchmark are considered at the Board level as to how anyshortfall should be made good or any surplus utilised.
I. Regulatory capital All insurers within the Group that carry on insurance business in Australia are registered with APRA and are subject to APRA prudentialstandards. IAG uses the standardised framework detailed in the relevant prudential standards to calculate the regulatory capitalrequirements that must be held to meet policyholder obligations. It is the Group's policy to ensure that each of the licensed insurersmaintains an adequate capital position from an entity perspective.
The Group has maintained both its consistent risk appetite and the following long term target capital ranges: a total capital position equivalent to 1.4-1.6 times the PCA, compared to a regulatory requirement of 1.0 times; and
Common Equity Tier 1 capital of 0.9-1.1 times the PCA, compared to a regulatory requirement of 0.6 times.
II. Economic capitalIn conjunction with the above, consideration is given to the operational capital needs of the business. Targeting a capital multipleabove the minimum regulatory requirement aims to ensure the ongoing strength and security of the Group, whilst suitably protectingpolicyholders and lenders.
An important influence on the capital levels is the payment of dividends. The Consolidated entity aims to maintain cash earningspayouts within a ratio range approved by the Board (refer to the dividends note).
The capital objectives are achieved through dynamic management of the balance sheet and capital mix, the use of a risk based capitaladequacy framework for capital needs that relies on explicit quantification of uncertainty or risk and the use of modelling techniquessuch as dynamic financial analysis which provide the capacity to understand the risk/return trade-off as well as valuable inputs to thecapital management process. The influences on capital such as product mix, reinsurance program, catastrophe exposure, investmentstrategy, profit margins and capital structure are all assessed through the dynamic financial analysis modelling.
B. CAPITAL COMPOSITIONThe Group’s capital comprises ordinary equity and interest bearing liabilities. The balance sheet capital mix at reporting date was asshown in the table below:
CONSOLIDATED
Target 2015 2014
% % %
Ordinary equity less goodwill and intangible assets 60-70 66.2 64.6
Interest bearing liabilities - hybrid securities and debt 30-40 33.8 35.4
Total capitalisation 100 100
95
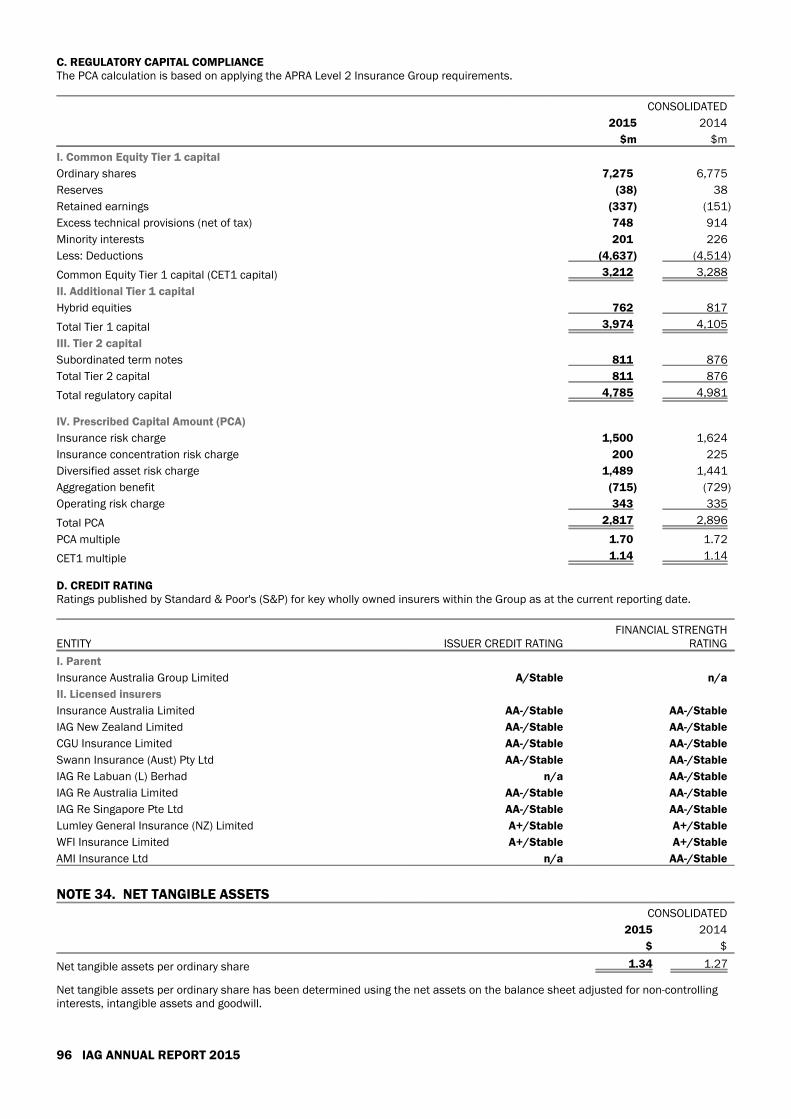
C. REGULATORY CAPITAL COMPLIANCEThe PCA calculation is based on applying the APRA Level 2 Insurance Group requirements.
CONSOLIDATED
2015 2014
$m $m
I. Common Equity Tier 1 capital
Ordinary shares 7,275 6,775
Reserves (38) 38
Retained earnings (337) (151)
Excess technical provisions (net of tax) 748 914
Minority interests 201 226
Less: Deductions (4,637) (4,514)
Common Equity Tier 1 capital (CET1 capital) 3,212 3,288
II. Additional Tier 1 capital
Hybrid equities 762 817
Total Tier 1 capital 3,974 4,105
III. Tier 2 capital
Subordinated term notes 811 876
Total Tier 2 capital 811 876
Total regulatory capital 4,785 4,981
IV. Prescribed Capital Amount (PCA)
Insurance risk charge 1,500 1,624
Insurance concentration risk charge 200 225
Diversified asset risk charge 1,489 1,441
Aggregation benefit (715) (729)
Operating risk charge 343 335
Total PCA 2,817 2,896
PCA multiple 1.70 1.72
CET1 multiple 1.14 1.14
D. CREDIT RATINGRatings published by Standard & Poor's (S&P) for key wholly owned insurers within the Group as at the current reporting date.
ENTITY ISSUER CREDIT RATINGFINANCIAL STRENGTH
RATING
I. Parent
Insurance Australia Group Limited A/Stable n/a
II. Licensed insurers
Insurance Australia Limited AA-/Stable AA-/Stable
IAG New Zealand Limited AA-/Stable AA-/Stable
CGU Insurance Limited AA-/Stable AA-/Stable
Swann Insurance (Aust) Pty Ltd AA-/Stable AA-/Stable
IAG Re Labuan (L) Berhad n/a AA-/Stable
IAG Re Australia Limited AA-/Stable AA-/Stable
IAG Re Singapore Pte Ltd AA-/Stable AA-/Stable
Lumley General Insurance (NZ) Limited A+/Stable A+/Stable
WFI Insurance Limited A+/Stable A+/Stable
AMI Insurance Ltd n/a AA-/Stable
NOTE 34. NET TANGIBLE ASSETSCONSOLIDATED
2015 2014
$ $
Net tangible assets per ordinary share 1.34 1.27
Net tangible assets per ordinary share has been determined using the net assets on the balance sheet adjusted for non-controllinginterests, intangible assets and goodwill.
96 IAG ANNUAL REPORT 2015
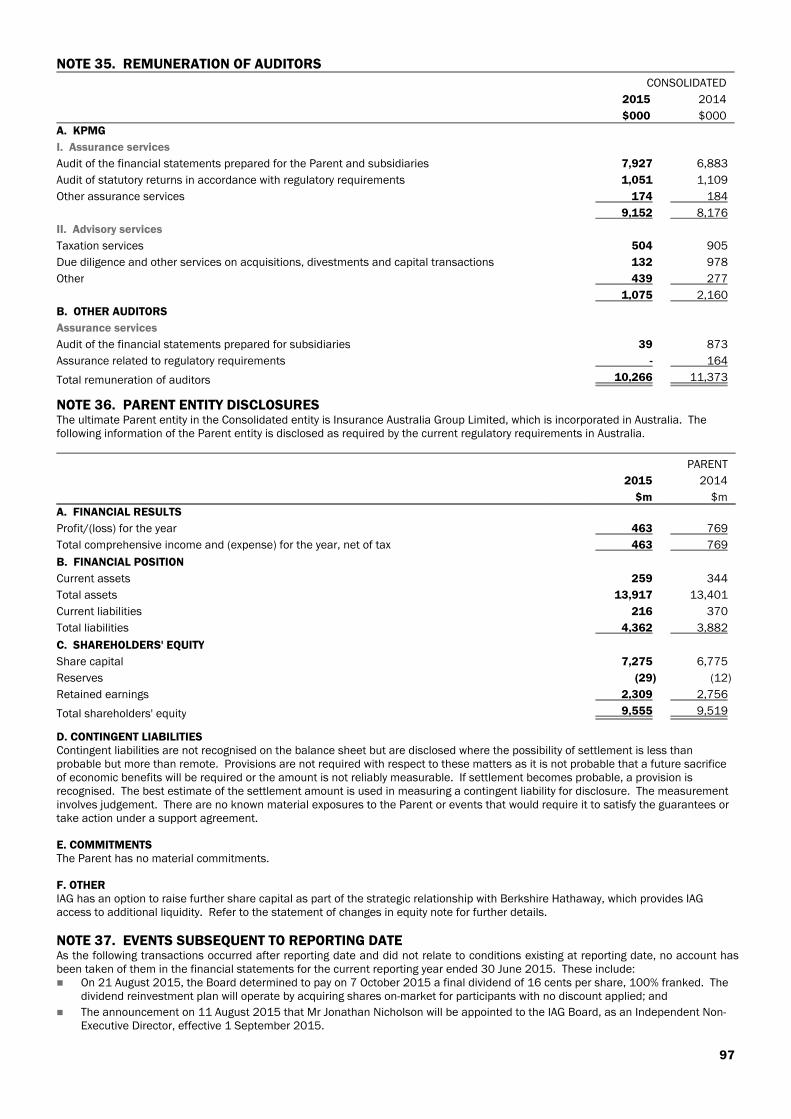
NOTE 35. REMUNERATION OF AUDITORSCONSOLIDATED
2015 2014
$000 $000A. KPMG
I. Assurance services
Audit of the financial statements prepared for the Parent and subsidiaries 7,927 6,883
Audit of statutory returns in accordance with regulatory requirements 1,051 1,109
Other assurance services 174 184
9,152 8,176
II. Advisory services
Taxation services 504 905
Due diligence and other services on acquisitions, divestments and capital transactions 132 978
Other 439 277
1,075 2,160
B. OTHER AUDITORS
Assurance services
Audit of the financial statements prepared for subsidiaries 39 873
Assurance related to regulatory requirements - 164
Total remuneration of auditors 10,266 11,373
NOTE 36. PARENT ENTITY DISCLOSURESThe ultimate Parent entity in the Consolidated entity is Insurance Australia Group Limited, which is incorporated in Australia. Thefollowing information of the Parent entity is disclosed as required by the current regulatory requirements in Australia.
PARENT
2015 2014
$m $mA. FINANCIAL RESULTS
Profit/(loss) for the year 463 769
Total comprehensive income and (expense) for the year, net of tax 463 769
B. FINANCIAL POSITION
Current assets 259 344
Total assets 13,917 13,401
Current liabilities 216 370
Total liabilities 4,362 3,882
C. SHAREHOLDERS' EQUITY
Share capital 7,275 6,775
Reserves (29) (12)
Retained earnings 2,309 2,756
Total shareholders' equity 9,555 9,519
D. CONTINGENT LIABILITIESContingent liabilities are not recognised on the balance sheet but are disclosed where the possibility of settlement is less thanprobable but more than remote. Provisions are not required with respect to these matters as it is not probable that a future sacrificeof economic benefits will be required or the amount is not reliably measurable. If settlement becomes probable, a provision isrecognised. The best estimate of the settlement amount is used in measuring a contingent liability for disclosure. The measurementinvolves judgement. There are no known material exposures to the Parent or events that would require it to satisfy the guarantees ortake action under a support agreement.
E. COMMITMENTSThe Parent has no material commitments.
F. OTHERIAG has an option to raise further share capital as part of the strategic relationship with Berkshire Hathaway, which provides IAGaccess to additional liquidity. Refer to the statement of changes in equity note for further details.
NOTE 37. EVENTS SUBSEQUENT TO REPORTING DATEAs the following transactions occurred after reporting date and did not relate to conditions existing at reporting date, no account hasbeen taken of them in the financial statements for the current reporting year ended 30 June 2015. These include: On 21 August 2015, the Board determined to pay on 7 October 2015 a final dividend of 16 cents per share, 100% franked. The
dividend reinvestment plan will operate by acquiring shares on-market for participants with no discount applied; and
The announcement on 11 August 2015 that Mr Jonathan Nicholson will be appointed to the IAG Board, as an Independent Non-Executive Director, effective 1 September 2015.
97
DIRECTORS' DECLARATIONIn the opinion of the Directors of Insurance Australia Group Limited:
the financial statements and notes 1 to 37, including all the remuneration disclosures that are contained in the RemunerationReport of the Directors’ Report, are in accordance with the Corporations Act 2001 including:
giving a true and fair view of the financial position of the Company and Consolidated entity as at 30 June 2015 and of theirperformance, as represented by the results of their operations and their cash flows, for the year ended on that date;
complying with Australian Accounting Standards and the Corporations Regulations 2001; and
the financial report also complies with International Financial Reporting Standards as disclosed in note 1.A; and
the Remuneration Report of the Directors’ Report complies with the Corporations Act 2001 and Australian Accounting Standards;and
there are reasonable grounds to believe that the Company will be able to pay its debts as and when they become due andpayable.
The Directors have been given the declaration required by section 295A of the Corporations Act 2001 from the Chief Executive Officerand the Chief Financial Officer for the financial year ended 30 June 2015.
Signed at Sydney this 21st day of August 2015 in accordance with a resolution of the Directors.
Michael WilkinsDirector
98 IAG ANNUAL REPORT 2015

INDEPENDENTAUDITOR'S REPORTTO THE SHAREHOLDERS OF INSURANCE AUSTRALIA GROUP LIMITEDREPORT ON THE FINANCIAL REPORTWe have audited the accompanying financial report of Insurance Australia Group Limited (Company), which comprises theconsolidated balance sheet as at 30 June 2015, and the consolidated statement of comprehensive income, consolidated statement ofchanges in equity and consolidated cash flow statement for the year ended on that date, notes 1 to 37 comprising a summary ofsignificant accounting policies and other explanatory information and the Directors’ Declaration of the Group comprising the Companyand the entities it controlled at the year’s end or from time to time during the financial year.
DIRECTORS' RESPONSIBILITY FOR THE FINANCIAL REPORTThe Directors of the Company are responsible for the preparation of the financial report that gives a true and fair view in accordancewith Australian Accounting Standards and the Corporations Act 2001 and for such internal control as the Directors determine isnecessary to enable the preparation of the financial report that is free from material misstatement whether due to fraud or error. Innote 1.A, the Directors also state, in accordance with Australian Accounting Standard AASB 101 Presentation of Financial Statements,that the financial statements of the Group comply with International Financial Reporting Standards.
AUDITOR'S RESPONSIBILITYOur responsibility is to express an opinion on the financial report based on our audit. We conducted our audit in accordance withAustralian Auditing Standards. These Auditing Standards require that we comply with relevant ethical requirements relating to auditengagements and plan and perform the audit to obtain reasonable assurance whether the financial report is free from materialmisstatement.
An audit involves performing procedures to obtain audit evidence about the amounts and disclosures in the financial report. Theprocedures selected depend on the auditor’s judgement, including the assessment of the risks of material misstatement of thefinancial report, whether due to fraud or error. In making those risk assessments, the auditor considers internal control relevant to theentity’s preparation of the financial report that gives a true and fair view in order to design audit procedures that are appropriate in thecircumstances, but not for the purpose of expressing an opinion on the effectiveness of the entity’s internal control. An audit alsoincludes evaluating the appropriateness of accounting policies used and the reasonableness of accounting estimates made by theDirectors, as well as evaluating the overall presentation of the financial report.
We performed the procedures to assess whether in all material respects the financial report presents fairly, in accordance with theCorporations Act 2001 and Australian Accounting Standards, a true and fair view which is consistent with our understanding of theGroup’s financial position and of its performance.
We believe that the audit evidence we have obtained is sufficient and appropriate to provide a basis for our audit opinion.
INDEPENDENCEIn conducting our audit, we have complied with the independence requirements of the Corporations Act 2001.
AUDITOR'S OPINIONIn our opinion:
the financial report of the Group is in accordance with the Corporations Act 2001, including:
giving a true and fair view of the Group’s financial position as at 30 June 2015 and of its performance for the year ended onthat date; and
complying with Australian Accounting Standards and the Corporations Regulations 2001.
the financial report also complies with International Financial Reporting Standards as disclosed in note 1.A.
99KPMG, an Australian partnership and a member firm of the KPMG network of independent member firms affiliated with KPMG International Cooperative ("KPMGInternational"), a Swiss entity. Liability limited by a scheme approved under Professional Standards Legislation.
REPORT ON THE REMUNERATION REPORTWe have audited the Remuneration Report included on pages 17 to 35 of the Directors' Report for the year ended 30 June 2015. TheDirectors of the Company are responsible for the preparation and presentation of the Remuneration Report in accordance with Section300A of the Corporations Act 2001. Our responsibility is to express an opinion on the Remuneration Report, based on our auditconducted in accordance with auditing standards.
AUDITOR'S OPINIONIn our opinion, the Remuneration Report of Insurance Australia Group Limited for the year ended 30 June 2015 complies with Section300A of the Corporations Act 2001.
KPMG
Dr Andries B TerblanchéPartner
Sydney21 August 2015
100 IAG ANNUAL REPORT 2015KPMG, an Australian partnership and a member firm of the KPMG network of independent member firms affiliated with KPMG International Cooperative ("KPMGInternational"), a Swiss entity. Liability limited by a scheme approved under Professional Standards Legislation.
SHAREHOLDER INFORMATIONInformation about Insurance Australia Group Limited including company announcements, presentations and reports can be accessedat www.iag.com.au.
ASX CODESInsurance Australia Group Limited’s shares are listed on the ASX under: IAG (ordinary shares); and
IAGPC (convertible preference shares).
Insurance Australia Group Limited’s wholly owned subsidiary IAG Finance (New Zealand) Limited issued reset exchangeable securities(RES) in January 2005 which are listed on the ASX under IANG.
ANNUAL REPORTUnder the Corporations Act 2001 regarding the provision of annual reports to shareholders, the default option for receiving annualreports is an electronic copy via IAG’s website at www.iag.com.au.
ANNUAL GENERAL MEETING The 2015 annual general meeting (AGM) of Insurance Australia Group Limited will be held on Wednesday, 21 October 2015commencing at 10am at the City Recital Hall, Angel Place, Sydney NSW 2000, Australia. The AGM will be webcast live on the internetat www.iag.com.au/shareholder-centre/annual-meetings and an archive version will be placed on the website to enable the AGM to beviewed at a later time.
ONLINE VOTINGShareholders can lodge voting instructions electronically either as a direct vote or by appointing a proxy for the 2015 AGM atwww.iag.com.au. The information required to log on and use online voting is shown on your voting form.
SHAREHOLDER QUESTIONSIf you would like to submit a written question to the Company or the Company’s auditor with regard to the AGM or any of theresolutions to be discussed please use the form supplied and return it with your completed Voting Form in the pre-addressed envelopeprovided or by fax to +61 (0)3 9473 2555. Please note your questions for the auditor must be received by 5pm on 14 October 2015.
You may also submit a question, after completing your voting instructions online at www.iag.com.au. Members will also be given areasonable opportunity to ask questions of the Company and the auditor at the AGM.
During the course of the AGM IAG intends to answer as many of the frequently asked questions as practicable but will not beresponding to individual questions. Responses to the most commonly asked questions will be added to the website atwww.iag.com.au/shareholder-centre/annual-meetings.
DIVIDEND PAYMENT METHODSInsurance Australia Group Limited no longer issues dividend payments by cheque to shareholders resident in Australia. Shareholdersshould provide the share registry with their alternative instructions as detailed below:
IAG ORDINARY SHAREHOLDERS Paid directly into a New Zealand bank account or to an Australian bank, credit union, building society or nominated account; or
Eligible shareholders can choose to participate in IAG’s Dividend Reinvestment Plan (DRP), if available, providing the option toincrease your shareholding without incurring brokerage or GST.
IAGPC CONVERTIBLE PREFERENCE SHAREHOLDERS Paid directly into an Australian bank, credit union, building society or nominated account.
MANAGE YOUR HOLDINGUsing your Shareholder Reference Number (SRN) or Holder Identification Number (HIN) and postcode of your registered address youcan view your holding online through IAG's share registry, Computershare, by following the easy prompts on their website atwww.investorcentre.com where you will be able to: view your holding balance;
review your dividend payment history;
access shareholder forms; and
retrieve holding statements, including recent dividend payment advices.
The share registry investor centre site will also allow you to update or add details to your shareholding. If you wish to amend or updateany of the current details you will be asked to register by choosing a User ID and Password which you can easily remember foradditional security purposes.
You will also be asked to enter answers to three personal questions for verification purposes should you forget your password in thefuture.
If you have previously used the Investor Centre site you will be asked to key in your password only.
101
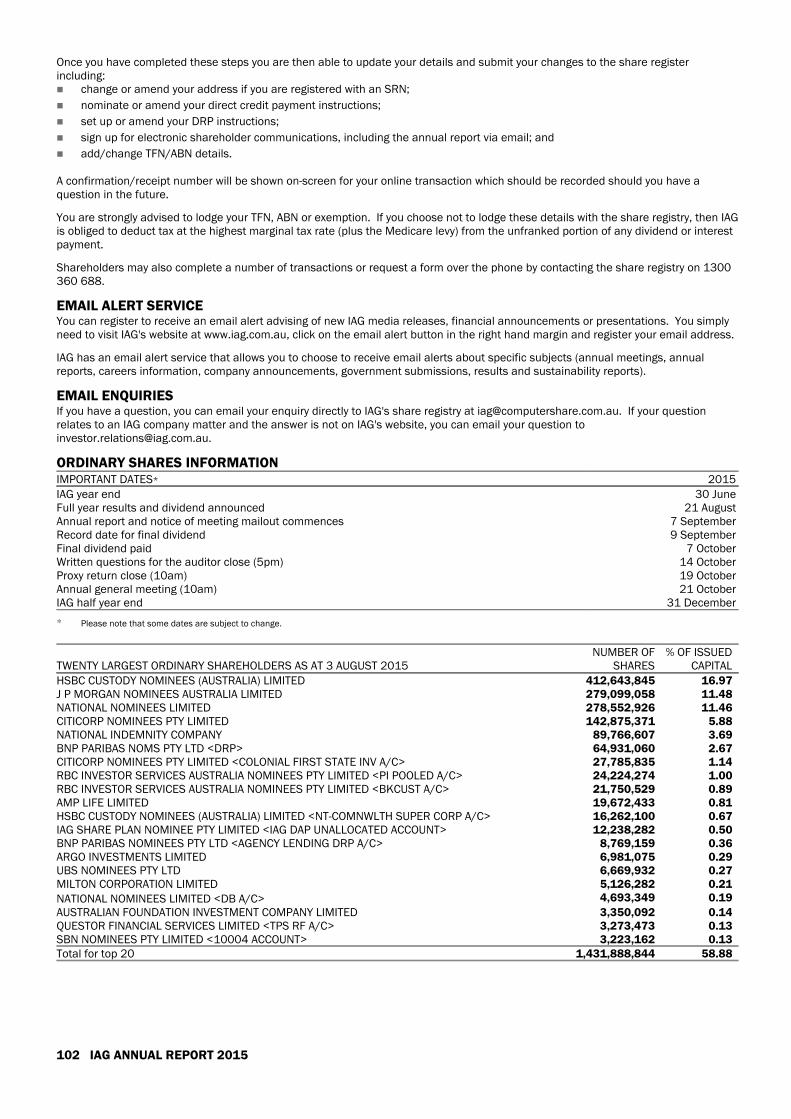
Once you have completed these steps you are then able to update your details and submit your changes to the share registerincluding: change or amend your address if you are registered with an SRN;
nominate or amend your direct credit payment instructions;
set up or amend your DRP instructions;
sign up for electronic shareholder communications, including the annual report via email; and
add/change TFN/ABN details.
A confirmation/receipt number will be shown on-screen for your online transaction which should be recorded should you have aquestion in the future.
You are strongly advised to lodge your TFN, ABN or exemption. If you choose not to lodge these details with the share registry, then IAGis obliged to deduct tax at the highest marginal tax rate (plus the Medicare levy) from the unfranked portion of any dividend or interestpayment.
Shareholders may also complete a number of transactions or request a form over the phone by contacting the share registry on 1300360 688.
EMAIL ALERT SERVICEYou can register to receive an email alert advising of new IAG media releases, financial announcements or presentations. You simplyneed to visit IAG's website at www.iag.com.au, click on the email alert button in the right hand margin and register your email address.
IAG has an email alert service that allows you to choose to receive email alerts about specific subjects (annual meetings, annualreports, careers information, company announcements, government submissions, results and sustainability reports).
EMAIL ENQUIRIESIf you have a question, you can email your enquiry directly to IAG's share registry at [email protected]. If your questionrelates to an IAG company matter and the answer is not on IAG's website, you can email your question [email protected].
ORDINARY SHARES INFORMATIONIMPORTANT DATES* 2015IAG year end 30 JuneFull year results and dividend announced 21 AugustAnnual report and notice of meeting mailout commences 7 SeptemberRecord date for final dividend 9 SeptemberFinal dividend paid 7 OctoberWritten questions for the auditor close (5pm) 14 OctoberProxy return close (10am) 19 OctoberAnnual general meeting (10am) 21 OctoberIAG half year end 31 December
* Please note that some dates are subject to change.
TWENTY LARGEST ORDINARY SHAREHOLDERS AS AT 3 AUGUST 2015NUMBER OF
SHARES% OF ISSUED
CAPITALHSBC CUSTODY NOMINEES (AUSTRALIA) LIMITED 412,643,845 16.97J P MORGAN NOMINEES AUSTRALIA LIMITED 279,099,058 11.48NATIONAL NOMINEES LIMITED 278,552,926 11.46CITICORP NOMINEES PTY LIMITED 142,875,371 5.88NATIONAL INDEMNITY COMPANY 89,766,607 3.69BNP PARIBAS NOMS PTY LTD <DRP> 64,931,060 2.67CITICORP NOMINEES PTY LIMITED <COLONIAL FIRST STATE INV A/C> 27,785,835 1.14RBC INVESTOR SERVICES AUSTRALIA NOMINEES PTY LIMITED <PI POOLED A/C> 24,224,274 1.00RBC INVESTOR SERVICES AUSTRALIA NOMINEES PTY LIMITED <BKCUST A/C> 21,750,529 0.89AMP LIFE LIMITED 19,672,433 0.81HSBC CUSTODY NOMINEES (AUSTRALIA) LIMITED <NT-COMNWLTH SUPER CORP A/C> 16,262,100 0.67IAG SHARE PLAN NOMINEE PTY LIMITED <IAG DAP UNALLOCATED ACCOUNT> 12,238,282 0.50BNP PARIBAS NOMINEES PTY LTD <AGENCY LENDING DRP A/C> 8,769,159 0.36ARGO INVESTMENTS LIMITED 6,981,075 0.29UBS NOMINEES PTY LTD 6,669,932 0.27MILTON CORPORATION LIMITED 5,126,282 0.21NATIONAL NOMINEES LIMITED <DB A/C> 4,693,349 0.19AUSTRALIAN FOUNDATION INVESTMENT COMPANY LIMITED 3,350,092 0.14QUESTOR FINANCIAL SERVICES LIMITED <TPS RF A/C> 3,273,473 0.13SBN NOMINEES PTY LIMITED <10004 ACCOUNT> 3,223,162 0.13Total for top 20 1,431,888,844 58.88
102 IAG ANNUAL REPORT 2015
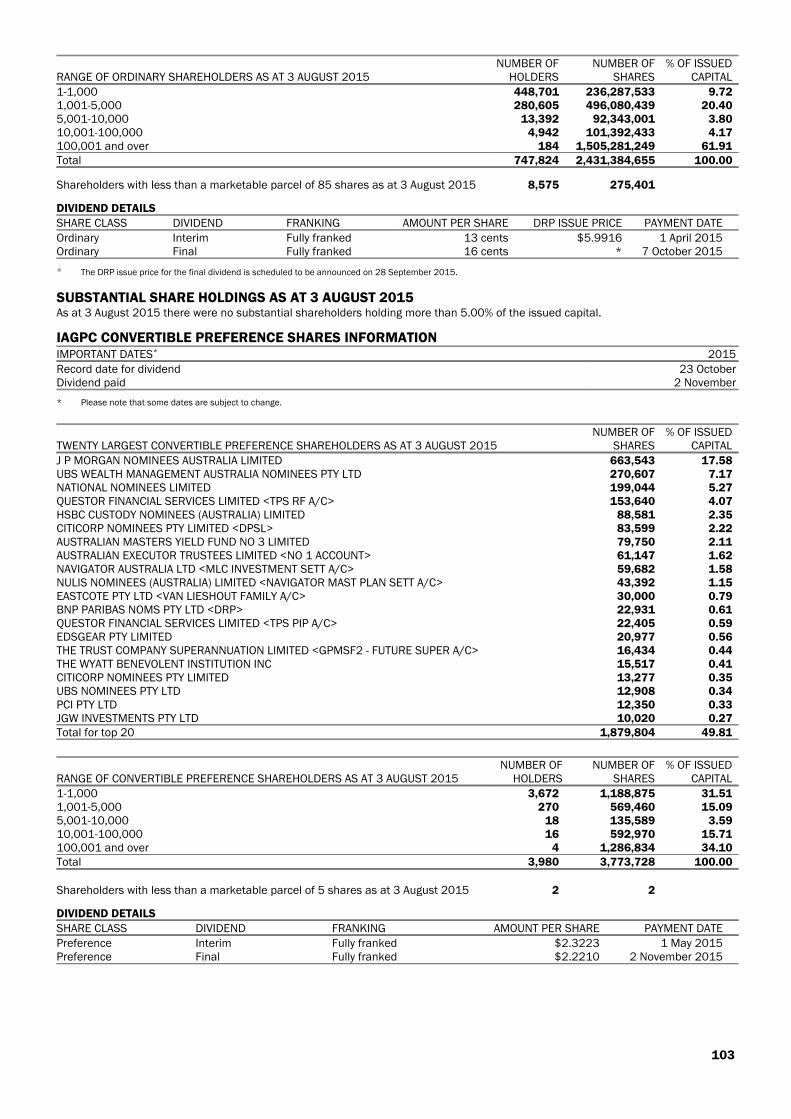
RANGE OF ORDINARY SHAREHOLDERS AS AT 3 AUGUST 2015NUMBER OF
HOLDERSNUMBER OF
SHARES% OF ISSUED
CAPITAL1-1,000 448,701 236,287,533 9.721,001-5,000 280,605 496,080,439 20.405,001-10,000 13,392 92,343,001 3.8010,001-100,000 4,942 101,392,433 4.17100,001 and over 184 1,505,281,249 61.91Total 747,824 2,431,384,655 100.00
Shareholders with less than a marketable parcel of 85 shares as at 3 August 2015 8,575 275,401
DIVIDEND DETAILSSHARE CLASS DIVIDEND FRANKING AMOUNT PER SHARE DRP ISSUE PRICE PAYMENT DATEOrdinary Interim Fully franked 13 cents $5.9916 1 April 2015Ordinary Final Fully franked 16 cents * 7 October 2015
* The DRP issue price for the final dividend is scheduled to be announced on 28 September 2015.
SUBSTANTIAL SHARE HOLDINGS AS AT 3 AUGUST 2015As at 3 August 2015 there were no substantial shareholders holding more than 5.00% of the issued capital.
IAGPC CONVERTIBLE PREFERENCE SHARES INFORMATIONIMPORTANT DATES* 2015Record date for dividend 23 OctoberDividend paid 2 November
* Please note that some dates are subject to change.
TWENTY LARGEST CONVERTIBLE PREFERENCE SHAREHOLDERS AS AT 3 AUGUST 2015NUMBER OF
SHARES% OF ISSUED
CAPITALJ P MORGAN NOMINEES AUSTRALIA LIMITED 663,543 17.58UBS WEALTH MANAGEMENT AUSTRALIA NOMINEES PTY LTD 270,607 7.17NATIONAL NOMINEES LIMITED 199,044 5.27QUESTOR FINANCIAL SERVICES LIMITED <TPS RF A/C> 153,640 4.07HSBC CUSTODY NOMINEES (AUSTRALIA) LIMITED 88,581 2.35CITICORP NOMINEES PTY LIMITED <DPSL> 83,599 2.22AUSTRALIAN MASTERS YIELD FUND NO 3 LIMITED 79,750 2.11AUSTRALIAN EXECUTOR TRUSTEES LIMITED <NO 1 ACCOUNT> 61,147 1.62NAVIGATOR AUSTRALIA LTD <MLC INVESTMENT SETT A/C> 59,682 1.58NULIS NOMINEES (AUSTRALIA) LIMITED <NAVIGATOR MAST PLAN SETT A/C> 43,392 1.15EASTCOTE PTY LTD <VAN LIESHOUT FAMILY A/C> 30,000 0.79BNP PARIBAS NOMS PTY LTD <DRP> 22,931 0.61QUESTOR FINANCIAL SERVICES LIMITED <TPS PIP A/C> 22,405 0.59EDSGEAR PTY LIMITED 20,977 0.56THE TRUST COMPANY SUPERANNUATION LIMITED <GPMSF2 - FUTURE SUPER A/C> 16,434 0.44THE WYATT BENEVOLENT INSTITUTION INC 15,517 0.41CITICORP NOMINEES PTY LIMITED 13,277 0.35UBS NOMINEES PTY LTD 12,908 0.34PCI PTY LTD 12,350 0.33JGW INVESTMENTS PTY LTD 10,020 0.27Total for top 20 1,879,804 49.81
RANGE OF CONVERTIBLE PREFERENCE SHAREHOLDERS AS AT 3 AUGUST 2015NUMBER OF
HOLDERSNUMBER OF
SHARES% OF ISSUED
CAPITAL1-1,000 3,672 1,188,875 31.511,001-5,000 270 569,460 15.095,001-10,000 18 135,589 3.5910,001-100,000 16 592,970 15.71100,001 and over 4 1,286,834 34.10Total 3,980 3,773,728 100.00
Shareholders with less than a marketable parcel of 5 shares as at 3 August 2015 2 2
DIVIDEND DETAILSSHARE CLASS DIVIDEND FRANKING AMOUNT PER SHARE PAYMENT DATEPreference Interim Fully franked $2.3223 1 May 2015Preference Final Fully franked $2.2210 2 November 2015
103
CORPORATE DIRECTORYSHARE REGISTRYCOMPUTERSHARE INVESTOR SERVICES PTY LIMITEDGPO Box 4709Melbourne VIC 3001Australia
Hand deliveries toLevel 460 Carrington StreetSydney NSW 2000
Telephone(within Australia) 1300 360 688(outside Australia) +61 (0)3 9415 4210
Fax(general) +61 (0)3 9473 2470
REGISTERED OFFICEINSURANCE AUSTRALIA GROUP LIMITEDLevel 26388 George StreetSydney NSW 2000Australia
Telephone+61 (0)2 9292 9222
Fax+61 (0)2 9292 8072
Websitewww.iag.com.au
104 IAG ANNUAL REPORT 2015

All information about IAG’s 2015 financial performance is available online at www.iag.com.au/reportingcentre/2015/index.html, or scan this QR code to go straight to IAG’s website, for financial updates, investor reports, ASX announcements, key dates and a comprehensive shareholder centre.
This report is printed on Pacesetter Laser Pro, a paper that is manufactured elemental chlorine free (ECF) from FSC® Mix certified fibre by an ISO 14001 certified mill.
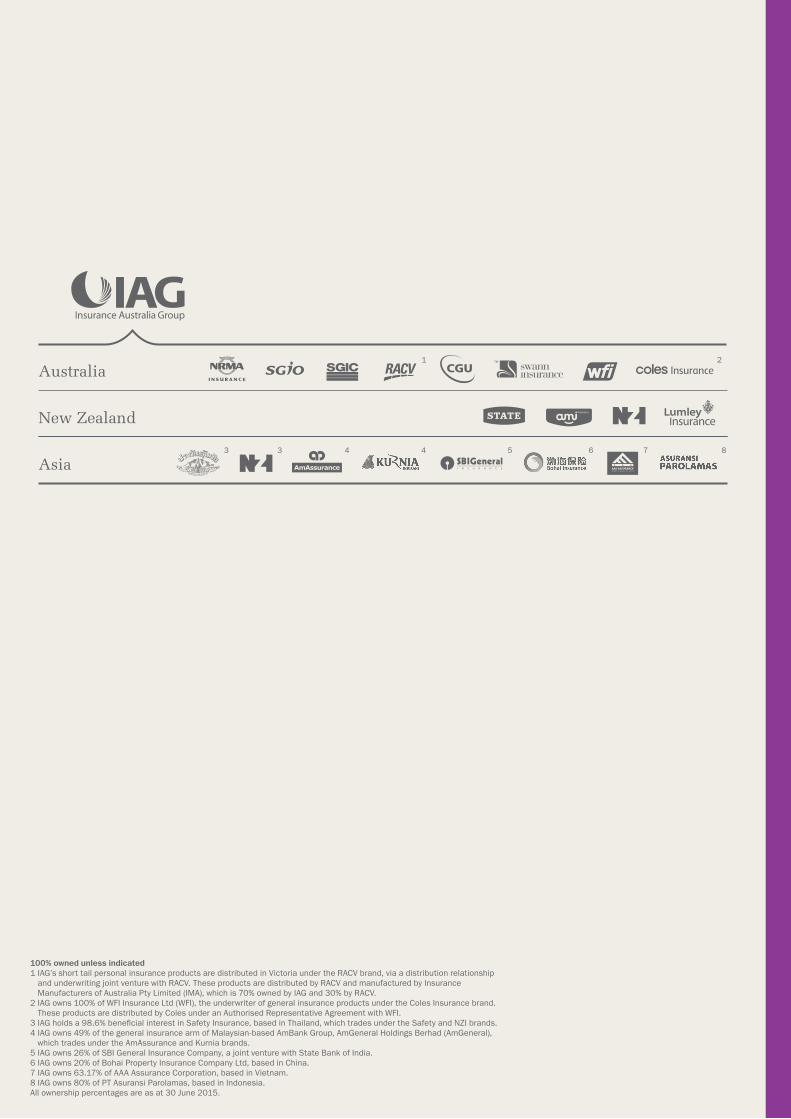
Insurance Australia G
roup Annual R
eport 2015
1 2
100% owned unless indicated 1 IAG’s short tail personal insurance products are distributed in Victoria under the RACV brand, via a distribution relationship
and underwriting joint venture with RACV. These products are distributed by RACV and manufactured by Insurance Manufacturers of Australia Pty Limited (IMA), which is 70% owned by IAG and 30% by RACV.
2 IAG owns 100% of WFI Insurance Ltd (WFI), the underwriter of general insurance products under the Coles Insurance brand. These products are distributed by Coles under an Authorised Representative Agreement with WFI.
3 IAG holds a 98.6% beneficial interest in Safety Insurance, based in Thailand, which trades under the Safety and NZI brands. 4 IAG owns 49% of the general insurance arm of Malaysian-based AmBank Group, AmGeneral Holdings Berhad (AmGeneral),
which trades under the AmAssurance and Kurnia brands. 5 IAG owns 26% of SBI General Insurance Company, a joint venture with State Bank of India. 6 IAG owns 20% of Bohai Property Insurance Company Ltd, based in China. 7 IAG owns 63.17% of AAA Assurance Corporation, based in Vietnam.8 IAG owns 80% of PT Asuransi Parolamas, based in Indonesia.All ownership percentages are as at 30 June 2015.
Asia3 3 4 4 5 6 7 8
New Zealand
Australia