instructor-specific grade inflation: incentives, gender, and ethnicity*
TRANSCRIPT

Instructor-Specific Grade Inflation:Incentives, Gender, and Ethnicity∗
R. Todd Jewell, University of North Texas
Michael A. McPherson, University of North Texas
Objectives. This study attempts to isolate instructor-specific measures that may besources of grade inflation and to measure their relative importance. Methods. Weestimate a fixed-effects model, using by far the most extensive data set related tograde inflation ever assembled. Our data comprise 48,038 courses taught by 1,871distinct instructors at a large public university over a two-decade period. Results. Ourresults suggest that female faculty members are the most likely to inflate grades, whileethnicity has a lesser effect. Conclusions. Characteristics of instructors, in particulargender, affect the degree of observed grade inflation, controlling for student- anddepartment-specific effects.
Over the past several decades, grades at American colleges and universitieshave shown a general upward trend. Stuart Rojstaczer (formerly of DukeUniversity) has compiled what are perhaps the most complete data in this area.Using information from 29 schools, he shows that grade point averages (GPAs)have increased approximately 0.15 points on the usual 4-point scale per decadesince the late 1960s, with grade inflation at private schools proceeding at a morerapid pace than at public institutions.1 Numerous other studies, includingFarley (1995), Cluskey, Griffin, and Ehlen (1997), Grove and Wasserman(2004), Bello and Valientes (2006), and Jewell and McPherson (2009) havefound evidence of rising grades in a variety of colleges and universities.
The increase in grades without a concomitant increase in student qualityhas become known as grade inflation, and researchers from various disciplineshave speculated about its causes.2 A long list of researchers, including Nelsonand Lynch (1984), Zangenehzadeh (1988), Isely and Singh (2005), Germainand Scandura (2005), McPherson (2006), and McPherson, Jewell, and Kim(2009) have argued that faculty members are inflating grades in response to the
∗Direct correspondence to Michael A. McPherson, Department of Economics, P.O. Box311457, Denton, TX 76203-1457 <[email protected]>. Author McPherson will share alldata and coding for replication purposes.
1See Rojstaczer (2008).2It is certainly possible that students are simply better and average grades have risen as a
natural result of this. However, there is some evidence to the contrary, usually based on theobservation that the SAT and ACT scores of entering students have not noticeably increasedand may in some periods have declined. See, for example, the work of Kolevzon (1981),Birnbaum (1977), and Cluskey et al. (1997).
SOCIAL SCIENCE QUARTERLY, Volume 93, Number 1, March 2012C© 2012 by the Southwestern Social Science AssociationDOI: 10.1111/j.1540-6237.2011.00827.x
96 Social Science Quarterly
now widespread use of student evaluations of teaching (SETs) in promotion,tenure, and merit evaluations.3
Unfortunately, much of the existing literature on the determinants of gradeinflation is rather limited. Many studies, including Kolevzon (1981), Sabot andWakemann-Linn (1991), Anglin and Meng (2000), Sonner (2000), and Groveand Wasserman (2004), use simple descriptive statistics to examine the issues.While there are studies that use regression methodologies, in general thesealso suffer from important shortcomings that call into some question theirconclusions. Most of the shortcomings in the previous literature stem from thepaucity of data that cover a large enough variety of courses, instructors, andtime periods. For example, Prather, Smith, and Kodras (1979) examine 144individual courses over a six-year period. The data of Cluskey, Griffin, andEhlen (1997) cover a 15-year period but only consider senior-level accountingcourses. Cheong (2000) examines data covering a 12-year period and thatare from 40 academic departments. However, data on individual courses andinstructors are evidently largely absent—only very rudimentary regressionanalyses are employed.
Other studies have examined whether certain characteristics of instructorsmake them more or less likely to inflate grades. Kolevzon (1981) suggests thatmale faculty members may be less prone to inflate grades than their femalecolleagues, but finds no evidence that a faculty member’s tenure status affectshis or her likelihood of inflating grades. Although their principal focus wason department-level effects, Jewell and McPherson (2009) found evidence ofsignificant instructor-specific effects.
The present study is an attempt to examine rigorously the influence ofcharacteristics of individual instructors on grade inflation. We employ a richdata set to test hypotheses concerning grade inflation for different aspectsof the undergraduate classroom experience. Our research involves data from48,038 course sections taught in 38 different academic departments by 1,871distinct instructors at a large public university over two decades (1984–2005),a data set that covers a substantially longer time period and considerably morecourses and departments than any other study.4 The unique nature of thedata permits a much more comprehensive data analysis of the determinants ofgrade inflation than has been possible previously. We find that while instructorethnicity appears to have little effect on the propensity to inflate grades,instructor gender does. In particular, in our sample, female instructors givesignificantly higher grades than their male colleagues.
3Institutional factors, such as allowing students to drop courses at later dates than beforeand degree programs that permit students to take nontraditional (and perhaps easier) coursesthan before, have also been suggested (Prather, Smith, and Kodras, 1979), along with a host ofothers. This literature is neatly summarized by Mulvenon and Ferritor (2005).
4As noted previously, grade inflation seems to be at least somewhat more serious at privateinstitutions. It is nevertheless a significant phenomenon at public institution such as ours.While each institution is unique, our results may be representative of the broader phenomenon.However, only an interinstitution study would allow us to speak to this.

Instructor-Specific Grade Inflation 97
Data and Empirical Methods
Following past literature, the present article views the issue of grade inflationas the outcome of economic processes. We follow the model of Dickson(1984). In that model, instructors’ utility depends positively on the levelof job security afforded by teaching, negatively on the effort an instructormust expend in teaching, and positively on student effort and ability. In thisframework, a faculty member may perceive that issuing higher grades will leadto greater job security through higher evaluations from students and peers.Utility maximization suggests that instructors have an incentive to adjustgrades as long as the marginal utility that accrues due to increased job securityexceeds the increased cost to the instructor because of increased instructoreffort in teaching (and, presumably, decreased research output). There is alsoat some point, presumably, a cost in terms of faculty members’ reputations toexcessive inflating of grades.
The Dickson model suggests that the degree of grade inflation may vary bycharacteristics of the department (e.g., the faculty–student ratio), and of thecourse (such as the level and size of the class). Some empirical evidence fromearlier studies supports these predictions. For instance, the more quantitativedisciplines are sometimes found to exhibit less evidence of grade inflation(Prather, Smith, and Kodras, 1979; Sabot and Wakeman-Linn, 1991; Cheong,2000). Dickson (1984) finds that departments with smaller class sizes are moreinclined to issue higher grades. Jewell and McPherson (2009) find an inverserelationship between number of faculty in a department and average gradesissued; this may indicate a reorientation toward research as departments addfaculty. Jewell and McPherson (2009) also find that departments respond togrowth in numbers of students by inflating grades.
Our focus is on the effects that characteristics of instructors may have ongrades; these effects are generally predicted by the Dickson model. For exam-ple, level of experience and rank affect instructors’ assessments of their jobsecurity, and instructors at different points in their career paths may have dif-ferent costs of teaching. While difficult to observe, observed grades also dependon teaching effectiveness and each instructor’s marking standard. Our articlefocuses in particular on instructor gender and ethnicity. These characteristicsmay affect observed grades in several ways. Student effort may differ accord-ing to the gender or ethnicity of instructors, or somehow gender or ethnicityof the instructor attracts students of different ability. It is also possible thatteaching effectiveness differs by instructor gender or ethnicity. For example,if we observe that the grades in classes taught by female instructors are higherthan comparable classes taught by men, it could suggest that women are moreeffective teachers. While these are possible, it may be more likely the casethat instructors face different incentives according to their gender or ethnicity.If it is the case that women and minority faculty face or feel that they facedifferential pressures, they may have incentives to issue higher grades to theirclasses. For example, a female faculty member may feel that she must excel

98 Social Science Quarterly
as a teacher in order to be eligible for promotion, tenure, or merit increases;if so, she may be inclined to inflate grades to a greater extent than her malecolleagues. Ginther and Khan (2004) find evidence that female faculty are lesslikely to receive tenure than men. As noted above, Kolevzon (1981) found thatlow-grade-inflation departments are more likely to have larger proportions ofmale faculty members. Nonwhite faculty members may face similar circum-stances. For example, Nettles et al. (2000) find that black faculty membersare less likely than whites to have received tenure and promotion. McPhersonand Jewell (2007) present evidence that after controlling for other observablecharacteristics of the students, instructor, and course, minority faculty receivelower evaluation scores from students. If ethnicity-based discrimination existsin promotion, tenure, and merit decisions, or if nonwhite faculty membersbelieve that it does, these faculty may gain more utility from grade inflationthan their white colleagues.
Our data set comprises course-level observations for 21 academic years(1984–1985 to 2004–2005) at the University of North Texas (UNT). UNTis a large, comprehensive, state-funded university with more than 25,000 un-dergraduate students. UNT has academic programs in all traditional subjectsand awards the Ph.D. in many of those programs. A particular advantage ofthese data is that they cover all UNT courses over the study period. Followingthe grade inflation literature, only undergraduate courses are considered in theanalysis. Certain courses, such as private music lessons, independent studies,honors research and theses, practica, driver’s education, and internships andcooperative education, are excluded from the analysis because they are orga-nized differently than traditional university courses and their grading systemsmay be nonstandard. For similar reasons, student teaching, institutes andstudy tours, and field studies are not considered. Other courses may also havedistinctive grading systems and are excluded from the analysis (e.g., activity-based physical education courses and lab sections in which a separate grade isentered from the classroom portion of the course).
Since we are interested in the effects of gender and ethnicity, instructorswith missing information on any of these measures are excluded. Further-more, courses taught in the summer or other terms outside of the regularsemester are excluded because of concerns over comparability. Finally, instruc-tors with fewer than four courses taught are excluded to facilitate estimationof instructor-specific effects. State law allows very small class sizes (fewer than10 students) only in exceptional cases; we exclude these as outliers. This isequivalent to deleting the bottom 5 percent of classes in terms of student size.We also carried out the analysis without the largest 5 percent of classes; thisdoes not affect our results in any important way.
After making these exclusions, the usable data include 48,038 observedcourse sections taught in 38 academic departments by 1,871 distinct instruc-tors. These data represent more than 50 percent of the approximately 90,000courses taught over the time period under study.

Instructor-Specific Grade Inflation 99
An Empirical Model of Grade Inflation
As noted above, the Dickson (1984) model predicts that average GPA willvary by the characteristics of instructors, of students in the classes, and of thedepartment itself. In terms of instructor characteristics, we are interested in therelationships between grade inflation and gender and ethnicity. With respectto ethnicity, we split the sample into whites and nonwhites. As discussedabove, we hypothesize that instructors who are not white males may be moreinclined toward the issuing of higher grades than their white male colleagues.
We include the following variables to measure student characteristics atthe course level: SAT, Students, Pct_1st_yr, Pct_2nd_yr, and Pct_3rd_yr. Whilean average SAT score for each of our 48,000 courses would be the optimalway to control for changes in student quality, such data are not available.However, we do have access to average SAT scores for entering freshmen ateach university in each year. We construct a course-specific SAT score as theaverage SAT score weighted by the proportion of students in that course thatshould have entered college in each year. That is, for a given course SAT iscalculated as the percentage of freshmen in that course times the average SATfor individuals who would be freshmen in that year plus the percentage ofsophomores in that course times the average SAT for individuals who wouldbe sophomores, and so forth. SAT is the average SAT score for a given classrelative to the national average, and as such measures improvement of UNTstudents relative to all college students over time. While an imperfect measure,SAT is included mainly to control for any impact that student quality mayhave on grade inflation. The mean of SAT for the estimation sample is 2.5,which implies that UNT students taking sampled courses had on average 2.5percent higher scores on the SAT than the national average. We hypothesizethat, other things equal, GPA should be directly related to the relative qualityof students, as measured by the SAT variable.
Students measures course size in terms of the number of students. Therelationship between the number of students and the average grade in aparticular course may be affected by differences in pedagogy at different classsizes. For example, instructors of smaller classes may be able to spend moretime with each student, both during class and outside of class. However, asclass sizes increase, the time an instructor can dedicate to each student declines.Other pedagogical changes may also occur as class sizes increase. In general,one might expect teaching methods to shift toward assessments that mayencourage memorization. It is unclear a priori how this might affect averagegrades in a given class.5 Pct_1st_yr, Pct_2nd_yr, and Pct_3rd_yr represent thepercentages of each class that are made up of first-, second-, and third-year
5It is possible that Students is endogenous. This would be the case if instructors who givehigher grades attract larger classes. However, there are systemic constraints to dramatically in-creasing a particular instructor’s class size. Typically, when an instructor’s course fills, additionalstudents are shunted to sections taught by other instructors rather than by finding a largerroom or by increasing an instructor’s teaching load.

100 Social Science Quarterly
students. On the supposition that student grades improve with experienceand maturity, classes with higher proportions of nonseniors should have lowerGPAs.
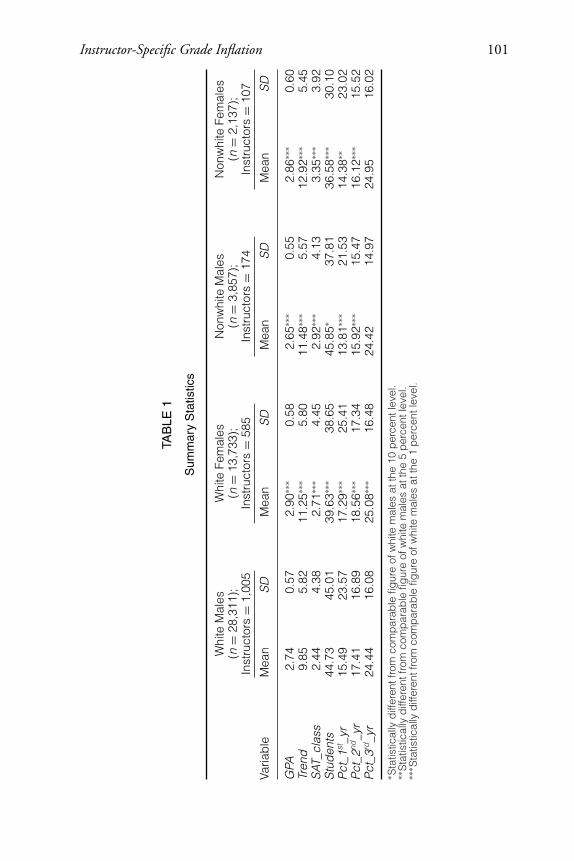
Given the wide range of departmental characteristics that may influenceGPA, we include departmental characteristics in the form of a department-specific dummy variable for each of the 38 distinct departments in our sample.The impact of time on GPA, or how grade inflation changes over time, ismeasured with the yearly time trend (Trend). An important purpose of thisstudy is to analyze differences in grade inflation by instructor characteristics.The instructor-level measures are gender and ethnicity. Given data limitations,we employ a white/nonwhite distinction for ethnicity.6 As an initial step, wereport summary statistics by gender and ethnicity in Table 1.7
Our dependent variable, GPA, is the average GPA in each course on astandard four-point system. Average GPA in all sampled courses is 2.812;however, GPA for the 1984–2005 period increased from 2.574 to 2.949, anoverall increase of 0.375. Note that this increase is greater than the 0.307average increase over roughly the same period reported by Rojstaczer (2008)for universities across the United States, which may indicate that UNT hasexperienced more grade inflation than other schools.
Table 1 provides additional descriptive information about our data. Whitemales taught nearly 60 percent of the 48,038 classes in our sample. Whitefemales, nonwhite males, and nonwhite females taught, respectively, 28.6percent, 8.0 percent, and 4.4 percent of all classes. Without addressing gradeinflation directly, Table 1 provides information on the average grade assignedby each category of instructor. Classes taught by nonwhite males have thelowest average GPA: 2.65. White females assigned the highest grades of anygroup.
Estimation Methods
We use panel data techniques to estimate the determinants of averageGPA using an unbalanced panel of UNT courses from 1984–1985 to 2004–2005, including the above-mentioned independent variables that measurecharacteristics of departments, faculty, and students. The standard approachto estimating a model using panel data with instructor-specific effects would beto use a random-effects estimator, since variables such as gender and ethnicitydo not change over time in our data set.8 Unfortunately, a Hausman test
6We estimated the model removing foreign-born instructors from the analysis. This did notchange our results dramatically; as a result we present the all-inclusive results here. The resultsfrom this more limited sample are available on request from the authors.
7Another instructor-level measure is tenure status. Our data only include rank as of 2005,so no allowance can be made for changes in tenure status.
8Although a tenure-track faculty member can change his or her rank over time, our data donot include this information.
Instructor-Specific Grade Inflation 101
TAB
LE1
Sum
mar
yS
tatis
tics
Whi
teM
ales
Whi
teFe
mal
esN
onw
hite
Mal
esN
onw
hite
Fem
ales
(n=
28,3
11);
(n=
13,7
33);
(n=
3,85
7);
(n=
2,13
7);
Inst
ruct
ors
=1,
005
Inst
ruct
ors
=58
5In
stru
ctor
s=
174
Inst
ruct
ors
=10
7
Varia
ble
Mea
nS
DM
ean
SD
Mea
nS
DM
ean
SD
GPA
2.74
0.57
2.90
∗∗∗
0.58
2.65
∗∗∗
0.55
2.86
∗∗∗
0.60
Tren
d9.
855.
8211
.25∗∗
∗5.
8011
.48∗∗
∗5.
5712
.92∗∗
∗5.
45S
AT_c
lass
2.44
4.38
2.71
∗∗∗
4.45
2.92
∗∗∗
4.13
3.35
∗∗∗
3.92
Stu
den
ts44
.73
45.0
139
.63∗∗
∗38
.65
45.8
5∗37
.81
36.5
8∗∗∗
30.1
0P
ct_1
st_y
r15
.49
23.5
717
.29∗∗
∗25
.41
13.8
1∗∗∗
21.5
314
.38∗∗
23.0
2P
ct_2
nd_y
r17
.41
16.8
918
.56∗∗
∗17
.34
15.9
2∗∗∗
15.4
716
.12∗∗
∗15
.52
Pct
_3rd
_yr
24.4
416
.08
25.0
8∗∗∗
16.4
824
.42
14.9
724
.95
16.0
2
∗ Sta
tistic
ally
diff
eren
tfro
mco
mp
arab
lefig
ure
ofw
hite
mal
esat
the
10p
erce
ntle
vel.
∗∗S
tatis
tical
lyd
iffer
entf
rom
com
par
able
figur
eof
whi
tem
ales
atth
e5
per
cent
leve
l.∗∗
∗ Sta
tistic
ally
diff
eren
tfro
mco
mp
arab
lefig
ure
ofw
hite
mal
esat
the
1p
erce
ntle
vel.
102 Social Science Quarterly
indicates that the random-effects model is inappropriate.9 When the random-effects estimator is inappropriate, an alternative is to estimate the model usinga fixed-effects estimator. However, fixed-effects estimation can only be usedwith time-varying covariates, as the influence of time-invariant variables aresubsumed into the estimated fixed effects.
Since the instructor-specific characteristics in which we are interested (gen-der and ethnicity) do not vary with time, we are forced to estimate theireffects on grade inflation in a different way. As pointed out by Wooldridge(2002:267), even though the effect of time-invariant variables cannot beidentified at any single point in time, differences in the marginal effect oftime-invariant variables can be identified by interacting these variables with atime trend.10 In our case, it is possible to tease out information on differencesin rates of grade inflation over time by interacting time-invariant instructorcharacteristics (gender and ethnicity) with the time trend and estimating astandard fixed-effects model. The resulting estimation will produce a fixedeffect for each instructor and an estimated rate of change of GPA that variesby instructor characteristic. The estimation results can then be used to predictthe time pattern of GPA and grade inflation for each instructor characteristicor group of characteristics.
In order to estimate the time pattern of GPA, we first separate instructorsinto one of four categories based on gender and ethnicity: white males, whitefemales, nonwhite males, and nonwhite females.11 Given this gender-ethnicitycategorization, we estimate the following equation:
GPAit = (a + u j ) + Dkμ + Dk Trend tβ + C j Trend tδ + Sitσ + εit .
The instructor-specific fixed effect, uj, represents the extent to which in-structor j has GPAs higher or lower than the overall average, net of the influenceof other independent variables. Dk is a vector of dummy variables indicatingthe department in which course i is taught at time t. This vector is also inter-acted with the time trend to measure any grade inflation that may result fromunobservable department characteristics. Cj represents a vector of dummy
9χ 2(75) = 245.99, significant at any conventional level of significance.
10Wooldridge’s example uses time dummies, but the logic holds for a time trend as well.He uses a specific example of estimating the gap in wages for men and women over timeusing a fixed-effect estimator. He states (p. 267): “we can estimate how the gender gap haschanged over time, even though we cannot estimate the gap in any particular period of time.”In other words, one cannot identify the marginal effect of being male on wages, but one canestimate the difference in how wages change over time between men and women. Analogously,we cannot estimate the marginal effect of “white male,” but we can estimate (and test) thedifference in the rate of change in GPAs over time for white males versus other gender-ethnicitycategories. We also estimate the model using Wooldridge-type time-dummy interactions withthe gender/ethnicity categories. The resulting inflation rates show little difference to those fromthe time trend model; we choose the time trend model mainly for ease of discussion. A full setof predictions from both models are available from the authors.
11Our sample includes 1,005 individual white male instructors, 585 white females, 174nonwhite males, and 107 nonwhite females. More specific subdivisions result in very smallsample sizes.

Instructor-Specific Grade Inflation 103
TABLE 2
Regression Results: Ethnicity and Gender Trends
N = 48,038Variable Coefficient SE
Trend (for white males) 0.0119∗∗∗ 0.0025White female trend 0.0044∗∗∗ 0.0011Nonwhite male trend 0.0009 0.0017Nonwhite female trend 0.0073∗∗∗ 0.0027Students −0.0017∗∗∗ 0.0001SAT_class −0.0013 0.0009Pct_1st_yr −0.0037∗∗∗ 0.0001Pct_2nd_yr −0.0040∗∗∗ 0.0001Pct_3rd_yr −0.0031∗∗∗ 0.0001R2 = 0.1213
∗∗∗Significant at 1 percent level.
variables indicating the gender-ethnicity category into which instructor j fits,which is interacted with the time trend to capture the category-specific rate ofgrade inflation over the sample period. The vector Sit represents characteristicsof course i in year t. μ, δ, β, and σ , represent vectors of parameters to beestimated, and εit represents the random error term.
Results and Discussion
The results in Table 2 provide several new insights into the causes of gradeinflation.12 Interesting patterns emerge, particularly with respect to instructorgender and ethnicity. The variable Trend represents the time trend in GPA forwhite male instructors, and the remaining trend interactions are interpretedas differences from the white male GPA trend. The most interesting result isthat female instructors appear to inflate grades at a statistically significantlygreater rate than their male counterparts. Given the estimated gender-ethnicitycategory rates of grade inflation, we can estimate the effect for all females, allmales, all whites, and all nonwhites. Unsurprisingly, the inflation rate of allfemales is significantly different from that of all males. The estimated rate ofchange in GPA for male instructors is 0.013 and 0.024 for female instructors.Regarding instructor ethnicity, the inflation rates of white and nonwhite
12The estimation also includes dummy variables for each department as well as department-specific trends. For brevity, the coefficients of the department-specific effects are not reported,but they are available from the authors.

104 Social Science Quarterly
instructors are not statistically different; the estimated rates of change in GPAare 0.016 and 0.020 for white and nonwhite instructors, respectively.13
The nature of the estimation method precludes the inclusion of gender-specific or ethnicity-specific fixed effects (as these do not vary over time), butby calculating predicted values for each group for each period one can betterunderstand changes in average grades over the sample period. These predictedvalues are presented in Figure 1. Over the sample period, female instructorshave higher predicted grades on average than males. Overall predicted gradesissued by female instructors increased by 12.1 percent, while male instructors’grades rose by 9.5 percent. Regarding instructor ethnicity, nonwhites havelower predicted grades on average in all periods except one. This result issomewhat surprising, since the expectation may be that nonwhite instructorsgive higher grades to combat discrimination on the part of students or theadministration. While the average predicted grade for nonwhite instructorsrose at a faster rate over the period (15.1 percent vs. 12.0 percent), thepreviously discussed estimated trends in Table 2 are not statistically differentby ethnicity.
Taken together, these results may provide some support for the contentionthat female faculty members may face greater pressure to issue higher grades,perhaps to counter perceived or actual discrimination or as a result of perceivedjob insecurity. However, it should be noted that the percentage of women ofthe total faculty has increased dramatically over the sample period—from21.7 percent in the 1984–1985 academic year to 43.5 percent in 2004–2005.Given that women on average tend to issue higher grades than males in allperiods, some part of the finding that female instructors’ grades have increasedat a more rapid pace than males may be because the proportion of women inthe faculty has risen. In any case, female instructors do tend to give highergrades than their male colleagues.
It is interesting that nonwhites evidently do not seem to perceive similarpressure. However, the nonwhite category is rather heterogeneous, groupingtogether nonwhite American instructors and nonwhite instructors who arecitizens of other countries. These subgroups may have very different motiva-tions and incentives with respect to the issuance of grades, but our data do notpermit an examination of this possibility. As was the case with female facultymembers, the proportion of nonwhite faculty members in the total faculty hassteadily increased over the sample period (from 6.7 percent to 16.6 percent).While this issue bears further consideration in future research, we find littleevidence in our data that an instructor’s ethnicity has any significant effect onthe grades he or she gives.
Grading behavior also varies according to characteristics of each class; asthe number of students in each class increases, average grades assigned fall.
13Test statistic for male versus female trend is F(1,46086) = 10.41, significant at 1 percentlevel. Test statistic for white versus nonwhite trend is F(1,46086) = 1.34, insignificant as anyconventional level of significance.

Instructor-Specific Grade Inflation 105
FIGURE 1
Predicted Values Gender and Ethnicity
106 Social Science Quarterly
TABLE 3
Predicted Values: Departmental Groupings
InflationDepartmental Grouping Trend = 0 Trend = 20 Rate (%)
Biology, Chemistry, Math, Physics, ComputerScience, Engineering, Speech andHearing Sciences
2.479 2.638 6.33
Accounting, BCIS, Finance, GeneralBusiness, Management, Marketing
2.571 2.700 4.90
Teacher Education, Educational Psychology,Special Education, Kinesiology
3.112 3.299 6.01
Art, Art History, Dance and Theater, English,Language, History, Philosophy, RTVF,Journalism
2.585 3.073 18.88
Applied Technology, Economics, BehavioralScience, Communication, CriminalJustice, Geography, Political Science,Psychology, Anthropology, Social Work,Sociology
2.634 2.826 7.29
All departments (37) 2.612 2.924 11.94
Unsurprisingly, classes with larger proportions of first-, second-, and third-year students receive lower grades, holding other factors constant. There isalso some evidence that average grades assigned decline slightly as the averagequality of students in each class (as measured by SAT scores) rises, echoing theresults reported in Jewell and McPherson (2009). These authors interpret theresult to mean that if student quality had not been improving grade inflationwould have been an even larger problem. It may also imply that average SATscores is a less-than-ideal measure of student quality.
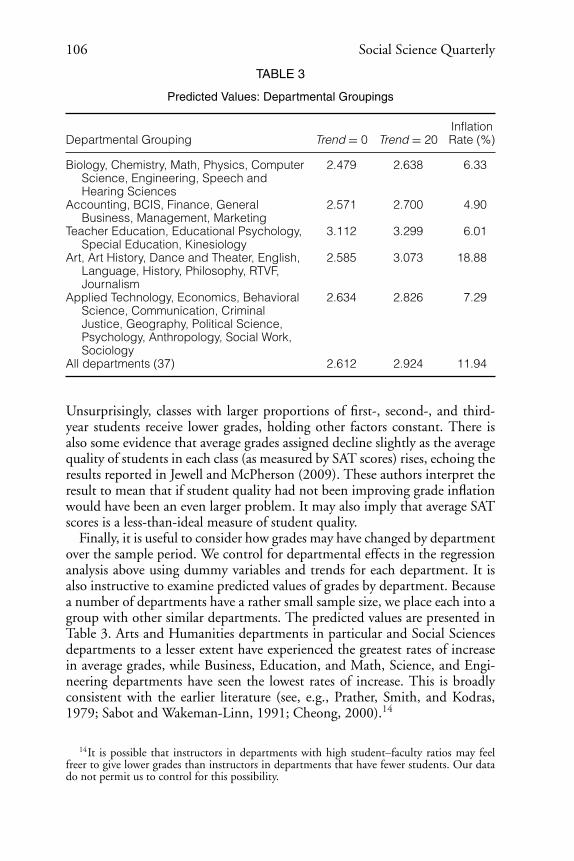
Finally, it is useful to consider how grades may have changed by departmentover the sample period. We control for departmental effects in the regressionanalysis above using dummy variables and trends for each department. It isalso instructive to examine predicted values of grades by department. Becausea number of departments have a rather small sample size, we place each into agroup with other similar departments. The predicted values are presented inTable 3. Arts and Humanities departments in particular and Social Sciencesdepartments to a lesser extent have experienced the greatest rates of increasein average grades, while Business, Education, and Math, Science, and Engi-neering departments have seen the lowest rates of increase. This is broadlyconsistent with the earlier literature (see, e.g., Prather, Smith, and Kodras,1979; Sabot and Wakeman-Linn, 1991; Cheong, 2000).14
14It is possible that instructors in departments with high student–faculty ratios may feelfreer to give lower grades than instructors in departments that have fewer students. Our datado not permit us to control for this possibility.
Instructor-Specific Grade Inflation 107
Conclusion
That grades at American colleges and universities have risen over the pastseveral decades is by now beyond dispute. What factors may have caused thisphenomenon has been the subject of much academic research. This articleadds to this literature by using a substantially larger data set than has ever beenpreviously used to examine the determinants of grade inflation, particularlythe characteristics of instructors.
A number of factors contribute to the phenomenon of grade inflation,including the number and type of students in each class. In addition, certaindisciplines seem to inflate grades differentially. We find, consistent with theearlier literature, that the arts and humanities (and to a lesser extent the socialsciences) tend to have inflated grades at a higher rate than the sciences andother disciplines.
Our focus, however, is on the effects of characteristics of instructors. Ourresults indicate that certain individuals seem to be especially inclined towardassigning higher and higher grades over time. While we cannot know whatmotivates particular individuals, it is interesting that women instructors issuehigher grades on average in every period. On average female faculty membersalso seem to inflate grades, although some part of this may be the result of thedramatic increase in the proportion of the faculty that is female. It is possiblethat despite our efforts to control for student quality, female instructors are onaverage teaching better students. Similarly, students in classes taught by womenmay, for some reason, put forth more effort. Female instructors could also bemore effective teachers than their male colleagues. Still, these explanationsstrike us as unlikely. Instead, because of real or perceived discrimination onthe part of students or administrators, female instructors may feel it necessaryto excel as teachers in order to be eligible for promotion, tenure, or meritincreases.
As noted earlier, the earlier literature has found that women are less likelyto receive tenure and be promoted. These results suggest that some significantpart of inflation can be attributed to this characteristic of instructors. We findvery little evidence of differential grade inflation by ethnicity. In all periodsexcept one, nonwhite instructors give lower average grades than do whites;furthermore, there is no significant difference by ethnicity in the rate at whichgrades have increased. Nevertheless, greater disaggregation by ethnicity thanis permitted by our data would be a useful avenue for future research andmight help illuminate whether or not faculty members from particular ethnicgroups feel any pressure to grade differently.
REFERENCES
Anglin, P. M., and R. Meng. 2000. “Evidence on Grades and Grade Inflation at Ontario’sUniversities.” Canadian Public Policy 26(3):361–68.

108 Social Science Quarterly
Bello, A. L., and D. M. Valientes. 2006. Grade Inflation: Fact or Myth? Draft Paper. Los Banos,CA: Department of Economics, University of the Philippines.
Birnbaum, R. 1977. “Factors Related to University Grade Inflation.” Journal of Higher Educa-tion 48(5):519–39.
Cheong, K. S. 2000. Grade Inflation at the University of Hawaii-Manoa. Department ofEconomics Working Paper No. 00-2.
Cluskey Jr., G. R., N. Griffin, and C. Ehlen. 1997. “Accounting Grade Inflation.” Journal ofEducation for Business 72(5):273–77.
Dickson, V. A. 1984. “An Economic Model of Faculty Grading Practices.” Journal of EconomicEducation 15(3):197–203.
Farley, B. L. 1995. “‘A’ Is for Average: The Grading Crisis in Today’s Colleges.” Issues ofEducation at Community Colleges: Essays by Fellows in the Mid-Career Fellowship Program atPrinceton University. Princeton, NJ: Center for Faculty Development, Mid-Career FellowshipProgram, History Department.
Germain, M. L., and T. A. Scandura. 2005. “Grade Inflation and Student Individual Differencesas Systematic Bias in Faculty Evaluations.” Journal of Instructional Psychology 32(1):58–67.
Ginther, D. K., and S. Khan. 2004. “Women in Economics: Moving Up or Falling Off theAcademic Career Ladder?” Journal of Economic Perspectives 18(3):193–214.
Grove, W. A., and T. Wasserman. 2004. “The Life-Cycle Pattern of Collegiate GPA: Longitu-dinal Cohort Analysis and Grade Inflation.” Journal of Economic Education 35(2):162–74.
Isely, P., and H. Singh. 2005. “Do Higher Grades Lead to Favorable Student Evaluations?Another Look at an Old Controversy.” Journal of Economic Education 36(1):29–42.
Jewell, R. T., and M. A. McPherson. 2009. Whose Fault Is It? Assigning Blame for Grade Inflationin Higher Education. Draft Paper. Denton, TX: University of North Texas, September.
Kolevzon, M. S. 1981. “Grade Inflation in Higher Education: A Comparative Study.” Researchin Higher Education 15(3):195–212.
McPherson, M. A. 2006. “Determinants of How Students Evaluate Teachers.” Journal ofEconomic Education 37(1):3–20.
McPherson, M. A., and R. T. Jewell. 2007. “Leveling the Playing Field: Should StudentEvaluation Scores be Adjusted?” Social Science Quarterly 88(3):868–81.
McPherson, M. A., R. T. Jewell, and M. Kim. 2009. “What Determines Student EvaluationScores? A Random Effects Analysis of Undergraduate Economics Classes.” Eastern EconomicJournal 35:37–51.
Mulvenon, S., and D. Ferritor. 2005. “Grade Inflation in Higher Education: Isolated orSystematic?” International Journal of Learning 12(6):55–62.
Nelson, J. P., and K. A. Lynch. 1984. “Grade Inflation, Real Income, Simultaneity, and TeachingEvaluations.” Journal of Economic Education 15(Winter):21–37.
Nettles, M. T., L. W. Perna, E. M. Bradburn, and L. Zimbler. 2000. Salary, Promotion, andTenure Status of Minority and Women Faculty in U.S. Colleges and Universities. NCES-2000-173.U.S. Department of Education National Center for Education Statistics, March.
Prather, J. E., G. Smith, and J. E. Kodras. 1979. “A Longitudinal Study of Grades in 144Undergraduate Courses.” Research in Higher Education 10(1):11–24.
Rojstaczer, S. 2008. “Grade Inflation at American Colleges and Universities.” Available at<http://www.gradeinflation.com>.

Instructor-Specific Grade Inflation 109
Sabot, R., and J. Wakeman-Linn. 1991. “Grade Inflation and Course Choice.” Journal ofEconomic Perspectives 5(1):159–70.
Sonner, B. 2000. “A is for ‘Adjunct’ Examining Grade Inflation in Higher Education.” Journalof Education for Business 76(1):5–8.
Wooldridge, J. M. 2002. Econometric Analysis of Cross Sectional and Panel Data. Cambridge,MA: MIT Press.
Zangenehzadeh, H. 1988. “Grade Inflation: A Way Out.” Journal of Economic Education19(3):217–26.