institute of management, nirma university · institute of management, nirma university ... the...
TRANSCRIPT

1
INSTITUTE OF MANAGEMENT, NIRMA UNIVERSITY MBA (FT)-I (Batch 2015-2017) : Term – I (End-Term Exam)
Course : Managerial Economics EC- 501
------------------------------------------------------------------------------------------------------------------------------------------ Maximum Marks: 100 Date: 21-09-2015 Duration: 3 Hours Close Book Exam ------------------------------------------------------------------------------------------------------------------------------- Instructions:
There are 4 pages and 10 questions in this question paper. Please attach the question paper along with the original answer sheet Answer all the questions and strictly adhere to the instructions given. The question paper is complete in all aspects. You may make reliable assumption if it
is necessary. Marks assigned to each question are given in the bracket.
---------------------------------------------------------------------------------------------------------------------- Q. 1 Examine the validity of the following statements: (Answer any 14) (28 marks)
(Word limit Maximum 50 words for each answer)
a. The marginal utility of last unit of X consumed is thrice the marginal utility of the last unit of Y consumed. The consumer is in equilibrium only if the price of X is one-third of the price of Y. Not true/False. At equilibrium, MUa/Pa =MUb/Pb Price of X should be three
times at equilibrium.
b. In a consumer’s basket it is possible to have all inferior or all normal goods. Not true/False. One can not have ALL inferior goods. Because, if income increases,
all inferior good would imply less spending rather than more spending. However, it is possible to have all normal goods with weighted average income
elasticity of 1.
c. As we move from left to right along the income consumption curve (ICC), the consumer’s money income, his real income and his utility level decrease. False/Not True.
d. Price elasticity of demand is measured through the movement along the demand curve.
True.
e. An increase in the income of the consumer would make the demand curve more elastic at a given point. Not True. As income increases, demand would increase at the same price and
Demand curve shifts to the right. E = (dq/dp)*(P/Q) . dq/dp and P remaining same, Q increases and elasticity decreases.
f. When demand is price elastic, the total revenue (TR) is directly related to the quantity
and inversely related to price of the good. True. TR=P*Q P and Q are inversely related. As P increases, Q will decrease and
hence TR. Because, due to elasticity being more than 1 (absolute), increase in price result in more decrease in Q.
g. Time series models require data only on the independent variables.

2
False. Requires data on both dependent and independent variables.
h. When MP < AP, the average product would have a tendency to increase as the employment of the factor increases. Not true. Since MP<AP, additional factor, would increase output by MP but which
is less than AP and hence will drag AP lower.
i. The short run supply curve of the perfectly competitive firm is given by the rising portion of its marginal cost curve over and above the average cost curve. False/Not true, Short run supply curve is MC above AVC.
j. If the demand curves for a monopolist’s commodity are identical in two separate
markets then by practicing third degree price discrimination, the monopolist will increase total revenue and hence total profits. In identical markets, price discrimination is not possible because they have same
elasticity at a given price.
k. Under first degree price discrimination, total output produced by a monopolist will be equivalent to that of perfectly competitive industry. True.
l. In the presence of economies of scale in production, a firm can do marginal cost pricing. False. Under economies of scale, MC keeps falling/decreasing. Hence, P=MC is
NOT profit maximizing.
m. In oligopoly models if there is sequence to moves, firms with identical costs of production will have equal market shares in equilibrium. False. This is possible under Simultaneous moves. In sequential moves, there
could be first mover advantage (Stackleberg L-F model)
n. In monopolistic competition, when firms compete with horizontally differentiated goods they have to separate consumers with different income levels in specifying product differentiation. False. Differentiation based on Income is for vertically differentiated products.

3
o. A kinked demand curve occurs in an oligopoly when a firm increases its price and others follow it. False.
p. Dominant strategy in game theory refers to the strategy of a player which deciminates
all other players. False. Dominant strategy DOES NOT mean decimation/war against competitors.
Dominant strategy is only a strategy which is best irrespective of what competitors do. Among competitors, firm with a small and least market share can also have dominant strategy,.e.g., not to compete head on and develop niche.
q. The distribution of two commodities between two individuals is said to be Pareto optimal if one individual is worse off because the other one has become better off. True.
r. In oligopoly, when firms compete aggressively every one could be worse off.
True. It is POSSIBLE that all firms suffer (but NOT NECESSARY. For example, aggressive competition on quality may result in one being better off if consumer preferences so demand)
xxxxxxxxxxxxxxxxxxxxxxxxxxxxxxxxxxxxxxxxxxxxxxxxxxxxxxxxxxxxxxxxxxxxxxxxxxxxxxxx
Q. 2 (2+2+2+2=8 marks)
Chetna has a weekly income of Rs 200, which she allocates between two goods: Tea (T) and Snacks (S).
a. Suppose Tea costs Rs 4 per cup and snacks cost Rs 2 per bowl. Draw her budget constraint.
b. Suppose also that her utility function is given by the equation u(T, S) = 2T + S. What combination of Tea and Snacks should she buy to maximize her utility? (Hint: Tea and snacks are perfect substitutes.)
c. Chetna’s restaurant has a special promotion. If she buys 20 bowls of snacks (at Rs2 per bowl), she gets the next 10 bowls for free. This offer applies only to the first 20 bowls she buys. All snacks in excess of the first 20 bowls (excluding bonus snacks) are still Rs 2 per bowl. Draw her budget constraint.
d. An outbreak of potato rot raises the price of snacks to Rs 4 per bowl. The restaurant ends its promotion. What does her budget constraint look like now? What combination of tea and snacks maximizes her utility?
-------------------------------------------------------------------------------------------------------------------------------------
Answer:
a. Budget Constraint: 4T+2S ≤200 4T+2S=200 2T+S =100
b. Slope of indifference curve is : (-)1/2. The budget constraint and indifference
curve overlap. Infinite solutions, all on Budget Line.
c. Assume that snacks are on the horizontal axis. Chetna’s budget constraint
has a slope of –1/2 until Chetna has purchased twenty bowls of snacks, is then

4
flat from 20 to 30 bowls of snacks, since the ten next bowls of snacks are free,
and then has a slope of –1/2 until it intercepts the snacks axis at 110.
50
110 Snacks
e. With the price of potatoes at Rs4, Chetna may buy either 50 cups of tea or 50
bowls of snacks, or some combination in between. She maximizes utility at,
say, U = 100 at point A when she consumes 50 cups of tea and no snacks. This
is a corner solution.
Tea 100
Budget Constraint
A 50 Indifference Curve for U=100
25 50 75 100 125 Snacks
xxxxxxxxxxxxxxxxxxxxxxxxxxxxxxxxxxxxxxxxxxxxxxxxxxxxxxxxxxxxxxxxxxxxxxxxxxxx

5
Q. 3 (2+2+2+2=8 marks)
The director of a theatre company in a small college town is considering changing the way he prices tickets. He has hired an economic consulting firm to estimate the demand for tickets. The firm has classified people who go the theatre into two groups, and has come up with two
demand functions. The demand curves for the general public (Qgp) and students (Qs) are
given below.
Qgp = 500 – 5 P
Qs = 200 – 4 P
a. Graph the two demand curves on one graph, with P on the vertical axis and Q on the horizontal axis. If the current price of tickets is Rs. 35, identify the quantity demanded by each group.
b. Find the price elasticity of demand for each group at the current price and quantity.
c. Is the director maximizing the revenue he collects from ticket sales by charging $35 for each ticket? Explain.
d. What price should he charge each group if he wants to maximize revenue collected from ticket sales?
-------------------------------------------------------------------------------------------------------------------------------
Graph the two demand curves on one graph, with P on the vertical axis and Q on the
horizontal axis. If the current price of tickets is $35, identify the quantity demanded by
each group.
Both demand curves are downward sloping and linear. For the general public, the vertical
intercept is 100 and the horizontal intercept is 500. For the students, the vertical intercept is
50 and the horizontal intercept is 200. The general public demands
Qgp 500 5(35) 325 tickets and the students demand
Qs 200 4(35) 60 tickets.
Find the price elasticity of demand for each group at the current price and quantity.
The elasticity for the general public is
gp 5(35)
325 0.54 and the elasticity for the
students is
gp 4(35)
60 2.33. If the price of tickets increases by one percent then the
general public will demand .54% fewer tickets and the students will demand 2.33% fewer
tickets.
Is the director maximizing the revenue he collects from ticket sales by charging $35 for
each ticket? Explain.
6
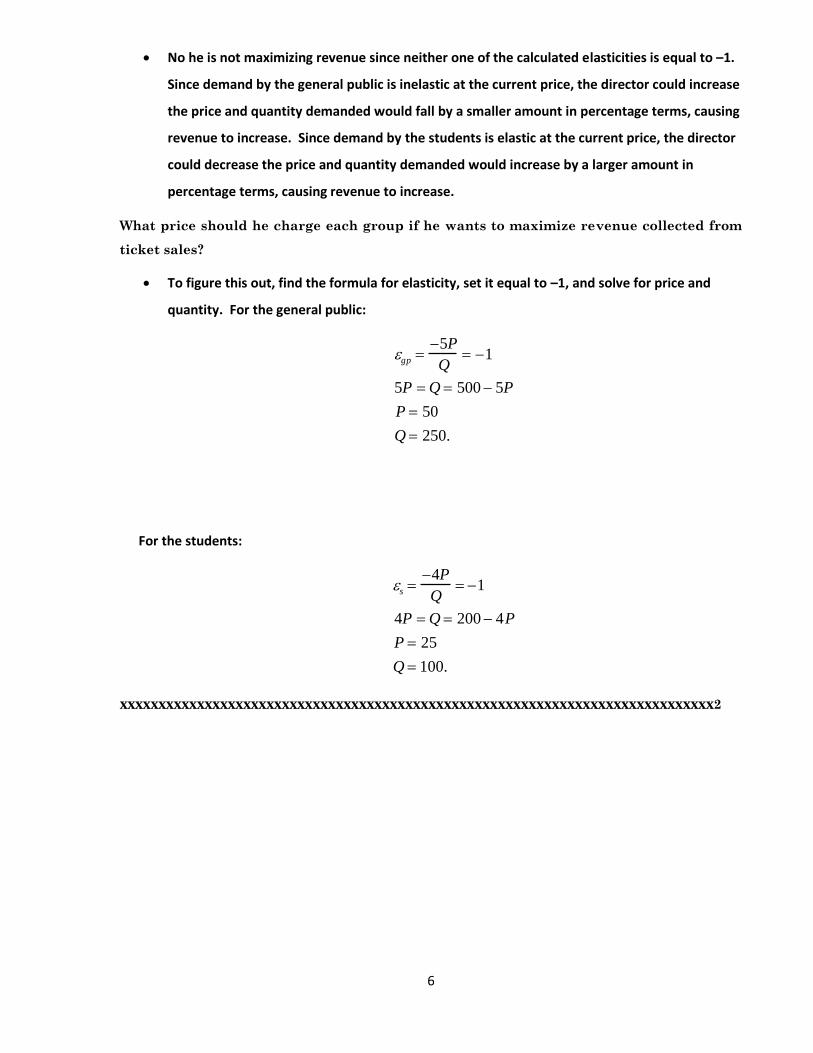
No he is not maximizing revenue since neither one of the calculated elasticities is equal to –1.
Since demand by the general public is inelastic at the current price, the director could increase
the price and quantity demanded would fall by a smaller amount in percentage terms, causing
revenue to increase. Since demand by the students is elastic at the current price, the director
could decrease the price and quantity demanded would increase by a larger amount in
percentage terms, causing revenue to increase.
What price should he charge each group if he wants to maximize revenue collected from
ticket sales?
To figure this out, find the formula for elasticity, set it equal to –1, and solve for price and
quantity. For the general public:
gp 5P
Q 1
5P Q 500 5P
P 50
Q 250.
For the students:
s 4P
Q 1
4P Q 200 4P
P 25
Q 100.
xxxxxxxxxxxxxxxxxxxxxxxxxxxxxxxxxxxxxxxxxxxxxxxxxxxxxxxxxxxxxxxxxxxxxxxxxxxxx2

7
Q. 4
(2+2+1=5 marks)
Suppose a chair manufacturer is producing in the short run when equipment is fixed. The manufacturer knows that as the number of labourers used in the production process increases from 1 to 7, the number of chairs produced changes as follows: 10, 17, 22, 25, 26, 25, 23.
a. Calculate the marginal and average product of labor for this production function.
b. Does this production function exhibit, diminishing returns to labor? Explain.
c. Explain intuitively what might cause the marginal product of labor to become negative.
-------------------------------------------------------------------------------------------------------------------------------------------
Answer:
a. The average product of labor, APL, is equal to Q
L. The marginal product of labor,
MPL, is equal to
Q
L, the change in output divided by the change in labor input. For
this production process we have:
L Q APL MPL
0 0 __ __
1 10 10 10
2 17 8 1/2 7
3 22 7 1/3 5
4 25 6 1/4 3
5 26 5 1/5 1
6 25 4 1/6 -1
7 23 3 2/7 -2
b. This production process exhibits diminishing returns to labor characteristic of all
production functions with one fixed input. The first worker has a marginal product
of 10; from the second to the fifth workers, the marginal product is declining, but
still positive. The sixth and seventh workers have negative marginal products.
c. Labor’s negative marginal product for L > 5 may arise from congestion in the chair
manufacturer’s factory. Since more laborers are using the same, fixed amount of
capital, it is possible that they could get in each other’s way, decreasing efficiency
and the amount of output.
xxxxxxxxxxxxxxxxxxxxxxxxxxxxxxxxxxxxxxxxxxxxxxxxxxxxxxxxxxxxxxxxxxxxxxxxxxxxxxxx

8
Q. 5 What is Monopsony? Compare the Equilibrium Price and Quantity determination of a Monopolist and a Monopsonist. (Use diagram to support your answer) (10 marks)
Definition/Meaning of Monopsony 1 mark
Diagram figure 9.15 pg-320 text book pindyck 6 marks
Explanation of the diagram. 3 marks

9
xxxxxxxxxxxxxxxxxxxxxxxxxxxxxxxxxxxxxxxxxxxxxxxxxxxxxxxxxxxxxxxxxxxxxxxxxxxxxxxx
Q. 6 “Dumping is a form of Price Discrimination between the Home Market and the foreign Market” How would the monopolist determine the output to be dumped.
(Use diagram t
o support your answer) (10 marks)
Meaning of dumping. 1 mark
Examples of Dumping. 1 mark
Diagram of Dumping. 6 marks
Explanation of the Diagram. 2 marks
• Dumping is the practice of charging a lower price for exported goods than for goods sold domestically.
• Dumping is an example of price discrimination: the practice of charging different customers different prices.
• Price discrimination and dumping may occur only if
imperfect competition exists: firms are able to influence market prices.

10
markets are segmented so that goods are not easily bought in one market and resold in another.
• Dumping may be a profit maximizing strategy because of differences in foreign and domestic markets.
• One difference is that domestic firms usually have a larger share of the domestic market than they do of foreign markets.
Because of less market dominance and more competition in foreign markets, foreign sales are usually more responsive to price changes than domestic sales.
Domestic firms may be able to charge a high price in the domestic market but must charge a low price on exports if foreign consumers are more responsive to price changes
• Draw a diagram of how dumping occurs when a firm is a monopolist in the domestic market but a small competitive firm in foreign markets.
Because the firm is a monopolist in the domestic market, the domestic market demand curve is downward sloping, and the marginal revenue curve lies below that demand curve.
Because the firm is a small competitive firm in foreign markets, the foreign market demand curve is horizontal, representing the fact that exports are very responsive to small price changes.

11
• To maximize profits, the firm will sell a low amount in the domestic market at a high price PDOM
, but sell in foreign markets at a low price PFOR.
Since an additional unit can always be sold at PFOR , the firm will sell its products at a high price in the domestic market until marginal revenue there falls to PFOR.
Thereafter, it will sell exports at PFOR until marginal costs exceed this price.
• In this case, dumping is a profit-maximizing strategy.
xxxxxxxxxxxxxxxxxxxxxxxxxxxxxxxxxxxxxxxxxxxxxxxxxxxxxxxxxxxxxxxxxxxxxxxxxxxxxxxx

12
Q. 7 (6+7=13 marks)
a. A firm is operating in Monopolistic Competition with the following Demand and Cost functions
P=11,100 – 30Q, TC = 4, 00,000 + 300Q–30Q2 + Q3
What is the short run Equilibrium Output and the price of the firm?
Solution
P=11,100 – 30Q
TR=PXQ
TR= (11,100 – 30Q) X Q
TR= 11,100Q – 30Q2
MR= 11,100 – 60Q
TC = 4, 00,000 + 300Q–30Q2 + Q3
MC = 300 –60Q +3 Q2
MC=MR
300 –60Q +3 Q2= 11,100 – 60Q
3 Q2= (11,100-300)
Q=60
P= 11,100 – (30X60) = 9,300
Ans; Equilibrium Output 60 units and the price Rs. 9,300 of the firm
b. What do you mean by the Excess Capacity under Monopolistic Competition? Show how the Excess Capacity can be utilized in the long run by the firm operating under Monopolistic Competition.
Meaning of Excess capacity. 1 mark
Diagram of Excess capacity in the long run.(Long run Normal profit ) 5 marks
Explanation of the diagram 1 mark

13
In the long run, optimal production is where Long Run Average Cost is minimum. (Quantity N in above diagram)
However, in the long run , socially optimum output = M (in above diagram), where P=AC where AC curve intersects with demand curve. (Tangent). This is where the resources of the society are OPTIMALLY utilized.
Hence, excess capacity. Capacity which (from society point of view) should exist but does not (from producer point of view).
Note: In long run, optimal production is where Min AC and NOT where MR=MC.

14
-------------------------------------------------------------------------------------------------------------------------------------
EXCESS CAPACITY UNDER MONOPOLISTIC COMPETITION
Theories of Chamberlin’s monopolistic competition and Joan Robinson’s
imperfect competition have revealed that a firm under monopolistic
competition or imperfect competition in long-run equilibrium produces an
output which is less than socially optimum or ideal output.
This means that firms operate at the point on the falling portion of long-
run average cost curve that is, they do not produce the level of output at
which long-run average cost is minimum. Long-run equilibrium of a firm
under monopolistic competition is achieved when the demand curve (or
average revenue curve) facing a firm becomes tangential to the long-run
average cost curve so that it earns only normal profits.
Under such circumstances a firm can reduce average cost (and hence
price) by expanding output to the minimum level of long-run average
cost, but it will not do so because its profits are maximised (equality of
15
marginal revenue with marginal cost is attained) at the level of output
smaller than that at which its long-run average cost is minimum.
Society’s productive resources are fully utilised when they are used to
produce the level of output which renders long-run average cost
minimum. Thus a monopolistically competitive firm produces less than
the socially optimum or ideal output, that is, the output corresponding to
the lowest point of long-run average cost curve. This is in sharp contrast
to the position of the firm in long-run equilibrium under perfect
competition, which operates at the minimum point of the long-run
average cost curve.
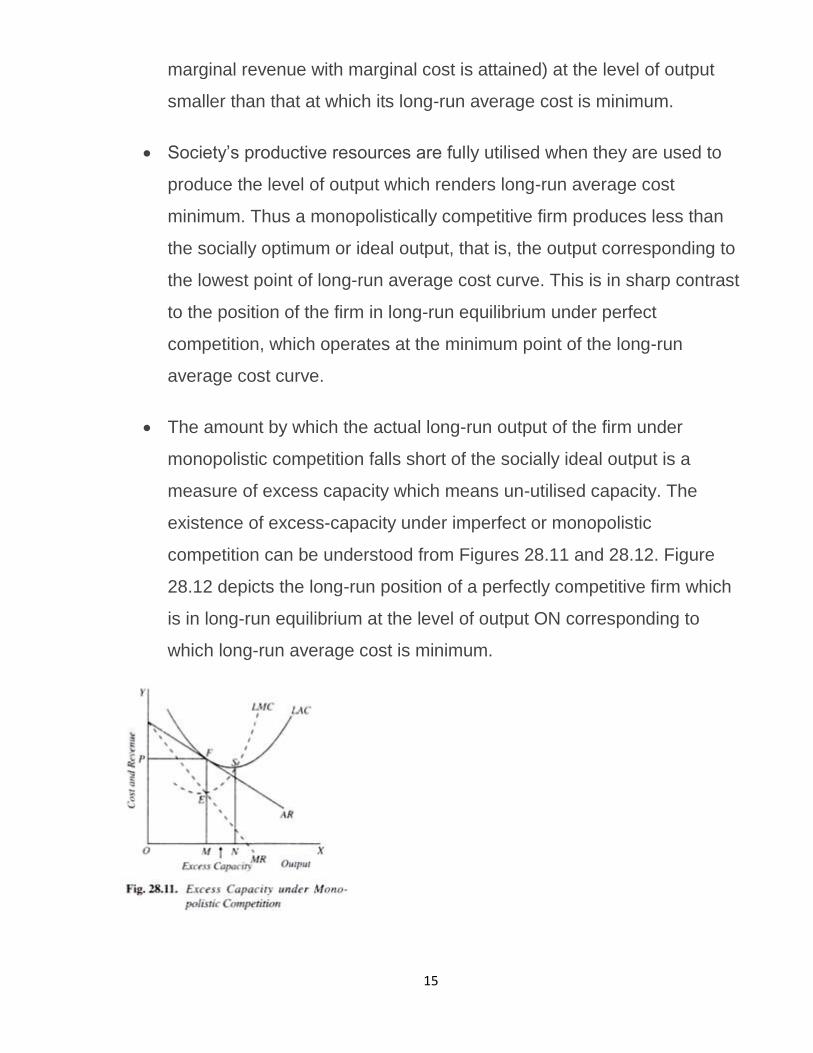
The amount by which the actual long-run output of the firm under
monopolistic competition falls short of the socially ideal output is a
measure of excess capacity which means un-utilised capacity. The
existence of excess-capacity under imperfect or monopolistic
competition can be understood from Figures 28.11 and 28.12. Figure
28.12 depicts the long-run position of a perfectly competitive firm which
is in long-run equilibrium at the level of output ON corresponding to
which long-run average cost is minimum.

16
It is at output ON that the double condition of long-run equilibrium,
namely Price = MC = AC is fulfilled. It is thus clear that firms under
perfect competition produce socially ideal output. On the other hand, a
firm under monopolistic competition depicted in Fig. 28.11 is in long-run
equilibrium at output OM at which its marginal revenue is equal to
marginal cost and price is equal to average cost (Average revenue
curve AR is tangential to average cost curve LAC at point F
corresponding to output OM).
It will be noticed that at output OM long-run average cost is still falling
and goes on falling up to output ON. This means that the firm can
expand its production up to ON and reduce his long-run average cost to
the minimum. Ideal output is the output at which long-run average cost
is minimum.
Therefore, the firm is producing MN less than the ideal output. Thus MN
output represents the excess capacity which emerges under
monopolistic competition. It is worth nothing that the concept of excess
capacity refers only to the long run. This is because in the short run
under any type of market structure (including perfect competition) there
can be all sorts of departures from the ideal reflecting incomplete
adjustment to the existing market conditions.

17
Causes of Excess Capacity:
What factors are responsible for the existence of excess capacity under
monopolistic competition? It is due to the existence of excess capacity
that average cost of production and price of product are higher and
output smaller monopolistic competition than under perfect competition.
There are three main causes of the emergence of excess capacity
under monopolistic competition. First, the most important cause of the
existence of excess capacity under monopolistic competition is down-
ward-sloping demand curve (or average revenue curve) of the firm.
A downward-sloping curve can be tangent to a U-shaped average cost
curve only at the latter’s falling portion. It is only the horizontal demand
curve or average revenue curve (as is actually found under perfect
competition) which can be tangent to a U-shaped average cost curve at
the latter’s minimum point. From this, it also follows that the greater the
elasticity of average revenue (or demand) curve confronting a
monopolistically competitive firm, the less the excess capacity and vice
versa. When the demand curve facing a firm is perfectly elastic, there is
no excess capacity, as is the case under perfect competition.
Now, demand curve facing individual firms under monopolistic
competition slopes downward due to product differentiation found in it.
Various firms produce different varieties and brands of product and
each has a certain degree of monopoly power over the variety or brand
it produces for fixing price and output.
If products were homogeneous the demand curve would not have been
downward sloping and equilibrium would have been established at the
minimum point of LAC without there being any excess capacity.

18
The second reason for the emergence of excess capacity under
monopolistic competition, as has been emphasised by Chamberlin, is
the entry of a very large a number of firms in the industry in the long run.
Lured by excess profits in the short run new firms enter the industry in
the long run. This results in sharing of market demand among many
firms so that each firm produces a smaller output than its full or optimum
capacity.
There are too many grocery shops, too many cloth manufacturing firms,
too many automobile parts producing firms, too many barber shops
each operating with excess capacity. In fact, under monopolistic
competition, given the same demand and cost conditions, number of
firms will be larger than even under perfect competition. This is because
by expanding output to the minimum point of LAC, fewer firms will be
required to meet the given demand for industry’s product.
The conception and the measure of excess capacity as enunciated
above is based upon a particular notion of ideal output. Marshall, Kahn,
Harrod, Cassel’ and Joan Robinson have regarded ideal output or
optimum size of the firm as that output at which its long-run average
cost is minimum. To, quote Joan Robinson, “In a perfectly competitive
industry each firm in full equilibrium will produce that output at which its
average costs are minimum.
Each firm will then be of the optimum size… If competition is imperfect,
the demand curve for the output of the individual firm will be falling and
the double condition of equilibrium can only be fulfilled for some output
at which average cost if falling. The firms will, therefore, be of less than
optimum size when profits are normal… It is only if conditions of perfect
competition prevail that firms will be of the optimum size and there is no

19
reason to expect that they will be of optimum size in the real world since
in the real world competition is not perfect.”
Benefits of Excess Capacity:
Mnay economists are of the view that excess capacity under
monopolistic competition is desirable in some respects. According to
them, excess capacity under monopolistic competition provides some
benefits which increase consumer welfare.
As mentioned above, the excess capacity comes into existence mainly
due to product differentiation under monopolistic competition. Now, this
product differentiation leads to product variety which is highly beneficial
to the consumers.
The ability to choose among a wide variety of clothes, furniture,
restaurant meals and other types of styles of product designs add
greatly to the satisfaction or welfare of the consumers. Therefore,
according to this view, social benefits of excess capacity should be
weighed against the cost to the society of excess capacity.
xxxxxxxxxxxxxxxxxxxxxxxxxxxxxxxxxxxxxxxxxxxxxxxxxxxxxxxxxxxxxxxxxxxxxxxxxxxxxxxxx

20
Q. 8 (3+3=6 marks)
Suppose two competitors, BALCO, and NALCO, are locked in a bitter pricing struggle in the aluminum industry. In the limit pricing payoff matrix, BALCO can choose a given row of outcomes by offering a limit price ("up") or monopoly price ("down"). NALCO can choose a given column of outcomes by choosing to offer a limit price ("left") or monopoly price ("right"). Neither firm can choose which cell of the payoff matrix to obtain; the payoff for each firm depends upon the pricing strategies of both firms.
NALCO
BALCO
Pricing Strategy Limit Price Monopoly Price
Limit Price Rs (-) 20 m, Rs (-) 30 m Rs 900 m, Rs 600 m
Monopoly Price Rs100 m, Rs 800 m Rs50 m, Rs 50 m
a. Is there a dominant strategy? If so, what is it? IS there Nash equilibrium? If yes, what is it?
b. What is the cooperative outcome? Which firm benefits most from the cooperative outcome? How much would that firm need to offer the other to persuade it to collude?
------------------------------------------------------------------------------------------------------------------------------
No Dominant Strategy for either.
A Nash equilibrium exists when neither party has an incentive to alter its
strategy, taking the other’s strategy as given. If Firm 2 chooses Low and Firm
1 chooses High, neither will have an incentive to change (100 > -20 for Firm 1
and 800 > 50 for Firm 2). If Firm 2 chooses High and Firm 1 chooses Low,
neither will have an incentive to change (900 > 50 for Firm 1 and 600 > -30 for
Firm 2). Both outcomes are Nash equilibria. Both firms choosing low is not a
Nash equilibrium because, for example, if Firm 1 chooses low then firm 2 is
better off by switching to high since 600 is greater than -30.
The cooperative outcome would maximize joint payoffs. This would occur if
Firm 1 goes for the low end of the market and Firm 2 goes for the high end of
the market. The joint payoff is 1,500 (Firm 1 gets 900 and Firm 2 gets 600).
best payoff is 900 - 100 = 800. To persuade Firm 2 to choose Firm 1’s best
option, Firm 1 must offer at least the difference between Firm 2’s payoff under
cooperation, 600, and its best payoff, 800, i.e., 200. However, Firm 2 realizes
that Firm 1 benefits much more from cooperation and should try to extract as
much as it can from Firm 1 (up to 800).

21
xxxxxxxxxxxxxxxxxxxxxxxxxxxxxxxxxxxxxxxxxxxxxxxxxxxxxxxxxxxxxxxxxxxxxxxxxxxxxxxx
Q. 9 (6 marks)
In a market for hired taxis, the inverse market demand function is given by P=100-Q, and the (private) marginal cost of production for the aggregation of all taxi firms is given by MC=10 +Q. Finally, the pollution generated by the hired taxis creates external damages given by the marginal external cost curve MEC=Q.
a. Calculate the output and price of hired taxi if it is produced under competitive conditions absent regulation.
b. Determine the socially efficient price and output of taxis.
c. Determine the tax that would result in a competitive market producing the socially efficient output.
---------------------------------------------------------------------------------------------------------------------
Answer
a. To find the answer, set price equal to marginal cost:
100-Q=10+Q,
Q=45, and P=55.
b. Determine the socially efficient price and output of taxis.
To find the answer here, we must first calculate the marginal social cost
(MSC), which is equal to the marginal external cost plus the private marginal
cost. Next, set MSC equal to the market demand function to solve for price
and quantity. When all costs are included, the quantity produced will fall
and the price will rise:
MSC=MC+MEC=10+2Q=100-Q,
Q=30, and P=70.
c. Determine the tax that would result in a competitive market producing the socially
efficient output.
If there is a unit tax, then the new marginal private cost function is MC’=10+Q+tQ.
If we now set this new marginal cost function equal to the price of 70 and substitute
in 30 for the quantity, we can solve for t:
10+Q+tQ=70
Q(1+t)=60
1+t=2
t=1.
The tax should be 1 per unit output. Note that with the tax equal to 1, the new
private cost function is the same as the marginal social cost function.

22
xxxxxxxxxxxxxxxxxxxxxxxxxxxxxxxxxxxxxxxxxxxxxxxxxxxxxxxxxxxxxxxxxxxxxxxxxxxxxxxx Q. 10 Place each of the following in the correct location as per the table. (6 marks)
Rival? Yes No
Excludable? Yes Private Goods Natural Monopolies No Common Resources Public Goods
a. Congested toll roads, b. Knowledge, c. Fish in the ocean, d. National defense, e. Congested non toll roads, f. Cable TV, g. The environment, h Fire protection, i. Ice-cream cones, j Uncongested toll roads, k. Clothing, l. Uncongested non-toll roads
Answer:
Rival YES
Excludable => Yes
=
PRIVATE GOODS
a. Congested Toll Roads
j.. Ice Cream Cones
k.. Clothing
Rival NO
Excludable => YES
=
NATURAL MONOPOLIES
e.. Cable TV
h. Fire Protection
j. Un Congested Toll Roads.
Rival YES
Excludable => NO
=
COMMON RESOURCES
c.. Fish in the Ocean.
e.. Congested Non-Toll Roads
g. The Ebvironment
Rival YES
Excludable => Yes
=
PUBLIC GOODS
b. Knowledge
d. National Defense.
l. Un Congested Non-Toll Roads.

23
Sr No
Item Rival
For any given level of production, the marginal cost of providing it to an additional consumer is NOT zero
Excludable
Goods that people can be excluded from consuming, so that it is possible to charge for their use
Category
1 Cable TV NO YES NATURAL MONOPOLY
2 Clothing YES YES PRIVATE GOODS
12 Environment YES NO COMMON RESOURCE
3 Fire Protection NO YES NATURAL MONOPOLY
4 Fish in the Ocean YES NO COMMON RESOURCE
5 Ice Cream Cones YES YES PRIVATE GOODS
6 Knowledge NO NO PUBLIC GOODS
7 National Defense NO NO PUBLIC GOODS
8 Roads –
Congested & Non Toll
YES NO COMMON RESOURCE
9 Roads –
Congested & Toll
YES YES PRIVATE GOODS
10 Roads –
Uncongested &b Non-Toll
NO NO PUBLIC GOODS
11 Roads –
Uncongested and Toll
NO YES NATURAL MONOPOLY
Xxxxxxxxxxxxxxxxxxxxxxxxxxxxxxxxxxxxxxxxxxxxxxxxxxxxxxxxxxxxxxxxxxxxxxxxxxxxxxxxxxxxx