inspiredata™ getting started guide - school district...
TRANSCRIPT


ii InspireData™ Getting Started Guide
Credits InspireData™ is developed by TERC and published by Inspiration Software®, Inc.
Created by Chris Hancock
Design Chris Hancock and Scot Osterweil
Engineering Clozure Associates: Gary Byers, Jeremy Jones, Mark Nahabedian, Gary Palter, Gail Zacharias; Inspiration Software: Peter Wong
Management & Administration Don Helfgott, Kate Kennedy, David Libby, Glen Secor, Mona Westhaver
Quality Assurance Elizabeth Butcher, Scott Daniels, Kim Russell, Gina Shankland, Geoff Unger, Eric West, Sue Williamson
Product Management John Cromett
Databases, Examples, and Classroom Projects Sue Collins, Bob Coulter, Elise Hooper, Linnea Johnsson, Peggy MacDonald, Caren Normandin, Gina Shankland, Lori Deuchar Yum
Documentation and Help Audrey Brislin, Charis Loeung, Adrian Quan, Mary Beth Saddoris
Icon Library Adrian Quan
Classroom Piloting and Research Ricky Carter, Sally Crissman, Nick Haddad, Katherine Paget, Elizabeth Rowe; Teachers: Jennifer Burgin, Rick Comeau, Deb Gallagher, Liz Gelotte, Jan Preheim, Myra Sussman, Kathy Vandiver
Special Thanks to: Kathy Jean, Tom Plati, Diamond Middle School, Lexington, MA; Lincoln Elementary School, Brookline, MA
InspireData is implemented in LispWorks LISP. Special thanks to Martin Simmons of Lispworks, Ltd.
Originally funded under a grant from the National Science Foundation (Grant No. ESI-0242626). Any opinions, findings and conclusions or recommendations expressed in this material are those of the author(s) and do not necessarily reflect the views of the National Science Foundation. TERC is a leading educational research and development lab committed to improving mathematics and science teaching and learning.
© 2006 Inspiration Software, Inc. © 2006 TERC, Inc. Font engine © The FreeType Project 1996-2002.
Inspiration Software® is a registered trademark, and InspireData™ and the InspireData design mark are trademarks of Inspiration Software, Inc. Other brands and trademarks are the property of their respective owners.
Table of Contents iii
Table of Contents
Chapter 1: Getting Started .....................................................5 Where to find more information .................................................................................................... 5 Key features of InspireData ........................................................................................................... 6 Installing InspireData..................................................................................................................... 8 Viewing and printing InspireData documentation ....................................................................... 11 Removing InspireData ................................................................................................................. 11 Registering InspireData ............................................................................................................... 12 Customer Service......................................................................................................................... 12
Chapter 2: Introducing InspireData.......................................13 About the InspireData views........................................................................................................ 13
Table View................................................................................................................................ 14 Plot View .................................................................................................................................. 15
Uses of tables............................................................................................................................... 16 Uses of plots ................................................................................................................................ 17
Venn plot .................................................................................................................................. 17 Stack plot .................................................................................................................................. 18 Pie plot ...................................................................................................................................... 19 Axis plot.................................................................................................................................... 20
Time series data ........................................................................................................................... 21
Chapter 3: Learning InspireData, A Tutorial ..........................22 Lesson One: Introduction to Plot View.................................................................................... 23
Start InspireData ....................................................................................................................... 24 Open a database ........................................................................................................................ 25 Quick introduction to Table View ............................................................................................ 26 Switch to Plot View .................................................................................................................. 27 View record details ................................................................................................................... 28 Show and change icon labels .................................................................................................... 29 Create a Venn plot .................................................................................................................... 30 Add a Venn loop ....................................................................................................................... 31 Add color to further represent meaning .................................................................................... 32 Create a Stack plot .................................................................................................................... 32 Create a parallel Stack plot ....................................................................................................... 34 Show the mean for each level ................................................................................................... 35 Create an Axis plot ................................................................................................................... 35 Mark items of interest ............................................................................................................... 37
iv InspireData™ Getting Started Guide
Create a Pie plot ........................................................................................................................ 38 Subdivide a Pie plot .................................................................................................................. 39 Save a document ....................................................................................................................... 40
Lesson Two: Working in Table View....................................................................................... 41 Create a new database............................................................................................................... 41 Rename and define fields.......................................................................................................... 42 Add and format a new field ...................................................................................................... 43 Enter record details ................................................................................................................... 44 Add a new record...................................................................................................................... 44 Reorder fields............................................................................................................................ 45 Change the default icon ............................................................................................................ 45 Import a custom icon ................................................................................................................ 47 Create a Questionnaire.............................................................................................................. 47 Conduct a survey using a Questionnaire................................................................................... 49 Import data from external sources ............................................................................................ 50
Lesson Three: Presenting with a slide show ............................................................................ 51 Capture a slide .......................................................................................................................... 52 Name a slide.............................................................................................................................. 53 Reorder a slide .......................................................................................................................... 53 Add notes .................................................................................................................................. 53 Make changes to a slide ............................................................................................................ 54 Delete a slide............................................................................................................................. 54 Present a slide show.................................................................................................................. 55
Lesson Four: Plotting time series and more ............................................................................ 56 Plot time series data .................................................................................................................. 57 Grouping time series data ......................................................................................................... 58 Change plot colors .................................................................................................................... 60 Compute summary data ............................................................................................................ 61 Clear a plot................................................................................................................................ 61 View previous plots .................................................................................................................. 62 Add a plot title .......................................................................................................................... 62 Combine categories................................................................................................................... 63
Other inspiring resources.......................................................................................................... 65 Online Help............................................................................................................................... 65 InspireData User’s Manual ....................................................................................................... 65 InspireData Classroom Projects ................................................................................................ 65 Database and example resources............................................................................................... 65
Inspiration Software®, Inc. License Agreement ......................69
Index ..................................................................................71
Chapter 1: Getting Started 5
Chapter 1: Getting Started Welcome to InspireData™, the foremost tool to visualize, investigate and understand data. With InspireData students investigate, manipulate and analyze data in science, mathematics and social studies. Applying the proven strategies of visual learning to data literacy, students formulate questions and interact with data to identify patterns, trends and relationships, solving problems and building their own conclusions. As a result, students develop deeper content knowledge and stronger critical thinking skills. This guide is designed to help you get started using InspireData. It contains:
• Key features of InspireData
• System requirements
• Installation instructions
• Customer service information
• Introduction to InspireData
• Tutorial
Where to find more information
The InspireData Help system contains detailed information about using InspireData’s commands and features. The InspireData User’s Manual is available as a PDF and contains all the information in the Help system.
• To access the Help system while you are using InspireData, choose InspireData Help on the Help menu.
• To view or print the InspireData User’s Manual, see “Viewing and printing InspireData documentation” on page 11.
• InspireData Technical Support is available online at http://www.inspiration.com/techsupport.
6 InspireData™ Getting Started Guide
Key features of InspireData
InspireData is a powerful learning tool that can be used across the curriculum. Some of the key features include:
Integrated data visualization environments See the meaning in data to strengthen analytical skills and understanding.
• Toggle between Table and Plot Views with one click.
• Move instantly from data collection to data interpretation.
• See and make connections between data and its visual representations to interpret information, solve problems and draw conclusions.
Table View Enter and customize data elements into tables to support activities and experiments across the curriculum in science, mathematics and social studies.
• Get started quickly with more than 50 cross-curricular databases.
• Import data sets from the Internet or other information sources.
• Generate data sets easily for instructional activities or experiments. • Use the Questionnaire tool to launch surveys and gather data. • Access built-in activities to give students early success in
generating data. • Enter data for new tables quickly by selecting from multiple data
types (number, text, true/false, time series, date).
• Work with formulas and multiple tables in a single database with InspireData’s advanced capabilities.
Chapter 1: Getting Started 7
Plot View Analyze data visually by creating and manipulating plots that illustrate trends and outcomes.
• Choose from multiple plot types including: Venn, Stack, Axis and Pie plots.
• Visualize and evaluate change over time with animated time series data using any plot type.
• Manipulate data visually to analyze, interpret and understand data.
• Reinforce essential data plotting skills including labeling the x/y axis and data points, plot titles, data annotation, and icon and color coding.
• Support data analysis with basic statistical tools (mean, median, mode, standard deviation).
• Build skills in working with multiple plot types by choosing the best format to communicate findings.
• Manipulate variables and settings to examine potential changes and impacts on trends or outcomes.
• Conduct more sophisticated analysis with advanced capabilities. • Focus in to isolate subsets of data for deeper investigation. • Combine data categories to discover larger data trends.
• Differentiate data points with visually rich, customizable icons from InspireData’s icon library, or import and edit your own. • Make higher-order concepts more concrete and understandable. • Use icons to help students build early familiarity with common
data expression.
8 InspireData™ Getting Started Guide
Document and present findings and conclusions Use the Slide Show and Notes features to capture a sequence of data analysis and to annotate, submit and present completed work.
• Record work with a slide show to present data and conclusions. • Arrange slides to organize and present analyses logically. • Continue investigation and analysis throughout a project using
the dynamic data that always resides within each slide.
• Use Notes for explanation, direction and support. • Document processes and add observations. • Add project guidance and directions for students within the data.
Installing InspireData
Before installing InspireData, make sure your computer meets the following minimum requirements:
System requirements Windows®
• Windows 98 SE, 2000, NT 4.0, ME or XP
• 64 MB RAM
• 50 MB available hard drive
• 800 x 600 display
• Optional • Interactive electronic whiteboard • Printer
Chapter 1: Getting Started 9
Macintosh®
• OS X version 10.2.8 or higher
• 128 MB RAM
• 50 MB available hard drive
• 800 x 600 display
• Optional • Interactive electronic whiteboard • Printer
Windows installation
1. Close all programs, including screen saver and anti-virus programs.
2. Insert the InspireData CD-ROM into your CD-ROM drive.
3. Double-click My Computer, and then double-click the icon for your CD-ROM drive.
4. Double-click the InspireData Setup.exe icon, and follow the instructions on your screen to complete the installation process.
5. Start up the application by selecting InspireData from the Start menu.
6. Enter your name and/or organization and your serial number, then click the OK button.
Note: Your serial number can be found on the CD-ROM sleeve. The serial number identifies your copy of InspireData; it is required to personalize your InspireData application. To register your copy of InspireData, see “Registering InspireData” on page 12.
10 InspireData™ Getting Started Guide
Macintosh installation
1. Close all programs, including screen saver and anti-virus programs.
2. Insert the InspireData CD-ROM into your CD-ROM drive.
3. Drag the InspireData folder to your Applications folder. Installation is complete.
4. Start the application by double-clicking the InspireData icon.
5. Enter your name and/or organization and your serial number, then click OK.
Note: Your serial number can be found on the CD-ROM sleeve. The serial number identifies your copy of InspireData; it is required to personalize your InspireData application. To register your copy of InspireData, see “Registering InspireData” on page 12.
Network installation Refer to the network installation instructions provided with your volume license. Volume licenses are available from Inspiration Software, Inc. For more information, call 503-297-3004.
Chapter 1: Getting Started 11
Viewing and printing InspireData documentation
The InspireData User’s Manual and other written documentation are available in the form of PDF files. To view or print this information, you need Adobe® Acrobat® Reader installed on your computer. If your computer does not have Acrobat Reader, you can download a free copy from Adobe at www.adobe.com. To view or print InspireData documentation:
1. Start InspireData.
2. On the InspireData Starter screen, click the Learn to Use button.
3. Select one of the following:
Getting Started.pdf Getting Started Guide, including
installation instructions and tutorial.
User’s Manual.pdf InspireData User’s Manual
Classroom Projects.pdf InspireData Classroom Projects book
4. Double-click a PDF to view or print.
Removing InspireData
Windows
1. Click the Start button, choose Settings, then select Control Panel.
2. Double-click Add/Remove Programs.
3. Select InspireData in the list box, then click the Add/Remove button.
Macintosh
• Drag the InspireData folder to the Trash, and then empty the Trash.

12 InspireData™ Getting Started Guide
Registering InspireData
If you purchased a single copy of InspireData, you can register online or send in the printed registration card provided. To register online, click Register Online after you personalize InspireData. Your browser starts and opens InspireData’s online registration form. Follow the on-screen instructions. (Note: You must have a modem and a browser installed to register online.) If you are unable to register online, please complete and mail the printed registration form. To register a volume license, please complete and mail or fax the printed license agreement. When you register, you are entitled to special benefits from Inspiration Software, Inc. As a registered customer, you receive:
• Free telephone, fax and email technical support
• Substantial discounts on upgrades
• Tips on using InspireData
• Information about new products or updates
• Flashes, the Inspiration Software, Inc. email newsletter
Customer Service
Inspiration Software®, Inc. is committed to assisting our customers. If you have comments, questions or need assistance while working with InspireData, you can contact us by email, telephone or fax. When you contact us, please be ready to provide your serial number. Our support services are open Monday-Friday from 8 a.m. to 5 p.m. Pacific time. Telephone 503-297-3004 Fax 503-297-4676 Email [email protected]
Chapter 2: Introducing InspireData 13
Chapter 2: Introducing InspireData
InspireData helps you to gather data and then move instantly to data interpretation with just one click, making it easy to connect data and its visual representations. Applying the proven strategies of visual learning to data literacy, you can formulate questions and interact with data to identify patterns, trends and relationships to solve problems and build conclusions. With its two dynamic data visualization environments, Table View and Plot View, InspireData is ideal for analyzing data in science, mathematics and social studies. Working within the integrated views, students see the meaning in data, strengthening analytical skills and understanding. As a result, they develop deeper content knowledge and stronger critical thinking skills.
About the InspireData views
InspireData offers two data visualization environments: Table View and Plot View. You work in Table View to enter and record data, and work in Plot View to analyze and understand the data visually. The two environments are integrated; as you enter new data in Table View, information is automatically updated in Plot View.
14 InspireData™ Getting Started Guide
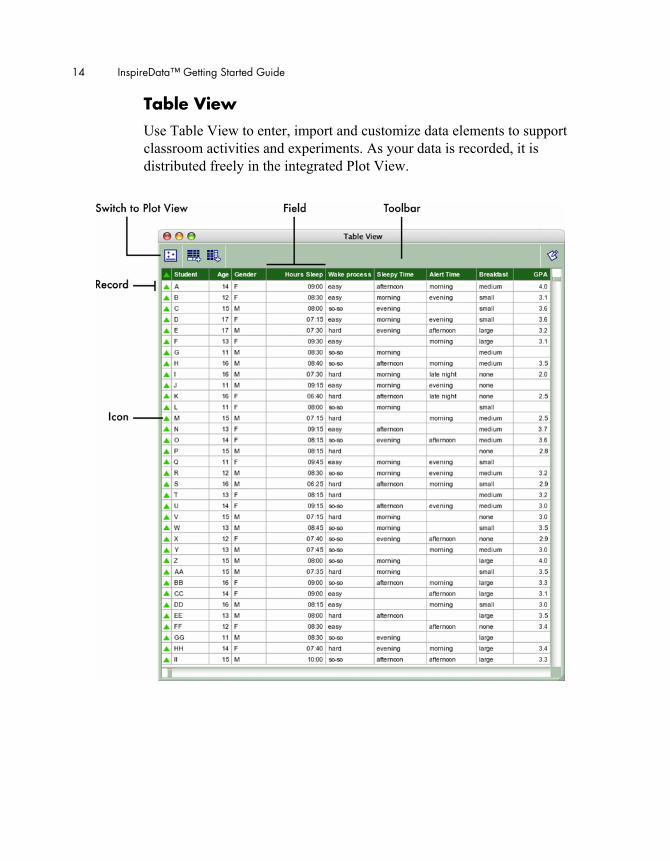
Table View Use Table View to enter, import and customize data elements to support classroom activities and experiments. As your data is recorded, it is distributed freely in the integrated Plot View.
Chapter 2: Introducing InspireData 15
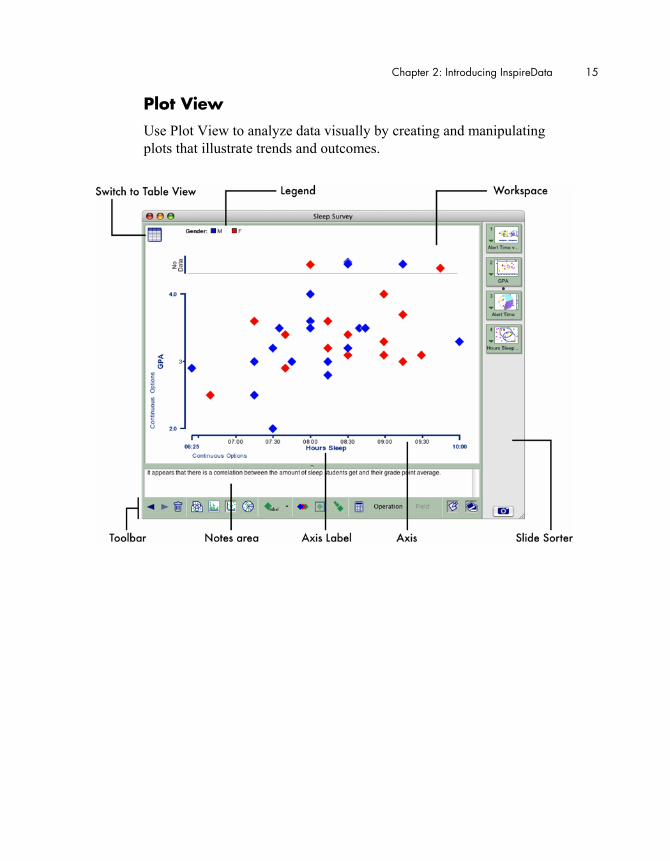
Plot View Use Plot View to analyze data visually by creating and manipulating plots that illustrate trends and outcomes.
16 InspireData™ Getting Started Guide
Uses of tables
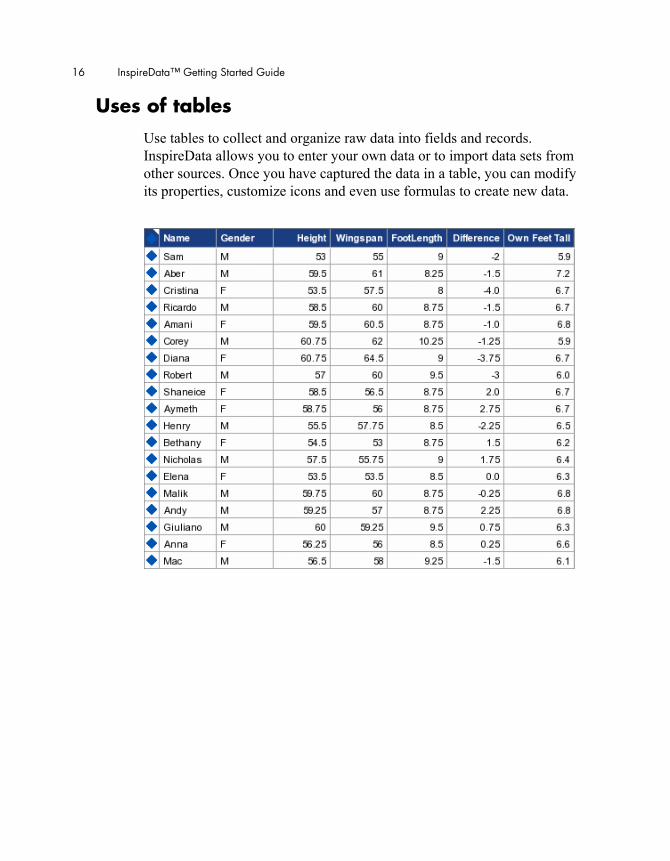
Use tables to collect and organize raw data into fields and records. InspireData allows you to enter your own data or to import data sets from other sources. Once you have captured the data in a table, you can modify its properties, customize icons and even use formulas to create new data.
Chapter 2: Introducing InspireData 17
Uses of plots
Use plots to manipulate data and examine potential changes and impacts on trends and outcomes. You can formulate questions, interact with the data and view the information in different types of plots to find the best way to represent meaning. InspireData provides multiple plot types, including Venn, Stack, Pie and Axis plots.
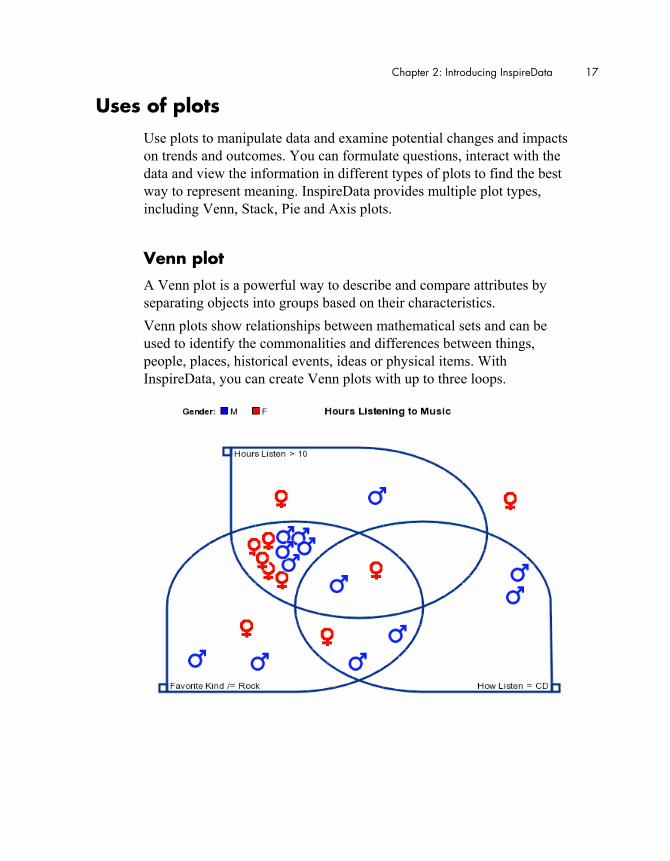
Venn plot A Venn plot is a powerful way to describe and compare attributes by separating objects into groups based on their characteristics. Venn plots show relationships between mathematical sets and can be used to identify the commonalities and differences between things, people, places, historical events, ideas or physical items. With InspireData, you can create Venn plots with up to three loops.
18 InspireData™ Getting Started Guide
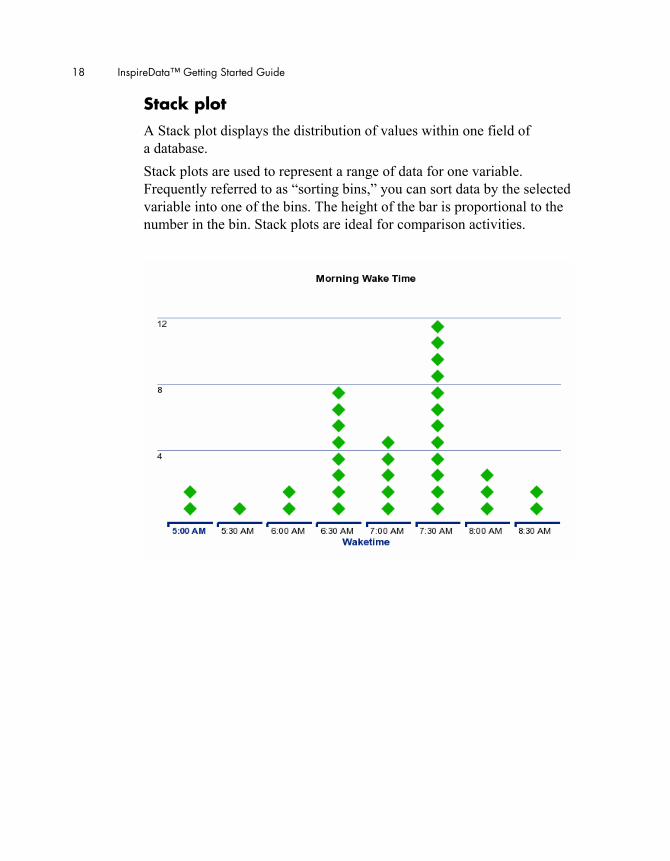
Stack plot A Stack plot displays the distribution of values within one field of a database. Stack plots are used to represent a range of data for one variable. Frequently referred to as “sorting bins,” you can sort data by the selected variable into one of the bins. The height of the bar is proportional to the number in the bin. Stack plots are ideal for comparison activities.
Chapter 2: Introducing InspireData 19
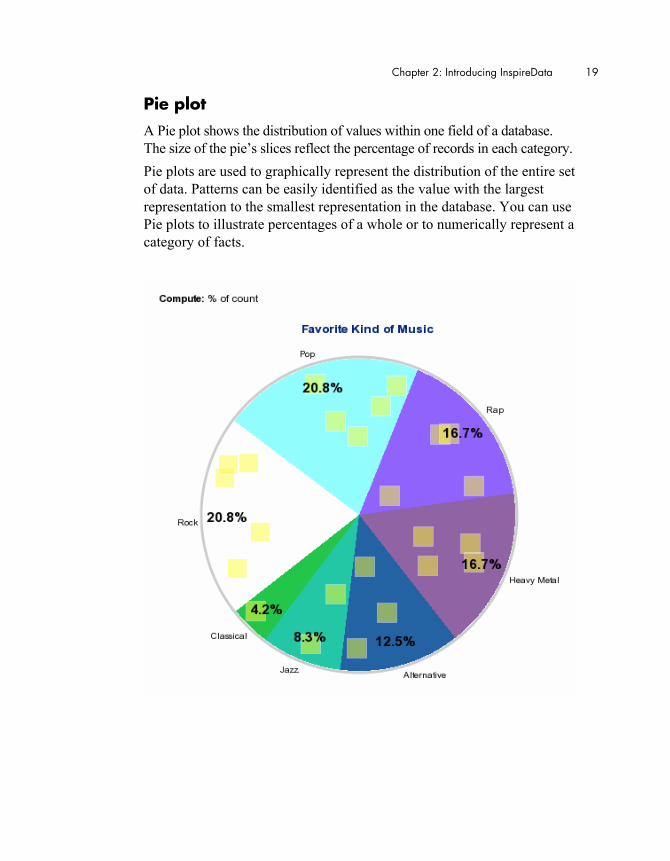
Pie plot A Pie plot shows the distribution of values within one field of a database. The size of the pie’s slices reflect the percentage of records in each category. Pie plots are used to graphically represent the distribution of the entire set of data. Patterns can be easily identified as the value with the largest representation to the smallest representation in the database. You can use Pie plots to illustrate percentages of a whole or to numerically represent a category of facts.
20 InspireData™ Getting Started Guide
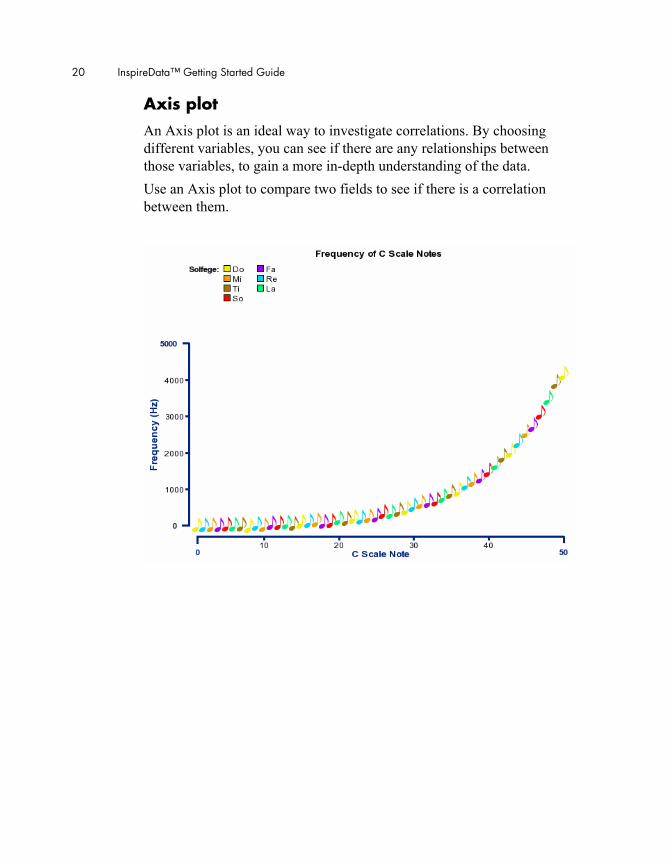
Axis plot An Axis plot is an ideal way to investigate correlations. By choosing different variables, you can see if there are any relationships between those variables, to gain a more in-depth understanding of the data. Use an Axis plot to compare two fields to see if there is a correlation between them.
Chapter 2: Introducing InspireData 21
Time series data
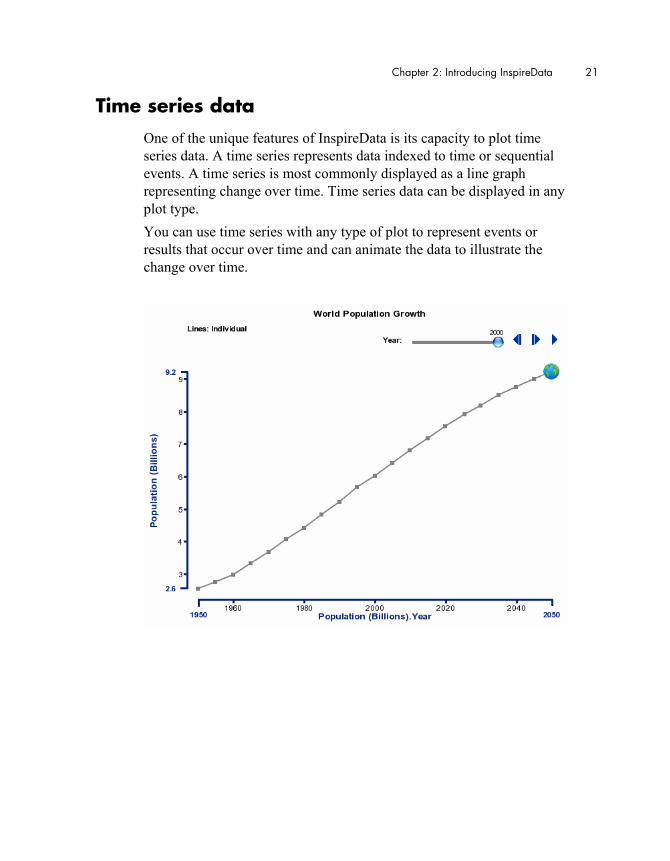
One of the unique features of InspireData is its capacity to plot time series data. A time series represents data indexed to time or sequential events. A time series is most commonly displayed as a line graph representing change over time. Time series data can be displayed in any plot type. You can use time series with any type of plot to represent events or results that occur over time and can animate the data to illustrate the change over time.
22 InspireData™ Getting Started Guide
Chapter 3: Learning InspireData, A Tutorial
This tutorial is a great starting point for learning how to use InspireData. Please plan on about an hour from start to finish. If you’re new to InspireData and like to learn while working on-screen, this tutorial is for you. We have kept the information in small, manageable chunks to make it easy to learn the basics quickly. Before you know it, you’ll be using InspireData to investigate, manipulate and analyze data! You use InspireData the same way you use most Windows and Mac OS programs. For example, you use the mouse to drag objects and to select text. You also click and double-click, as well as enter information using the keyboard. If you’re not comfortable doing these things, take a moment now and refer to the user’s guide that came with your computer.
Conventions we use
This tutorial has instructions for both Windows and Mac OS-based computers. When you’re asked to press a key or click a command on a menu, the Windows instructions appear first, and the Mac OS instructions are in parentheses immediately afterward. Here are two examples: Press Enter (Return) and press the Control (Command) key. When you’re asked to enter specific text, the text you type appears in bold. When instructions refer to a menu item, button or other interface element, the name of that element also appears in bold. And a special note ... Because people work in different ways, InspireData offers many ways to do things—from toolbar buttons to menu commands to keyboard shortcuts. While all these options are readily available, this tutorial usually shows one way to do a task. By limiting the alternatives presented, we hope to make it easier to learn the task. In the Help system and the InspireData User’s Manual, you will find many ways to do each task so you can pick the one that’s most comfortable for you. To access the Help system, see “Where to find more information” on page 5. To view or print the InspireData User’s Manual see “Viewing and printing InspireData documentation” on page 11.
Chapter 3: Learning InspireData, A Tutorial 23
How we organized the tutorial
In the InspireData tutorial, you will follow a series of straightforward step-by-step instructions to create a table, plot data, present a slide show and more. The tutorial is divided into four lessons. Each lesson introduces you to several of the unique features in InspireData. When you finish the tutorial, you’ll be ready to collect, manipulate and analyze data on your own.
Lesson One: Introduction to Plot View
In this lesson, you’ll open a database containing information about the sleep habits of a group of students. You’ll learn to do the following: • Start InspireData • Open a database • Switch to Plot View • View record details • Show and change icon labels • Create a Venn plot • Add a Venn loop • Add color to further represent meaning • Create a Stack plot • Create a parallel Stack plot • Show the mean for each level • Create an Axis plot • Mark items of interest • Create a Pie plot • Subdivide a Pie plot • Save a document

24 InspireData™ Getting Started Guide
Start InspireData Note: Before you can start the program, InspireData needs to be installed. If you haven’t installed InspireData on your computer yet, see “Installing InspireData” on page 8. To start InspireData on a computer running Windows:
• Click the Start button, point to Programs, and then click InspireData.
The InspireData Starter screen opens.
To start InspireData on a Macintosh computer:
• Open the InspireData folder, and then double-click the InspireData icon.
The InspireData Starter screen opens.
Chapter 3: Learning InspireData, A Tutorial 25
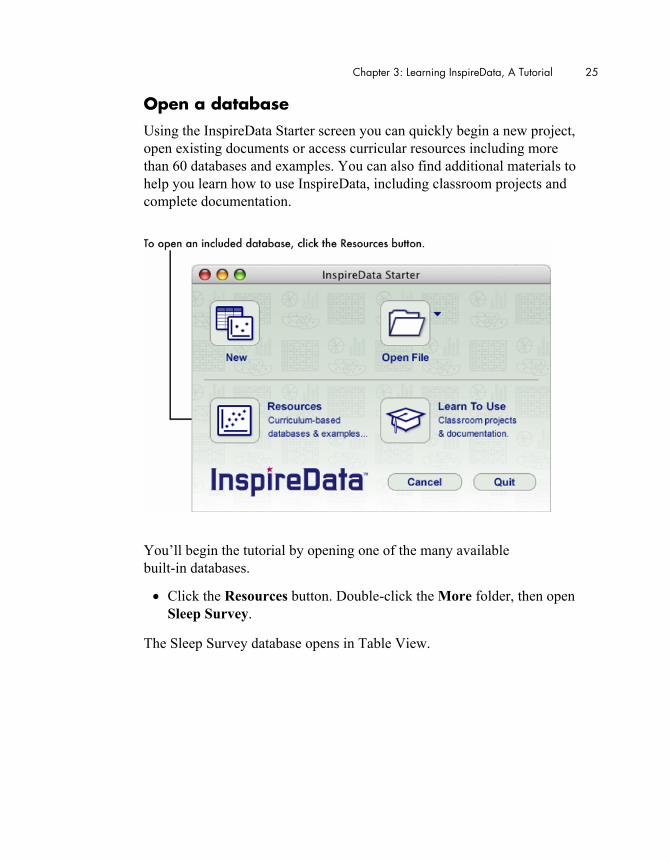
Open a database Using the InspireData Starter screen you can quickly begin a new project, open existing documents or access curricular resources including more than 60 databases and examples. You can also find additional materials to help you learn how to use InspireData, including classroom projects and complete documentation.
You’ll begin the tutorial by opening one of the many available built-in databases.
• Click the Resources button. Double-click the More folder, then open Sleep Survey.
The Sleep Survey database opens in Table View.
26 InspireData™ Getting Started Guide
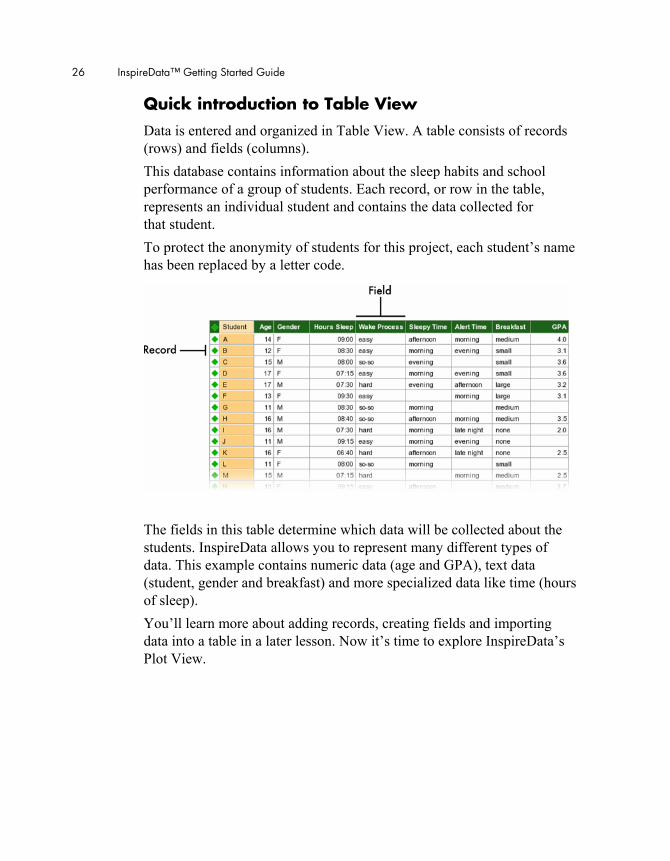
Quick introduction to Table View Data is entered and organized in Table View. A table consists of records (rows) and fields (columns). This database contains information about the sleep habits and school performance of a group of students. Each record, or row in the table, represents an individual student and contains the data collected for that student. To protect the anonymity of students for this project, each student’s name has been replaced by a letter code.
The fields in this table determine which data will be collected about the students. InspireData allows you to represent many different types of data. This example contains numeric data (age and GPA), text data (student, gender and breakfast) and more specialized data like time (hours of sleep). You’ll learn more about adding records, creating fields and importing data into a table in a later lesson. Now it’s time to explore InspireData’s Plot View.
Chapter 3: Learning InspireData, A Tutorial 27
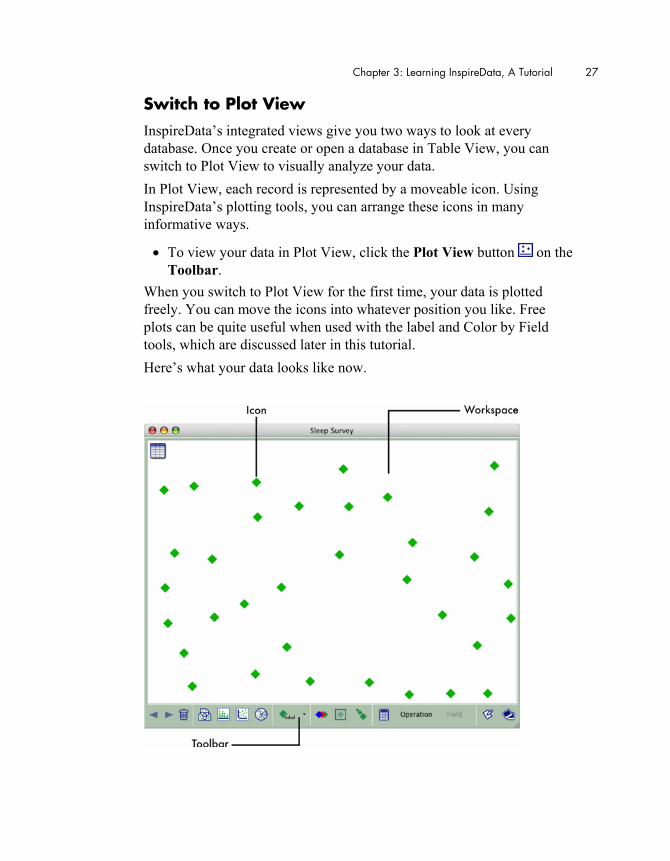
Switch to Plot View InspireData’s integrated views give you two ways to look at every database. Once you create or open a database in Table View, you can switch to Plot View to visually analyze your data. In Plot View, each record is represented by a moveable icon. Using InspireData’s plotting tools, you can arrange these icons in many informative ways.
• To view your data in Plot View, click the Plot View button on the Toolbar.
When you switch to Plot View for the first time, your data is plotted freely. You can move the icons into whatever position you like. Free plots can be quite useful when used with the label and Color by Field tools, which are discussed later in this tutorial. Here’s what your data looks like now.
28 InspireData™ Getting Started Guide
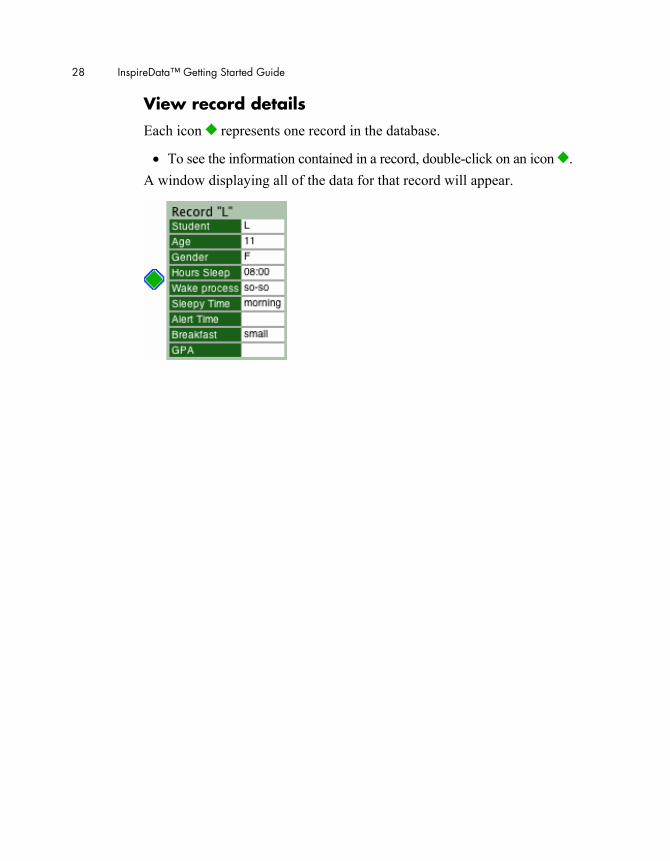
View record details Each icon represents one record in the database.
• To see the information contained in a record, double-click on an icon . A window displaying all of the data for that record will appear.
Chapter 3: Learning InspireData, A Tutorial 29
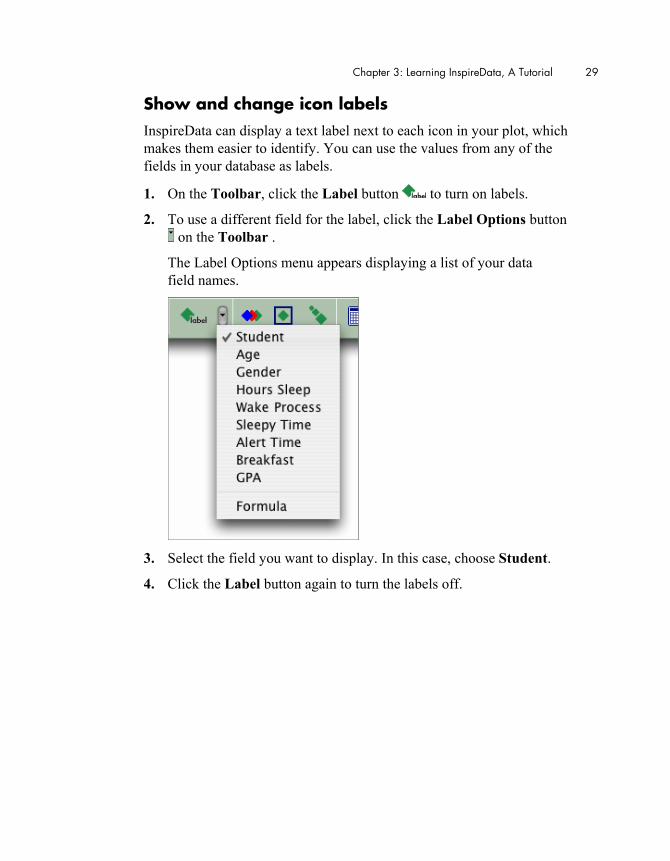
Show and change icon labels InspireData can display a text label next to each icon in your plot, which makes them easier to identify. You can use the values from any of the fields in your database as labels.
1. On the Toolbar, click the Label button to turn on labels.
2. To use a different field for the label, click the Label Options button on the Toolbar .
The Label Options menu appears displaying a list of your data field names.
3. Select the field you want to display. In this case, choose Student.
4. Click the Label button again to turn the labels off.

30 InspireData™ Getting Started Guide
Create a Venn plot Venn diagrams offer a powerful way to compare and analyze the relationship between sets of data. In a Venn plot, you can separate objects into groups based on certain characteristics, such as hours of sleep and ability to wake in the morning. With InspireData, you can create Venn plots with up to three loops.
1. On the Toolbar, click the Venn Plot button .
An undefined Venn loop appears. In the corner of the loop, the words Field = ? appear. This simple equation allows you define which icons you want to include in the loop.
2. In the corner of the Venn loop, click on the word Field and select Hours Sleep from the menu that appears.
3. Click on the operator, which is currently an equals sign (=). Select < from the menu that appears.
4. Click on the question mark (?). A data entry box appears. Type 8:00 into the dialog, then click the Accept button .
The icons move so only those meeting the criteria—less than 8 hours sleep per night—appear inside the loop.

Chapter 3: Learning InspireData, A Tutorial 31
Add a Venn loop Now you’ll add a second Venn loop.
1. In the lower left corner of the workspace, click the Add Loop button .
2. In the equation, click on the word Field. Select Wake Process.
3. Click on the operator. Select =.
4. Click on the question mark (?). Select Hard.
Now records are sorted into multiple categories. If you look where the two loops overlap, you can see that the students who get less than 8 hours of sleep have more difficulty waking. Also notice that students who do not match the characteristics you set (in this case, the students who get more than 8 hours of sleep and don’t have a hard time waking up) remain outside of both loops.
Here’s what your data looks like now.
32 InspireData™ Getting Started Guide
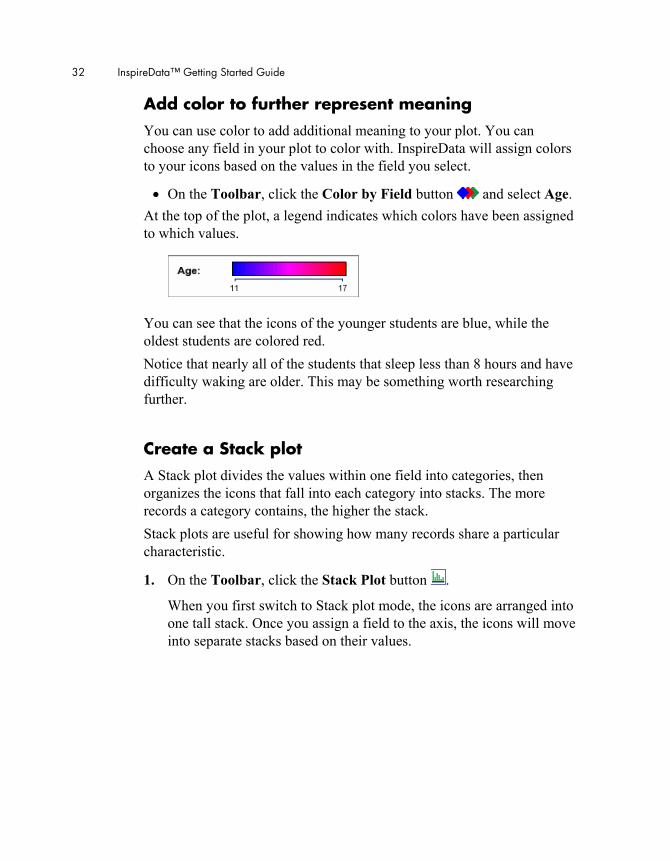
Add color to further represent meaning You can use color to add additional meaning to your plot. You can choose any field in your plot to color with. InspireData will assign colors to your icons based on the values in the field you select.
• On the Toolbar, click the Color by Field button and select Age. At the top of the plot, a legend indicates which colors have been assigned to which values.
You can see that the icons of the younger students are blue, while the oldest students are colored red. Notice that nearly all of the students that sleep less than 8 hours and have difficulty waking are older. This may be something worth researching further.
Create a Stack plot A Stack plot divides the values within one field into categories, then organizes the icons that fall into each category into stacks. The more records a category contains, the higher the stack. Stack plots are useful for showing how many records share a particular characteristic.
1. On the Toolbar, click the Stack Plot button .
When you first switch to Stack plot mode, the icons are arranged into one tall stack. Once you assign a field to the axis, the icons will move into separate stacks based on their values.
Chapter 3: Learning InspireData, A Tutorial 33
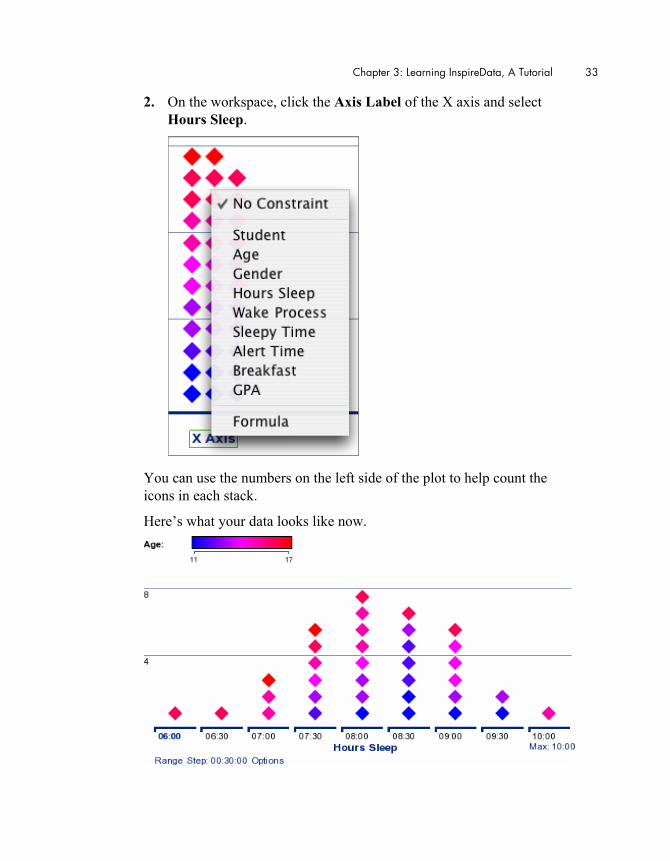
2. On the workspace, click the Axis Label of the X axis and select Hours Sleep.
You can use the numbers on the left side of the plot to help count the icons in each stack.
Here’s what your data looks like now.
34 InspireData™ Getting Started Guide
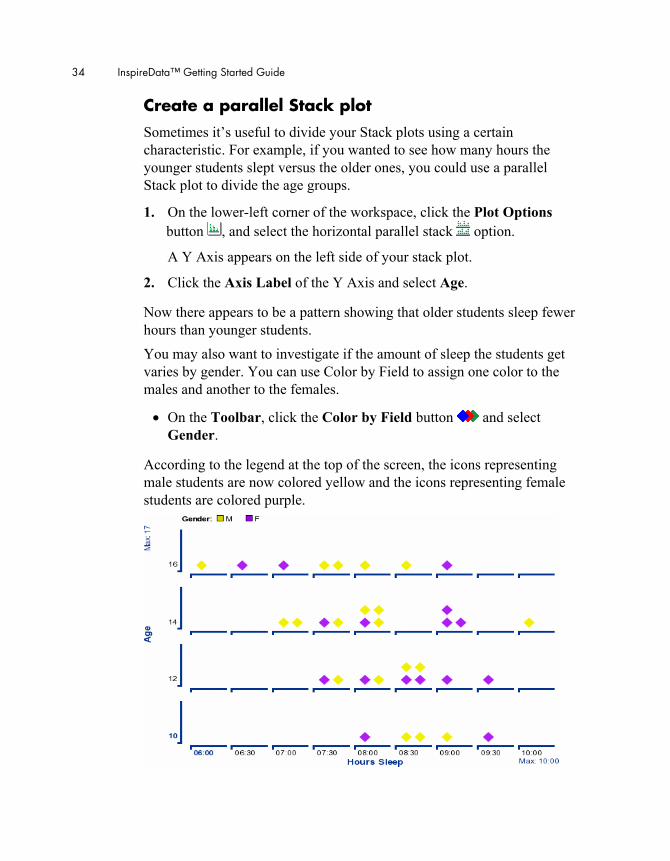
Create a parallel Stack plot Sometimes it’s useful to divide your Stack plots using a certain characteristic. For example, if you wanted to see how many hours the younger students slept versus the older ones, you could use a parallel Stack plot to divide the age groups.
1. On the lower-left corner of the workspace, click the Plot Options button , and select the horizontal parallel stack option.
A Y Axis appears on the left side of your stack plot.
2. Click the Axis Label of the Y Axis and select Age.
Now there appears to be a pattern showing that older students sleep fewer hours than younger students.
You may also want to investigate if the amount of sleep the students get varies by gender. You can use Color by Field to assign one color to the males and another to the females.
• On the Toolbar, click the Color by Field button and select Gender.
According to the legend at the top of the screen, the icons representing male students are now colored yellow and the icons representing female students are colored purple.
Chapter 3: Learning InspireData, A Tutorial 35
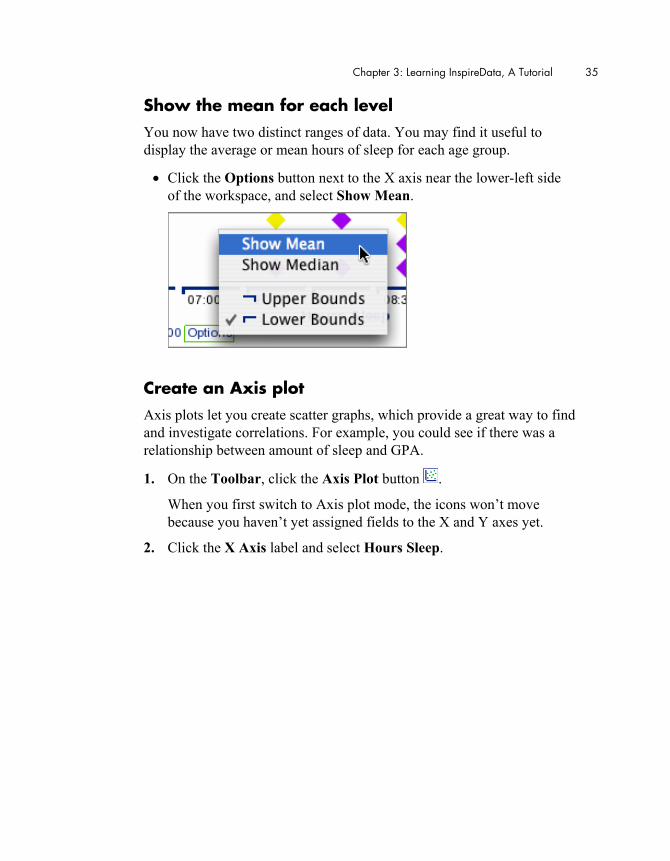
Show the mean for each level You now have two distinct ranges of data. You may find it useful to display the average or mean hours of sleep for each age group.
• Click the Options button next to the X axis near the lower-left side of the workspace, and select Show Mean.
Create an Axis plot Axis plots let you create scatter graphs, which provide a great way to find and investigate correlations. For example, you could see if there was a relationship between amount of sleep and GPA.
1. On the Toolbar, click the Axis Plot button .
When you first switch to Axis plot mode, the icons won’t move because you haven’t yet assigned fields to the X and Y axes yet.
2. Click the X Axis label and select Hours Sleep.
36 InspireData™ Getting Started Guide
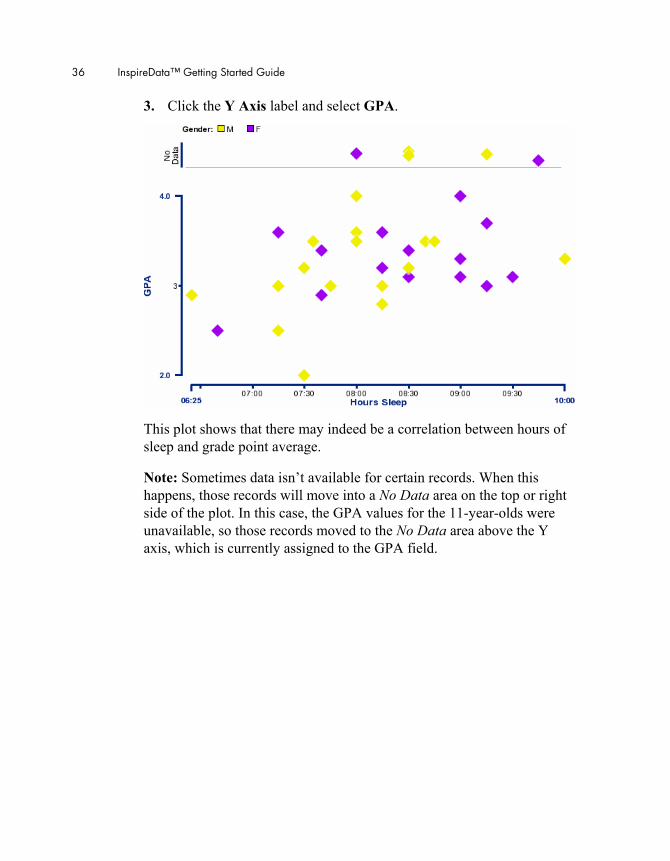
3. Click the Y Axis label and select GPA.
This plot shows that there may indeed be a correlation between hours of sleep and grade point average.
Note: Sometimes data isn’t available for certain records. When this happens, those records will move into a No Data area on the top or right side of the plot. In this case, the GPA values for the 11-year-olds were unavailable, so those records moved to the No Data area above the Y axis, which is currently assigned to the GPA field.
Chapter 3: Learning InspireData, A Tutorial 37
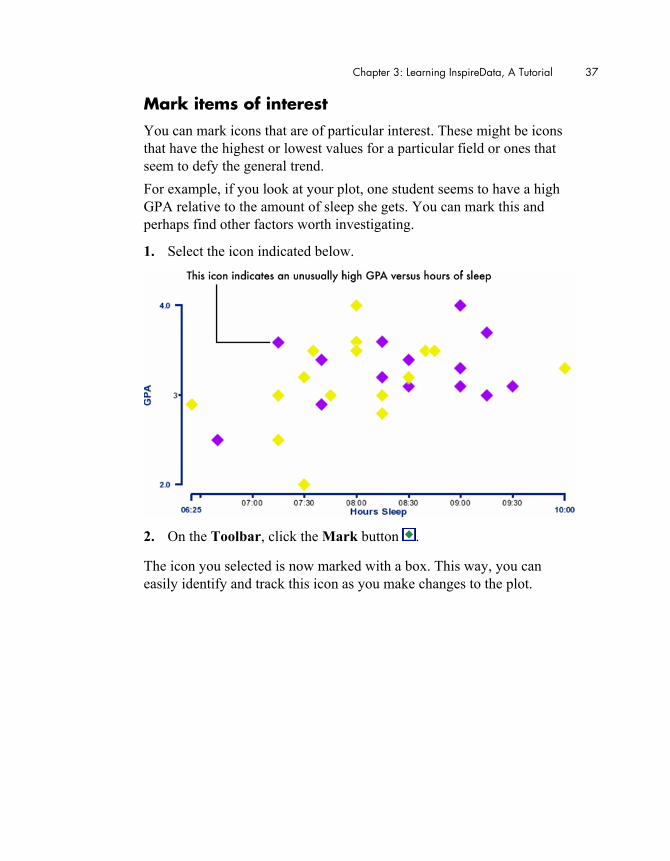
Mark items of interest You can mark icons that are of particular interest. These might be icons that have the highest or lowest values for a particular field or ones that seem to defy the general trend. For example, if you look at your plot, one student seems to have a high GPA relative to the amount of sleep she gets. You can mark this and perhaps find other factors worth investigating.
1. Select the icon indicated below.
2. On the Toolbar, click the Mark button .
The icon you selected is now marked with a box. This way, you can easily identify and track this icon as you make changes to the plot.
38 InspireData™ Getting Started Guide
Create a Pie plot Pie plots—like Stack plots—allow you to show how many records in your table share a common attribute. In a Pie plot, icons are arranged in slices which are determined by the values in the field you assign to the pie. The size of each slice is proportional to the number of data values that fall into each category in the assigned field. The higher the number of records per slice, the larger the pie slice is.
1. On the Toolbar, click the Pie Plot button .
When you first switch to Pie plot mode, the pie contains no slices because you haven’t assigned a field to the pie yet.
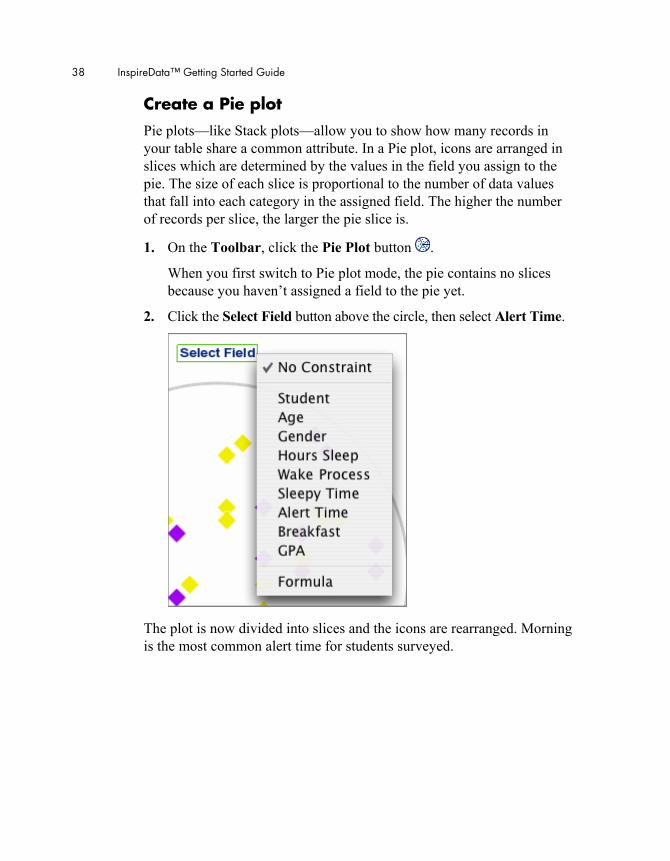
2. Click the Select Field button above the circle, then select Alert Time.
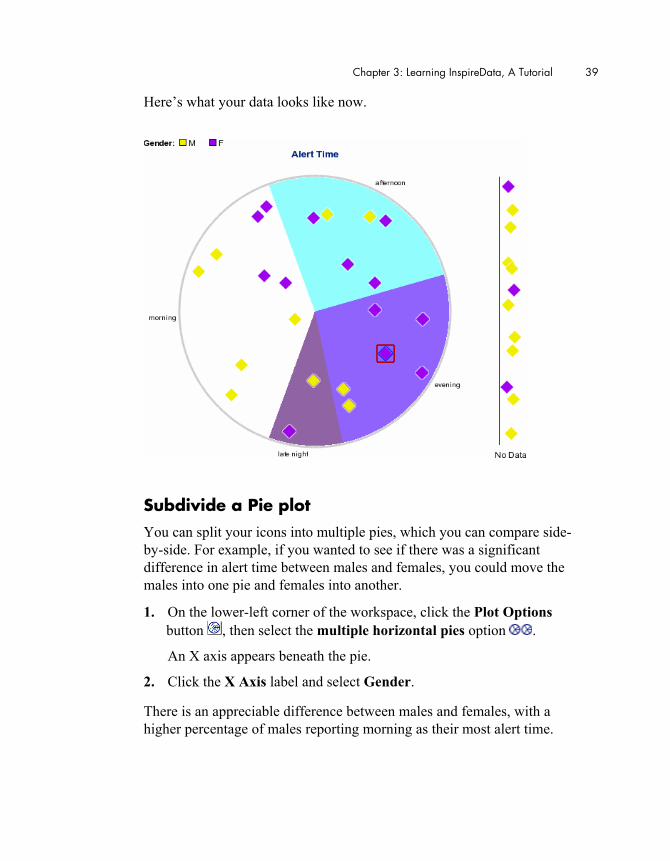
The plot is now divided into slices and the icons are rearranged. Morning is the most common alert time for students surveyed.
Chapter 3: Learning InspireData, A Tutorial 39
Here’s what your data looks like now.
Subdivide a Pie plot You can split your icons into multiple pies, which you can compare side-by-side. For example, if you wanted to see if there was a significant difference in alert time between males and females, you could move the males into one pie and females into another.
1. On the lower-left corner of the workspace, click the Plot Options button , then select the multiple horizontal pies option .
An X axis appears beneath the pie.
2. Click the X Axis label and select Gender.
There is an appreciable difference between males and females, with a higher percentage of males reporting morning as their most alert time.

40 InspireData™ Getting Started Guide
Save a document Whenever you’re working on a document, it’s a good idea to save it on a regular basis. To save a document for the first time, or to save a document you’ve already saved using the current file name, use the Save command.
1. On the File menu, choose Save.
2. If necessary, navigate to the folder in which you want to save the document.
3. Click the Save button.
You’ll open this document again in Lesson Three.
Note: All InspireData documents are automatically saved with an .IDF extension.
Chapter 3: Learning InspireData, A Tutorial 41
Lesson Two: Working in Table View
InspireData’s Table View is where you collect and organize raw data. InspireData enables you to directly enter the data you have collected and import data that you acquire from outside sources like web sites. Once you’ve captured the data, you can modify its formatting and even create new data using formulas. Working in Table View, you’ll learn to do the following:
• Create a new database
• Label and define fields
• Add and format a new field
• Enter record details
• Add a new record
• Reorder fields
• Change the default icon
• Import a custom icon
• Create a Questionnaire
• Conduct a survey using a Questionnaire
• Import data from external sources
Create a new database In this lesson, you’ll create a simple sleep survey database.
1. If you quit InspireData after the last lesson, launch the program.
2. From the InspireData Starter screen, click New.
42 InspireData™ Getting Started Guide
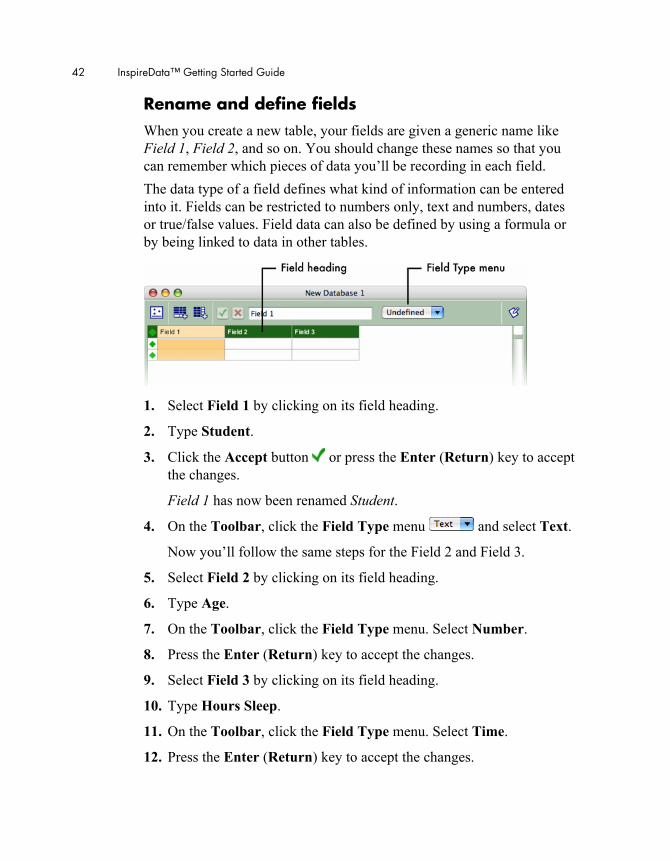
Rename and define fields When you create a new table, your fields are given a generic name like Field 1, Field 2, and so on. You should change these names so that you can remember which pieces of data you’ll be recording in each field. The data type of a field defines what kind of information can be entered into it. Fields can be restricted to numbers only, text and numbers, dates or true/false values. Field data can also be defined by using a formula or by being linked to data in other tables.
1. Select Field 1 by clicking on its field heading.
2. Type Student.
3. Click the Accept button or press the Enter (Return) key to accept the changes.
Field 1 has now been renamed Student.
4. On the Toolbar, click the Field Type menu and select Text.
Now you’ll follow the same steps for the Field 2 and Field 3.
5. Select Field 2 by clicking on its field heading.
6. Type Age.
7. On the Toolbar, click the Field Type menu. Select Number.
8. Press the Enter (Return) key to accept the changes.
9. Select Field 3 by clicking on its field heading.
10. Type Hours Sleep.
11. On the Toolbar, click the Field Type menu. Select Time.
12. Press the Enter (Return) key to accept the changes.
Chapter 3: Learning InspireData, A Tutorial 43
Note: You can edit cell data in either the text entry field on the Toolbar or in the cell itself. If you make a mistake while entering text, just select the words you want to change and type over them. You can also click anywhere in the text and begin typing.
Add and format a new field New tables start with three fields and two records, but you can always add more of each if you need to.
1. On the Toolbar, click the Add Field button .
2. Type GPA to name the new field.
3. On the Toolbar, click the Field Type menu and select Number.
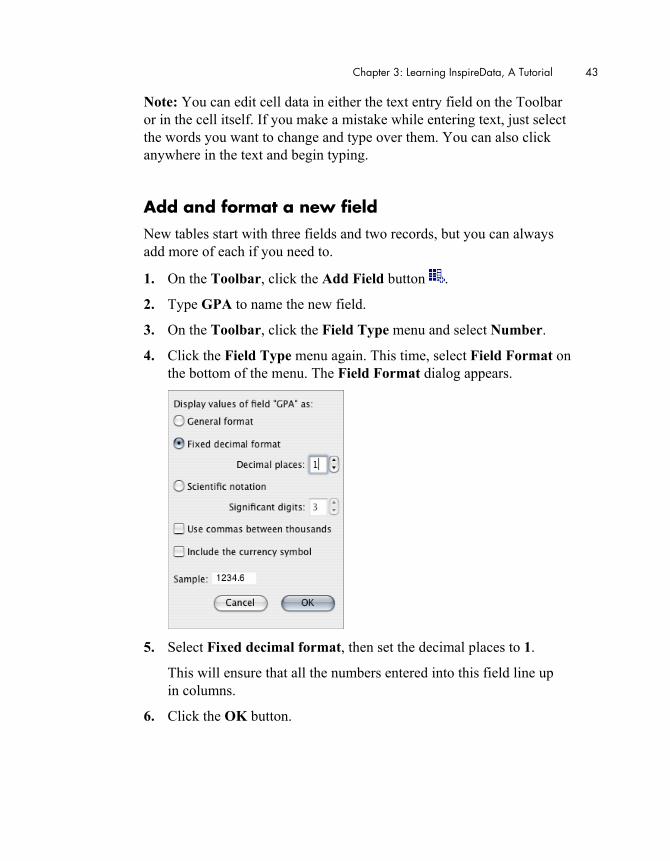
4. Click the Field Type menu again. This time, select Field Format on the bottom of the menu. The Field Format dialog appears.
5. Select Fixed decimal format, then set the decimal places to 1.
This will ensure that all the numbers entered into this field line up in columns.
6. Click the OK button.
44 InspireData™ Getting Started Guide
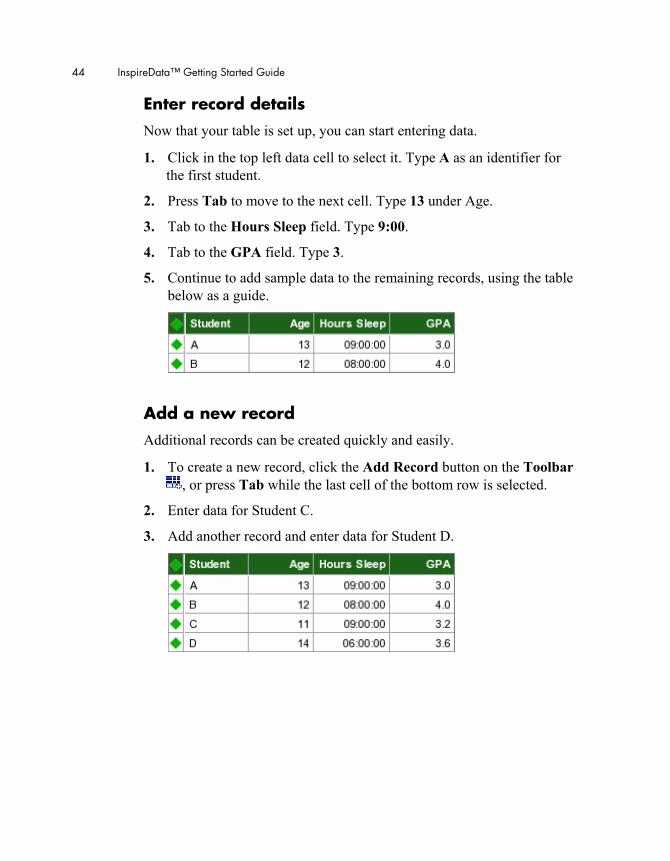
Enter record details Now that your table is set up, you can start entering data.
1. Click in the top left data cell to select it. Type A as an identifier for the first student.
2. Press Tab to move to the next cell. Type 13 under Age.
3. Tab to the Hours Sleep field. Type 9:00.
4. Tab to the GPA field. Type 3.
5. Continue to add sample data to the remaining records, using the table below as a guide.
Add a new record Additional records can be created quickly and easily.
1. To create a new record, click the Add Record button on the Toolbar , or press Tab while the last cell of the bottom row is selected.
2. Enter data for Student C.
3. Add another record and enter data for Student D.
Chapter 3: Learning InspireData, A Tutorial 45
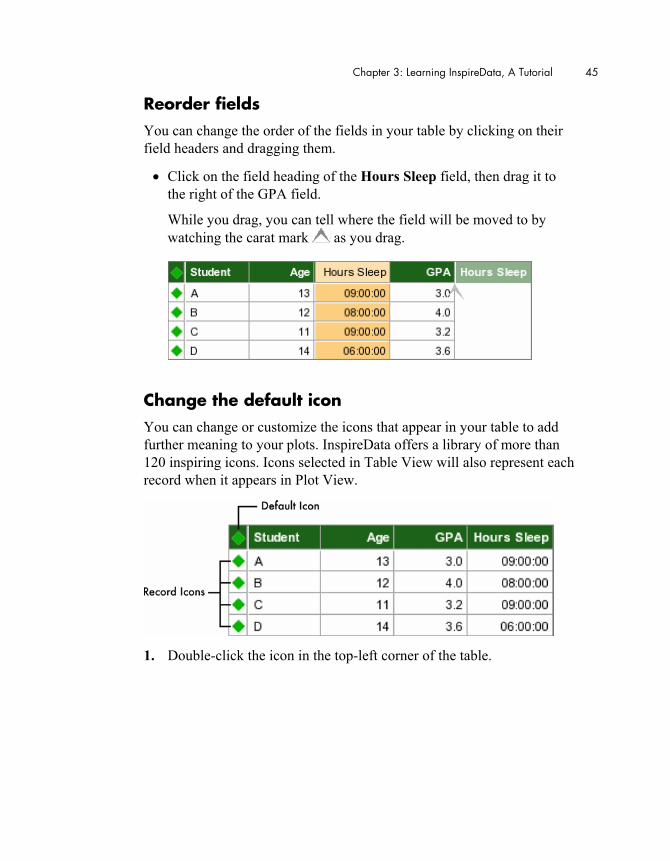
Reorder fields You can change the order of the fields in your table by clicking on their field headers and dragging them.
• Click on the field heading of the Hours Sleep field, then drag it to the right of the GPA field.
While you drag, you can tell where the field will be moved to by watching the carat mark as you drag.
Change the default icon You can change or customize the icons that appear in your table to add further meaning to your plots. InspireData offers a library of more than 120 inspiring icons. Icons selected in Table View will also represent each record when it appears in Plot View.
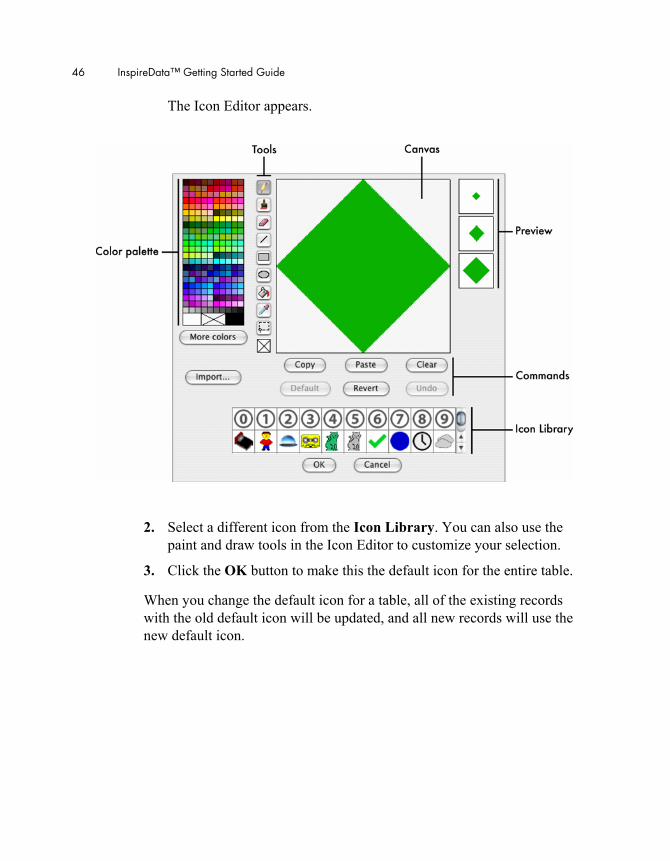
1. Double-click the icon in the top-left corner of the table.
46 InspireData™ Getting Started Guide
The Icon Editor appears.
2. Select a different icon from the Icon Library. You can also use the paint and draw tools in the Icon Editor to customize your selection.
3. Click the OK button to make this the default icon for the entire table.
When you change the default icon for a table, all of the existing records with the old default icon will be updated, and all new records will use the new default icon.
Chapter 3: Learning InspireData, A Tutorial 47
Import a custom icon InspireData provides a variety of tools to create icons, but you can also import a photograph or graphic from a drawing program or web browser. For example, if you have a digital camera, you can take photos of students and use these as custom icons. Imported graphics are automatically resized to fit into the space available on the canvas of the Icon Editor.
1. To add a custom icon to Student A, double-click on Student A’s icon. The Icon Editor opens.
2. Click the Import button.
3. Locate and click on the file you want to import. InspireData can import most types of image files including .GIF and .JPG.
4. Click the Open button.
Note: You can use the tools in the Icon Editor to further customize an imported image.
Create a Questionnaire InspireData’s Questionnaire feature allows you to create new records and enter data for those records using an onscreen form, similar to one you might find on a web page. The Questionnaire is especially useful when you have a group of people who aren’t familiar with InspireData. Using Questionnaires, those people can enter data directly into your document. By writing questions that correspond to each field, you will make it easy for your respondents to know which data goes where. You can set up a computer as a Questionnaire station and let students take turns filling out the form. When a Questionnaire is completed, its data is added as a record to your database.
1. On the Table menu, select Edit Questionnaire.
2. Click the Use custom title checkbox.
3. Type Student Sleep Survey into the Title box.
48 InspireData™ Getting Started Guide
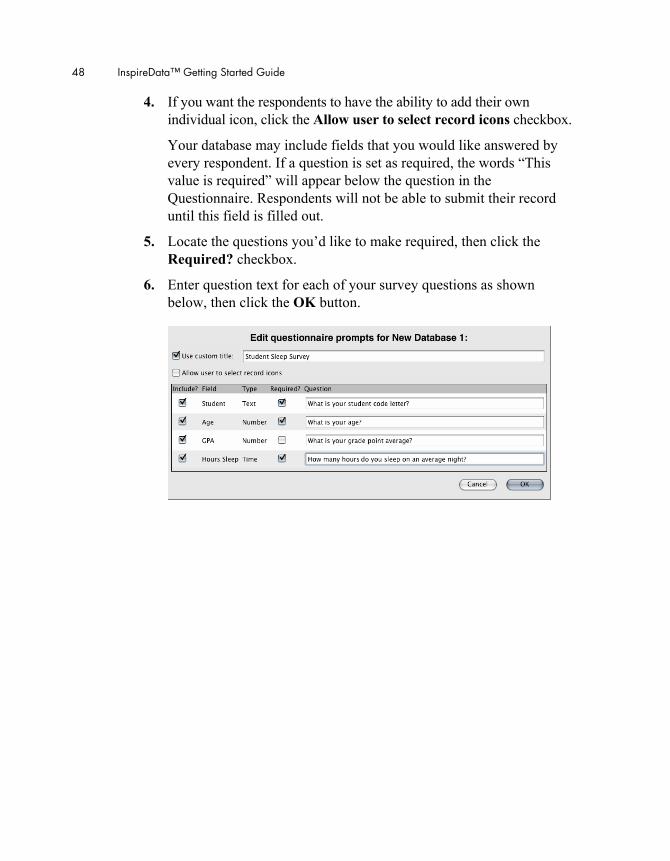
4. If you want the respondents to have the ability to add their own individual icon, click the Allow user to select record icons checkbox.
Your database may include fields that you would like answered by every respondent. If a question is set as required, the words “This value is required” will appear below the question in the Questionnaire. Respondents will not be able to submit their record until this field is filled out.
5. Locate the questions you’d like to make required, then click the Required? checkbox.
6. Enter question text for each of your survey questions as shown below, then click the OK button.
Chapter 3: Learning InspireData, A Tutorial 49
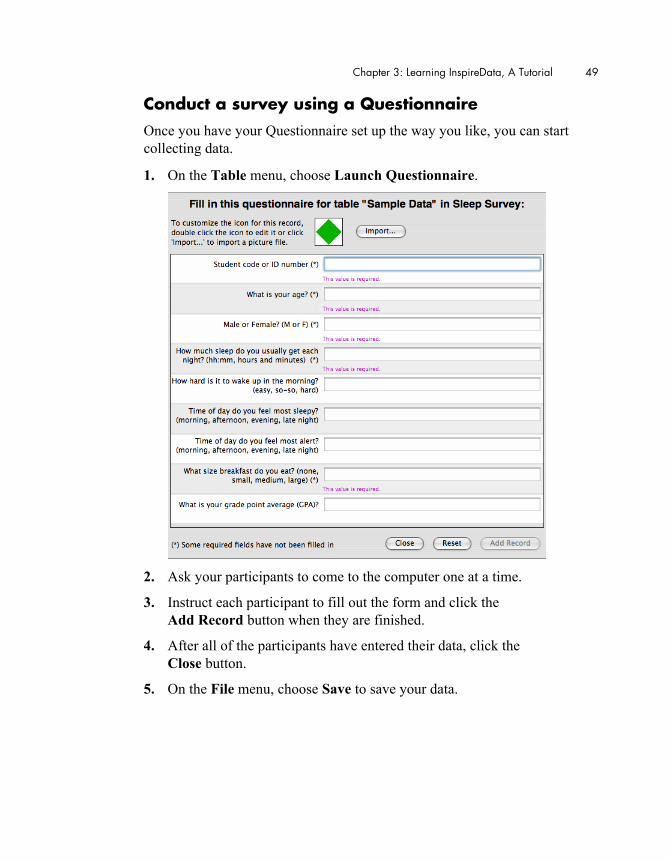
Conduct a survey using a Questionnaire Once you have your Questionnaire set up the way you like, you can start collecting data.
1. On the Table menu, choose Launch Questionnaire.
2. Ask your participants to come to the computer one at a time.
3. Instruct each participant to fill out the form and click the Add Record button when they are finished.
4. After all of the participants have entered their data, click the Close button.
5. On the File menu, choose Save to save your data.
50 InspireData™ Getting Started Guide
Import data from external sources You can import data from a variety of sources, such as data files created by other applications, provided those files are in comma-separated or tab-separated text format. You can also use copy and paste to gather data from sources like a web browser or other software applications. See the InspireData User’s Manual for more information on importing data from other sources. InspireData also includes a tool that allows you to collect reaction time data using a simple game called the Circle Game. See the Circle Game project in the Classroom Projects book and the InspireData User’s Manual for more information.
Chapter 3: Learning InspireData, A Tutorial 51
Lesson Three: Presenting with a slide show
InspireData includes features that allow you to capture and play back a sequence of slides. The Slide Show feature provides a great way for students to document and present their work. Each slide captures a live view of the data, which means that when viewing slides, you can continue to change and work with the captured plots. This enables you to continue investigating your data and make adjustments to your plots. In this lesson, you’ll build a slide show as you learn to do these things:
• Capture a slide
• Name a slide
• Reorder a slide
• Add notes
• Make changes to a slide
• Delete a slide
• Present a slide show
52 InspireData™ Getting Started Guide
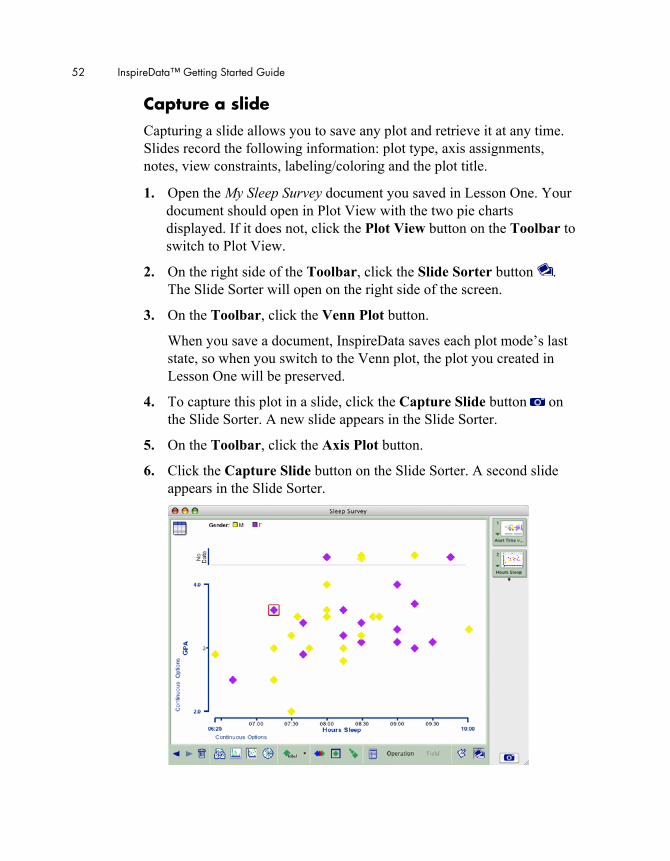
Capture a slide Capturing a slide allows you to save any plot and retrieve it at any time. Slides record the following information: plot type, axis assignments, notes, view constraints, labeling/coloring and the plot title.
1. Open the My Sleep Survey document you saved in Lesson One. Your document should open in Plot View with the two pie charts displayed. If it does not, click the Plot View button on the Toolbar to switch to Plot View.
2. On the right side of the Toolbar, click the Slide Sorter button . The Slide Sorter will open on the right side of the screen.
3. On the Toolbar, click the Venn Plot button.
When you save a document, InspireData saves each plot mode’s last state, so when you switch to the Venn plot, the plot you created in Lesson One will be preserved.
4. To capture this plot in a slide, click the Capture Slide button on the Slide Sorter. A new slide appears in the Slide Sorter.
5. On the Toolbar, click the Axis Plot button.
6. Click the Capture Slide button on the Slide Sorter. A second slide appears in the Slide Sorter.
Chapter 3: Learning InspireData, A Tutorial 53
Name a slide InspireData automatically creates a name for new slides based on the fields assigned to axes on the plot, but you can rename a slide at any time.
1. Click the Slide Options button on the second slide, then select Rename from the menu that appears.
2. Type GPA into the text box that appears, then click OK to rename the slide.
Renaming a slide does not change the title, content or order of the slide in the Slide Sorter.
Reorder a slide You can change the order of the slides in your slide show at any time. You can move the slide up and down the Slide Sorter.
1. Click and drag the GPA slide to the top of the Slide Sorter.
When you move a slide, the other slides will move to make room for the slide you are dragging, indicating where the moved slide will be placed.
2. Release the mouse button.
Add notes Notes are a useful feature that aids in capturing thoughts and communicating findings. Notes can be added to plots and slides in Plot View, as well as cells and fields in Table View.
1. On the Toolbar, click the Note button .
The Notes area appears at the bottom of your screen.
2. Type It appears that there is a correlation between the amount of sleep students get and their grade point average.
54 InspireData™ Getting Started Guide
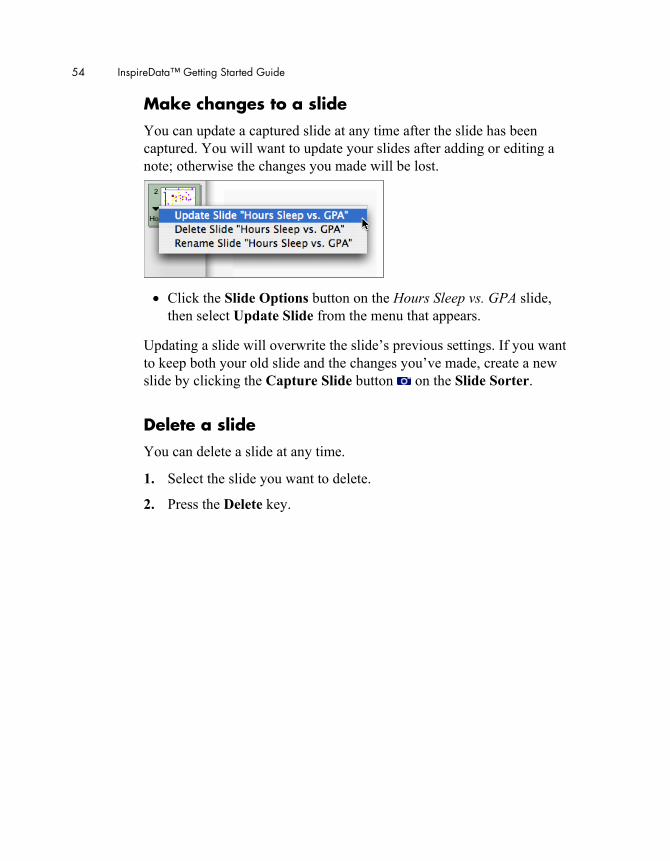
Make changes to a slide You can update a captured slide at any time after the slide has been captured. You will want to update your slides after adding or editing a note; otherwise the changes you made will be lost.
• Click the Slide Options button on the Hours Sleep vs. GPA slide, then select Update Slide from the menu that appears.
Updating a slide will overwrite the slide’s previous settings. If you want to keep both your old slide and the changes you’ve made, create a new slide by clicking the Capture Slide button on the Slide Sorter.
Delete a slide You can delete a slide at any time.
1. Select the slide you want to delete.
2. Press the Delete key.
Chapter 3: Learning InspireData, A Tutorial 55
Present a slide show Slides are saved with your work when you save your document. When you are ready to present your slides, you can either use the Slide Sorter or the Slide Show controls. Remember, one of the very powerful features of InspireData is that slides remain “live.” This means that instead of being a unchangeable screen capture, slides can be modified at any time, just like any plot. Changes you make in the Table View will automatically be updated on your slides. Remember, if you want to save any of the changes you’ve made to a slide in Plot View, you will have to update that slide as described previously.
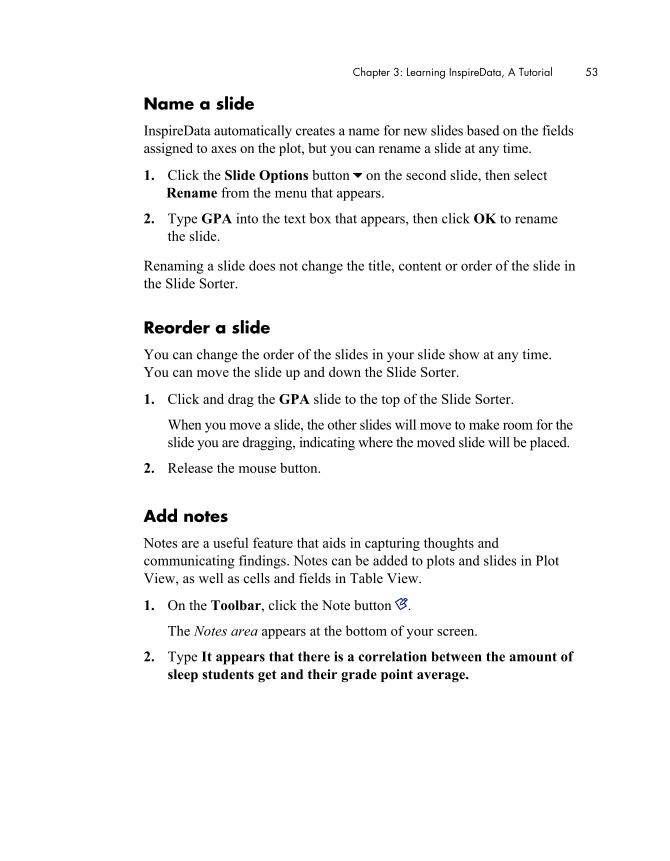
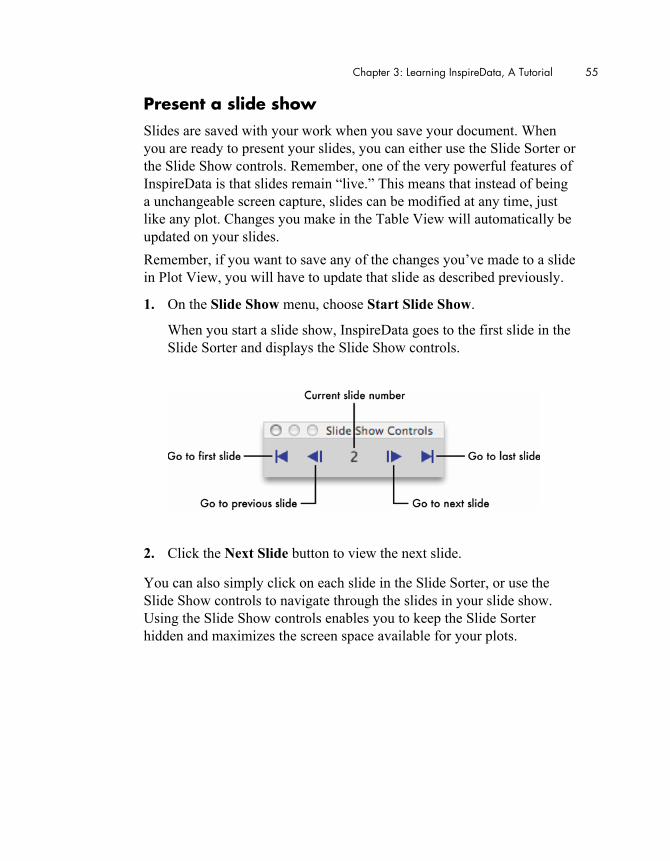
1. On the Slide Show menu, choose Start Slide Show.
When you start a slide show, InspireData goes to the first slide in the Slide Sorter and displays the Slide Show controls.
2. Click the Next Slide button to view the next slide.
You can also simply click on each slide in the Slide Sorter, or use the Slide Show controls to navigate through the slides in your slide show. Using the Slide Show controls enables you to keep the Slide Sorter hidden and maximizes the screen space available for your plots.
56 InspireData™ Getting Started Guide
Lesson Four: Plotting time series and more
InspireData includes a number of sophisticated features that extend its usefulness and make it an extremely powerful and flexible tool. In this lesson, you’ll plot time series data and explore some of the many other plotting options available.
• Plot time series data
• Grouping time series data
• Change plot colors
• Compute summary data
• Clear a plot
• View previous plots
• Add a plot title
• Combine categories
Chapter 3: Learning InspireData, A Tutorial 57
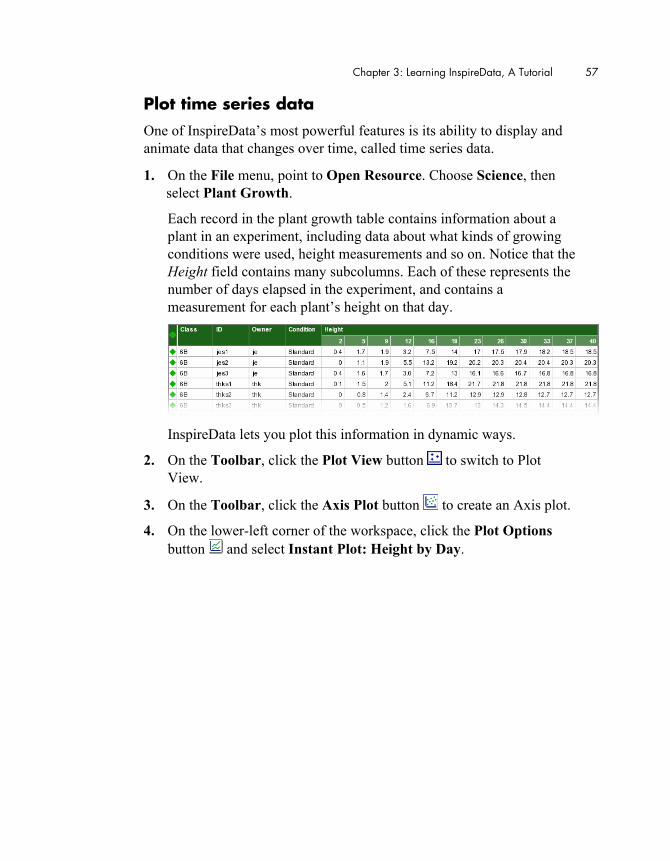
Plot time series data One of InspireData’s most powerful features is its ability to display and animate data that changes over time, called time series data.
1. On the File menu, point to Open Resource. Choose Science, then select Plant Growth.
Each record in the plant growth table contains information about a plant in an experiment, including data about what kinds of growing conditions were used, height measurements and so on. Notice that the Height field contains many subcolumns. Each of these represents the number of days elapsed in the experiment, and contains a measurement for each plant’s height on that day.
InspireData lets you plot this information in dynamic ways.
2. On the Toolbar, click the Plot View button to switch to Plot View.
3. On the Toolbar, click the Axis Plot button to create an Axis plot.
4. On the lower-left corner of the workspace, click the Plot Options button and select Instant Plot: Height by Day.
58 InspireData™ Getting Started Guide
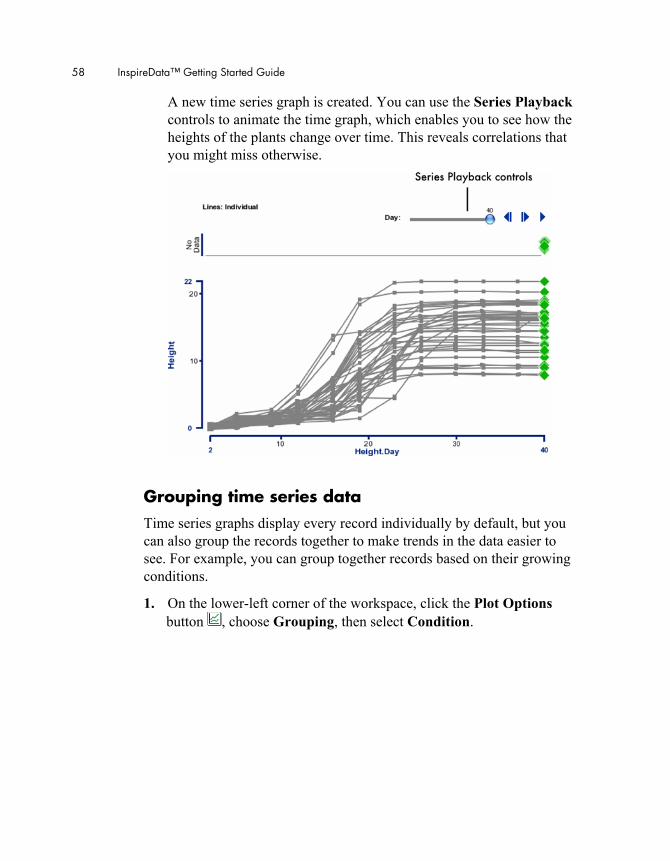
A new time series graph is created. You can use the Series Playback controls to animate the time graph, which enables you to see how the heights of the plants change over time. This reveals correlations that you might miss otherwise.
Grouping time series data Time series graphs display every record individually by default, but you can also group the records together to make trends in the data easier to see. For example, you can group together records based on their growing conditions.
1. On the lower-left corner of the workspace, click the Plot Options button , choose Grouping, then select Condition.
Chapter 3: Learning InspireData, A Tutorial 59
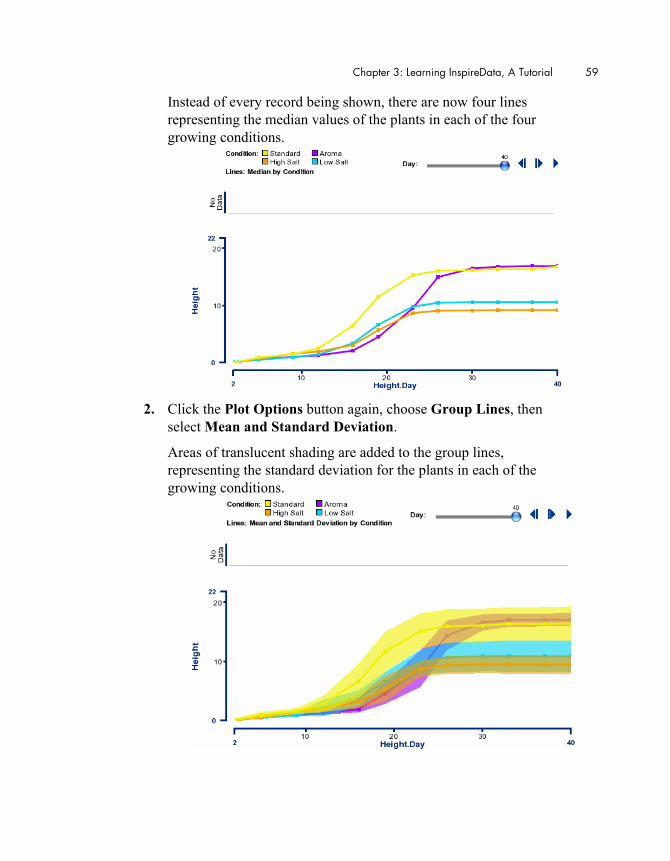
Instead of every record being shown, there are now four lines representing the median values of the plants in each of the four growing conditions.
2. Click the Plot Options button again, choose Group Lines, then
select Mean and Standard Deviation.
Areas of translucent shading are added to the group lines, representing the standard deviation for the plants in each of the growing conditions.
60 InspireData™ Getting Started Guide
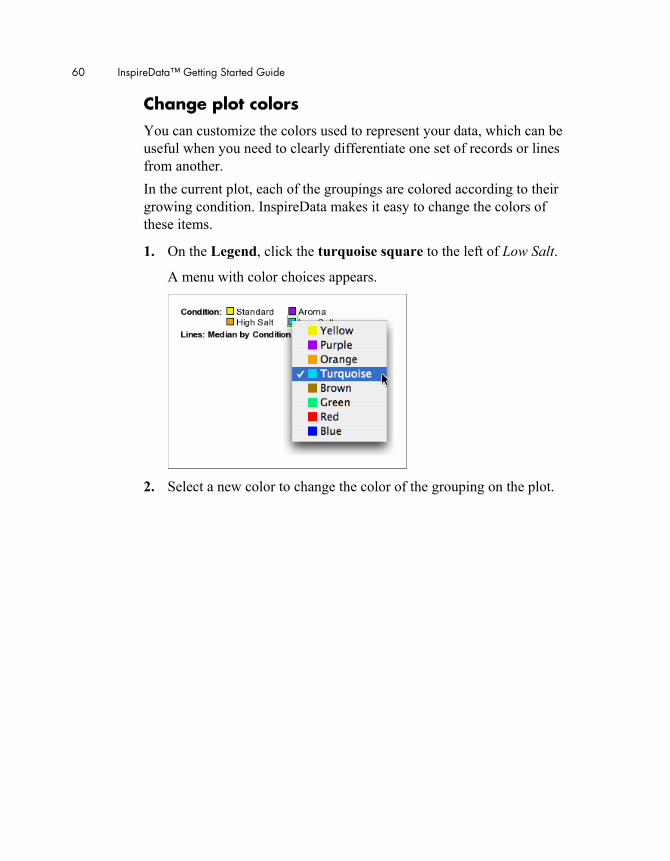
Change plot colors You can customize the colors used to represent your data, which can be useful when you need to clearly differentiate one set of records or lines from another. In the current plot, each of the groupings are colored according to their growing condition. InspireData makes it easy to change the colors of these items.
1. On the Legend, click the turquoise square to the left of Low Salt.
A menu with color choices appears.
2. Select a new color to change the color of the grouping on the plot.
Chapter 3: Learning InspireData, A Tutorial 61
Compute summary data InspireData allows you to calculate summary data for your plots, including count, total, mean, median and smallest or largest data points. For example, in this plot you might want to calculate the mean height for the plants on each day.
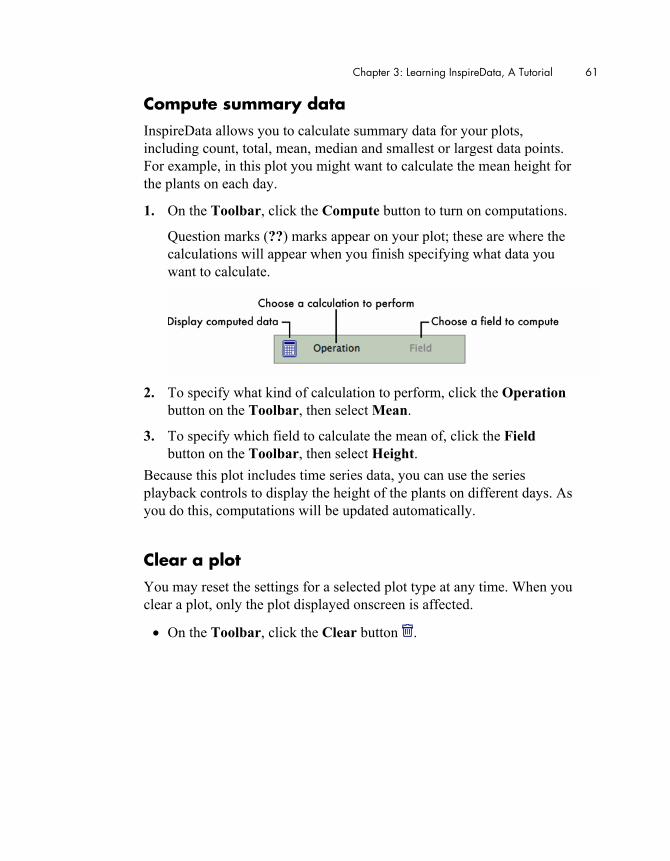
1. On the Toolbar, click the Compute button to turn on computations.
Question marks (??) marks appear on your plot; these are where the calculations will appear when you finish specifying what data you want to calculate.
2. To specify what kind of calculation to perform, click the Operation
button on the Toolbar, then select Mean.
3. To specify which field to calculate the mean of, click the Field button on the Toolbar, then select Height.
Because this plot includes time series data, you can use the series playback controls to display the height of the plants on different days. As you do this, computations will be updated automatically.
Clear a plot You may reset the settings for a selected plot type at any time. When you clear a plot, only the plot displayed onscreen is affected.
• On the Toolbar, click the Clear button .
62 InspireData™ Getting Started Guide
View previous plots InspireData keeps a history of the plots you create while you work. You can jump backward or forward at any time, just like you would with previously viewed pages in a web browser.
1. On the Toolbar, click the Back button to view your previously created plots.
2. On the Toolbar, click the Forward button to return to the most recently created plot.
Add a plot title A title is an important element in a finished plot. InspireData makes it easy to add this information.
1. On the Plot menu, select Plot Title.
2. Type Growth Comparison by Treatment Condition.
3. Click the Accept button to add the title to your plot. You can make changes to an existing title by clicking directly on the title in your plot.
Chapter 3: Learning InspireData, A Tutorial 63
Combine categories While working on a plot, you might find it useful to clarify your data by combining two related categories into one. For example, you can combine the two growing conditions with varying salt levels into one supercategory called Salt.
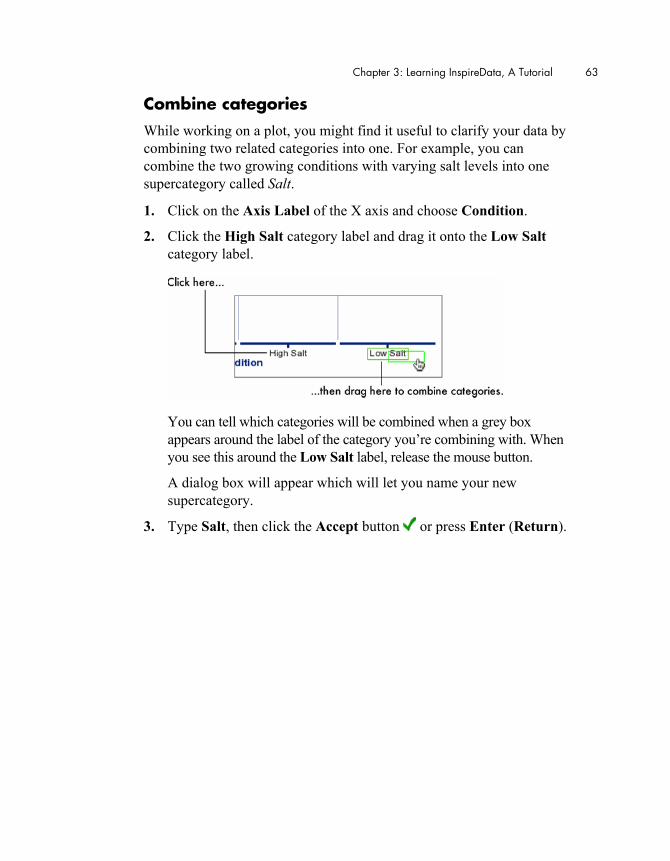
1. Click on the Axis Label of the X axis and choose Condition.
2. Click the High Salt category label and drag it onto the Low Salt category label.
You can tell which categories will be combined when a grey box appears around the label of the category you’re combining with. When you see this around the Low Salt label, release the mouse button.
A dialog box will appear which will let you name your new supercategory.
3. Type Salt, then click the Accept button or press Enter (Return).
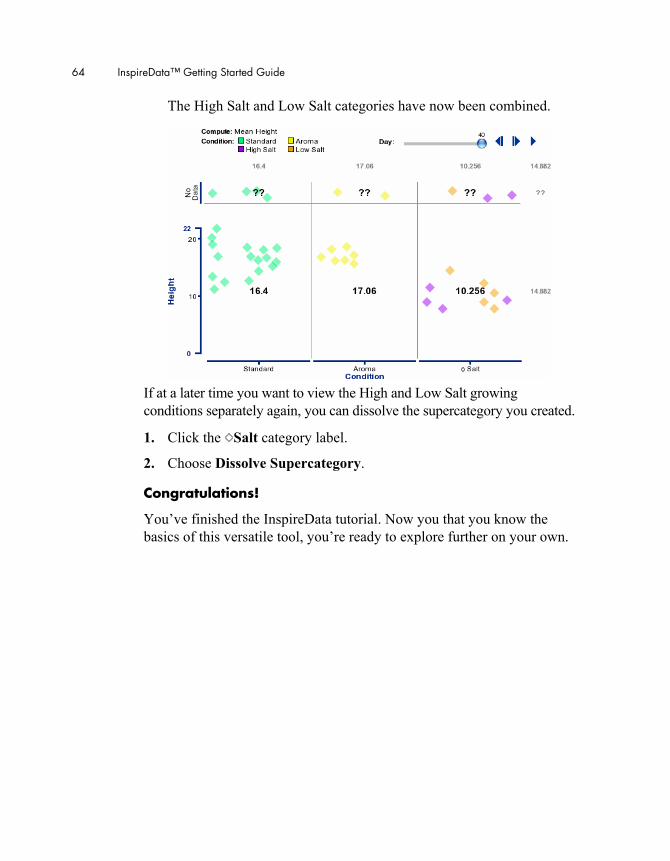
64 InspireData™ Getting Started Guide
The High Salt and Low Salt categories have now been combined.
If at a later time you want to view the High and Low Salt growing conditions separately again, you can dissolve the supercategory you created.
1. Click the Salt category label.
2. Choose Dissolve Supercategory.
Congratulations!
You’ve finished the InspireData tutorial. Now you that you know the basics of this versatile tool, you’re ready to explore further on your own.
Chapter 3: Learning InspireData, A Tutorial 65
Other inspiring resources
To learn more about using InspireData, check out these inspiring resources.
Online Help The InspireData Help system contains detailed information about how to use InspireData, including special features, tools and commands.
• To open the Help system, choose InspireData Help on the Help menu. If the Help system is not available, you must install it using the InspireData CD-ROM.
InspireData User’s Manual The InspireData User’s Manual contains all the information in the Help system. The manual is available as a PDF file, which you can view and print using Adobe Acrobat Reader.
• To open the User’s Manual PDF file, click the Learn to Use button on the Starter screen and select User’s Manual.pdf.
InspireData Classroom Projects These ten standards-focused projects provide a fantastic jumpstart to integrating use of InspireData into the classroom. You’ll find step-by-step guidance on how to use this powerful tool to achieve desired learning outcomes across the curriculum.
• To open the InspireData Classroom Projects PDF file, click the Learn to Use button on the Starter screen and select Classroom Projects.pdf.
Database and example resources InspireData includes more than 60 built-in databases and examples grouped by curricular focus. Examples contain notes and slides to help you begin investigating the data more thoroughly; example files are noted with an Ex at the end of the filename. For example: Dinosaurs Ex.idf.
1. On the InspireData Starter screen, click Resources.
2. Select a curricular area and choose a database or example to open.
66 InspireData™ Getting Started Guide
The following is a comprehensive list of the databases provided with InspireData: 100m Track Finals
This data set shows the splits every 10 meters for the top four finishers in the men’s 100-m track final in the 1988 Olympics in Seoul, South Korea.
Agriculture Trends
This data set captures the changing trends in agriculture, including the percentages of specific crops and livestock that are present on farms in the years 1900 and 1997.
Alligators
This data set includes alligator data, including gender, length, weight and habitat.
American Community Survey
The American Community Survey (ACS) is a nation-wide survey that collects population, social, economic and housing data. This data set contains selected social characteristics of the United States for the years 2000 to 2004.
Are You a Square
This data set represents height and wingspan measurements taken on a class of elementary school-aged students.
Baseball Salaries
This data set represents National League Baseball salaries in 2005.
Bean Box Experiment
This is experimental data collected by dropping 10 beans into a box that has a shaded picture inside. The data shows how many beans landed in the shaded picture and how many did not land in the shaded picture, in order to determine the experimental probability that a single bean will land in the shaded area.
Cats
This data set simulates a survey of cat characteristics, such as age, weight, body length, eye color and fur color.
Cell Division
This data set represents the results of mitosis, a process of cell division that produces two
daughter cells from a single parent cell. The data shows how many daughter cells will result from a single parent cell after 24 hours.
Cell Phone Plans
This data set includes the minutes, charges and costs for three different cell phone plans.
Change Over Time
This data set includes multiple examples of data indexed to time or sequential events.
Circle Game
This fictional data simulates the results of a simple computer game that compares the reaction times of a student’s dominant hand vs. non-dominant hand.
City Climates
This data set shows the average annual monthly temperature as it was recorded over a 30 year period (1971-2000) by the National Climatic Data Center.
Clay Boat Experiment
This fictional experimental data represents the weight in pennies that student-designed clay boats can hold before sinking. The experiment is performed four times with a modified boat design for each trial.
Consumer Price Index
From US Department of Labor, this data set collects the US city averages for the consumer price index for all urban consumers.
Cooling
This data represents the temperature change over time as a beaker of water cools off.
Countries of the World
This data set profiles 155 countries of the world, and includes information on population density and change over time, average life expectancy, literacy rates, GDP, imports, exports and government expenditures.
Defrost Time
This data set shows defrost times in hours for turkeys that range in weight from 4 lbs to 24 lbs.
Chapter 3: Learning InspireData, A Tutorial 67
Dinosaurs
This data set contains information, such as geographic locations, era, length, height, mass and diet, for many different kinds of dinosaurs.
Early Native Americans
This data set contains statistics and background information on the characteristics of selected Native American groups or tribes.
Election Results
This data set contains selected U.S. presidential election data, including popular and electoral college results, from 1876-2004.
Endangered Species
This data set represents the number of endangered animals and plants per calendar year as of 12/31/2005.
Fish Counts
This data set compiles yearly totals of fish counted passing over the Bonneville Lock and Dam from 1938 to 2002.
Friction Experiment
This data was collected by rolling a cue ball through a set of photogates and measuring the distance from the gates to where the ball stopped.
Gasoline Prices
This data set demonstrates average price trends of gasoline in the U.S. from 1977-2003.
Harmony
This data set collects information on musical notes, including set note, solfege, high and low frequencies, and the frequency ratio.
Heating
This data represents the temperature change over time as a pan of water is heated on a stove.
Heptathlon
This data contains the results of the 2004 Olympics Women’s Heptathlon event.
Historical US Population
This data set contains population and population density figures beginning with the first U.S. census in 1790 through 1900.
Human Cannonball
This fictional data set represents the vertical height (in feet) and the horizontal distance (in feet) of a human being launched from a cannon.
Hurricanes
This data set documents the tracking information for hurricanes in the North Atlantic Basin in 2003 and 2004.
Minimum Wage
This data set, compiled from data on the U.S. Department of Labor web site, details the number of workers paid at or below the prevailing Federal minimum wage in 2002.
Motor Vehicle Safety
This data set contains motor vehicle safety data for selected years from 1960-1985, and annual data from 1990-2003.
Music Survey
This fictional data shows the kinds of answers you might get in a classroom music survey.
NBA Statistics
This data contains statistics for teams and players in the NBA 2005-2006 season.
Oil Slick Spread
This data set represents the spread of an oil slick over time.
Pendulum Experiment
This data set shows the time it takes a pendulum to swing 10 times, and the corresponding weight and length of the pendulum used in each trial.
Periodic Table
This data set collects information for each element represented in periodic table, including its atomic number and weight, electron configuration, electronegativity and ionization potential.
Planets Advanced
Geared for middle to high school students, this data set contains NASA planetary data, including orbital circumference, mass, volume, density, rotation period, rotational velocity, pressure and calculated escape velocity.
68 InspireData™ Getting Started Guide
Planets Basic
Aimed at elementary students, this data set contains planetary data from NASA, including the diameter, circumference, surface area, minimum and maximum surface temperature measurements for each planet.
Plant Growth
This data set charts plant growth over time, as it is affected by various changes in growing conditions, such as low salt, high salt and aromatherapy.
Produce Predictions
This data set contains length and girth measurements for fruits and vegetables from the local produce market.
Roller Coasters
This data set contains a variety of facts about roller coasters of the world including track material, largest drop, height, length and top speed.
Savings Account
This data set represents the future value of a savings account with an initial deposit of $2600.00, no additional contributions, collecting 4% interest compounded four times annually for 30 years.
Seat Belt and Helmet Use
This data set contains seat belt and motorcycle helmet use statistics for the years 1994 to 2004.
Shopping Cart Train
This data set includes the number of carts in a shopping cart train and its resulting overall length.
Sleep in Mammals
This data set includes statistics for body weight, brain weight, sleep cycle, life span and gestation period for several mammals.
Sleep Survey
This fictional survey represents data, including hours of sleep, ease of waking up, sleepy time, alert time, size of breakfast and average GPA, you might collect from students in a classroom.
Slinky Experiment
This data set was collected by hanging a slinky vertically and measuring its length. The number of coils allowed to hang is varied.
Soap Brands
This data set presents information such as price and bubble diameter for several different soap brands.
Student Survey
This fictional data set shows data, including hair and eye color, that you might collect from students in your classroom.
Time and Position
This data set contains information such as average speed, time and acceleration for several experiments.
US Immigration
Adapted from the U.S. Department of Homeland Security yearbook, this data set collects immigration to the United States statistics for the years 1820 to 2004.
US Unemployment Rates
This data represents the fluctuations in the U.S. national unemployment rate from 1948 to 2004.
Video Game Survey
This fictional data set shows the kinds of data you might collect in a classroom video game survey.
World Population Growth
This data set presents the total mid-year population of the world with projections for population growth through 2050.

Inspiration Software®, Inc. License Agreement 69
Inspiration Software®, Inc. License Agreement
IMPORTANT -- PLEASE READ THIS LICENSE AGREEMENT CAREFULLY BEFORE OPENING THE SOFTWARE PACKAGE:
In this Agreement, “Software” means the computer program and software known as InspireData Version 1. “You” or “your” means the end user and licensee of the Software pursuant to this Agreement. “Inspiration Software” means Inspiration Software, Inc., an Oregon corporation.
TERMS OF AGREEMENT: When you open the package containing the CD-ROM disk on which the Software is installed, you agree to be bound by the terms and conditions of this Agreement and at that time the grant of the license described below will be effective. If you do not agree to be so bound, promptly return the unopened Software package and all contents to the place of purchase for a full refund of the amount you paid for this Software license.
GRANT OF LICENSE FOR USE ON ONE COMPUTER: Inspiration Software grants to you a nonexclusive license to use the Software on the temporary memory, hard drive or other storage device of one computer. You must purchase a license for each additional computer on which the Software is installed or can be used. If the Software is installed on a computer which is usable by multiple work stations or on multiple computers connected by a network, you must purchase licenses for each computer that can access or use the Software.
PROPRIETARY RIGHT: All right in and to the Software (including but not limited to any images, photographs, animations, video, audio, music, text, examples, templates, symbols and software modules incorporated into the Software) are owned or licensed by Inspiration Software and are protected by law, including without limitation, U.S. and international copyright laws and international trade provisions. You acknowledge the ownership, validity and enforceability in all aspects of all rights, including patent, copyright and trademark rights, that Inspiration Software has in the Software. You will not participate in any attack on the validity or enforceability of Inspiration Software’s above-described rights whether in court, the United States Patent and Trademark Office, the U.S. Copyright Office, or elsewhere, or otherwise contest Inspiration Software’s above-described rights. It is in the intent of Inspiration Software and you that this paragraph shall have claim and issue preclusive effect. You agree that the nature and quality of the Software will conform to standards set by Inspiration Software and otherwise be under the control of Inspiration Software. You will not use the Software for any purpose other than as expressly provided in this Agreement, including without limitation, any unauthorized copying or distribution of, or other act with respect to the Software, that would violate any law. You may not modify, reverse engineer, decompile, disassemble, create derivative works, or otherwise change the whole or any part of the Software, nor may you deliver copies to, or sell, rent, lease, loan or sublicense the Software to any third party (other than as expressly provided in this Agreement).
You may transfer the Software installed on the enclosed CD-ROM disk along with the accompanying written materials to a recipient, but only if you retain no copies thereof and the recipient agrees to the terms of this Agreement.

70 InspireData™ Getting Started Guide
LIMITED WARRANTY: Inspiration Software warrants that the CD-ROM disk on which any portion of the Software is recorded will be free of defects in materials and workmanship under normal use for ninety (90) days after the original purchase. If a defect occurs during such ninety (90) day period, you may return the CD-ROM disk to Inspiration Software for free replacement. Inspiration Software will replace the CD-ROM disk, provided that you have previously properly filled out, executed and returned the registration card accompanying the Software to Inspiration Software. Any replacement Software CD-ROM disk will be warranted for the remainder of the original warranty period or 30-days, whichever is greater; provided, however, that this replacement warranty is not available, nor will it be provided by Inspiration Software, outside of the United States of America. Inspiration Software disclaims all other warranties, either express or implied, including but not limited to implied warranties of merchantability and fitness for a particular purpose, with respect to the Software. In no event will Inspiration Software be liable to you for damages, whether based on contract, tort, warranty or other legal or equitable basis, including any loss of profits, loss of business, cost savings or other indirect, special, incidental or consequential damages arising out of or related to the Software, even if Inspiration Software, or an authorized representative of Inspiration Software, has been advised of the possibility of such damages. Subject to the foregoing, certain Software content may be available for use on your computer only through computer download via computer Internet access. You understand that the operability and functionality of the Software may be dependent upon your computer’s performance capabilities, its capacity to access the Internet and the operability of computer servers or Internet web sites on which Software content may be stored or from which Software content may be accessed. Without limiting any other matter contained herein, Inspiration Software does not warrant or represent that the Software will meet your requirements or that the operation of the Software will be uninterrupted or error-free. You bear all risk of loss for computer, Software or other malfunctions arising from access to or use of the Internet. The remedies set forth in this Agreement shall be your sole and exclusive remedies for any breach of this Agreement by Inspiration Software.
GENERAL: All notices under this Agreement will be transmitted between the parties at the addresses identified above, or as otherwise designated by written notice from either party to the other. This Agreement contains the entire understanding between the parties regarding the subject matter of this Agreement, superseding all prior or contemporaneous communications, agreements and understandings between you and Inspiration Software. This Agreement is binding on and inures to the benefit of the parties, their legal representatives, successors and assigns; provided, however, that except as otherwise provided herein, neither this Agreement, nor any rights granted hereunder, may be assigned, transferred, conveyed or encumbered by you without the prior written consent of Inspiration Software. This Agreement will be construed in accordance with the internal laws (and not the law of conflicts) of the state of Oregon, and it may be amended only in writing and signed by duly authorized representatives of both parties. If any provision or clause of this Agreement, or any portion thereof, is held by any court or other tribunal of competent jurisdiction to be illegal, void or unenforceable in such jurisdiction, the remainder of such provisions shall not thereby be affected and shall be given full effect, without regard to the invalid portion. This Agreement is neither intended to, nor shall it be construed as creating, a joint venture, partnership or other form of business association between the parties. If any suit or action is filed by any party to enforce this Agreement or otherwise with respect to the subject matter of this Agreement, the prevailing party shall be entitled to recover reasonable attorney fees incurred in preparation or in prosecution or defense of such suit or action as fixed by the trial court, and if any appeal is taken from the decision of the trial court, reasonable attorney fees as fixed by the appellate court. If you are a U.S. Government user, then the Software is provided with “RESTRICTED RIGHTS” as set forth in subparagraphs (c)(1) and (c)(2) of the Commercial Computer Software-Restricted Rights clause at FAR 52.277-19.
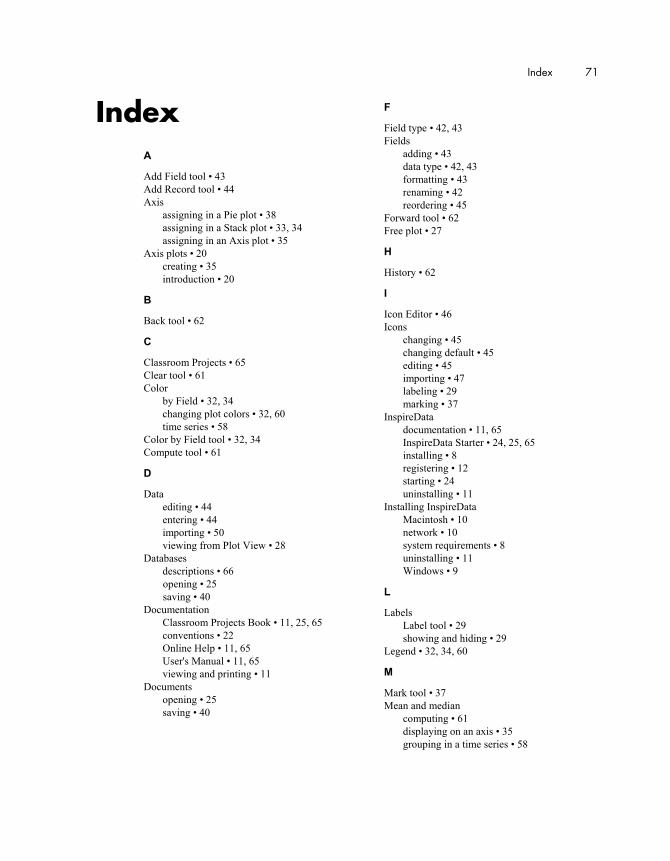
Index 71
Index A
Add Field tool • 43 Add Record tool • 44 Axis
assigning in a Pie plot • 38 assigning in a Stack plot • 33, 34 assigning in an Axis plot • 35
Axis plots • 20 creating • 35 introduction • 20
B
Back tool • 62
C
Classroom Projects • 65 Clear tool • 61 Color
by Field • 32, 34 changing plot colors • 32, 60 time series • 58
Color by Field tool • 32, 34 Compute tool • 61
D
Data editing • 44 entering • 44 importing • 50 viewing from Plot View • 28
Databases descriptions • 66 opening • 25 saving • 40
Documentation Classroom Projects Book • 11, 25, 65 conventions • 22 Online Help • 11, 65 User's Manual • 11, 65 viewing and printing • 11
Documents opening • 25 saving • 40
F
Field type • 42, 43 Fields
adding • 43 data type • 42, 43 formatting • 43 renaming • 42 reordering • 45
Forward tool • 62 Free plot • 27
H
History • 62
I
Icon Editor • 46 Icons
changing • 45 changing default • 45 editing • 45 importing • 47 labeling • 29 marking • 37
InspireData documentation • 11, 65 InspireData Starter • 24, 25, 65 installing • 8 registering • 12 starting • 24 uninstalling • 11
Installing InspireData Macintosh • 10 network • 10 system requirements • 8 uninstalling • 11 Windows • 9
L
Labels Label tool • 29 showing and hiding • 29
Legend • 32, 34, 60
M
Mark tool • 37 Mean and median
computing • 61 displaying on an axis • 35 grouping in a time series • 58
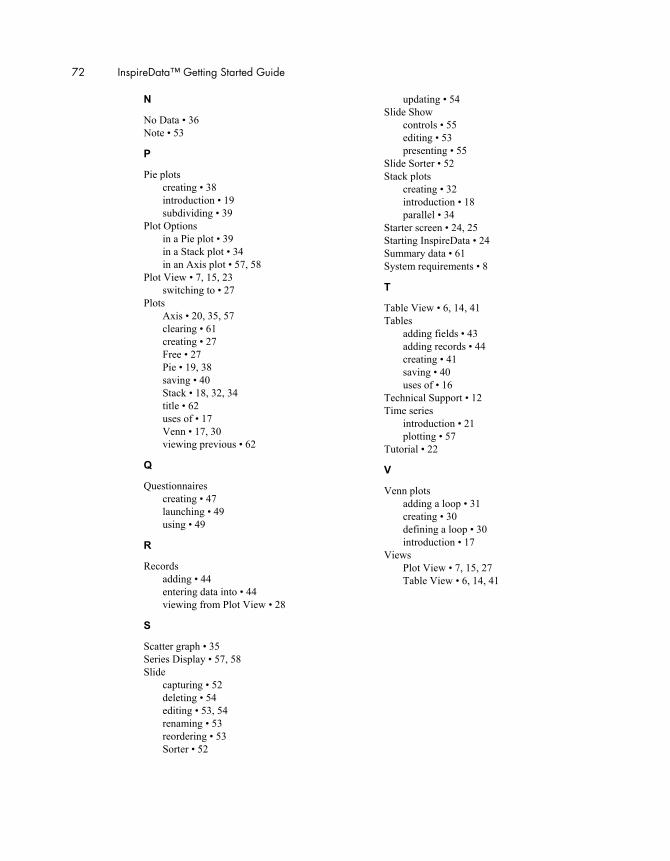
72 InspireData™ Getting Started Guide
N
No Data • 36 Note • 53
P
Pie plots creating • 38 introduction • 19 subdividing • 39
Plot Options in a Pie plot • 39 in a Stack plot • 34 in an Axis plot • 57, 58
Plot View • 7, 15, 23 switching to • 27
Plots Axis • 20, 35, 57 clearing • 61 creating • 27 Free • 27 Pie • 19, 38 saving • 40 Stack • 18, 32, 34 title • 62 uses of • 17 Venn • 17, 30 viewing previous • 62
Q
Questionnaires creating • 47 launching • 49 using • 49
R
Records adding • 44 entering data into • 44 viewing from Plot View • 28
S
Scatter graph • 35 Series Display • 57, 58 Slide
capturing • 52 deleting • 54 editing • 53, 54 renaming • 53 reordering • 53 Sorter • 52
updating • 54 Slide Show
controls • 55 editing • 53 presenting • 55
Slide Sorter • 52 Stack plots
creating • 32 introduction • 18 parallel • 34
Starter screen • 24, 25 Starting InspireData • 24 Summary data • 61 System requirements • 8
T
Table View • 6, 14, 41 Tables
adding fields • 43 adding records • 44 creating • 41 saving • 40 uses of • 16
Technical Support • 12 Time series
introduction • 21 plotting • 57
Tutorial • 22
V
Venn plots adding a loop • 31 creating • 30 defining a loop • 30 introduction • 17
Views Plot View • 7, 15, 27 Table View • 6, 14, 41