innovation and performance-driven …€¦ · abstract innovation and performance-driven...
TRANSCRIPT

INNOVATION AND PERFORMANCE-DRIVEN ENTREPRENEURSHIP:
A COMPARATIVE ANALYSIS OF THE ENTREPRENEURIAL ORIENTATION OF BLACK
SMEs VS. MAJORITY SMEs
By
Kenneth L. Harris
A DISSERTATION
Submitted to
Michigan State University
in partial fulfillment of the requirements
for the degree of
African American and African Studies– Doctor of Philosophy
2016

ABSTRACT
INNOVATION AND PERFORMANCE-DRIVEN ENTREPRENEURSHIP:
A COMPARATIVE ANALYSIS OF THE ENTREPRENEURIAL ORIENTATION OF BLACK
SMEs VS. MAJORITY SMEs
By
Kenneth L. Harris
The last 15 years have seen a significant increase in the participation of African
Americans in the U.S. labor force and, as a result, a rapid growth in the number of self-employed
Black businessmen and women relative to White Americans (Fairlie, 2004; Fairlie & Sundstrom,
1997). Noteworthy regarding the increase is that Black businesses in the U.S. struggled to
perform, in comparison to majority-White businesses, in the increasingly competitive
marketplace today. The purpose of this dissertation is to contribute to the general understanding
of how businesses’ entrepreneurial orientation (EO)—a firm-level strategic orientation which
captures an organization’s strategy-making practices, managerial philosophies, and firm
behaviors that are entrepreneurial in nature —impacts Black business performance. Although
research has been studying majority firms for years and correlated EO as a strong predictor of
firm performance, there is a widening gap in the literature assessing the performance measures of
Black businesses. Data gathered from this study contributes to the entrepreneurship literature by
measuring the performance of Black and majority small and medium enterprises (SMEs) and by
critically examining any disparities or commonalities that may exist individually, and between
these two distinct organizations. New business start-ups (entries) into the marketplace have been
very important to the nation’s economic foundation and can be attributed to significant job
growth. By measuring performance amongst Black SMEs, we can begin to learn significant
information to help improve black businesses. Despite the increased growth of Black SMEs,

Black business owners struggled to perform at high levels of peak performance and degrees of
success, in comparison to majority SMEs. Important to the performance measures of Black
entrepreneurs, Black firms experienced challenges when operating in turbulent business
environments with increased competition, even though they tried relentlessly to enter the
marketplace. Thus, Black SMEs fail at a considerably higher rate than other majority
organizations and barriers to entrepreneurship for these groups remain. Census data indicate that
the rates of entrepreneurial activity for Blacks lag significantly behind those for Whites (Strom,
2007). The study is designed to examine the constructs of entrepreneurial orientation, which is a
firm’s innovativeness, ability to be proactive, risk-taking, competitive aggressiveness and
autonomy, and its impact on performance in a comparison of Black and majority SMEs. I also
examined whether the constructs and their measurements can be used to identify literature that is
useful and relevant to the needs and improvements important to high performance of Black
SMEs.

Copyright by
KENNETH L. HARRIS
2016
v
This dissertation is dedicated to Black entrepreneurship and the entrepreneurs in the trenches of
ownership and enterprise throughout America and the African Diaspora using innovation to shift
our purpose, passion, and practice into economic freedoms that will lead our race toward
financial independence, generational wealth, and entrepreneurial prosperity as a people.

vi
ACKNOWLEDGEMENTS
“Success is to be measured not so much by the position that one has reached in life as by the
obstacles which he has overcome.” - Dr. Booker T. Washington
To God who is the center of my being, I give my life to thee. I thank all those who
helped usher me through this journey. Ruyard Kipling said in a poem “It Couldn’t Be Done”, but
“we” did it. I thank my ancestors who provided me a legacy to follow and the committee of
intellectuals who guided me, Dr. Forrest S. Carter, Dr. Ernest Betts, Dr. Lisa Cook, and Dr. Rita
Kiki Edozie. A special acknowledgment to Dr. Forrest Carter who chaired the committee and
guided me through the entire process with excellence as the mantra. Thank you.
To my son Kenneth, who inspired my strength, motivation, courage, and tenacity to
provide and leave a purpose-driven legacy and the more than 5 generations of educated Black
men and women in my family. I especially thank my mother Linda who brought me into this
world and loved and supported me by any means necessary. I also thank her husband Robert,
who provided the means for a quality education, and my brothers Roshaun and Marcus. My
father Kenneth taught me about manhood, scholarship, and perseverance; his wife, Gail,
provided unconditional love and support. I also thank my sisters Kira and Myra, my aunt
Jocelyn, and my cousins Stephanie and Lisa. I thank my grandparents, Dr. DeWitt T. Burton, my
great uncle the founder of Burton Mercy Hospital in Detroit, MI, and my extended family.
To the Michigan State University African American and African Studies Program 2011
Cohort of Black intellectuals: Dr. Sherrae M. Hayes, Dr. Maria Martin, Dr. Cona Marshall, Dr.
Ashley Newby, Dr. David M. Walton, Professor El-Ra Adair Radney, Ramon Jenkins, Kimberly

vii
Ross, Sitou Akibode, and Dr. Emilie Diouf. I offer with a very special thanks to Dr. Rita Kiki
Edozie, who opened doors and provided opportunities for me.
I also thank the Men of Omega Psi Phi Fraternity, Inc., and the countless Ph.Ds who
provided a circle of friendship. A special acknowledgement to the Michigan Black Chamber of
Commerce, its Board of Directors, and especially William Brooks, Charlie Beckham, Eric
Hardy, and Pamela Rodgers, who as past Chairpersons afforded me the freedom to pursue this
arduous task. Thank you to the intellectuals that opened my mind, including Congresswoman
Brenda Lawrence, Dr. Alexander Hamilton, Dr. Austin Jackson, Dr. Betty N. James, Dr. Britney
O-Neal, Dr. Carol Adams, Dr. Charles Brown, Dr. Clarence Stone, Dr. Claud Anderson, Dr. Carl
Taylor, Dr. Curtis Stokes, Dr. Darlene Clark Hine, Dr. David Craig, Dr. David Kirkland, Dr.
Dennis Kimbro, Dr. G. Thomas Lumpkin, Dr. Geneva Smitherman, Dr. Glenda Price, Dr.
Harvey Day, Dr. Janice Green, Dr. Jay Marks, Dr. Jeffery D. Robinson, Dr. Juan McGruder, Dr.
Julianne Malveaux, Dr. Juliet E.K. Walker, Dr. Kamahra Ewing, Dr. Karl Gregory, Dr. Kaye
Patten, Dr. Keith Stallworth, Dr. Kristie Dotson, Dr. Lena Rodriquez, Dr. Marilyn French
Hubbard, Dr. Michael Bowie, Dr. Michael Eric Dyson, Dr. Moses C Norman, Dr. William
Pickard, Dr. Nancy Quarles, Dr. Randall Pinkett, Dr. Shari Rodgers, Dr. Thomas W. Cole, Jr.,
Dr. Tony Ingram, Dr. Ural Hill, Dr. Wallace Peace, Dr. Willie L. White, Louis Green, Thomas
W. Dortch, Michelle S. Robinson, Richard K. Studley, Rob Fowler, Dilip Mullick, Greg
Martinez, and Vincent Henderson. The following poem, “It Couldn’t Be Done” by Edgar Albert
Guest was an inspiration throughout this research.
“It Couldn’t Be Done”
Somebody said that it couldn’t be done
But he with a chuckle replied

viii
That “maybe it couldn’t,” but he would be one
Who wouldn’t say so till he’d tried.
So he buckled right in with the trace of a grin
On his face. If he worried he hid it.
He started to sing as he tackled the thing
That couldn’t be done, and he did it!
Somebody scoffed: “Oh, you’ll never do that;
At least no one ever has done it;”
But he took off his coat and he took off his hat
And the first thing we knew he’d begun it.
With a lift of his chin and a bit of a grin,
Without any doubting or quiddit,
He started to sing as he tackled the thing
That couldn’t be done, and he did it.
There are thousands to tell you it cannot be done,
There are thousands to prophesy failure,
There are thousands to point out to you one by one,
The dangers that wait to assail you.
But just buckle in with a bit of a grin,
Just take off your coat and go to it;
Just start in to sing as you tackle the thing
That “cannot be done,” and you’ll do it.

ix
TABLE OF CONTENTS
LIST OF TABLES ........................................................................................................................ xii
LIST OF FIGURES ..................................................................................................................... xiii
CHAPTER 1: INTRODUCTION ................................................................................................... 1
Purpose of the Research .............................................................................................................. 1
Background of the Problem ........................................................................................................ 2
Statement of the Problem ............................................................................................................ 8
Significance of the Study ............................................................................................................ 9
Entrepreneurial Orientation ...................................................................................................... 10
Theoretical Lenses for Advancing EO Research ...................................................................... 11
Research Questions ................................................................................................................... 13
Hypotheses ................................................................................................................................ 14
Summary of Key Definitions .................................................................................................... 14
Contribution of the Study.......................................................................................................... 16
Structure of the Dissertation ..................................................................................................... 17
CHAPTER 2: LITERATURE REVIEW ...................................................................................... 18
Historical Significance .............................................................................................................. 19
Entrepreneurship: An Introduction ........................................................................................... 22
Entrepreneurship Orientation (EO) ........................................................................................... 24
The Dimensions of EO.............................................................................................................. 26
Innovativeness........................................................................................................................... 26
Risk-Taking............................................................................................................................... 27
Proactiveness............................................................................................................................. 28
Competitive Aggressiveness ..................................................................................................... 29
Autonomy ................................................................................................................................. 30
SME Entrepreneurial Innovativeness ....................................................................................... 30
SME Entrepreneurial Risk Taking ............................................................................................ 32
SME Entrepreneurial Proactiveness ......................................................................................... 33
SME Entrepreneurial Learning ................................................................................................. 36
SME Entrepreneurial Resource-Based View ............................................................................ 38
Conclusion ................................................................................................................................ 39
CHAPTER 3: METHODOLOGY ................................................................................................ 40
Research Objective ................................................................................................................... 40
Research Framework ................................................................................................................ 40
Research Methodology ............................................................................................................. 41
Research Design........................................................................................................................ 42
Research Sampling Plan ........................................................................................................... 43
Sampling Procedures ................................................................................................................ 44
Sampling Units.......................................................................................................................... 44

x
Data Results and Analysis ........................................................................................................ 45
Research Question 1 ................................................................................................................. 45
Research Question 2 ................................................................................................................. 46
Multiple Linear Regression....................................................................................................... 46
Assumptions of Multiple Linear Regression ............................................................................ 47
Research Question 3 ................................................................................................................. 47
Assumption of MANOVA ........................................................................................................ 48
Research Question 4 ................................................................................................................. 48
Entrepreneurial Orientation Scale ............................................................................................. 49
Firm Performance Scale ............................................................................................................ 50
Demographics ........................................................................................................................... 51
Data Reliability and Ethical Considerations ............................................................................. 51
Limitations of the Study............................................................................................................ 52
Conclusion ................................................................................................................................ 52
CHAPTER 4: RESULTS .............................................................................................................. 53
Data Collection ......................................................................................................................... 54
Performance .............................................................................................................................. 54
Entrepreneurial Orientation ...................................................................................................... 55
Descriptive Statistics ................................................................................................................. 57
Results for Research Question 1 ............................................................................................... 62
Gross Sales ................................................................................................................................ 64
Market Share ............................................................................................................................. 65
Profit Margin ............................................................................................................................. 65
Results for Research Question 2 ............................................................................................... 66
Results for Research Question 3 ............................................................................................... 70
Results for Research Question 4 ............................................................................................... 71
Summary ................................................................................................................................... 72
CHAPTER 5: CONCLUSIONS, DISCUSSION AND SUGGESTIONS FOR FUTURE
RESEARCH .................................................................................................................................. 74
Summary and Interpretation of Findings .................................................................................. 75
Theoretical Considerations ....................................................................................................... 79
Limitations to the Study ............................................................................................................ 81
Implications and Recommendations for Further Research ....................................................... 82
Conclusion ................................................................................................................................ 83
APPENDICES .............................................................................................................................. 87
APPENDIX A IRB Application for Initial Review .................................................................. 88
APPENDIX B IRB Initial Application Signature Form ........................................................... 95
APPENDIX C MSU IRB Approval .......................................................................................... 98
APPENDIX D Participant Information Letter ........................................................................ 100
APPENDIX E Demographic Survey ...................................................................................... 103
APPENDIX F Michigan Business Performance Survey ........................................................ 105
APPENDIX G Performance Scale .......................................................................................... 118
APPENDIX H Entrepreneurial Orientation Scale .................................................................. 120

xi
APPENDIX I Lumpkin Autonomy Scale ............................................................................... 124
BIBLIOGRAPHY ....................................................................................................................... 126

xii
LIST OF TABLES
Table 1 Eigenvalues for Factor Solutions of One to Seventeen ........................................56
Table 2 Factor Loadings for Five Factor Solution .............................................................56
Table 3 Frequencies and Percentages for Sample Characteristics .....................................57
Table 4 Comparison of Frequencies and Percentages between Black and Majority
SMEs ......................................................................................................................59
Table 5 Continuous Variables of Interest among Black Owned, Majority Owned, and
All SMEs ................................................................................................................62
Table 6 Regressions with Entrepreneurial Orientation Predicting Performance Scales
in Black SMEs .......................................................................................................65
Table 7 Regressions with Entrepreneurial Orientation Predicting Performance Scales
in Majority SME ....................................................................................................69
Table 8 Results of MANOVA for EO Scales between Black and Majority SMEs ...........71
Table 9 Hypothesis Tests and Results from Chapter Four ................................................75

xiii
LIST OF FIGURES
Figure 1. Normality P-P scatterplots of residuals for Black SME group ..........................63
Figure 2. Homoscedasticity plots of residuals and predicted values for Black SME
group ......................................................................................................................64
Figure 3. Normality P-P scatterplots of residuals for majority SME group ......................67
Figure 4. Homoscedasticity plots of residuals and predicted values for majority SME
group ......................................................................................................................68

1
CHAPTER 1: INTRODUCTION
Purpose of the Research
The purpose of this study was to examine Black businesses on the Entrepreneurial
Orientation (EO) scale and to determine the extent to which EO might explain the economic
performance of Black businesses. Specifically, the study focused on three primary objectives: (a)
the relationship between the EO of Black small and medium-sized enterprises (SMEs) and their
market performance measures; (b) the differences in the EOs of Black SMEs and comparable
majority SMEs; and (c) whether Black SMEs were equally deficient in each of the underlying
factors of EO (e.g., risk taking, innovativeness, proactiveness, competitive aggressiveness, and
autonomy), compared to a proportionate number of majority SMEs.
Entrepreneurship supports economic growth and accounts for the majority of new
business development and job creation in the United States, and it is an essential feature of high-
performing firms (Lumpkin, 1996; Peters & Waterman, 1982). Yet, the performance of small
businesses owned by African Americans between 2007 and 2010 was below that of all U.S.
small businesses, and while Black business revenue grew by 26.5%, small business revenue as a
whole grew by an average of 39% (Census, 2010). This points to a discrepancy between Black
SMEs and majority SMEs. Examining EO may offer valuable data by which to examine the
existence of this discrepancy. In the present study EO is defined by a focus on innovation,
proactiveness, and risk-taking (Miller, 1983). Miller (1983) developed a scale to empirically
measure these dimensions, which Covin and Slevin (1986, 1989) subsequently extended and
refined to include competitive aggressiveness and autonomy. Wiklund (1998a) identified several
studies based on Miller’s and Covin and Slevin’s (1986, 1989) instruments, which suggest that
EO is viable means to capture firm-level entrepreneurship and performance.

2
Background of the Problem
The widely recognized definition of the “American Dream” was popularized by James
Truslow Adams in his 1931 book, The Epic of America. Since then, various immigrant groups
have come to American shores in search of this dream through educational, social, political, and
economic means, with different levels of success (Meacham, 2012). Since the post-Civil War
Reconstruction era, African Americans have often been successful in education, politics, and
social standing, yet to a lesser degree entrepreneurially or in business (Ahiarah, 1993).
In the late 19th and early 20th centuries, the rationale for African Americans to go into
business was to create jobs, enhance economic viability, and generate wealth within their own
communities, as they were usually blocked from participating in mainstream economy. Today,
the number of Black businesses has developed significantly but at the same time lacks growth
capacity and compared to their White counterparts, economic disparities remain a fundamental
struggle (Boston, 2011). Despite the increase in the number of Black businesses, the number of
jobs generated and the level of wealth generated have been insufficient means to substantially
impact the economic status and disparities that currently exist among Black entrepreneurs
(Panth, 2013). Inquiry into the economic status of SMEs, either directly or indirectly, has served
as the predominant focus of entrepreneurship research. Such investigation increased the
understanding of entrepreneurial processes and problems for Black SMEs, and led to strategies
designed to maximize the economic potential of this underserved population (Alegre & Chiva,
2013).
Since slavery, African Americans pursued the American dream—life, liberty, and
justice—through educational, social, political, and economic means, which were the cornerstones
of achieving this overall goal. Black businesses, coming from roots of slavery, had tremendous

3
economic hurdles to overcome. The slave system, under its own tenants, produced many racially
oppressed institutions that created systematic barriers for Black entrepreneurship which both
directly and indirectly affected Black businesses. A cornerstone of understanding the African
American experience since the eradication of slavery on December 18, 1865, remains: a vast
amount of effort was designed to disenfranchise Blacks and their subsequent reconstruction.
First, Black codes were adopted throughout the Southern and Midwestern states to
regulate the northern migration of Blacks who were free. The same laws were implemented even
more severely in the South to restrict Blacks’ civil and economic rights, and maintain the old
social structure that defined the South and slavery. The Bureau of Refugees, Freedmen, and
Abandoned Lands was established in 1865 to provide relief and assistance to former slaves and
abandoned freedmen including health, educational, and other services. However, prejudice
continued and Southern discrimination prevailed; thereby, the net effect of this oppression
relegated freed slaves to being second-class citizens. Unfortunately, the failure of reconstruction,
the resurgence of the Democratic Party, and the passage of separate but equal laws relegated
Blacks back into a subservient status. Jim Crow laws became policy after the 1890s and into the
1900s. Jim Crow segregation, as an American form of apartheid, completely prevented African
Americans from participating in the economic fabric of society.
African Americans sought their economic freedom after the Reconstruction. Although
they were successful in education, politics, and social standing after slavery, their entrepreneurial
and business gains were limited (Ahiarah, 1993). First, paradoxically, Blacks were denied the
fundamental right to freedom. Second, they were relegated to depending on the government for
seldom-displayed support and intervention, due to the very limited economic progress in the
African American community after the Reconstruction and the abolishment of slavery. Third,

4
opportunities to create and grow sustainable businesses in the marketplace was specifically and
extremely limited for African Americans, especially when pertaining to acquiring access to
much-needed capital and other economic prospects within the sharecropping agricultural
landscape. The following are some of the barriers experienced by African Americans in their
attempted businesses, growth, and development:
In the late 1880s and 1890s the Ku Klux Klan increased in strength and breadth, which
resulted in less expansion and retracted growth and development of new Black businesses, as
well as a limited capital and lack of credit availability, all of which severely hindered the growth
and development of Black businesses. A large population of Blacks and Black businesses lost
much of their capital and savings in American banks due to dishonest and crooked businessmen
who owned the financial institutions. This prompted the establishment of the Freedman’s Bank,
which aimed to help free slaves deposit funds and also assist them in receiving government
assistance through loans. The bank failed tremendously and subsequently following slavery,
African Americans never truly established themselves economically.
At the end of the late 1800s, almost 95% of the African American population was still
illiterate and uneducated, resulting in an unemployable population yet again dependent on the
same racist system that precluded slaves from independently establishing themselves and their
families financially. As of 1936, for example, there were only three Black PhDs employed by all-
White universities and institutions across the country (Sowell, 1981, p. 47).
During the early years of the late 1800s, economic conditions for African Americans
even worsened in certain capacities, compared to when they were under slavery. In response,
many migrated west and north seeking greater opportunities for social, educational, and
economic advancement. The late 1890s and early 1900s experienced, once again, a resurgence of

5
racial segregation, Black codes, Jim Crow laws, and separate-but-equal clauses, which regulated
African Americans’ advancement to a backward mode of progress. Blacks still could not
advocate or have political influence by voting, nor could they find sufficient employment. More
ghettos were segregated and education lacked equality.
The absence of fair and equal education and the systemic illiteracy in the Black
community contributed to the growth of what many refer to as “Black ghettos” (Wallich &
Dodson, 1972). This powerlessness led to a lack of self-employment success and dependence on
a non-functional system of government that prevented economic opportunity. Subsequently,
remnants of the past remain and in the current economy, limited opportunities exist for Black
people. This is especially true in technology and entrepreneurship realms. Unfortunately, the
perceived marginalization of African Americans appears to be tangibly evident, as many major
public and private industry leaders who control market forces and globalization have perpetuated
inequalities that African Americans face. These can be found in cases such as the affirmative
action ban at the University of Michigan, which rescinded opportunities for Blacks and other
minorities.
The historical experiences of African Americans in the United States including the
negative impacts of slavery have perpetuated generations of oppression, racism, segregation,
discrimination, and prejudice by race. Although the United States experienced phenomenal
growth and the greatest accumulation of wealth and capital that the world has ever seen, African
Americans, unfortunately, have not been the beneficiaries. Even though they helped produce a
significant portion of the wealth as workers they have never been able to fully participate in the
American dream of life, liberty, and the pursuit of happiness. As former enslaved people whose
servant labor produced wealth that generated capital, African Americans remained victims in the
6
process. Their history shows no drastic differences even 150 years after the abolition of slavery
and the Reconstruction. Unfortunately, although Blacks meet most, if not all, of the necessary
criteria to become entrepreneurs, historically they have yet to advance into a more progressive
economic state (Coles, 1982).
After the Reconstruction African Americans sought employment to care for their
families, which served as survival incentive to go into business and create stable jobs. This
transition was effectively a means of survival. Most Blacks in the trades viewed
entrepreneurship, education, and training as a way to generate wealth and move toward
economic viability. This sort of autonomy would allow an assured level of independence,
resources, and lifestyle, which most ex-slaves had not yet experienced. In today’s economy,
Black businesses have grown significantly but lack capacity, and economic disparities still exist
in comparison to their White counterparts. Despite the increase in the number of Black
businesses, the number of jobs that they generated and their level of wealth creation is yet
insufficient in having a substantial impact on the economic status and disparities that currently
exist among entrepreneurs. Inquiry into such disparity led to a body of research into the
development of strategies that might effectively augment autonomy and success for Black
entrepreneurs (Alegre & Chiva, 2013).
EO has attracted increasing attention in entrepreneurship literature (Baron, 2010), fueled
by the development of the EO scale, which is designed to measure the theoretical construct of
EO and its contribution to business or firm performance. Although the topic of EO has become
more prevalent in literature, the vast majority of research in this field focuses on SMEs (Covin &
Lumpkin, 2012). To date, there have been no empirical results that focus on minority business
enterprises (MBEs) or Black SMEs. In addition, there are no published studies that compare the

7
impact of EO among Black SMEs versus the impact of EO among majority SMEs. Assuming
Black SMEs can be improved makes inquiry into the very construct of EO, such relationships
and their impacts a vital research focus. The present research, therefore, examines these
relationships through a comparative analysis methodology (Anderson & Covin, 2010).
One of the major reasons attributed to the poor performance of Black SMEs has been, in
part, the lack of innovativeness and proficiency in their EO (Lee, 2000). Since Reconstruction,
Black SMEs and both startup and existing firms have used entrepreneurship in pursuing business
opportunities to spur economic expansion, including job and wealth creation. Entrepreneurship
activity represents one of the major engines of economic growth; today, it is a dominant driving
force that represents the majority of new business development and job creation in the United
States (Business, 1993). As such, writers in both scholarly literature (Covin & Slevin, 1991) and
popular press (Peters & Waterman, 1982) argue that entrepreneurship is an essential feature of
high-performing firms (Lumpkin, 1996). However, the performance of small businesses owned
by African Americans was below that of all U.S. small businesses between 2007 and 2010—a
time period that corresponds to the start of the last recession and extends to one year after the
current economic recovery began (Boston, 2011). During this 4-year period, Black business
revenues grew by 26.5% and employment grew by 6.3%. In comparison, among all small
businesses, revenue grew by 39% and employment increased by 11%, on average (Census,
2010). It is necessary for Black SMEs to perform better, specifically in their pursuit to produce
economic opportunities, including creating jobs and accruing wealth within the Black
community (Auster, 1988).

8
Statement of the Problem
The objective of this quantitative study was to measure the entrepreneurial orientation as
it related to Black SME’s performance and to compare the EO of Black SMEs with majority
SMEs. The number of Black SMEs increased by nearly three times the national rate in new
entries, but they lack the necessary EO for successful start-ups (Anderson, 2009). This increased
rate of startups shows that African Americans are seeking economic advantages by forming
Black SMEs at an unprecedented rate. However, Black entrepreneurs face hardship when their
businesses struggle or fail and find it difficult to compete in the global marketplace because of
their lack of EO and other factors that dictate their ability to perform (Anderson, 1982).
Based on the foundational statements above, it is possible to identify a two-fold
distinction in the current study: entrepreneurship from the perspective of business participation
and from ownership. Schumpeter (1912) defined entrepreneurship as the entrepreneur’s role to
reform and revolutionize the pattern of production by taking steps such as producing a new
commodity or an old one in a new way, by using a new supply outlet for products, or by
reorganizing an industry. The entrepreneur’s ability to reform and reorganize for success is a
clear difference between starting and maintaining and owning a business. Three different
problems arise. The first is that a majority of Black SMEs lack high performance, which can
have a tremendous impact on the socioeconomic disparities that exist in the Black community
(Anderson, 1982). It is likely that low percentages of Black SMEs advance and in most cases do
not perform successfully due to their EO in the marketplace. The second is the alarming disparity
between the performance of Black SMEs and majority SMEs and the implications of the various
approaches for EO success. Lastly, an important construct in the EO of Black SMEs is

9
entrepreneurial innovation (as defined here in “Key Definitions”); entrepreneurs need to be
innovators and without this they will not be able to thrive (Bates, 1989).
In his theory of economic development, Schumpeter (1912) denoted the value of
innovation in the entrepreneurship process. He described a process of industrial mutation and the
opening up of new markets that continually revolutionize economic structure from within, in
which the old one is destroyed and replaced by a new one. He called this process creative
destruction. Schumpeter also analyzed the capitalist model and tried to understand which
companies would be more innovative. Initially he thought that small companies should be in a
better position because of their flexibility, while large companies might become trapped in
bureaucratic structures. Eventually, however, he changed his view, and stated that larger
corporations, because of their monopolistic power, could have an advantage in developing
innovations. According to this theory, entrepreneurial profit is the direct result of innovation and
innovation is a temporarily productive factor.
This present study was designed to test, in conjunction with the other elements of EO, the
innovativeness of Black SMEs as they enter the marketplace. Black SMEs depend on innovation,
along with risk-taking, proactiveness, competitive aggressiveness, and autonomy, which are all
EO constructs (Barnett, 2001). The purpose of this study is to measure the effects of Black SMEs
on the EO scale and compare them to majority SMEs to determine to what extent EO explains
the discrepancy between Black and majority SMEs economic performance.
Significance of the Study
Historically, efforts to improve the performance and conditions of Black SMEs revolved
around increasing access to resources and capital, improving education and training in various
managerial roles, and preferential treatment in the marketplace (Koellinger, 2006). The present

10
study contributed information that may help to expand the overall market presence of Black
SMEs by examining the importance of EO, and in particular, innovation as a driver of
entrepreneurship. This research defined entrepreneurs as innovators, and showed that it is
through innovation that entrepreneurship introduces new Black SMEs to the marketplace (Bates,
1989). By cultivating innovation-driven entrepreneurial activity, Black SMEs help to foster
economic growth while encouraging sustainable communities (Bates, 1989). Innovation is a
specific function of entrepreneurship that either constructs new wealth resources or strategically
incorporates obtainable resources that have the potential to create wealth and jobs (Anderson,
1982). Schumpeter’s (2012) theory of innovation and entrepreneurship assigns an important role
of entrepreneurship in economic development. In addition, through his innovation model,
Drucker (1985) found most innovative business practices and ideas can be conceptualized across
seven areas of opportunity that lie within private companies or industries and in broader socio-
economic demographic trends. This study was designed to evaluate the impact of innovation as a
process in the systematic EO of Black SMEs, while analyzing how Black SMEs foster economic
growth and performance, stabilize urban economies, and contribute economically to eradicating
the existing barriers and disparities that exist in the marketplace (Bates, 1989).
Entrepreneurial Orientation
Entrepreneurial orientation (EO) refers, among other things, to the strategy and
performance of an organization (Wales, 2011). Based on the work of Miller (1983), EO can also
be thought of as a group of entrepreneurial patterns, processes, attitudes and behaviors. Covin
(1991) called EO a pervasive phenomenon in organizations. Later Covin and Lumkin (2011)
examined whether EO was a dispositional or behavioral construct and noted that scholars do not
agree on a clear definition. They found EO to be a composite construct that was defined by

11
behaviors including risk-taking, innovativeness, proactiveness, autonomy, and competitive
aggressiveness. Kollmann and Stöckmann (2014) suggested it was difficult to convert EO into
performance measures because disposition does not always translate into entrepreneurial
behavior. However, these researchers found that EO and its effect on entrepreneurial behavior
affects business performance, which may be a direct result of EO. Other empirical evidence also
suggests EO actually improves firm performance (Covin & Slevin, 1991; Sexton & Bowman-
Upton, 1991; Zahra, 2012).
Theoretical Lenses for Advancing EO Research
The present study was guided by Kor, Mahoney, and Michael's subjectivist theory of
entrepreneurship (as cited in Kor, 2007). The theorists emphasized the subjective nature of
entrepreneurial discovery and how matters such as the entrepreneur's experience and prior
knowledge can affect perceptions of opportunity. The theorists also posited that entrepreneurship
occurs through subjective processes of discovery, learning, and creativity. Subjectivist theory
might be used to explain, for example, why the availability of certain innovation-facilitating
resources (e.g., technological knowledge, organizational slack, skilled labor) leads to high levels
of EO in some firms, but not in others. Subjectivist theory, similar to Schumpeter (1912),
indicates that the entrepreneur offers an innovation, but rather than affecting the whole economy,
the innovation is new to the firm. This theory includes both individual creativity and the random
nature of knowledge-creation and rejects economic rationality where actors engage in predictable
moves on the basis of well-defined choice sets. It posits that uncertainty and subjectivity in
decision making and creativity always exist. A subjectivist perspective of entrepreneurship also
emphasizes the non-deterministic, evolutionary nature of dynamic capabilities and
entrepreneurial activities. This theory will enhance the present study in its goal of determining
12
the performance of EO for Black SMEs compared to non-Black SMEs, and can also offer
explanation into why some SMEs thrive in terms of EO and why some do not. Since this theory
focuses on the subjective nature of entrepreneurial discovery and creativity, it can support
inquiry into the demonstration of how SMEs are influenced by cultural prejudices as they
infiltrate business infrastructure.
The present study was also guided by the theory of dynamic capabilities (Teece, 1997).
Zahra, Sapienza, and Davidson (2012) defined dynamic capabilities as "abilities to reconfigure a
firm's resources and routines in the manner envisioned and deemed appropriate by its principal
decision-maker(s)" (p. 918). As argued by Jantunen et al. (2005), entrepreneurial firms create
opportunities through their actions. To take advantage of these opportunities, such firms will
often need to reconfigure their resource bases while dynamic capabilities are the enabling
mechanisms for doing this. Aramand and Valliere (2012) further defined dynamic capabilities
theory as the firm’s ability to integrate and reconfigure internal and external competencies to
keep up in a rapidly changing environment. If ordinary capabilities permit a firm to make a
living in the short term, dynamic capabilities extend, modify or create these ordinary capabilities
(Winter, 2003). For this reason, employing dynamic capabilities theory was particularly
important to the present study because it explains how some SMEs thrive. Dynamic capabilities
can additionally be understood as key means for linking EO to firm opportunity exploitation and
subsequent performance.
The concept of dominant logic (Prahalad, 1986), and in particular, entrepreneurial
dominant logic (Meyer, 2000) has also been employed in EO research. Prahalad and Bettis
(1986) used the phrase dominant logic to refer to how firms "conceptualize and make critical
resource allocation decisions—be it in technologies, product development, distribution,

13
advertising, or in human resource management" (p. 490). The concept of entrepreneurial
dominant logic captures the collective mindset exhibited by entrepreneurial firms and is
consistent with the notion that sustained patterns of entrepreneurial behavior, as is needed to
infer the existence of EO, are the result of top management beliefs, attitudes, and philosophies
regarding the value and advisability of entrepreneurial actions. As described by Meyer and
Heppard (2000), an entrepreneurial dominant logic "leads a firm and its members to constantly
search and filter information for new product ideas and process innovations that will lead to
greater profitability" (p. 2). Evidence suggests that an entrepreneurial dominant logic both
facilitates firm amenability to transformation (Dixon, 2007) and contributes to firm performance
through encouraging experimentation with new entrepreneurial initiatives (Obloj, 2010). Thus,
an entrepreneurial dominant logic operates in close causal adjacency through exhibiting
entrepreneurial behavior. The concept of dominant logic can help explain why, for example,
firms facing similar environments often vary in their exhibition of EO.
Research Questions
Based on past theoretical constructs and empirical studies the following research
questions were proposed:
RQ1: How does entrepreneurial orientation impact the performance measures of Black
SMEs?
RQ2: How does entrepreneurial orientation impact the performance measures of SMEs?
RQ3: How do the entrepreneurial orientations of Black SMEs and majority SMEs differ?
RQ4: Is “Innovativeness” the most significant aspect of EO that explains the difference
between Black SMEs and majority SMEs?

14
Hypotheses
Considering past research there is likely no relationship between the EO of Black SMEs
and their market performance measures (profit margins, growth rate, and/or market share). Those
Black SMEs that reported a high degree of EO likely tend to have a higher degree of
performance measures, while low degrees of EO would relate to a lower degree of performance
measures considering profit margins, growth rate, and/or market share. In essence, this suggests
that it would be possible to predict Black SMEs’ level of performance by knowing their score on
the EO scale plus their performance as it relates to each EO construct. In addition, there is
presumably no difference in the EO of Black SMEs and the EO of a comparable majority of
SMEs considering Black SMEs were deficient of each underlying factor of EO. The following
four hypotheses are thus suggested:
1. There is no relationship between the EO of Black SMEs and performance measures.
2. There is no relationship between the EO of majority SMEs and performance measures.
3. No difference exists between the EO of Black SMEs and majority SMEs.
4. Innovativeness is not a significant contributor to the difference between the EO of
Black SMEs and majority SMEs.
Summary of Key Definitions
Autonomy –the independent action of an individual or a team in bringing forth an idea or
a vision and carrying it through to completion, without being held back by overly stringent
organizational constraints.
Black-Owned Business or Black SMEs - firms in which blacks or African-Americans own
51% or more of the equity, interest or stock of the business.

15
Competitive aggressiveness - a company’s way of engaging with its competitors,
distinguishing between companies that shy away from direct competition with other companies
and those that aggressively pursue their competitors’ target markets.
Entrepreneurial Orientation (EO) - a firm-level strategic orientation which captures an
organization's strategy-making practices, managerial philosophies, and firm behaviors that are
entrepreneurial in nature.
Entrepreneurship - the process of designing, launching, and running a new business, i.e. a
startup company offering a product, process or service. It has been defined as the "...capacity and
willingness to develop, organize, and manage a business venture along with any of its risks in
order to make a profit."
Firm performance - a relevant construct in strategic management research that is
frequently used as a dependent variable. Despite this relevance, there is hardly a consensus about
its definition, dimensionality and measurement and the factors that limit advances in research
and understanding of the concept.
Innovation - the process of translating an idea or invention into a good or service that
creates value or for which customers will pay. To be called an innovation, an idea must be
replicable at an economical cost and must satisfy a specific need. Innovation involves deliberate
application of information, imagination and initiative in deriving greater or different values from
resources. It includes all processes by which new ideas are generated and converted into useful
products. In business, innovation often results when ideas that are applied by the company in
order to further satisfy customers’ needs and expectations.

16
Innovativeness – a willingness to support creativity and experimentation in introducing
new products, services, and novelty, as well as technological leadership and R&D in developing
new processes.
Minority Business Enterprises (MBEs) - a business that is owned, capitalized, operated
and controlled by a member of an identified minority group. The business must be a for-profit
enterprise, which physically resides in the United States or one of its territories.
Proactiveness –an opportunity-seeking, forward looking perspective that involves
introducing new products or services ahead of the competition and acting in anticipation of
future demand to create change and shape the business environment.
Risk-taking –a tendency to take bold actions such as venturing into unknown new
markets, committing a large portion of resources to ventures with uncertain outcomes, and
borrowing heavily.
Small and medium size enterprises (SMEs) - non-subsidiary, independent firms that
employ less than a given number of employees. This number varies across countries, while the
United States considers SMEs to include firms with fewer than 500 employees set by the Small
Business Administration based on industry, ownership structure, revenue, and number of
employees.
Contribution of the Study
Implications for positive social change include development on individual, community,
and public levels. The present study provides information for future studies on Black
entrepreneurship that might be used to influence corporate policy, as well as individual strategies
for Black entrepreneurs. For the public at large, this research can be used to inform business and

17
political leaders the need to better understand how cultural phenomena influence business
practices and outcomes.
Structure of the Dissertation
Chapter 1 includes the background, problem, and purpose, as well as significance in
examining EO among Black SMEs and majority SMEs. It also includes the four research
questions based on previous studies, examines the theoretical framework, and definitions
associated with the present study. Chapter 2 includes a comprehensive review of current
literature. Chapter 3 details the design of the present study and its methodology. Chapter 4
includes the results of the research, and Chapter 5 includes discussions of the results of the study
in the context of the current literature and makes suggestions about recommended areas for
further study.
18
CHAPTER 2: LITERATURE REVIEW
Collectively, minority-owned business enterprises reflect the evolving constraints and
opportunities that operate within the broader society. Minorities seeking to create viable business
ventures have traditionally faced higher barriers than Whites. The market has been set up against
them, market opportunities exploited, financing raised, and mainstream networks penetrated
(Bates, 2011). The main purpose of this study was to measure the entrepreneurial orientation
(EO) between Black SMEs and majority small and medium enterprises (SMEs) related to
business performance. EO has become an important and extensively researched topic of
literature (Wiklaund, 1999) indicating a positive relationship between EO and performance. The
relationship between EO and performance has inspired further research in the field of
entrepreneurship. Empirical evidence suggests EO actually improves firm performance (Covin &
Slevin, 1991; Zahra, 2012).
This study examines the impact of EO performance on Black SMEs versus majority
small and medium enterprises (SMEs). In particular, it explores the influence of EO on Black
SMEs and majority SMEs using a sizeable, longitudinal data set of firms. Miller (1983)
described firms’ degrees of entrepreneurship as the extent to which they innovate, take risks, and
act proactively. EO, in this study, is defined as a focus on innovation, proactiveness, and risk-
taking. Miller also developed a scale to empirically measure these dimensions while Covin and
Slevin (1986, 1989) subsequently extended and refined this instrument. To denote a clearer
understanding of the plight of Black SMEs, a historical overview of requisite literature is
presented.
19
Historical Significance
When scholars first began to collect and analyze data describing MBE performance,
many argued that minority businesses generally, and black-owned ventures specifically — being
few in number and small in size and scope — were collectively insignificant (Brimmer &
Terrell, 1971; Osborne, 1976). Black business participation has been the pursuit of the African-
American community in its goal to achieve economic parity and inclusion in the American way
of life. The Black community has had trouble understanding reasons African Americans have
limited involvement in American business (Massey & Denton, 1993). Contemporary authors
asserted that the large and persistent racial inequalities in minority business ownership and
performance in the United States has been a cornerstone of repression in the 19th and 20th
centuries, and continues into the 21st century (Fairlie, 2008).
SMEs have become increasingly important components of economic development (Bates,
1989), but Black SMEs have had a far less significant impact. The Black political economy has
been a source of much interest to scholars for generations. Classic works of pioneers such as
W.E.B. Du Bois’ The Negro Artisan (1902), E. Franklin Frazier’s Black Bourgeoisie (1955), and
Woodson’s The Negro Wage Earner (1930) have established an intellectual tradition of the
African-American political economy in the early 20th century. Their work has offered invaluable
insight into socio-economic disparities that exist in the Black community, but more importantly,
the lasting effects of reduced access to the marketplace that halts Black entrepreneurs’ successful
performance.
The Tulsa, Oklahoma race riot in 1921 framed the systemic segregation and targeted
destruction of historic African American businesses. The Greenwood district, an all-Black
enclave within the city of Tulsa, was known as the “Black Wall Street” because of its booming

20
economy built on successful Black businesses and professional firms (Johnson, 1998). On May
31, 1921, a young Black man was arrested for allegedly assaulting a White woman, and the
White residents of Tulsa charged through the Greenwood district, killing 300 people, burning
down the entire 35-block area, and leaving 10,000 Black residents homeless. Considered the
deadliest race riot in American history, Fields-White (2011) suggests an economically viable
Black business district like Greenwood would never exist again. After Greenwood, Black
business districts were limited and restricted, and those that did subsequently develop in later
years, such as the Black Bottom/Paradise Valley district in Detroit, were decimated by
government decree. The entire section Paradise Valley area of Detroit was destroyed to make
room for an Interstate highway in the late 1950s under the guise of “urban renewal” (Gibson,
1982).
The traditional route to successful business ownership and operation in the 19th and early
20th century urban America entailed selling personal services to affluent whites, while catering
and barbering were prominent lines of black enterprise. In trades connoting servility, Whites
were reluctant to create firms, leaving Blacks with a near-monopoly in more than 162 minority
communities in the United States (Harris, 1936). African Americans entrepreneurs were thus
relegated to owning businesses in fields deemed appropriate for freed slaves. W.E.B. Du Bois
(1899), in The Philadelphia Negro, observed that because of this Blacks owned the city’s leading
catering firms. Black caterer Peter Augustin, for example, originated this Philadelphia tradition,
entering business in 1818 and then establishing a reputation for courtesy and efficiency that
spread nationwide. Throughout most of the 19th century, no entertainment in Philadelphia’s high
society was socially correct if not catered by Augustin and his successors (Du Bois, 1899).
Lieberson (1980) observed affluent Whites of the times viewed certain jobs as suitable for

21
Blacks to perform so long as they serviced Whites such as preparing and serving meals, ironing
shirts, and shining shoes. Prevailing White attitudes opened certain entrepreneurial opportunities
for Blacks yet blocked others (Bates, 2011). Through the lens of these historical events several
African Americans trained as economists and made critical analyses of the economic
circumstances affecting their race including: Abram Harris’ The Negro as Capitalist (1936),
George Edmund Hayes’ The Negro Labor (1946) and The Negro Ghetto (1948), Phyllis
Wallace’s Women, Minorities, and Employment Discrimination (1977), Margaret Sims and
Julianne Malveaux’s Slipping Through the Cracks: The Status of Black Women (1986), Darlene
Clark Hine’s Black Women in White: Racial Conflict and Cooperation in the Nursing Profession
(1890–1950), and Jacqueline Jones’ Labor of Love, Labor, of Sorrow: Black Women, Work, and
Family From Slavery to Freedom (1985).
Scholarly work, such as Oliver Cox’s Caste, Class, and Race (1948), W.E.B. DuBois’
Negroes and the Crisis of Capitalism (1953), James Boggs’ Racism and the Class Struggle:
Further Pages from a Black Worker's Notebook (1970), Robert Browne’s A Different Vision:
Black Economic Thought (1997), Frank Davis’ The Economics of Black Economic Development
(1972), William Tabb’s The Political Economy of the Black Ghetto (1970), Thomas Sowell’s
Race and Economics (1975), William Julius Williams’ When Work Disappears: The World of
the New Urban Poor (1996), William A. Darity’s Persistent Disparity: Race and Economic
Inequality in the United States Since 1945 (1999), and Timothy Bates’ Minority
Entrepreneurship (2011), delved into deeper economic analysis of the situation. A significant
portion of research has covered the historical, political, and sociological aspects of the African-
American political economy, but few has examined business performance and entrepreneurship
as defined by Drucker (1985). For Drucker, entrepreneurship involves identifying and

22
speculating about moments of change and transforming them into business opportunities. This
approach diverges from previous attempts that centered on improving management skills and
providing preferential access to capital and the market. This gap in literature needs to be
examined in more detail to provide a foundation for further study and to examine why
entrepreneurial socio-economic disparities still exist in the Black community.
Entrepreneurship: An Introduction
The concept of entrepreneurship and the emergence of the entrepreneurial class can be
traced back to the early 18th century and French economist Richard Cantillion. Shortly thereafter,
French economist J.B. Say added to Cantillion’s definition by including the idea that
entrepreneurs had to be leaders. Say claimed that an entrepreneur is one who brings other people
together in order to build a single productive organism (Schumpeter, 1951). Economics,
generally defined as the study and process of producing, distributing (or exchanging) and
consuming goods, products, commodities or services, penetrates deeply into every aspect of
social life. The area of focus matters not, economics and entrepreneurship encompasses a broad
range of topics including, but not limited to poverty, income, jobs, housing, class, racial
discrimination, religion, the arts, and social status. These major ideologies and socioeconomic
systems of today (e.g., capitalism, socialism, and nationalism) compete for the hearts and minds
of everyday people, i.e., capitalism, socialism, and nationalism. African Americans have been
either directly or indirectly impacted by all of the above mentioned tenets of economics and
entrepreneurship.
In their 2009 book, which detailed recent entrepreneurship studies, Campbell and Spicer
(as cited in Carter, Mwaura, Ram, Trehan, & Jones, 2015) offered a thorough examination of
entrepreneurial attention in academia. Their work contributes to a vast amount of research and

23
has contributed to the establishment of collaborative research organizations that help to fill gaps
in scholarly entrepreneurship discourse (Ewing Marion Kauffman Foundation, 2016).
Entrepreneurial inquiry has since become one of the most rapidly evolving subject matters in
economics, management, finance, and even legislation (Baron, 2010). A tremendous amount of
empirical evidence suggests that the impact of new firm creation is a critical driving force of
economic growth and development as it creates hundreds of thousands of jobs (Neumark, 2008).
The U.S. Census Bureau reported that Black SMEs are among the fastest-growing segments of
the nation’s economy—up 45% from 1997–2002—and serve to boost local communities
(Wiklund, 2007). A nation’s dynamism and wealth depends on its companies’ competiveness,
which in turn is fundamentally based on capacities that entrepreneurs and managers exhibit
(Cuervo-Cazurra, & Genc, 2008). Drucker (1985), a management theorist, defined the
entrepreneur not so much as a change agent, but an enterpriser who identifies and speculates
about the moments of change, transforming them into business opportunities. This definition is
intrinsically unique to African-American entrepreneurs who exploited change due to market
access to form enterprises when scarce opportunities were made available.
Due to the African-American community’s economic conditions, entrepreneurs have had
to be both innovative and enterprising just to enter the competitive marketplace. Although more
Black small- and medium-sized enterprises (SME) entered the marketplace recently, Fairlie and
Robb (2007) showed that they lagged well behind White-owned businesses in sales, revenues,
employment, and survival. For African-American entrepreneurs to succeed and make an impact
in their communities, Black SMEs must perform at higher rates while innovating in the
marketplace. The early work of economist Joseph Schumpeter (1912) reframed the entrepreneur
as an innovator and a key figure in driving economic growth and development. Wennekers and
24
Thurik (1999), and more recently Caree (2002), provided an extensive body of literature
examining the relationship between entrepreneurship and economic growth.
New start-up firms provide employment opportunities in themselves and also create
employment in existing firms (Fitch & Myers, 2000). The Schumpeterian definition of
entrepreneurship (Schumpeter, 1912) has coupled this with innovation, while expanding it to
embrace other core constructs such as risk-taking, proactiveness, competitive aggressiveness,
and entrepreneurial autonomy. This shift offers integral tools by which to examine the role of
Black SMEs and majority SMEs in job creation and economic growth.
Entrepreneurship Orientation (EO)
Entrepreneurship theory was developed in the first half of the 20th century concentrating
on defining entrepreneurship and clearly identifying its role in business and economic
development (Burns & Stalker, 1961; Marshall, 1930; McClelland, 1961; Say, 1834;
Schumpeter, 1934, 1942). In the 1960s and 1970s the focused shifted toward identification of
factors affecting entrepreneurship and the mechanics of how entrepreneurs started small and
medium size enterprises. Soon entrepreneurial researchers began to recognize entrepreneurial
behavior (Conley, 1974; Hagen, 1962; Kilby, 1971; Lachman, 1980; Mintzberg, 1973; Weick,
1976). In the 1980s and 1990s entrepreneurial research moved toward the development of EO
and its dimensions and other EO-Strategy models, which align different research strategies
(Barringer & Bluedorn, 1999; Burgelman, 1983; Covin & Slevin, 1988; Covin et al., 1994; Dess
et al., 1997; Galbraith & Kazanjina, 1986; Lumpkin, 1996; Miller & Friesen, 1982; Miller &
Toulouse, 1986; Zahra, 1993). Further developments in the EO-performance relationship
followed in the last two decades (Viji & Bedi, 2012).

25
EO can be traced back to the research of Mintzberg (1973) who theorized about strategic
decision-making, an entrepreneurial strategy making mode in which a managerial disposition is
characterized by an actual search for new opportunities (Covin & Wales, 2011). Subsequently,
Khandwalla (1976, 1977) advanced the concept of management styles as the operating set of
beliefs and norms about management held by organizations’ key decision makes.
EO has become an important and extensively researched topic in the literature (Wiklund,
1999). Although several authors challenged its connection to firm performance (Covin & Slevin,
1991; Zahra, 1991), empirical evidence suggesting that EO can improve company performance
has mounted (Dess, Lumpkin, & Covin, 1997). Establishing the positive relationship between
EO and performance is necessary in order to effectively create a conceptual framework and
interpretive measure using the EO scale.
Because entrepreneurship depends on economic and business structures that allow
entrepreneurs or businesspeople to launch start-ups and innovate with them, EO and performance
have become critical variables. Although there is a substantial and increasing amount of
literature pertaining to EO and performance, virtually none exists in measuring Black SMEs.
Further research can help African-American firms understand and improve performance,
catalyzing economic growth in Black communities and driving the free marketplace and local
economies. Black SMEs facilitate the spread of innovation, exploiting more opportunities to
create jobs and then create sustainable Black communities. Attempting to chart a rational but
effective economic development path for African Americans in the United States is particularly
difficult because of the dual inequities of American society (Boston, 2011). Market presence,
market share, and the creation of businesses that have transcendent impacts on communities and
societies require radical innovation in either technology or business models. This type of

26
innovation and market success tends to occur in firms that exhibit a high degree of competence
in those areas captured by EO constructs. To help Black SMEs gain market presence and market
share, this study will measure the degree of their competence compared to other SMEs, using EO
constructs.
The Dimensions of EO
Miller (1982) conceptualized the three focal dimensions of EO as inventiveness, risk-
taking, and proactiveness, and utilized them reliably as a part of measuring EO. Lumpkin (1996)
portrayed creativity as an association’s Schumpeterian propensity to participate in and bolster
new thoughts, oddities, experimentation, and inventive procedures. Baird and Thomas (1985)
highlighted three separate sorts of danger taking: venturing into the unknown, substantial
acquiring, or committing significant resources to ventures in uncertain environments. Lumpkin
contended that two extra dimensions were also notable parts of EO: aggressive forcefulness and
self-governance. Covin and Slevin (1989) claimed EO to be a one-dimensional idea, though
Lumpkin (2001), for instance, proposed that distinctive dimensions of EO may relate diversely to
firm execution and thus advance a multidimensional notion of EO.
Innovativeness
Innovation represents the advancement of businesses is through creativity, which, as per
Lumpkin (1996) argued, is comprised of the affinity for production of new things, inventiveness
in techniques, tests that prompt the improvement of new items or administrations, or even a new
arrangement of mechanical procedures. For Drucker (1985), innovation is a tool entrepreneurs
use to exploit change as an opportunity for a different business or a different service.
Entrepreneurs should search for sources of innovation, as well as changes and symptoms that
might indicate opportunities for successful innovation (Drucker, 1985). Schumpeter (1912) gave

27
a premise for this term, contending that inventive things consolidated together in the commercial
sector specifically foster advanced societies.
Schumpeter’s (1912) insights notwithstanding, into how advancement or imagination
plays a role in a firm’s success are nonconventional because they far different from
innovativeness. Imagination is a part of the general procedure of development, but it is
insufficient for an SME to only be an inventive firm because advancement has to be maintained
for SMEs to continue to thrive and maintain themselves (Prahalad, 1986)
Creativity in its substance infers an intention to develop new thoughts and
methodologies, novel things, tests, imaginative strategies and steps beginning with the assembled
standards and advancements (Lumpkin, 1996). In a study done by Tajeddini (2010), there was a
positive relationship between innovativeness and business execution in the administrations
segment.
Risk-Taking
Risk-taking has always been a key characteristic associated with entrepreneurship. Its
original conception referred to the risk of being an entrepreneur, as opposed to working for
someone else as an employee. Today, risk-taking can be associated with companies whose
managers make decisions that allocate significant amounts of resources to projects with uncertain
outcomes. Risk-taking is also identified with the risk of turnover or to the danger of other
monetary examination (Prahalad, 1986). Anything defined as a tremendous activity of obtaining
capital or money-related terms that may encounter instability could be viewed as danger taking
(Baird & Thomas, 1985). This danger could be seen as an organization’s expectation to be
included in grandiose, dangerous undertakings and administrative alternatives inverse to prudent
activities (Miller, 1983). Historically, risk-taking refers to the propensity to take bold steps into

28
unknown new markets and committing a large portion of resources to projects with uncertain
outcomes (Viji & Bedi, 2012). Catillion (1930) described the entrepreneur as a rational decision
maker “who assumes risk and provides the management of the firm.” In the 1800s, John Stuart
Mill argued that risk-taking was a paramount attribute of entrepreneurship (Viji & Bedi, 2012).
Other scholars implied risk-taking to be the willingness to commit large amounts of resource to
opportunities that involve a probability of high failure (Mintzberg, 1973; Wiklund & Shepard,
2003; Zahra, 1991).
Proactiveness
What makes a firm proactive? Proactive firms are continually the first contestants or
pioneers in a new business (Barnett, 2001). To be considered first in the business arena, an
association of being first by giving considerable offerings in response to the needs of clients
needs to be perceived (Lumpkin, 1996). When a firm has been a first-mover as its point of
interest, it opens opportunities to gain preferences within a market segment by using a
“skimming” methodology of estimation to make connections in the market (Zahra, 2012).
Correspondingly, it can turn into a business sector controller in checking appropriating chains,
and may seek to rapidly secure brand distinguishment (Wiklaund, 1999). Proactiveness also
describes the characteristics of entrepreneurial actions to anticipate future opportunities, both in
terms of products or technologies and in terms of markets and consumer demand (Schillo, 2011).
This characteristic, which was at the center of early economic thought, suggested the
entrepreneur to be someone who identifies opportunities in the marketplace and proactively
pursues them (Lumpkin, 1996). Translated to the level of the firm, proactive companies are
leaders in the market, rather than followers (Schillo, 2011). Proactiveness is an opportunity-
seeking, forward-looking perspective involving introducing new products and services ahead of

29
the competition and acting in anticipation of future demand to create, change or shape the
environment (Kreiser, Marino, & Weaver, 2002; Lumpkin, 1996). Proactiveness is manifested in
the following: (a) aggressive behavior directed at rival firms and (b) the organizational pursuit of
favorable business opportunities (Viji & Bedi, 2012). Simply put, proactiveness is the manager’s
ability to take initiative, whenever the situations demands. Porter (1985) suggested that in certain
situations, firms could utilize proactive behavior in order to increase their competitive position in
relation to other firms. Proactiveness is concerned with first mover and other actions aimed at
seeking to secure and protect market share and with a forward-looking perspective reflected in
actions taken in anticipation of future demand (Dimitratos et al., 2004; Lee & Penning, 2001;
Naman & Slevin, 1993; Venkatraman, 1989a, 1989b). This defines not just a defensive posture,
but an offensive posture as well. It refers to a process aimed at anticipating and acting on future
needs by seeking new opportunities which may or may not be related to the present line of
operations, introduction of new products and brands ahead of the competition, and strategically
eliminating operations that are the mature or declining stages of life cycle (Clercq et al., 2010;
Green et al., 2008; Kreiser & Davis, 2010; Stam & Elfring, 2008; Swierczek & Ha, 2003). Thus,
competitors respond to the managers’ willingness to initiate proactive measures.
Competitive Aggressiveness
Competitive aggressiveness refers to the company’s way of engaging with its
competitors, distinguishing between companies that shy away from direct competition with other
companies and those that aggressively pursue opportunities within their competition’s target
markets. Competitive aggressiveness refers to a firm’s propensity to directly and intensely
challenge its competitors to achieve entry or improve position, that is, to outperform industry
rivals in the marketplace (Kraus et al., 2005). It also reflects the willingness of a firm to be

30
unconventional rather than rely on traditional methods of competing. This aspect is used to
measure how entrepreneurial firms deal with threats, and it also refers to the firm’s
responsiveness directed toward achieving a competitive advantage (Frese et al., 2002; Grande et
al., 2011; Lumpkin, 2001). In literature, the terms proactiveness and competitive aggressiveness
are often used interchangeably but there is a difference between both of these. Proactiveness
refers to how a firm relates to market opportunities in the process of creating demand, while
competitive aggressiveness refers to how firms relate to competitors, that is, how firms respond
to trends and demands that exist in the marketplace (Lumpkin, 2001).
Autonomy
Autonomy refers to the independent action of an individual or a team in bringing forth an
idea or vision and carrying it through to completion (Lumkin & Dess, 1996). In general, it refers
to the ability and will to be self-directed in the pursuit of opportunities. In an organizational
context, it refers to freely taken action that is irrespective of organizational constraints, for
establishment and smooth running of a venture (Kraus et al., 2005; Shrivastava & Grant, 1985;
Stevenson & Jaillo, 1990). Autonomy in firms may vary with the size of organization,
management style, or ownership (Lumpkin, 1996).
SME Entrepreneurial Innovativeness
With respect to entrepreneurial innovation, innovativeness is defined as the ability to do
something new when all known techniques fail. Bates (1989) suggested that innovativeness for
individuals and employees involves the ability to harness creative abilities. Innovativeness
explains how individuals and employees accomplish this, and how they put these abilities to use
in facing challenges while deciding to improve their processes, procedures, and products. This is
an inclusive definition that combines the results of other similar studies. As outlined in the

31
definition, innovativeness is a crucial process that comes into play in making decisions related to
upgrading existing practices.
Examining innovation types assumed by firms is a way to understand innovativeness in
SMEs (Alegre & Chiva, 2013). Alegre and Chiva (2013) presented a practical study explaining
that a decision to pursue innovation is often based on the calculated extent of variation and the
factors that bring about variation in products, services, and processes. While this is clear on a
practical front, the explanation lacks theoretical and logical consistency required by those
seeking a better understanding of innovativeness in SMEs. Four different directions are available
for firms to follow while upgrading their processes including process, product, chain, and
functional upgrading (Khandwalla, 1976, 1977). Humphrey and Schmitz (2003) pointed out that
these categories are important contributions to the international debate on innovativeness and in
doing so gained rapid recognition in the international sphere. Firms can therefore follow a
hierarchy of upgrades.
Many researchers believed that technological innovation is equivalent to upgrading
within a firm. In this context, Habaradas (2008) suggested that technological innovativeness is a
process that consists of many steps. The main steps include technological, scientific, and
commercial. Organizational and financial aspects are also counted as steps and are crucial in
leading the firm to adopting innovative processes and generating enhanced products.
Innovation can be described as the creative application of suitable traits to business
development activities (Lyons et al., 2007). To generate a definition of innovation, it would
therefore be safe to say that innovativeness is the process of generating original concepts by
using methodologies that are generally used to place creative ideas into action. Roy (2012)
provided a direct correlation between innovation and profitability, and demonstrated that the

32
early and fast introduction of innovation into an enterprise brings in the highest possible market
returns, as the firm becomes the first one to introduce a product or good into the market
(Parkman, 2012). Innovation is therefore important for SMEs so they can earn monopoly profits,
which are short in duration and valid only until a competitor arrives on the scene. Competitive
advantage is a direct outcome of innovation among competitor brands; hence, innovativeness is
the essential element of many firms’ strategies for growth and is an integral part of EO (Panth,
2013). Firms can hit the jackpot if their EO is driven by a thrust to innovate at each and every
step of the work. It has a positive effect not only on market performance, but also on the brand’s
long-term reputation, helping firms retain customers after the initial product breakthrough
(Bodenhorn, 2011).
SME Entrepreneurial Risk Taking
Entrepreneurial risk taking has many aspects, and charting studies in this field can help
clarify many of the factors that increase or decrease the level of risk in a decision and the role
risk taking in EO plays. Risk taking is ideally a combination of bold steps that a firm takes to
improve its business returns. These include venturing into unknown markets, investing in
ventures that have uncertain outcomes, and borrowing large quantities from the market (Baker &
Sinkula, 2009). An alternative definition that delineates risk taking is the readiness to commit
huge amounts of resources (monetary, human) to projects that may have high probabilities of
failure (Eggers et al., 2013).
Generally, firms built on EO are often classified or characterized by their risk-taking
potentials or strategies. These would include taking on large debts or making large resource
commitments toward projects that secure high market returns thus making the most of
opportunities in the marketplace. In short, risk taking is a measure of a firm’s ability to venture

33
into the unknown and break away from the conventional path. Hughes and Morgan (2007)
suggested that entrepreneurially-oriented firms undertake risks in order to secure favorable
performance. McGrath (2001) elaborated suggesting that following conventional paths leads to a
high mean performance while risk taking has variable outcomes for businesses, including the
potential for long-term profitability. Dess et al. (2011) and Tang et al. (2014) noted that
entrepreneurial risk taking had a positive influence on organizational and business growth.
Risk taking and innovation are related aspects of EO as they both have positive impacts
on the growth of a business by virtue of improved brand awareness in the market and the
introduction of competition in the processes. Risk taking may boost crucial factors in innovation
such as product innovation and services innovation, which, according to Hoonsopon and
Ruenrom (2012), have a positive impact on the competitive advantage of firms. Such firms
provide superior benefits to their customers (Zhou et al., 2005) and enhance their cost advantage
over competitors by offering the same services and products at lower prices (Hoonsopon &
Ruenrom, 2012). Therefore, entrepreneurial risk taking is positively related to SMEs’ innovation.
SME Entrepreneurial Proactiveness
The level of entrepreneurial proactiveness in a firm often determines the extent to which
it will survive changes in the market. Proactiveness is often defined as the tendency of a firm to
anticipate, understand, and act upon potential needs that will originate in the marketplace, thus
leaving behind present competition and establishing a favorable first-mover benefit among
competitors (Eggers et al., 2013). Fundamentally, proactiveness is a multi-dimensional tool that
can be utilized in relation to innovativeness or independence. A forward-looking approach and a
positive mindset help the firm use existing or old techniques to overcome imminent changes in
the marketplace. However, a firm has the maximum chance of enjoying first-mover benefits

34
when it combines proactiveness with innovativeness to develop a solution that is brand new to
the marketplace and is therefore accepted as a breakthrough. Entrepreneurial orientation rests on
the capability of a firm to use its existing resources or redefine its investments to develop and
introduce products and services that are completely new to the marketplace (Bolton, 2012).
Proactiveness has the capacity to not only project the firm forward in the market, but also shape
the environment in the market and give the firm a new edge against existing competition (Bonds,
2007).
Constructive proactiveness is therefore a healthy supplement to competition as they
propel one another. Essentially, proactiveness capitalizes on emerging markets (Tang & Hull,
2012). Proactiveness is significant in securing superior firm performance (Baker & Sinkula,
2009), and makes it easier for firms to target premium markets and take pleasure in the first-
entrant advantages like skimming the market ahead of their competitors (Lumpkin, 2001; Tang
& Hull, 2012).
Conventionally, innovations are classified as radical or incremental, depending upon the
degree of novelty in their applications (Nieto et al., 2013). Studies on innovation management
and degrees of proactiveness show that firms that succeed in balancing their existing expertise to
proactively create improved incremental innovations are more likely to experience market
success, though they are simultaneously required to develop new technologies to bring about
major breakthroughs (Chang et al., 2011). In order to fulfill this prerequisite, a firm must be able
to balance internal dilemmas between innovation pathways and challenges related to
contradictory demands from the market environment that create external pressures on the firm
(Jansen et al., 2006). A firm should therefore be able to effectively know how to strike a balance
between radical and incremental innovative actions in order to accomplish superior sustainable

35
performance. A firm that falls short of this will end up becoming mediocre and uncompetitive in
the market (Chang et al., 2011).
Innovativeness is akin to proactiveness as they are both derived in tandem with existing
innovation protocols and are designed to meet emerging customer or market needs (Nieto et al.,
2013). The innovative approach utilizes original designs, the creation of new markets, and new
channels of distribution, which are developed through due diligence and proactiveness (Boston,
1998). Alternatively, incremental innovations exploit current capabilities while seeking
continuous upgrades that generate consistent and positive returns as firms expand on the skills
and knowledge they currently have (Nieto et al., 2013). They also enhance recognized designs
and expand on existing products and associated services, which can increase the efficiency of
existing distribution channels (Chang & Hughes, 2012). Hence, incremental innovations must
build on existing knowledge and organizational learning frameworks bringing into focus existing
skills, structures, and processes (Jansen et al., 2006).
Product and service innovations are normally categorized by closeness to novel or
existing technologies, functions, product features, customers, market segments, and market
routes (Chang & Hughes, 2012). Therefore, to enhance product and service innovations, firms
must be focused on original and emerging customer needs in new, creative, or rising markets
through the use of novel technologies, features, and functions that are significantly different from
existing processes and products. Likewise, incremental innovations of both products and services
can meet current market needs and those of customers with enhancements in modem
technologies. Following this approach fulfills customer needs through new features and functions
and also incrementally differentiates firms from their competitors’ through offering different
products (Chang & Hughes, 2012).

36
As noted earlier, innovations completely rely on using an inventive and proactive
approach that is considered through prototyping, tests, research, and discovery. Firms that are
known to introduce innovations also need to substantially change their ways of operating. This
can be fulfilled by entry into unknown markets or introducing new services and products using
new technologies to improve the total performance of the firm (Nieto et al., 2013). This type of
proactive innovation undoubtedly destroys competence for the firm using it. Innovation
combined with proactiveness, in this regard, represents a high-risk strategy (Boyd, 2000).
SME Entrepreneurial Learning
Prior research suggests that entrepreneurial learning includes a number of entrepreneurial
activities, such as knowledge acquisition and information sharing, which consciously influence
firms’ innovation performance (Sakiet al., 2013). Innovation can offer notable benefits to an
organization if there is a steady amount of entrepreneurial learning in the firm inspired by EO.
Importantly, entrepreneurial learning is a function of innovation and goes a long way in allowing
a firm to make strategic moves in the market. Entrepreneurial learning and entrepreneurial
orientation have a tenuous relationship considering entrepreneurial learning often eats away at
the roots of firms’ innovation, while entrepreneurial ventures are more a function of copying
existing protocols (Avlonitis & Salavou, 2007). Entrepreneurial learning has also been proposed
to have a positive impact on innovation (Renko et al., 2009). There is a general propensity for
restricting lifecycles in both product and business structures in the modern business setting
(Hamel, 2000).
Future profit from existing operations in entrepreneurial firms is uncertain, and
businesses need to use entrepreneurial learning to continue searching for new opportunities.
Empirical studies that examine this phenomenon have found that entrepreneurial learning has a

37
positive impact on entrepreneurial firms’ performance (Eggers et al., 2013; Zahra, 2012).
Entrepreneurial learning also has a positive impact on the quality of performance, which has
been proven through proliferating anecdotal evidence that supports the value of entrepreneurial
orientation (Tang & Hull, 2012). The intensification of pioneering entrepreneurship offers
significant purpose for any new enterprise, as it would increase its receptiveness to global and
varying market settings. Today’s firms cannot survive fast changes and novelty, making them
susceptible to experiencing a downturn if they fail to develop entrepreneurial skills (Eggers et al.,
2013). SMEs invariably lack the competence, market control, and resources of other big firms.
To a great extent, their success depends on their innovative behaviors and ability to formulate
competitive strategies, implement them, and respond to the challenges posed by market changes
(Mbizi et al., 2013).
Entrepreneurial learning, from the perspective of SMEs, is both direct and impactful
since there exists less of a focus on innovation and more of a focus on expansion and
enhancement of services in these businesses. Internationalization is another necessary
entrepreneurial activity as well as entering new geographic markets on a large scale. These are
regarded as equivalent to adopting new practices and upgrades and implementing entrepreneurial
teaching (Johnson et al., 2013). Prior research suggests that SMEs differ from larger enterprises
in terms of their leadership styles, internal operations, organizational structures, existing assets,
and environment reactions (Mbizi et al., 2013). SME owners or managers often emphasize the
innovation phase in order to achieve greater growth rates with exciting variances in a given
period of time. The results, however, entail a high failure rate as the innovative phase is highly
uncertain, risky, and chaotic (Mueller et al., 2013). Entrepreneurial learning helps secure risk
factors and keeps movements under control, although the product or service-launch phase is of

38
extreme importance in this regard. Entrepreneurial learning has an important role to play in the
success of innovations. Supporting this contention, Oke et al. (2007) suggested that SMEs are
more engaged in creating product and service innovations based upon important lessons in
entrepreneurial learning and previous drives for innovation. Innovations are aimed at the creation
and commercialization of improved products and services to meet demands of current customers
and markets (Mueller et al., 2013). Such innovations have successful outcomes that are known to
customers and firm builders, and therefore have a low-risk capability. Entrepreneurial learning is
known to follow a particular or specific trajectory. Entrepreneurial strategists build upon
previous experience, core competencies, entrepreneurial learning, and linkages in market and
field knowledge (Kollman & Stöckmann, 2014). There is no doubt that in SMEs operating today,
economies of scale and those of scope increase firms’ profit margins greatly, and directly affect
operational efficiency and profitability. Existing portfolios and products allow an easy synergy
of strategy with profitability. SMEs have the benefit experience over new entrepreneurs, and as
they apply their prior experience and develop extensions of present product lines, they must keep
in mind that experience might greatly influence their entrepreneurial learning curve. In addition,
innovations are presumed to enhance the life cycle of an SME’s offerings, as relatively few
resources are required and profit gains are observed within a very short duration of time (Mueller
et al., 2013).
SME Entrepreneurial Resource-Based View
In a competitive environment, firms deploy their physical, human, and organizational
assets to gain an advantage in the marketplace (Auster, 1988). If these resources and capabilities
are valuable to customers, as well as rare, and difficult to imitate, then these assets give rise to
sustainable competitive advantage(s), which then boosts firm performance. Among various

39
intangible assets that a firm possesses, organizational orientations are considered some of the
most important because these skills sets are deeply ingrained into the everyday routines of an
organization and, as such, are problematic for competitors to copy (Bates, 2006). In turn,
organizational orientations may give rise to sustainable advantage and superior company
performance. Whereas firms may pursue various orientations, past research has noted the
importance of EO and its corresponding relationship to company outcomes. In summary,
companies that effectively deploy these organizational capabilities perform at high levels in the
marketplace (Benjamin, 1996).
Conclusion
This literature review explores the fact that while Black SMEs are a major part of the
U.S. economy they face enormous existing disparities in comparison to other SMEs. Black
entrepreneurship can be an avenue to achieve the American dream while providing sustainable
impact in local Black communities. Through entrepreneurship African Americans have the
chance to obtain wealth and direct access to the marketplace.
The present study contributes to the further development of Black SMEs, increasing the
opportunity to exploit innovative strategies that can create wealth and sustainable communities
(Brimmer, 2002). EO, including such characteristics as innovativeness, risk-taking, and
proactiveness, has become a very popular concept in allowing Black SMEs to improve their
performance. The results of this research will provide an empirical assessment of Black SMEs to
improve the prospects of African Americans in achieving an equitable portion of America’s
wealth and economic influence. Further research can advance serious discussion on how to
improve Black SMEs in America and further strengthen their ability to perform and compete.

40
CHAPTER 3: METHODOLOGY
The research design used in this study was quantitative, comparative, cross-sectional, and
descriptive. Quantitative research methodologies were used to facilitate collecting reliable and
relevant data. In this study, the objective and subjective aspects were included to more
completely explore the research questions presented.
Research Objective
To show that the lack of EO, innovativeness, and performance are significant contributors
to the gap between Black SMEs and majority SMEs. The research objectives were defined using
the following four research questions, which guided the study and the analyses:
RQ1: How does entrepreneurial orientation impact the performance measures of Black
SMEs?
RQ2: How does entrepreneurial orientation impact the performance measures of SMEs?
RQ3: How do the entrepreneurial orientations of Black SMEs and majority SMEs differ?
RQ4: Is “Innovativeness” the most significant aspect of EO that explains the difference
between Black SMEs and majority SMEs?
Research Framework
The central focus of this quantitative research was on Black SMEs as compared to other
SMEs. Black SMEs represent the fastest growing segment of enterprises in Michigan and
throughout the Unites States of America. The Black SMEs I analyzed represent $4.6 billion in
revenues and 30,874 jobs in the state of Michigan. As of 2007, African Americans owned 1.9
million nonfarm U.S. businesses operating in the 50 states and the District of Columbia, an
increase of 60.5% from 2002 and three times the national rate. These African American-owned
firms also accounted for 7.1% of all nonfarm businesses in the United States, employed 921,032

41
persons (0.8% of total employment), and generated $137.5 billion in receipts (0.5% of all
receipts) (United States Census, 2010).
In comparison, since the Great Recession of 2007-2010, SMEs account for 63% of net
new jobs created and, according to the SBA’s Office of Advocacy, continue to play a vital role in
the incubation of innovation and job creation in America. The following points also support the
importance of African American-owned businesses to the overall local and national economies is
related to job creation, revenue growth, and market share. These enterprises provide an
opportunity for researchers to study Black SMEs faced with systemic barriers to capacity
building, market entry, and increased competition, while modeling EO profiles with the
important qualities of innovativeness and performance (United States Census, 2010).
Research Methodology
EO was measured with a nine-item, seven-point semantic differential-type scale
developed by Covin and Slevin (1991), and also based on the work of Miller and Friesen (1982)
and Khandwalla (1976, 1977). In the present study, this variable reflects top management’s
behaviors in making strategic decisions and operating management philosophies, captured in the
three dimensions of proactiveness, risk taking, and innovativeness.
Covin and Slevin (1991) developed this scale with the goal of measuring performance,
and based the scores on respondent perceptions of their organization. In the current study, Black
and majority SMEs were asked to assess the performance indicators under analysis as compared
to their main competitors in terms of sales volume, growth in revenues, gross profit margins, net
income, market share, change in market share, and entry to new markets (from -7, much weaker,
to 7, much stronger).

42
This study included two regression analyses and a MANCOVA, which I used to assess
the relationships between measures of EO, performance, and group placement into a Black or a
majority SME. By using these statistical procedures, I addressed each of the four research
questions.
Research Design
This study employed an exploratory research approach with a quantitative research
design. I used this research design to assess the opinions and views of respondents from SMEs
through quantitative means, with numerical values assigned to the responses of the participants.
The quantitative methodology is used by the natural sciences and uses quantifiable data
to assess and measure observations. This method of deductive reasoning works based on a
representative sample of the universe studied. The research design is the structure used to guide
the planning, implementation, and analysis of the study (Mousa & Wales, 2012). The design
chosen for this study is a way of responding to the question or hypothesis of the research;
different types of questions or hypotheses require different types of research designs, and
preparation is necessary to gain a comprehensive understanding of the various types of research
design available. Research designs are generally classified as qualitative or
quantitative. However, it is becoming more common for researchers combine or mix multiple
quantitative and qualitative designs in a single study. Quantitative research refers to studies that
collect and analyze quantitative data that are highly objective and projectable.
Quantitative research designs generally reflect a deterministic philosophy, which is based
on the paradigm or school of post-positivist thought. Post-positivism examines how different
causes interact and influence the results. The post-positivist paradigm adopts a philosophy in
which reality can be discovered, imperfectly but probabilistically (Parkman, 2012). The approach

43
is typically deductive, in that most of the ideas or concepts are reduced to variables and the
relationships among them are subject to testing. Resulting knowledge is based on observation,
measurement, and careful interpretation of objective reality. I employed a quantitative research
design, which was best suited to the topic of the research (Reed, 1997).
Research Sampling Plan
The Black SMEs and majority SMEs operating in the state of Michigan in 2013-2015
were chosen as the target population. A suitable sampling, with an appropriate sample size, and
included firms from the Michigan Chamber of Commerce, including the Michigan Black
Chamber of Commerce, the Michigan Minority Supplier Development Council, the Small
Business Association of Michigan, the Detroit Regional Chamber of Commerce, and Dunn and
Bradstreet, along with various other membership-driven organizations representing multiple
industries and sectors. The stratified sample was based on two NAIC codes, majority, and Black
ratios. This sampling method was intended to achieve near equally sized groups of Black and
majority SMEs so that the two could be statistically compared with a lower margin of error
(Cohen, 1988).
Data were collected from samples of Black and majority SMEs in a structured
questionnaire used for the survey, which was disseminated electronically and physically by mail.
A total of 600 questionnaires were sent to Black SMEs and an additional 600 to majority SMEs,
for a total sample of 1,200 questionnaires. The expectation was that 180 questionnaires would be
completed by respondents, with a response rate of at least 50%-60% for the purpose of analysis.
To ensure that this number would contribute to a statistically valid analysis, an a-priori power
analysis was conducted using G*Power version 3.1.9. Using this power analysis software, each
analysis was checked for a minimal sample size to contribute to empirically valid results, and the

44
multivariate analysis of variance (MANOVA) posed to inform RQ3 had the greatest sample size
requirement.
Assuming that there would be a medium sized difference between the three EO measures
between Black and majority SMEs, a sample of 180 participants was required to determine these
differences with an alpha of .05 and a generally accepted power of .80 (Cohen, 1988). For the
best results, I contacted approximately 50 participants from majority SMEs, and 50 participants
from Black SMEs. This activity contributed to the most robust analysis possible (Tabachnick,
2013). As this number did not exceed the expected sample of 200 participants, the analysis
achieved a power of .80 at the alpha level of .05.
Sampling Procedures
I selected the sample by using a stratified sampling procedure, with the intention of
gathering a near equal amount of Black SMEs as majority SMEs. In doing so, the two groups in
question had a nearly equal size, resulting in a greater degree of validity (Tabachnick, 2013).
The sample also included industry and business-type specific inclusion criteria so that a range of
businesses germane to this research were contacted for participation. Based on a-priori sample
size calculations, I gathered a minimum of 180 participants, including 50 participants from Black
SMEs and 50 participants from majority SMEs.
Sampling Units
Though the analysis focused on the SMEs themselves, the unit of analysis was employees
within each of these SMEs. Because each of these participants provided their perception of a
specific SME, the data is applicable to the study, and describes the array of viewpoints within
any given SME. As indicated by the sample size calculation, approximately 50 participants were

45
affiliated with Black SMEs, while an equal amount (50) of participants worked for or with the
majority SMEs.
Data Results and Analysis
Data generated from the quantitative data collection instrument were analyzed
statistically using SPSS for Windows. The main categories of statistical procedures included
descriptive and inferential. Descriptive statistics depict events or individuals with some
predetermined characteristics, and will be used to describe the demographic layout of the final
collected sample. This approach is intended to help determine the external validity of the results
and express how well the sample represents the population of interest. Inferential statistics are
used to determine and assess the relationships between variables or attributes of a particular
sample with the goal of generating generalizations about a specific population. For this purpose,
variables were coded and the effect of one variable over another was assessed. In this research,
inferential statistics included the use of regression analysis and a MANOVA (Brimmer, 2002).
Results were analyzed for each research question using the procedures outlined below.
Research Question 1
Research Question 1 was how does entrepreneurial orientation impact the performance
measures of Black SMEs? In order to address this research question, a multiple linear regression
was conducted where the three measures of EO were assessed for a collective relationship with
performance within the sample of participants from Black SMEs. In this analysis, the three
measure of EO included the predictor variables, as well as risk-taking, innovativeness, and
proactiveness. The dependent, or outcome variable was the overall performance score, which
were calculated as the average of a participant’s perceptions of their SME’s growth in profit
margins, growth rate, and market share

46
Research Question 2
Research Question 2 was how does entrepreneurial orientation impact the performance
measures of SMEs? To address Research Question 2, an identical multiple regression analysis
was conducted as for Research Question 1, but with a sample of participants only from majority
SMEs. As in the regression for Research Question 1, the three measures of EO were assessed for
a collective relationship with performance. The dependent was again defined again as the overall
performance score, and was calculated as the average of the participants’ perceptions of their
SME’s growth in profit margins, growth rate, and market share.
Multiple Linear Regression
The multiple linear regression is considered an appropriate analysis when the goal of
research is to assess the collective relationship between a set of independent variables and a
single continuous outcome variable. Because each of the measures included in either model was
continuous, and because the goal was to assess the correlational relationship between the set of
EO measures with performance, multiple linear regression analysis was appropriate (Stevens,
2009).
Variables were evaluated based on what each variable added to the prediction of the
dependent variable that is different from the predictability provided by the other predictors
(Tabachnick, 2013). The F test was used to assess whether the set of independent variables
collectively predicted the dependent variable. The multiple correlation coefficient of
determination (R2) was reported and used to determine how much variance in the dependent
variable could be accounted for by the set of independent variables. If the results of the F test
indicated that the model was significantly predictive, the t test was then being used to determine
the significance of each predictor. For any significant predictor in the model, beta coefficients

47
were used to determine the extent of prediction. For these significant predictors, every one unit
increase in the predictor, the dependent variable was interpreted as increasing or decreasing by
the number of unstandardized beta coefficients (Urdan, 2010).
Assumptions of Multiple Linear Regression
Prior to either regression analysis, the assumptions of this test were assessed. For a valid
model, the assumptions of normality and homoscedasticity had to be met. In addition, the series
of independent variables were assessed for multicollinearity, which is an indication that the
independent variables are too highly correlated to provide a good model fit. Normality was
assessed using a normal P-P plot, though deviations from this assumption are not likely to
invalidate the model to any great extent so long as the sample size exceeds 30 (Stevens, 2009).
Homoscedasticity was assessed using a standardized residual plot, and additionally, the issue of
multicollinearity was assessed using variance inflation factors, or VIFs. According to
Tabachnick and Fidell (2012), any VIF of 10 or greater may be indication that the independent
variables are too highly correlated, and are artificially inflating the model to an extent that it may
not be accurately fitted to the data.
Research Question 3
Research Question 3 was how does the entrepreneurial orientations of Black SMEs and
majority SMEs differ? To assess Research Question 3, a MANOVA was conducted. The
MANOVA is similar to a collection of one way analyses of variance (ANOVAs), but takes into
account the effect of repetitious analyses, which may result in an inflated instance of Type I
error. The MANOVA created a linear combination of the dependent variables, which included
all three EO measures of interest (i.e., risk taking, innovativeness, and proactiveness) and was
assessed for overall differences based on group placement into a Black SME or a majority SME.

48
If an overall difference was determined, ANOVAs were utilized to determine which EO
measures were different between the two groups (Tabachnick, 2013). For any EO measures that
differed between the Black and Majority SMEs, a mean score was examined for both groups to
determine which group had the significantly higher score.
Assumption of MANOVA
Prior to conducting the MANOVA, the assumptions of normality and homogeneity of
variance/covariance matrices were assessed. Normality is the assumption that the EO scores are
normally distributed (i.e., bell shaped), and were assessed using the Kolmogorov Smirnov test.
According to Stevens (2009), F tests such as MANOVA and regression are robust toward this
violation with respect to Type I error. Homogeneity of variance is the assumption that both
groups have statistically similar variances and will be assessed using Levene’s test.
Homogeneity of covariance matrices is the multivariate equivalent to homogeneity of variance
and were tested using Box’s M test (Leech, 2011). Significant results for the Levene’s test or
Box’s M test are indicative of violations to either assumption.
Research Question 4
Research Question 4 was, is “innovativeness” the most significant aspect of EO that
explains the difference between Black SMEs and majority SMEs? In order to assess Research
Question 4, the results of the MANOVA was further assessed. Within the results of the
MANOVA, the degree of difference for each EO measure was assessed using partial η2 values.
The partial η2 is an indication of effect size, and may be used to interpret the statistical size of
difference between two group measurements (Cohen, 1988). If the innovativeness measure of
EO is found to be significantly different between participants from Black versus majority SMEs,
this statistic was interpreted to determine if it was in fact the largest difference between these

49
groups. This result was compared to the differences between Black and majority SMEs for both
risk-taking and proactiveness, and the findings were stated in relation to this research question.
As such, this post-hoc interpretation of the MANOVA findings were used to effectively indicate
whether the gap in innovativeness us larger than the gap in risk-taking or proactiveness between
the two groups (Urdan, 2010). In addition, the results of the first two regressions were assessed,
and innovativeness assessed for a significant relationship with performance above and beyond
what is explained by risk-taking or proactiveness. If innovativeness was found to be a significant
predictor, assuming that it is related to performance in a unique way that is not explained by risk-
taking or proactiveness, and the partial correlation coefficient (β) was used to determine the
strength of correlation between innovativeness and performance while controlling for both other
EO factors (Tabachnick, 2013).
Entrepreneurial Orientation Scale
The Entrepreneurship Orientation (EO) Scale has been used extensively in the application
of firm-level entrepreneurship research. Based on measures developed by Miller (1982),
published by Miller (1983), and refined modified by Covin and Slevin (1986), and Khandwalla
(1977), the EO scale focused on three dimensions of the entrepreneurial orientation construct-
risk taking, innovativeness, and proactiveness. According to Kreiser et al. (2002) the scale is the
most commonly utilized instrument in operationalizing EO. As early as 1999, Wiklund noted
that more than a dozen studies had employed this scale or slightly modified versions of it.
According to Zahra, Jennings, and Kuratko (1999), “there has been an unusually high degree of
consistency in the way researchers measured firm-level entrepreneurship” (p. 54). The scale
remains popular among researchers in the field (e.g., Green, Covin, & Slevin, 2006; Kreiser et
al., 2002; Roberson & Park, 2004; Wiklund & Shepard, 2005).
50
Firm Performance Scale
The firm performance scale was developed by Gupta and Govindarajan (1984).
Measuring firm performance has always been a major challenge for researchers. In this study,
firm performance measurement involves two Likert-type scales to capture the importance and
satisfaction of firm performance indicators. Because of the difficulty getting small business
owners to reveal their business data (Naman & Slevin, 1993), managerial perceptual measures to
assess firm performance are used in this study. There is a series of well documented research
with issues relative to firm performance measurement in the framework of small businesses by
Sapienza, Smith, and Gannon (1988). Lyles and Salk (1996), Smart and Conant (1994), and
Covin and Slevin (1989) used subjective, self-reporting measures of performance in the past. In
addition, there is research evidence that managers’ perceptions of their firm are highly consistent
with how their firm actually performed as indicated by objective measures (Dess & Robinson,
1984; Wall et al., 2004). Therefore, the subjectivity of the measure was used in this study.
Respondents were asked to indicate on a 5-point Likert-type scale (1 = of little importance and 5
= extremely important) signifying the degree of importance to their firm as it relates to the
following criteria: sales growth rate, market share, and operating profits, profit to sales ratio,
market development and new product development. Respondents are then asked on another 5-
point Likert-type scale (1 = highly dissatisfied and 5 = highly satisfied) the extent to which their
firm is satisfied with their firm’s performance on each of these same items pf firm performance
criteria. “Satisfaction” scores are therefore multiplied by the “importance” scores to calculate a
weighted performance index. This instrument has been used by scholars and researchers,
including O’Regan and Ghobadian (2004), Kreisner, Marino, and Weaver (2002), Robertson and

51
Chetty (2000), and Covin, Slevin, and Schultz (1997). Additional support comes from
Strandholm, Kumar, and Subramanian (2004) and Naman and Slevin (1993).
Demographics
The survey instrument also included a number of demographic questions used for
descriptive and control purposes that address a series of questions that address the age of the
firm, number of employees, classification of industry, revenues, companies market share, profit
margin, and average growth rate.
Data Reliability and Ethical Considerations
For the reliability of survey questionnaires, Cronbach’s alpha was used to measure
internal consistency and estimate the reliability for a sample of participants. To ensure the
validity is protected, data must be verified through statistical analysis. Therefore, I used
statistical tools to ensure the validity of the research (Heywood, 1988).
All researchers strive to achieve the ideals of perfect reliability and validity. Because it is
impossible to achieve perfection, a high degree of credibility, consistency, and dependability was
attempted by this research by clearly conceptualizing constructs, using a precise level of
measurement, and using multiple indicators, a pilot test, and representative reliability. High
reliability is said to exist when other researchers under similar conditions can replicate the same
study and achieve similar results (Zajonc, 2003).
The aspects of ethical consideration in this study concerned the involvement of human
subjects and referred to the review of principles, criteria, and requirements that an investigation
must satisfy to be considered ethical. Trust is the basis of ethical research. The dignity and
welfare of individuals who participate in research should be a central concern of every person
involved in a research project (Roy, 2012). The researcher is ultimately responsible for the

52
conduct of research, the project’s performance, and the protection of the study subjects’ rights
and welfare.
Limitations of the Study
Following are some limitations of this study:
1. This study was not a national study. The state of Michigan provides a limited scope of
work in comparison to future national research.
2. One main focus of this study was small- and medium-sized enterprises SMEs. This
contributed to limiting the scope of this study in that results cannot be made generalized to other
sectors.
3. Another main focus of this study was Black SMEs, but not necessarily Minority
Business Enterprises (MBEs). This also limited the scope of this study and the results.
Conclusion
This chapter covered the research methodology used to test the hypotheses identified in
Chapter 3. The methodology pertaining to the sample selection was provided. A description of
the survey items used to develop the measures was presented, supporting the reliability and
validity of information. Next, the data collection process was described. Finally, the
operationalization of the variables described in Chapter 3 was provided, along with a description
of the rationale behind the choice of multivariate techniques used to analyze the data.

53
CHAPTER 4: RESULTS
In 2007 and 2010, the performance of small businesses owned by African Americans
were below that of all U.S. small businesses, while Black business revenue grew by 26.5%, as
small business revenue grew by 39% on average (Census, 2010). This points to a discrepancy
between Black SMEs and majority SMEs and examining EO may be a way to define why this
discrepancy exists. As such, the purpose of this study is to examine Black SMEs on the EO scale
and determine to what extent EO might explain their economic performance.
In this study, I sought to show that entrepreneurial orientation, innovativeness, and
performance are significant contributors to the gap between Black and majority small and
medium enterprises (SMEs). This chapter includes multiple linear regressions and analyses of
variance, meant to explore these relationships. Based on past studies the research questions and
associated hypotheses stated in null and alternative form are displayed below.
RQ 1: How does entrepreneurial orientation impact the performance measures of Black
SMEs?
RQ 2: How does entrepreneurial orientation impact the performance measures of
majority SMEs?
RQ 3: How does the entrepreneurial orientation of Black SMEs and majority SMEs
differ?
RQ4: Is “Innovativeness” the most significant aspect of EO that explains the difference
between Black SMEs and majority SMEs?
This chapter includes descriptions of the data collection and characteristics of the sample,
as well as variables of interest. For each research question, assumptions of the analysis were

54
assessed, and results of those assumptions presented. Statistical analyses were conducted and
results are detailed.
Data Collection
A sample was drawn from Black SMEs and majority SMEs operating in the state of
Michigan. Random sampling of majority SMEs included firms from the Michigan Chamber of
Commerce and the Small Business Administration of Michigan, while the Michigan Black
Chamber of Commerce and Michigan Minority Supplier Development supplied participants who
fulfilled the category of Black SMEs. The purpose of this sampling method was to achieve near
equally sized groups of Black and majority SMEs so that the two could be statistically compared
with a lower margin of error (Cohen, 1988).
A total of 206 responses were collected, and none were removed for missing responses or
for leaving the survey early. Data were collected using a structured questionnaire meant to
measure EO and performance. These data were entered into SPSS for ease of data management
and to conduct statistical analyses. The calculation of each of the scales pertinent to the research
is described below.
Performance
Performance was measured using three different scales based on data that was
representative of individuals’ responses to one item each on the survey. For gross sales,
participants were asked, “What is your firm’s total gross sales/revenue?” with responses ranging
from (1) to (11) where (1) = “under $10,000,” and (11) = “Over $50 million.” For market share,
participants were asked, “What is your company's (organization's) market share?” with responses
ranging from (1) = “0% to 5%” to (7) = “10.01% to 15%.” For average growth rate, participants
were asked, “What is your company's (organization's) average growth rate over the last 3 years?”
55
with responses ranging from (1) = “0 to 2%” to (7) = “Over 12%.” Finally, data for profit
margin was collected using the question, “What is your company's (organization's) average profit
margin over the last 3 years?” where responses ranged from (1) = “0% to 1%” to (6) = “Over
9%.” These responses were treated as dependent variables in Research Question 1 and Research
Question 2.
Entrepreneurial Orientation
Next, the EO scales were calculated including risk taking, innovativeness, proactiveness,
competitive aggressiveness, and autonomy. Risk taking was calculated as the average of items
RT1 through RT4 on the survey, innovativeness was calculated as the average of items IN1
through IN4, proactiveness was calculated as the average of items PR1 through PR3, competitive
aggressiveness was calculated as the average of items CA1 and CA2, and autonomy was
calculated as the average of items AU1 through AU4.
To assess the fit of each of these items in their overall scale, a latent variable analysis was
conducted using generalized least squares. A varimax rotation was employed to simplify the
expression of the factor loadings into these five scales. First, Eigenvalues were calculated for a
solution of up to 17 factors (i.e., one factor for each item). Eigenvalues that drops below 1.00 for
a number of factors used to group the items may not be the best solution (Stevens, 2009). As
seen in Table 2, the Eigenvalue for a 5-factor solution was 1.18, and this value dropped below
1.00 (Eigenvalue = 0.99) for the 6-factor solution. This suggests that the 5-factor solution was
the best fit, and indicates that roughly 59.36% of variance in item values is explained by
grouping items in this way.

56
Table 1
Eigenvalues for Factor Solutions of One to Seventeen
Number of factors Eigenvalue Cumulative % of variance explained
1 4.03 23.72
2 2.12 36.20
3 1.51 45.06
4 1.25 52.43
5 1.18 59.36
6 0.99 65.15
7 0.82 69.99
8 0.77 74.52
9 0.68 78.53
10 0.63 82.26
11 0.62 85.89
12 0.53 89.01
13 0.49 91.87
14 0.48 94.69
15 0.39 96.98
16 0.33 98.93
17 0.18 100.00
Table 2
Factor Loadings for Five Factor Solution
Item Component 1 Component 2 Component 3 Component 4 Component 5
IN1 0.58 0.38
IN2 0.53 0.37
IN3 0.39 0.58
IN4 0.40 0.33 0.61
RT1 0.65
RT2 0.60 -0.48
RT3 0.67
RT4 0.48 0.33 -0.44
PR1 0.70
PR2 0.71 0.34
PR3 0.68 -0.42
CA1 0.45 -0.46
CA2 0.31 -0.38 0.43
AU1 0.74 -0.31
AU2 0.74 -0.39

57
Table 2 (cont’d)
AU3 0.72 -0.33
AU4 0.37
Note. Factor loadings below .30 are suppressed.
Descriptive Statistics
A total of 206 majority and black SMEs were included in the final data set. Sixty-eight
SMEs (33.0%) were aged 11-25 years while 51 SMEs were aged 5-10 years old. Most
companies were publicly traded (92.7%, n = 191), followed by non-profit (5.3%, n = 11). The
majority of SMEs were Black owned (75.7%, n = 156). Ninety-six companies (46.6%) had a
growing industry tendency in the past 3 years, and 91 companies (44.2%) had a stable industry
tendency in the past 3 years. The majority of companies had a growing firm tendency in the past
3 years (55.8%, n = 115). Seventy-six (37.3%) of the SMEs received support either from other
business organizations and associations, or from financial and banking institutions. Table 3
displays the frequencies and percentages for the sample characteristics.
Table 3
Frequencies and Percentages for Sample Characteristics
Variable n %
Company Age
Less than 2 years 23 11.2
3-4 years 16 7.8
5-10 years 51 24.8
11-25 years 68 33.0
Over 26 years 48 23.3
Privately owned / traded / non-profit
Private 4 1.9
Publicly-traded 191 92.7
Non-profit 11 5.3
Black or majority owned
Black 156 75.7
Majority 50 24.3

58
Table 3 (cont’d)
Variable n %
Net Sales
Under $10,000 14 6.8
$10,000 - $99,999 21 10.2
$100,000 - $249,999 24 11.7
$250,000 - 499,999 21 10.2
$500,000 - 999,999 22 10.7
$1 Million - $5 Million 54 26.2
$5 Million - $10 Million 16 7.8
$10 Million - $20 Million 7 3.4
$20 Million - $30 Million 5 2.4
$30 Million - $50 Million 3 1.5
Over $50 Million 19 9.2
Number of employees
Under 10 119 59.8
10-19 28 13.6
20-49 21 10.2
50-99 12 5.8
100-249 13 6.3
250-499 8 3.9
500-999 1 0.5
Over 1000 4 1.9
Industry tendency in past 3 years
Growing 96 46.6
Stable 91 44.2
Declining 19 9.2
Firm Tendency in the past 3 years
Growing 115 55.8
Stable 75 36.4
Declining 16 7.8
Receipt of support from:
Business organization or associations 76 37.3
Chambers of commerce 47 23.3
Colleges / Universities 32 15.8
Entrepreneurship Training and
Development Programs
60 29.4
Faith-based institutions 34 16.9
Financial or banking institutions 76 37.3
Federal government agencies 38 18.7
Incubators / Co-working spaces 15 7.4
Not for profit organizations 36 17.7
Philanthropic / Foundation
community
23 11.4

59
Table 3 (cont’d)
Variable n %
Receipt of support from:
Private sector or corporate
community
54 26.7
Procurement programs 41 20.6
Professional organizations and
associations
65 32.2
Public sector or economic
development corporations
31 15.4
When comparing Black versus majority SMEs several group-wise differences and
similarities become evident. Proportionally, more majority-owned SMEs had companies over 26
years old (24, 48%) than did the Black-owned SMEs (24, 15%). However, both groups were
mostly privately owned and largely reported sales between one and five million dollars.
Similarly, the majority of both groups reported that they were either stable or growing (see Table
4).
Table 4
Comparison of Frequencies and Percentages between Black and Majority SMEs
Variable
Black SMEs Majority SMEs
n % n %
Company Age
Less than 2 years 22 14.1 1 2.0
3-4 years 13 8.3 3 6.0
5-10 years 42 26.9 9 18.0
11-25 years 55 35.3 13 26.0
Over 26 years 24 15.4 24 48.0
Privately owned / traded / non-profit
Private 148 94.9 43 86.0
Publicly-traded 4 2.6 0 0
Non-profit 4 2.6 7 14.0
Black or majority owned
Black 156 100 - -
Majority - - 50 100

60
Table 4 (cont’d)
Variable
Black SMEs Majority SMEs
n % n %
Net Sales
Under $10,000 12 7.7 2 4.0
$10,000 - $99,999 19 12.2 2 4.0
$100,000 - $249,999 21 13.5 3 6.0
$250,000 - 499,999 19 12.2 2 4.0
$500,000 - 999,999 12 7.7 10 20.0
$1 Million - $5 Million 38 24.4 16 32.0
$5 Million - $10 Million 12 7.7 4 8.0
$10 Million - $20 Million 6 3.8 1 2.0
$20 Million - $30 Million 2 1.3 3 6.0
$30 Million - $50 Million 1 0.6 2 4.0
Over $50 Million 14 9 5 10.0
Number of employees
Under 10 100 64.1 19 38.0
10-19 18 11.5 10 20.0
20-49 14 9.0 7 14.0
50-99 8 5.1 4 8.0
100-249 6 3.8 7 14.0
250-499 7 4.5 1 2.0
500-999 0 0 1 2.0
Over 1000 3 1.9 1 2.0
Industry tendency in past 3 years
Growing 78 50.0 18 36.0
Stable 66 42.3 25 50.0
Declining 12 7.7 7 14.0
Firm Tendency in the past 3 years
Growing 89 57.1 26 52.0
Stable 55 35.3 20 40.0
Declining 12 7.7 4 8.0
Receipt of support from:
Business organization or associations 57 36.5 19 38.0
Chambers of commerce 37 23.7 10 20.0
Colleges / Universities 24 15.4 8 16.0
Entrepreneurship Training and Development
Programs
51 32.7 9 18.0
Faith-based institutions 28 17.9 6 12.0
Financial or banking institutions 50 32.1 26 52.0
Federal government agencies 28 17.9 10 20.0
Incubators / Co-working spaces 13 8.3 2 4.0
Not for profit organizations 29 18.6 7 14.0
Philanthropic / Foundation community 16 10.3 7 14.0

61
Table 4 (cont’d)
Variable
Black SMEs Majority SMEs
n % n %
Receipt of support from:
Private sector or corporate community 40 25.6 14 28.0
Procurement programs 39 25.0 2 4.0
Professional organizations and associations 50 32.1 15 30.0
Public sector or economic development corporations 23 14.7 8 16.0
Sector
Construction 15 9.6 5 10.0
Manufacturing 15 9.6 10 20.0
Wholesale trade 12 7.7 1 2.0
Retail trade 6 3.8 5 10.0
Transportation and warehousing 9 5.8 1 2.0
Information 2 1.3 1 2.0
Finance and insurance 9 5.8 12 24.0
Real estate and rental leasing 3 1.9 1 2.0
Professional, scientific, and technical services 19 12.2 4 8.0
Management companies and enterprises 6 3.8 1 2.0
Administrative and support and waste management
and remediation services
3 1.9 1 2.0
Educational services 3 1.9 8 16.0
Health care and social assistance 9 5.8 5 10.0
Arts, entertainment, and recreation 7 4.5 10 20.0
Accommodation and food services 2 1.3 1 2.0
Other services (except public administration) 6 3.8 5 10.0
Other 30 19.2 1 2.0
Next, continuous measures of interest to the study were assessed for their spread and
central tendency. Table 5 shows descriptions for the continuous scores of EO and performance
among all samples, as well as within the sub-group of Black or majority-owned SMEs. The
highest EO scores overall were proactiveness (M = 4.48, SD = 1.26) and competitiveness /
aggressiveness (M = 4.38, SD = 1.01), while the lowest were autonomy (M = 3.92, SD = 1.05)
and risk taking (M = 3.91, SD = 1.08).

62
Table 5
Continuous Variables of Interest among Black Owned, Majority Owned, and All SMEs
Overall
(n = 206)
Black owned
(n = 156)
Majority owned
(n = 50)
Variable M SD M SD M SD
Risk taking 3.91 1.08 3.98 1.06 3.68 1.13
Innovativeness 4.03 1.03 4.06 1.07 3.93 0.89
Proactiveness 4.48 1.26 4.53 1.21 4.33 1.40
Competitive
Aggressiveness
4.38 1.01 4.47 0.98 4.11 1.08
Autonomy 3.92 1.05 3.95 1.08 3.83 0.95
Performance 11.17 4.16 11.45 4.13 10.30 4.16
Results for Research Question 1
How does entrepreneurial orientation impact the performance measures of Black SMEs?
To answer Research Question 1 a series of four multiple linear regressions were conducted using
data for the group of Black SMEs. A multiple linear regression was used, as it is appropriate for
the goal of assessing how well a set of continuous or dichotomous independent variables predicts
a single continuous dependent variable (Pallant, 2010). Prior to analysis, the assumption of
normality in the residuals was assessed by viewing a series of P-P scatterplots, with one per
regression. The P-P scatterplots showed that data closely followed the normality trend line for
all four regressions (see Figure 1), indicating that the assumption was met for this series of
analyses. The assumption of homoscedasticity was assessed using a scatterplot between the
residuals and predicted values for each regression. These plots all showed approximate
rectangular distributions (see Figure 2), meeting the homoscedasticity assumption for all four
regressions. Finally, the absence of collinearity assumption was assessed using Variance
Inflation Factors (VIFs). Any VIF values over 10 suggest the presence of multicollinearity and a

63
violation of the assumption (Stevens, 2009). Because all VIFs were under 10, this assumption
was fulfilled and the analysis was conducted as proposed.
Figure 1. Normality P-P scatterplots of residuals for Black SME group

64
Figure 2. Homoscedasticity plots of residuals and predicted values for Black SME group
The multiple linear regression models for gross sales (F(7,118) = 3.30, p = .003, R2 =
.16), market share (F(7,118) = 2.09, p = .050, R2 = .11), and profit margin (F(7,118) = 3.22, p =
.004, R2 = .16) were statistically significant. Because three of the four regression equations were
significant, the predictors for these regressions were assessed further. These results are described
in the three sections below.
Gross Sales
For gross sales, autonomy was the only significant EO factor (p = .003), where higher
autonomy scores corresponded with a higher average gross sale. In addition, assessment of the
industry type indicated that both service and retail industries had significantly lower gross sales
than manufacturing industries in the sample.

65
Market Share
For market share, autonomy was again the only significant EO factor (p = .015), where
higher autonomy scores corresponded with a higher average market share. None of the other
variables were significantly predictive of market share, indicating that the market shared did not
differ based on the industry type.
Profit Margin
For profit margin, proactiveness was the only significant EO factor (p = .001), where
higher proactiveness scores corresponded with a higher average profit margins. In addition,
assessment of the industry type indicated that both service and retail industries had significantly
lower profit margins than manufacturing industries in the sample. Results of each of the four
regressions are displayed in Table 6.
Table 6
Regressions with Entrepreneurial Orientation Predicting Performance Scales in Black SMEs
Source B SE β t p
Gross sales .030
Services (ref: manufacturing) -1.52 0.59 -.27 -2.56 .012
Retail (ref: manufacturing) -1.84 0.73 -.26 -2.51 .013
Risk Taking -0.36 0.27 -.14 -1.35 .180
Innovativeness 0.18 0.24 .08 0.78 .439
Proactiveness 0.31 0.23 .14 1.39 .169
Competiveness /
Aggressiveness
-0.30 0.26 -.11 -1.15 .254
Autonomy 0.69 0.23 .26 2.98 .003
Market Share .050
Services (ref: manufacturing) -0.70 0.43 -.18 -1.64 .104
Retail (ref: manufacturing) -0.42 0.53 -.09 -0.80 .425
Risk Taking 0.19 0.19 .10 0.96 .338
Innovativeness 0.03 0.17 .02 0.16 .875
Proactiveness -0.01 0.16 -.01 -0.05 .957
Competiveness /
Aggressiveness
0.13 0.19 .06 0.68 .498
Autonomy 0.41 0.17 .23 2.48 .015
Note. For each dependent variable, overall ANOVA p-values are listed in bold.

66
Table 6 (cont’d)
Source B SE β t p
Growth rate .057
Services (ref: manufacturing) -0.53 0.50 -.12 -1.06 .292
Retail (ref: manufacturing) -1.01 0.62 -.18 -1.62 .108
Risk Taking 0.35 0.23 .17 1.53 .128
Innovativeness -0.20 0.20 -.10 -0.99 .323
Proactiveness 0.25 0.19 .14 1.32 .189
Competiveness /
Aggressiveness
0.01 0.22 .00 0.04 .970
Autonomy 0.31 0.20 .15 1.59 .114
Profit margin .004
Services (ref: manufacturing) -0.87 0.39 -.24 -2.25 .026
Retail (ref: manufacturing) -1.62 0.48 -.36 -3.41 .001
Risk Taking -0.05 0.17 -.03 -0.28 .781
Innovativeness -0.11 0.15 -.07 -0.72 .475
Proactiveness 0.48 0.15 .33 3.29 .001
Competiveness /
Aggressiveness
-0.10 0.17 -.06 -0.60 .550
Autonomy 0.02 0.15 .01 0.12 .908
Note. For each dependent variable, overall ANOVA p-values are listed in bold.
Results for Research Question 2
How does entrepreneurial orientation impact the performance measures of majority
SMEs? To answer Research Question 2, a second series of four multiple linear regressions were
conducted using data for the group of majority SMEs. Prior to analysis, the assumption of
normality in the residuals was assessed by viewing a series of P-P scatterplots, with one per
regression. The P-P scatterplots showed the data closely followed the normality trend line for all
four regressions (see Figure 3), indicating that the assumption was met for this series of analyses.
The assumption of homoscedasticity was assessed using a scatterplot between the residuals and
predicted values for each regression. These plots all showed approximate rectangular
distributions (see Figure 4), meeting the homoscedasticity assumption for all four regressions.
Finally, the absence of collinearity assumption was assessed using Variance Inflation Factors
(VIFs). Any VIF values over 10 suggest the presence of multicollinearity and a violation of the

67
assumption (Stevens, 2009). Since all VIFs were under 10, this assumption was fulfilled as well
and the analysis was conducted as proposed.
Figure 3. Normality P-P scatterplots of residuals for majority SME group

68
Figure 4. Homoscedasticity plots of residuals and predicted values for majority SME group
The multiple linear regression models were not statistically significant for any of the
equations using the sample of majority SMEs. This suggests that the EO variables of risk taking,
innovativeness, proactiveness, competitiveness/aggressiveness and autonomy are not
significantly related to any of the performance scales among the sampled majority-owned SMEs.
Because none of these regressions were significant, interpretation of the individual predictors in
each equation was unnecessary. In addition, because there were no independent to dependent
variable relationships, there was no need to assess the moderating influence of industry type.
Results of each regression are presented in Table 7 below.

69
Table 7
Regressions with Entrepreneurial Orientation Predicting Performance Scales in Majority SMEs
Source B SE β t p
Gross sales .147
Services (ref: manufacturing) -0.29 0.85 -.06 -0.34 .733
Retail (ref: manufacturing) -1.62 1.15 -.24 -1.40 .170
Risk Taking 0.24 0.36 .12 0.67 .510
Innovativeness -0.02 0.41 -.01 -0.06 .955
Proactiveness 0.10 0.29 .06 0.34 .738
Competiveness / Aggressiveness 0.43 0.41 .20 1.04 .308
Autonomy 0.71 0.43 .29 1.65 .108
Market Share .457
Services (ref: manufacturing) 0.40 0.92 .08 0.44 .662
Retail (ref: manufacturing) -0.87 1.25 -.13 -0.70 .488
Risk Taking -0.49 0.39 -.24 -1.25 .221
Innovativeness 0.46 0.44 .18 1.05 .302
Proactiveness 0.53 0.31 .31 1.69 .100
Competiveness / Aggressiveness 0.07 0.44 .03 0.16 .877
Autonomy 0.00 0.46 .00 0.00 .997
Growth rate .085
Services (ref: manufacturing) 0.14 0.84 .03 0.17 .869
Retail (ref: manufacturing) -1.27 1.14 -.19 -1.12 .272
Risk Taking 0.49 0.36 .24 1.37 .180
Innovativeness -0.46 0.40 -.18 -1.13 .266
Proactiveness 0.51 0.28 .31 1.81 .080
Competiveness / Aggressiveness -0.52 0.40 -.25 -1.29 .207
Autonomy 0.83 0.42 .34 1.97 .057
Profit margin .644
Services (ref: manufacturing) -0.81 0.70 -.22 -1.15 .257
Retail (ref: manufacturing) -1.17 0.95 -.23 -1.24 .225
Risk Taking 0.06 0.30 .04 0.19 .849
Innovativeness -0.02 0.34 -.01 -0.06 .952
Proactiveness 0.30 0.24 .24 1.27 .213
Competiveness / Aggressiveness -0.15 0.34 -.10 -0.45 .655
Autonomy -0.23 0.35 -.12 -0.65 .523
Note. For each dependent variable, overall ANOVA p-values are listed in bold.

70
Results for Research Question 3
How does the entrepreneurial orientation of Black SMEs and majority SMEs differ? To
answer Research Question 3, a MANOVA was conducted. In this analysis, the EO variables
were all entered as dependent variables, while the grouping variable was defined by whether an
SME was Black or majority owned. Prior to analysis, the assumptions of the MANOVA were
assessed. Normality of the dependent variables was assessed with Kolmogorov Smirnov (KS)
tests, which indicated statistical significance for risk taking (p < .001), innovativeness (p < .001),
proactiveness (p < .001), competitiveness (p < .001), and autonomy (p < .001); thus, the
assumption was not met for these variables. Although this assumption was violated, Stevens
(2009) states that the MANOVA is robust for the assumption of normality when the sample size
is large (i.e., > 30). Homogeneity of covariance was assessed with Box’s M test. At the required
α of .001 as prescribed by Pallant (2010), results were not statistically significant (p = .274) and
the assumption was thus met. Levene’s test was utilized in order to examine homogeneity of
variance and the results were not statistically significant for risk taking (p = .567), innovativeness
(p = .179), proactiveness (p = .312), competitiveness (p = .726), or autonomy (p = .496). The
assumption was thus met for these variables.
The results of the MANOVA were not statistically significant. There were no significant
differences on entrepreneurial orientation (i.e., risk taking, innovativeness, proactiveness,
competitiveness and autonomy) by Black versus majority SME (F(5, 200) = 1.19, p = .317,
partial η2 = .029). These findings suggest that none of the EO scales differed significantly
between Black and majority-owned SMEs. Because the MANOVA indicated that there were no
significant differences on any of the EO scores by SME type (i.e., majority versus Black), the

71
individual ANOVAs could not be assessed with any degree of certainty. The results of this
MANOVA are presented in Table 8.
Table 8
Results of MANOVA for EO Scales between Black and Majority SMEs
MANOVA ANOVA F(1, 204)
Source
F(5, 200)
Risk
taking
Innovativeness
Proactiveness
Competitive
aggressiveness
Autonomy
Black vs.
majority
1.19 3.09 0.69 0.92 4.84* 0.45
Note. Significant findings are marked with an asterisk (*).
Results for Research Question 4
Is “innovativeness” the most significant aspect of EO that explains the difference
between Black SMEs and majority SMEs? To answer Research Question 4, the results of each of
the previous three analyses were assessed. The results of Research Question 1 showed that
innovativeness was not a significant predictor of performance among Black SMEs. Per a review
of the predictor variables in this analysis, innovativeness also had the largest p-value (p = .288),
suggesting that innovativeness has the least significant influence on performance among black
SMEs, particularly after controlling for each of the other aspects of EO. Furthermore,
innovativeness (p = .641) had a much larger p-value than risk taking (p = .340), or proactiveness
(p = .008) among majority SMEs as well. This suggests that innovativeness is not the most
significant EO to influence performance among either the majority or Black SMEs when the
influence of the other EO scales are taken into account.
Finally, results of Research Question 3 indicated that all five of the EO variables (i.e.,
risk taking, innovativeness, proactiveness, competitiveness and autonomy) were statistically

72
similar between Black and majority SMEs (p = .317). This suggests that there were little to no
differences in proactiveness between Black and majority SMEs that could not be explained by
chance alone. Based on these findings, the research failed to find that proactiveness was
significantly higher or lower between Black SMEs and majority SMEs, and did not influence the
performance of either group. Thus, performance could not be interpreted as the most significant
aspect of EO explaining the difference between Black SMEs and majority SMEs.
Summary
The purpose of this quantitative study was to measure the entrepreneurial orientation
between Black and majority SMEs as it relates to business performance. This chapter presented
results of several quantitative analyses conducted to address four research questions of this study.
Results of Research Question 1 revealed that there is a relationship between the entrepreneurial
orientation of Black SMEs and their performance in terms of gross sales, market share, and profit
margins. For gross sales and market share, autonomy was the only predictive EO factor, though
the analysis for Research Question 2 indicated that there is also a relationship between the
entrepreneurial orientation of majority SMEs and performance measures. For both of these
analyses, proactiveness was the most significantly variable in the prediction of performance.
However, autonomy was a significant predictor among Black SMEs only, and did not provide
any predictive ability to the majority SMEs’ performance. Research Question 3 results indicated
that there is no statistical difference between entrepreneurial orientation of Black SMEs and
majority SMEs. A final post-hoc analysis with a focus on innovativeness indicated that this EO
scale was not a significant contributor to the difference between the EO of Black SMEs and
majority SMEs, nor to the prediction of either group’s performance. Chapter 5 includes a

73
discussion of these results in relation to previous literature and the theoretical framework of the
study. In addition to this synthesis, directions for future research will also be discussed.

74
CHAPTER 5: CONCLUSIONS, DISCUSSION AND SUGGESTIONS FOR FUTURE
RESEARCH
The purpose of this quantitative study was to examine Black businesses using the
Entrepreneurial Orientation (EO) scale to determine the extent to which EO might explain the
economic performance of Black small and medium-sized enterprises (SMEs), as well as the
differences between Black and majority SMEs. The EO model includes factors designed to
measure business dimensions of innovation, risk-taking, proactiveness, competitive
aggressiveness, and autonomy, as well these factors’ impact on business performance. An
investigation of factors that predict performance of Black and majority SMEs was necessary
because of the disparities that exist between the success of Black and majority firms. Scholars,
practitioners, and educators remain interested in firm-level entrepreneurship behavior and its link
to firm performance because engaging in risk-taking, innovation, proactiveness, competitive
aggressiveness, and autonomous behaviors can lead to favorable organizational outcomes
(Chadwich, Barnett, & Dwyer, 2008; Covin & Miles, 1999; Parnell & Lester, 2007; Wiklund &
Shepard, 2003).
Despite growth in many of these areas, Black SMEs continue to struggle in matching the
successful rates of their majority counterparts. Wallick and Dodson (1972) suggested that
voluntary modification of business behavior can improve economic conditions in the Black
community. This examined the dynamics and tendencies of Black SMEs and gathered
information on the development of Black SMEs to better understand how they can compete and
succeed in today’s competitive business environment. This chapter contains the following
sections: Summary and Interpretation of Findings, Theoretical Considerations, Limitations,
Implications and Recommendations for Further Research and ends with a Conclusion.

75
Summary and Interpretation of Findings
The following section, summarized in Table 9, provides a brief summary and
interpretation of empirical findings in relation to previous literature.
Table 9
Hypothesis Tests and Results from Chapter Four
Hypothesis number Hypothesis Results
1 Null EO does not impact the
performance measures of
Black SMEs.
Rejected
1 Alternative EO impacts the performance
measures of Black SMEs.
Accepted: EO predicts
performance among Black
SMEs
2 Null EO does not impact the
performance measures of
majority SMEs.
Rejected
2 Alternative EO impacts the performance
measures of majority SMEs.
Accepted: EO predicts
performance among majority
SMEs
3 Null EO of Black SMEs and
majority SMEs are
statistically similar.
Accepted: There is no
statistically significant
difference in EO between
Black and majority owned
SMEs
3 Alternative EO of Black SMEs and
majority SMEs are
significantly different.
Rejected
Research Question 1 was how does entrepreneurial orientation impact the performance
measures of Black SMEs? The present study indicated that there was a significant relationship
between EO and performance measures of Black SMEs. Consequently, because the overall
model was significant, individual predictors were examined. Results indicated that while risk
taking (t = 1.39, p = .168), innovativeness (t = 1.07, p = .288), and competitiveness (t = 1.32, p
= .190) were not significant predictors within the model, proactiveness (t = 2.91, p = .004) and
autonomy (t = 2.06, p = .041) were significant predictors of performance. The findings that
76
proactiveness and autonomy were significant predictors of Black SME business performance are
novel because researchers have yet to focus on EO in Black SMEs.
These findings suggest that Black SMEs are proactive and autonomous in their decision-
making and business behavior. Proactiveness, or taking initiative by anticipating and pursuing
new opportunities and participating in emerging markets (Dimitratos et al., 2004), was associated
with Black entrepreneurship. This may be because in marginalized and resource-limited
environments, in which many Black SMEs find themselves operating, being proactive allows
Black SME leaders to anticipate future opportunities and thus remain competitive. Black
business owners relegated to a small market share may need to anticipate and pursue new
opportunities to remain competitive. This important finding suggests that Black SMEs relate to
marketplace opportunities by seizing advantages and opportunities to gain market share, to
influence trends, and most likely to create demand for a particular commodity, good, or service.
The findings for Research Question 1 also suggest that Black SMEs have an independent
spirit and express the freedom of action (i.e., autonomy; Burgelman, 2001) necessary to advance
new venture development as a driving force in entrepreneurial value creation. While the finding
is novel in relation to Black SMEs, it also reinforces that “the exercise of autonomy by strong
leaders, unfettered teams, or creative individuals who are disengaged from organizational
constraints “(Lumpkin, 1996, p. 140). It is, therefore, an important general component to
business performance. However, autonomy may be important for Black entrepreneurs to thrive in
many organizational contexts. For Black SMEs, autonomy may afford organizational members
the freedom and flexibility to develop and enact entrepreneurial initiatives.
Research Question 2 was how does entrepreneurial orientation impact the performance
measures of majority SMEs? There was a significant relationship between EO and performance

77
measures of majority SMEs, and, since the overall model was significant, individual predictors
were examined. Results indicated that only proactiveness (t = 2.80, p = .008) was a statistically
significant predictor of performance among majority SMEs. Previous research has shown that
proactiveness involves business leaders seeking to secure and protect market share with forward-
looking perspectives reflected in actions taken in anticipation of future demand (Dimitratos et al.,
2004; Lee & Penning, 2001; Naman & Slevin, 1993; Venkatraman, 1989a, 1989b). In addition,
Vij and Bedi (2012) found proactiveness to be manifested in aggressive behavior directed at rival
firms and at the organizational pursuit of favorable business opportunities.
The finding of the present study confirms that proactiveness is an important factor in the
performance of majority SMEs. Lieberman and Montgomery (1988), for example, argued that
first-mover advantage was the best strategy for capitalizing on a market opportunity. In addition,
Venkatraman (1989a) argued that proactiveness defined as “seeking new opportunities which
may or may not be related to the present line of operations, introduction of new products and
brands ahead of competition, strategically eliminating operations which are in the mature or
declining stages of life cycle,” was crucial to business performance (p. 949). The findings of the
present study suggest that proactiveness is an important factor to the business success of both
Black and majority SMEs. In addition, being proactive and exploiting asymmetries in the
marketplace may allow Black entrepreneurs to capture potential profits and garner brand
recognition amongst their customer base.
Research Question 3 was how does the entrepreneurial orientation of Black SMEs and
majority SMEs differ? The results of the MANOVA showed no significant differences in
entrepreneurial orientation (risk taking, innovativeness, proactiveness, competitiveness and
autonomy) between Black and majority SMEs (F(5, 200) = 1.19, p = .317, partial η2 = .029).

78
These findings suggest that none of the EO scales differed significantly between the two, but
meant the individual ANOVAs could not be assessed with any degree of certainty. Thus, there is
no significant difference between Black and White businesses on the EO scale and therefore,
Hypothesis 4 was rejected.
The findings for Research Question 3 indicate that there are other reasons than EO that
explain the discrepancies between Black and majority SMEs and this offers opportunity for
future research. The only factor of EO that showed significant difference for Black SMEs in
relation to majority SMEs was autonomy. Autonomy, or affording organizational members the
freedom and flexibility to develop and enact entrepreneurial initiatives, may be more important
for Black entrepreneurs to thrive than for majority entrepreneurs. The differences between
autonomy for Black SMEs and majority SMEs also represent an avenue for future study.
Research Question 4 was, is “innovativeness” the most significant aspect of EO that
explains the difference between Black SMEs and majority SMEs? The results for Research
Question 4 indicated that innovativeness was not a significant predictor of performance among
Black SMEs. Per a review of the predictor variables in this analysis, innovativeness also had the
largest p-value (p = .288), suggesting that innovativeness has the least significant influence on
performance among Black SMEs, particularly after controlling for each of the other aspects of
EO. Further, innovativeness (p = .641) had a much larger p-value than risk taking (p = .340), or
proactiveness (p = .008) among majority SMEs. This suggests that innovativeness is not the most
significant EO to influence performance among either the majority or Black SMEs when the
influence of other EO scales are taken into account. These findings are significant because the
show that Black SMEs are just as innovative as White SMEs and innovation has the least
influence on performance measurers between the two.

79
Innovativeness involves the ability to harness creative abilities and put those abilities to
use in facing challenges while improving processes, procedures, and products (Bates, 1989).
Innovation is a specific function of entrepreneurship that either creates new wealth resources or
strategically incorporates obtainable resources that have the potential to establish wealth and jobs
(Anderson, 1982). Consequently, many researchers believe that innovativeness may be the most
important factor of EO, and differences in innovativeness might help to explain discrepancies
between Black and majority SMEs (Alegre & Chiva, 2013; Panth, 2013; Parkman, 2012; Roy,
2012). The findings of the present study, however, suggest other reasons than innovativeness
explain the discrepancies between Black and majority SMEs. These findings offer, yet again,
avenues for future research.
Theoretical Considerations
Cultural theory of entrepreneurship offers one of the oldest accounts of group difference
in business enterprise, having its origins in Max Weber’s classical writings (1930) on the
Protestant ethic and capitalism (Light, 1979; Weber, 1930). The fundamental claim of the
cultural theory of entrepreneurship is straightforward, highlighting group differences in business
performance resulting from group differences in cultural norms and values required for
successful entrepreneurship such as a predisposition toward risk-taking, hard work, and delayed
gratification (Hunter & Boyd, 2004). The theory additionally holds that the pursuit of economic
independence—to be “ones’ own boss”—and a drive for high achievement are primary
motivations for the pursuit of self-employment in a small business (Light, 1979). This theory can
be applied to the entrepreneurial orientation of Black businesses because of the more than
106,000 African American firms in Michigan, 90% are “sole entrepreneurs” or have only one
employee.

80
Similar to cultural theory, disadvantage theory is rooted in the work of Weber (1930),
especially his proposal that those excluded from the mainstream economy because of
discrimination will turn to business ownership as an alternative to the labor market—in effect,
choosing self-employment over unemployment (Berger, 1991; Light & Rosenstein, 1995). This
theory has been employed to explain why, in a wide variety of societies, Black SMEs embrace
entrepreneurship as an economic survival strategy and have high rates of small-business
ownership (Cooper & Dunkelberg, 1987; Horton & DeJong, 1991; Light, 1979; Light &
Rosenstein, 1995). Using this connection, the concept of “survivalist entrepreneurship” has been
proposed referring to business ventures undertaken out of desperation by persons who have no
options in the mainstream economy (Light & Rosenstein, 1995). Applying disadvantage theory
to racial differences in Black entrepreneurship, we find Black entrepreneurs better fit the profiles
of resource-disadvantage, survivalist entrepreneurs than that of their White counterparts. These
theories can be applied to the entrepreneurial orientation of Black businesses because African
American businesses arguably form out of necessity, i.e., job loss, joblessness, low income, or
earnings.
Lastly, protected market theory is also relevant to minority business enterprise in the pre-
civil rights era, when White entrepreneurs generally refused to cater to the personal service needs
of minority customers (Hunter & Boyd, 2004). Light proposed the term “protected market” to
refer to the special ethnic minority groups that only co-ethnic entrepreneurs can serve. During
this time, many personal services—especially those requiring intimate contact between provider
and consumer, such as mortuary services, hairdressing, and beauty culture, were left to minority
business owners (Boyd, 1996a). The protected market theory also focuses on the importance of
special skills or knowledge that business owners must have in order to serve their clientele, for

81
example, an intimate knowledge of the cosmetics and hair preparations demanded by minority
consumers (Boyd, 1996b). This theory can be applied to the entrepreneurial orientation of Black
businesses in the fact that African American firms have great access to sectors and industries
within their communities with limited competition.
Limitations to the Study
Limitations to this research occur in four different areas: sample population, participants,
geography, and racial identity. First, the sample population was drawn from business
organizations representing segments of businesses throughout the state of Michigan, and it was
largely representative of publicly-traded firms. This study is, therefore, limited to the state and
lacks national scope. In addition, findings may relate more heavily to publicly-traded firms than
other small businesses. Consequently, empirical findings may not generalize to other regions or
the national level. Secondly, this study relies heavily on perceptual data of managerial leadership
from representatives of each SME, usually a company president, CEO, or an executive-level
manager. This could lead to potential perceptual bias and cognitive limitations in observation of
the firm, environment, or cultural conditions. Thirdly, one of the focuses of the study was SMEs;
therefore, results cannot be generalized to explain phenomenon among larger industries. Lastly,
another focus was Black SMEs specifically, not Minority Business Enterprises (MBEs), which
also limits the scope of this study. Although other ethnic minority groups experience many of the
same challenges and barriers to entrepreneurial success, this study was not designed to measure
EO in relation to MBE performance. In conclusion, recognizing the inevitable limitations that
exist further research can maximize what is learned here. However, despite limitations this
research intentionally focused on a comparative assessment as it garnered a more equal sampling
pool of business owners between Black and majority firms. The larger participation of majority
82
firms could have an impact on the results as it relates to a limited analysis not equal to that of
Black businesses. This relegates the sampling of data to a segmented analysis.
Implications and Recommendations for Further Research
This study on Black SMEs provides a framework, theoretical perspective, and conceptual
design to further research opportunities, using entrepreneurial orientation and its relationship to
firm performance as a tool for entrepreneurship growth.
First, the research supports the hypothesis that an entrepreneurial orientation has a
positive relationship with a firm’s performance and manager’s entrepreneurial decision-making.
Future research could make several contributions to the study of Black SMEs by: (a) focusing on
“barriers to entry,” as EO is an important way to measure how a business is organized and enters
the marketplace; (b) exploring different industries and sectors of Black SMEs objectively and
subjectively (financially and non-financially), resulting in a high variance of EO-performance
relationship; (c) exploring other geographic locations throughout the U.S. and diasporic regions
of the Caribbean and Africa; and (d) continuing to compare Black SMEs and majority SMEs
both organizationally and individually, to find similarities and differences in behavioral and
strategic decision-making that lead to better performance using the EO construct and its
dimensions.
Secondly, literature suggests that the relationship between EO and performance is not
completely straightforward, with regard to strategic decision-making. This offers an opportunity
to explore the combination of the following theoretical frameworks: (a) subjectivist theory of
entrepreneurship; (b) dynamic capabilities theory; (c) the theory of dominant logic; (d) learning
theory, which links causally adjacent phenomena via learning-related processes and/or links EO
to learning to various endogenous processes and contextual attributes; (e) cultural theory; (f)

83
disadvantaged theory; and (g) protected market theory (Anderson, Covin, & Slevin, 2009; Bierly,
Damanpour, & Santoro, 2009; Hughes, Hughes, & Morgan, 2007; Lee & Sukoco, 2007; Wang,
2008). All of these are suggested theoretical frameworks and phenomenon-framing lenses that
might be employed in advancing EO research on Black SMEs
Thirdly, findings indicate that the entrepreneurial orientation construct and scale can help
determine existing or potential programs as a fundamental contribution of Black SMEs to the
overall performance of the economy. This constitutes a crucial motive for researchers to
investigate the key success factors behind their performance (Wickham, 2001; Wiklund et al.,
2011), with special attention given to the factors of proactiveness and autonomy.
Additionally, the findings imply that if a company maintains its growth rate in a balanced
way (i.e., focusing on all factors of EO), it can sustain development thus guaranteeing its
survival. How black SMEs can develop and maintain a balanced approach should be a major
focus of Black SME research. Small businesses face many challenges that hinder their growth or
even cause permanent shutdown or failure. However, a few small businesses can overcome those
challenges, survive and achieve a remarkable growth rate. Future research can help Black SMEs
not only avoid shutdown or failure, but also contribute to the general understanding of the
challenges that hinder sustainable growth and the ability to create jobs. Lastly, using future
entrepreneurial research on Black SMEs can effectively address inadequate and inappropriate
legislation and policy as common barriers to entrepreneurship. This would improve the chances
of entrepreneurial success, especially in terms of entrepreneurial orientation.
Conclusion
In conclusion, I set out to contribute to the general scholarship of entrepreneurship and
growing body of literature relating to EO, performance and its impact on Black SMEs and

84
majority SMEs. Empirical results showed that EO was related to performance and its own
individual dimensions. This research provides empirical support for the relationship between EO
and performance, while contributing to the general understanding of its impact relative to Black
and majority SMEs. By measuring the EO construct and its dimensions in Black and majority
SMEs, empirical and theoretical development of future research about entrepreneurship becomes
extremely important. The major goal of this study was to open a new path for entrepreneurial
research and an unexplored assessment of a population critical to the development of African
American communities and the overall economic fabric of society and the country. These results
reinforce and extend prior studies through the empirical assessment of the EO construct and its
dimensionality of the EO scale. By replicating and extending previous research, the EO
conceptual model and construct can offer unique value to the academic and practical community,
helping provoke ongoing concerns, debates and inconsistencies as it relates to the further
development, challenges, and barriers experienced by Black businesses in the United States and
beyond.
It is also important to discuss that Black SMEs have recently made tremendous strides.
From 2002 to 2007, the number of Black-owned businesses increased by 60.5% to 1.9 million,
more than triple the national rate of 18.0%, according to the U.S. Census Bureau’s Survey of
Business Owners. Over the same period, receipts generated by Black-owned businesses
increased 55.1% to $137.5 billion. “Black-owned businesses continued to be one of the fastest
growing segments of our economy, showing rapid growth in both the number of businesses and
total sales during this time period,” said Census Bureau Deputy Director Thomas Mesenbourg.
The Survey of Business Owners: Black-Owned Businesses: 2007 provides detailed information
in five-year segments for Black-owned businesses, including the number of firms, sales and

85
receipts, number of paid employees and annual payroll. These data are presented by geographic
area (nation, state, county, city and metro area), industry and size of business. Preliminary
national and state data were released in July 2010. In 2007, nearly 4 in 10 Black-owned
businesses operated in health care and social assistance as well as repair, maintenance, personal
and laundry services sectors. The retail trade and health care and social assistance sectors
accounted for 27.4% of Black-owned business revenue. Among states, New York had 204,032
Black-owned businesses and accounted for 10.6% of the nation’s Black-owned businesses,
followed by Georgia, with 183,874 Black-owned businesses (9.6%) and Florida, with 181,437
(9.4%). Among counties, Cook, Illinois, had the most Black-owned businesses, with 83,733,
accounting for 4.4% of all the nation’s Black-owned businesses. Los Angeles followed with
59,680 (3.1%) and Kings, N.Y., with 52,705 businesses (2.7%). Among cities, New York had the
most Black-owned businesses, with 154,929 (8.1% of all the nation’s Black-owned businesses),
followed by Chicago, with 58,631 (3.1%), Houston, with 33,062 (1.7%) and Detroit, with 32,490
(1.7%). Of the 1.9 million Black-owned businesses in 2007, 106,824 increased employee wages
13.0% from 2002. These businesses employed 921,032 people, an increase of 22.2%. Their
payrolls totaled $23.9 billion, an increase of 36.3%. Receipts from Black-owned employer
businesses totaled $98.9 billion, an increase of 50.2% from 2002. In 2007, 1.8 million Black-
owned businesses had no paid employees, an increase of 64.5% from 2002. These non-employer
businesses’ receipts totaled $38.6 billion, an increase of 69.0%. Between 2002 and 2007 the
number of Black-owned businesses with receipts of $1 million or more increased by 35.4% to
14,507. This important data denotes the need for future research, specifically to better understand
the fascinating dynamics of Black businesses, but also to help encourage growth, sustainability
and performance, as a contributor to the overall economy.
86
In contrast, the average outcomes of businesses owned by African Americans are at the
low end of all groups. Although a sizeable body of research has focused on why there are few
Black-owned businesses, very little research focuses on the causes of their relative
underperformance (Fairly & Robb, 2008). These statistics are important to discuss as they relate
to EO because in signifying a growing Black economy with limitations that give access to
capital, market share, and resources. This analysis indicates that the number of Black-owned
businesses in diverse industries are increasing and increased, which provide for a greater
contribution to the socio-economic progress of African Americans and the larger society. The
significant growth rate amongst the total number of Black businesses consistently outpaced other
minority groups and all U.S. businesses. Despite these increases in the number of Black
businesses, African American entrepreneurs tend to participate in industries and sectors with less
capital and resource requirements for start-up and expansion, and therefore, depended heavily on
the companies’ entrepreneurial orientation to compete. There is a need for a much broader scope
of implementation and much greater follow-through. The essential contributions of this study
suggest several areas of further research and analysis. Understanding and mitigating barriers to
success and sustainability for Black-owned businesses has a direct economic impact to the
economic competitiveness of Michigan and the U.S. economy as a whole, especially in light of
the systemic economic barriers that still exist between Black and majority businesses.

87
APPENDICES

88
APPENDIX A
IRB Application for Initial Review

89

90

91

92

93

94

95
APPENDIX B
IRB Initial Application Signature Form
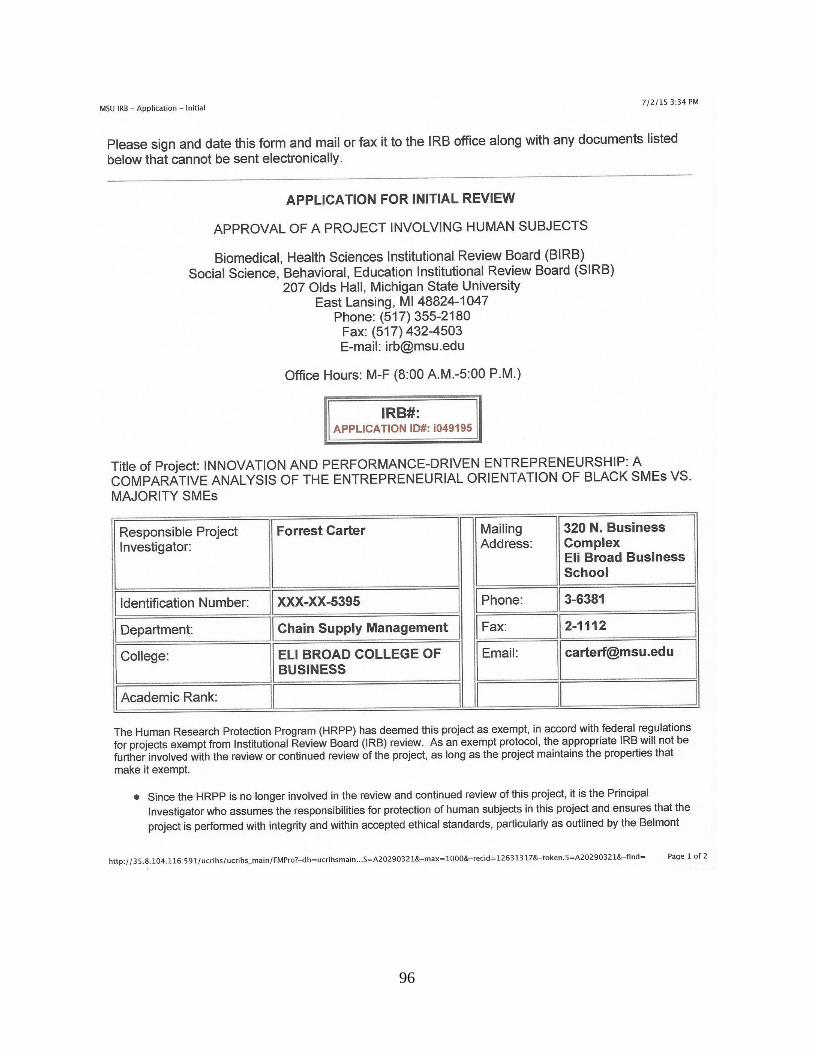
96

97

98
APPENDIX C
MSU IRB Approval

99

100
APPENDIX D
Participant Information Letter

101

102

103
APPENDIX E
Demographic Survey

104

105
APPENDIX F
Michigan Business Performance Survey

106

107

108

109

110

111

112

113

114

115
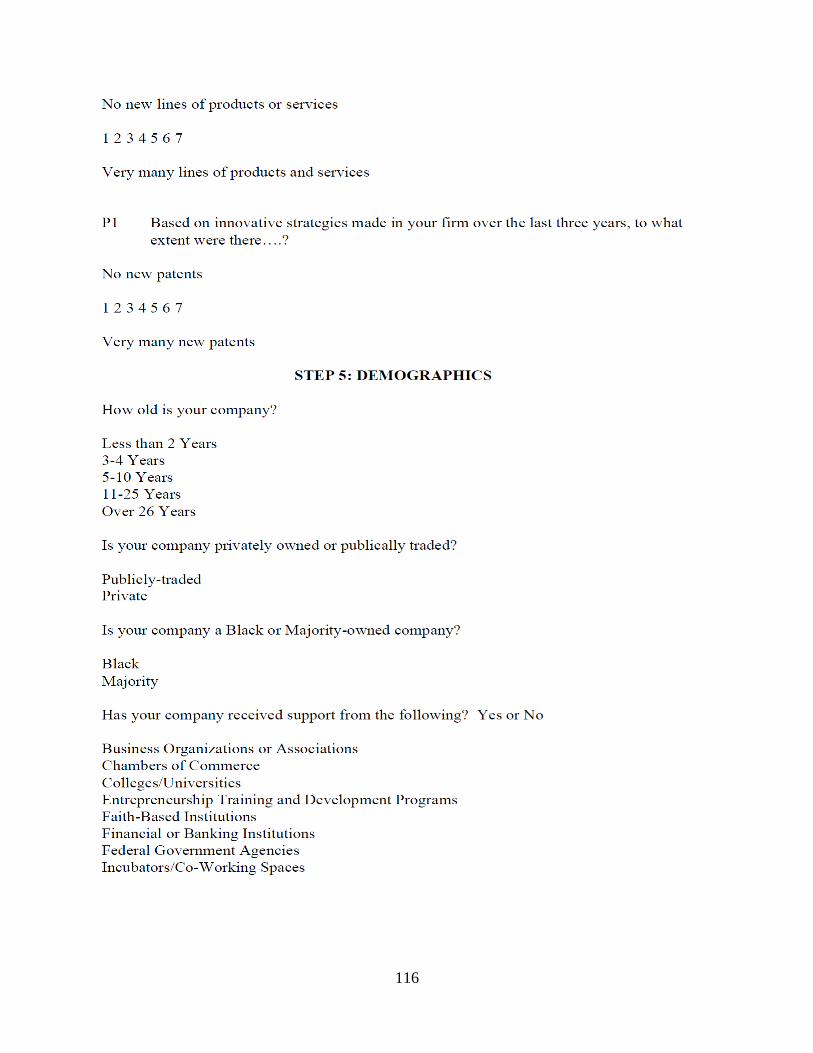
116

117

118
APPENDIX G
Performance Scale
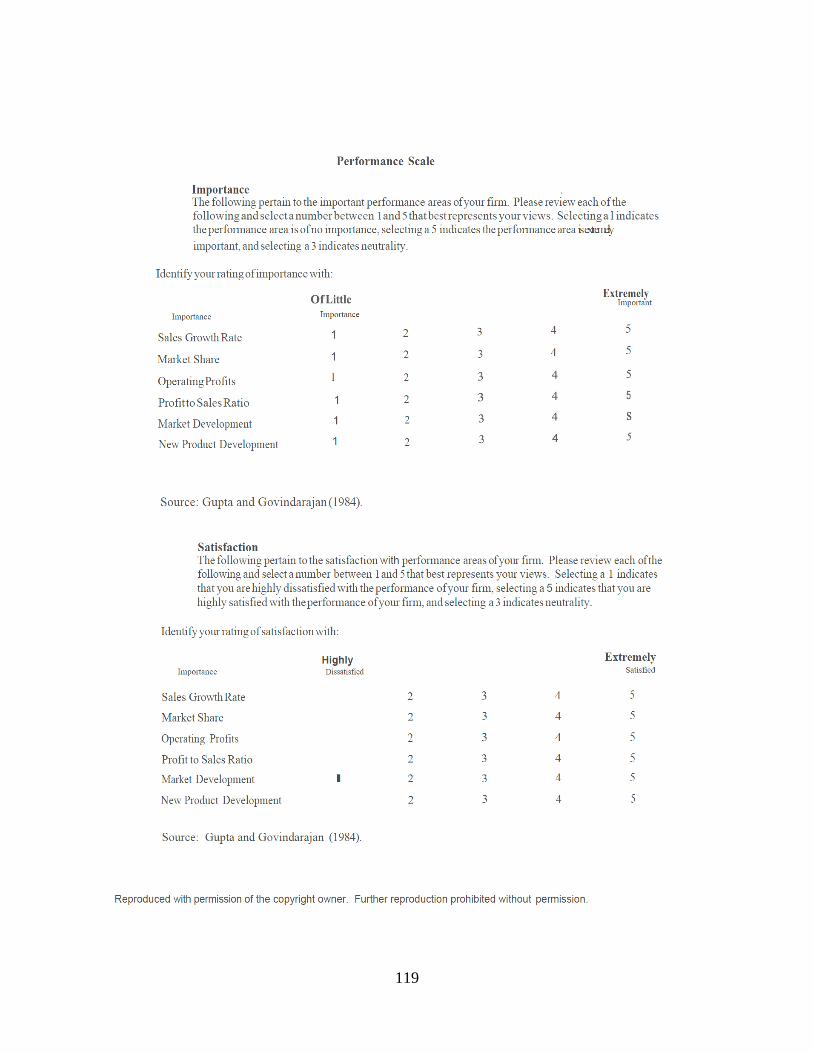
119

120
APPENDIX H
Entrepreneurial Orientation Scale

121
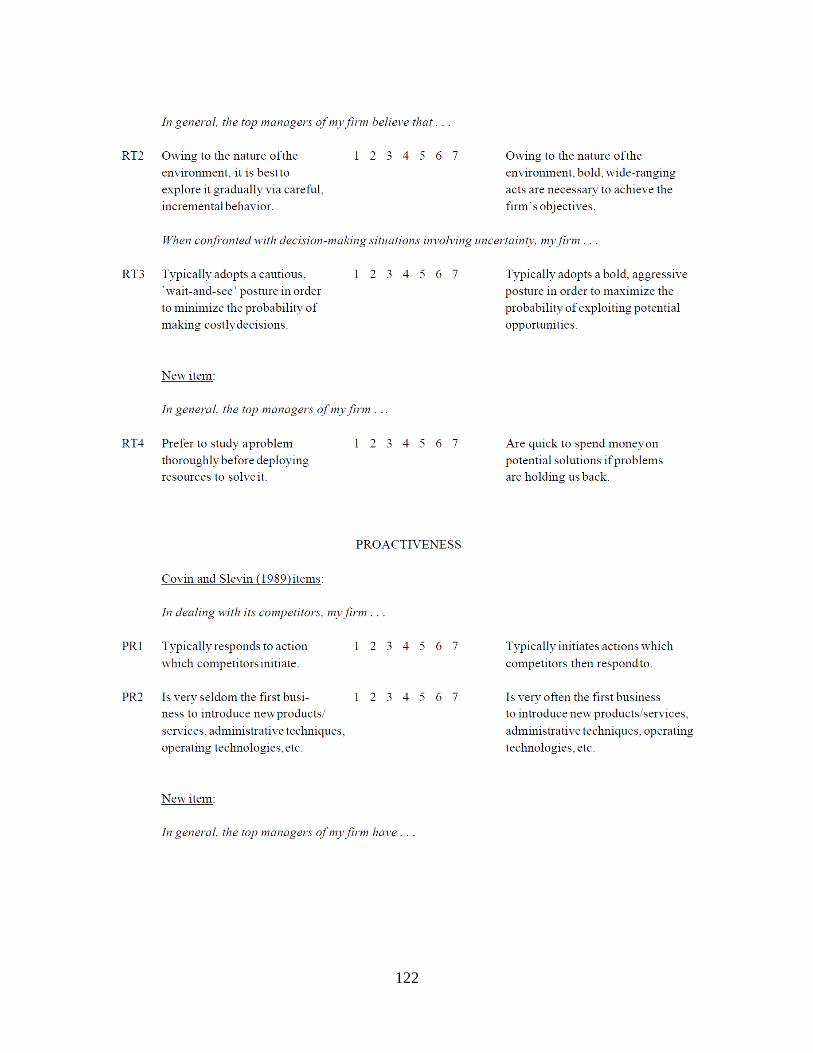
122

123

124
APPENDIX I
Lumpkin Autonomy Scale

125

126
BIBLIOGRAPHY

127
BIBLIOGRAPHY
Adams, J. T. (1931). The epic of America. Boston, MA: Little, Brown, and Company.
Alegre, J., & Chiva, R. (2013). Linking entrepreneurial orientation and firm performance: The
role of organizational learning capability and innovation performance. Journal of Small
Business Management, 51(4), 491-507.
Anderson, B. C. (2009). Understanding the relationship between entrepreneurial and strategic
learning capability: An empirical investigation. Strategic Entrepreneurship Journal, 3(3),
218-240.
Anderson, B. S., Covin, J. G., & Slevin, D. P. (2009). Understanding the relationship between
entrepreneurial orientation and strategic learning capability: An empirical investigation.
Strategic Entrepreneurship Journal, 3(3), 218-240. doi:10.1002/sej.72
Anderson, T. (1982). Black entrepreneurship and concepts toward economic coexistence.
Western Journal of Black Studies, 6(2), 80.
Aramand, M. A. (2012). Dynamic capabilities in entrepreneurial firms: A case study approach.
Journal of International Entrepreneurship, 10(2), 142-157.
Auster, E. (1988). Owner and organizational characteristics of Black- and White-owned
businesses: Self-employed Blacks had less training, fewer resources, less profits, but had
similar survival rates. American Journal of Economics & Sociology, 47(3), 331-344.
Baird, I. A. (1985, April). Towards a contingency model of strategic risk taking. The Academy of
Management Review, 10(2), 230-243.
Barnett, R. I. (2001). Assessing minority entrepreneurship: An analysis of Black-owned
businesses in 274 metropolitan statistical areas. Retrieved from ProQuest Dissertations.
(3014517)
Baron, R. A. (2010). How entrepreneurs acquire the capacity to excel: Insights from research on
expert performance. Strategic Entrepreneurship Journal, 4, 49-65.
Bates, T. (1989). The changing nature of minority business: A comparative analysis of Asian,
nonminority, and Black-owned businesses. The Review of Black Political Economy,
18(2), 25.
Bates, T. (2011). Minority entrepreneurship. Foundations and Trends in Entrepreneurship, 7(3–
4), 151-311.
Benjamin, R. (1996). Black entrepreneurs and the politics of economic development. Retrieved
from ProQuest Dissertations. (304295658)

128
Bierly, P. E., Santoro, M. D., & Damanpour, F. (2009). The application of external knowledge:
Organizational conditions for exploration and exploitation. Journal of Management
Studies, 46(3), 481-509. doi:10.1111/j.1467-6486.2009.00829.x
Boston, T. (2011, Summer). Minority report: Expanding opportunity for all. Democracy: A
Journal of Ideas, 21.
Brimmer, A. F. (2002). Competition and integration of Black enterprises in the American
economy. Review of Black Political Economy, 29(3), 9-50.
Carree, M. V. (2002). Business ownership and economic growth in 23 OECD countries in the
period 1976-1996. Small Business Economics, 19, 271-290.
Carter, S., Mwaura, S., Ram, M., Trehan, K., & Jones, T. (2015). Barriers to ethnic minority and
women's enterprise: Existing evidence, policy tensions and unsettled
questions.International Small Business Journal, 33(1), 49-69.
doi:10.1177/0266242614556823
Chadwick, K., Barnett, T., & Dwyer, S. (2008). An empirical analysis of the entrepreneurial
orientation scale. Journal of Applied Management and Entrepreneurship, 13(4), 64.
Cohen, J. (1988). Statistical power analysis for the behavioral sciences (2nd ed.). Hillsdale, NJ:
Lawrence Erlbaum.
Covin, J., & Lumpkin, G. T. (1991). A conceptual model of entrepreneurship as firm behavior.
Entrepreneurship Theory and Practice, 16(1), 7-25.
Colvin, J., & Lumpkin, G. T. (2011). Entrepreneurial orientation theory and research:
Reflections on a needed construct. Entrepreneurship: Theory and Practice, 35(5), 855.
Covin, J., & Lumpkin, G. T. (2012). The measurement of entrepreneurial orientation.
Entrepreneurship: Theory and Practice, 36(4), 677-702.
Covin, J. G., & Miles, M. P. (1999). Corporate entrepreneurship and the pursuit of competitive
advantage. Entrepreneurship: Theory and Practice, 23(3), 47.
Covin, J. G., & Wales, W. J. (2012). The measurement of entrepreneurial orientation.
Entrepreneurship Theory and Practice, 36(4), 677-702. doi:10.1111/j.1540-
6520.2010.00432.x
Cuervo-Cazurra, A., & Genc, M. (2008). Transforming disadvantages into advantages:
developing-countries MNEs in the least developed countries. Journal of International
Business Studies, 39, 957-979.

129
Dess, G. G., Lumpkin, G. T., & Covin, J. G. (1997). Entrepreneurial strategy making and firm
performance: Tests of contingency and configurational models. Strategic Management
Journal, 18(9), 677-695.
Dixon, S. A. (2007). Leadership, administrative heritage, and absorptive capacity. Leadership &
Organization Development Journal, 28(8), 727-748.
Drucker, P. (1985). Innovation and entrepreneurship: Practice and principles. New York, NY:
Harper & Row.
Ewing Marion Kauffman Foundation. (2016). Global Entrepreneurship Research Network.
Retrieved from Ewing Marion Kauffman Foundation website: http://kauffman.org
Fairlie, R. A. (2008). Race and entrepreneurial success: Black-, Asian-, and White-owned
businesses in the United States. Cambridge, MA: The MIT Press.
Feagin, J. R., & Imani, N. (1994). Racial barriers to African American entrepreneurship: An
exploratory study. Social Problems, 41(4), 562–584.
Fields-White, M. (2011, February 24). Greenwood, Oklahoma: The legacy of the Tulsa race riot.
The Root.
Fitch, C., & Myers, S. L. (2000). Testing the survivalist entrepreneurship model. Social Science
Quarterly, 81(4), 985.
Gibson, M. A. (1982). An introduction to urban renewal. London, UK: Hutchinson & Company.
Green, K. M., Covin, J. G., & Slevin, D. P. (2008). Exploring the relationship between strategic
reactiveness and entrepreneurial orientation: The role of structure–style fit. Journal of
Business Venturing, 23(3), 356-383. doi:10.1016/j.jbusvent.2007.01.002
Habaradas, R. (2008). SME development and technology upgrading in Malaysia: Lessons for the
Philippines. Journal of International Business Research, 7(1), 89-116.
Henry, C., & De Bruin, A. (2011). Entrepreneurship and the creative economy: Process,
practice and policy. Northampton, MA: Cheltenham, UK: Edward Elgar.
Heywood, J. (1988). Market structure and the pattern of Black-owned firms. The Review of the
Black Political Economy, 16(4), 65.
Hoonsopon, D., & Ruenrom, G. (2012). The impact of organizational capabilities on the
development of radical and incremental product innovation and product innovation
performance. Journal of Managerial Issues, 24(3), 250-276.
Hughes, M., Hughes, P., & Morgan, R. E. (2007). Exploitative learning and entrepreneurial
orientation alignment in emerging young firms: Implications for market and response

130
performance. British Journal of Management, 18(4), 359-375. doi:10.1111/j.1467-
8551.2007.00519.x
Humphrey, J., & Schmitz, H. (2003). Chain governance and upgrading: Taking stock. In H. S.
(Ed.), Local enterprises in the global economy: Issues of governance and upgrading (pp.
349-381). Cheltenham: Edward Elgar.
Jantunen, A. P. (2005). Entrepreneurial orientation, dynamic capabilities, and international
performance. Journal of International Entrepreneurship, 3(3), 223-243.
Johnson, H. B. (1998). Black Wall Street: From riot to renaissance in Tulsa's historic
Greenwood district. Fort Worth, TX: Eakin Press.
Khandwalla, P. (1976, 1977). Some top management styles. Organizational and Administrative
Sciences, 7(Winter), 21-51.
Kollman, T., & Stöckmann, C. (2014). Filing the entrepreneurial orientation performance gap:
The mediating effects of exploratory innovations. Entrepreneurship: Theory and
Practice, 35(5), 1001-1026.
Kor, Y. M. (2007). Resources, capabilities, and entrepreneurial perceptions. Journal of
Management Studies, 44, 1187-1212.
Kreiser, P. A. (2014). Entrepreneurial responses to hostile environments. Academy of
Management Proceedings, 1, 14506. New York, NY: Academy of Management
Proceedings.
Kreiser, P. M. (2010). The development and validation of an objective entrepreneurial
orientation scale. Frontiers of Entrepreneurship Research, 30(20), 2.
Kreiser, P. M., Marino, L. D., & Weaver, K. M. (2002). Assessing the psychometric properties
of the Entrepreneurial Orientation Scale: A multi-country analysis. Entrepreneurship
Theory and Practice, 26(4), 71-94.
Lee, L. T., & Sukoco, B. M. (2007). The effects of entrepreneurial orientation and knowledge
management capability on organizational effectiveness in Taiwan: The moderating role
of social capital. International Journal of Management, 24(3), 549.
Leech, N. B. (2011). IBM SPSS for intermediate statistics (4th ed.). New York, NY: Taylor &
Francis.
Lumpkin, G. T. (1996). The entrepreneurial orientation (EO) of new entrants: Performance
implications of alternative configurations of EO, environment, and structure. Retrieved
from ProQuest Dissertations & Theses Global. (304317351)

131
Lumpkin, G. T. (2001). Linking two dimensions of entrepreneurial orientation to firm
performance: The moderating role of environment and industry life cycle. Journal of
Business Venturing, 16(5), 429-451.
Lumpkin, G. T., & Dess, G. G. (1996). Clarifying the entrepreneurial orientation construct and
linking it to performance. The Academy of Management Review, 21(1), 135-172.
Lyons, R. C. (2007). Innovation in services: Corporate culture and investment banking.
California Management Review, 50(1), 174-191.
Massey, D., & Denton, N. (1993). American apartheid: Segregation and the making of the
underclass. Cambridge, MA: Harvard University Press.
Meacham, J. (2012, June 21). Keeping the dream alive. Time.
Meyer, G. A. (2000). Entrepreneurship as strategy. New York, NY: Sage.
Miller, D. (1982). Innovation in conservative and entrepreneurial firms: Two models of strategic
momentum. Strategic Management Journal, 3(1), 1-25.
Miller, D. (1983). The correlates of entrepreneurship in three types of firms. Management
Science, 29(7), 770-791.
Mousa, F., & Wales, W. (2012). Founder effectiveness in leveraging entrepreneurial orientation.
Management Decision, 50(2), 305-324.
Naman, J. L., & Slevin, D. P. (1993). Entrepreneurship and the concept of fit: A model and
empirical tests. Strategic Management Journal, 14(2), 137-153.
doi:10.1002/smj.4250140205
Neumark, D. W. (2008). Do small businesses create more jobs? New evidence for the United
States for the National Establishment Time Series. Bonn: IZA.
Obloj, T. O. (2010). Dominant logic and entrepreneurial firms' Performance in a transition
economy. Entrepreneurship Theory and Practice, 34(1), 151-170.
O'Regan, N., & Ghobadian, A. (2004). The importance of capabilities for strategic direction and
performance. Management Decision, 42(2), 292-313. doi:10.1108/00251740410518525
Panth, N. (2013). Accelerating the growth of small African-American-owned businesses. St.
Louis, MO: Federal Reserve Bank of St. Louis.
Parkman, I. H. (2012). Creative industries: Aligning entrepreneurial orientation and innovation
capacity. Journal of Research in Marketing and Entrepreneurship, 14(1), 95-114.

132
Parnell, J. A., & Lester, D. L. (2007). Reevaluating the entrepreneurship-management
conundrum: Challenges and solutions. Journal of Applied Management and
Entrepreneurship, 12(4), 74.
Peters, T. J. (1982). In search of excellence: Lessons from America's best-run companies. New
York, NY: Harper & Row.
Prahalad, C. A. (1986). The dominant logic: A new linkage between diversity and performance.
Strategic Management Journal, 7, 485-501.
Reed, W. (1997). Black business in the world economy. Network Journal, 5(2), 12.
Reedy, E. (2015, July 28). Making entrepreneurial growth vibrant again. Retrieved from Ewing
Marion Kauffman Foundation website: http://kauffman.org/what-we-do/research/2015/07
Roberson, Q. M., & Park, H. J. (2007). Examining the link between diversity and firm
performance: The effects of diversity reputation and leader racial diversity. Group &
Organization Management, 32(5), 548-568. doi:10.1177/1059601106291124
Robertson, C., & Chetty, S. K. (2000). A contingency-based approach to understanding export
performance. International Business Review, 9(2), 211-235. doi:10.1016/S0969-
5931(99)00037-2
Roy, A. V. (2012). Measuring entrepreneurial orientation in SMEs. Abhigyan, 30(2), 60.
Sapienza, H. J., Smith, K. G., & Gannon, M. J. (1988). Using subjective evaluations of
organizational performance in small business research. American Journal of Small
Business, 12(3), 45.
Schumpeter, J. (1912). The theory of economic development: An inquiry into profits, capital,
credit, interest, and the business cycle. NJ: Transaction Publishers.
Sexton, D., & Bowman-Upton, N. B. (1991). Entrepreneurship: Creativity and growth. New
York, NY: Macmillan.
Stevens, J. (2009). Applied multivariate statistics for the social sciences (5th ed.). New York,
NY: Routledge.
Strandholm, K., Kumar, K., & Subramanian, R. (2004). Examining the interrelationships among
perceived environmental change, strategic response, managerial characteristics, and
organizational performance. Journal of Business Research, 57(1), 58-68.
doi:10.1016/S0148-2963(02)00285-0
Strom, R. D. (2007). Preface: Fostering research on minority entrepreneurship. The Annals of the
American Academy of Political and Social Science, 613, 6–9.

133
Tabachnick, B. A. (2013). Using multivariate statistics (6th ed.). Northridge, CA: Pearson.
Tajeddini, K. (2010). Effect of customer orientation and entrepreneurial orientation on
innovativeness: Evidence from the hotel industry in Switzerland. Tourism Management,
31(2), 221-231.
Teece, D. P. (1997, August). Dynamic capabilities and strategic management. Strategic
Management Journal, 18(7), 509-533.
United States Census. (2010). United States Census. Washington, DC: United States
Government.
Urdan, T. (2010). Statistics in plain English (3rd ed.). New York, NY: Taylor & Francis.
Wales, W. M. (2011). The organizational pervasiveness of entrepreneurial orientation.
Entrepreneurship Theory and Practice, 35, 895-923.
Wang, C. L. (2008). Entrepreneurial orientation, learning orientation, and firm performance.
Entrepreneurship Theory and Practice, 32(4), 635-657. doi:10.1111/j.1540-
6520.2008.00246.x
Wennekers, S. A. (1999). Linking entrepreneurship and economic growth. Small Business
Economics, 13, 27-55.
Wiklaund, J. (1999). The sustainability of the entrepreneurial orientation-performance
relationship. Entrepreneurship: Theory and Practice, 24(1), 37.
Wiklund, J., & Shepherd, D. (2003). Knowledge-based resources, entrepreneurial orientation,
and the performance of small and medium-sized businesses. Strategic Management
Journal, 24(13), 1307-1314. doi:10.1002/smj.360
Winter, S. (2003). Understanding dynamic capabilities. Strategic Management Journal, 24, 991-
995.
Zahra, S. (2012). Organizational learning and entrepreneurship in family firms: Exploring the
moderating effect of ownership and cohesion. Small Business Economics, 38(1), 51-65.
Zahra, S. A., Jennings, D. F., & Kuratko, D. F. (1999). The antecedents and consequences of
firm-level entrepreneurship: The state of the field. Entrepreneurship: Theory and
Practice, 24(2), 45.
Zahra, S. A., Sapienza, H. J., & Davidson, P. (2006). Entrepreneurship and dynamic capabilities:
A review, model and research agenda. The Journal of Management Studies, 43(4), 917.
Zajonc, T. (2003). Black enterprise and the legacy of slavery. The Review of Black Political
Economy, 30(3), 23-37.