iniiiiiiiiii}iiii}iiiiii}ii}iiiiiiiiiiii, irp - nasa ·...
TRANSCRIPT

iNIIIIIIIIII}IIII}IIIIII}II}IIIIIIIIIIII,_IA.<ArPi-_,__3 1176 00138 6664
NASA Technical Memorandum 80197
NASA-TM-80197 19800007614
A STUDY OF PARTIAL COHERENCE FOR IDENTIFYING
INTERIOR NOISE SOURCES AND PATHS ON GENERAL
AVIATION AIRCRAFT
JAMEST. HOWLETT FO_. _I,EFEItENCE
DECEMBER 1979
I
NASANational Aeronaubcs andSpace Administration
LangleY Research CenterHampton, Virginia 23665
//
//
https://ntrs.nasa.gov/search.jsp?R=19800007614 2019-07-04T12:15:02+00:00Z


A STUDYOFPARTIAL COHERENCEFORIDENTIFYING INTERIORNOISE SOURCES
ANDPATHSONGENERALAVIATION AIRCRAFT
James T. HowlettNASALangley Research Center
Hampton, Virginia
SUMMARY
This paper describes the initial results of an effort Lo develop partialcoherence techniques for interior noise source/path determination in the highlycoherent environment of propeller-driven general aviation aircraft. Examplesillustrate the effects of measurement interference and the use of a two-channel,real-time analyzer for the analysis. The paper includes a summary of thecomputational techniques and illustrates their application to a two input,single output system with coherence between the inputs. Errors introduced intothe calculations by the method used for data analysis are discussed. Theresults illustrate the importance of using a simultaneous time base for thedata reduction and indicate the type of errors that can be encountered byfailure to observe this requirement.

INTRODUCTION
Effectiveproceduresfor controllinginteriornoise require identificationofthe noise sourcesand the noise transmissionpaths. Currentmethodsforaccomplishingthis are cumbersomeand time consuming, The difficultiesencounteredare particularlyevident in the highlycoherentenvironmentof apropeller-drivengeneralaviationaircraft. A new techniquefor efficient,reliabledeterminationof noise sourcesand paths along with the capabilitytorank order their importanceis needed.
Recent developmentsin computationalprocedureshave led to increasedinterestin partialcoherenceanalysesfor source/pathdetermination. The theoreticalaspectsof this method as developedby Dodds and Robson (ref. l) and furtherimprovedby Bendat (refs.2, 3, 4) are particularlyappropriatefor tl_investigation. Applicationsof these methods to diesel engines (refs.3, 6),a punch press (ref. 7), and a light aircraft (ref.8) have been reportedin theliterature. However, these previousauthorsreportedonly partialsuccessinidentifyingsources. Improvementsof the approachare felt to be needed beforethe method can be successfullyapplied to interiornoise problemsencounteredin propeller-drivengeneralaviationaircraft.
The purposeof this paper is to describe the latest resultsof an ongoing effortto develop partialcoherencetechniquesfor interiornoise source/pathdetermi-nation in the highly coherentenvironmentof propeller-drivengeneralaviationaircraft. The paper includesa summaryof the theoreticalmethod as developedby Bendat (ref. 2) and illustratesthe applicationto a two input, single outputsystem with coherencebetweenthe inputs. The augmentationof the calculationson a digitalcomputer interfacedwith a two-channelreal-timeanalyzerisdiscussed. The resultspresentedindicatepossiblesourcesof error in thecomputationsand suggestproceduresfor avoiding these errors.
DESCRIPTIONOF ANALYSIS
A schematicindicatingthe analyticalmodel of a physicalsystem used in partialcoherenceanalyses is shown in figure I, The physicalinputs consistsof anumberof time historieswhich have been directlymeasured on the physicalsystem under considerationand are assumedto representthe varioussourcesofinteriornoise. There may be variousdegreesof coherencebetweenthese inputrecordsas well as betweeneach of them and the output recordwhich has beendirectlymeasured also and is assumedto representthe interiornoise environ-ment (receiver). It is assumedthat none of these coherencesare identicallyone. If this occurs,the recordscontainredundant(or unnecessary)informationand some of the recordsshould be eliminatedfrom the analysis (ref. 2). Afterthe redundantrecordsare eliminated,the remaininginput recordsare ordered.Although the selectionof the order of these records is largelyarbitrary,oneprocedureis to choose the recordwith the highestcoherencebetween the inputand output as the first ordered input; the recordwith the next highestcoherenceis chosen as the secondordered input,and so forth.

Once the ordered inputs have been obtained_the rest of the analysis is usuallycarriedout in the frequencydomain, Conceptually,however,the processisequivalentto obtainingconditionedinputs in the time domain, The firstconditionedinput is identicalto the first ordered input, The second
_' conditionedinput,x2,1(t), is the second orderedinput with the effectsof
xl(t) removed. The third conditionedinput, x3,12(t),is the third ordered
input with the effects of xl(t) and x2(t) removed,and so on. The conditioned
inputsare then mutually uncoherent, Each conditionedinput record is assumedto be the input signal to an orderedtransferfunctionwhich relates thatparticularconditionedinput record to the output. The ordered transferfunctionsare not unique,but depend upon the particularorder used for theordered inputs. Equationsrelatingthe physicaltransferfunctionsto theorderedtransfer functionsmay be found in reference3. The relative effect ofeach ordered input on the output is given by an equationof the formSyy = IHI2Sxx (ref. 4).
As previously stated, the analysis is usually carried out in the frequencydomain. The first step is the calculation of the auto-spectra and cross-spectra for all possible combinations of the ordered inputs and the output.After these spectral functions have been calculated, the effects of the inputsare removed from the spectra. The formulas for removing the effect ofinput k from the auto-spectra and cross-spectra are shown in figure 2. Asindicated in the figure, the equation for Sii. k (auto-spectrum of ordered input i
with the effect of input k removed) has two forms. The form of this equation
which explicitly involves the coherence function, Y_k'. clearly demonstrates2that Sii. k _ 0 since Yik _ I. However, the other form of this equationinvolves multiplications, divisions, and subtractions of three differentspectra and it is entirely possible that small, statistically insignificantdifferences in the estimates of these spectra could result in the computationof negative numbers. The formula for Sij. k (cross-spectrum between orderedinputs i and j with the effect of input k removed) involves four differentspectra and is also subject to the kinds of errors just mentioned. Theformulas for removing the effects of more than one input are similar and may befound in the literature, e.g., reference 2.
Also shown in figure 2 is the partial coherence function Y_y.k (partialcoherence between ordered input i and the output with the effect of input kremoved). Note that partial coherence is simply ordinary coherence computedusing conditioned spectra and may be used to rank order the importance of theinputs. That is, it follows from the formula for the output due to ordered
input i with the effect of input k removed (fig. 2) that Y_y.k_< Y_y.kvimpliesordered input j producesa greater part of the output signal thanordered input i (with input k removed).
3

RESULTS AND DISCUSSION
Source Measurement Interference
The problem of source measurement interference provides a typical applicationfor partial coherence techniques, The analytical model for this problem isshown in figure 3, The two sources of noise are assumed to be uncoherent,Two microphones, M1 and M2, are used to measure the noise sources but becauseof measurement interference, the quantities actually measured are
MI: SII + klS22 and M2:$22 + k2Sll, where the parameters kI, k2 determine thecoherence between the input measurements. For the numerical example presented
herein, the coherence between the input measurements is ¥ 2 0,7, An
analytical transfer function is specified between each of the source inputsand the output. The auto-spectra shown in figure 3, along with the variouscross-spectra, were used in the computational algorithms to compute the partialcoherence functions between MI, M2, and the output, and estimate th_ previously
specified transfer functions, Figure 4 shows plots of two of the coherencefunctions for this test case. The ordinary coherence function between inFut 1and the output is nearly equal to 1 for frequencies up to 500 Hz and drops toa value of about 0.8 for frequencies between 700 Hz and I000 Hz. The partialcoherence function between input 1 and the output with the effect of input 2removed is identically I. This value is correct since, after the effectsof input 2 are removed, the model consists of a single input, single output,linear system.
Figure 5 shows a comparison of the exact and estimated transfer functions forthe test case. The first resonant peak of Hly at 400 Hz is determinedreasonably well by the estimated transfer function, The frequency of the
second resonant peak of Hly at 700 Hz is also determined accurately but theamplitude of the transfer function is somewhat overestimated at this frequency.
For H2y, the resonant peak at 400 Hz is also determined quite well by theestimated transfer function. However, at 700 Hz the estimated functionindicates a low amplitude resonant peak which is not present in the exact
expression for H2y. The presence of this peak in the estimated transferfunction is due partly to the coherence which exists between the inputs, M1
and M2, and partly to the difference between ordered transfer functions andphysical transfer functions. This result indicates that care must be exercisedin inferring the existence of resonant responses from a partial coherenceanalysis using experimental data for which measurement interference may exist,and for which the actual resonances are unknown. Although the amplitudes ofthe estimated transfer functions are somewhat in error, these transfer functionsdo correctly indicate the relative importance of the two inputs in this example,

ExperimentUsing Computer_AnalyzerInterface
In this test case, the use of a hard-wired,two-channelanalyzerwas investigated,_, A set of experimentaldata was obtained by simultaneouslyrecordingthe output
of a white noise generatoron threechannels of a tape recorder, These datawere consideredas a two input, singleoutput system with transfer functionsof
" unity betweeneach of the input signalsand the output, The data were analyzedon a desk top computerwhich was interfacedwith a two-channelanalyzerusingthe IEEE bus. This interfacewas straightforwardand presentedno particularproblems, However, the use of a two-channelanalyzerdoes have implicationsonthe subsequentdata analysis, This system dictatedthat only three spectracould be obtained simultaneously: two auto-spectraand the cross-spectrum.Thus, severalpasses of the data were requiredto obtain the necessaryspectra,Since it was impossiblewith the equipmentavailableto start the data analysisat preciselythe same spot on the analog tape every time, the actual spectraused in the analysiswere obtained from slightlydifferenttime segments. Thiswas found to adverselyaffect the accuracy of the results specificallyin thatvalues of coherenc_much greaterthan l were computed, As a measureof thisaccuracyloss, the ordinarycoherencefunctionshave been recomputedusing thespectrastored in the computerand comparedwith the coherencefunctionsfromthe two-channelanalyzerwhich were obtained as the data were processed, Itis felt that any additionalresultsobtained by futher processingof this datawill be no more accurate than these recomputedcoherencefunctions,
Figure 6 shows several examplesof these recomputedordinarycoherence
functions. As indicatedin figure6(a), Y_2.which was recomputedusing threespectraobtainedsimultaneously,displays the characteristicsexpected forthese coherencefunctions. Its value is very nearly l over most of thefrequencyrange. All of the coherencefunctions_forthis case shouldappear
virtuallyidenticalto the coherencefunction Y_2 shown in this figure, ifthe computationsare accurate.
The coherencefunction y_y shown in figure 6(a), which was recomputedwithonly two spectraobtained simultaneously,indicateserrors of about ±lO percent
(comparedwith y_2)._ Some of the values are greaterthan l and could lead tothe computationof negativevalues for the conditionedauto-spectrum. (See
recomputedwith none of the spectrafigure 2.) The coherencefunction y Yfrom simultaneoustime segments,shows large deviations (±30 percent)from thetrue value. Errors of this magnitudeobviatethe usefulnessof coherenceanalyses.
Figures6(b) and 6(c) show the effectsof increasingthe number of averages(figure6(b)) and increasingthe bandwidthof the analysis (figure6(c)) fora recomputedcoherencefunctionwith two spectraobtained simultaneously.As these figures indicate,increasingeither the number of averagesor thebandwidthof the analysisdoes have a smoothingeffect on the recomputedcoherencefunctions. However,the amount of data availablefor analysisor
5

the frequencyresolutionrequiredto separatedifferentsourcesmay easily makeeither of these approachesunfeasible.
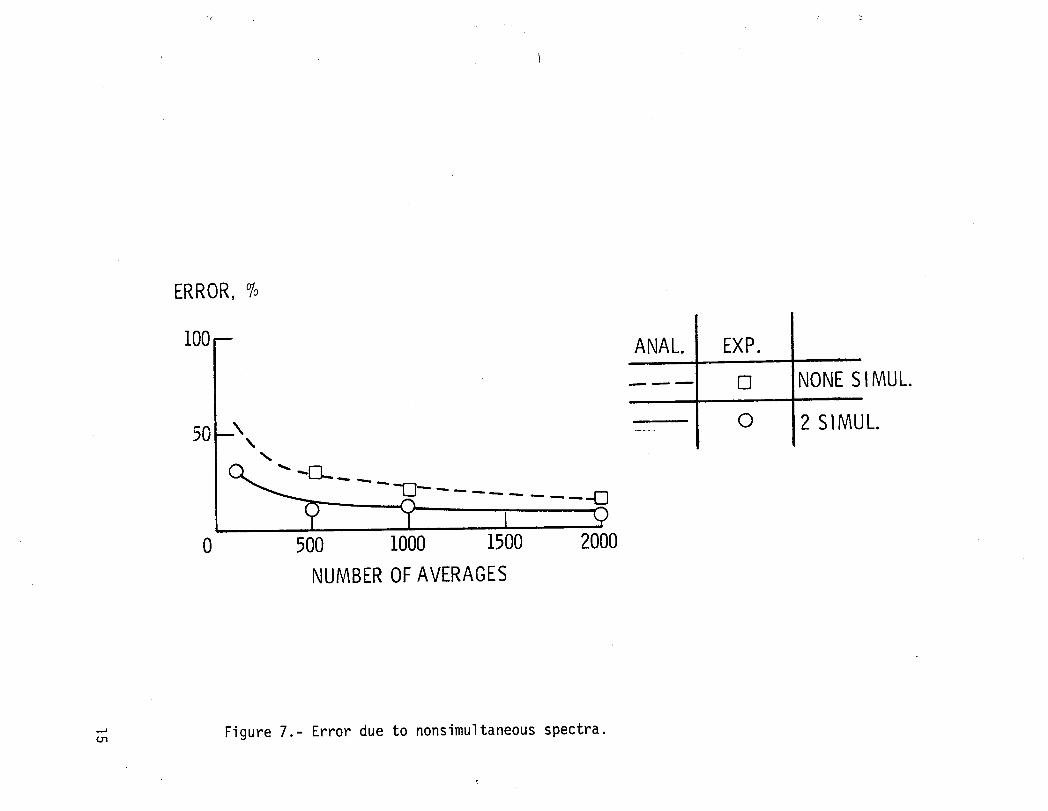
An error analysiswas conductedto determinethe source of the loss of accuracy.Standarderror formulaswere used to obtain 95 percentconfidenceintervalsfor the individualspectra (ref, 4), The worst combinationsof the numberssoobtainedwere then used in the equationfor calculatingcoherencefunctionstoobtain the actual errors, The resultsof this analysisare shown in figure 7,The solid curve in figure 7 shows the percentageof the error (whichmay beplus or minus) versus the number of averagesfor data with two spectraobtainedsimultaneously. The dashed curve shows the error for data with none of thespectraobtainedsimultaneously. Also shown on figure 7 are experimentalresultsfor two spectraobtained simultaneously(circles)and none of the spectraobtained simultaneously(squares). As the figure shows, the experimentalresultsare in good agreementwith this error analysis,
Although the data analysiscan be accomplishedusing a two-channelanalyzerwithno fewer than two spectraobtained simultaneously,such an approachwouldrequirereanalyzingthe same data severaltimes. This fact, togetherwith thelarge number of averagesrequiredto maintain reasonablysmall errors (saylO percent),suggeststhat alternativemethodsof analysis,such as simultaneousdigitizingof all data, would be preferred. In addition,the resultsof thisstudy indicatethat the calculationswhich must be performedin a partialcoherenceanalysisare quite sensitiveto such parametersas the number ofaverages and the bandwidthof the analysis.
CONCLUDINGREMARKS
This paper has describedthe initialresultsof an effort to developpartialcoherencetechniquesfor interiornoise source/pathdeterminationin the highlycoherentenvironmentof propeller-drivengeneral aviationaircraft. Examplesare shown to illustratethe effectsof measurementinterferenceand the use ofa two-channel,real-timeanalyzerto obtain the initialspectrarequiredfor theanalysis. Use of the two-channelanalyzer system illustratesthe importanceofobtainingall of the necessaryspectrafrom simultaneoustime segments. Failureto observe this requirementintroduceserrors of up to ±30 percent into thecomputations. Such errors may result in computedcoherencesmuch larger than I.Resultswere presentedshowingthat these errorscould be reducedby using alarge number of averages,up to 2000, in obtainingthe spectralestimates.Becausesuch a large number of averages is difficultor impossibleto obtain inpracticalexperimentalsituations,alternativemethods of analysis,such as thesimultaneousdigitizingof all data, are preferred.
An analyticalexampleof the measurementinterferenceproblemhas also beenpresented. The results indicatethat the estimatedtransferfunctionscan beused to determinethe relativeimportanceof the noise source inputs.
6

REFERENCES
. I, Dodds, C. J,; and Robson,J. D,; Partial Coherencein MultivariateRandomProcesses, J, Sound and Vibration_42(2), pp, 243_249_September1975.
2. Bendat,J. S,: Solutionsfor the Multiple Input/OutputProblem. J. Soundand Vibration,44(3), pp, 311-324, February1976.
3. Bendat,J, S.: System Identificationfrom Multiple Input/OutputData.J. Sound and Vibration,49(3), pp, 293-308,December 1976,
4. Bendat,J. S.: StatisticalErrors in Measurementof CoherenceFunctionsand Input/OutputQuantities, J. Sound and Vibration,59(3), pp. 405-421,August 1978.
5. Chung,J. Y.; Crocker,M. J.; and Hamilton,J. F.: MeasurementofFrequencyResponsesand the Multiple CoherenceFunctionof the Noise-GenerationSystem of a Diesel Engine. J, AcousticalSocietyof America,Vol. 58, No. 3, pp. 635-642, September1975.
6. Alfredson,R. J.: The PartialCoherenceTechniquefor Source Identificationon a Diesel Engine. J. Sound and Vibration,55(4), pp, 487-494,December1977.
7. Koss, L. L.; and Alfredson,R. J.: Identificationof TransientSoundSourceson a Punch Press, J. Sound and Vibration,34(I), pp, ll-13,May 1974.
8. Keefe, Laurence: InteriorNoise Path Identificationin Light AircraftUsing MultivariateSpectralAnalysis. AIAA Paper No. 79-0644, 5thAeroacousticsConference,Seattle,Washington,March 1979.

ORDERED
ACTUAL ORDERED CONDITIONED TRANSFERINPUTS INPUTS INPUTS FUNCTIONS OUTPUT
(t) x1 (t) x1 (t) =! H1 (f)
i
Xi I
xj (t) x2 (t) x2. l(t) _ H2 (f) \
xk (t) x3 It) I x3.12 It) _ H3 If) y (t)B
• • • Q
• .0 • .0
• L•o xN (t) XN.12 IN_l)(t) _ HN If)
x[ (t)
Figure I.- Schematic of partial coherence analytical model for multiple input system.

= CROSS-SPECTRUMFORORDEREDINPUTSi ANDj WITHEFFECTOFSij.k
INPUTk REMOVED
Sik Ski 2= - = (I-7 ik) S..
Sii.k Sii Skk 11
Sik Skj
Sij.k = Sij - Skk
2 = PARTIALCOHERENCEFUNCTIONBETWEENORDEREDINPUTi AND1,ly.k
OUTPUTWITHEFFECTOFINPUTk REMOVED
1 2 -
2 Isiy.kI_'_y.k: sii.ksyy.k
1,2 S = OUTPUTDUETOORDEREDINPUTi WITHINPUTk REMOVEDiy.k yy,k
Figure 2.- Calculationof conditionedspectraand partialcoherencefunctions.

o
S11,Pa
3- SOURCEI
m
IIH1yI- r c/y, Pa
0 1000 3 OUTPUTFREQUENCY,Hz "--
S22,Pa _ 21SOURCE2 "- j3 m
0 I000
2F- FREQUENCY,Hz
I H2y(f)1-
0 i000
FREQUENCY,Hz
Figure 3.- Analytical model for source measurement interference.

1.o COHERENCe1,_--__-..__2 .5-Y ly _
0
- PARTIALCOHERENCEly'2D
2
Y ,ly-2 .5_--m
D
m
, J I I I _ I v i J0 500 IO00
FREQUENCY,Hz
Figure4.- Coherencefunctionsfor sourcemeasurementinterferenceproblem.

,,.,.,.I
Ix)
1.0[- A EXACT/I ESTIMATE
Hly ..5-
J0 _ I
1.0-EXACT
.... ESTIMATE
H2y .5 -
o 500 Ilooo' FREQUENCY,Hz
Figure 5.- Transfer functions for source measurement interference problem.

2 2 2
12_ Y-ly Y ,2yCOHERENCE1,2 COHERENCE1,y
,.o_..__._._SPECTRA 2 SPECTRA _NOSPECTRA
o5
, I I I I I0 2500 5000 0 2500 5000 0 2500 5000
FREQUENCY,Hz FREQUENCY,Hz . FREQUENCY,Hz
(a) 500AVERAGES,2.5 HzBANDWIDTH
Figure 6.- Examples of accuracy loss in recomputed coherence due to nonsimultaneous spectra.

,,,,,a
2 2Y
I._io_c__,_ L_
e5 -- _
2 SPECTRA 2 SPECTRASIMULTANEOUS SIMULTANEOUS
I I I I I0 2500 5000 0 5000FREQUENCY,Hz FREQUENCY,Hz
(b) 2000AVERAGES,12.5Hz BANDWIDTH (c) 100AVERAGES,50 Hz BANDWIDTH
Figure6.- Concluded.
ERROR,%
I00 -- ANAL. EXP.
-- ---- [] _ONESIMUL.i i|
O 2 SIMUL.50-\ ......\
C_'_ ,,-[]]....,...,... ,., --"13 ........ -0
--7---@ , ,,0 500 I000 1500 2000
NUMBER OFAVERAGES
Figure 7.- Error due to nonsimultaneous spectra.


1. Report No. 2. Government Accession No. 3. Recipient's Catalog No.
NASATM-801974. Title and Subtitle 5. Report.Date
December 1979A STUDYOF PARTIAL COHERENCEFOR IDENTIFYING INTERIOR 6. Performing Organization CodeNOISE SOURCESAND PATHSONGENERALAVIATION AIRCRAFT
7. Author(s) 8. Performing Organization Report No.
James T. Howlett._ 10. Work Unit No.
_, 9. Performing Organization Name and Address 505-33-53-03
NASALangley Research Center 11 Contract or Grant No.
Hampton, Virginia 23665
13. Type of Report and Period Covered
12. Sponsoring Agency Name and Address Technical MemorandumNational Aeronautics and Space Administration 14. Army Project No.Washington, DC 20546
15. _pplementary Notes
Paper presented at the 98th Acoustical Society of America Meeting, Salt Lake City,Utah, November 26-30, 1979.
16. Abstract
Effective interior noise control procedures require identification of the noisesources and the noisetransmission paths. Recent developments in computationalprocedures have led to increased interest in partial coherence analyses for source/path determination. However, the practical application of partial coherencetechniques is not straightforward and an improved understanding of the approach isneeded. This paper describes the latest results of an ongoing effort to use partialcoherence for interior noise source/path determination. The paper includes a summaryof the computational techniques as developed by Bendat (J. Sound & Vib., 49(3), 1976,pp. 293-308) and illustrates their practical application. A numerical example isincluded to illustrate one difficulty in applying partial coherence and a suggestionfor circumventing this difficulty is offered. The augmentation of the calculationson a digital computer interfaced with a two-channel real-time analyzer is alsodiscussed.
17. Key Words (Sugg_ted by Author(s)) 18. Distribution Statement
Interior noise control procedures,Noise sources, Noise transmission paths, Unclassified - UnlimitedPartial coherence analyses
Subject Category 71
19. Security Classif. (of this report] 20. Security Classif. (of this page) 21. No. of Pages 22. Price"
Uncl assi fied Uncl assi fi ed 15 $4. O0
"For sale by the National Technical Information Service, Springfield, Virginia 22161