infrastructure investments - ey.com · infrastructure investments 3 in today’s low-yield...
TRANSCRIPT
Infrastructure investments An attractive option to help deliver a prosperous and sustainable economy

ContentsExecutive summary03
Introduction04
Current state of the infrastructure investments market07
The evolving regulatory climate — current requirements and Solvency II12
Operational management of infrastructure assets17
Appendix21
Conclusion22

3Infrastructure investments
In today’s low-yield environment, insurers are under increasing pressure to source additional investment return. Infrastructure investments may present an opportunity for insurers to achieve the required yields to cover future liabilities and provide competitively priced products. This is due to the fact that typical loans have historically outperformed comparative traditional investments.
In particular, the treatment of infrastructure loans under risk-based capital regulatory regimes, such as Solvency II, could be attractive relative to more traditional institutional investments. However, one should note that, although the capital charge may not necessarily inhibit this investment, a treatment that reflects the underlying economic risk of the asset class will likely enable insurers to commit more money to the sector.
Infrastructure investments are an interesting option for an insurer’s portfolio, as they provide:
• Potentially lucrative risk-adjusted return on equity
• Long-term risk exposure, which may provide a good match for long-term liabilities
• Illiquidity and sector-diversity, which could increase portfolio diversification
• An opportunity to lend money to sectors in need of funding, leading to social and potentially reputational benefits
There are practical issues, however, which an insurer should consider prior to investment, including:
• Determining whether margins are sufficient to cover the costs and risks associated with operational complexities, such as sourcing, managing and pricing infrastructure investments
• Putting in place suitable processes to assess and manage infrastructure debt investment
• Investing in infrastructure that is best suited to their balance sheet and risk profile (these opportunities have been limited because issuances have historically been influenced by banking requirements)
As a result of these considerations, the insurance industry has made only a marginal investment in the infrastructure sector in recent years. However, there is increasing interest as insurers find that the benefits of infrastructure assets outweigh the apparent costs relative to the low yields available on more traditional investments.
The typical annual benchmark spread achieved by infrastructure investments is comparable to A- and BBB-rated corporate bonds of a similar duration (as indicated by our analysis in this paper) with spreads ranging from 125–160bps for non-publicly rated private finance initiative (PFI)/public private partnership (PPP) infrastructure considered of A to BBB
Executive summary
credit quality by lenders. These relatively competitive spreads may be seen as attractive, with our analysis indicating that the achievable return on equity may be greater than that for A- or BBB-rated corporate bonds of a comparable duration under the Solvency II regulatory regime.
However, the source of preferred insurer investments has been limited. Increased interest in a concentrated sub-sector of the market has contributed to tightening margins on the most attractive investment opportunities. Therefore, insurers should understand the requirements of the infrastructure market to suitably influence the availability and attractiveness of investments.
In this paper, we have identified a selection of historic deals and pipeline opportunities which may be well suited to an insurance investor. We explore the operational complexity of such an investment, and analyze the materiality of such risks, including the possible mitigation options available to insurers.

4 Infrastructure investments
The definition of the infrastructure asset class can be very broad. One definition is “facilities or structures required for the effective operation of a business, state or economy.” In this paper, we define infrastructure to include roads, railways, airports, power generation and transmission, ports, communications, water and waste, together with social infrastructure, such as hospitals, schools
Introduction
Types of infrastructure
Description Examples
Greenfield or brownfield
Greenfield projects involve an asset or structure that needs to be designed and constructed, where no infrastructure or building previously existed. Investors fund the building of the infrastructure asset and the maintenance when it is operational.
The Gemini offshore wind farm project involves the construction of two wind farms with a combined capacity of 600MW in the North Sea, off the coast of the Netherlands. It has an estimated completion date of Q4 2016 and a value of $3.35b.1
Brownfield projects involve an existing asset or structure that requires improvement, repair or expansion (i.e., land where a building or construction already exists). The infrastructure asset or structure is usually partially operational and may already be generating income.
The 7.5km road improvement of the A556 trunk road between Knutsford and Bowdon in the UK, creating a modern dual carriageway road. The improvement works are expected to be completed by 2017 at a cost of between £165m and £221m.2
Construction (primary) or operational (secondary) phase
Primary infrastructure investments are those made at the pre-operational or construction phase, before most revenue is generated. Higher risk is associated with construction-phase projects due to completion and usage risks.
The risk-return profile of infrastructure, which is complex to construct, is similar to high-risk venture capital projects. However, the risks involved in projects with a more typical construction phase (such as schools and hospitals) are often bank-debt funded, and are lower risk than speculative construction projects given that they are subject to greater controls. Note that a primary investment could be either greenfield or brownfield.
The Johan Sverdrup Oil Field Development in Norway, which is expected to be completed in Q4 2019. The cost of the development is $28.6b and involves installation of four fixed platforms and infrastructure to export oil and gas.3
Secondary infrastructure investments apply to the operational stage of a project. There is a lower risk as construction has been completed and usage levels have been established; the risk also reduces over time if the project has proven to be revenue generating. This phase offers reliable long-term returns, although it still carries significant ongoing management challenges. Note that a secondary investment could be either greenfield or brownfield.
The Marmaray Project is a 76km subterranean railway development under the Bosporus Strait in Turkey. The project began in 2004, with the initial phase completed in 2013, following multiple delays due to archaeological sensitivity.4
Availability- or demand-based
Availability-based projects are typically where the government, or some other sponsor, procures essential facilities or services in return for payments linked to availability rather than usage levels (this obligation is defined in the terms of the investment contract).
Availability-based investments are typically lower-risk investments whereby equity cash flows can be debt like in their certainty and timing given that the exposure is to the sponsor rather than the profitability of the project. There is often an element of performance risk in the cash flows of availability-based projects, typically via performance-related deductions from the composite payment. Projects usually include schools, hospitals and government accommodation.
The Gystadmarka Secondary School PPP project in the Ullensaker Municipality, Norway, is an example of a greenfield availability-based project.5
Demand-based projects are where the investor bears the revenue risk of the project (i.e., the investor’s income relies on the ability of the project to generate cash). These projects vary widely in risk profile; often they have inflation-linked returns with greater exposure to economic risk and tend to be long term, hence uncertain in the future.
The Pedemontana Lombarda Highway in Italy is a demand-based project and is under the management of Italian concession company Autostrada Pedemontana Lombarda. It is a brownfield project with an estimated value of $6.3b.6
and housing. There are a number of different types and common characteristics of infrastructure investments, with opportunities in the pipeline that may be attractive to an insurer.
Several common distinctions within the infrastructure asset class are highlighted in Figure 1.
Figure 1: Different types of infrastructure asset classes

Types of infrastructure
Description Examples
Corporate entities or concession structures
Corporate entities include utility companies, toll road operators and airport companies, whose revenues are either economic or regulated. Many infrastructure corporate entities generate revenues that are broadly linked to inflation. Corporate entities tend to be less leveraged than concession structures and debt is typically more liquid (due to higher volumes of debt issuance in the market).
The M6 toll road in the UK was opened in December 2003. Midland Expressway Limited (MEL) is a private company with a government concession to design, build, operate and maintain the 27 miles of the M6 toll road until 2054.7
Concession structures involve debt which is typically secured on physical assets or contracts. Some concession structures also provide for index-linked cash flows, which can be financed by index-linked bonds. Included within concession structures are government initiatives, such as PPPs and PFIs:
• PPPs help transfer financing risk of major infrastructure developments from the public to the private sector. Infrastructure has been developed through PPP models worldwide.
• The PFI method is a form of PPP initially developed by Australia and the UK and adopted in a number of European countries. It is the most common method of using private capital to finance public infrastructure projects. The sectors within the infrastructure portfolio that fall under the UK Government’s PFI regime are education, healthcare, social housing and the Ministry of Defence.
Such projects are characterized by a long-term commitment from the public sector to pay a pre-agreed income, so long as a certain public service is delivered according to specification. This service is typically delivered by a private sector operator and, as such, payments made may be affected subject to operator performance.
According to 2014 government summary data,8 there are 728 PFI projects in the UK, of which 671 are operational. The capital value of these PFI deals totals £56.6b, an increase of £2.4b from 2013. An example of a PFI project currently in operation is the Oldham Sheltered Housing PFI Project, worth £400m over a 30-year concession period.
An example of a PPP project in Europe is the Marseille L2 Motorways project in France. The financing for this availability-based PPP was confirmed in October 2013 and was the largest infrastructure financing in France in 2013.9
Debt or equity investment
Debt is usually secured on physical assets and/or contracts and as such the cash flows are generally stable and secure. Debt will typically make up 80%–90% of a project’s capital requirement. There are typically a number of borrower options embedded in projects which add to the operational complexity of these investments. For example, prepayment risk exists with debt investments, which can be mitigated via a suitable Spens clause.
The 80MW Kizildere III Geothermal Plant project in Turkey has a debt to equity financing ratio of 89:11. Equity financing of $30m is to be provided by the Zorlu Group, with $250m of debt financing to be sourced.10
Equity investors receive the remaining cash flows from projects after deducting operating costs and income used to service debt investors. Thus, equity investors have a leveraged exposure and are subject to more volatile cash flows and asset valuations.
Equity will typically comprise 10%–20% of a project’s capital requirement. Equity is frequently structured as subordinated debt and may be provided by a financial investor, as opposed to an operator or sponsor.
The 22.66MW Reckahn 1 Solar PV Plant in Germany has a debt to equity ratio of 90:10. Debt financing of $63m is to be provided by BayernLB, with $8m of equity financing from Commerz Real AG.11
5Infrastructure investments
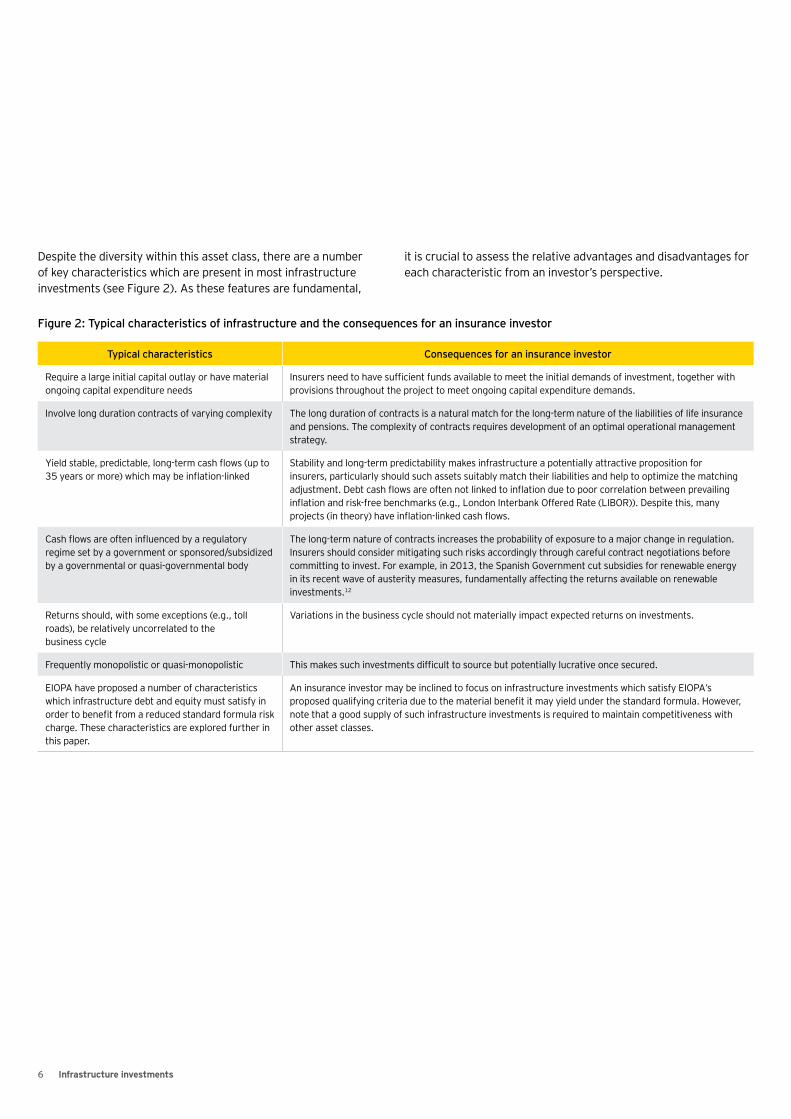
Despite the diversity within this asset class, there are a number of key characteristics which are present in most infrastructure investments (see Figure 2). As these features are fundamental,
Typical characteristics Consequences for an insurance investor
Require a large initial capital outlay or have material ongoing capital expenditure needs
Insurers need to have sufficient funds available to meet the initial demands of investment, together with provisions throughout the project to meet ongoing capital expenditure demands.
Involve long duration contracts of varying complexity The long duration of contracts is a natural match for the long-term nature of the liabilities of life insurance and pensions. The complexity of contracts requires development of an optimal operational management strategy.
Yield stable, predictable, long-term cash flows (up to 35 years or more) which may be inflation-linked
Stability and long-term predictability makes infrastructure a potentially attractive proposition for insurers, particularly should such assets suitably match their liabilities and help to optimize the matching adjustment. Debt cash flows are often not linked to inflation due to poor correlation between prevailing inflation and risk-free benchmarks (e.g., London Interbank Offered Rate (LIBOR)). Despite this, many projects (in theory) have inflation-linked cash flows.
Cash flows are often influenced by a regulatory regime set by a government or sponsored/subsidized by a governmental or quasi-governmental body
The long-term nature of contracts increases the probability of exposure to a major change in regulation. Insurers should consider mitigating such risks accordingly through careful contract negotiations before committing to invest. For example, in 2013, the Spanish Government cut subsidies for renewable energy in its recent wave of austerity measures, fundamentally affecting the returns available on renewable investments.12
Returns should, with some exceptions (e.g., toll roads), be relatively uncorrelated to the business cycle
Variations in the business cycle should not materially impact expected returns on investments.
Frequently monopolistic or quasi-monopolistic This makes such investments difficult to source but potentially lucrative once secured.
EIOPA have proposed a number of characteristics which infrastructure debt and equity must satisfy in order to benefit from a reduced standard formula risk charge. These characteristics are explored further in this paper.
An insurance investor may be inclined to focus on infrastructure investments which satisfy EIOPA’s proposed qualifying criteria due to the material benefit it may yield under the standard formula. However, note that a good supply of such infrastructure investments is required to maintain competitiveness with other asset classes.
Figure 2: Typical characteristics of infrastructure and the consequences for an insurance investor
6 Infrastructure investments
it is crucial to assess the relative advantages and disadvantages for each characteristic from an investor’s perspective.

7Infrastructure investments
Current state of the infrastructure
investments market
Insurers have become more willing to take on new investment risks and are likely to consider perceived lower-risk availability-based (or social) senior infrastructure debt assets. In particular, they are attracted to infrastructure assets provided through PPP and PFI models, as these are issued by sub-sovereign entities and provide implicit government support. The relative security of these investments is somewhat dependent on the sub-sovereign entity, with certain sectors (e.g., school and hospital trusts) facing substantial political pressure not to fail. The safety of such investments under a stressed scenario is difficult to determine, as it is partly reliant on the actions and priorities of the relevant government.
UK insurers intend (and have already begun) to invest approximately £25b in infrastructure investments between 2013 and 2018.13 A recent example is the £200m Consumer Price Index (CPI)-linked bond purchased from the Greater London Authority by Rothesay Life, which is the UK’s first CPI-linked sterling bond.14 This deal demonstrates how infrastructure investments can provide natural inflation hedges, which could be attractive for insurers wishing to match inflation-linked liabilities.
As the demand for infrastructure loans has increased, however, the available yield has narrowed significantly. This has led some insurers to consider investment in infrastructure loans that carry greater risk. For example, insurers have started to fund infrastructure loans during both primary and secondary phases of projects; in particular, their preference for long-term lending encourages providing funds through both phases.
Loans are typically issued for the entire term of a project; though, it is often the case that private equity companies (or the equivalent)
provide financing for the primary phase and capital markets finance the secondary phase. Capital markets are comfortable accepting the project risk during this phase because of the collateral (i.e., the underlying infrastructure asset).
A comparison to traditional assetsThe Infrastructure Index (produced through EY proprietary analysis of Reuters data) shown in Figure 3 has been constructed as the average spread of five infrastructure bonds across different sectors. It is indicative of the performance of a typical infrastructure asset that an insurer may invest in, specifically PFI/PPP infrastructure assets rated A to BBB. The average term of the Infrastructure Index is 20 years. It is important to note the challenges in constructing such an index due to the limited availability of data. This is relevant to investors, as they may be faced with limited information when committing to infrastructure investments.
Figure 3 shows the available spread for typical assets which an insurance company may hold. It is interesting to note that the spread of the Infrastructure Index at 1 March 2015, constructed from a number of infrastructure bonds, falls between the annual benchmark spread available on A- and BBB-rated corporate bonds for terms of 10–15 years.15 This suggests that the spread available from infrastructure investment is competitive when compared to other more traditional assets despite the narrowing of spreads since the beginning of 2014.
The comparison is with respect to infrastructure bonds, as opposed to infrastructure loans. It is likely that investments in infrastructure loans would be rewarded with an additional illiquidity premium, given that loans are not publicly listed, so less information is readily

8 Infrastructure investments
available to prospective investors. This additional premium may reflect the fact that infrastructure loans may be structured in a more flexible way as they do not have to meet the rating agencies’ strict criteria.
Since early 2014, there has been an estimated 12% decline in the Infrastructure Index, indicating that spreads available on infrastructure bonds are narrowing. This trend is broadly consistent with other recently observed issuances. In particular, after the first quarter of 2015, spreads on non-publicly rated PFI/PPP infrastructure considered to be of A- to BBB credit quality by lenders broadly range from 125–160bps, based on proprietary knowledge, for assets with terms typically between 15 to 25 years. Spreads on other infrastructure debt could vary anecdotally from as tight as 40bps to as wide as 260bps, depending on the sub-sector, rating, tenor and whether the issue is private or public. Such tight spreads are typically observed in energy, utilities and transport. For example, the Mersey Bridge bond issued in the UK matures in 2043 and trades at c.38bps,16 which is reflective of both the AA rating of the bond and its positioning within the transport sector.
Furthermore, Figure 4 provides a high-level indication of how infrastructure investments may compare to other illiquid assets, as well as more traditional investments, in terms of return and duration. The figure indicates that infrastructure investments could increase portfolio diversification. Investment provides returns similar to other illiquid loans; however, it rewards the investor with a longer duration of returns, which may suitably match particular liabilities.
Par gilt curve
Equity releasemortgage loan
Student housing loan
UK RMBS AAA
EM debt
Aviation bond
High-yield bond
Infrastructure loan Social housing loan
Res. mortgageloan
CRE loan
CMBSAAA
Infrastructure loans Real estate-backed loans Other asset-backed securities Other unsecured assets
Privateplacement loan
Ground rent
0%
1%
2%
3%
4%
5%
6%
0 5 10 15 20 25 30 35
Estim
ated
retu
rns
p.a.
Indicative modified duration
Figure 3: Typical annual benchmark spread on infrastructure investments compared to traditional assets
0
50
100
150
200
250
300
350
Dec
10
Mar
11
Jun
11
Sep
11
Dec
11
Mar
12
Jun
12
Sep
12
Dec
12
Mar
13
Jun
13
Sep
13
Dec
13
Mar
14
Jun
14
Sep
14
Dec
14
Mar
15
Ann
ual b
ench
mar
k sp
read
A-rated corporate bond(annual benchmark spread)
BBB-rated corporate bonds(annual benchmark spread)
Infrastructure Index (z-spread)
Figure 4: Infrastructure investments compared to other illiquid assets 31 December 2014
Source: Published by the Institute and Faculty of Actuaries working party on non-traditional assets. “Documents,” Actuaries, http://www.actuaries.org.uk/research-and-resources/documents/non-traditional-investments-key-considerations-insurers-long-versio, accessed 17 April 2015

9Infrastructure investments
Recent activity in the infrastructure marketFigure 5 provides insight into recent activity in the infrastructure market where an insurance company has played a pivotal financing role over the past two years. This suggests that infrastructure investments are topical, achievable and potentially lucrative for insurers should the right project become available. It also
demonstrates that not only can infrastructure investments provide diversification between asset classes, but there is significant diversification within the asset class. In particular, infrastructure investments can be diverse by structure, geography and exposure within an insurer’s portfolio.
Figure 5: Recent insurance company activity in the infrastructure market
Date Country DealInvesting Insurance Company
Type Size
Jan 15 Belgium Bus Depot Cluster II. 32-year contract involving the construction of four depots.17
AG Insurance Primary financing transport PPP with a 32 year concession period. Financing of €60m inclusive of a €30m contribution from AG Insurance.
€60m
Jan 15 Netherlands Limmel Lock PPP. Pilot of a nation-wide program for the construction of four other locks.18
AG Insurance Primary financing PPP for improvements to the limmel lock. Tranche value of €31m with a tenor of 33 years, €16m of which provided by AG Insurance.
€31m
Jul 14 UK Stoke Extra Care Housing PFI19 Aviva Senior debt package with a 25-year tenor (from the start of construction). First UK housing deal financed by Aviva
£65m
Jun 14 UK Alford Community Campus20 Aviva Primary financing PPP, senior debt due in 2038 £27m
Jun 14 Ireland N17/N18 Motorway, Ireland21 Aviva Primary financing for roads. Funded by monthly availability payments over a 25-year contract. Motorway due to come into operation in late 2018. Aviva provided a €10m debt-credit facility.
€10m
Feb 14 UK M8, Scot Roads Partnership Finance22
Allianz Availability-based road project, senior secured fixed-rate bonds due 2045
£175m
Oct 13 France Marseille L2 Motorways23 Allianz Availability-based road PPP, unwrapped bond, largest infrastructure financing in France in 2013.
€163m
Aug 13 UK Thameslink Rolling Stock PPP24 ING Major european PPP transaction financed by 20 lenders, including £37m from ING. Note that the debt facilities were refinanced in February 2015, resulting in a reduction of the initial loan margin at original financial close in 2013 from 260bps to 120bps.
£37m
Apr 13 UK Drax Power Station25 Friends Life Amortising loan facility PPP maturing in 2018, underpinned by UK treasury through the Infrastructure UK guarantee scheme
€90m
Jan 13 France French Prison PPP packages (Lot A and Lot B)26
Ageas Ageas provided the long-term facility (the daily tranche) in partnership with Natixis, following a partnership agreement set up in October 2012.
Share of £259m
Pipeline for the futureThe appetite of traditional lenders for investment in infrastructure has fallen in recent years. In particular, with the reassessment of the risk culture inherent within the banking industry, banks are wary of committing to long-term loans. They are also reluctant to take on credit risk, even where probability of default (PD) and loss given default (LGD) are as low as might be expected in infrastructure loans.
It is interesting to note that, historically, the structuring of senior debt for the bank market has resulted in infrastructure transactions below investment grade, resulting in more attractive senior funding from the perspective of equity holders and sponsors. However, given the changes in regulatory capital requirements for banks, it has become more expensive in capital terms for banks to hold

10 Infrastructure investments
long-tenor loans. Additionally, local regulators are focusing on how banks model low-default portfolios. It is likely that opportunities for insurance investors in this sector will increase as equity holders and sponsors find the cost and availability of bank debt less attractive. In spite of this, the challenge in accessing suitable secondary phase opportunities remains. A potential solution is to explore restructuring options with full legacy bank portfolios, for instance making derivatives and securitizations more attractive to an insurer.
According to research published by McKinsey Global Institute in March 2014, it will cost a total of $57t to build and maintain the world’s infrastructure requirements between 2013 and 2030. However, insurance companies worldwide currently allocate approximately 2% of their assets under management to infrastructure investments.27 This appears low considering the natural match between long-term liabilities and corresponding cash flows.
However, recent austerity measures have led to reduced government spending on capital investments (including funding new infrastructure projects and maintaining existing ones). For example, in the UK, spending fell by 26% from a high of £57b in 2009–10 to £42b in 2013–14, according to statistics provided by the National Audit Office.28 The drop in UK government investment in infrastructure is mirrored across Europe, with similar measures being enforced by governments across the Continent.
Given the fall in sovereign spending on infrastructure, a relevant consideration is that the limited availability of the types of loans that insurers may prefer to invest in could be a significant inhibitor to investment in the asset class. In general, insurers prefer long-dated PPP or PFI loans with availability-based returns, where the underlying asset is fully operational. This is likely due to the greater stability of returns and potentially simpler operational management. Currently, there is a limited supply of these secondary phase assets, and, due to market competition, the yields are low on new assets that are likely to be suitable for insurance investors.
As a result, insurers are looking at more complex or risky infrastructure investments with potentially more lucrative returns, such as infrastructure equity. These could be particularly attractive for participating insurance products or unit-linked funds, where mandates and unit offerings permit investment in infrastructure assets due to the higher risk-adjusted returns typically available. Furthermore, insurers’ general accounts could also enjoy the higher risk-return profile of this investment structure relative to infrastructure debt.
Despite the apparent reduction in sovereign support for infrastructure investment, there are other significant sponsors, which should lead to a healthy future pipeline of debt in Europe. In December 2014, the European Commission (EC) and European Investment Bank (EIB) announced their intention to form a partnership to deliver the Investment Plan for Europe. This aims to bring at least €315b of investment in European infrastructure between 2015 and 2017, primarily from the private sector, through the promise of substantive risk support to investors.29
Part of the plan would see a more transparent pipeline of investments, a concept that would be welcomed by many insurers who would like to see governments and central banks within Europe provide greater transparency over future projects that require funding. At present, there is limited transparency on the volume of these projects, even in the short term, making it difficult to commit long-term financing. For example, Infrastructure UK, a unit within the Treasury working on the long-term infrastructure priorities of the UK, has published a pipeline in a bid to attract private investors.30 This, however, has its limitations and provides summary statistics rather than the details a prospective investor may require.
Figure 6 provides a pipeline of future deals and insight into some of the opportunities across Europe which may be attractive to insurance companies seeking to invest in infrastructure.
Date Country Deal Type Size
Earliest construction: 2018Forecast date in service: 2021
UK Deep sea container terminal at Bristol Port on a brownfield site in Avonmouth docks31
Private sector funded £600m
Earliest construction: 2019/20Forecast date in service: 2023/24
UK River Thames Scheme (Datchett to Teddington) — capacity improvements and flood channel32
Funding strategy being developed £300m
Earliest construction: 2016Forecast date in service: 2023
UK Construction of tunnel as part of Thames Tideway Tunnel Main33
Flexible financing structure with probable Government Support Package (GSP)
£4056m
Figure 6

11Infrastructure investments
Date Country Deal Type Size
Launch for tender in April 2015 Turkey 302MW Turkey Solar PV Project34 Primary financing (specifics to be determined)
TBC
Earliest construction: 2015Forecast commercial operations: 2018
Poland 220MW Zabrze Multi-Fuel Combined Heat and Power Plant35
Primary financing for greenfield power plant (specifics to be determined)
€200m
Tender launch in 2015, financing TBC Norway Gystadmarka School PPP36 Primary financing for greenfield secondary school
TBC
Operator selection in 2016with private sponsor to propose financing structure
Lithuania Marvele Cargo Port PPP37 Primary financing for greenfield port
€11m
Service provider to be selected in 2015 and will determine the financing of the project through a 15 to 20 year concession period
Finland E18 PPP Hamina-Vaalimaa — 32km four-lane motorway leading to the Russian border on a Greenfield site38
The project is likely to be procured as a PPP.
TBC
Currently under appraisal Germany A6 Wiesloch-Rauenberg to Weinsberg PPP39
Likely to be procured as a PPP. Service provider will determine the financing of the project through a 30-year concession period.
€250m from the EIB plus undisclosed additional amount
Currently under appraisal Spain Court of Justice Madrid PPP — comprises the design, construction, financing and facility management of a new Court of Justice in Madrid40
Likely to be procured as a PPP. Service provider will determine the financing of the project through a 30-year concession period.
€510m
Beyond Europe, a recent development in the market for infrastructure financing is the introduction of the Asian Infrastructure Investment Bank (AIIB), an institution proposed by China to facilitate the financing of infrastructure projects in Asia with a view to being fully operational by the end of 2015. With 57 founding members (including France, Germany, Portugal, Poland, Italy, Switzerland and the UK), the AIIB has the scope to be a powerful and effective institution investing in infrastructure in less-developed areas. The demand for financing could be substantial. European insurers could look to the AIIB as an alternative source of investment opportunities and may also increase diversification within existing infrastructure portfolios. Foreign investors in the Asian market (such as European insurers) may wish to consider suitable currency hedging strategies to protect against adverse exchange rate volatility.
Alongside the introduction of the AIIB, a co-advisory initiative between the Asian Development Bank (ADB) and eight international commercial banks was agreed in May 2015. This initiative aims
to increase the level of private funding in critical infrastructure projects in Asia and has the potential to improve availability of suitable investments for insurers.
In addition to this, the G20’s Global Infrastructure Initiative (announced in November 2014) is designed to support public and private investment in infrastructure in both G20 and non-G20 countries by helping to match prospective investors with suitable projects and lowering barriers to investment. This will be implemented with the help of the Global Infrastructure Hub, to be located in Australia with an initial four-year mandate. This initiative will complement the aims of the Global Infrastructure Facility, which intends to help prepare and structure high credit quality infrastructure projects and ultimately integrate the efforts of banks, governments and institutional investors.41

12 Infrastructure investments
The evolving regulatory
climate — current requirements and
Solvency II
Regulation and legislation for infrastructure investments is evolving. In the UK, the Infrastructure Act 2015, implemented in February 2015, expanded on the financial assistance that the UK Government would provide for particular infrastructure projects. Further, recent European legislation has focused on sustainable growth, with energy infrastructure at the forefront of the flagship initiative “A resource-efficient Europe,” launched in 2011. This initiative underlined the need to urgently upgrade Europe’s networks and improve interconnectivity, with particular emphasis on integrating renewable energy sources.
As part of the initiative, the EC aims to facilitate the timely implementation of projects and provide rules and guidance for the cross-border allocation of costs and risk-related incentives for projects of common interest. There is considerable support for infrastructure investments should they meet the EC criteria, which is a noteworthy consideration for insurers looking to invest. Since then, as highlighted previously, the EC has outlined plans to invest an estimated €315b in European infrastructure.42
Furthermore, the EC requested that the European Insurance and Occupational Pensions Authority (EIOPA) investigate the specific treatment of infrastructure investments under Solvency II for supervisory reporting purposes in Europe, which we explore further in this paper. Clearly, EIOPA is another regulatory body that could have a profound impact on the suitability of future infrastructure investments for insurers.
Solvency II considerationsInsurers can use either the standard formula or an internal model approach to calculate capital requirements, where the standard formula is prescribed in the Solvency II legislation and an internal model approach requires approval from the local regulator.
A key consideration for insurance companies investing under Solvency II is the relative capital efficiency (and return on capital) for different assets. The capital charge on an insurer’s assets is an addition made to a company’s liabilities to suitably accommodate for risks inherent in its investments (for example, currency and interest rate risk).
Under Solvency II, the capital charge itself should not be seen as an inhibitor to investment in infrastructure; however, we would expect that a treatment better reflecting the underlying economic treatment would enable insurers to commit more money to the sector.
The full benefit of investment in infrastructure should be assessed on a return-on-capital metric, as opposed to merely the available spread. In particular, return-on-capital appeals to insurers where infrastructure loans provide a higher (or equivalent) yield relative to equivalent corporate bonds (in terms of rating and duration), but carry a similar (or lower) capital charge.

13Infrastructure investments
Analysis of the standard formulaThe following analysis is based on the Solvency II standard formula and provides an indicative comparison of return on capital and the potential efficiency of infrastructure loans relative to other asset classes.
Given the significance of UK annuity companies (and other long-term insurers with annuity type liabilities) as potential funders for European infrastructure, we have considered a specific case for these companies. Under Solvency II, these long-term insurers can benefit from a matching adjustment, an addition to the risk-free rate used to discount liabilities (and therefore reduce them), since they can buy and hold investments to match their liability cash flows. Insurers can take this benefit only if the assets have suitably fixed cash flows.
This analysis is presented under two scenarios: with and without the matching adjustment. The following assumptions have been made:
• Returns on corporate bonds are based on benchmark bond indices with constituents of terms from 10 to 15 years.
• The indicative annual return on the infrastructure bond is based on our constructed Infrastructure Index weighted by the market capitalization of each of the five infrastructure bonds which compose the Infrastructure Index. The term of this index is 20 years and the constituents are sinking bonds (i.e., bonds whereby the issuer is required to buy a certain amount of the bond back from the purchaser at various points throughout the life of the bond).
• The indicative annual return on the infrastructure loan is based on the Infrastructure Index used for infrastructure bonds, with additional market illiquidity of loans relative to bonds being accounted for.
• It is assumed that the duration of the bond indices and the Infrastructure Index is approximately 10 years.
• The annual return on equity applies to the full outlay for investment, and is inclusive of the value of the bond at purchase, plus the capital held based on the duration of the asset.
Asset typeAnnual return (as of 31 Mar 15)
Indicative capital charge (based on the standard formula without matching adjustment)
Annual return on equity (without matching adjustment)
Indicative capital charge (based on the standard formula with matching adjustment)
Annual return on equity (with matching adjustment)
A-rated corporate bond 3.17% 10.50% 2.87% 6.30% 2.98%
BBB-rated corporate bond 3.40% 20.00% 2.83% 15.00% 2.96%
Infrastructure bond (A/BBB-rated)
3.51% 10.50% 3.18% 6.30% 3.30%
Infrastructure loan (unrated)
3.91% 23.50% 3.17% 17.63% 3.32%

14 Infrastructure investments
A future standard formula calibrationThe EC has asked EIOPA to investigate the possibility of a specific standard formula calibration for the asset class with the aim of encouraging insurers to invest in infrastructure to benefit the wider European economy. EIOPA believe that there is evidence to suggest a sound method could be developed to specify the treatment of certain infrastructure debt and equity investments in standard formula risk charges, subject to the investments satisfying a number of proposed qualifying criteria. We outline below some of the suggested potential requirements:
• Externally rated infrastructure debt may only be in scope of EIOPA calibration if it is investment grade. Infrastructure debt which is not externally rated may need to demonstrate it is the equivalent of investment grade through satisfying stringent qualifying criteria. A similar requirement is proposed for infrastructure equity
• The infrastructure project entity may be required to meet obligations under sustained, severely stressed conditions including specified economic, project, environmental and financial risks.
• It is likely that EIOPA will require cash flows to be predictable for both debt and equity holders. In addition, any project in operation for at least five years may need to demonstrate that variation in revenues over this period is in line with projections.
• A robust contractual framework including strong termination clauses is likely to need to be in place.
• It is likely that EIOPA will require infrastructure debt to be senior and financial risk (including refinancing risk) deemed to be low.
• Construction/operational risk may need to be transferred to a suitable construction/operational company.
• Adequate due diligence is likely to be required prior to investment in an infrastructure project entity, including independent validation of how the asset complies with the qualifying criteria and a confirmation that any cash flow models used for the project are valid.
It is worth noting that EIOPA anticipate industry feedback on the requirements outlined previously and as such the specifics may be somewhat subject to evolution over time.
Interestingly, the stress to be applied to infrastructure debt is yet to be fully defined. EIOPA are considering both a liquidity approach (which takes into consideration that an infrastructure asset may need to be sold, despite an investor’s best intention to hold to maturity) and a credit risk approach (which is built on the supposition that the PD for infrastructure is meaningfully lower than for corporate bonds, reinforced by Moody’s statistics discussed previously). EIOPA expect the stress for a well-diversified portfolio of infrastructure equity to be between 30%–39%, compared with 49% plus symmetric adjustment for Type 2 equity under the standard formula.
The new calibration under Solvency II may improve future capital treatment for infrastructure debt, namely through a lower PD and LGD. As discussed, infrastructure debt is typically characterized by higher recovery rates and a low correlation between default and recovery rates relative to corporate bonds. This would be best reflected through an adjustment to the capital charge for spread volatility on bonds and loans rather than the charge for counterparty default under the Solvency II framework, which is consistent with the approach proposed by EIOPA.
Unrated infrastructure loan44BBB corporate
bond45Operational Construction
Probability of default 3.8% 7.4%
Ultimate recovery rate c.80% c.60% 48.8%
Note: Unrated infrastructure loan data averaged over 1983-2013 and corporate bond data averaged over 1987-2014. The probability of default for the BBB corporate bond is based on a term of 15 years.
Under these assumptions, the return on capital for an infrastructure bond appears attractive compared to that of an A-rated 10-year corporate bond. This will potentially improve as the calibration of the standard formula develops over time.
The capital charges for the existing standard formula calibration for bonds and loans utilize the largest datasets. Therefore, it is perhaps unsurprising that infrastructure loans, with a relatively sparse dataset, do not currently have their own category. However, the data that exists (most notably provided by Moody’s43) suggests a lower PD and LGD for unrated infrastructure loans than, for example, BBB-rated corporate bonds. In particular, the PD is significantly reduced once the asset is in the secondary phase. Furthermore, the ultimate recovery rates on infrastructure loans have, to date, been much higher than bonds, as observed in the table below.

15Infrastructure investments
Internal model approachSolvency II provides for an internal model approach in calculating capital requirements. This could be beneficial for insurers investing in infrastructure assets, due to the potential for a more efficient capital treatment (as previously discussed). However, as no liquid market for infrastructure investments exists, there is limited data available to calibrate a spread risk stress and no clear mechanism for deconstructing the spread into components attributable to credit and liquidity.
We have constructed a model designed to overcome this issue, which provides further insight into the potential merits of an internal model approach over the standard formula. For example, the proportion of spread allocated to credit risk may range from 40% to 50% under an internal model approach. Using this approximate allocation, the spread risk capital charge for an unrated infrastructure asset (assuming the matching adjustment can be applied) has been observed to be approximately 50%–60% lower than the standard formula capital requirement for unrated infrastructure bonds and loans.
The steps of the model are as follows:
1. Identify indices which reflect the relative levels of credit and liquidity risk present in the market to be used as a proxy for credit and liquidity spread movements in infrastructure investments. The idea is that the theoretical (non-observable) spread on infrastructure investment can be deconstructed into a linear combination of the market credit and liquidity indices:
Theoretical infrastructure debt spread = α * market credit index + β * market liquidity index
2. Estimate the through-the-cycle (TTC) credit and liquidity spreads for the infrastructure investment portfolio. These spreads can be derived using available infrastructure investment data and benchmarking with the wider infrastructure investment market. Data challenges exist, though, which could make such calculations challenging. These TTC spreads are used to scale the market indices identified in step 1 to make them specific to the infrastructure investment market.
3. Scale the specific indices derived in step 2 to reflect the credit quality and tenor of the actual infrastructure investments relative to the reference index.
4. Calibrate specific credit and liquidity spread shocks by making an appropriate transformation to the specific indices in step 3 prior to applying a suitable distribution and fitting methodology to derive the spread shocks. The choice of distribution and fitting methodology is arguably as material as the choice of data.
5. Perform scenario testing to assess the suitability of the calibrated spread shocks and the implied level of required capital, particularly as the calibration is based on proxy data.
Benefits of the matching adjustmentWith the implementation of Solvency II imminent, many European insurers have reconsidered the extent that their asset portfolio and liability profiles match. For those applying for the matching adjustment, this consideration is of particular importance. The matching adjustment allows insurers to benefit from holding assets to maturity by increasing the discount rate used in the calculation of the company’s best estimate liabilities. A higher discount rate reduces the valuation of the liabilities and ultimately can materially strengthen the insurer’s balance sheet.
The introduction of the matching adjustment is expected to have an impact on insurers’ investment preferences. When insurers utilizing the matching adjustment are faced with two assets of an equivalent yield which broadly satisfy their risk appetite, it is likely that they will select the asset with the greatest matching adjustment (i.e., the greatest spread over the prescribed regulatory risk-free interest rate and credit default allowance). Therefore, infrastructure investments that meet the eligibility criteria for the matching adjustment may be lucrative. This is due to the additional return they may provide to compensate the investor for illiquidity risk relative to more traditional investments.
To apply for the matching adjustment, insurers must satisfy strict requirements for the cash flows associated with their assets and the ongoing portfolio management and governance. They must demonstrate that their asset portfolio produces fixed cash flows that replicate or materially match those of the company’s liabilities. In addition, assets and liabilities must match with respect to their currency and nature. As a consequence, there are limitations on which assets satisfy the matching adjustment criteria.

16 Infrastructure investments
It is important to consider the different ways to categorize infrastructure investments, as discussed earlier. Primary infrastructure projects pose a greater risk in terms of cash flow uncertainty. In contrast, secondary projects offer greater certainty and, thus, the potential to satisfy the matching adjustment criteria. Due to ambiguity in the timing and/or amount of expected cash flows expected from an infrastructure investment, and the complexity of borrower options, it is unlikely that all infrastructure investments will be well-suited to the matching adjustment criteria. It may be possible, however, to include clauses or use derivatives to address this issue.
For example, it is possible for insurers to mitigate against the uncertainty of cash flows due to borrower optionality through a Spens clause. Under a Spens clause, the issuer of an infrastructure loan has to value cash flows beyond the point that an option is exercised (for example, to prepay) at a specified yield (often linked to government bond yields or similar benchmarks). They also must pay a fee representative of the insurers’ loss in future revenue on the asset. This protects the insurer from loss of future income or may make it prohibitively expensive for the issuer to take an early redemption, thus mitigating this risk. It is important to reiterate that there are a variety of borrower options embedded in typical infrastructure projects, making such a mitigation technique difficult to successfully implement.
As a rating is required to perform the matching adjustment calculation, additional operational issues may arise for unrated infrastructure assets. At present, many companies use internal rating methodologies to assign a rating to their infrastructure assets. These methodologies are likely to be subject to significant supervisory scrutiny under Solvency II and may present an additional operational cost for investors relative to more vanilla investments.

17Infrastructure investments
The risks concerning investment in
infrastructure assets
As noted previously, infrastructure investments can provide a competitive expected return-on-capital to investors. However, investment is only attractive if the costs associated with originating and servicing the loans are not overly onerous for the insurer. A balance is required between the economic benefits of the asset class and the cost and difficulty of implementation and servicing, which may erode any potential gains.
Infrastructure investments can be highly complex to manage. The way in which the project is financed is often the key differentiator as to who performs the ongoing management:
• Financed by equity: Ongoing management would be maintained by a fund manager or experienced in-house team.
• Financed by debt: Ongoing management would be maintained by a “super trustee,” a credit enhancer acting as a controlling creditor (or partial controlling creditor), or an in-house team.
For highly-geared projects (i.e., those with a high proportion of debt finance), creditors are typically entitled to exercise a high degree of control over the managing company’s actions. Bondholders can expect to deal with a range of issues on a fairly regular basis, including the possibility of major changes to the project. Preserving the original risk profile of the infrastructure project can take time and effort.
Another consideration for investors is the amount and accessibility of available information about the project in which they are investing. This may depend on the format of the debt — for example, information is more easily provided under loan structures than publicly-listed bond issues.
Most insurance companies do not possess the capability to trade and manage illiquid loans unless they have been previously active in this market. The operational requirements can be onerous and insurers will need to consider the impact of originating, trading and managing loans on investment margins.
Some of the more onerous challenges that insurers may encounter include sourcing appropriate investments or managing third-party relationships. Furthermore, the capability to quickly assess credit quality, legal documentation and value illiquid loans and their capital treatment may not exist in-house. An insurer may wish to consider how best to acquire such skills.
Once the investment has been sourced, valued and purchased, there are further requirements for the insurer to address. The investor will need to develop or acquire the capability to manage borrower relationships. This includes deviations from the agreed drawdown schedule for development projects and assessing project progress during development and management of loans (such as handling borrower requests and exercise of any associated optionality). Inability to do so may result in reputational damage or further contact risks.
Insurers entering the market for infrastructure investments, therefore, must decide whether to take on these challenges in-house, outsource operations or seek external expertise.

18 Infrastructure investments
Figure 7: Infrastructure investment risks
Type of risk Description
Primary or secondary (ranked by materiality of risk — high/medium/low)
Materiality of the risk Potential mitigants of the risk
Revenue risk The risk of default with a PFI concession agreement, backed by a central government, is low. However, an investor entering an agreement which is not backed by a government guarantee is subject to the risk of being unable to meet its liabilities with the revenue generated by the asset.
Secondary — medium If a project is not backed by a central government, there is the material risk that the investor may not receive the expected cash flows or revenue from the investment.
Investors could mitigate this risk by investing only in projects with government guarantees or complete a thorough due diligence of the project prior and during the investment.
Movements in local government debt yields and local swap rates
The yields on infrastructure loans may be affected by movements in local government debt yields. There is the risk of a movement relative to local swap rates driving a change in the value of infrastructure loans.
Primary — medium Secondary — medium
This risk may not be the most material concern; however, it should be considered by insurers in their capital modeling.
Investors may enter an interest rate swap or ensure that their infrastructure investment is part of a well-diversified portfolio.
Gearing risk PFI projects are typically highly geared; thus, there are interest rate risks and downgrade risks to consider.
Primary — mediumSecondary — low
Interest rate movements or the downgrading of the credit rating of a project increases the probability of default and may have a detrimental effect on the investor’s matching adjustment portfolio.
Interest rate swaps can mitigate the risk of a detrimental interest rate movement. Investors could focus only on higher-rated infrastructure investments.
Infrastructure bond marketability risk
There is the risk that the change in marketability of infrastructure bonds can impact the ability to trade bonds for a more marketable source or cash. Such changes in marketability can be the result of:• Increased/reduced activity
in the infrastructure loan market
• Divergent views on asset prices resulting in wide bid-ask spreads and general market sentiment
• Uncertainty in the wider infrastructure loan market
Secondary — low This risk is material for investors who intend on exchanging the bond in the future. Many infrastructure bonds are held until maturity due to their illiquid nature; thus, this risk may be less material.
If an investor would prefer to have the option to exchange an infrastructure bond in the future, this should be specified in the initial contract. Investors may need to invest elsewhere if they prefer a portfolio which is highly marketable and readily exchangeable.
Major risks for infrastructure investmentsAs a consequence of such demanding operational challenges, infrastructure investments pose a number of risks. The level of risk to which the investor will be exposed depends on whether the
investment is made in primary or secondary infrastructure. The most material risks in each instance are summarized in Figure 7.

19Infrastructure investments
Type of risk Description
Primary or secondary (ranked by materiality of risk — high/medium/low)
Materiality of the risk Potential mitigants of the risk
Optionality risk Under infrastructure loan contracts, the borrower retains the option to repay or extend the loans at any point. Exercise of these options has the potential to result in a loss of income to the investor.
Primary — highSecondary — high
This can have a material impact on investors. The loans often favor the borrower with valuable options, such as early prepayment and switching coupon linkage (for example, to inflation or nominal curves). As a result, the cash flows are not fixed, which is problematic for insurers (particularly those looking to match these assets to their liabilities under the matching adjustment).
It is possible for insurers to mitigate against the uncertainty of cash flows due to borrower optionality through a Spens clause.
Under a Spens clause, the issuer of an infrastructure loan has to value cash flows beyond the point that an option is exercised (for example, to prepay) at a specified yield (often linked to government bond yields or similar benchmarks) and to pay a fee representative of the insurers loss in future revenue on the asset. This provides protection to the insurer from loss of future income or may make it prohibitively expensive for the issuer to take an early redemption, thus mitigating this risk.
Currency risk Projects undertaken in a foreign country are subject to the risk of movement in currency exchange rates.
Primary — lowSecondary — low
Investments in non-GBP assets carry additional risks:• Credit risk of the counterparty when
holding exchange rate derivatives• Mitigation of counterparty risk by
collateralizing the exposure creating a yield drag if the required form of collateral is higher quality, and thereby lower return, than the target portfolio of the derivative holder
• Entering contracts that require collateral creates a form of liquidity risk to meet collateral calls on the hedged assets
• Balance sheet volatility as a result of cross-currency swaps
Investors can hedge currency risk through futures contracts, swaps or options.
Construction risk
Failure to finish construction on time, according to specifications and within budget, will pose a considerable risk to the investor and possibly lead to termination of the project before the income-generating secondary phase begins.
Primary — high This is a significant risk which poses a threat to the completion of the project.
Construction risk could be partially mitigated through guarantees from the government or otherwise. This would ensure that should a project fail, the investors are somewhat protected. Having several contractors involved in construction will reduce this risk.

20 Infrastructure investments
Type of risk Description
Primary or secondary (ranked by materiality of risk — high/medium/low)
Materiality of the risk Potential mitigants of the risk
Supply chain default risk
It is important that supply chain agreements are drafted tightly and the covenant strength of both main contractor and key sub-contractors are acceptable. The caps and limitations on liability also need to be established appropriately.
Primary — mediumSecondary — low
This risk is at its most material when there are a number of contractors and sub-contractors involved. This is often the case in order to mitigate construction risk. Ultimately, the greater the number of supply chain agreements, the higher the exposure to this risk.
It may be beneficial to seek additional advice to ensure agreements are drafted in line with expectations.
Environmental risk
Environmental damage caused by an infrastructure project constitutes a real risk for investors, and mitigation of this risk requires extensive due diligence.
Primary — mediumSecondary — low
This risk has the potential to pose a major threat to the investment and can vary substantially from project to project.
It is difficult to clearly define how to mitigate against environmental risk. The risk and corresponding mitigation technique is likely to be specific to the project at hand, for example flood mitigation for a project with a potential risk of flood damage.
Regulatory, political and social risk
Regulatory changes can affect infrastructure projects on a general level as well as change the direction of specific projects (particularly with projects which fall under the remit of the PFI/PPP).
In addition, consumer fare rises such as road tolls or train fares may fall behind the level originally envisioned when the project commenced due to a change in government policy.
Primary — mediumSecondary — medium
A material risk may alter the direction and content of an infrastructure project. The materiality will vary depending on the governmental policies implemented, as well as local election outlooks or public opinion.
Investors should analyze the regulatory, political and social climate in which they are investing in. Current sentiment and historic performance of similar projects in the region could be a good indicator of likely obstacles.
Operating risk Higher than expected operating and maintenance costs, coupled with uncertainty over the stability of long-term returns, could lead to deductions from the monthly payments and subsequently dilute the income stream.
Primary — lowSecondary — low
This risk is perhaps less material than others, but has the potential to significantly affect the returns from a project.
Analyze fully the expected operating and maintenance costs and scrutinize the evaluation of the project managers. Perform sensitivity and scenario testing to ascertain the impact of changes in the income stream.
Hand-back risk The value of the infrastructure asset may be lower than expected at the time of exchange from the contractor to the project sponsor (i.e., the party providing equity financing).
End of secondary — medium
This risk is relevant to investors who have assumed legal ownership of the asset through equity financing rather than debt financing.
This risk could be avoided entirely by providing only debt financing. Sensitivity and scenario testing could be performed to calculate the expected impact on profit should the value of the infrastructure asset fall below expectations.
As is evident from the split of primary and secondary risks above, the primary phase of an infrastructure project poses much greater risk in terms of both variety and magnitude than the second phase.
Figure 7: Infrastructure investment risks (continued)

21Infrastructure investments
1. “Typhoon Gemini offshore wind farm — Netherlands,” World construction network, http://www.worldconstructionnetwork.com/projects/typhoon-gemini-offshore-wind-farm-netherlands/, accessed 17 April 2015
2. “A556 Knutsford to Bowdon improvement,” IJ Global, http://www.highways.gov.uk/roads/road-projects/a556-knutsford-to-bowdon-improvement/, accessed 17 April 2015
3. “Johan Sverdup oil field development Norway,” World construction network, http://www.worldconstructionnetwork.com/projects/stolupedetnormopetoro-johan-sverdrup-oil-field-development-norway/, accessed 17 April 2015
4. “World spectacular infrastructure projects,” CNN, http://edition.cnn.com/2013/06/18/business/world-spectacular-infrastructure-projects/, accessed 17 April 2015
5. “Norway launches Gystadmarka school PPP,” IJ Global, https://ijglobal.com/articles/95765/norway-launches-gystadmarka-school-ppp, accessed 17 April 2015
6. “Pedemontana Lombarda toll road bank financing launches,” IJ Global, https://ijglobal.com/articles/96375/pedemontana-lombarda-toll-road-bank-financing-launches
7. “About us,” M6 Toll, https://www.m6toll.co.uk/about-us/, accessed 17 April 2015
8. “Uploads,” UK Government website, https://www.gov.uk/government/uploads/system/uploads/attachment_data/file/387228/pfi_projects_2014_summary_data_final_15122014.pdf, accessed 17 April 2015
9. “European availability road and overall European deal of the year 2013,” IJ Global, https://ijglobal.com/pf-archive/article/3310692/and-65279european-availability-road-and-overall-european-deal-of-the-year-2013-l2-marseille, accessed 17 April 2015
10. “80MW Kizildere III geothermal plant,” IJ Global, https://ijglobal.com/data/transaction/33727/80mw-kizildere-iii-geothermal-plant, accessed 17 April 2015
11. “2266MW Reckahn 1 Solar PV Plant,” IJ Global, https://ijglobal.com/data/transaction/29355/2266mw-reckahn-1-solar-pv-plant, accessed 17 April 2015
12. “Sustainable energy meets unsustainable costs,” The Economist, http://www.economist.com/news/business/21582018-sustainable-energy-meets-unsustainable-costs-cost-del-sol, accessed 17 April 2015
13. “UK Britain Infrastructure,” Reuters, http://uk.reuters.com/article/2013/12/04/uk-britain-infrastructureidUKBRE9B300M20131204, accessed 17 April 2015
14. “Greater London authority raises £200m via UK’s first CPI bond,” Professional Pensions, http://www.professionalpensions.com/professional-pensions/news/2407934/greater-london-authority-raises-gbp200m-via-uk-s-first-cpi-bond, accessed 17 April 2015
15. http://www.markit.com/, accessed 17 April 2015
16. RBC — Infrastructure Structured DCM Pricing Update — 20150505.pdf
17. “Bus depots cluster 2,” Inspiratia, http://www.inspiratia.com/datalive/Projects/Bus-Depots-Cluster-2/, accessed 17 April 2015
18. “Limmel Lock,” Inspiratia, http://www.inspiratia.com/datalive/Projects/Limmel-Lock/, accessed 17 April 2015
19. “Stoke extra care housing,” Inspiratia, http://www.inspiratia.com/infrastructure/regions/eu-europe/england/region-dealfocus/article/stoke-extra-care-housing-pfi, accessed 17 April 2015
20. IJGlobal - Alford Community Campus PPP.pdf
21. “N17 N18 Motorway 1,” Inspiratia, http://www.inspiratia.com/datalive/Projects/N17N18-Motorway-1/, accessed 17 April 2015
22. Published by the Institute and Faculty of Actuaries working party on non-traditional assets. “Documents,” Actuaries, http://www.actuaries.org.uk/research-and-resources/documents/non-traditionalinvestments-key-considerations-insurers-long-versio
23. “European availability road and overall European deal of the year 2013,” IJ Global, https://ijglobal.com/pf-archive/article/3310692/and-65279european-availabilityroad-and-overall-european-deal-of-the-year-2013-l2-marseille, accessed 17 April 2015
24. “Thameslink rolling stock PPP,” Inspiratia, http://www.inspiratia.com/infrastructure/regions/eu-europe/england/region-dealfocus/article/thameslink-rolling-stock-ppp-1, accessed 17 April 2015
25. “Drax secures loan for coal to biomass switch,” Penn Energy, http://www.pennenergy.com/articles/pennenergy/2013/04/drax-secures-loan-forcoal-to-biomass-switch.html, accessed 17 April 2015
26. “French prison lot A and B,” Inspiratia, http://www.inspiratia.com/infrastructure/regions/eu-europe/france/region-dealfocus/article/french-prisons-lot-a-and-b, accessed 17 April 2015
27. sp_investing_in_infrastructure-are_insurers_ready_to_fill_the_funding_gap.pdf
28. The FT, http://www.ft.com/cms/s/0/5652c79c-ccae-11e4-b94f-00144feab7de.html?siteedition=intl#axzz3Uol5olIb, accessed 17 April 2015
29. “Jobs, Growth and Investment,” The European Community, http://ec.europa.eu/priorities/jobs-growth-investment/plan/docs/factsheet3-whatin_en.pdf, accessed 17 April 2015
30. “National infrastructure pipeline,” UK Government, https://www.gov.uk/government/publications/national-infrastructure-pipelinedecember-2014, accessed 17 April 2015
31. “Infrastructure pipeline,” Building, http://www.building.co.uk/infrastructure-pipeline-microsite/timeline/, accessed 17 April 2015
32. “Infrastructure pipeline,” Building, http://www.building.co.uk/infrastructure-pipeline-microsite/timeline/, accessed 17 April 2015
33. “Information for Investors,” Thames Tideway Tunnel, http://www.thamestidewaytunnel.co.uk/procurement/information-for-investors, accessed 17 April 2015
34. “302MW Turkey Solar PV Project,” IJ Global, https://ijglobal.com/data/transaction/33746/302mw-turkey-solar-pv-project, accessed 17 April 2015
35. “220MW Zabrze Multi Fuel Combined Heat and Power Plant,” IJ Global, https://ijglobal.com/data/transaction/33668/220mw-zabrze-multi-fuel-combinedheat-and-power-plant, accessed 17 April 2015
36. “Gystadmarka School PPP,” IJ Global, https://ijglobal.com/data/transaction/33653/gystadmarka-school-ppp, accessed 17 April 2015
37. “Marvele Cargo Port PPP,” IJ Global, https://ijglobal.com/data/transaction/33654/marvele-cargo-port-ppp, accessed 17 April 2015
38. EIB, http://www.eib.org/projects/pipeline/2013/20130595.htm, accessed 17 April 2015
39. EIB, http://www.eib.org/projects/pipeline/2014/20140566.htm, accessed 17 April 2015
40. EIB, http://www.eib.org/projects/pipeline/2015/20150058.htm, accessed 17 April 2015
41. “Despite wave of infrastructure capital investment opportunities remain scarce,” Moodys, https://www.moodys.com/research/Moodys-Despite-wave-of-infrastructure-capitalinvestment-opportunities-remain-scarce--PR_326366, accessed 17 April 2015
42. “Jobs, Growth and Investment,” The European Community, http://ec.europa.eu/priorities/jobs-growth-investment/plan/docs/factsheet3-whatin_en.pdf, accessed 17 April 2015
43. “Infrastructure project finance,” Moodys, https://www.moodys.com/researchandratings/market-segment/infrastructureproject-finance/005008/4294966386/4294966623/0/0/-/0/rr, accessed 17 April 2015
44. Moodys, https://www.moodys.com/researchdocumentcontentpage.aspx?docid=PBC_179524, accessed 17 April 2015
45. Moodys, https://www.moodys.com/researchdocumentcontentpage.aspx?docid=PBC_179348, accessed 17 April 2015
Appendix

22 Infrastructure investments
ConclusionInfrastructure investments are an interesting option for an insurer’s portfolio. There are considerable benefits to such an investment, notably the competitive expected return (and return on capital under Solvency II) which could be achieved. Although not as inviting as a couple of years ago, spreads on infrastructure investments continue to lie within a range that would be of interest to insurers. In addition, the fact that certain infrastructure investments may provide real returns to match inflation-linked or real liabilities and the possibility that some assets could be eligible for the matching adjustment further demonstrate the range of potential benefits that an infrastructure investment portfolio could offer an insurer.
But despite these advantages, there remain ongoing managerial challenges and difficulty in sourcing such infrastructure assets. This scarcity, coupled with high demand, has a detrimental effect on the benefits and may erode advantages that infrastructure investments hold over more traditional assets. Insurers appear willing to invest and plan to continue doing so, at least while the apparent benefits seem to outweigh the costs.

23Infrastructure investments
This publication contains information in summary form and is therefore intended for general guidance only. It is not intended to be a substitute for detailed research or the exercise of professional judgment. Neither EYGM Limited nor any other member of the global EY organization can accept any responsibility for loss occasioned to any person acting or refraining from action as a result of any material in this publication. On any specific matter, reference should be made to the appropriate advisor.
Insurance Investment global contacts
Insurance Investment country leads
Jeff Davies Global Optimization lead +44 20 7951 7227 [email protected]
Tino Madzingira Africa lead +27 21 443 0200 [email protected]
Wim Weijgertze Netherlands lead +31 88 407 3105 [email protected]
Gareth Mee Insurance Investment lead +44 20 7951 9018 [email protected]
Arthur Chabrol France lead +33 1 46 93 81 54 [email protected]
Gareth Sutcliffe UK lead +44 20 7951 4805 [email protected]
ContactsAuthors
Infrastructure Transaction Advisory contacts
Rick Marx North America lead +1 212 773 6770 [email protected]
Abhishek Kumar Asia lead +44 020 7951 1175 [email protected]
Ryan Allison Associate +44 207 951 4479 [email protected]
Richard Tollis Partner +44 20 7951 3736 [email protected]
Sam Tufts Executive +44 207 951 6671 [email protected]
Chris Lowe Partner +44 20 7951 0826 [email protected]

EY | Assurance | Tax | Transactions | Advisory
About EYEY is a global leader in assurance, tax, transaction and advisory services. The insights and quality services we deliver help build trust and confidence in the capital markets and in economies the world over. We develop outstanding leaders who team to deliver on our promises to all of our stakeholders. In so doing, we play a critical role in building a better working world for our people, for our clients and for our communities.
EY refers to the global organization, and may refer to one or more, of the member firms of Ernst & Young Global Limited, each of which is a separate legal entity. Ernst & Young Global Limited, a UK company limited by guarantee, does not provide services to clients. For more information about our organization, please visit ey.com.
About EY’s Global Insurance CenterInsurers must increasingly address more complex and converging regulatory issues that challenge their risk management approaches, operations and financial reporting practices. EY’s Global Insurance Sector brings together a worldwide team of professionals to help you succeed — a team with deep technical experience in providing assurance, tax, transaction and advisory services. The Sector team works to anticipate market trends, identify their implications and develop points of view on relevant sector issues. Ultimately, this team enables us to help you meet your goals and compete more effectively.
© 2015 EYGM Limited. All Rights Reserved.
EYG no. EG0276
BMC Agency BACS 1002585
In line with EY’s commitment to minimize its impact on the environment, this documenthas been printed on paper with a high recycled content.
This material has been prepared for general informational purposes only and is not intended to be relied upon as accounting, tax, or other professional advice. Please refer to your advisors for specific advice.
ey.com