“infrastructure development roadmap and progress in indonesia” dedy supriadi priatna, ph.d...
TRANSCRIPT
““INFRASTRUCTURE INFRASTRUCTURE DEVELOPMENT ROADMAP AND DEVELOPMENT ROADMAP AND
PROGRESS IN INDONESIAPROGRESS IN INDONESIA””
Dedy Supriadi Priatna, Ph.DDeputy Minister of Infrastructure Affairs
Ministry of National Development Planning / Bappenas
1. Infrastructure Challenges2. Mid Term National Development Plan 2010-
20143. Central Government Financing
a. Rupiahb. External Loan/ Grantc. Government Guarantee
4. Public Private Partnership5. Summary
2
4
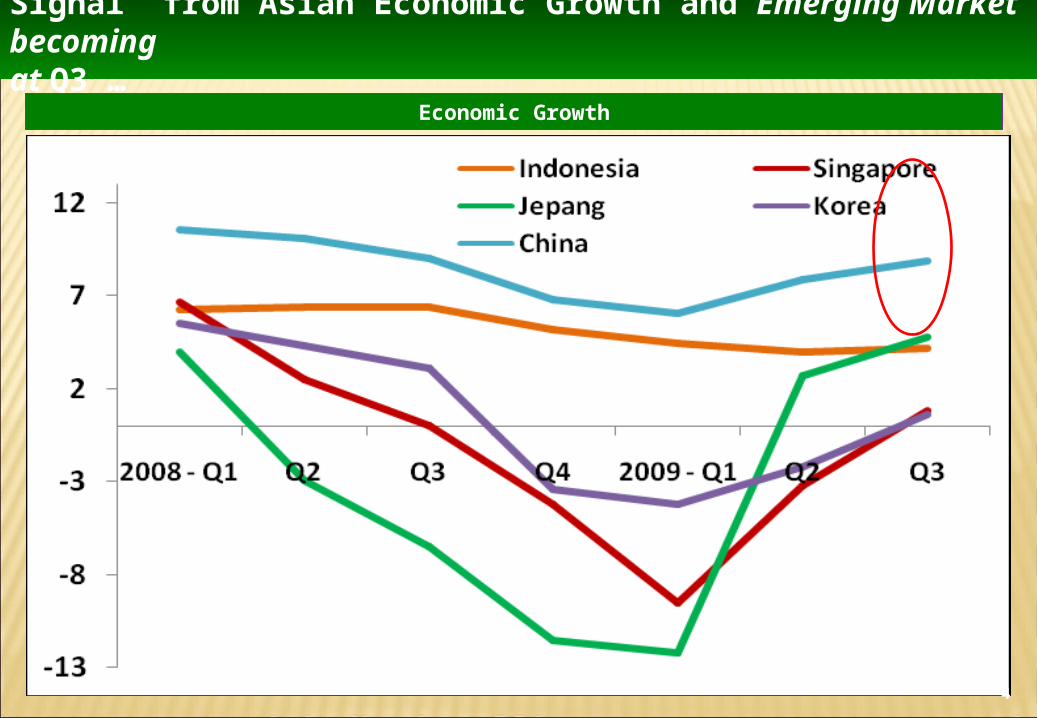
Signal from Asian Economic Growth and Emerging Market becoming at Q3 …
Economic Growth
4
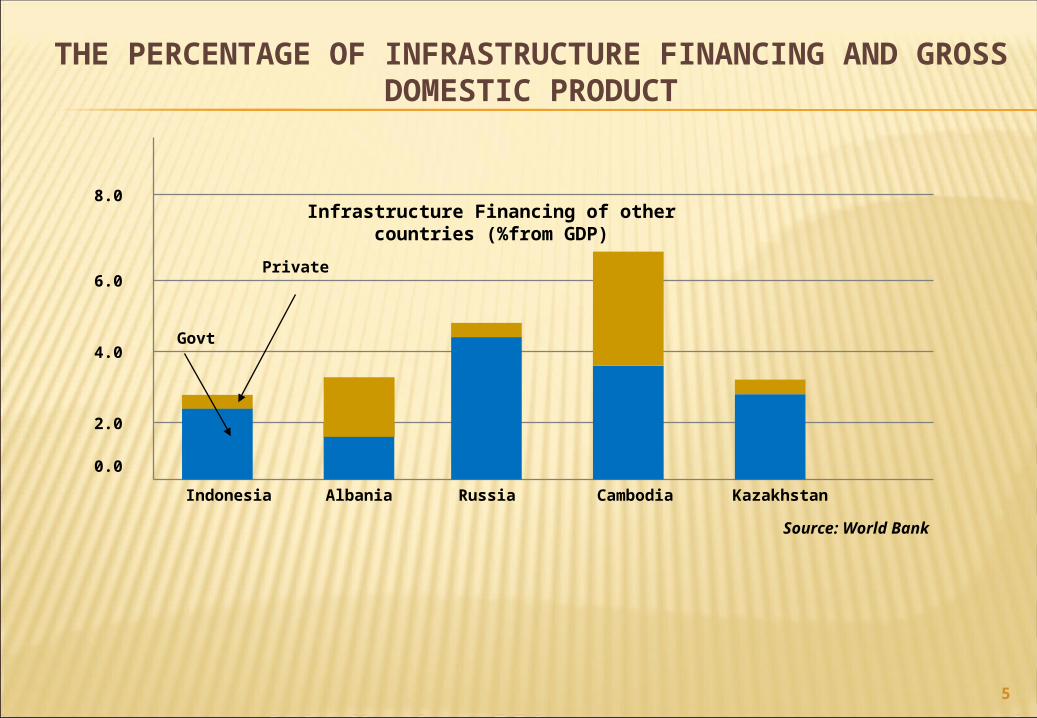
Infrastructure Financing of other countries (%from GDP)
THE PERCENTAGE OF INFRASTRUCTURE FINANCING AND GROSS DOMESTIC PRODUCT
0.0
2.0
4.0
6.0
8.0
Indonesia Albania Russia Cambodia Kazakhstan
Private
Govt
Source: World Bank
5
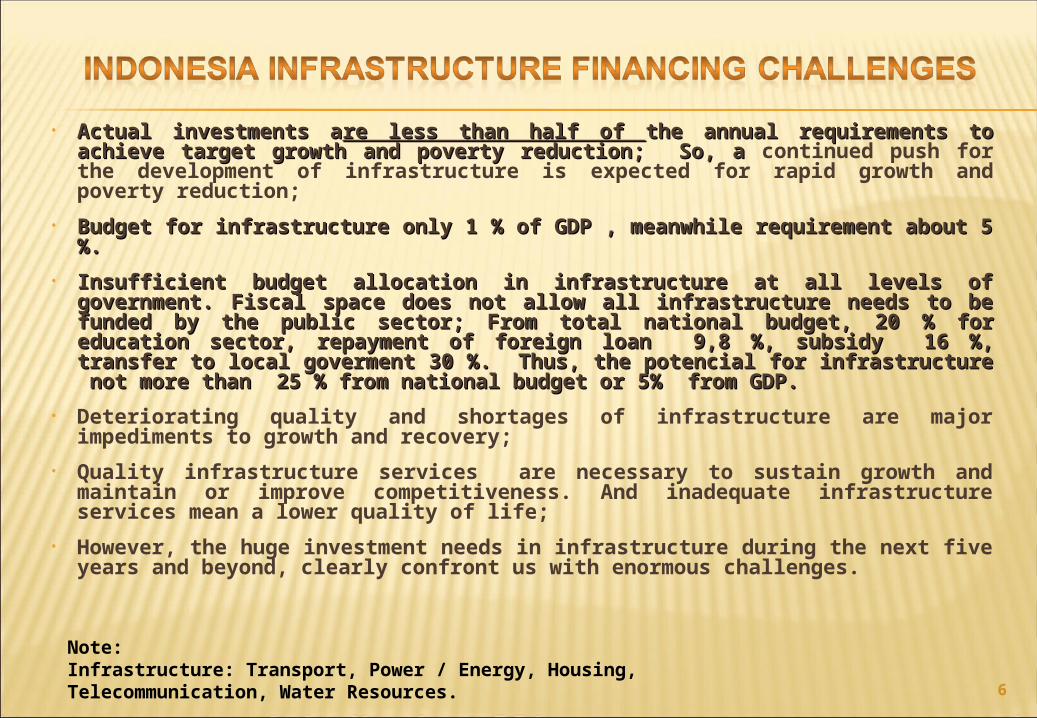
• AActual investments actual investments are less than half of re less than half of the annual requirements to the annual requirements to achieve target growth and poverty reduction;achieve target growth and poverty reduction; So, a So, a continued push for the development of infrastructure is expected for rapid growth and poverty reduction;
• Budget for infrastructure only 1 % of GDP , meanwhile requirement about Budget for infrastructure only 1 % of GDP , meanwhile requirement about 5 %. 5 %.
• Insufficient budget allocation in infrastructure at all levels of governmentInsufficient budget allocation in infrastructure at all levels of government. . FFiscal space does not allow all infrastructure needs to be funded by the iscal space does not allow all infrastructure needs to be funded by the public sector; public sector; From total national budget, From total national budget, 20 % 20 % for education sector, for education sector, repayment of foreign loan repayment of foreign loan 9,8 %, subsid 9,8 %, subsidy y 16 %, transfer 16 %, transfer to local to local goverment goverment 30 %. 30 %. Thus, the potencial for infrastructure not more than Thus, the potencial for infrastructure not more than 25 % 25 % from national budget or from national budget or 5% 5% from GDP from GDP..
• Deteriorating quality and shortages of infrastructure are major impediments to growth and recovery;
• Quality infrastructure services are necessary to sustain growth and maintain or improve competitiveness. And inadequate infrastructure services mean a lower quality of life;
• However, the huge investment needs in infrastructure during the next five years and beyond, clearly confront us with enormous challenges.
6
Note: Infrastructure: Transport, Power / Energy, Housing, Telecommunication, Water Resources.

Growth Competitiveness Index/GCI Ranking (2003 - 2008)
Argentina Indonesia
Philipines
Brazil Korea China JapanThailan
dMalaysi
a
2003 78 72 66 54 18 44 11 32 29
2004 74 69 76 57 29 46 9 34 31
2005 72 74 77 65 17 49 12 36 24
2007 85 54 71 72 11 34 8 28 21
2008 88 55 71 64 13 30 9 34 21
Difficult challenges to promote foreign and domestic investment National competitiveness is low Based on World Economic Forum (WEF), Indonesia ranked 55th out of 134 countries. Meanwhile,
Malaysia and Thailand ranked 21st and 34th, respectively.
Note: In 2003 cover 101 countries, 2004 cover 104 countries, & 2005 cover 117 countries, 2007 cover 131 countries, 2008 cover 134 countriesSource: World Economic Forum
7
8
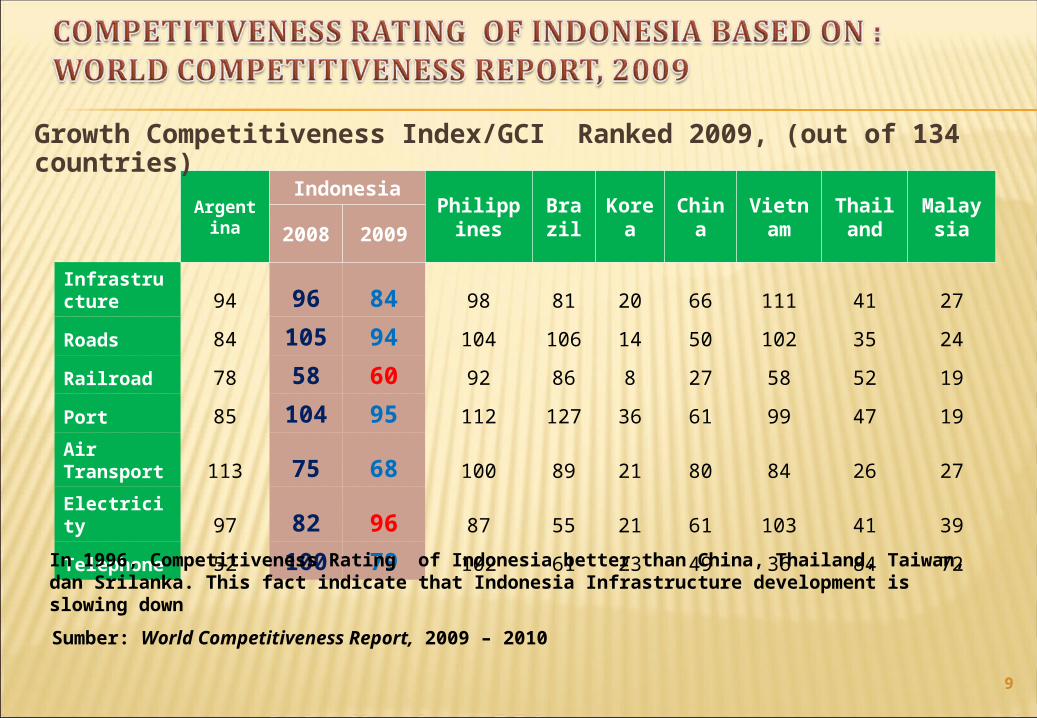
Argentina
IndonesiaPhilippines Brazil Korea China Vietnam Thailand Malaysia
2008 2009
Infrastructure 94 96 84 98 81 20 66 111 41 27
Roads 84 105 94 104 106 14 50 102 35 24
Railroad 78 58 60 92 86 8 27 58 52 19
Port 85 104 95 112 127 36 61 99 47 19
Air Transport 113 75 68 100 89 21 80 84 26 27
Electricity 97 82 96 87 55 21 61 103 41 39
Telephone 52 100 79 102 61 23 49 36 84 72
Sumber: World Competitiveness Report, 2009 – 2010
In 1996, Competitiveness Rating of Indonesia better than China, Thailand, Taiwan, dan Srilanka. This fact indicate that Indonesia Infrastructure development is slowing down
Growth Competitiveness Index/GCI Ranked 2009, (out of 134 countries)
9
10
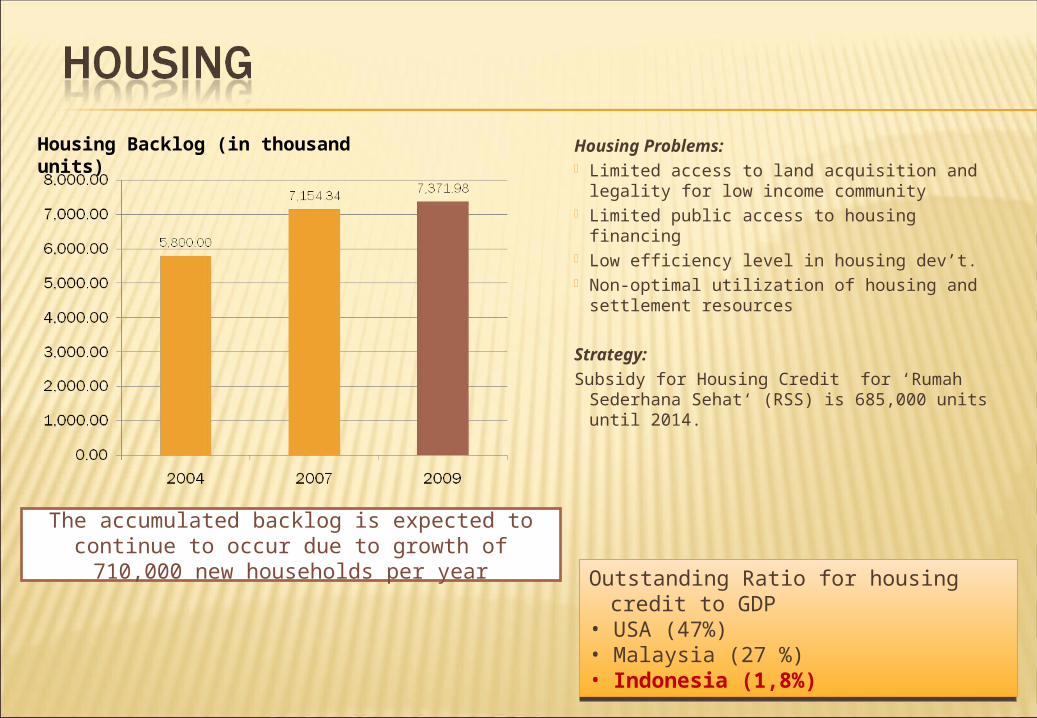
Housing Problems: Limited access to land acquisition and
legality for low income community Limited public access to housing financing Low efficiency level in housing dev’t. Non-optimal utilization of housing and
settlement resources
Strategy:Subsidy for Housing Credit for ‘Rumah
Sederhana Sehat‘ (RSS) is 685,000 units until 2014.
The accumulated backlog is expected to continue to occur due to growth of 710,000 new
households per year
11
Housing Backlog (in thousand units)
Outstanding Ratio for housing credit to GDP
• USA (47%) • Malaysia (27 %) • Indonesia (1,8%)
Outstanding Ratio for housing credit to GDP
• USA (47%) • Malaysia (27 %) • Indonesia (1,8%)
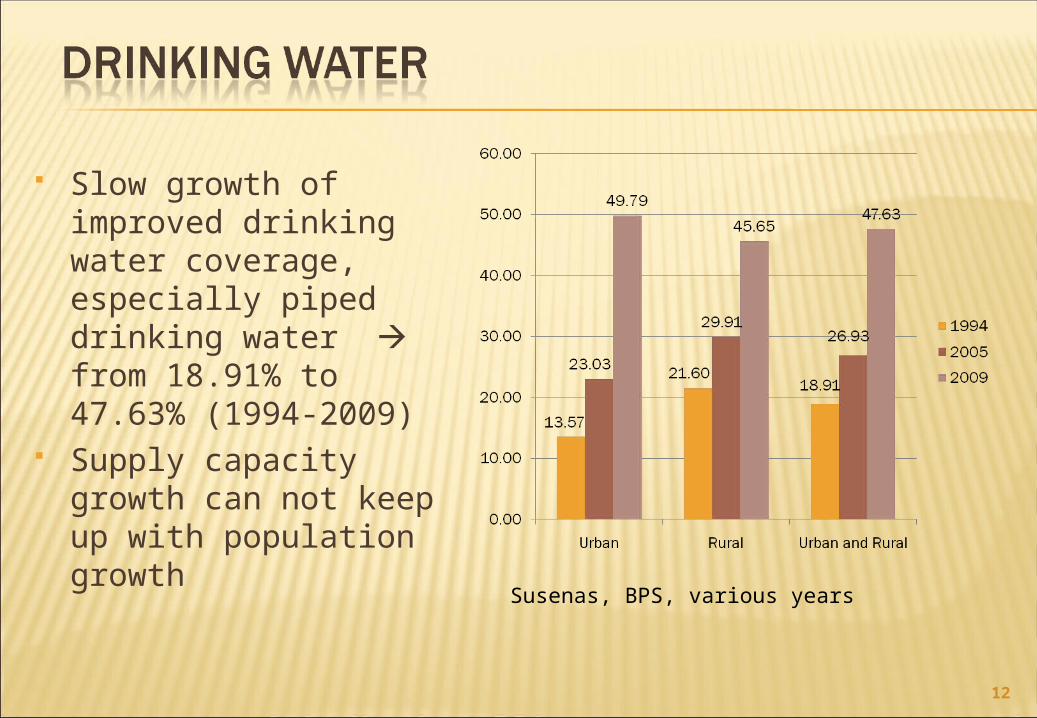
Slow growth of improved drinking water coverage, especially piped drinking water from 18.91% to 47.63% (1994-2009)
Supply capacity growth can not keep up with population growth
Susenas, BPS, various years
12
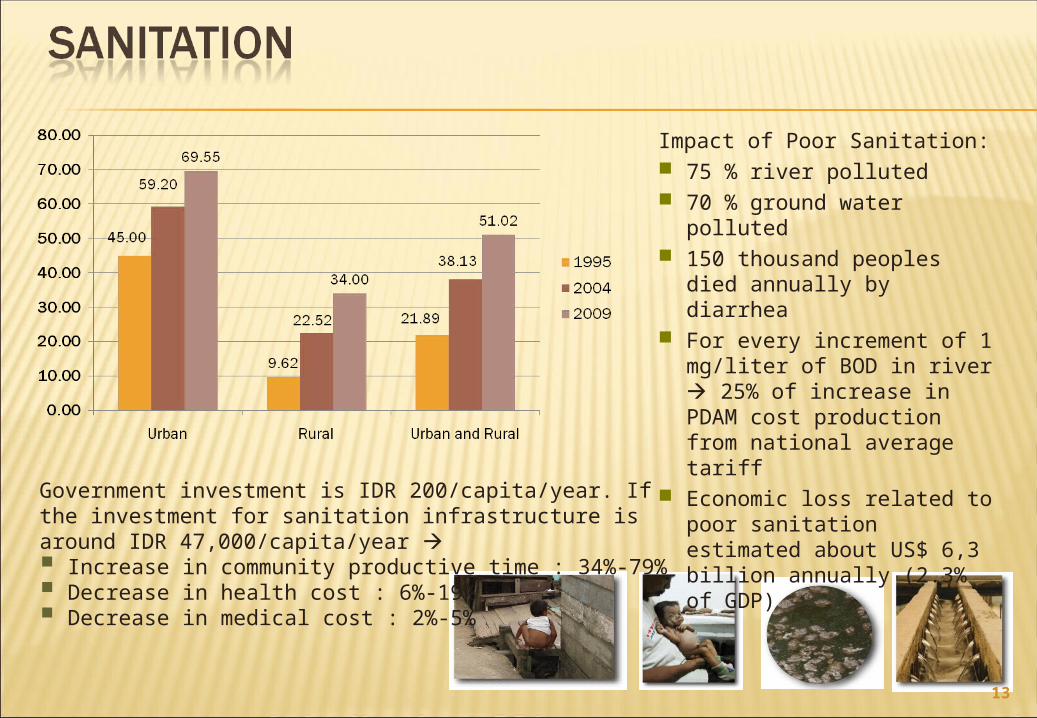
Government investment is IDR 200/capita/year. If the investment for sanitation infrastructure is around IDR 47,000/capita/year Increase in community productive time : 34%-79% Decrease in health cost : 6%-19% Decrease in medical cost : 2%-5%
13
Impact of Poor Sanitation: 75 % river polluted 70 % ground water polluted 150 thousand peoples died
annually by diarrhea For every increment of 1
mg/liter of BOD in river 25% of increase in PDAM cost production from national average tariff
Economic loss related to poor sanitation estimated about US$ 6,3 billion annually (2.3% of GDP)
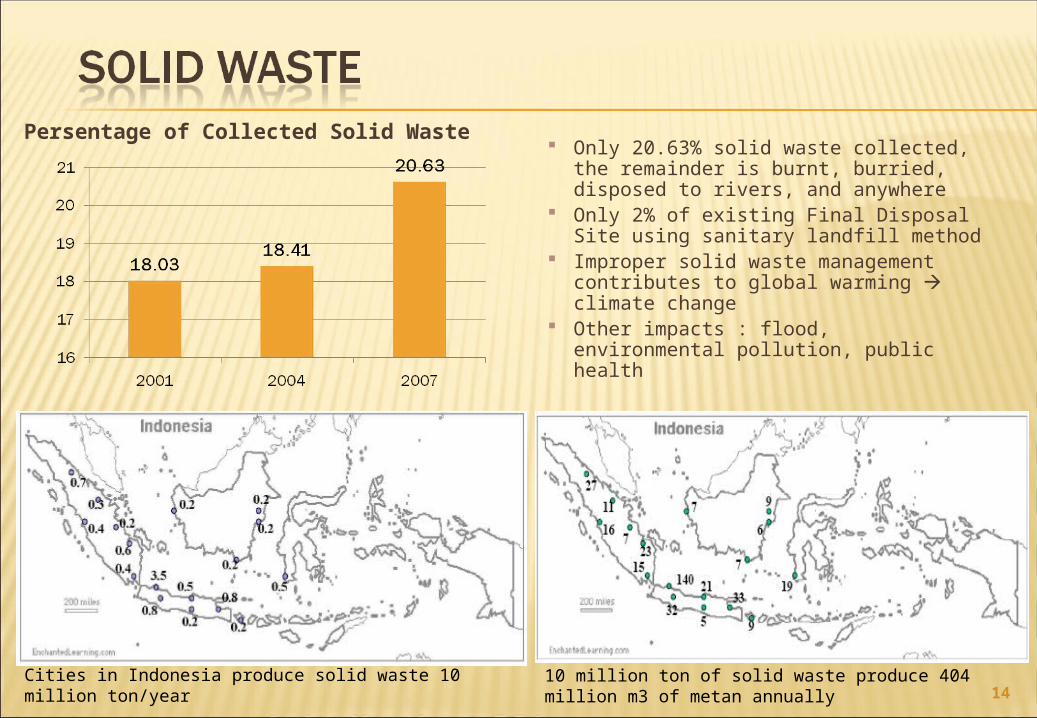
Only 20.63% solid waste collected, the remainder is burnt, burried, disposed to rivers, and anywhere
Only 2% of existing Final Disposal Site using sanitary landfill method
Improper solid waste management contributes to global warming climate change
Other impacts : flood, environmental pollution, public health
Persentage of Collected Solid Waste
Cities in Indonesia produce solid waste 10 million ton/year
10 million ton of solid waste produce 404 million m3 of metan annually 14
15
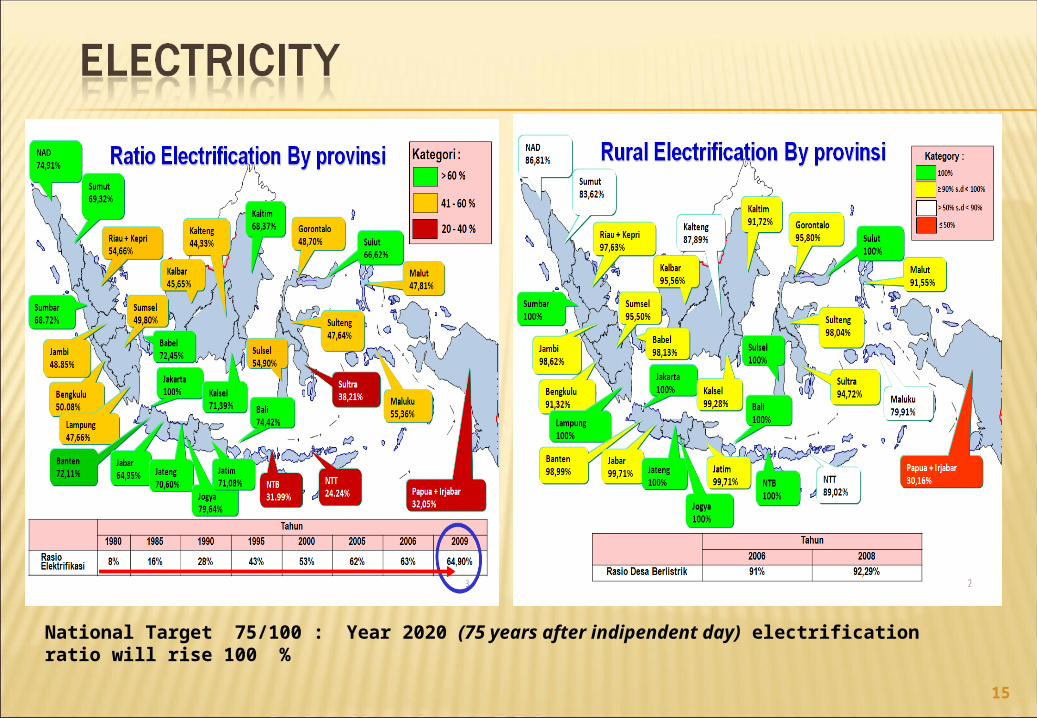
National Target 75/100 : Year 2020 (75 years after indipendent day) electrification ratio will rise 100 %
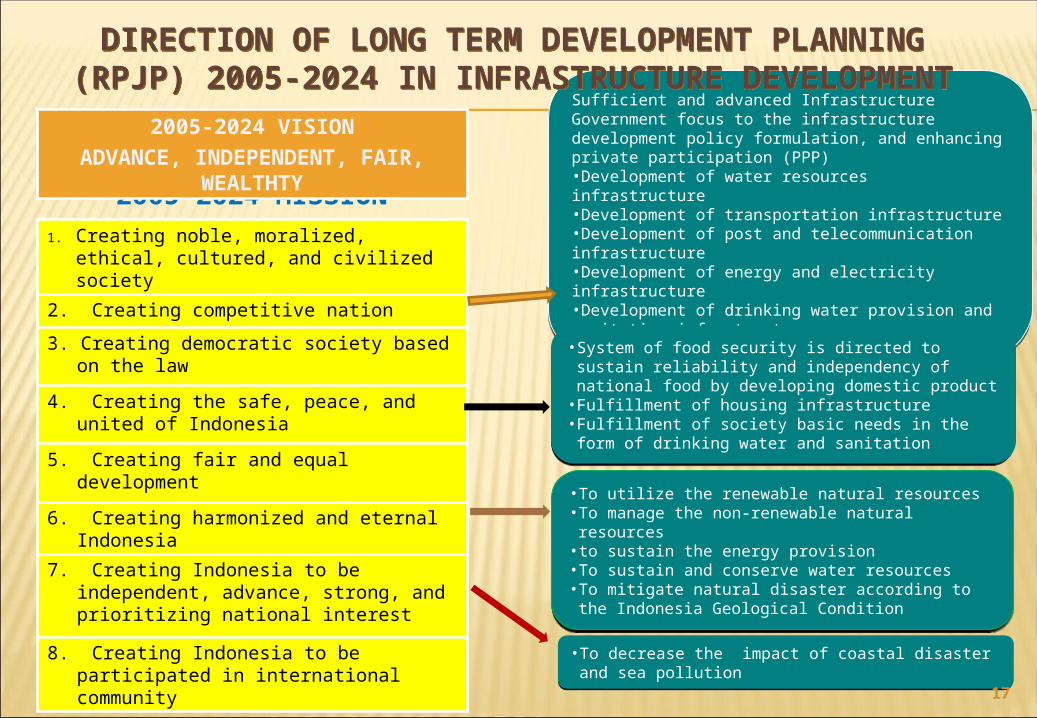
1. Creating noble, moralized, ethical, cultured, and civilized society
2. Creating competitive nation
3. Creating democratic society based on the law
4. Creating the safe, peace, and united of Indonesia
5. Creating fair and equal development
6. Creating harmonized and eternal Indonesia
7. Creating Indonesia to be independent, advance, strong, and prioritizing national interest
8. Creating Indonesia to be participated in international community
2005-2024 MISSION
2005-2024 VISIONADVANCE, INDEPENDENT, FAIR, WEALTHTY
Sufficient and advanced Infrastructure Government focus to the infrastructure development policy formulation, and enhancing private participation (PPP)•Development of water resources infrastructure•Development of transportation infrastructure•Development of post and telecommunication infrastructure•Development of energy and electricity infrastructure•Development of drinking water provision and sanitation infrastructure
Sufficient and advanced Infrastructure Government focus to the infrastructure development policy formulation, and enhancing private participation (PPP)•Development of water resources infrastructure•Development of transportation infrastructure•Development of post and telecommunication infrastructure•Development of energy and electricity infrastructure•Development of drinking water provision and sanitation infrastructure
• System of food security is directed to sustain reliability and independency of national food by developing domestic product
• Fulfillment of housing infrastructure• Fulfillment of society basic needs in the form of drinking water and sanitation
• System of food security is directed to sustain reliability and independency of national food by developing domestic product
• Fulfillment of housing infrastructure• Fulfillment of society basic needs in the form of drinking water and sanitation
• To utilize the renewable natural resources• To manage the non-renewable natural resources• to sustain the energy provision• To sustain and conserve water resources• To mitigate natural disaster according to the Indonesia Geological Condition
• To utilize the renewable natural resources• To manage the non-renewable natural resources• to sustain the energy provision• To sustain and conserve water resources• To mitigate natural disaster according to the Indonesia Geological Condition
• To decrease the impact of coastal disaster and sea pollution
• To decrease the impact of coastal disaster and sea pollution
DIRECTION OF LONG TERM DEVELOPMENT PLANNING (RPJP) 2005-2024 IN INFRASTRUCTURE DEVELOPMENTDIRECTION OF LONG TERM DEVELOPMENT PLANNING (RPJP) 2005-2024 IN INFRASTRUCTURE DEVELOPMENT
17
18
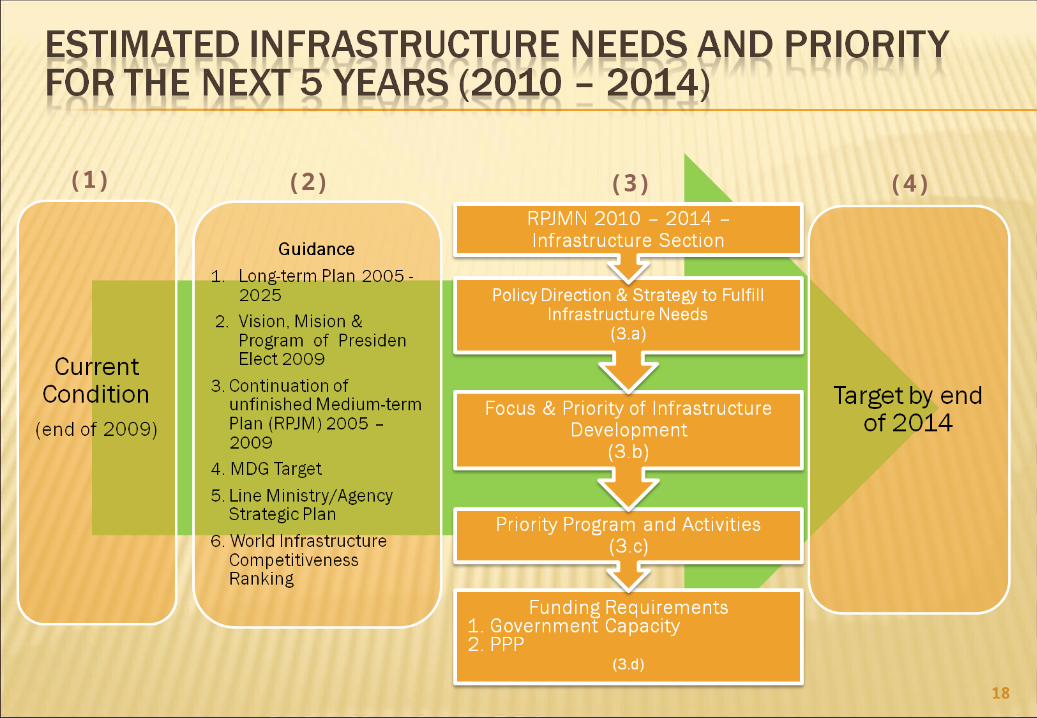
(1) (2) (3) (4)
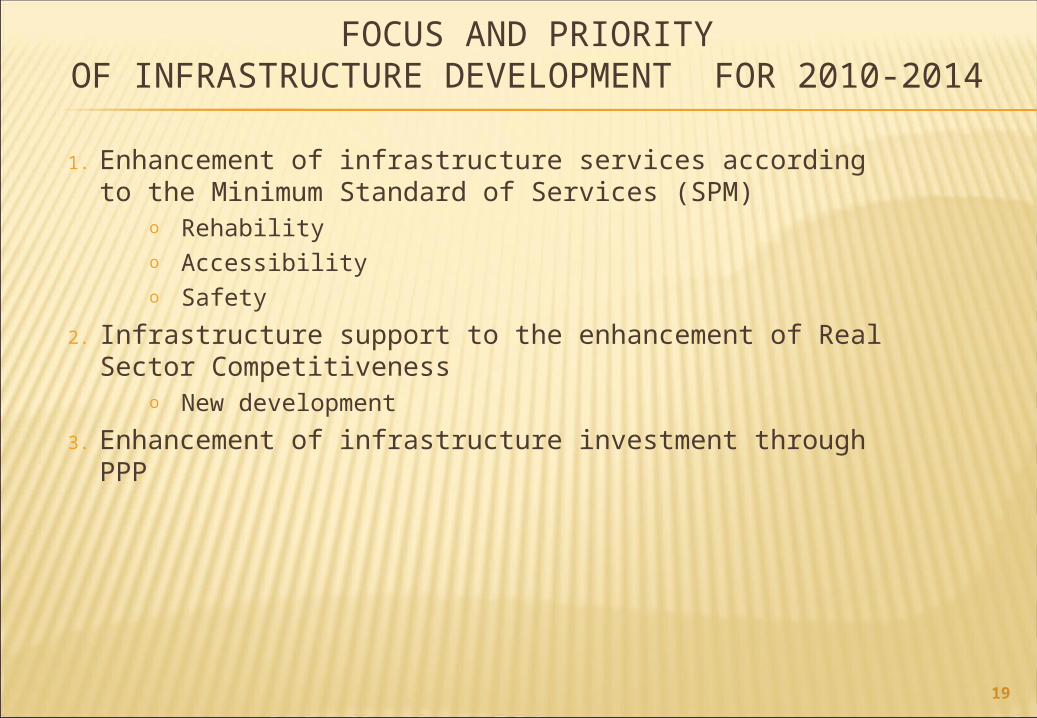
FOCUS AND PRIORITYOF INFRASTRUCTURE DEVELOPMENT FOR 2010-2014
1. Enhancement of infrastructure services according to the Minimum Standard of Services (SPM)
o Rehabilityo Accessibilityo Safety
2. Infrastructure support to the enhancement of Real Sector Competitiveness
o New development
3. Enhancement of infrastructure investment through PPP
19
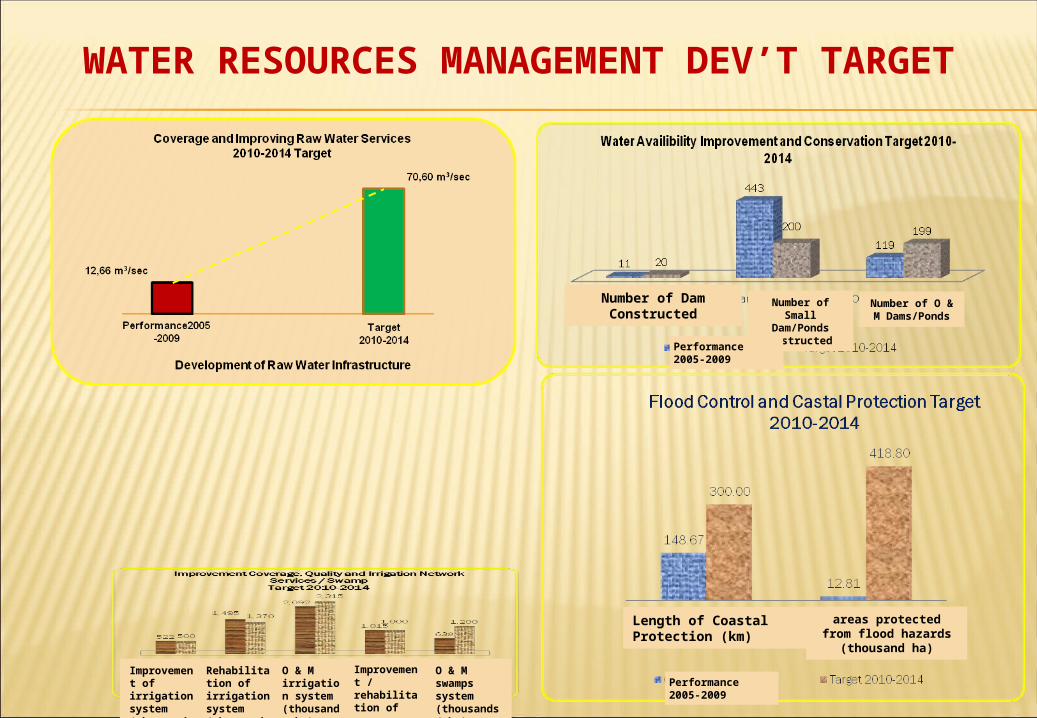
WATER RESOURCES MANAGEMENT DEV’T TARGET
Number of Dam Constructed
Number of Small Dam/Ponds
Constructed
Number of O & M Dams/Ponds
Performance 2005-2009
Length of Coastal Protection (km)
areas protected from flood hazards (thousand
ha)
Performance 2005-2009Improvement of irrigation system(thousands ha)
Rehabilitation of irrigation system(thousands ha)
O & M irrigation system(thousands ha)
Improvement / rehabilitation of swamps(thousands / ha)
O & M swamps system(thousands / ha)
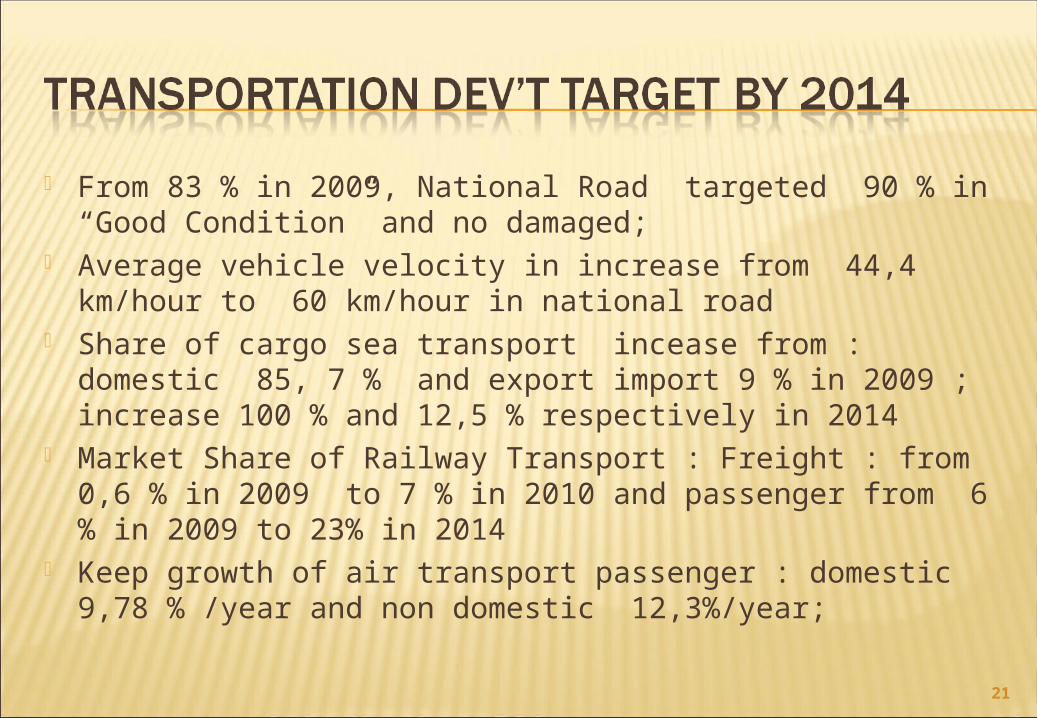
From 83 % in 2009, National Road targeted 90 % in “Good Condition” and no damaged;
Average vehicle velocity in increase from 44,4 km/hour to 60 km/hour in national road
Share of cargo sea transport incease from : domestic 85, 7 % and export import 9 % in 2009 ; increase 100 % and 12,5 % respectively in 2014
Market Share of Railway Transport : Freight : from 0,6 % in 2009 to 7 % in 2010 and passenger from 6 % in 2009 to 23% in 2014
Keep growth of air transport passenger : domestic 9,78 % /year and non domestic 12,3%/year;
21
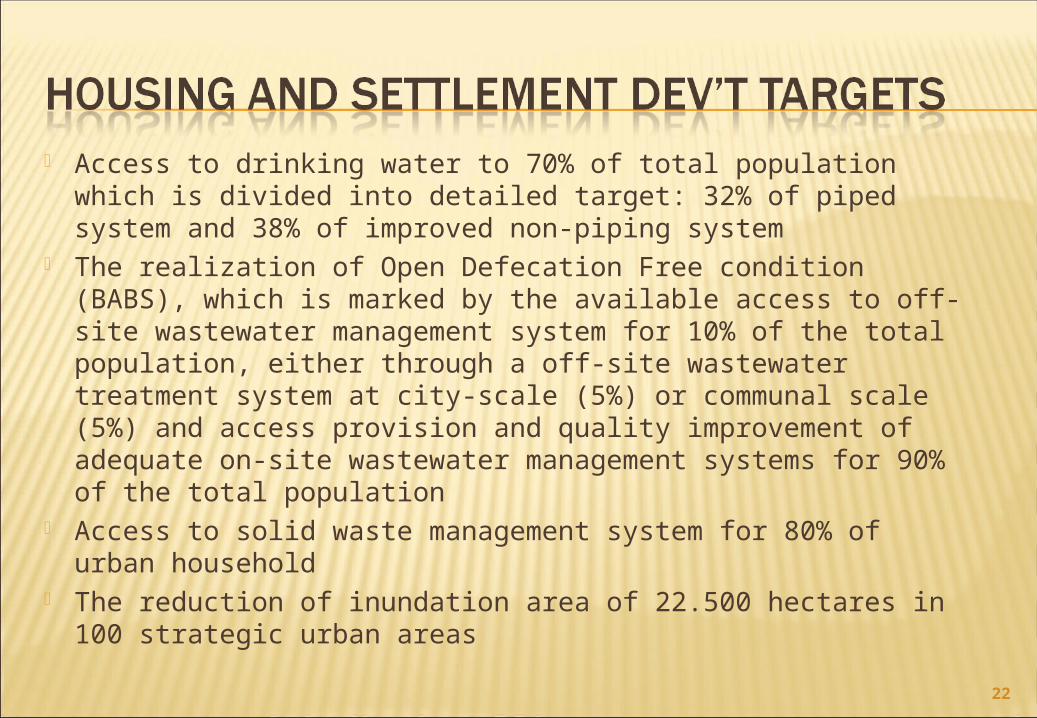
Access to drinking water to 70% of total population which is divided into detailed target: 32% of piped system and 38% of improved non-piping system
The realization of Open Defecation Free condition (BABS), which is marked by the available access to off-site wastewater management system for 10% of the total population, either through a off-site wastewater treatment system at city-scale (5%) or communal scale (5%) and access provision and quality improvement of adequate on-site wastewater management systems for 90% of the total population
Access to solid waste management system for 80% of urban household
The reduction of inundation area of 22.500 hectares in 100 strategic urban areas
22
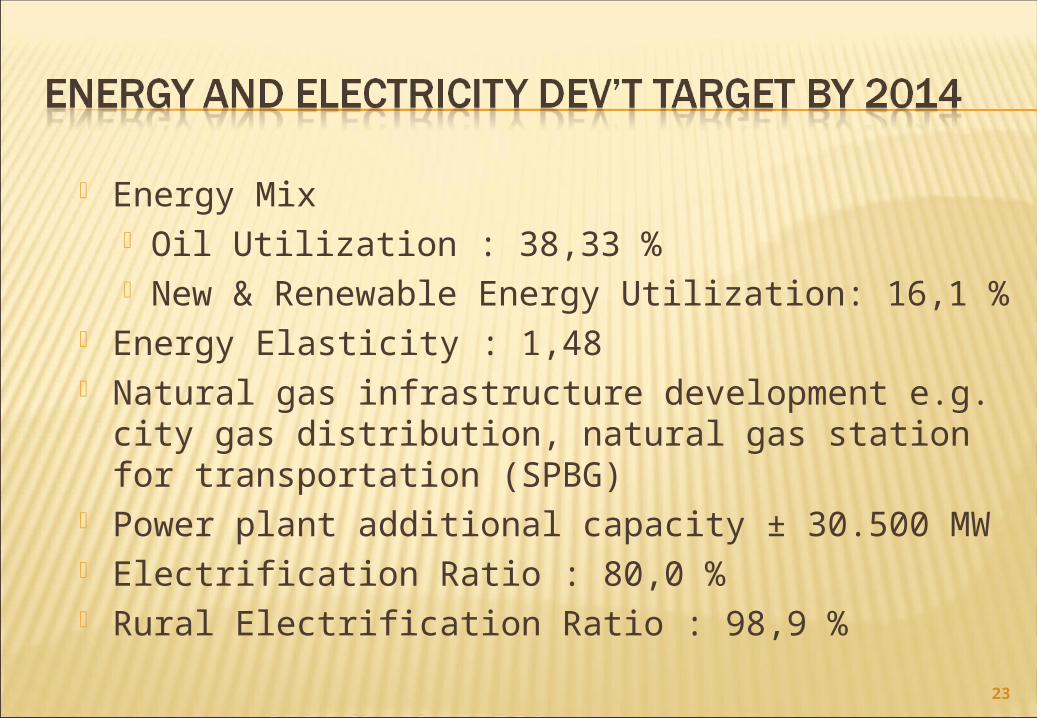
Energy Mix Oil Utilization : 38,33 % New & Renewable Energy Utilization: 16,1 %
Energy Elasticity : 1,48 Natural gas infrastructure development e.g. city
gas distribution, natural gas station for transportation (SPBG)
Power plant additional capacity ± 30.500 MW Electrification Ratio : 80,0 % Rural Electrification Ratio : 98,9 %
23
24
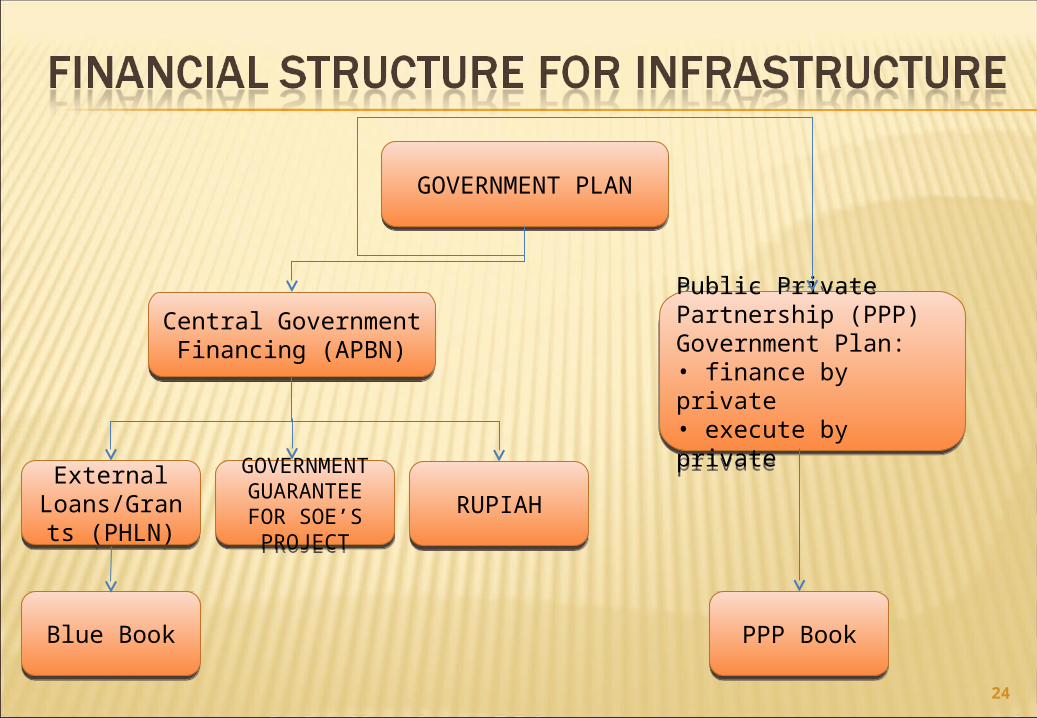
GOVERNMENT PLANGOVERNMENT PLAN
Central Government Financing (APBN)Central Government Financing (APBN)
Public Private Partnership (PPP)Government Plan:• finance by private• execute by private
Public Private Partnership (PPP)Government Plan:• finance by private• execute by private
External Loans/Grants (PHLN)
External Loans/Grants (PHLN)
RUPIAHRUPIAH
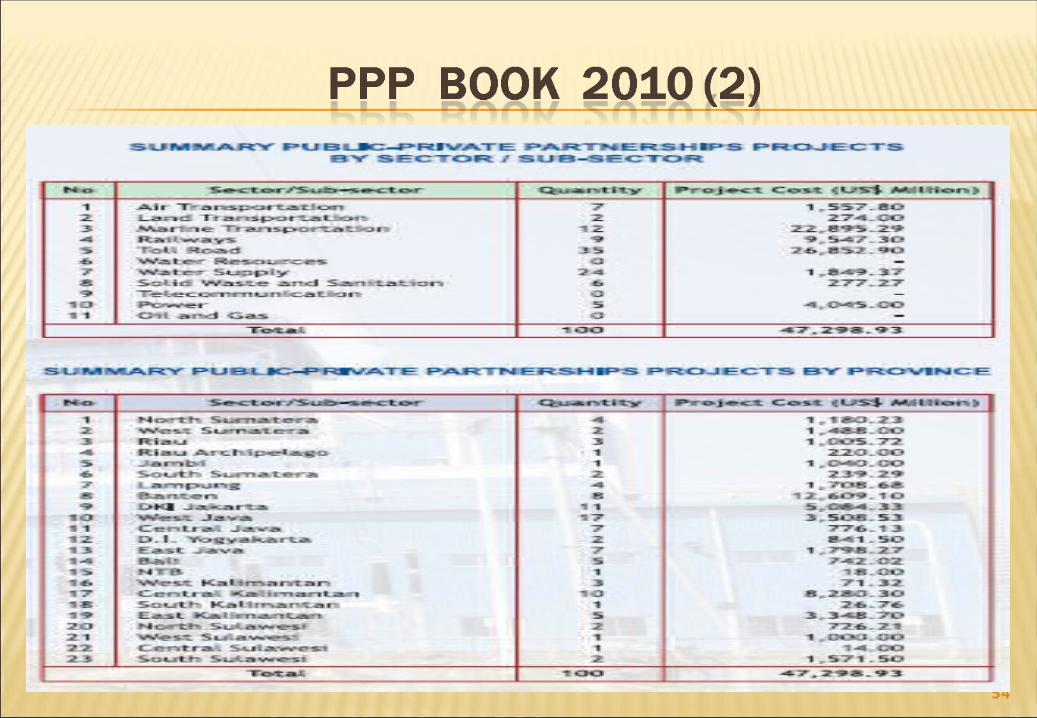
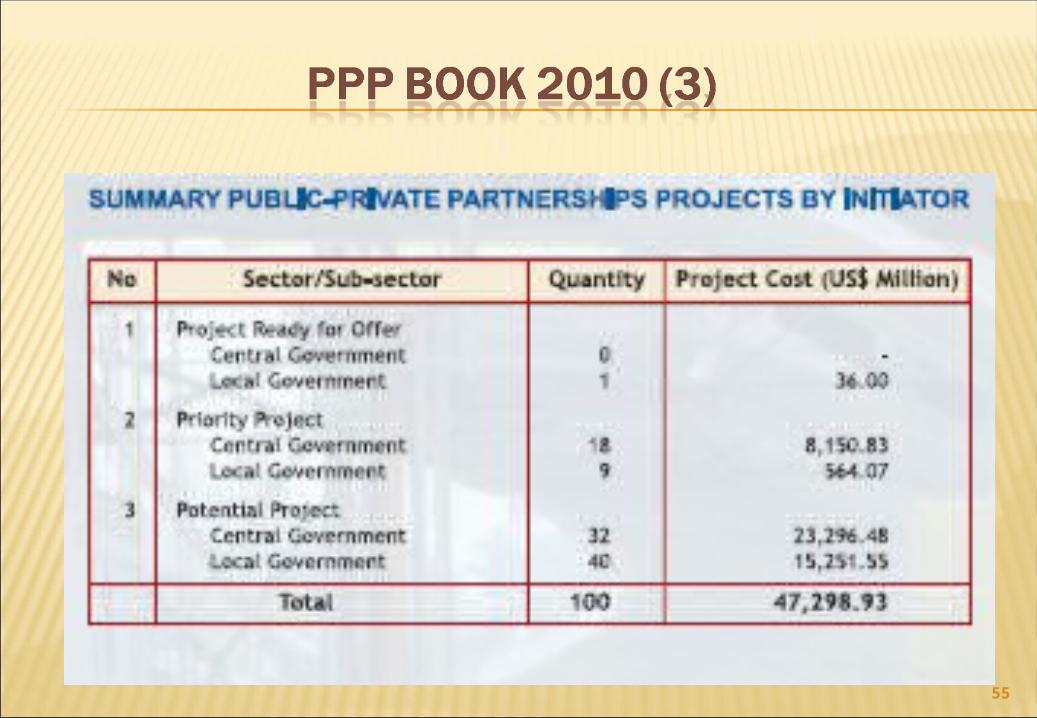
Blue BookBlue Book PPP BookPPP Book
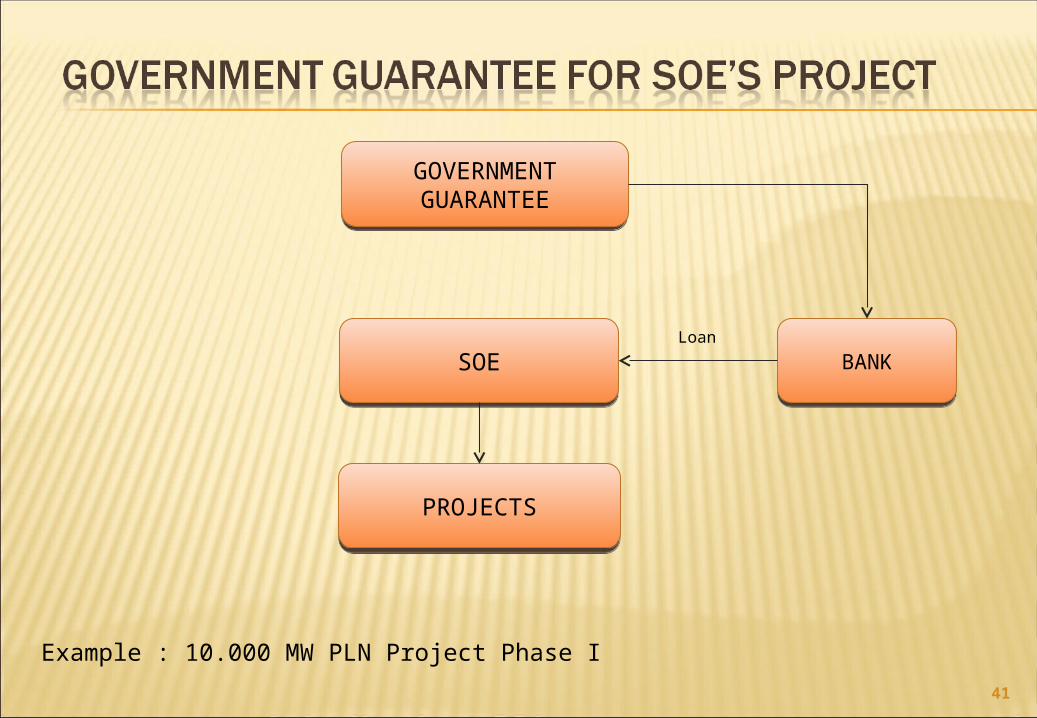
GOVERNMENT GUARANTEE FOR SOE’S PROJECT
GOVERNMENT GUARANTEE FOR SOE’S PROJECT
Rupiah External Loan/ Grant Government
Guarantee
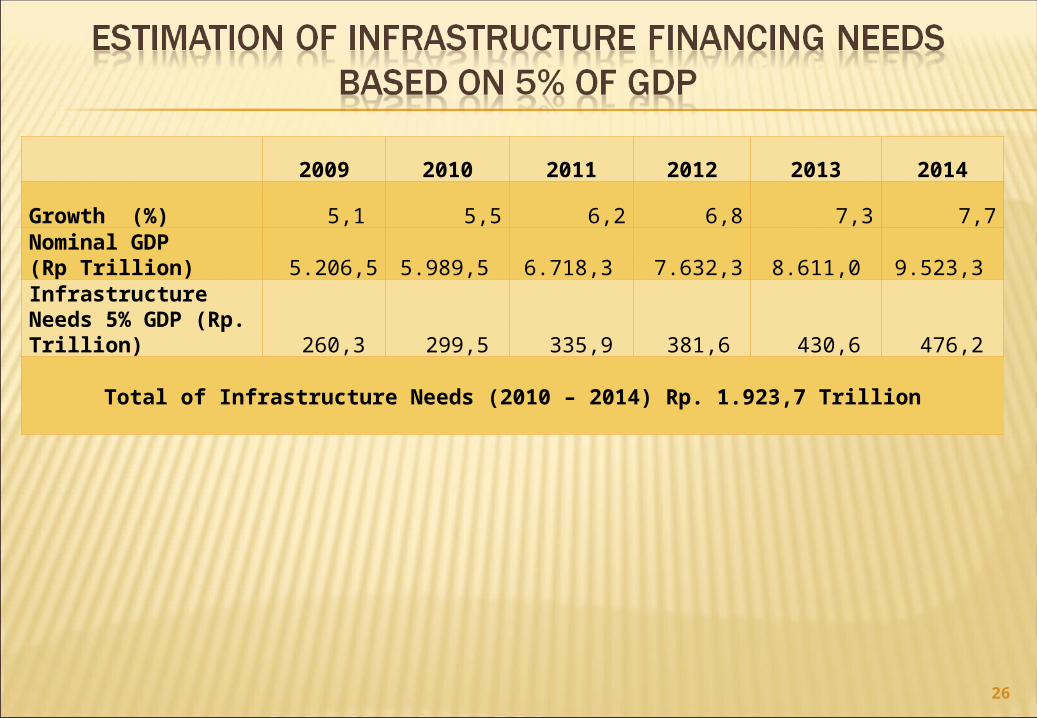
2009 2010 2011 2012 2013 2014Growth (%) 5,1 5,5 6,2 6,8 7,3 7,7Nominal GDP (Rp Trillion) 5.206,5 5.989,5 6.718,3 7.632,3 8.611,0 9.523,3 Infrastructure Needs 5% GDP (Rp. Trillion) 260,3 299,5 335,9 381,6 430,6 476,2
Total of Infrastructure Needs (2010 – 2014) Rp. 1.923,7 Trillion
26
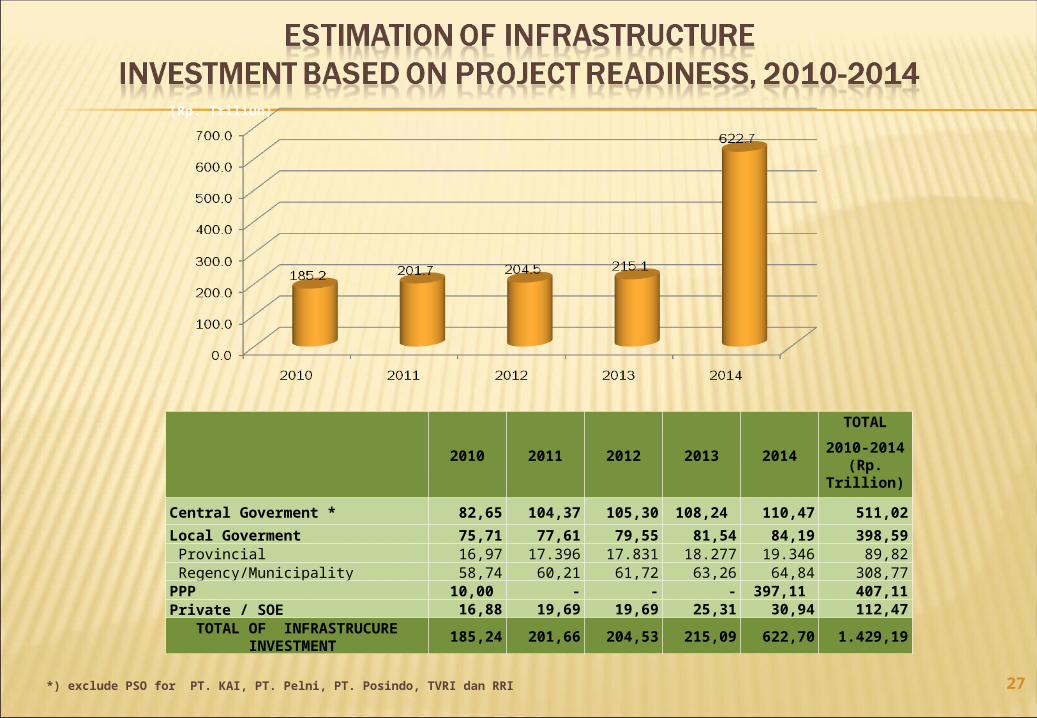
*) exclude PSO for PT. KAI, PT. Pelni, PT. Posindo, TVRI dan RRI 27
2010 2011 2012 2013 2014
TOTAL2010-2014 (Rp.
Trillion)Central Goverment * 82,65 104,37 105,30 108,24 110,47 511,02Local Goverment 75,71 77,61 79,55 81,54 84,19 398,59 Provincial 16,97 17.396 17.831 18.277 19.346 89,82 Regency/Municipality 58,74 60,21 61,72 63,26 64,84 308,77PPP 10,00 - - - 397,11 407,11Private / SOE 16,88 19,69 19,69 25,31 30,94 112,47
TOTAL OF INFRASTRUCURE INVESTMENT
185,24 201,66 204,53 215,09 622,70 1.429,19
(Rp. Triliun)
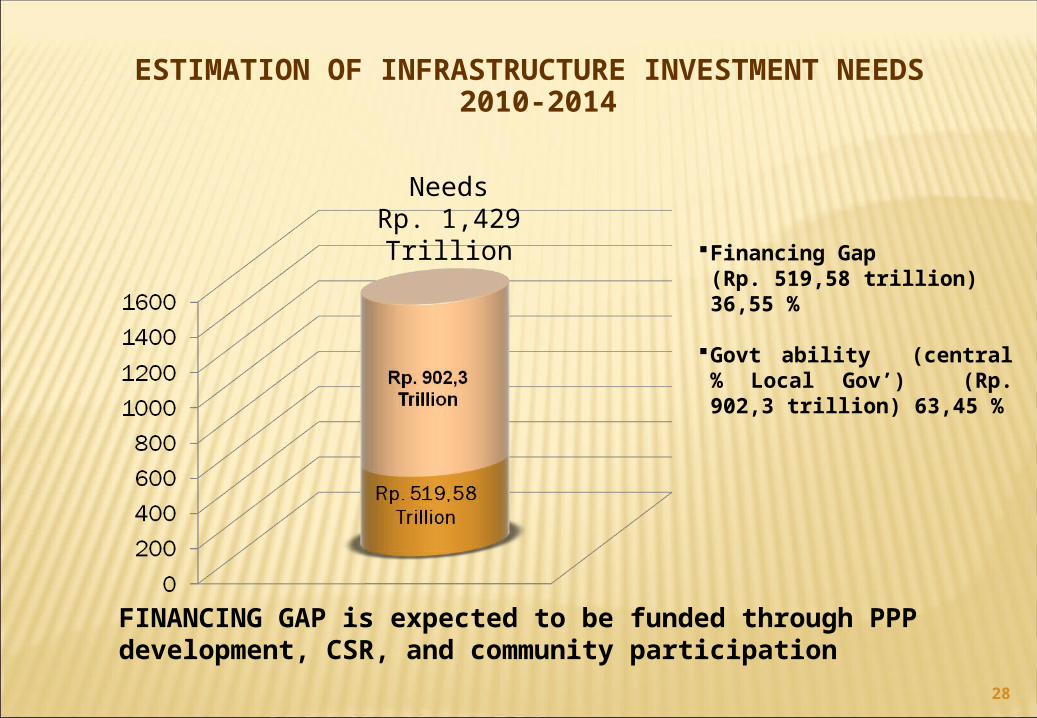
ESTIMATION OF INFRASTRUCTURE INVESTMENT NEEDS 2010-2014
FINANCING GAP is expected to be funded through PPP development, CSR, and community participation
NeedsRp. 1,429 Trillion
28
Financing Gap (Rp. 519,58 trillion) 36,55 %
Govt ability (central % Local Gov’) (Rp. 902,3 trillion) 63,45 %
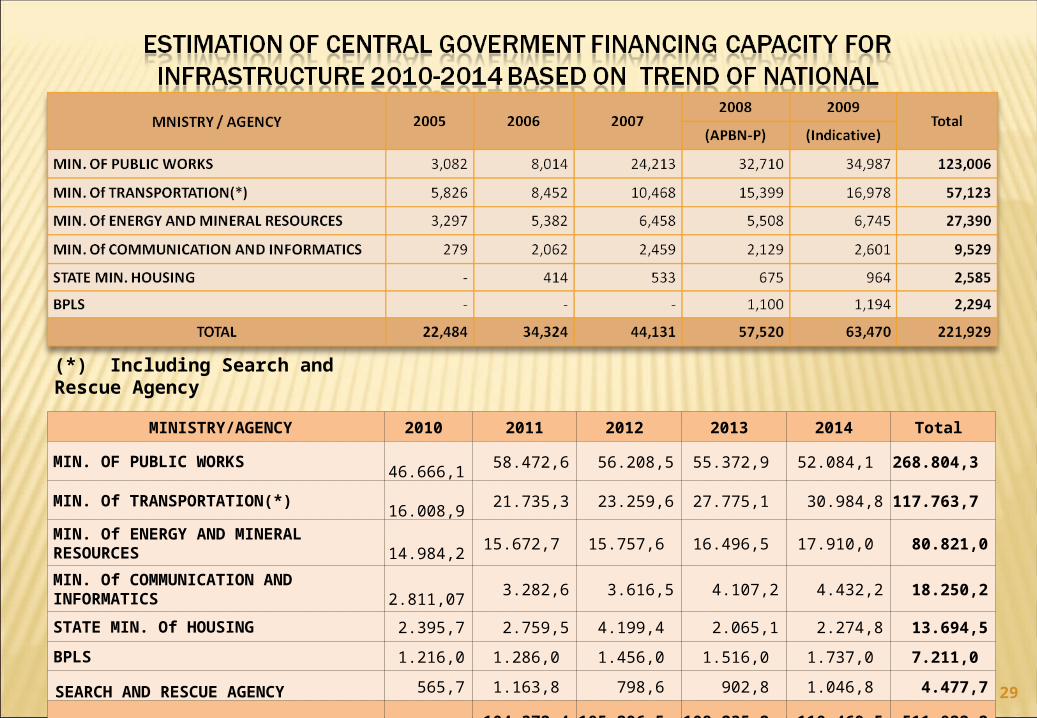
(*) Including Search and Rescue Agency
MINISTRY/AGENCY 2010 2011 2012 2013 2014 Total
MIN. OF PUBLIC WORKS 46.666,1 58.472,6 56.208,5 55.372,9 52.084,1 268.804,3
MIN. Of TRANSPORTATION(*) 16.008,9 21.735,3 23.259,6 27.775,1 30.984,8 117.763,7
MIN. Of ENERGY AND MINERAL RESOURCES 14.984,2 15.672,7 15.757,6 16.496,5 17.910,0 80.821,0
MIN. Of COMMUNICATION AND INFORMATICS 2.811,07 3.282,6 3.616,5 4.107,2 4.432,2 18.250,2
STATE MIN. Of HOUSING 2.395,7 2.759,5 4.199,4 2.065,1 2.274,8 13.694,5
BPLS 1.216,0 1.286,0 1.456,0 1.516,0 1.737,0 7.211,0
SEARCH AND RESCUE AGENCY 565,7 1.163,8 798,6 902,8 1.046,8 4.477,7
TOTAL 82.648,5 104.372,4 105.296,5 108.235,2 110.469,5 511.022,2
29
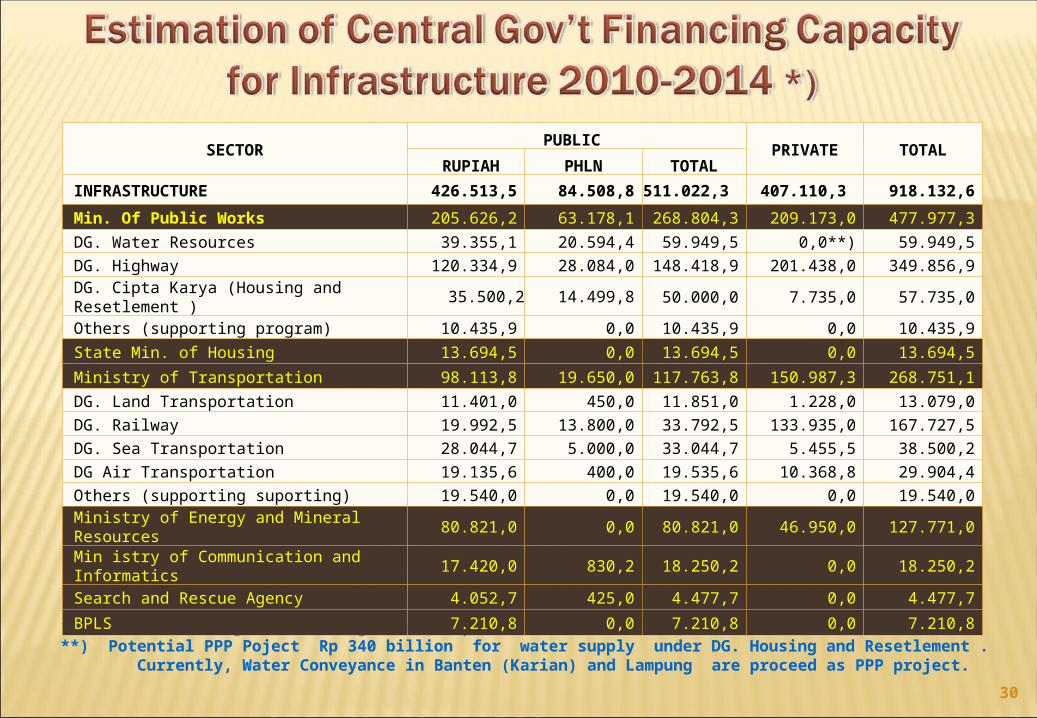
*) Exclude financing from local goverment, private, and SOE**) Potential PPP Poject Rp 340 billion for water supply under DG. Housing and Resetlement . Currently, Water Conveyance in Banten (Karian) and Lampung are proceed as PPP project.
SECTORPUBLIC
PRIVATE TOTAL RUPIAH PHLN TOTAL
INFRASTRUCTURE 426.513,5 84.508,8 511.022,3 407.110,3 918.132,6
Min. Of Public Works 205.626,2 63.178,1 268.804,3 209.173,0 477.977,3DG. Water Resources 39.355,1 20.594,4 59.949,5 0,0**) 59.949,5DG. Highway 120.334,9 28.084,0 148.418,9 201.438,0 349.856,9DG. Cipta Karya (Housing and Resetlement )
35.500,2 14.499,8 50.000,0 7.735,0 57.735,0
Others (supporting program) 10.435,9 0,0 10.435,9 0,0 10.435,9State Min. of Housing 13.694,5 0,0 13.694,5 0,0 13.694,5Ministry of Transportation 98.113,8 19.650,0 117.763,8 150.987,3 268.751,1DG. Land Transportation 11.401,0 450,0 11.851,0 1.228,0 13.079,0DG. Railway 19.992,5 13.800,0 33.792,5 133.935,0 167.727,5DG. Sea Transportation 28.044,7 5.000,0 33.044,7 5.455,5 38.500,2DG Air Transportation 19.135,6 400,0 19.535,6 10.368,8 29.904,4Others (supporting suporting) 19.540,0 0,0 19.540,0 0,0 19.540,0Ministry of Energy and Mineral Resources 80.821,0 0,0 80.821,0 46.950,0 127.771,0Min istry of Communication and Informatics
17.420,0 830,2 18.250,2 0,0 18.250,2
Search and Rescue Agency 4.052,7 425,0 4.477,7 0,0 4.477,7
BPLS 7.210,8 0,0 7.210,8 0,0 7.210,8
30
31
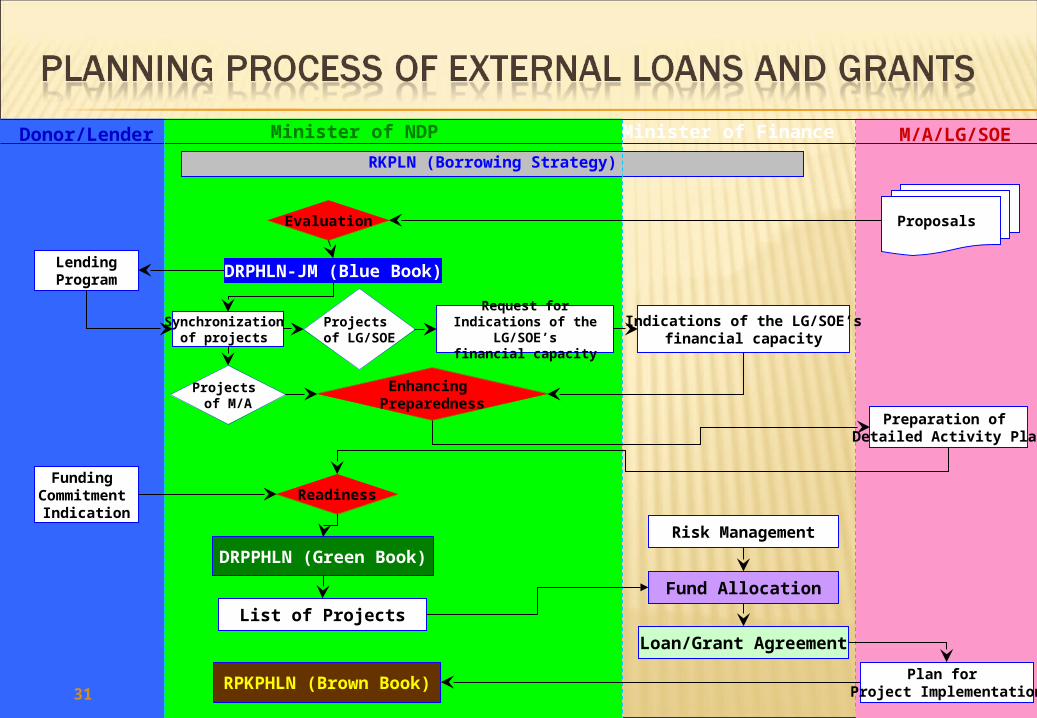
Minister of FinanceMinister of NDP M/A/LG/SOE
Proposals
RKPLN (Borrowing Strategy)
Donor/Lender
LendingProgram
Evaluation
DRPHLN-JM (Blue Book)
Synchronization of projects
Preparation of Detailed Activity Plan
Indications of the LG/SOE’sfinancial capacity
Request for Indications of the LG/SOE’s
financial capacity
Enhancing Preparedness
Readiness
DRPPHLN (Green Book)
List of Projects
Funding Commitment
Indication
Fund Allocation
Loan/Grant Agreement
RPKPHLN (Brown Book)
Risk Management
Plan for Project Implementation
Projects of LG/SOE
Projects of M/A
31
32
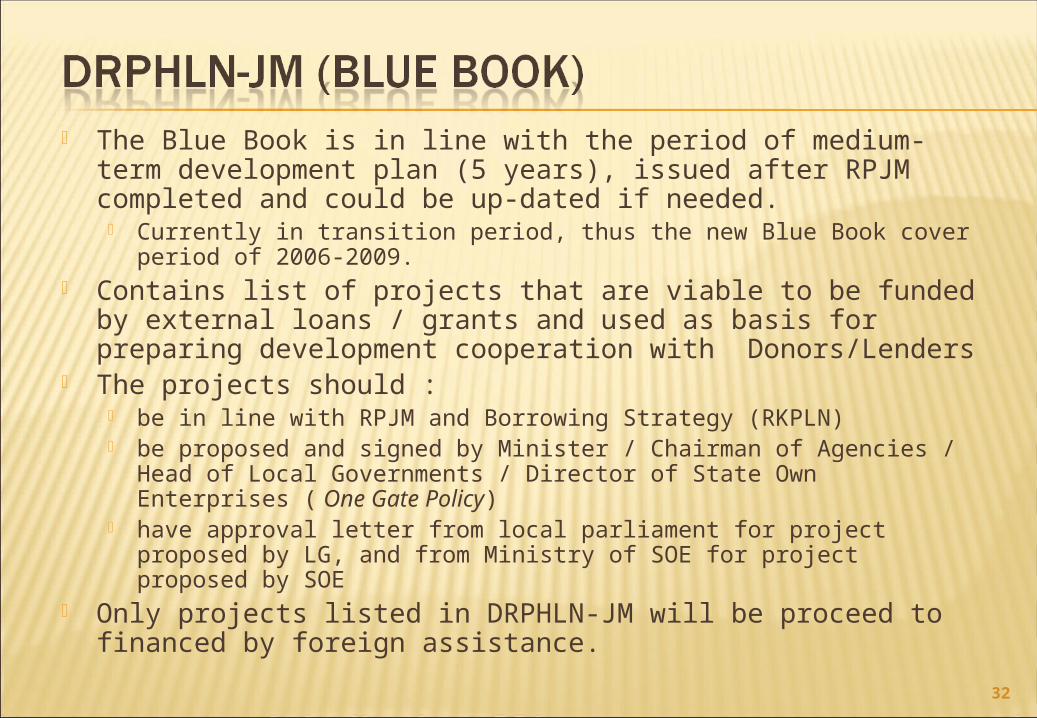
The Blue Book is in line with the period of medium-term development plan (5 years), issued after RPJM completed and could be up-dated if needed. Currently in transition period, thus the new Blue Book cover period of
2006-2009. Contains list of projects that are viable to be funded by
external loans / grants and used as basis for preparing development cooperation with Donors/Lenders
The projects should : be in line with RPJM and Borrowing Strategy (RKPLN) be proposed and signed by Minister / Chairman of Agencies / Head of
Local Governments / Director of State Own Enterprises ( One Gate Policy)
have approval letter from local parliament for project proposed by LG, and from Ministry of SOE for project proposed by SOE
Only projects listed in DRPHLN-JM will be proceed to financed by foreign assistance.
33
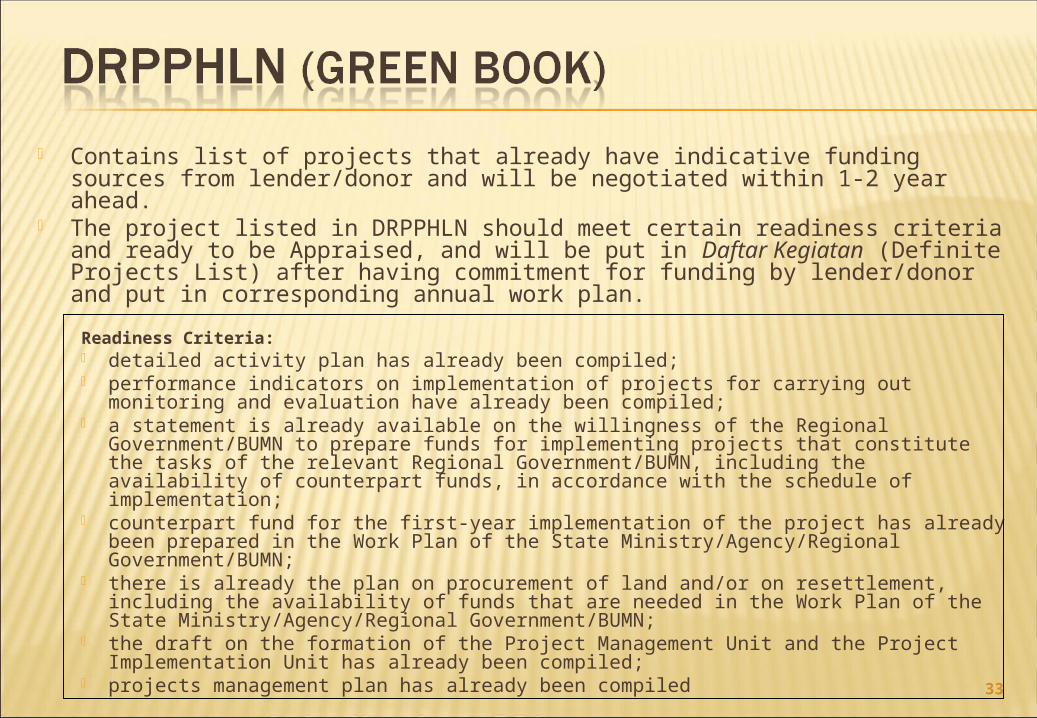
Contains list of projects that already have indicative funding sources from lender/donor and will be negotiated within 1-2 year ahead.
The project listed in DRPPHLN should meet certain readiness criteria and ready to be Appraised, and will be put in Daftar Kegiatan (Definite Projects List) after having commitment for funding by lender/donor and put in corresponding annual work plan.
Readiness Criteria: detailed activity plan has already been compiled; performance indicators on implementation of projects for carrying out monitoring
and evaluation have already been compiled; a statement is already available on the willingness of the Regional
Government/BUMN to prepare funds for implementing projects that constitute the tasks of the relevant Regional Government/BUMN, including the availability of counterpart funds, in accordance with the schedule of implementation;
counterpart fund for the first-year implementation of the project has already been prepared in the Work Plan of the State Ministry/Agency/Regional Government/BUMN;
there is already the plan on procurement of land and/or on resettlement, including the availability of funds that are needed in the Work Plan of the State Ministry/Agency/Regional Government/BUMN;
the draft on the formation of the Project Management Unit and the Project Implementation Unit has already been compiled;
projects management plan has already been compiled
34
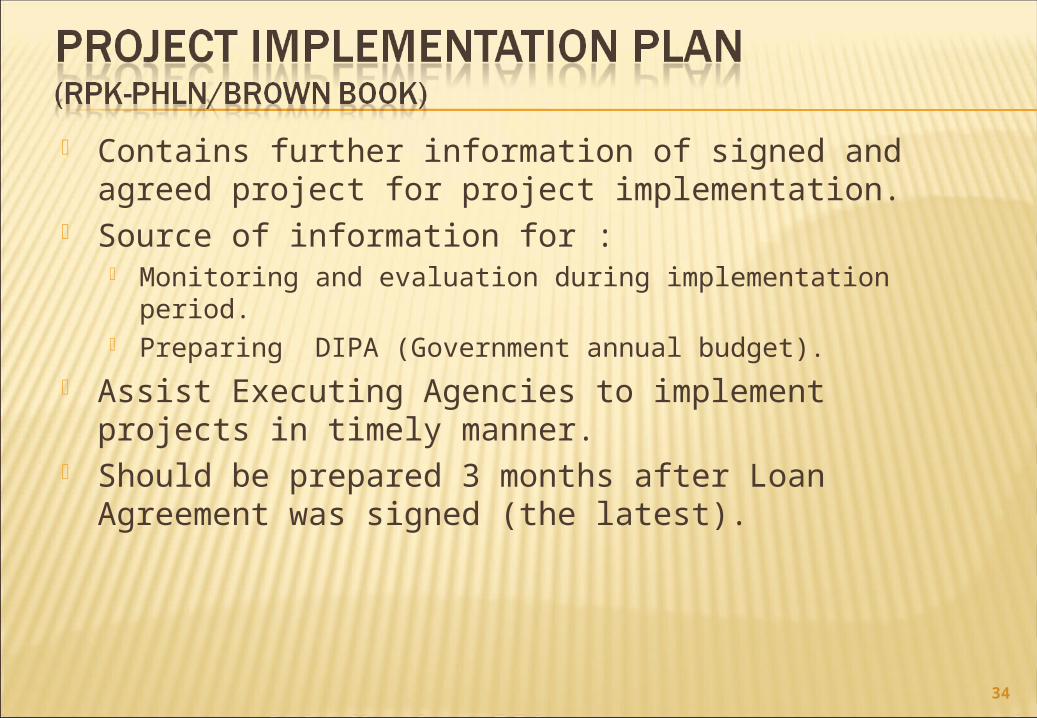
Contains further information of signed and agreed project for project implementation.
Source of information for : Monitoring and evaluation during implementation period. Preparing DIPA (Government annual budget).
Assist Executing Agencies to implement projects in timely manner.
Should be prepared 3 months after Loan Agreement was signed (the latest).
35
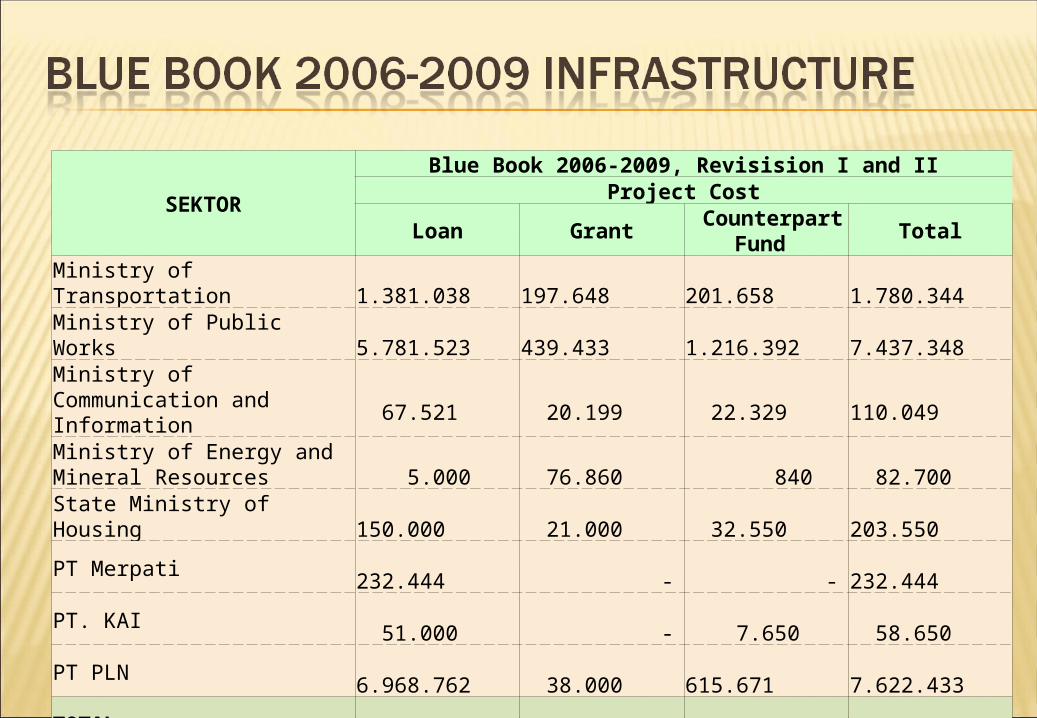
SEKTOR
Blue Book 2006-2009, Revisision I and II Project Cost
Loan Grant Counterpart
Fund Total
Ministry of Transportation 1.381.038 197.648 201.658 1.780.344
Ministry of Public Works 5.781.523 439.433 1.216.392 7.437.348
Ministry of Communication and Information
67.521 20.199 22.329 110.049
Ministry of Energy and Mineral Resources
5.000 76.860 840 82.700
State Ministry of Housing 150.000 21.000 32.550 203.550
PT Merpati 232.444 - - 232.444
PT. KAI 51.000 - 7.650 58.650
PT PLN 6.968.762 38.000 615.671 7.622.433
TOTAL 14.637.288 793.140 2.097.091 17.527.519
36
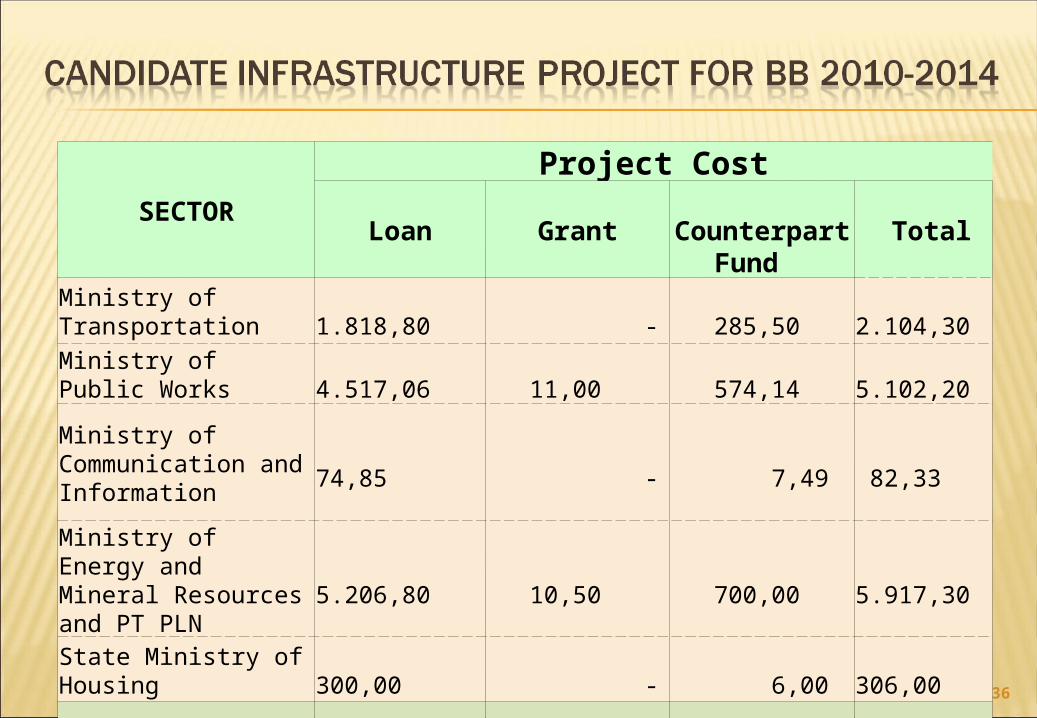
SECTOR Project Cost
Loan Grant Counterpart
Fund Total
Ministry of Transportation
1.818,80 - 285,50 2.104,30
Ministry of Public Works 4.517,06 11,00 574,14 5.102,20
Ministry of Communication and Information
74,85 - 7,49 82,33
Ministry of Energy and Mineral Resources and PT PLN
5.206,80 10,50 700,00 5.917,30
State Ministry of Housing
300,00 - 6,00 306,00
TOTAL 11.917,51 21,50 1.573,13 13.512,13
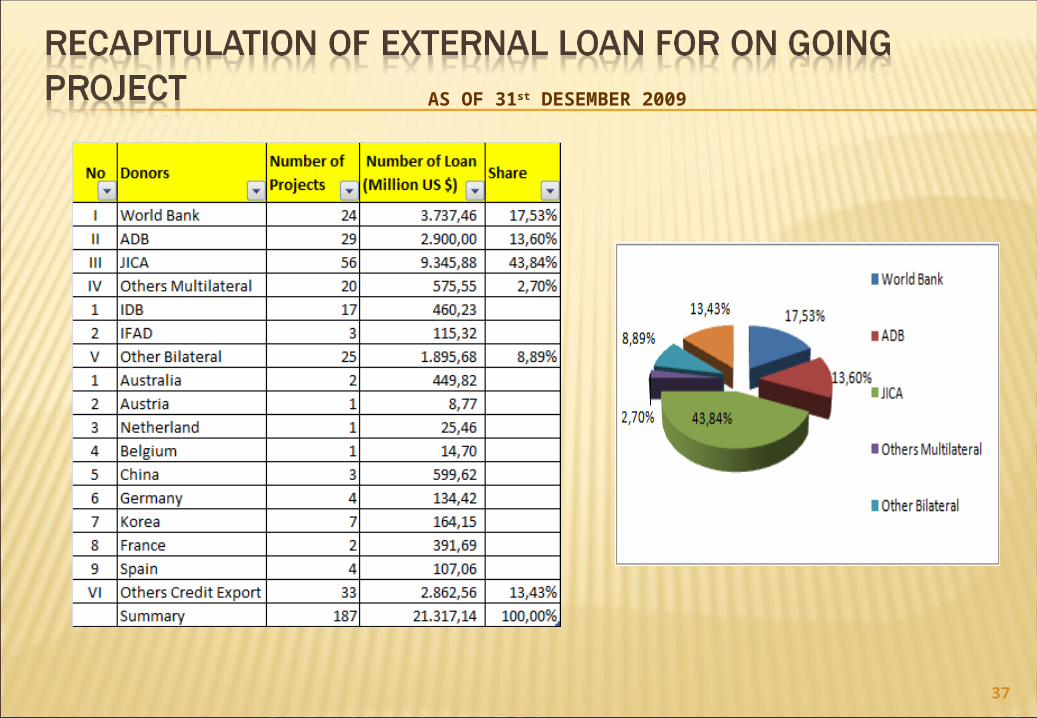
AS OF 31st DESEMBER 2009
37
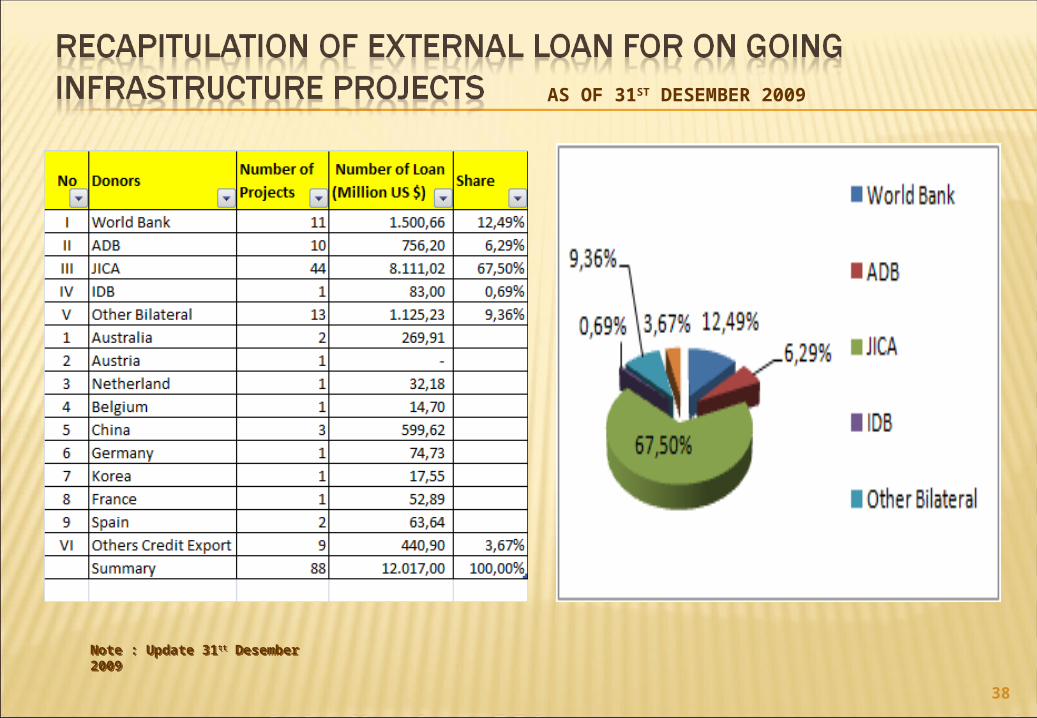
Note : Update 31tt Desember 2009Note : Update 31tt Desember 2009
AS OF 31ST DESEMBER 2009
38
AS OF 31ST DESEMBER 2009
39
40
41
GOVERNMENT GUARANTEEGOVERNMENT GUARANTEE
PROJECTSPROJECTS
BANKBANKSOESOELoan
Example : 10.000 MW PLN Project Phase I
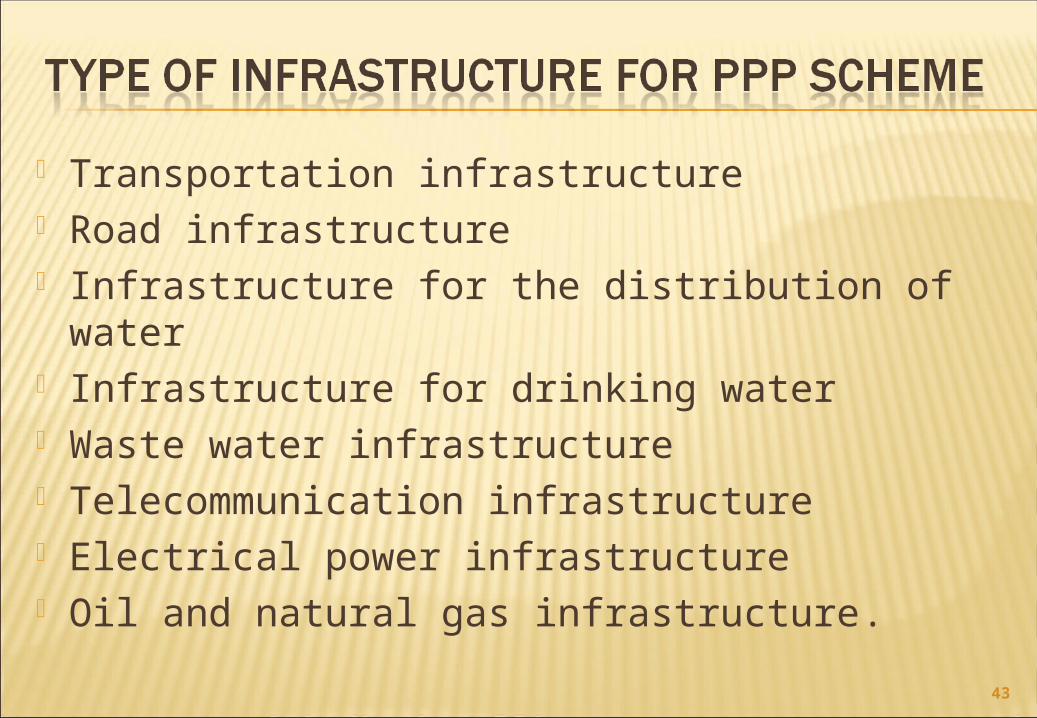
Transportation infrastructure Road infrastructure Infrastructure for the distribution of water Infrastructure for drinking water Waste water infrastructure Telecommunication infrastructure Electrical power infrastructure Oil and natural gas infrastructure.
43
44
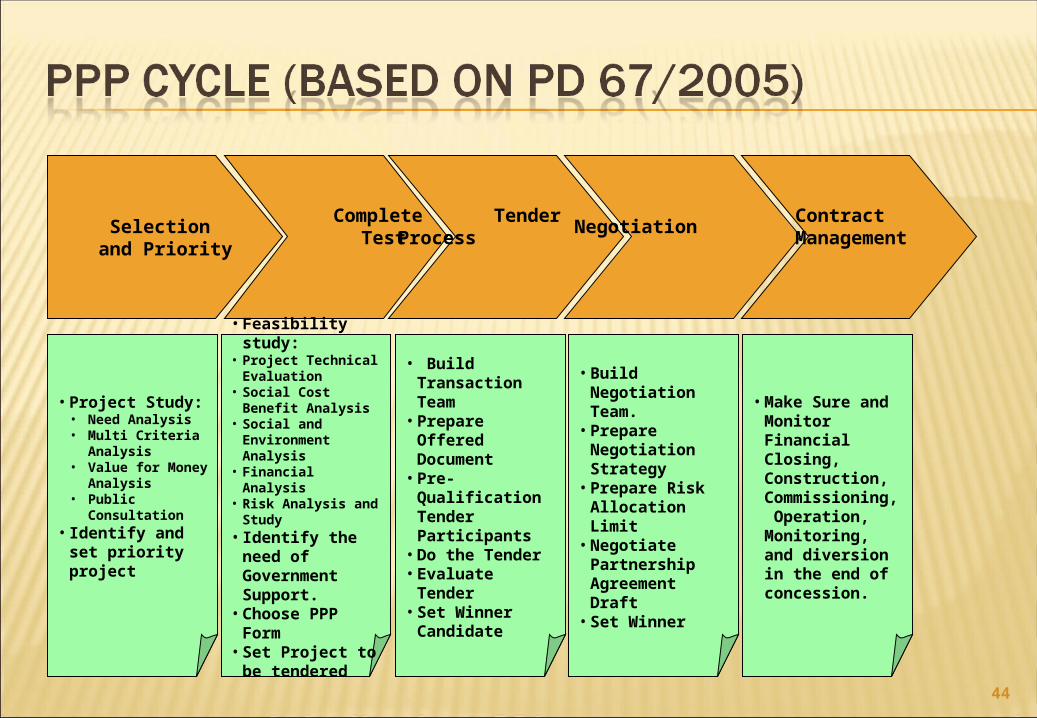
Selection and Priority
Complete Test
Tender Process
Negotiation Contract Management
• Project Study:• Need Analysis• Multi Criteria
Analysis• Value for Money
Analysis• Public
Consultation• Identify and set
priority project
• Feasibility study:• Project Technical
Evaluation• Social Cost Benefit
Analysis• Social and
Environment Analysis
• Financial Analysis• Risk Analysis and
Study• Identify the need
of Government Support.
• Choose PPP Form
• Set Project to be tendered
• Build Transaction Team
• Prepare Offered Document
• Pre-Qualification Tender Participants
• Do the Tender• Evaluate Tender• Set Winner
Candidate
• Build Negotiation Team.
• Prepare Negotiation Strategy
• Prepare Risk Allocation Limit
• Negotiate Partnership Agreement Draft
• Set Winner
• Make Sure and Monitor Financial Closing, Construction, Commissioning, Operation, Monitoring, and diversion in the end of concession.
Government realize the importance of PPP to cover infrastructure financing gap;
Measures have been taken on: Policy and regulatory framework Institutional and financial framework Project development facilities
Government is now in the final stage of completing the framework by establishing the PPP Central Unit (PPP-CU) and launching of the PPP Book.
45
PPP as part of Government policy package 2006 Issuance of Presidential regulation 67/2005 that
governing the process of developing PPP projects;
Issuance of Presidential regulations 36/2005 and 65/2006 on Land Acquisition to outline the rules and procedures for infrastructure projects serving public purpose;
Minister of Finance Decree No. 38/2006 on risks management of PPP projects
Various ministerial decrees related to PPP implementation
46
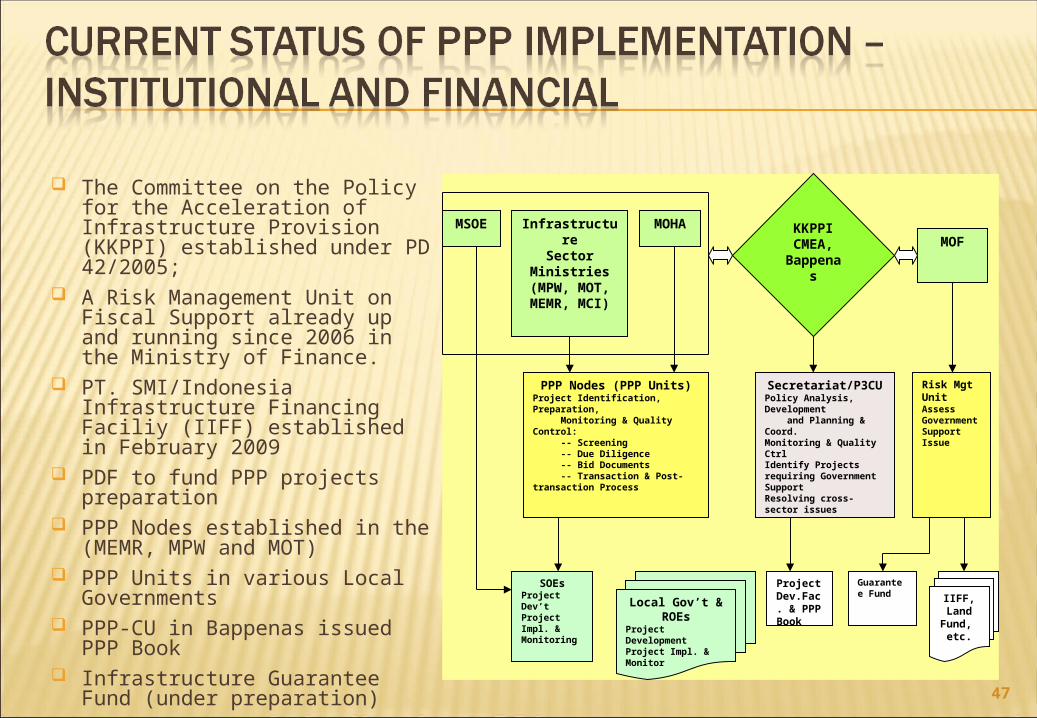
The Committee on the Policy for the Acceleration of Infrastructure Provision (KKPPI) established under PD 42/2005;
A Risk Management Unit on Fiscal Support already up and running since 2006 in the Ministry of Finance.
PT. SMI/Indonesia Infrastructure Financing Faciliy (IIFF) established in February 2009
PDF to fund PPP projects preparation
PPP Nodes established in the (MEMR, MPW and MOT)
PPP Units in various Local Governments
PPP-CU in Bappenas issued PPP Book
Infrastructure Guarantee Fund (under preparation)
47
Infrastructure
Sector Ministries
(MPW, MOT, MEMR, MCI)
KKPPICMEA, Bappen
as
MOF
PPP Nodes (PPP Units)Project Identification, Preparation, Monitoring & Quality Control: -- Screening -- Due Diligence -- Bid Documents -- Transaction & Post- transaction Process
Secretariat/P3CUPolicy Analysis, Development and Planning & Coord.Monitoring & Quality CtrlIdentify Projects requiring Government SupportResolving cross-sector issues
Risk Mgt UnitAssess Government SupportIssue
Guarantee Fund
ProjectDev.Fac. & PPP Book
IIFF, Land
Fund, etc.
MOHA
MSOE
SOEsProject Dev’tProject Impl. & Monitoring
Local Gov’t & ROEs
Project DevelopmentProject Impl. & Monitor
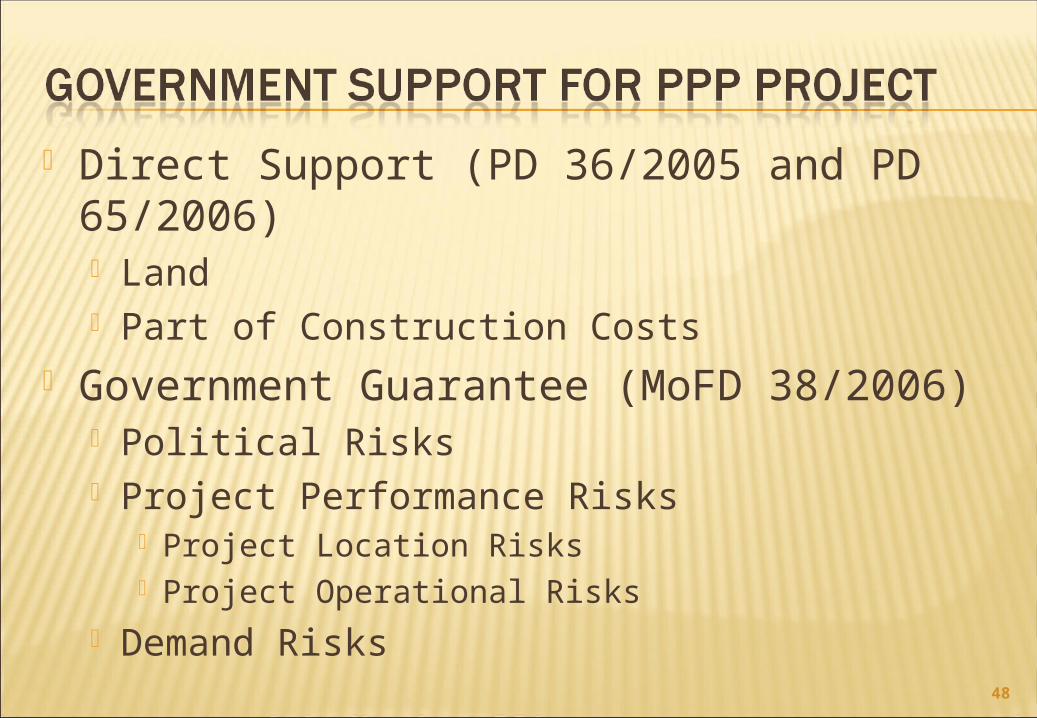
Direct Support (PD 36/2005 and PD 65/2006) Land Part of Construction Costs
Government Guarantee (MoFD 38/2006) Political Risks Project Performance Risks
Project Location Risks Project Operational Risks
Demand Risks48
Based on Presidential Instruction (Inpres) No. 5/2008 on Economic Development Focus 2008-2009
To confirm list of PPP Projects in the Government pipeline;
To ensure that the PPP project planning is transparent and preparations are done properly;
As an instrument to monitor the progress of PPP implementation;
As a mean for cross-sector and inter-region synchronization and coordination for PPP project preparation
As a mean for Public Consultation on PPP projects
49
50
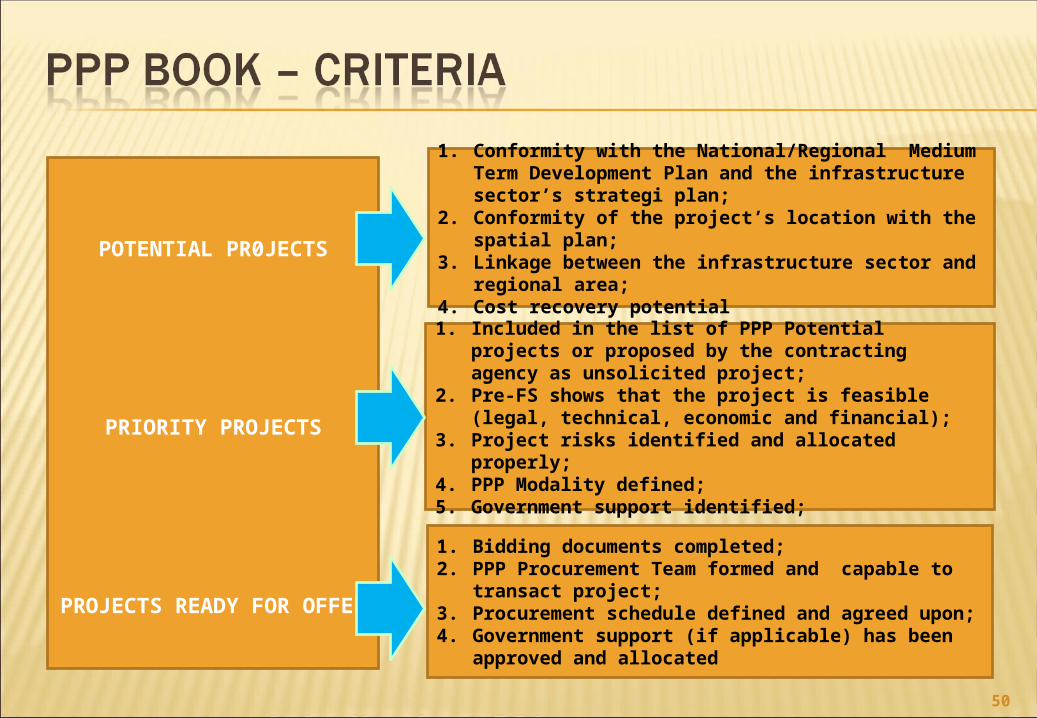
POTENTIAL PR0JECTS
PRIORITY PROJECTS
PROJECTS READY FOR OFFER
1. Conformity with the National/Regional Medium Term Development Plan and the infrastructure sector’s strategi plan;
2. Conformity of the project’s location with the spatial plan;3. Linkage between the infrastructure sector and regional
area;4. Cost recovery potential
1. Included in the list of PPP Potential projects or proposed by the contracting agency as unsolicited project;
2. Pre-FS shows that the project is feasible (legal, technical, economic and financial);
3. Project risks identified and allocated properly;4. PPP Modality defined; 5. Government support identified;
1. Bidding documents completed;2. PPP Procurement Team formed and capable to
transact project;3. Procurement schedule defined and agreed
upon;4. Government support (if applicable) has been
approved and allocated
51
52
53
54
55
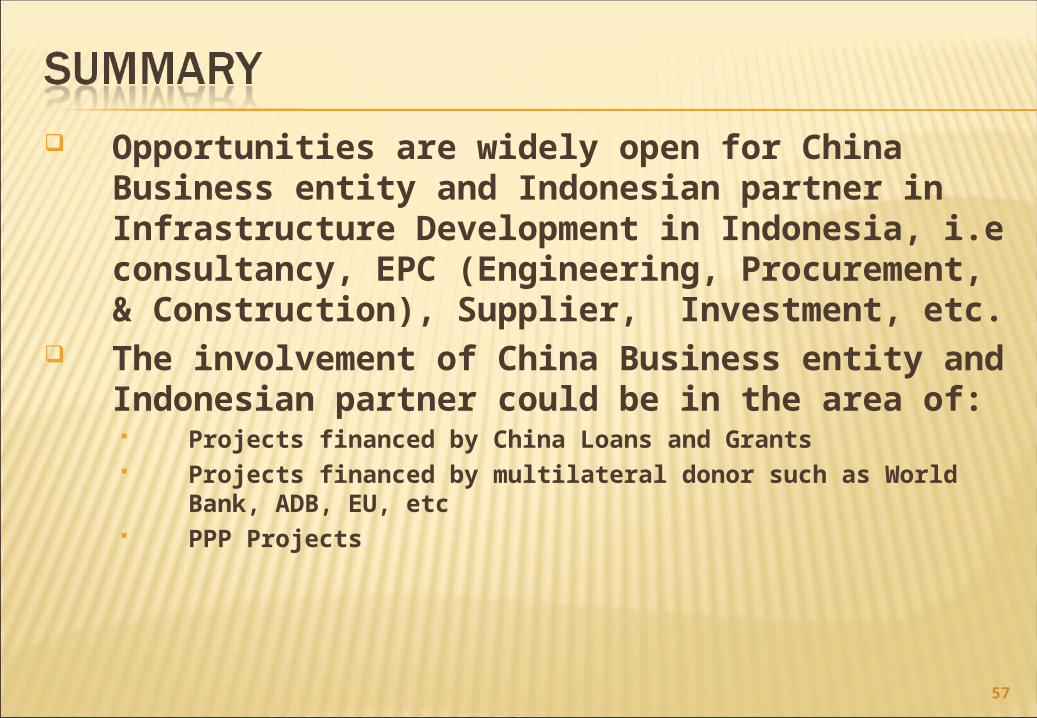
Opportunities are widely open for China Business entity and Indonesian partner in Infrastructure Development in Indonesia, i.e consultancy, EPC (Engineering, Procurement, & Construction), Supplier, Investment, etc.
The involvement of China Business entity and Indonesian partner could be in the area of: Projects financed by China Loans and Grants Projects financed by multilateral donor such as World
Bank, ADB, EU, etc PPP Projects
57

THANK YOUTHANK YOUTHANK YOUTHANK YOU
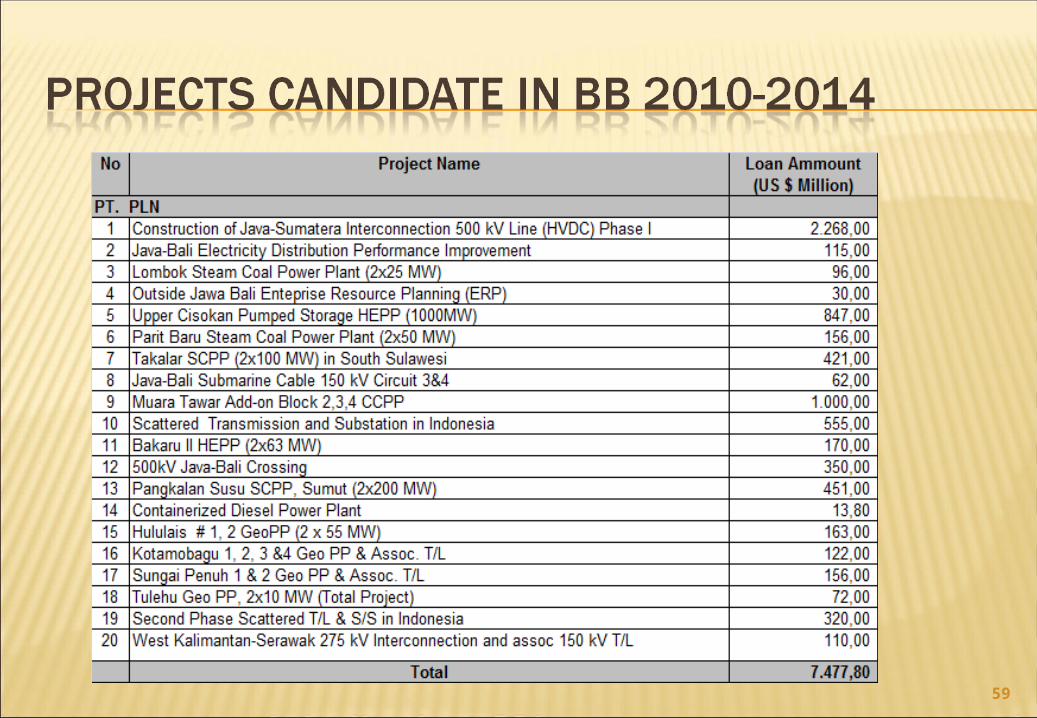
59
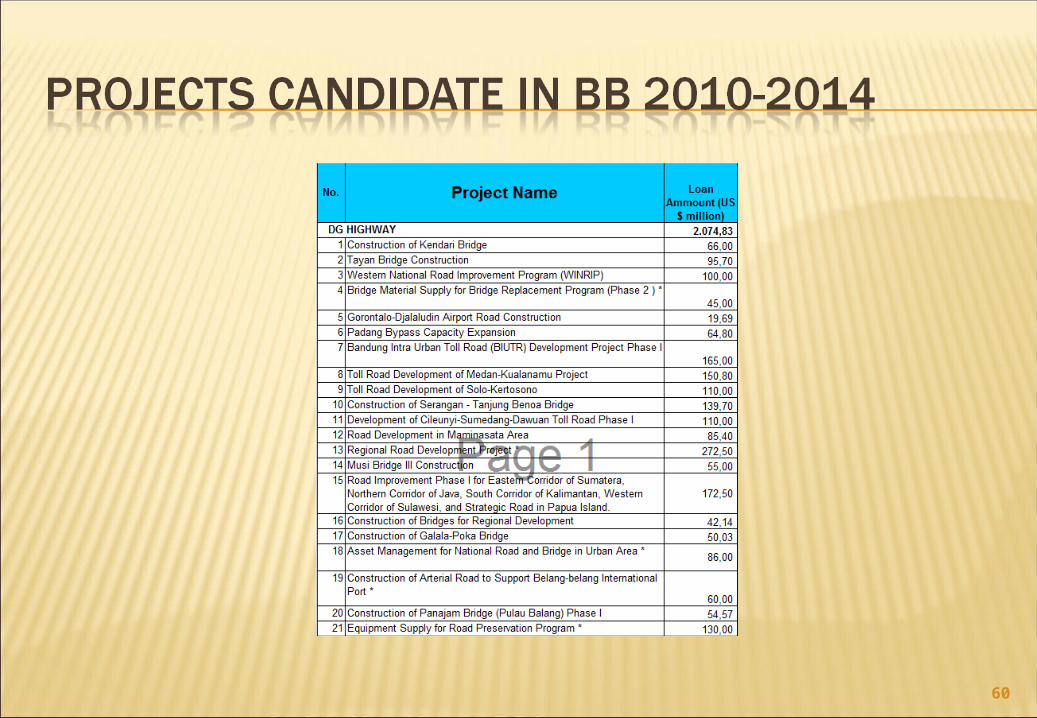
60
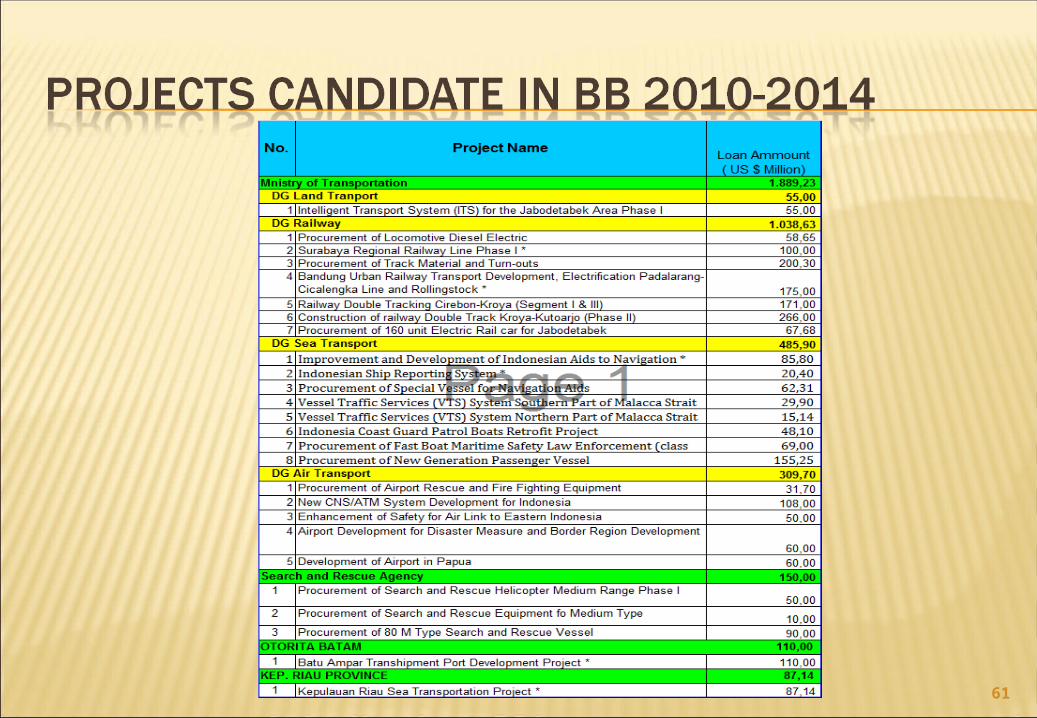
61
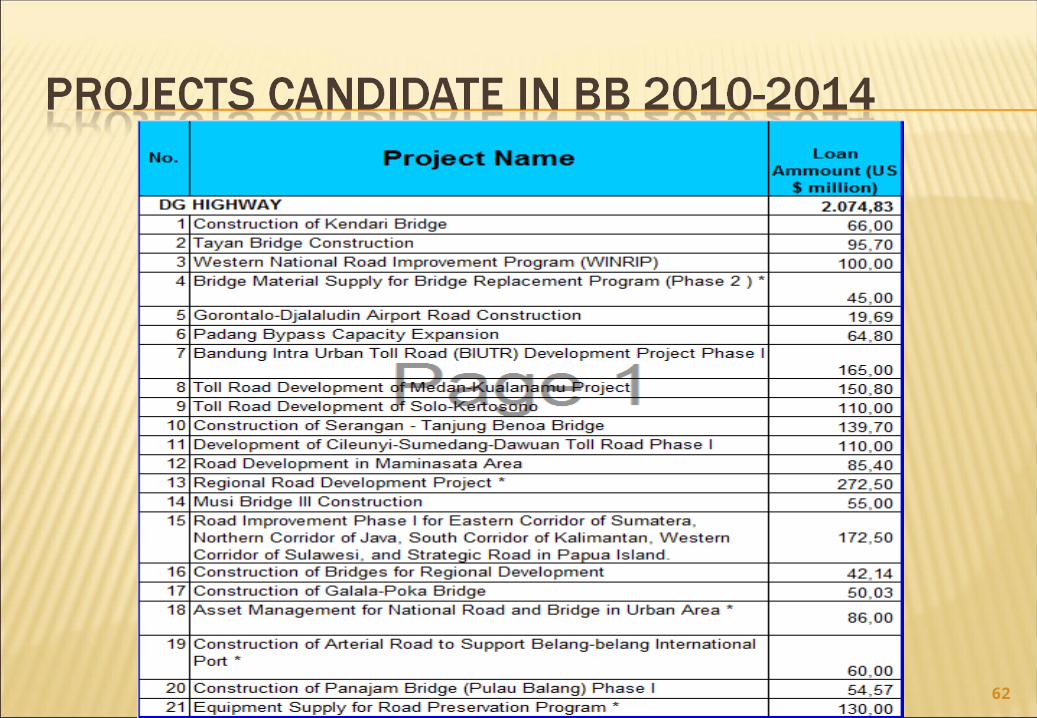
62
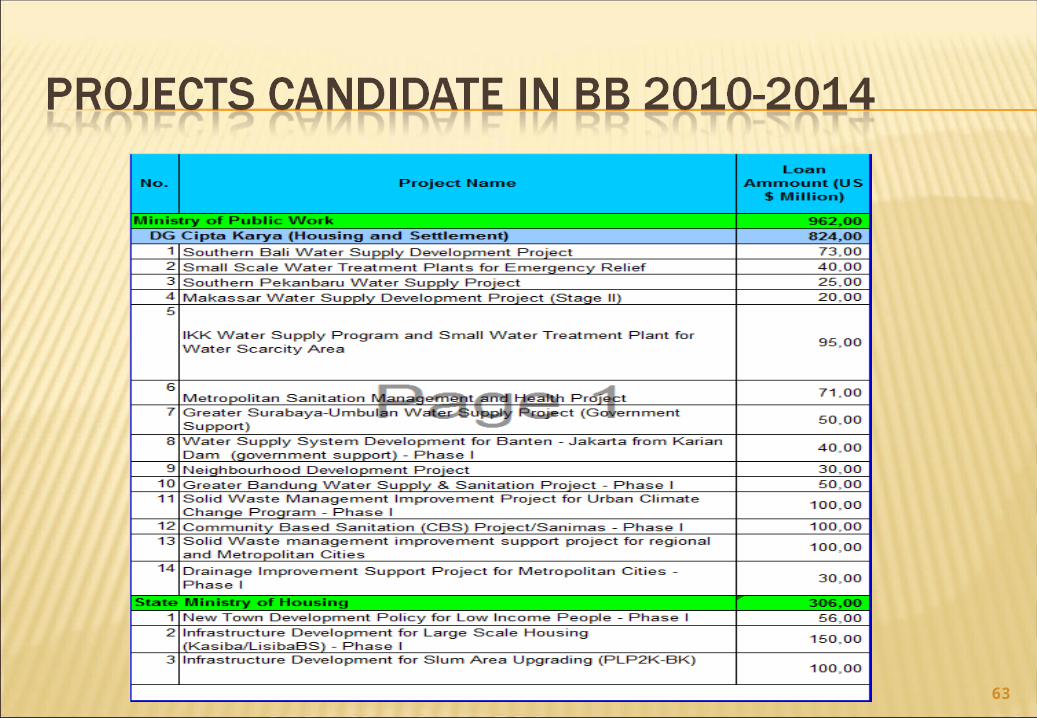
63
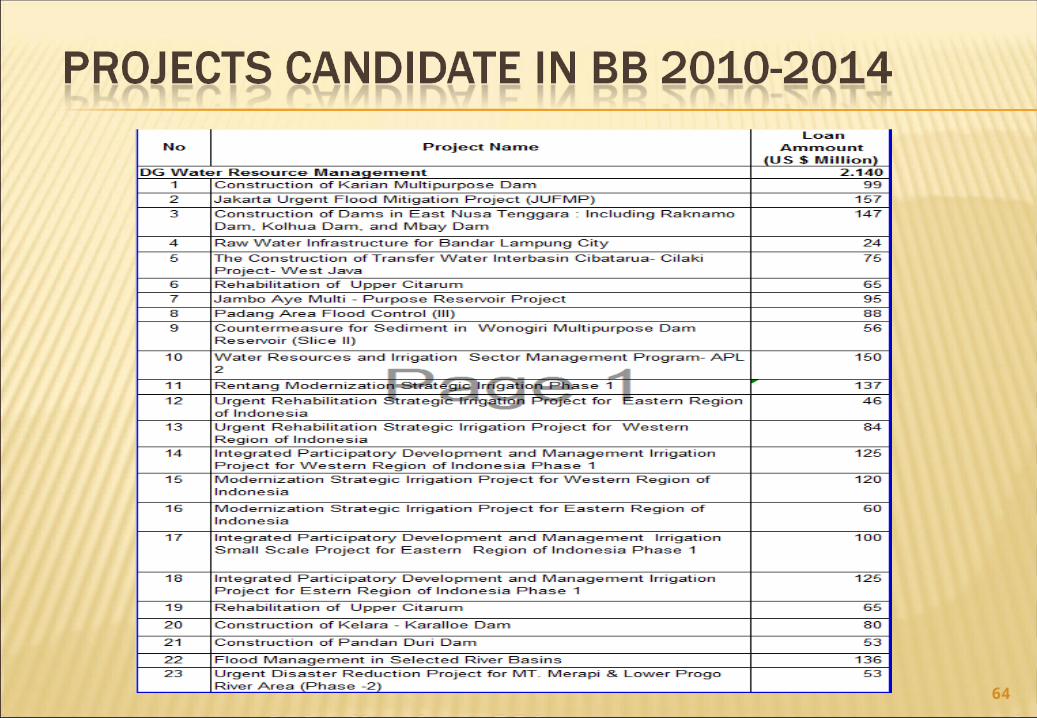
64
65
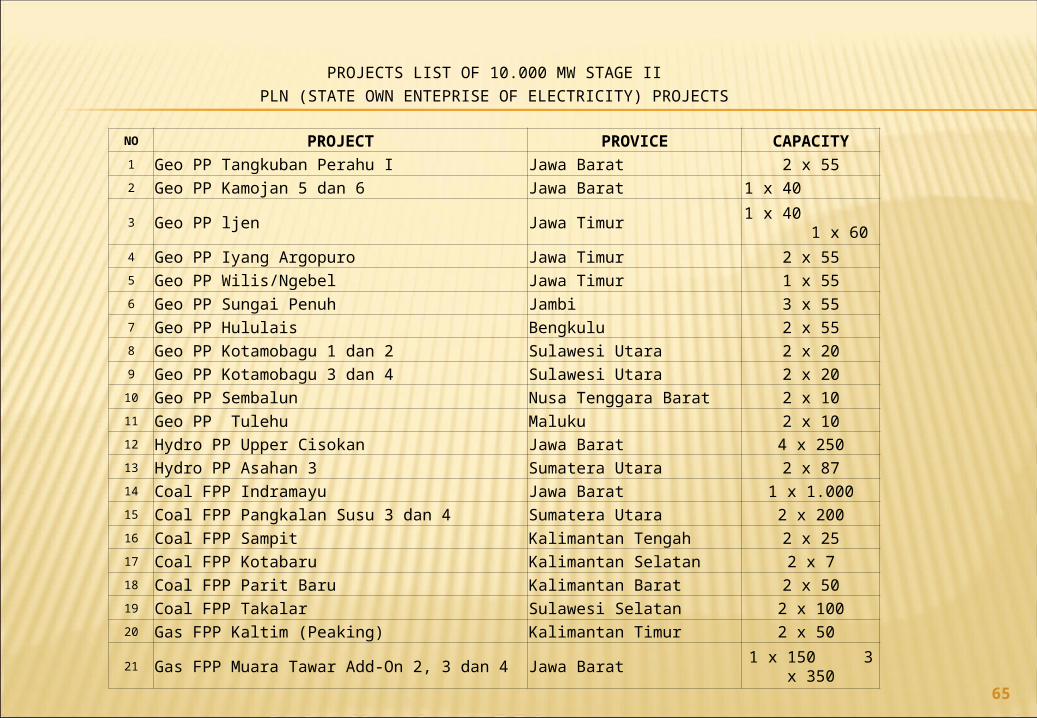
PROJECTS LIST OF 10.000 MW STAGE IIPLN (STATE OWN ENTEPRISE OF ELECTRICITY) PROJECTS
NO PROJECT PROVICE CAPACITY1 Geo PP Tangkuban Perahu I Jawa Barat 2 x 552 Geo PP Kamojan 5 dan 6 Jawa Barat 1 x 40
3 Geo PP ljen Jawa Timur 1 x 40 1 x 60
4 Geo PP Iyang Argopuro Jawa Timur 2 x 555 Geo PP Wilis/Ngebel Jawa Timur 1 x 556 Geo PP Sungai Penuh Jambi 3 x 557 Geo PP Hululais Bengkulu 2 x 558 Geo PP Kotamobagu 1 dan 2 Sulawesi Utara 2 x 209 Geo PP Kotamobagu 3 dan 4 Sulawesi Utara 2 x 2010 Geo PP Sembalun Nusa Tenggara Barat 2 x 10¹¹ Geo PP Tulehu Maluku 2 x 10¹² Hydro PP Upper Cisokan Jawa Barat 4 x 25013 Hydro PP Asahan 3 Sumatera Utara 2 x 8714 Coal FPP Indramayu Jawa Barat 1 x 1.00015 Coal FPP Pangkalan Susu 3 dan 4 Sumatera Utara 2 x 20016 Coal FPP Sampit Kalimantan Tengah 2 x 2517 Coal FPP Kotabaru Kalimantan Selatan 2 x 718 Coal FPP Parit Baru Kalimantan Barat 2 x 5019 Coal FPP Takalar Sulawesi Selatan 2 x 10020 Gas FPP Kaltim (Peaking) Kalimantan Timur 2 x 50
21 Gas FPP Muara Tawar Add-On 2, 3 dan 4 Jawa Barat 1 x 150 3 x 350
66
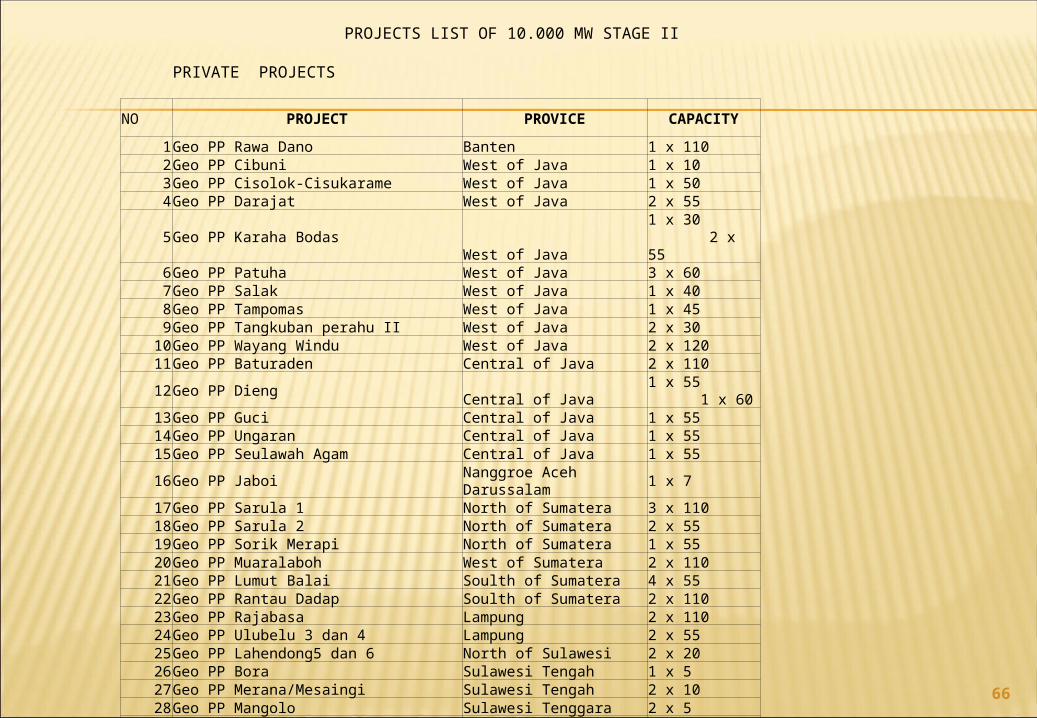
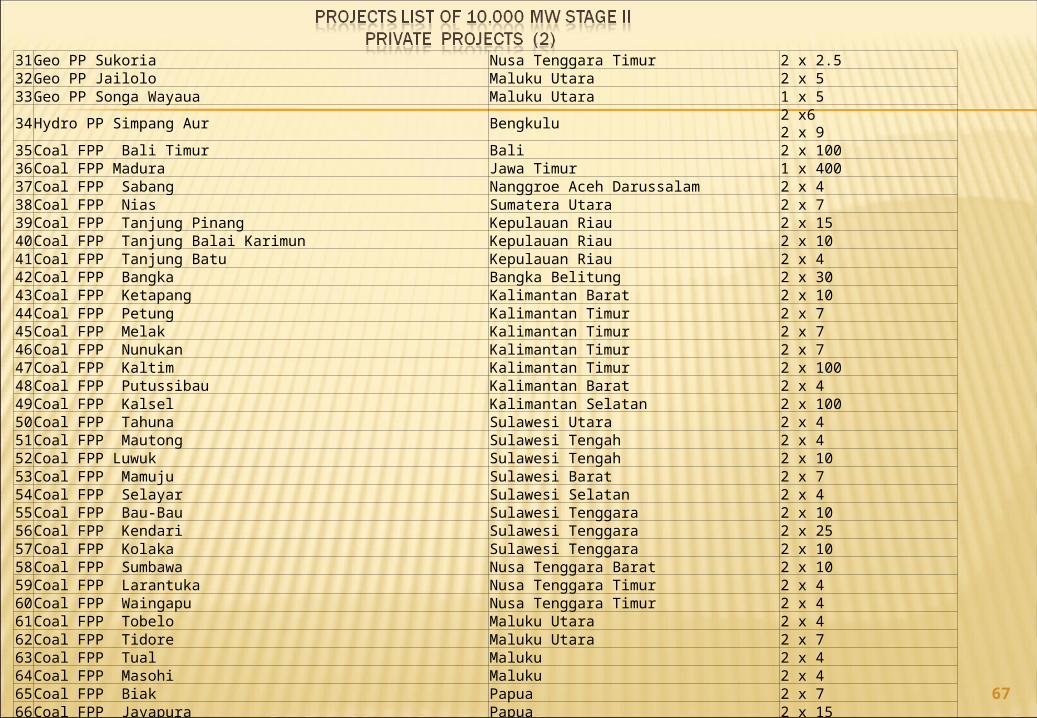
PROJECTS LIST OF 10.000 MW STAGE II PRIVATE PROJECTS
NO PROJECT PROVICE CAPACITY
1Geo PP Rawa Dano Banten 1 x 1102Geo PP Cibuni West of Java 1 x 10³Geo PP Cisolok-Cisukarame West of Java 1 x 504Geo PP Darajat West of Java 2 x 55
5Geo PP Karaha Bodas West of Java1 x 30 2 x 55
6Geo PP Patuha West of Java 3 x 607Geo PP Salak West of Java 1 x 40 8Geo PP Tampomas West of Java 1 x 459Geo PP Tangkuban perahu II West of Java 2 x 3010Geo PP Wayang Windu West of Java 2 x 12011Geo PP Baturaden Central of Java 2 x 110
12Geo PP Dieng Central of Java1 x 55 1 x 60
13Geo PP Guci Central of Java 1 x 55 14Geo PP Ungaran Central of Java 1 x 5515Geo PP Seulawah Agam Central of Java 1 x 5516Geo PP Jaboi Nanggroe Aceh Darussalam 1 x 717Geo PP Sarula 1 North of Sumatera 3 x 11018Geo PP Sarula 2 North of Sumatera 2 x 5519Geo PP Sorik Merapi North of Sumatera 1 x 5520Geo PP Muaralaboh West of Sumatera 2 x 11021Geo PP Lumut Balai Soulth of Sumatera 4 x 5522Geo PP Rantau Dadap Soulth of Sumatera 2 x 11023Geo PP Rajabasa Lampung 2 x 11024Geo PP Ulubelu 3 dan 4 Lampung 2 x 5525Geo PP Lahendong5 dan 6 North of Sulawesi 2 x 2026Geo PP Bora Sulawesi Tengah 1 x 527Geo PP Merana/Mesaingi Sulawesi Tengah 2 x 1028Geo PP Mangolo Sulawesi Tenggara 2 x 529Geo PP Huu Nusa Tenggara Barat 2 x 1030Geo PP Atadei Nusa Tenggara Timur 2 x 2.5
67
31Geo PP Sukoria Nusa Tenggara Timur 2 x 2.532Geo PP Jailolo Maluku Utara 2 x 533Geo PP Songa Wayaua Maluku Utara 1 x 534Hydro PP Simpang Aur Bengkulu 2 x6 2 x 935Coal FPP Bali Timur Bali 2 x 10036Coal FPP Madura Jawa Timur 1 x 40037Coal FPP Sabang Nanggroe Aceh Darussalam 2 x 438Coal FPP Nias Sumatera Utara 2 x 739Coal FPP Tanjung Pinang Kepulauan Riau 2 x 1540Coal FPP Tanjung Balai Karimun Kepulauan Riau 2 x 1041Coal FPP Tanjung Batu Kepulauan Riau 2 x 442Coal FPP Bangka Bangka Belitung 2 x 3043Coal FPP Ketapang Kalimantan Barat 2 x 1044Coal FPP Petung Kalimantan Timur 2 x 745Coal FPP Melak Kalimantan Timur 2 x 746Coal FPP Nunukan Kalimantan Timur 2 x 747Coal FPP Kaltim Kalimantan Timur 2 x 10048Coal FPP Putussibau Kalimantan Barat 2 x 449Coal FPP Kalsel Kalimantan Selatan 2 x 10050Coal FPP Tahuna Sulawesi Utara 2 x 451Coal FPP Mautong Sulawesi Tengah 2 x 452Coal FPP Luwuk Sulawesi Tengah 2 x 1053Coal FPP Mamuju Sulawesi Barat 2 x 754Coal FPP Selayar Sulawesi Selatan 2 x 455Coal FPP Bau-Bau Sulawesi Tenggara 2 x 1056Coal FPP Kendari Sulawesi Tenggara 2 x 2557Coal FPP Kolaka Sulawesi Tenggara 2 x 1058Coal FPP Sumbawa Nusa Tenggara Barat 2 x 1059Coal FPP Larantuka Nusa Tenggara Timur 2 x 460Coal FPP Waingapu Nusa Tenggara Timur 2 x 461Coal FPP Tobelo Maluku Utara 2 x 462Coal FPP Tidore Maluku Utara 2 x 763Coal FPP Tual Maluku 2 x 464Coal FPP Masohi Maluku 2 x 465Coal FPP Biak Papua 2 x 766Coal FPP Jayapura Papua 2 x 1572Gas FPP Senoro Sulawesi Tengah 2 x 120
68
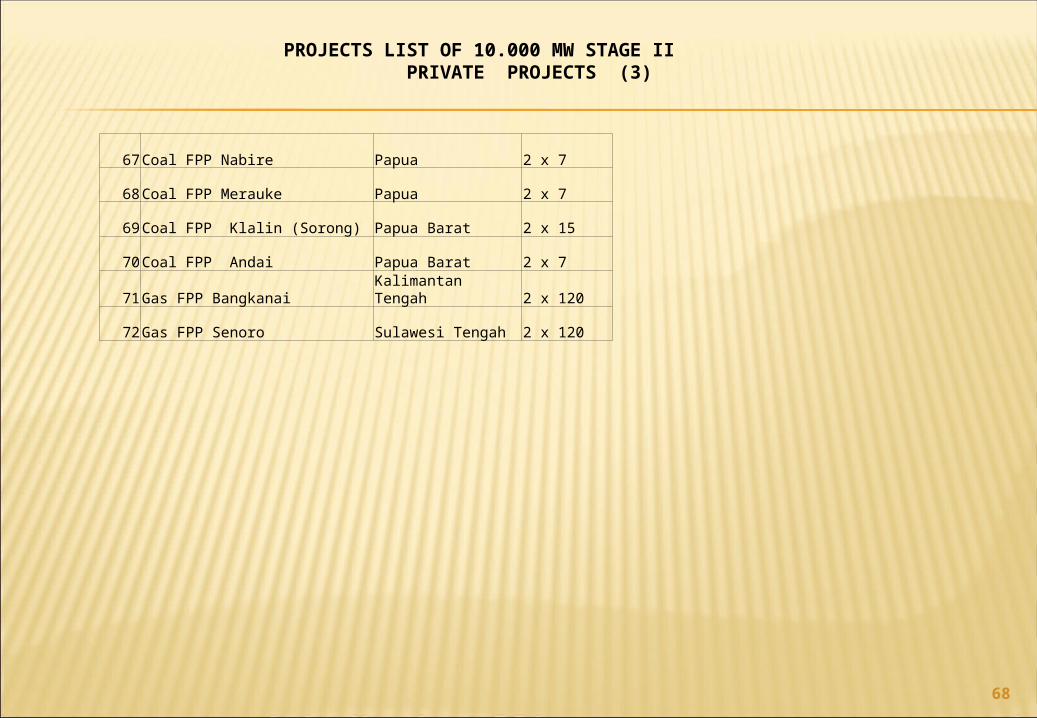
67Coal FPP Nabire Papua 2 x 7
68Coal FPP Merauke Papua 2 x 7
69Coal FPP Klalin (Sorong) Papua Barat 2 x 15
70Coal FPP Andai Papua Barat 2 x 7
71Gas FPP Bangkanai Kalimantan Tengah 2 x 120
72Gas FPP Senoro Sulawesi Tengah 2 x 120
PROJECTS LIST OF 10.000 MW STAGE II PRIVATE PROJECTS (3)