infrastructure development in india and china— a comparative
TRANSCRIPT
Infrastructure Development in India and China—
A Comparative Analysis
M. Julie Kim and Rita Nangia*
August 2008
Dr. Kim is a senior researcher at the Rand Corporation and Ms. Nangia is Director (Special Projects), Office of Information Systems and Technology of the Asian Development Bank (ADB). The views expressed here are authors’ and do not in anyway represent the views of the Rand Corporation or the ADB, its board of directors or the governments they represent. Comments can be sent to [email protected] or [email protected]
2
Infrastructure Development in India and China— A Comparative Analysis
M. Julie Kim, Rita Nangia1
INTRODUCTION
Global interest in India and China, the two Asian giants, is more than mere curiosity. Never before have such large economies with combined population of 2.3 billion grown so fast for so long (World Bank, 2007a). For the last two decades, both India and China have grown at twice the global rate. If this trend continues for next few decades, with their vast labor supply, favorable demographics, and aspirations for reaching the developed world per capita income and consumption standards, these economies can be expected to have a significant impact on the world economy. A large number of studies on China and India focus on comparing sources of economic growth, poverty reduction and inequality issues, political structures, policy and institutional reform processes, trade, or foreign direct investment policies in these two economies. Infrastructure, with its critical input in this spectacular performance, remains in the background. This paper aims to contribute to the ongoing comparative analyses of these two economies in infrastructure development.
Asian Infrastructure Model—Building Ahead of Demand
Asia has always recognized the role of infrastructure in creating wealth. Archeological evidence points to the exchange of goods between Mesopotamia and the Indian and the Chinese territories between 7500 and 4000 BC. The Silk Road created prosperous clusters of towns and trading posts while connecting Asia and Europe through the Middle East (Kuroda et. al., 2007). In more recent history, Asian nations were openly trading with each other long before Europeans arrived in the region. After World War II, the four Asian tigers (Korea, Taiwan, Singapore, and Hong Kong) reported strong growth driven by trade, investments, and infrastructure. The Asian tigers—followed closely by Malaysia, China, and, the most recent entrant to this group, Vietnam—adopted a development model where manufacturing and exports were key drivers of their economic performance. These governments recognized that export competitiveness and manufacturing require connectivity to the global economy and, as a result, infrastructure development was propelled by a substantial and sustained drive supported by the government. Top leaders and senior policy makers in these countries were intimately involved in developing comprehensive sector strategies, and they guided (and, in some sense, controlled) how the strategies were implemented and resources allocated (Mody, 1997). Not all countries followed a uniform path. In each country, different sectors developed approaches suited for the particular tasks at hand. The most remarkable common factor behind the success of infrastructure in these countries was the single-minded goal of sustaining economic growth and recognition of the importance of infrastructure development in achieving this goal. China has followed the path of these fast growing economies, building impressive infrastructure at lightning speed. China’s
1 Dr. Kim is a senior researcher at the Rand Corporation and Ms. Nangia is Director (Special Projects), Office of Information
Systems and Technology of the Asian Development Bank (ADB). The views expressed here are authors’ and do not in anyway represent the views of the Rand Corporation or the ADB, its board of directors or the governments they represent.
3
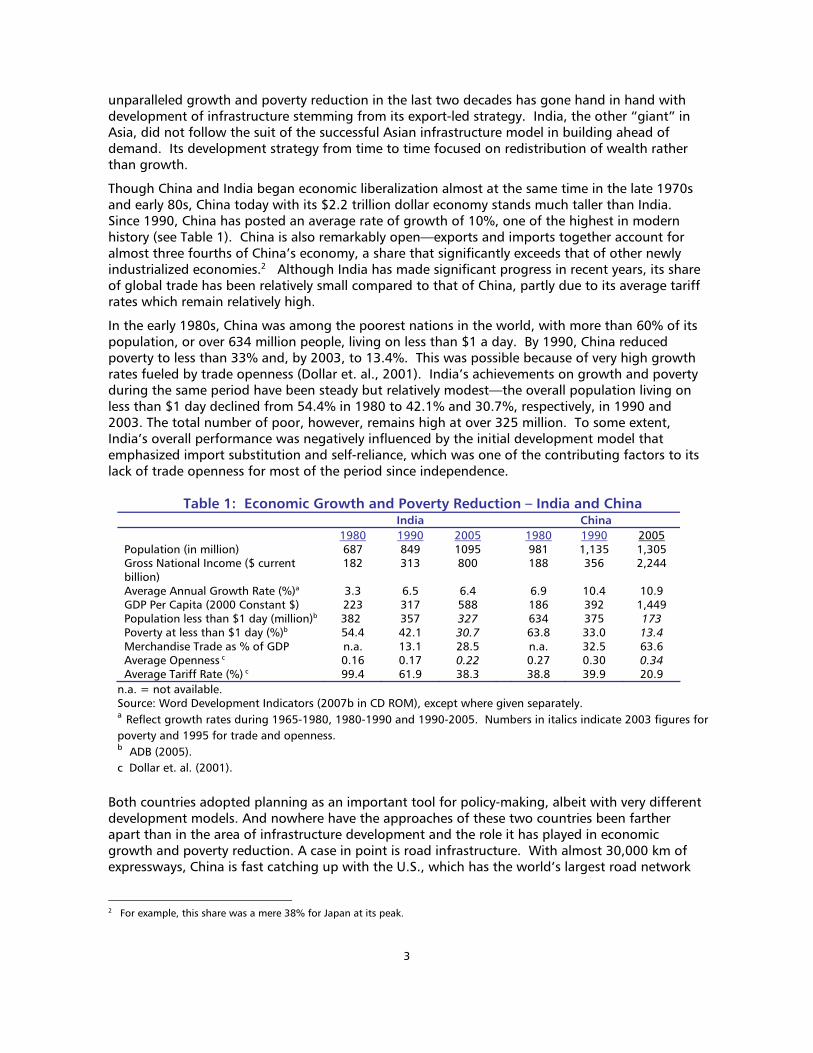
Table 1: Economic Growth and Poverty Reduction – India and China India China 1980 1990 2005 1980 1990 2005 Population (in million) 687 849 1095 981 1,135 1,305 Gross National Income ($ current billion)
182 313 800 188 356 2,244
Average Annual Growth Rate (%)a 3.3 6.5 6.4 6.9 10.4 10.9 GDP Per Capita (2000 Constant $) 223 317 588 186 392 1,449 Population less than $1 day (million)b 382 357 327 634 375 173 Poverty at less than $1 day (%)b 54.4 42.1 30.7 63.8 33.0 13.4 Merchandise Trade as % of GDP n.a. 13.1 28.5 n.a. 32.5 63.6 Average Openness c 0.16 0.17 0.22 0.27 0.30 0.34 Average Tariff Rate (%) c 99.4 61.9 38.3 38.8 39.9 20.9
n.a. = not available. Source: Word Development Indicators (2007b in CD ROM), except where given separately. a Reflect growth rates during 1965-1980, 1980-1990 and 1990-2005. Numbers in italics indicate 2003 figures for poverty and 1995 for trade and openness. b ADB (2005). c Dollar et. al. (2001).
unparalleled growth and poverty reduction in the last two decades has gone hand in hand with development of infrastructure stemming from its export-led strategy. India, the other “giant” in Asia, did not follow the suit of the successful Asian infrastructure model in building ahead of demand. Its development strategy from time to time focused on redistribution of wealth rather than growth.
Though China and India began economic liberalization almost at the same time in the late 1970s and early 80s, China today with its $2.2 trillion dollar economy stands much taller than India. Since 1990, China has posted an average rate of growth of 10%, one of the highest in modern history (see Table 1). China is also remarkably open—exports and imports together account for almost three fourths of China’s economy, a share that significantly exceeds that of other newly industrialized economies.2 Although India has made significant progress in recent years, its share of global trade has been relatively small compared to that of China, partly due to its average tariff rates which remain relatively high.
In the early 1980s, China was among the poorest nations in the world, with more than 60% of its population, or over 634 million people, living on less than $1 a day. By 1990, China reduced poverty to less than 33% and, by 2003, to 13.4%. This was possible because of very high growth rates fueled by trade openness (Dollar et. al., 2001). India’s achievements on growth and poverty during the same period have been steady but relatively modest—the overall population living on less than $1 day declined from 54.4% in 1980 to 42.1% and 30.7%, respectively, in 1990 and 2003. The total number of poor, however, remains high at over 325 million. To some extent, India’s overall performance was negatively influenced by the initial development model that emphasized import substitution and self-reliance, which was one of the contributing factors to its lack of trade openness for most of the period since independence.
Both countries adopted planning as an important tool for policy-making, albeit with very different development models. And nowhere have the approaches of these two countries been farther apart than in the area of infrastructure development and the role it has played in economic growth and poverty reduction. A case in point is road infrastructure. With almost 30,000 km of expressways, China is fast catching up with the U.S., which has the world’s largest road network
2 For example, this share was a mere 38% for Japan at its peak.
4
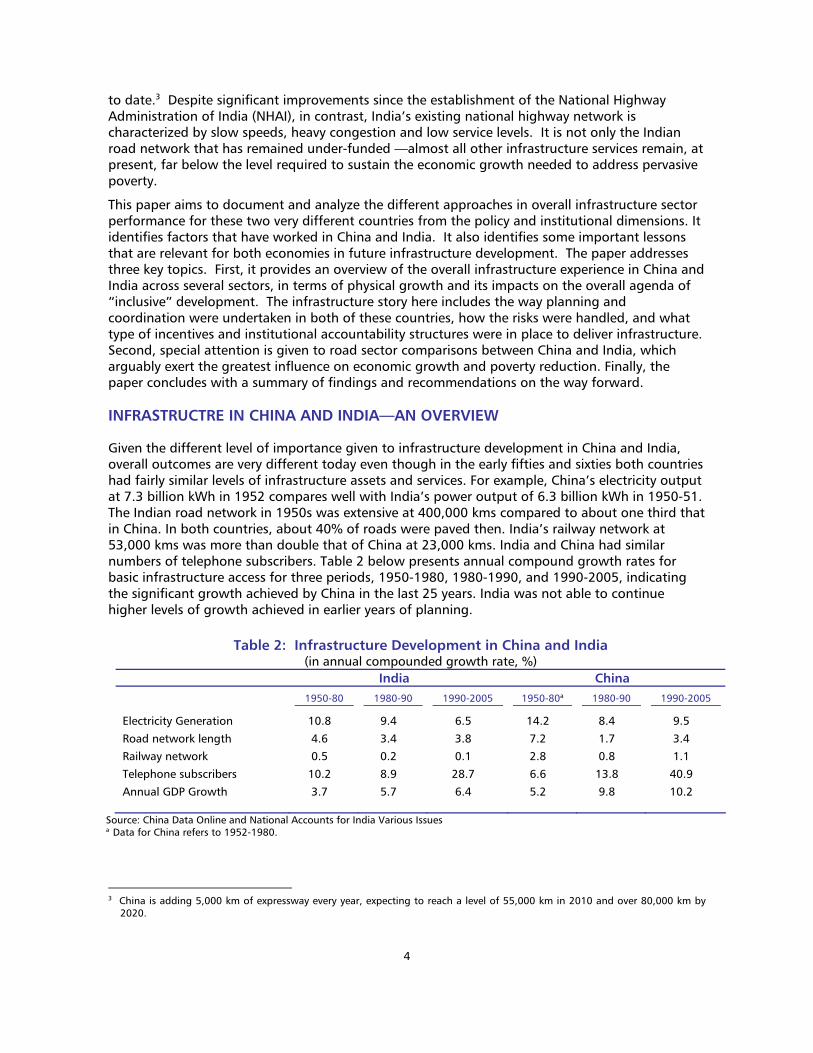
Table 2: Infrastructure Development in China and India (in annual compounded growth rate, %)
India China
1950-80 1980-90 1990-2005 1950-80a 1980-90 1990-2005
Electricity Generation 10.8 9.4 6.5 14.2 8.4 9.5
Road network length 4.6 3.4 3.8 7.2 1.7 3.4
Railway network 0.5 0.2 0.1 2.8 0.8 1.1
Telephone subscribers 10.2 8.9 28.7 6.6 13.8 40.9
Annual GDP Growth 3.7 5.7 6.4 5.2 9.8 10.2
Source: China Data Online and National Accounts for India Various Issues a Data for China refers to 1952-1980.
to date.3 Despite significant improvements since the establishment of the National Highway Administration of India (NHAI), in contrast, India’s existing national highway network is characterized by slow speeds, heavy congestion and low service levels. It is not only the Indian road network that has remained under-funded —almost all other infrastructure services remain, at present, far below the level required to sustain the economic growth needed to address pervasive poverty.
This paper aims to document and analyze the different approaches in overall infrastructure sector performance for these two very different countries from the policy and institutional dimensions. It identifies factors that have worked in China and India. It also identifies some important lessons that are relevant for both economies in future infrastructure development. The paper addresses three key topics. First, it provides an overview of the overall infrastructure experience in China and India across several sectors, in terms of physical growth and its impacts on the overall agenda of “inclusive” development. The infrastructure story here includes the way planning and coordination were undertaken in both of these countries, how the risks were handled, and what type of incentives and institutional accountability structures were in place to deliver infrastructure. Second, special attention is given to road sector comparisons between China and India, which arguably exert the greatest influence on economic growth and poverty reduction. Finally, the paper concludes with a summary of findings and recommendations on the way forward.
INFRASTRUCTRE IN CHINA AND INDIA—AN OVERVIEW
Given the different level of importance given to infrastructure development in China and India, overall outcomes are very different today even though in the early fifties and sixties both countries had fairly similar levels of infrastructure assets and services. For example, China’s electricity output at 7.3 billion kWh in 1952 compares well with India’s power output of 6.3 billion kWh in 1950-51. The Indian road network in 1950s was extensive at 400,000 kms compared to about one third that in China. In both countries, about 40% of roads were paved then. India’s railway network at 53,000 kms was more than double that of China at 23,000 kms. India and China had similar numbers of telephone subscribers. Table 2 below presents annual compound growth rates for basic infrastructure access for three periods, 1950-1980, 1980-1990, and 1990-2005, indicating the significant growth achieved by China in the last 25 years. India was not able to continue higher levels of growth achieved in earlier years of planning.
3 China is adding 5,000 km of expressway every year, expecting to reach a level of 55,000 km in 2010 and over 80,000 km by
2020.
5
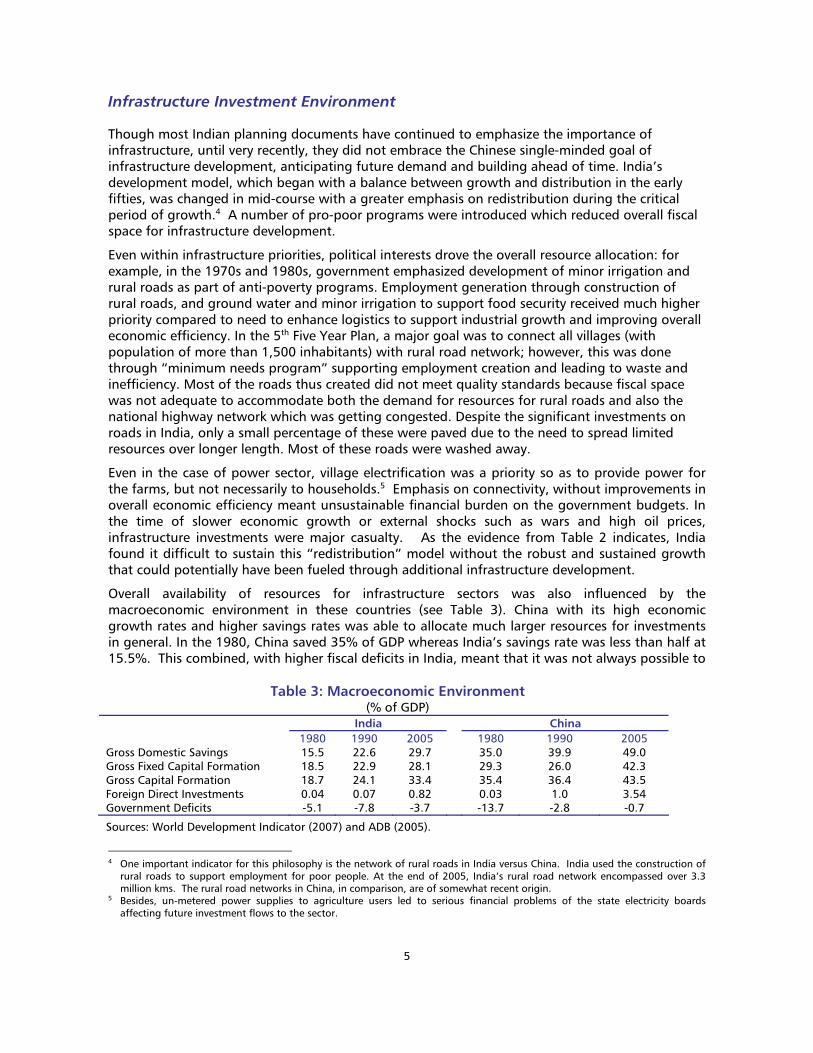
Table 3: Macroeconomic Environment (% of GDP)
India China 1980 1990 2005 1980 1990 2005 Gross Domestic Savings 15.5 22.6 29.7 35.0 39.9 49.0 Gross Fixed Capital Formation 18.5 22.9 28.1 29.3 26.0 42.3 Gross Capital Formation 18.7 24.1 33.4 35.4 36.4 43.5 Foreign Direct Investments 0.04 0.07 0.82 0.03 1.0 3.54 Government Deficits -5.1 -7.8 -3.7 -13.7 -2.8 -0.7
Sources: World Development Indicator (2007) and ADB (2005).
Infrastructure Investment Environment
Though most Indian planning documents have continued to emphasize the importance of infrastructure, until very recently, they did not embrace the Chinese single-minded goal of infrastructure development, anticipating future demand and building ahead of time. India’s development model, which began with a balance between growth and distribution in the early fifties, was changed in mid-course with a greater emphasis on redistribution during the critical period of growth.4 A number of pro-poor programs were introduced which reduced overall fiscal space for infrastructure development.
Even within infrastructure priorities, political interests drove the overall resource allocation: for example, in the 1970s and 1980s, government emphasized development of minor irrigation and rural roads as part of anti-poverty programs. Employment generation through construction of rural roads, and ground water and minor irrigation to support food security received much higher priority compared to need to enhance logistics to support industrial growth and improving overall economic efficiency. In the 5th Five Year Plan, a major goal was to connect all villages (with population of more than 1,500 inhabitants) with rural road network; however, this was done through “minimum needs program” supporting employment creation and leading to waste and inefficiency. Most of the roads thus created did not meet quality standards because fiscal space was not adequate to accommodate both the demand for resources for rural roads and also the national highway network which was getting congested. Despite the significant investments on roads in India, only a small percentage of these were paved due to the need to spread limited resources over longer length. Most of these roads were washed away.
Even in the case of power sector, village electrification was a priority so as to provide power for the farms, but not necessarily to households.5 Emphasis on connectivity, without improvements in overall economic efficiency meant unsustainable financial burden on the government budgets. In the time of slower economic growth or external shocks such as wars and high oil prices, infrastructure investments were major casualty. As the evidence from Table 2 indicates, India found it difficult to sustain this “redistribution” model without the robust and sustained growth that could potentially have been fueled through additional infrastructure development.
Overall availability of resources for infrastructure sectors was also influenced by the macroeconomic environment in these countries (see Table 3). China with its high economic growth rates and higher savings rates was able to allocate much larger resources for investments in general. In the 1980, China saved 35% of GDP whereas India’s savings rate was less than half at 15.5%. This combined, with higher fiscal deficits in India, meant that it was not always possible to
4 One important indicator for this philosophy is the network of rural roads in India versus China. India used the construction of
rural roads to support employment for poor people. At the end of 2005, India’s rural road network encompassed over 3.3 million kms. The rural road networks in China, in comparison, are of somewhat recent origin.
5 Besides, un-metered power supplies to agriculture users led to serious financial problems of the state electricity boards affecting future investment flows to the sector.
6
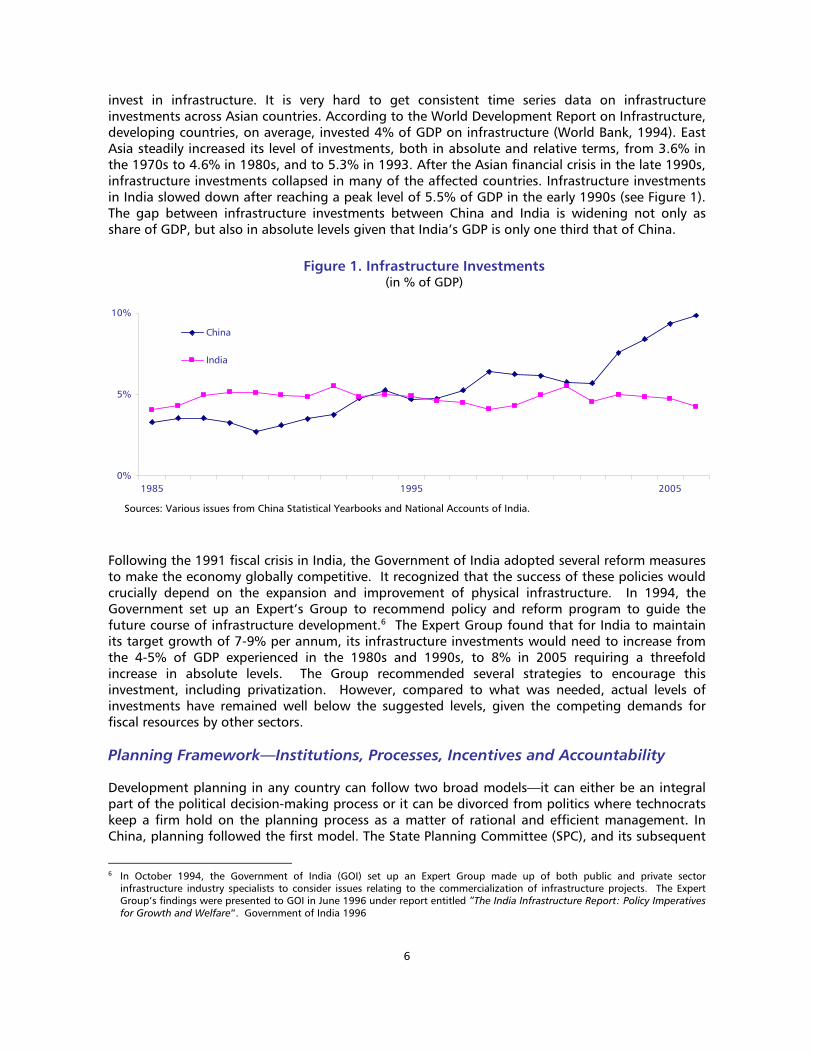
Figure 1. Infrastructure Investments (in % of GDP)
0%
5%
10%
1985 1995 2005
China
India
Sources: Various issues from China Statistical Yearbooks and National Accounts of India.
invest in infrastructure. It is very hard to get consistent time series data on infrastructure investments across Asian countries. According to the World Development Report on Infrastructure, developing countries, on average, invested 4% of GDP on infrastructure (World Bank, 1994). East Asia steadily increased its level of investments, both in absolute and relative terms, from 3.6% in the 1970s to 4.6% in 1980s, and to 5.3% in 1993. After the Asian financial crisis in the late 1990s, infrastructure investments collapsed in many of the affected countries. Infrastructure investments in India slowed down after reaching a peak level of 5.5% of GDP in the early 1990s (see Figure 1). The gap between infrastructure investments between China and India is widening not only as share of GDP, but also in absolute levels given that India’s GDP is only one third that of China.
Following the 1991 fiscal crisis in India, the Government of India adopted several reform measures to make the economy globally competitive. It recognized that the success of these policies would crucially depend on the expansion and improvement of physical infrastructure. In 1994, the Government set up an Expert’s Group to recommend policy and reform program to guide the future course of infrastructure development.6 The Expert Group found that for India to maintain its target growth of 7-9% per annum, its infrastructure investments would need to increase from the 4-5% of GDP experienced in the 1980s and 1990s, to 8% in 2005 requiring a threefold increase in absolute levels. The Group recommended several strategies to encourage this investment, including privatization. However, compared to what was needed, actual levels of investments have remained well below the suggested levels, given the competing demands for fiscal resources by other sectors.
Planning Framework—Institutions, Processes, Incentives and Accountability
Development planning in any country can follow two broad models—it can either be an integral part of the political decision-making process or it can be divorced from politics where technocrats keep a firm hold on the planning process as a matter of rational and efficient management. In China, planning followed the first model. The State Planning Committee (SPC), and its subsequent
6 In October 1994, the Government of India (GOI) set up an Expert Group made up of both public and private sector
infrastructure industry specialists to consider issues relating to the commercialization of infrastructure projects. The Expert Group’s findings were presented to GOI in June 1996 under report entitled “The India Infrastructure Report: Policy Imperatives for Growth and Welfare”. Government of India 1996
7
variants, have been and remain at the center of China’s political and economic affairs. The SPC sets the national policy agenda, makes important policy decisions, and even guides the law-making process to ensure that these decisions are implemented. Through a dual-track implementation system, its policy-making role also extends to closely monitoring and guiding policy implementation (Liu, 2005). Thus the Chinese planning institutions fully integrate political economy considerations in the process of designing and implementing development plans. In China, strong accountability for delivery of plans was embedded through powerful party structure and this has so far led to better economic outcomes in terms of growth and infrastructure development. In India, there was disconnect between targets and performance, plan and implementation, and demand for resources and actual availability of funds. As a result, in most years until recently, infrastructure projects were actually built on a piecemeal approach.
For India, the decade of the 1970s was tumultuous. On the political front, this included a war with Pakistan, the birth of a new nation on its border with a million refugees, an oil crisis, the public announcement of nuclear ambitions with an explosion at Pokhara, and a brief experiment with the cessation of civil liberty. The economy was hindered by this political turmoil as indicated by its slow rate of growth. In the 1970s, the underlying economic trend did not differ much from that observed since early 1950s. The rate of growth of national income, for example, was 3.5%, including a 2.7% growth rate in agricultural production and a 6.1% growth rate in industrial production. Per capita income grew by 1.3% per year, while per capita consumption grew by 1.2% (Patel, 2002). In the late 1970s, a non-congress government took power at the center for the first time since independence. The new government had to change the old ways of running the government and economy and, thus began the phase of slow liberalization in the 1980s.
The Indian planning process historically tended to be more technical than political. Although the Planning Commission, with the Prime Minister as the Chairman, had some institutional ties to the political decision-making process, the process has tended to be more technical in reality, captured at times by technocrats who wanted to ensure rational and managerial efficiency.7 The planning institutions in India at the national and state levels adopted a consultative process for the formulation of plans. Plan formulations for important sectors were undertaken by working groups with broad mandates and high levels of technical expertise. These working groups included not only representatives of the line ministries, but also financial sector, private sector, and academic institutions. This process of participation, however, worked well only in the initial phase of the preparation of formal plan documents. Unlike the dual-track system in China, overall implementation in India has more often been divorced from the planning process. Similarly, policy-making too was fragmented where, for example, a number of policy reforms have been often decided by committees and working groups, without the Planning Commission always being in charge of the process of reform designs or action plans for implementation.
Being a pluralistic democracy, Indian development plans in the past have indicated directions but not specific goals. As a result, plans often did not articulate an appropriate policy framework based on a set of priorities. Rather, most of the earlier plans were essentially statements of intentions for public expenditures, implemented by annual budget process. In addition, the targets set for private sector participation soon provided a rationale for public sector to effect an industrial licensing policy with its inherently large transaction costs. Unlike the East Asian economies, incentives were rarely used as instruments of economic policy in India until much later, partly due to belief in the wisdom and supreme ability of the Government (Patel, 2002). In some sense, Prime Minister’s statement in the Foreword to the Sixth Plan that “the measure of a plan is not intention but achievement, not allocation but benefit” needed to be heeded via the use of incentive structures and monitoring to bring results that were essential in India’s planning process. 7 Given the federal structure, the political leaders of the states also participate in preparation of the national plans. States have
similar structures as the federal structure with the state planning commissions.
8
In China, the party’s organizational structure is set in parallel to the administrative organizational structure at every level of the government. Under this system, every government agency is led by an official who serves both as the party secretary and the administrator (commonly seen at the central level), or jointly by two officials, one as party secretary and the other as an administrator (more commonly seen at the provincial and local levels). In the second case, the party secretary does not engage in the day-to-day administrative functions, but closely monitors the policy implementation process and always has a final say on major policy and personnel decisions. He or she is accountable to the higher level party secretary. The administrators need not be party members, but many of them are. The career of a government official with party membership, moreover, is not limited to just the party or administration track, but it could be both (Liu, 2005).
Unlike the Chinese system of administrative accountability emanating from the all-embracing Party, Indian planning institutions or processes have limited interaction with the government personnel management. In short, India’s planning ability, widely regarded as world class, was not backed by underlying incentives and accountability systems in China that delivered better outcomes.
Infrastructure Sector Reforms
The planning framework for infrastructure was very different in China and India. Similar to their efforts in rural transformation and agricultural modernization, China was able to adopt a dual-benefit infrastructure development policy—to build infrastructure that will promote economic growth and to build systems that directly target poverty reduction. The vast program of building expressways was complemented with several programs that would directly benefit the poor. This was possible because of China’s very pragmatic approach to reforms and modernization, as suggested by Deng Xiaoping’s statement, “black cat, white cat, it does not matter so long as it catches mice.” Having a centralized political system with complete State control made it possible to take risks that would have been more difficult under alternate political paradigms. The political costs of direct dissent were relatively small, if not entirely absent in China.
Until 1994, the Indian government did not have a comprehensive framework for infrastructure. Most of the government interventions were through large number of sector ministries and departments—Ministry of Finance, Planning Commission, Pricing bureaus, state-owned enterprises (SOEs), etc. Since there were so many actors, the entire spectrum of infrastructure functions, namely, planning and policy making, regulation, production, and supply tended to be dominated by public sector SOEs. The SOEs in these sectors had the skills and capabilities to influence important decisions; however, accountability structures were being weakened due to excessive interference by political “bosses” (Virmani, 2005).
With the exception of pricing reforms, most infrastructure reforms in India did not begin until the late 1980s and early 1990s. Telecommunications was selected as a technology mission where connectivity was considered a priority.8 Indigenous entrepreneurship was unleashed and the Village Public Telephone system spread to every village under the public-call office, providing telephone access and thus breaking the long time monopoly of post offices. In the early 1990s, the telecom sector was the first one to allow entry of private sector firms in both basic and cellular telephone systems. Even though the telecom reforms had many ups and downs, the government
8 The five missions started by the Rajiv Gandhi government (1984-89) did have elements of the Chinese strategic approaches,
combined with the technical skills, capabilities and adequate resources. Adequate implementation and monitoring apparatus were also built in for this particular mission with support from the highest level of the government, the Prime Minister himself. However, this worked as long as the attention and support of the Prime Minister was present. Its success, though very large in terms of access of service and cost reduction, was not backed by systematic program of reforms necessary to sustain such a large scale expansion of a service network. When the people that drove these programs moved from the scene, the success began to wear off until the onset of mobile phone network many years later.
9
Table 4: Basic Infrastructure Sector Performance Indicators
India China 1980 1990 2005 1980 1990 2005
Communicationsa Units
Telephone Connections 2.3 5.07 185 4.3 11.1 626 Mobile Phones
per 1,000 person n.a. 0 148 n.a. .02 348
Energyb
Power Capacity 1000 mwh 33.3 71.8 137.6 65.9 126.6 442.4 Power Generation billion kwh 119.3 275.5 661.6 285.5 590.3 2371.8 Primary Energy Production
1015 BTU 3.1 6.8 11.7 18.1 29.4 63.2
Per Capita Energy Consumption
106 BTU 5.9 9.4 14.8 17.8 23.5 51.4
Energy Intensity $ GDP/kg 3.4 4.0 5.5 1.3 2.1 4.4
Transportc Roads 1,000 km 644 2,000 2,526 883 1,181 1,931 Paved Roads % n.a. 47 57 n.a. n.a. 82.5 Road Freight million tons 195.9 318.4 557.4 3,820 7,240 11,600 Rail Lines Route Length km 61,240 62,367 63,465 49,940 53,378 62,200 Rail Freight billion ton-km 158 236 407 571 1,060 1,934
Water and Sanitation Accessc Safe Drinking Water 42 70 86 n.a. 70 77 Sanitation
% population 7 14 33 n.a. 23 44
n.a. = not available. Sources: a International Telecommunications Union (2008). b Energy Information Administration website http://www.eia.doe.gov/. c World Development Indicator (2007), supplemented by national source such as Economic Survey (various issues) for India and National Bureau of Statistics for China.
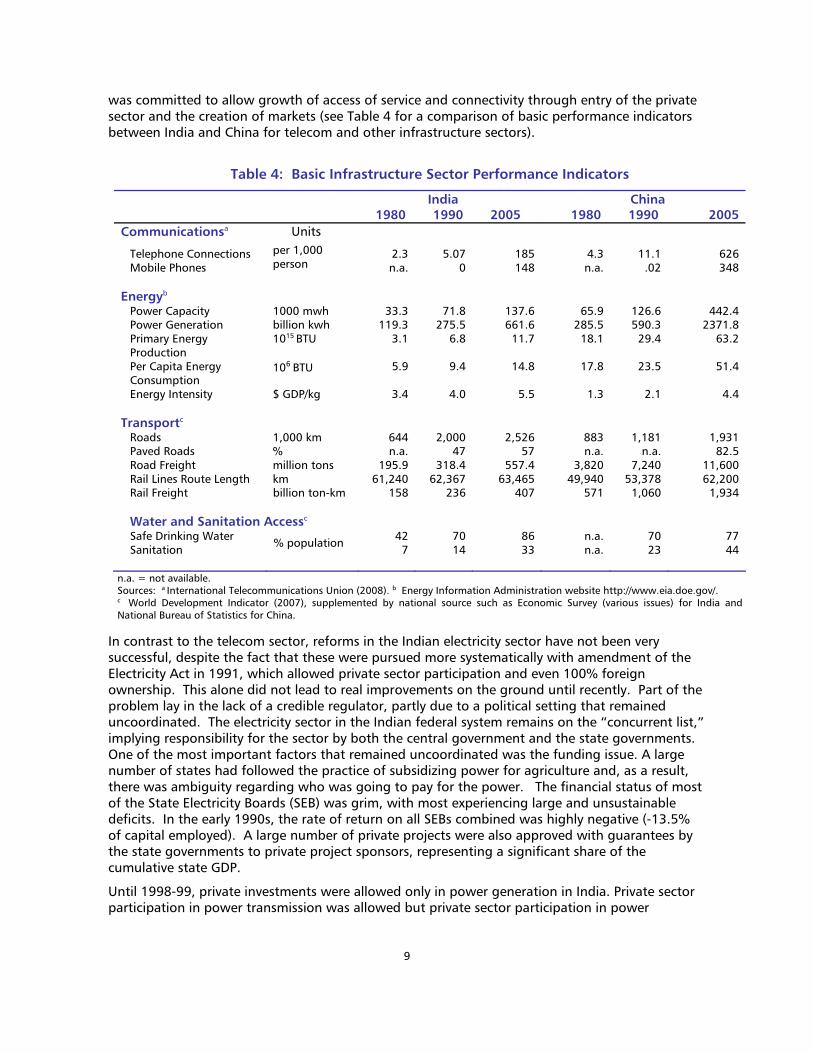
was committed to allow growth of access of service and connectivity through entry of the private sector and the creation of markets (see Table 4 for a comparison of basic performance indicators between India and China for telecom and other infrastructure sectors).
In contrast to the telecom sector, reforms in the Indian electricity sector have not been very successful, despite the fact that these were pursued more systematically with amendment of the Electricity Act in 1991, which allowed private sector participation and even 100% foreign ownership. This alone did not lead to real improvements on the ground until recently. Part of the problem lay in the lack of a credible regulator, partly due to a political setting that remained uncoordinated. The electricity sector in the Indian federal system remains on the “concurrent list,” implying responsibility for the sector by both the central government and the state governments. One of the most important factors that remained uncoordinated was the funding issue. A large number of states had followed the practice of subsidizing power for agriculture and, as a result, there was ambiguity regarding who was going to pay for the power. The financial status of most of the State Electricity Boards (SEB) was grim, with most experiencing large and unsustainable deficits. In the early 1990s, the rate of return on all SEBs combined was highly negative (-13.5% of capital employed). A large number of private projects were also approved with guarantees by the state governments to private project sponsors, representing a significant share of the cumulative state GDP.
Until 1998-99, private investments were allowed only in power generation in India. Private sector participation in power transmission was allowed but private sector participation in power
10
distribution did not occur until 2003 (Virmani, 2005). Although many states have set up independent regulators that have been fairly effective, the fundamental issue of who pays for the subsidized power has remained an important challenge. Unless there is a viable system of paying for the needed capacity for power generation and investments in transmission and distribution, financing of the power sector will remain a major challenge in years to come.
Unlike India, however, China’s power sector reforms have been relatively more successful in terms of the level of foreign and private sector participation in reducing the funding gap. The foreign private sector was welcomed into China, not only due to the need to augment financial resources, but also for the needed manufacturing capacity to produce the power generating equipment for an ambitious capacity expansion program. Foreign direct investments (FDI) in China took various institutional forms such as joint ventures, build-operate-transfer (BOT) types of arrangements, equity joint ventures, loans, and equity in the existing energy enterprises. In 1996, the sector was further reformed under the new Electricity Law that created the State Power Corporation of China as an entity separate from the Ministry of Electric Power, thus signifying a first step to separating regulation from actual production and supply. Given the dual pricing system of “new plant, new price,” China’s power sector funding gap has not been as large as that of India.9
The transport sector of India is one of the largest in the world. Serving over a billion people, Indian roads carry about 85% of passenger traffic and about 70% of freight traffic in the country (IRF, 2003). Accelerated economic growth in the 1990s has meant a surge in demand for both freight and passenger transport by 12% and 8% per year, respectively. India had a large network of roads at the time of independence; however, the overall quality of roads reflected the underlying weak and inefficient institutional structures responsible for planning, designing, and maintaining the highway network.
When it was decided in the 1990s to strengthen the road network, it was recognized that allocating more money to the Central and State Public Works Departments would not lead to better outcomes. It was believed the resources would be wasted and siphoned off in the end because these institutions had become inefficient and obsolete. One of the institutional innovations introduced in 1995 was to set up a new organization. The National Highway Authority of India (NHAI) was given a very clear mandate to upgrade the road network. A fuel “cess” (tax) was introduced to pay for the transport network upgrade, and private sector participation was also allowed through collection of user tolls to partly pay for the new roads. An ambitious transport upgrade plan was launched with very clear targets even though overall accountability structures continued to remain low.
Visible differences have been seen in a very short period of time. The fuel cess is being leveraged for raising debt in the domestic market. There has also been a rapid rise in toll revenues. Capital expenditure by NHAI has risen rapidly from $175 million in 1999-2000 to $2.2 billion in 2003-2004. At the same time, the Indian government has also initiated a program of rural connectivity so as to connect all habitations with a population of 500 or more. It is funded from a central road fund supported from the multilateral development banks and domestic borrowing.
ROAD SECTOR—“TO GET RICH, BUILD ROADS FIRST; TO GET RICH FAST, BUILD FAST ROADS”
A majority of farmers in China believe this saying. Although arguments have been made to the contrary, numerous recent studies have demonstrated that the greatest effect on poverty reduction can come from investments in the transport sector, particularly roads. It has been
9 China’s “new plant, new price” system allows a different tariff structure for new plants when compared to old plants for the
same power generated and consumed. The new plants had higher costs compared to old depreciated ones.

11
shown that an efficient road network increases access to services and economic opportunities, facilitates domestic market integration, lowers the cost of production and transportation, and allows healthy competition both domestically and internationally. In addition to accessibility, the quality of the roads also plays an important role in economic development.
A 1999 study in India, for example, used a general equilibrium model to evaluate the effects of government expenditures in a number of sectors—agricultural research and development, irrigation, roads, education, rural and community development, power, health, and soil/water conservation—and found that the greatest effect on poverty reduction came from roads (Fan et. al., 1999). Recent research in the Philippines that covered 73 rural provinces also suggested that road infrastructure endowment proved to be, by far, the strongest predictor of successful poverty reduction (Balisacan, 2001). A study in Indonesia that covered 25 provinces from 1976 and 1996 found that poverty was most sensitive to road investments, followed by education, agriculture, and irrigation (Kwon, 2000). In a recent study of 17 Indian states from 1970 to 1994, it was found that a 10% increase in the road network (measured by km of road per square km of land) would lead to a 3.4% increase in income per capita (Nagaraj et. al., 2000). Another study in Mexico showed that a 10% increase in market access (as defined by the density and quality of the road network within the region) would increase labor productivity by 6% (Deichmann, 2000). In former Zaire, the road quality was found to be the key factor in determining the significant differences in food prices across regions (Minten et. al., 1999). These are but a few examples that indicate the importance of the road sector in economic development and poverty reduction.
An overview of road sector development in China and India is provided in this section, followed by a more detailed comparative look at the two countries from the viewpoint of the road sector development scope, institutional setting, and investment and funding climate.
Road Sector Comparative Overview
The development of the road infrastructure remained relatively unimportant in China’s national development strategy during the pre-reform period. When the reforms began in 1978, China, consequently, was poorly endowed with road infrastructure and the road density was well below that of India; it remained 20-30% below India throughout the 1980s. Despite the priorities given to develop the road infrastructure, relatively low levels of investment in the transport sector in the early years of the reform period—compared to investment levels in the industrial sector—combined with significant growth in inter-regional trade following the reforms created serious road shortages and urban congestion. Since 1985, however, the Government has geared up its investments in roads, particularly for high quality roads such as highways connecting major industrial centers in the coastal areas. In the 1990s, as the infrastructure investments became a national priority, China started to invest massively in road construction. Road projects are now an important part of China’s strategy to develop the western region and to reduce the disparities between the well-developed coastal regions and inner provinces, and between the urban and rural areas.
As mentioned earlier, India, home to more people living on less than $1 per day than any other nation, faces significant hurdles in its efforts to combat poverty and stimulate economic growth. Even so, progress over the past decade and a half has been notable. Beginning in 1991, the government launched a series of economic reforms aimed at market liberalization that stimulated annual GDP growth on the order of 6 to 6.5% in the ensuing years. The first wave of reforms deregulated and expanded foreign trade, deregulated and privatized domestic industries, and cut many government subsidies; the second wave, now underway, is focused on eliminating redundant public sector employees, as well as attracting increased private and foreign investment (Bansal, 2002a).
12
Not surprisingly, sustained growth in the Indian economy has led to a corresponding increase in the demand for transportation services within the country. Regrettably, considerably less attention has been devoted to improving transportation infrastructure over the same period, and the country’s transportation systems remain in a rather dismal state. Within the road sector, for instance, India has only 3,000 km of highways with more than two lanes, and major economic centers are not yet linked by access-controlled expressways. Congestion along the existing network is both rampant and chronic, leading to significant economic losses associated with wasted time and fuel. Safety is another major concern, as indicated by a crash-related death rate per vehicle that is about ten times higher than that within the European Union. Finally, due to scarce funding and lack of investment in the road program, about 40% of India's 661,000 rural villages do not have all-weather access to markets and social services. Many of the 70 million urban residents living below the national poverty line lack access to basic infrastructure services such as affordable transport (Bansal, 2002a). Given such circumstances, poor transportation is now viewed as a major threat to the continued growth of the Indian economy (Akanda, 2003).
To put India's relative lack of progress in the road infrastructure sector into perspective, it is useful to contrast the country's experience with that of China over the past fifteen years. As mentioned previously, at the beginning of the 1990s, India's road structure was actually more advanced than that of China, but that advantage reversed dramatically in the intervening years. Between 1991 and 2002, China's annual investment in its road network increased from about US$1 billion to around $38 billion; meanwhile, India's annual investment, starting at a similar level in 1991, increased to just $3 billion over the same twelve year period. China also adopted a different investment allocation philosophy, focusing first on arterial networks to connect its 100 largest cities. Projects included the 35,000 km national trunk highway system, along with an additional 25,000 km of low-grade four-lane highways without access control. In total, China devoted 60% of its investment to new arterial networks, 25% to upgrading existing networks, and 15% to rural roads. India, in contrast, focused mainly on rural roads, adopting the basic goal of stretching a limited budget as far as possible (Harral et. al., 2005). India's choices have had severe consequences; whereas China currently boasts an impressive road network infrastructure capable of supporting its continued economic growth into the future, India must now find a way to deal with an under-sized and over-crowded road system that threatens to choke further economic progress. Indian officials are well aware of this dilemma and have taken initial steps to reverse this trajectory. Initial results appear promising, but much remains to be done.
Road Sector Development Scope
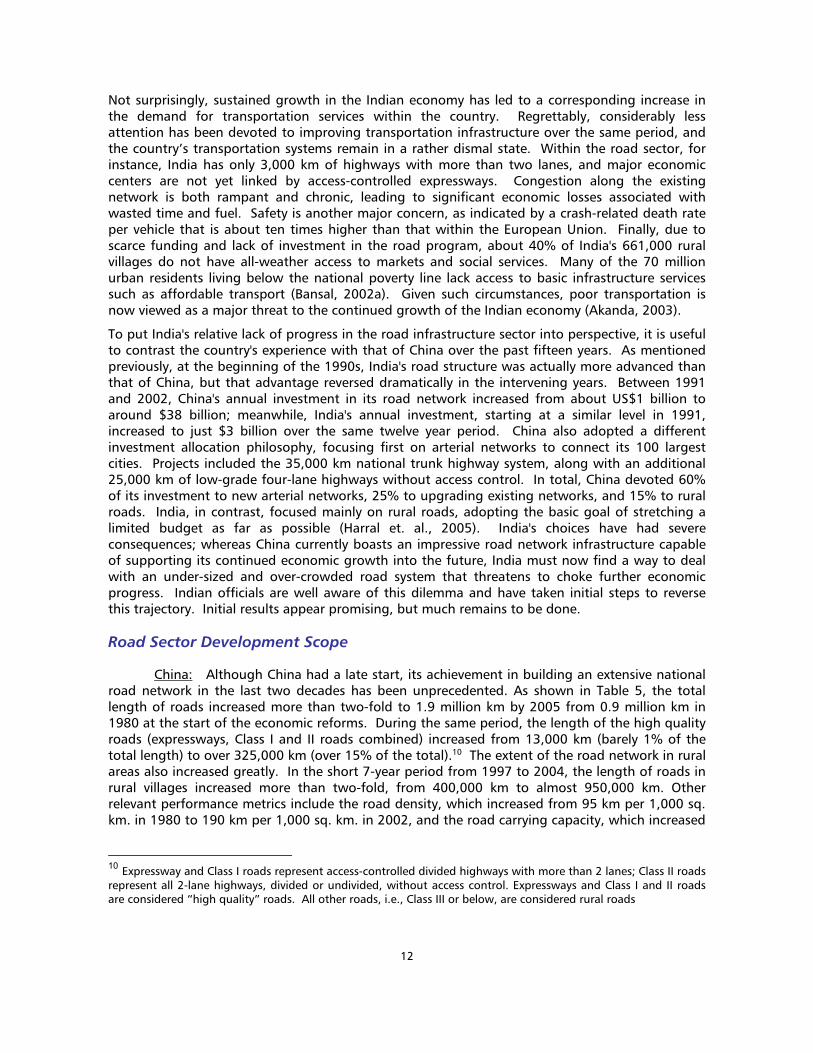
China: Although China had a late start, its achievement in building an extensive national road network in the last two decades has been unprecedented. As shown in Table 5, the total length of roads increased more than two-fold to 1.9 million km by 2005 from 0.9 million km in 1980 at the start of the economic reforms. During the same period, the length of the high quality roads (expressways, Class I and II roads combined) increased from 13,000 km (barely 1% of the total length) to over 325,000 km (over 15% of the total).10 The extent of the road network in rural areas also increased greatly. In the short 7-year period from 1997 to 2004, the length of roads in rural villages increased more than two-fold, from 400,000 km to almost 950,000 km. Other relevant performance metrics include the road density, which increased from 95 km per 1,000 sq. km. in 1980 to 190 km per 1,000 sq. km. in 2002, and the road carrying capacity, which increased
10 Expressway and Class I roads represent access-controlled divided highways with more than 2 lanes; Class II roads represent all 2-lane highways, divided or undivided, without access control. Expressways and Class I and II roads are considered “high quality” roads. All other roads, i.e., Class III or below, are considered rural roads
13
Table 5: China Road Characteristics (1980-2005) (in 1,000 kms)
1980 1990 2000 2005 Length of Roads Classification:a Expressway 0 0.5 16.3 41.0 Class I 0.2 2.6 25.2 38.4 Class II 12.6 43.4 177.8 246.4 Class III 108.3 169.8 305.4 344.7 Class IV 400.1 524.8 791.2 921.3 Substandard 367.1 287.2 363.9 338.8 Total 888.25 1028.4 1679.8 1930.5
Jurisdiction: National 107.5 119.0 132.7 Provincial 166.1 212.5 233.8 County 340.8 461.9 494.3 Village/Township 370.2 800.7 981.4 Special Purpose 43.8 85.9 88.4 Total 1028.4 1679.8 1930.5
Source: China’s National Bureau of Statistics, Statistical Yearbook of China (various issues).
Table 6: China Road Characteristics by Region (2002)
Share in Total Length of Roads (%) Length of
Roads (km)
Road Density (km/1,000
sq.m.) High Quality
Roads [a] Below Class 4
North 146,745 392.2 19.7 8.5 Northeast 152,192 193.3 17.7 5.3 East 368,500 463.3 20.5 15.5 Central 372,061 478.4 16.6 24.3 Southwest 391,790 166.2 5.6 38.1 Northwest 277,637 65.7 10.5 18.2
National Total 1,765,222 184.7 14.1 21.7 a Represents expressways and Class I and II roads combined. Source: China’s National Bureau of Statistics, Statistical Yearbook of China, 2003
from 2.2 billion people and 3.8 billion tons of freight to almost 15 billion people and 11 billion tons of freight in the same period.
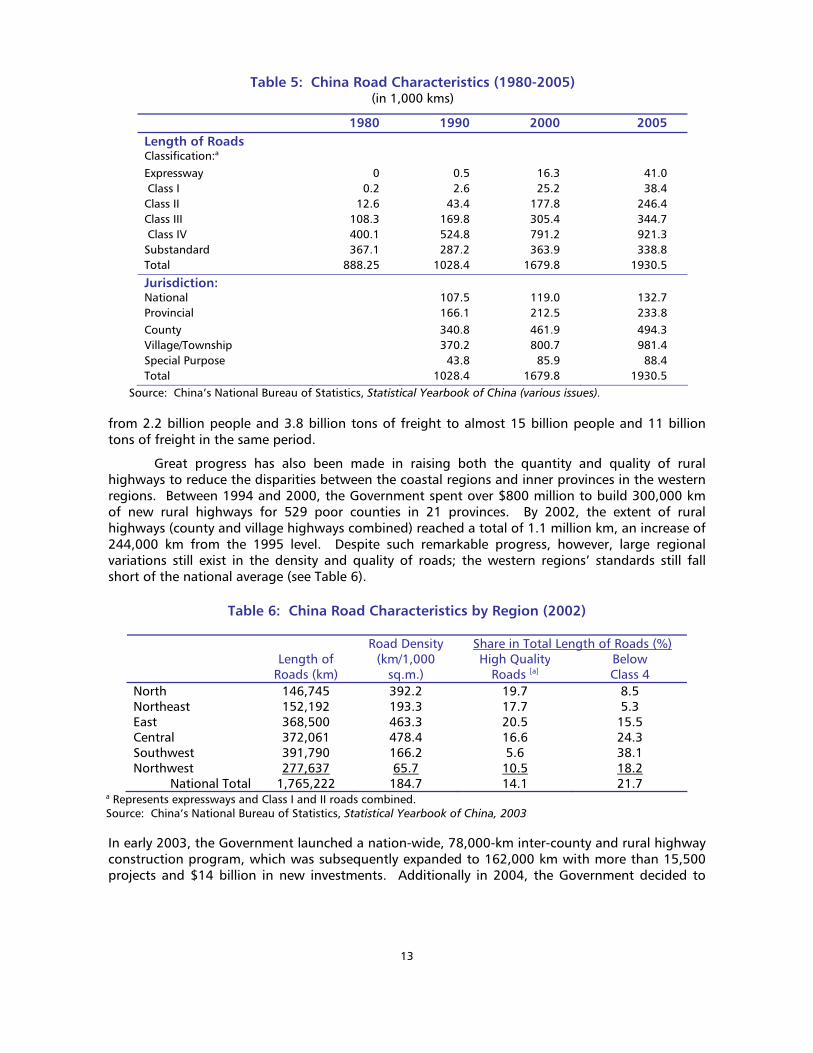
Great progress has also been made in raising both the quantity and quality of rural highways to reduce the disparities between the coastal regions and inner provinces in the western regions. Between 1994 and 2000, the Government spent over $800 million to build 300,000 km of new rural highways for 529 poor counties in 21 provinces. By 2002, the extent of rural highways (county and village highways combined) reached a total of 1.1 million km, an increase of 244,000 km from the 1995 level. Despite such remarkable progress, however, large regional variations still exist in the density and quality of roads; the western regions’ standards still fall short of the national average (see Table 6).
In early 2003, the Government launched a nation-wide, 78,000-km inter-county and rural highway construction program, which was subsequently expanded to 162,000 km with more than 15,500 projects and $14 billion in new investments. Additionally in 2004, the Government decided to
14
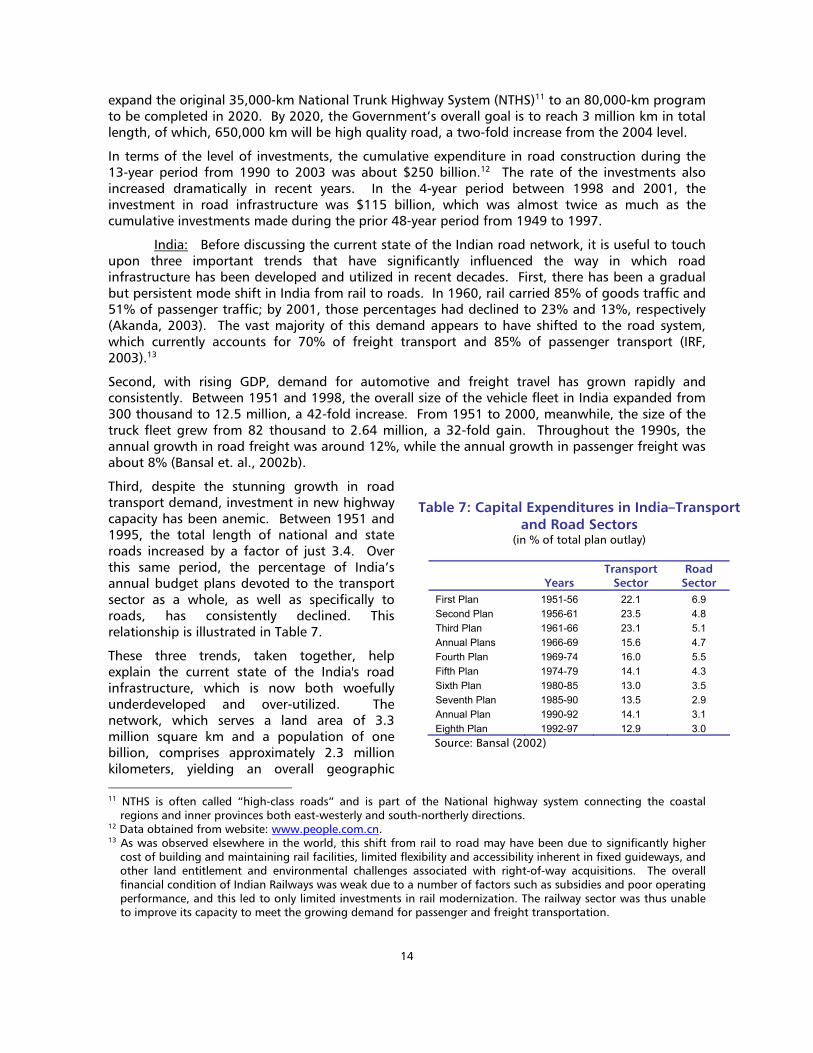
Table 7: Capital Expenditures in India–Transport and Road Sectors
(in % of total plan outlay)
Years Transport
Sector Road
Sector First Plan 1951-56 22.1 6.9 Second Plan 1956-61 23.5 4.8 Third Plan 1961-66 23.1 5.1 Annual Plans 1966-69 15.6 4.7 Fourth Plan 1969-74 16.0 5.5 Fifth Plan 1974-79 14.1 4.3 Sixth Plan 1980-85 13.0 3.5 Seventh Plan 1985-90 13.5 2.9 Annual Plan 1990-92 14.1 3.1 Eighth Plan 1992-97 12.9 3.0 Source: Bansal (2002)
expand the original 35,000-km National Trunk Highway System (NTHS)11 to an 80,000-km program to be completed in 2020. By 2020, the Government’s overall goal is to reach 3 million km in total length, of which, 650,000 km will be high quality road, a two-fold increase from the 2004 level.
In terms of the level of investments, the cumulative expenditure in road construction during the 13-year period from 1990 to 2003 was about $250 billion.12 The rate of the investments also increased dramatically in recent years. In the 4-year period between 1998 and 2001, the investment in road infrastructure was $115 billion, which was almost twice as much as the cumulative investments made during the prior 48-year period from 1949 to 1997.
India: Before discussing the current state of the Indian road network, it is useful to touch upon three important trends that have significantly influenced the way in which road infrastructure has been developed and utilized in recent decades. First, there has been a gradual but persistent mode shift in India from rail to roads. In 1960, rail carried 85% of goods traffic and 51% of passenger traffic; by 2001, those percentages had declined to 23% and 13%, respectively (Akanda, 2003). The vast majority of this demand appears to have shifted to the road system, which currently accounts for 70% of freight transport and 85% of passenger transport (IRF, 2003).13
Second, with rising GDP, demand for automotive and freight travel has grown rapidly and consistently. Between 1951 and 1998, the overall size of the vehicle fleet in India expanded from 300 thousand to 12.5 million, a 42-fold increase. From 1951 to 2000, meanwhile, the size of the truck fleet grew from 82 thousand to 2.64 million, a 32-fold gain. Throughout the 1990s, the annual growth in road freight was around 12%, while the annual growth in passenger freight was about 8% (Bansal et. al., 2002b).
Third, despite the stunning growth in road transport demand, investment in new highway capacity has been anemic. Between 1951 and 1995, the total length of national and state roads increased by a factor of just 3.4. Over this same period, the percentage of India’s annual budget plans devoted to the transport sector as a whole, as well as specifically to roads, has consistently declined. This relationship is illustrated in Table 7.
These three trends, taken together, help explain the current state of the India's road infrastructure, which is now both woefully underdeveloped and over-utilized. The network, which serves a land area of 3.3 million square km and a population of one billion, comprises approximately 2.3 million kilometers, yielding an overall geographic 11 NTHS is often called “high-class roads” and is part of the National highway system connecting the coastal
regions and inner provinces both east-westerly and south-northerly directions. 12 Data obtained from website: www.people.com.cn. 13 As was observed elsewhere in the world, this shift from rail to road may have been due to significantly higher
cost of building and maintaining rail facilities, limited flexibility and accessibility inherent in fixed guideways, and other land entitlement and environmental challenges associated with right-of-way acquisitions. The overall financial condition of Indian Railways was weak due to a number of factors such as subsidies and poor operating performance, and this led to only limited investments in rail modernization. The railway sector was thus unable to improve its capacity to meet the growing demand for passenger and freight transportation.
15
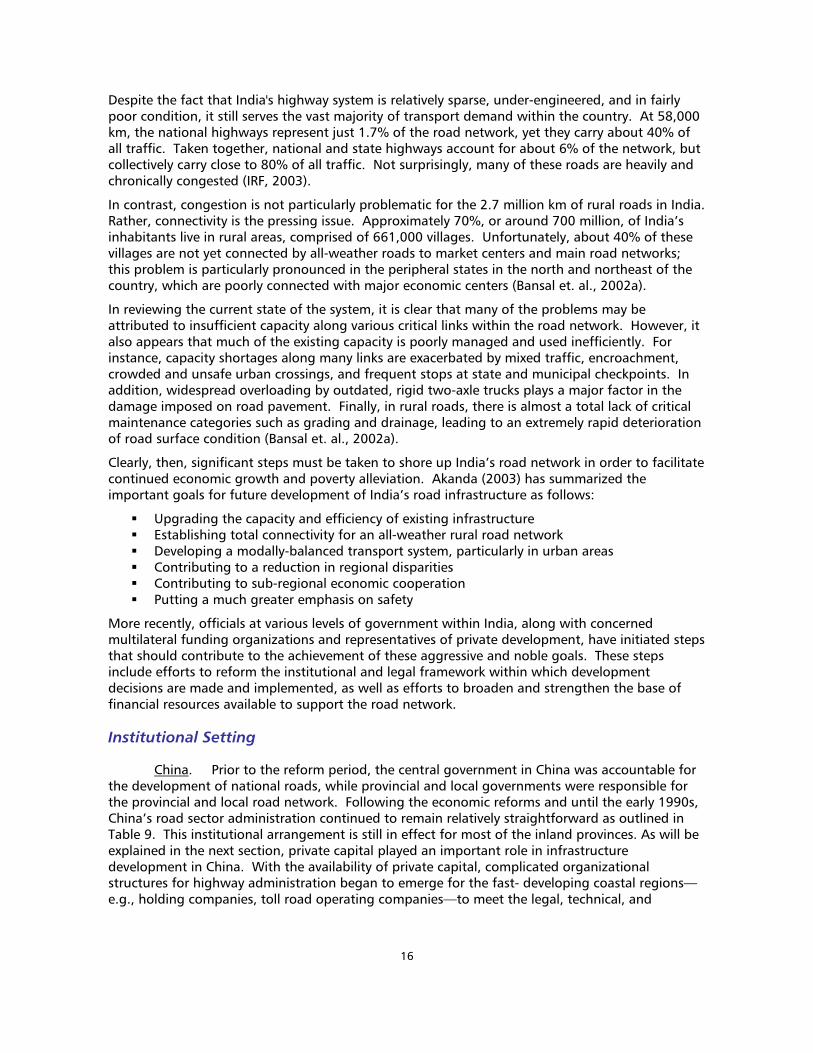
Table 8: India Highway Condition Breakdown (in percent of total, %)
State Highways
IRI National Highways
Single Lane
Intermediate lane
Two Lanes
< 4 (Good) 50.7 11.0 10.8 11.2
4-6 (Fair) 23.6 23.4 31.8 48.4
6-8 (Poor) 25.7 35.3 34.6 35.5
>8 (Very Poor)
0.0 30.4 22.7 4.9
IRI= International Roughness Index Source: Bansal et al. (2002a).
density of 0.66 km of roadway per square km of land (this is actually about the same density as that found in the U.S., at 0.65, and much higher than that in China, at 0.16) (Bansal, 2002a).
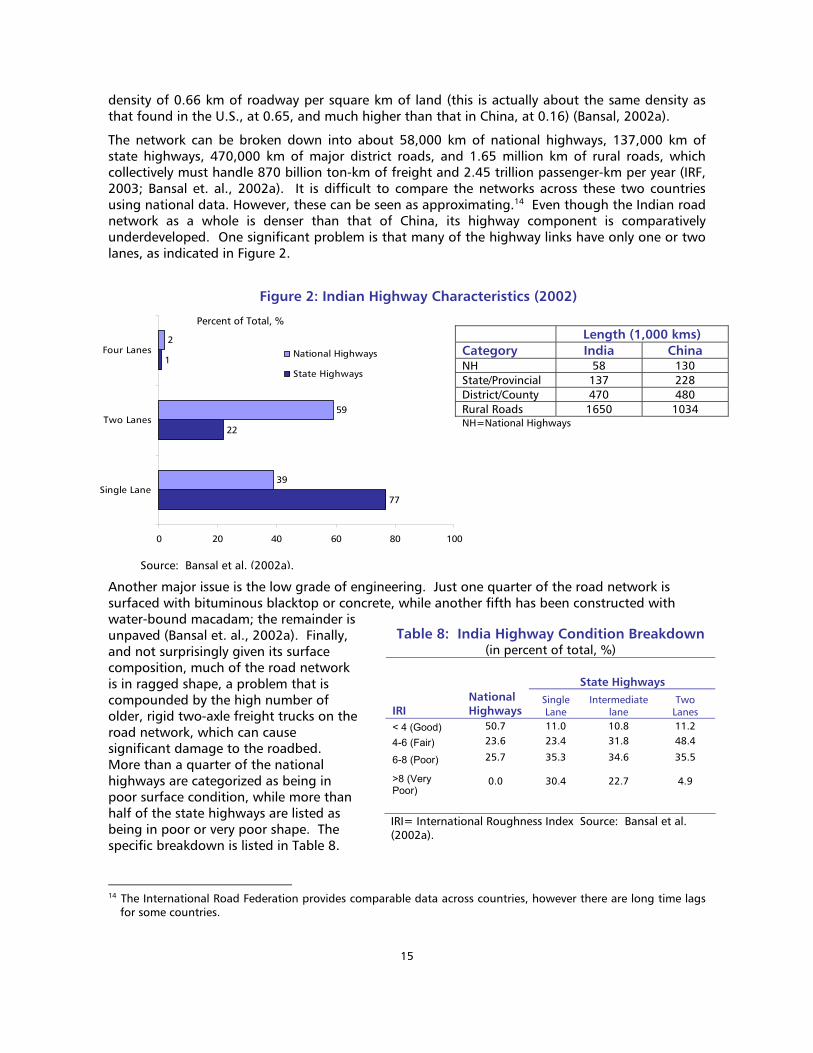
The network can be broken down into about 58,000 km of national highways, 137,000 km of state highways, 470,000 km of major district roads, and 1.65 million km of rural roads, which collectively must handle 870 billion ton-km of freight and 2.45 trillion passenger-km per year (IRF, 2003; Bansal et. al., 2002a). It is difficult to compare the networks across these two countries using national data. However, these can be seen as approximating.14 Even though the Indian road network as a whole is denser than that of China, its highway component is comparatively underdeveloped. One significant problem is that many of the highway links have only one or two lanes, as indicated in Figure 2.
Another major issue is the low grade of engineering. Just one quarter of the road network is surfaced with bituminous blacktop or concrete, while another fifth has been constructed with water-bound macadam; the remainder is unpaved (Bansal et. al., 2002a). Finally, and not surprisingly given its surface composition, much of the road network is in ragged shape, a problem that is compounded by the high number of older, rigid two-axle freight trucks on the road network, which can cause significant damage to the roadbed. More than a quarter of the national highways are categorized as being in poor surface condition, while more than half of the state highways are listed as being in poor or very poor shape. The specific breakdown is listed in Table 8.
14 The International Road Federation provides comparable data across countries, however there are long time lags
for some countries.
Figure 2: Indian Highway Characteristics (2002)
77
22
1
39
59
2
0 20 40 60 80 100
Single Lane
Two Lanes
Four Lanes National Highways
State Highways
Source: Bansal et al. (2002a).
Length (1,000 kms) Category India China NH 58 130 State/Provincial 137 228 District/County 470 480 Rural Roads 1650 1034 NH=National Highways
Percent of Total, %
16
Despite the fact that India's highway system is relatively sparse, under-engineered, and in fairly poor condition, it still serves the vast majority of transport demand within the country. At 58,000 km, the national highways represent just 1.7% of the road network, yet they carry about 40% of all traffic. Taken together, national and state highways account for about 6% of the network, but collectively carry close to 80% of all traffic. Not surprisingly, many of these roads are heavily and chronically congested (IRF, 2003).
In contrast, congestion is not particularly problematic for the 2.7 million km of rural roads in India. Rather, connectivity is the pressing issue. Approximately 70%, or around 700 million, of India’s inhabitants live in rural areas, comprised of 661,000 villages. Unfortunately, about 40% of these villages are not yet connected by all-weather roads to market centers and main road networks; this problem is particularly pronounced in the peripheral states in the north and northeast of the country, which are poorly connected with major economic centers (Bansal et. al., 2002a).
In reviewing the current state of the system, it is clear that many of the problems may be attributed to insufficient capacity along various critical links within the road network. However, it also appears that much of the existing capacity is poorly managed and used inefficiently. For instance, capacity shortages along many links are exacerbated by mixed traffic, encroachment, crowded and unsafe urban crossings, and frequent stops at state and municipal checkpoints. In addition, widespread overloading by outdated, rigid two-axle trucks plays a major factor in the damage imposed on road pavement. Finally, in rural roads, there is almost a total lack of critical maintenance categories such as grading and drainage, leading to an extremely rapid deterioration of road surface condition (Bansal et. al., 2002a).
Clearly, then, significant steps must be taken to shore up India’s road network in order to facilitate continued economic growth and poverty alleviation. Akanda (2003) has summarized the important goals for future development of India’s road infrastructure as follows:
Upgrading the capacity and efficiency of existing infrastructure Establishing total connectivity for an all-weather rural road network Developing a modally-balanced transport system, particularly in urban areas Contributing to a reduction in regional disparities Contributing to sub-regional economic cooperation Putting a much greater emphasis on safety
More recently, officials at various levels of government within India, along with concerned multilateral funding organizations and representatives of private development, have initiated steps that should contribute to the achievement of these aggressive and noble goals. These steps include efforts to reform the institutional and legal framework within which development decisions are made and implemented, as well as efforts to broaden and strengthen the base of financial resources available to support the road network.
Institutional Setting
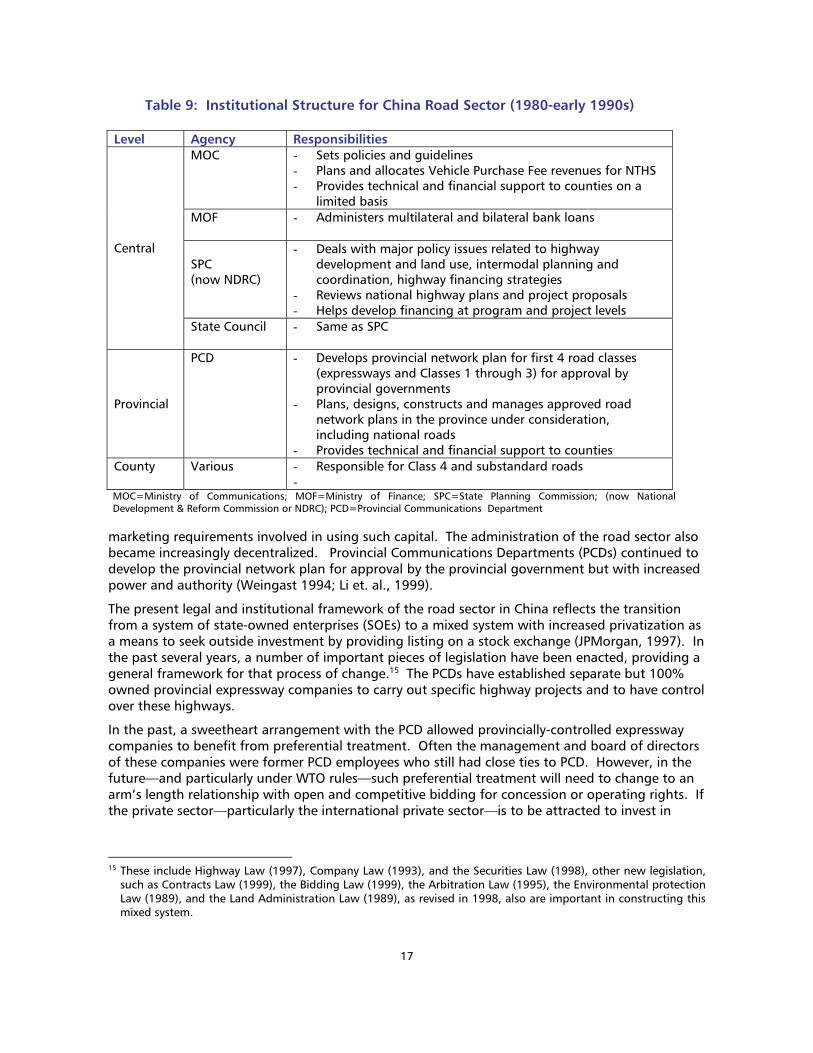
China. Prior to the reform period, the central government in China was accountable for the development of national roads, while provincial and local governments were responsible for the provincial and local road network. Following the economic reforms and until the early 1990s, China’s road sector administration continued to remain relatively straightforward as outlined in Table 9. This institutional arrangement is still in effect for most of the inland provinces. As will be explained in the next section, private capital played an important role in infrastructure development in China. With the availability of private capital, complicated organizational structures for highway administration began to emerge for the fast- developing coastal regions—e.g., holding companies, toll road operating companies—to meet the legal, technical, and
17
Table 9: Institutional Structure for China Road Sector (1980-early 1990s)
Level Agency Responsibilities MOC - Sets policies and guidelines
- Plans and allocates Vehicle Purchase Fee revenues for NTHS - Provides technical and financial support to counties on a
limited basis MOF - Administers multilateral and bilateral bank loans
SPC (now NDRC)
- Deals with major policy issues related to highway development and land use, intermodal planning and coordination, highway financing strategies
- Reviews national highway plans and project proposals - Helps develop financing at program and project levels
Central
State Council - Same as SPC
Provincial
PCD - Develops provincial network plan for first 4 road classes (expressways and Classes 1 through 3) for approval by provincial governments
- Plans, designs, constructs and manages approved road network plans in the province under consideration, including national roads
- Provides technical and financial support to counties County Various - Responsible for Class 4 and substandard roads
- MOC=Ministry of Communications; MOF=Ministry of Finance; SPC=State Planning Commission; (now National Development & Reform Commission or NDRC); PCD=Provincial Communications Department
marketing requirements involved in using such capital. The administration of the road sector also became increasingly decentralized. Provincial Communications Departments (PCDs) continued to develop the provincial network plan for approval by the provincial government but with increased power and authority (Weingast 1994; Li et. al., 1999).
The present legal and institutional framework of the road sector in China reflects the transition from a system of state-owned enterprises (SOEs) to a mixed system with increased privatization as a means to seek outside investment by providing listing on a stock exchange (JPMorgan, 1997). In the past several years, a number of important pieces of legislation have been enacted, providing a general framework for that process of change.15 The PCDs have established separate but 100% owned provincial expressway companies to carry out specific highway projects and to have control over these highways.
In the past, a sweetheart arrangement with the PCD allowed provincially-controlled expressway companies to benefit from preferential treatment. Often the management and board of directors of these companies were former PCD employees who still had close ties to PCD. However, in the future—and particularly under WTO rules—such preferential treatment will need to change to an arm’s length relationship with open and competitive bidding for concession or operating rights. If the private sector—particularly the international private sector—is to be attracted to invest in
15 These include Highway Law (1997), Company Law (1993), and the Securities Law (1998), other new legislation,
such as Contracts Law (1999), the Bidding Law (1999), the Arbitration Law (1995), the Environmental protection Law (1989), and the Land Administration Law (1989), as revised in 1998, also are important in constructing this mixed system.
18
these companies, transparency and proper accountability in the companies’ internal operations and decision-making process must be assured (CPCS, 2001).
India. The current woes of India’s road transport sector can be at least partially attributed to a deep-rooted philosophical attitude—one that has permeated many of the country’s governmental institutions—that transport should be viewed as an area in which economic efficiency should not necessarily take precedence over social equity. This belief is reflected in the low priority given to road infrastructure during most of the 1970s and 1980s, when many road tax revenues were earmarked for other forms of government spending (IRF, 2003a). Paradoxically, the lack of reinvestment on roads reduced much- needed connectivity of the rural road network, often penalizing the most remote and poorest areas of the country. Most of the social equity objectives set for the transport sector have not been achieved and economic efficiency, meanwhile, has been seriously compromised (Bansal et. al., 2002a).
Vestiges of this philosophy are still apparent within the current institutional and legal structure within India. Although there is some mixture of public and private activity within the transport arena, it remains divided along fairly strict lines. The public sector dominates in the area of transport infrastructure, while the private sector is heavily engaged in road transport services (providing, for example, all freight trucking along with about 70% of intercity bus services), consultant services, and civil works (Bansal et. al., 2002a).
Within the public arena, the Indian Constitution assigns responsibility for the national highway network to the central government, while state governments are charged with developing and maintaining state highways and rural roads. At the state level, highways are typically provided and maintained by state public works departments (PWDs), while rural roads may be taken care of either by PWDs or by local government engineering departments. At the central level, responsibility for the national highway system is split between the Ministry of Road Transport and Highways (MORTH) and the recently created National Highways Authority of India (NHIA), although the maintenance of national highways under MORTH is increasingly delegated to state PWDs (Bansal et. al., 2002a).
In order to perform their tasks more effectively, these national, state, and local agencies must collectively overcome a number of structural challenges, many of which can only be solved through policy or institutional reform. At the broadest level, the most pressing issues fall under the categories of poorly defined bureaucratic structure/mission, insufficient accountability, poor asset/system management, and inadequate resource mobilization.16 These categories can be broken down into greater detail as follows:
Poorly defined bureaucratic structure/mission
Unclear or overlapping responsibilities, often with no agency in charge Multiple mandates including roads, buildings, and irrigation Absence of clear strategic goals, mission statements, performance indicators, or
investment plans
Insufficient accountability
Failure to separate policy and operational roles for clear accountability Not enough consultation with road users Failure to report all relevant information Failure to impose sanctions on poor performance Absence of independent bodies to verify information and assess performance
16 See Akanda (2003), Bansal et al. (2002a), Bansal et al. (2002b),
19
Inappropriate evaluation techniques that are merely input-based, focusing solely on accounting for expenditures against the budget and not taking into consideration the physical or operational conditions of the actual road network
Poor asset/system management
Inadequate attention to data collection and analysis in decision-making Excessive focus on new investment vs. maintenance Uneconomical investments made under political influence Lack of competition in procurement Need for leaner staffing with greater skill-set diversification Declining investments in transport relative to GDP Input from private finance still very limited Need to make better use of user charges in the form of gas taxes or tolling
Though these problems are daunting, agencies at various levels within the government have taken initial steps to address them in recent years. Within the central government, notable examples include:
Increasing the level of public funding for transportation within the Ninth Five-Year Plan Creating the Central Road Fund (CRF) to finance road development and maintenance
through an earmarked "cess" (tax) on diesel and gasoline Operationalizing the National Highways Authority of India (NHAI) to act as an
infrastructure procurer rather than a provider Establishing the National Highways Development Project (NHDP) to upgrade the nationals
major highway routes Amending the National Highway Act to expedite land acquisition, permit private
participation in road financing, and allow for the tolling of public roads
At the national level, India's road sector received a significant boost in 1995 when the NHAI was set up with the express purpose of modernizing the subcontinent's system of national highways (IRF, 2003). The NHAI is a semi-autonomous agency that operates only as a client for planning and procuring road construction, and its staff has greater delegation of authority than in traditional Indian road agencies to allow for a quicker decision process. To become more responsible to user demands, the NHAI has recently constituted a Road Users' Advisory Committee, including representatives from states, road users, businesses, and the construction industry (IRF, 2003).
The momentum for reform at the national level was further bolstered in 1998, when the Indian Prime Minister Shri Vajpayee announced a strategic vision for upgrading the national highway system that could serve as a model for other developing nations. To support this aim, the NHAI devised the master plan for the National Highways Development Project, which calls for an investment of approximately US$10 billion (in 1999 dollars) to upgrade more than 14,000 km of national highways to four, six, or eight lanes. Notable elements of the project include a 5,900 km "golden quadrilateral" linking Delhi, Kolkata, Chennai, and Mumbai, as well as approximately 7,300 km for the north-south corridor between Srinagar and Kanayakumari and the east-west corridor between Silchar and Porbandar (IRF, 2003).
Over the course of the NHDP effort, it is envisioned that the project will provide direct employment to nearly 2.5 million workers along with 10 thousand supervisors a day. It will also help to jumpstart India's cement and steel industries, requiring on the order of 4 million tons of cement and 300 thousand tons of steel on an annual basis. When the work is completed, average speed along the national highways should double to 60 km per hour, resulting in lower fuel bills and significant travel-time savings. The improved arterial network will also help to further
20
integrate India's rural areas and promote their economic development through faster access from the hinterland to main marketing areas (IRF, 2003).
In addition to progress at the national level, a handful of states have also undertaken institutional reform efforts with the goal of improving the delivery and maintenance of highway infrastructure (Bansal et. al., 2002b). Examples include:
Divesting rural roads to local governments or dedicated central agencies Separating responsibility for state roads from building and/or irrigation functions Divesting government construction plants and equipment Establishing mechanisms for broader road user participation Creating Road Development Corporations (RDCs) as implementing agencies with clear
mandates and a capacity to raise private finance
Finally, policy initiatives to address the current lack of all-weather connectivity throughout the rural road network are also underway. In 2000, the prime minister introduced the Pradhan Mantri Gram Sadak Yojana (PMGSY), a program designed to improve the rural network in a systematic fashion. Specific goals of PMGSY included connecting road access to all rural communities with a population of greater than 1000 by 2003, and to all communities with a population of greater than 500 by 2007. As a result, approximately 600,000 km of tracks and trails in total have been refurbished as technically sound and durable roads. PMGSY has been implemented by the newly created National Rural Road Development Agency (NRRDA), which is administered by the Indian government’s Ministry of Rural Development. Because the Indian constitution assigns responsibility for developing rural roads to state governments, the NRRDA is working in partnership with the appropriate state agencies to implement the development projects (IRF, 2003).
Collectively, then, at the national, state, and rural road levels, recent institutional and policy-related reforms appear to mark the beginning of an important paradigm shift—from treating transport as social service to treating it as an economic development tool that simultaneously combats poverty (Bansal et. al., 2002a).
Investment Climate and Funding Sources
China. Under the centrally planned system, provincial and local governments in China typically received funds for infrastructure construction from the central government. Starting in the early 1990s, China recognized that the highway expansion needs would not be met by the traditional revenue sources. To respond to the growing travel demand from the liberalization of the economy and rapid economic growth, other sources would be needed. As a result, the sources of funds for roads became increasingly diversified to include not only funds from central and local governments but also loans and credits from multilateral and bilateral organizations and commercial banks, as well as from foreign and domestic private capital. These funding sources became critical for China’s road infrastructure since 1990, especially for building the high-class highway network. The use of the toll roads also became the primary vehicle for accessing private capital and other new sources of funding. China presently is charging tolls on virtually all high-quality highways. Under various revenue sharing arrangements between the government and private investors, many of these toll facilities now generate significant revenues to provide important funding sources for new construction and for leveraging external financing.
The general transaction of toll roads is centered upon the establishment of provincial toll road companies, which act as the financing vehicles for PCDs. PCDs inject operating assets to these special purpose entities to give them a high level of credit worthiness from the outset to raise new capital for the road development projects. Many of these companies are diversified with

21
Table 10: China’s Highway Funding by Sources (%)
Sources
1998-2001 Average
Central: - Ministry Special Funds - Central Fiscal
Subtotal
7.0 1.3
8.3%
Provincial: - Domestic Loans - Local Fiscal - Self-Raised
Subtotal
37.3 4.6
46.1 87.9%
Foreign Capital 3.8% TOTAL 100.0%
Source: Fan et. al., 2005.
comprehensive portfolios. In 1999, for example, the Hong Kong Stock Exchange listed eight stocks that had a substantial part of their assets in Chinese roads, mostly in Guangdong (CPCS, 2001). Most of these companies are ultimately controlled by entities associated with the PCDs in provinces where the assets are located. Private funding initiatives for toll roads in China, i.e., the creation of private toll road companies with assets securitized on the markets, basically rely on five specific instruments: joint ventures (JV), securitization, loans from multilateral and bilateral agencies, domestic bonds, and commercial rate loans from the Chinese banks. JV arrangements are by far the most popular instrument, followed by securitization.
The multilateral and bilateral institutions historically played a central role in helping to solve the funding shortfalls by enabling the government to experiment with different kinds of road management structures.17 Multilateral funds were used mainly for purposes of financing national and provincial trunk routes. It is anticipated that these funds will be less attractive in the future due to the conditionality that is usually attached to them. In addition, given that China is no longer eligible for concessional loans, these funds will also become more expensive than domestic rates. They remain, however, an important source for the construction of rural and feeder roads.
Beginning in 1998, another important change was made as the issuance of long-term public bonds to finance road and other infrastructure projects became more prevalent. Between 1998 and 2002, China issued more than $74 billion in bonds to state-owned banks, such as the Industrial and Commercial Bank of China, for the following types of projects (Fan et. al., 2005):
Construction of highways, railways, airfields, ports, and telecommunication projects Infrastructure investments in agriculture, forests, water conservancy, and the environment Environmental protection Upgrading rural and urban electric networks.
As local governments gained more autonomy, they became responsible for most of the road projects financed by bonds. For example, local governments applying for expressway construction projects are now required to raise 35% of the cost themselves from their own revenue (including tolls) and by selling bonds (Fan et. al., 2005). The remaining 65% of the cost is funded through bank loans. As the investments in roads—especially for high-quality roads such as highways and expressways—has proven to be profitable in recent years, the banks are now more eager to fund road projects, especially in the eastern region.
Table 10 shows the breakdown of highway investments by sources of funds averaged over the 4-year period between 1998 and 2001. The local governments contributed to most of the highway investments (88%) in that period, followed by the central government (8.3%) and foreign capital (3.8%). Two sources of funds make up the
17 The World Bank, for example, has been supporting China’s transport sector since 1983. By 1998, China obtained
18 road loans from the World Bank totaling about $3.3 billion, which helped to support 1,300 km of high-class roads and 4,000 km of other roads. China currently has the biggest road portfolio among all the World Bank’s client countries.
22
lion’s share of the investments: domestic loans and self-raised funds by local governments, which together accounted for more that 80% of investments in 1998-2001.
The situation is quite different in western China where local governments cannot get enough revenue from tolls to pay for road maintenance and repay principal and interest on the loans. The greater autonomy given to local governments, in fact, contributed to widening regional inequality as the capacity to raise funds to finance road projects depended on local government revenue and their ability to negotiate higher contributions from the central governments. As a result, the central government launched major road construction projects in the central and western regions. From 1998 to 2001, for example, the share of highway investment in central and western China increased from 45% to 55%.
Between 1998 and 2020, it is estimated that over $150 Billion will be needed to complete the high-quality NTHS roads with only 50% of the requirement coming from user fees and other direct charges. The World Bank has estimated the likely shortfall in funding will be approximately 30% of this total, or $50 billion overall.18 In addition, China’s 10th Five-Year Plan called for a total investment requirement in road infrastructure to be $120 billion. A major portion of the available funding from this Plan has been directed at the western provinces—mainly in development roads and the high quality Class 1 and 2 roads,19 with preference given to expressways linking the western provinces with eastern areas of the country. Under this plan, it is anticipated that $20 to $25 billion in private investment will need to be raised to meet the needs of the road infrastructure.20 As the central government begins to redirect its resources increasingly to the western part of China, the eastern provinces will need to find private capital to supplement their road construction program.
The financial environment in China is in a constant state of flux. On the investment side, due to the increased individual and collective wealth, there is significant interest in investment options in China by both the individual and institutional investors.21 The domestic capital market represents an important debt and equity finance source for infrastructure projects in China, which has developed extensively in recent years as evidenced by the opening of the Shanghai and Shenzhen Securities Exchanges in the 1990s and the growth in domestic bond market. China’s debt market is currently dominated by government bonds. Under the State Plan, the bond issue quotas are given to ministries and provinces, which, in turn, allocate quotas for highway companies and other domestic enterprises. It is estimated that the bond funds will account for about 20% of the needed capital in the roadway sector in the future.
India. Most observers of the Indian transport sector would agree that there has been inadequate financing of roads in the past, with allocations to the road sector consistently declining as a share of the total national budget over successive planning periods. Road financing has also been problematic at the state level, and there has been a consistent bias towards investment in rural access rather than maintenance and rehabilitation of the most economically beneficial roads. Until quite recently, user fees have not been tapped as a major source of revenue, and capital from the private sector has not been widely leveraged.
At the present time, there is, in fact, a wide variety of taxes levied on the road transport sector. These include cesses (taxes) on diesel and petrol, unions customs duties, excise duties, and central
18 “Private Public Partnership in Toll Roads in China,” Ushering a New Era of International Cooperation between
Engineering Consulting Industry in Asia and the Pacific Region, Three Gorges, China, October 20-26, 2001. 19 Specific road classifications are defined in Table 5. 20 By comparison, the total of all private sector contributions to the end 1999 was about $1.5 billion. 21 Household savings, estimated at about $800 billion, now account for the largest share of domestic bank savings
in China. Corporate investors have historically been an important source for most domestic enterprises in raising initial private equity prior to their listing on the domestic or foreign exchange.
23
sales taxes levied by the central government; motor vehicle taxes, passenger and goods taxes, sales taxes, and entry taxes levied by the states; and octroi (taxes on goods entering a city) and tolls levied by local bodies. Yet even with this wide array of funding mechanisms, road finance in India remains problematic. Major outstanding issues include the following (Akanda, 2003; Bansal et al., 2002b):
Prior to recent diesel and petrol cesses, none of the road-related taxes was specifically earmarked for transportation, and at present, less than 60% of road tax revenues are returned to fund transportation.
Current road user tax burdens are geographically inequitable, varying widely from one area of the country to the next.
Many forms of taxation (such as passenger and goods taxes, sales taxes, and octroi) are both inefficient to administer and time-consuming for users.
Other than a few direct tolls levied on some bypasses and bridges, there have been no explicit pricing signals for road use, and cost recovery—at least for maintenance—has not been a clearly articulated policy goal.
Appropriate incentive structures and institutional frameworks to attract private capital have not been sufficiently developed.
More recently, the Indian government has initiated steps to counteract these longstanding problems. Some of the most notable areas of financial reform include the following:
Establishing a Central Road Fund (CRF) earmarked for transportation improvements and backed by user fee taxes on petrol and diesel
Experimenting with rational road pricing and direct road tolling Seeking expanded funding from multilateral development institutions Bolstering the prospects and incentives for private sector finance.
As mentioned above, India first introduced cesses on diesel and petrol in 1998. In 2000, with the passage of the Central Road Fund Act, the cesses were made permanent, and the funds were channeled into the newly created CRF. From a policy perspective, this represents a major step forward, and the financial implications are far from trivial. Annual revenues from the cesses amount to between US$1.0 and 1.3 billion, and are divided according to the following formula: 33% for the construction and maintenance of national highways, 17% for the construction and maintenance of state highways, 43% for the development of rural roads, and 7% for the development of rail over-bridges to improve safety outcomes (Bansal et al., 2002b; IRF, 2003).
Several state and national road projects are beginning to incorporate the notion of direct tolling as well. The major attraction of this approach is that the fees are directly related to benefits received, and they send a price signal that imposes market discipline on both suppliers and users. They are also clearly separable from general taxes and, with new technology, can be reasonably simple to collect. To date, only a few hundred km of India’s roads are directly tolled (compared to around 4,700 km in China). Even so, it is expected that direct road tolling will continue to increase in importance as road agencies are granted increasing autonomy in raising funds, as the desire to manage demand grows, and as the impact of debt related to current and recent borrowing within the road sector becomes more severe in future years (Bansal et al., 2002b).
The Indian governments at various levels have also sought to expand the available pool of funding from the multilateral financial institutions. Major partners on this front included the World Bank (for example, approximately US$1.6 billion in loans approved between 1992 and 2002), the Japanese Bank for International Cooperation (JBIC) (approximately US$320 million through 2002), and the Asian Development Bank (contributing an additional US$870 million through 2002) (Bansal et al., 2002b).
24
Finally, the government has also taken steps to ramp up the application of private sector finance in highway development and maintenance projects. In addition to standard techniques, such as the issuance of state- and federally-backed bonds, more innovative public-private partnership arrangements have also been developed. Examples include BOTs (build-operate-transfer contracts, in which a private partnership builds and operates a facility for a fixed number of years, recouping its expenses plus a reasonable profit through tolling, before transferring the facility back to the state) and other forms of maintenance and operations concessions (Bansal et al., 2002b).
Different combinations of these new finance trends are being employed within the various divisions of the Indian road sector. For national highway projects, of course, the CRF as well as multilateral funding agencies are both playing a strong role, but the efforts to lure private involvement are particularly pronounced. In order to enhance the attractiveness of BOTs and other forms of concessions, the government has introduced a variety of strategies to lower the risk and increase the reward to private capital. For instance:
The government will carry out all preparatory work, including land acquisition and utility removal, such that right-of-way can be made available to concessionaires free of encumbrances
The government will streamline environmental clearances for large projects Customs duty exemptions have been offered for a number of types of foreign-
manufactured road building equipment that are not manufactured in India The domestic price preference (which tilts the competitive advantage toward Indian firms)
has been removed for a few select projects Bonuses are offered for early completion of projects Procedures for the repatriation of profits have been streamlined The government will provide capital grants of up to 40% for BOT projects Earnings on NHDP projects are 100% tax exempt for five years and 30% tax exempt for ten
years; associated housing and real estate development projects are entitled to the same tax benefits
Up to 100% foreign equity is allowable for roads and bridges New methods of payment, such as annuities and shadow tolls, are being used to reduce
the risk to concessionaires
The sources of funding for state highways are somewhat similar, including allocations from state budgets, money from the CRF, loan assistance from multilateral agencies, and private capital (IRF, 2003). To attract more of the latter, states have begun to experiment with various forms of franchise arrangements, including BOTs as well as maintenance contracts for existing highway links. Contractors are allowed to set up tolls during the concession period in order to generate revenues to cover their costs and profit margins, and in certain cases they are also granted development rights as an added incentive (Bansal et al., 2002b).
The rural road development effort also draws funds from the CRF, from national and state budgets, and from multilateral institutions such as the World Bank and the ADB (IRF, 2003). Unlike highways, however, rural roads do not present much opportunity in terms of developing revenue streams based on user fees (after all, their primary role is to help alleviate poverty and promote rural economic development); as such, there has been less effort to attract the private sector into this arena for anything beyond simple construction contracts. The private capital injection and revenues derived from user fees for the national and state highways may provide opportunity to reallocate or free up public funds to invest in rural roads.
25
SUMMARY AND LESSONS LEARNED
The basic aim of this paper is to record and analyze the overall infrastructure experience and different approaches in infrastructure sector development for China and India. The comparative analysis presented in this paper provides important lessons learned for other developing countries in addressing the critical infrastructure policy issues and questions described in the following.
What Role Should Infrastructure Play In Developing Economies?
There is a large body of literature that analyses the impact of infrastructure on both economic growth and on poverty reduction (Klitgaard, 2004).22 Though there is an overwhelming recognition of the contribution of infrastructure in modern economies, the links between infrastructure and economic growth and poverty reduction is neither certain nor automatic. Infrastructure development results in improvements in productivity and in overall quality of life but the impact is still contextual. A study prepared jointly by three major development institutions—the Asian Development Bank (ADB), Japan Bank for International Cooperation (JBIC), and the World Bank (WB)—advocated that it is not enough to examine impacts of infrastructure without broadening and deepening the definition of poverty and economic growth (ADB et. al., 2005). In the study, the impacts of infrastructure are seen to occur at three levels—first, through facilitating economic growth; second, through improving quality of life; and, finally, through enhancing broader social and economic capabilities.
Nevertheless, manufacturing and exports have proven to be key drivers to economic performance of less developed and developing countries. Infrastructure provides connections to the global economy that are crucial for export competitiveness and manufacturing. As demonstrated by the recent experiences in India and China described in this paper, infrastructure played an important role for these two Asian giants in their development process. They have shown that it is important for top leaders and senior policymakers to take an active posture in developing comprehensive infrastructure sectoral strategies that strike an appropriate balance between economic growth and redistribution of wealth.
China adopted the same model as other fast growing economies in Asia, building infrastructure ahead of demand that helped to promote exports and economic growth. China used infrastructure as a policy instrument and active political tool to reduce poverty and trigger growth. The central government had a strategic vision that was combined with a sustained drive toward economic growth, which resulted in unprecedented growth, poverty reduction, and gains in efficiency, but at a cost of increased inequality and great regional disparity. India started with a very rational approach of maintaining a balance between growth and distribution, but changed mid-course to a greater emphasis on redistribution. India learned the hard way that a greater emphasis on redistribution was not viable without robust and sustained growth. The resulting consequences were limited improvements in growth and poverty reduction with relatively little impact on income distribution.
What Are The Critical Policy And Institutional Dimensions To Infrastructure Development?
Infrastructure development has several important institutional and policy dimensions. The infrastructure story, to be complete, must include the way planning and implementation is undertaken, how the risks are handled, and what type of incentives and accountability structures
22 Cited references are provided at the end.
26
are in place to deliver the infrastructure system. Proper integration between policy-making and implementation and how the market-based systems are phased and merged with the pre-existing, centrally-controlled and planned economy are all part of the story. In recent years, this story has become further complicated by the tremendous global shortage in short- and long-term funding needs for infrastructure. Multilateral and official lending institutions, the traditional funding sources for infrastructure, can fulfill only a small part of the total funding needs.23 Deficit funding will be no longer a viable option in the long-term and the role of private sector will become increasingly important. At the forefront of infrastructure development challenges in the future will be the ability to establish a clear financing and pricing policy and, to the extent possible, in proper alignment between the bearers of infrastructure investments and the beneficiaries from the built facilities.
In terms of institutional and policy dimensions, both India and China used planning as an important tool. China viewed infrastructure development in its totality and encouraged strong integration and coordination between planning and implementation. China also allowed a market-based system to emerge on the margin rather than totally restructuring the existing system. The dual-track system between policy-making and implementation coexisted with market-based non-state arrangements on one hand, and old-style centrally planned command economy on the other. This approach worked because ultimate decision-making authority remained within the central government.
In the period from 1966-1977, India also exercised an incremental move towards state controls. India’s approach was arguably more participatory and democratic in nature with much more technical and managerial focus in planning stage however implementation and resource allocation remained fragmented. India’s approach to decentralization was to duplicate the central government structure at the state and local levels without coordinated roles and responsibilities and integration between different government levels. This resulted in duplication of responsibilities and weakened accountability, where there were too many political bosses. Unlike China, political interventions had negative influence on the overall infrastructure outcomes.
Infrastructure reforms in China were easier due to strong central control. Central control also provided the ability to take risks and to go against the market economy when necessary. In the power sector, for example, what they called “new plant-new price” policy was possible where the consumers had to pay a higher price for the electricity generated by the new plants compared to the same service they received from old plants. The Chinese were also pragmatic in their approach and did not shy away from experimenting and using a trial-and-error approach. India’s reforms only started in the early 1990s with the telecomm sector, which resulted in an unleashing of private entrepreneurship. The reforms also focused on attracting increased private and foreign investment. Although the private sector provided a critical funding source its participation had mixed results for both countries.
Depending on who pays, be they consumers or taxpayers, there will be different challenges for both countries in financing infrastructure projects. For consumers, the challenges will be the pricing and subsidy issues. For tax-payers, the challenges will be transparency and the balance between maintenance of existing facilities versus new construction. For the private sector, the challenges will be to work along side the public sector to encourage policy improvements and better risk allocation models to continue to provide attractive environment for private, foreign direct investment. For official lenders and donors, including multilaterals, the challenges will be changing their role with a focus on experimentation, innovation, and sharing risks; helping to
23 In the power sector, for example, it is estimated that the multilaterals can only satisfy 5 to 10% of the funding
needed.
27
build institutional foundation in host countries to nurture the ability to implement major infrastructure projects; and ensuring sustainability in the long run.
How Should The Road Sector Be Integrated With An Overall Infrastructure Development Strategy?
By providing domestic connectivity and linkages to global connectivity, the road sector represents an important component to overall infrastructure development strategy and is arguably a key contributor in triggering economic growth and poverty reduction. As demonstrated by the experiences in India and China, a balanced development between the arterial and rural roads addresses an important concern associated with a balance between growth and redistribution. It has also been found that road quality and conditions are as important as the length and overall coverage of the roads.
At the beginning of the 1990s, India's road structure was actually more advanced than that of China, but that advantage reversed dramatically in the intervening years, largely due to the limitation in investment. Between 1991 and 2002, China's annual investment in its road network increased from about US$1 billion to around $38 billion; meanwhile, India's annual investment, starting at a similar level in 1991, increased to just $3 billion over the same twelve year period.
China also adopted a different investment allocation philosophy, focusing first on arterial networks to connect its 100 largest cities. China devoted 60% of its investment to new arterial networks, 25% to upgrading existing networks, and 15% to rural roads. India, in contrast, focused mainly on rural roads, adopting the basic goal of stretching a limited budget as widely as possible and creating short-term employment for rural masses. Although the total length of roads is higher in India, the quality of roads is a different story; only 57% roads are paved in India compared to 91% in China. In addition, only 2% of Indian roads have 4 lanes, while the rest are comprised of single-lane (39%) and 2-lane (59%) roads.
Some of India's choices have had serious consequences; whereas China currently boasts an impressive road network infrastructure capable of supporting its continued economic growth into the future, India must now find a way to deal with an under-sized and over-crowded road system that threatens to choke further economic progress. The needs and challenges facing India’s road sector include major capacity and safety enhancements, simpler road finance structures with more emphasis on user fees, greater accountability for road agencies in terms of outputs, development of closer ties between road agencies and stakeholder groups, and opportunities to leverage private finance to a much greater extent. Indian officials are well aware of these challenges and have taken initial steps to address them. Initial results appear promising, but much remains to be done.
28
REFERENCES
1. Acemoglu, Daron, and Simon Johnson, “Unbundling Institutions,” Journal of Political Economy, 113: 949-995, 2005.
2. Akanda, A., ADB Transport Sector Strategy for India – The Roads Subsector, presented at SUMINFRA 2003 Summit on Integrated Infrastructure Development in Southern Region, Chennai, March 20, 2003.
3. Aschauer, David Alan, “Is Public Expenditure Productive?” Journal of Monetary Economics, 23: 177-200, 1989.
4. Ascher, William, "The Ambiguous Nature of Forecasts in Project Evaluation," International Journal of Forecasting, Vol. 9, No. 1, 1993.
5. Ashoka Mody, “Infrastructure Delivery through Central Guidance,” Infrastructure Strategies in East Asia: the Untold Story, 1997.
6. Asian Development Bank, Japan Bank for International Cooperation, and the World Bank, “Connecting East Asia: A New Framework for Infrastructure,” 2005.
7. Asian Development Bank, Key Indicators 2005, Manila 2005. 8. Balisacan, Arsenio M., “Pathways of Poverty Reduction: Rural Development and Transmission
Mechanisms in the Philippines,” paper prepared for the Asia Pacific Forum in Poverty, Manila, Asian Development Bank, Feb. 5-9, 2001.
9. Bansal, A., Bhandari, Bhandari, A., Liu, Z., Thompson, L., and Vickers, P, Executive Summary, in India’s Transport Sector: The Challenges Ahead. The World Bank, May 10, 2002a.
10. Bansal, A., Bhandari, A., Gupta, D. P., & Vickers, P, Chapter 1: Highway, in India’s Transport Sector: The Challenges Ahead, The World Bank, May 10, 2002b.
11. CPCS Transcom Ltd., “Private Public Partnerships in Toll Roads in China,” A paper prepared for the International Workshop on Ushering in a New Era of International Cooperation between Engineering Consulting Industry in Asia and the Pacific Region, Three Gorges, China, October 20-26, 2001.
12. Deichmann, U., M. Fay, J. Koo and S.V. Lall, Economic Structure, Productivity, and Infrastructure Quality in Southern Mexico, World Bank Policy Research Working Paper Series 2900, Washington D.C., 2000.
13. Demurger, S., Differences in Infrastructure Investments: An Explanation for Regional Disparities in China?, presented at CEANA session at ASSA meeting, Boston, January 7-9, 2000.
14. Dollar, David and Aart Kraay, “Trade, Growth and Poverty,” Asia-Pacific Forum on Poverty, Manila, 2001.
15. Easterly, William, and Sergio Rebelo, “Fiscal Policy and Economic Growth: An Empirical Investigation,” Journal of Monetary Economics, 32: 417-458, 1993.
16. Fan, Shenggen, Peter Hazell, and Sukhadeo Throat, “Linkages between Government Spending, Growth and Poverty in Rural India,” Research Report no. 110, International Food Policy Research Institute (IFPRI), Washington, DC, 1999.
17. Fan, Shenggen and C. Chan-Kang, “Road Development, Economic Growth and Poverty Reduction in China,” International Food Policy Research Institute, Research Report 138, Washington, D.C., 2005.
18. Government of India, “The India Infrastructure Report: Policy Imperatives for Growth and Welfare”, New Delhi, 1996
19. Government of India, “Economic Survey”, Various Issues, New Delhi 20. Harral, C. & Sondhi, J., Comparative Evaluation of Highway and Railway Development in
China and India 1992-2002, presented at the 2005 India Infrastructure Summit, New Delhi, March 28-29, 2005.
21. International Road Federation (IRF), “Road Development in India – Realizing a Dream,” World Highways, Washington, DC, June 2003.
29
22. Iyer, Ramaswamy R., A Grammar of Public Enterprises, Jaipur, India (Rawat), 1991. 23. Iyer, Ramaswamy R, WATER: Perspectives, Issues, Concerns, New Delhi, India (Sage), 2003. 24. J. P. Morgan Securities Asia Ltd., Industry Report: China Highway Sector, Hong Kong, 1997. 25. Klitgaard, Robert, “On Infrastructure and Development,” Prepared for the Planning Workshop
for Infrastructure in East Asia: The Way Forward, Manila, January 15-16, 2004. 26. Kwon, Eunkyung, “A Link Between Infrastructure, Growth, and Poverty in Indonesia: Stage 1
Report,” Economics and Development Resource Center, Asian Development Bank, Manila, 2000.
27. Kuroda, Haruhiko, Masahiro Kawai, and Rita Nangia. 2007. Infrastructure and Regional Cooperation. In Annual World Bank Conference on Development Economics 2007, Global: Rethinking Infrastructure for Development, edited by François Bourguignon and Boris Pleskovic. Washington, DC. 2007.
28. Lane, Jan-Erik, New Public Management, London (Routledge), 2000. 29. Levy, Sidney, Build, Operate, Transfer: Paving the Way for Tomorrow’s Infrastructure, New
York, John Wiley & Sons, 1996. 30. Li, P., Zhang, S., Talvitie, A., and Y. Chen, “New Models for Financing and Managing
Highways: Asset-based Road Corporations in China,” Transportation, Vol. 26: 67-86, 1999. 31. Liu, Zhi, “Planning and Policy Coordination in China’s Infrastructure Development: A
Background Paper,” for Connecting East Asia: A New Framework for Infrastructure, 2005. 32. Minten, B., and S. Kyle, “The Effects of Distance and Road Quality on Food Collection,
Marketing Margins, and Traders’ Wages: Evidence from Former Zaire,” Journal of Development Economics, Vol. 60: 467-495, 1999.
33. Mody, Ashoka, Infrastructure Strategies in East Asia: The Untold Story, EDI Development Studies, The World Bank, Washington DC, 1997.
34. Nagaraj, R., A. Varoudakis, and M.A. Veganzones, “Long-run Growth Trends and Convergence Across Indian States,” Journal of International Development, Vol. 12:45-70, 2000.
35. Patel, I.G., “Glimpses of Indian Economic Policy: An Insider’s View,” New Delhi, 2002. 36. Pucher, J. et. al., “Urban Transport Crisis in India,” Transport Policy, 12(3): 185-198, 2005. 37. Rondinelli, Dennis A, Government Decentralization in Comparative Perspective: Theory and
Practice in Developing Countries, International Review of Administrative Sciences, XLVII (2): 133-145, 1981.
38. Rondinelli, Dennis A., “Decentralizing Public Services in Developing Countries: Issues and Opportunities,” Journal of Social, Political and Economic Studies 14(1):77-98, 1989.
39. Shirley, Mary, “Information, Incentives, and Commitment: An Empirical Analysis of Contracts between Government and State Enterprises,” Policy Research Working Paper 1769, World Bank, Development Research Group, Washington, D.C., 1997.
40. Shirley, Mary, “Why Performance Contracts for State-Owned Enterprises Have Not Worked,” Public Policy for the Private Sector Note 150, Washington, DC: World Bank, 1998.
41. Tarschys Daniel, “Time Horizons in Budgeting.” OECD Journal on Budgeting, 2(2): 77-103, 2003.
42. Virmani, Arvind, “Economic Reforms: Policy and Institutions Some Lessons from Indian Reforms,” ICRIER Working Paper No. 121, 2005.
43. Weingast, B (1994), 'The Political Impediments to Economic Reform: Political Risk and Enduring Gridlock', Mimeo, Hoover Institution and Stanford University.
44. World Bank, World Development Report 1994: Infrastructure for Development, New York, Oxford University Press, 1994.
45. World Bank, India’s Transport Sector: The Challenges Ahead, Washington D.C., 2002a. 46. World Bank, World Development Report 2002: Building Institutions for Markets, New York,
Oxford University Press, 2002b.

30
47. World Bank, Dancing with Giants- India, China and Global Economy, Washington DC, 2007a. 48. World Bank, World Development Indicators, 2007b (in CD-Rom).