infrastructure and economic development - world...
TRANSCRIPT
Infrastructure and economic
development
Luis Servén
The World Bank
Lima, July 2015

2
“[T]he sovereign has only three duties to attend to; three
duties of great importance […] Thirdly, the duty of erecting
and maintaining certain public works […] which it can never
be for the interest of any individual, or small number of
individuals, to erect and maintain; because the profit could
never repay the expence to any individual or small number
of individuals, though it may frequently do much more than
repay it to a great society.”
Adam Smith, Wealth of Nations, Book IV.
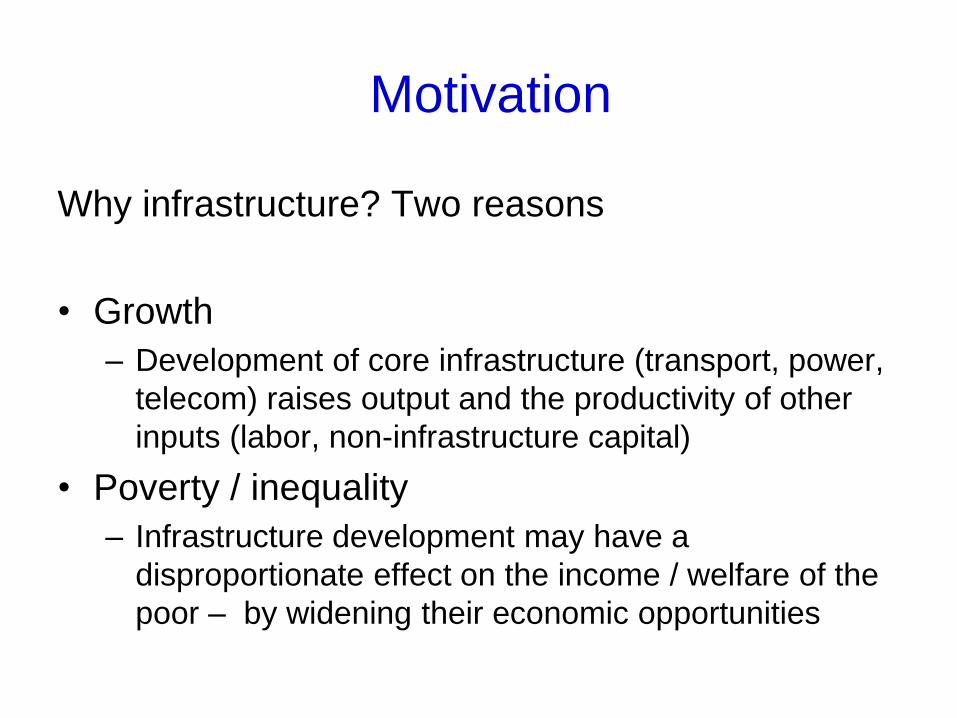
Why infrastructure? Two reasons
• Growth
– Development of core infrastructure (transport, power,
telecom) raises output and the productivity of other
inputs (labor, non-infrastructure capital)
• Poverty / inequality
– Infrastructure development may have a
disproportionate effect on the income / welfare of the
poor – by widening their economic opportunities
Motivation

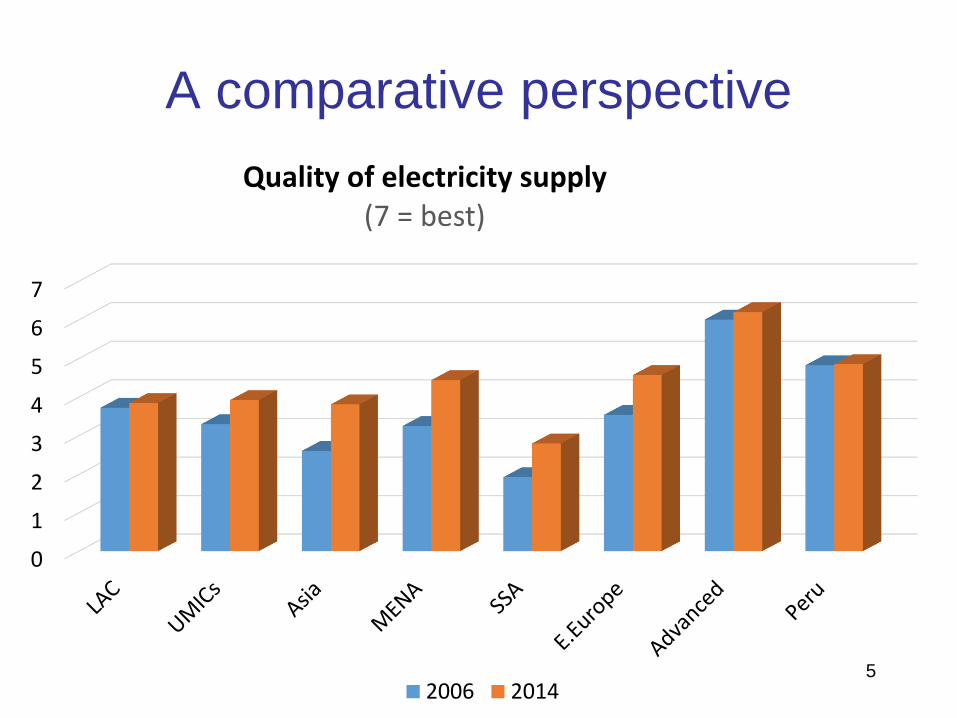
A comparative perspective
4
0
1
2
3
4
5
6
Overall infrastructure quality(7 = best)
2006 2014
A comparative perspective
5
0
1
2
3
4
5
6
7
Quality of electricity supply(7 = best)
2006 2014

A comparative perspective
6
0
1
2
3
4
5
6
Road quality(7 = best)
2006 2014
7
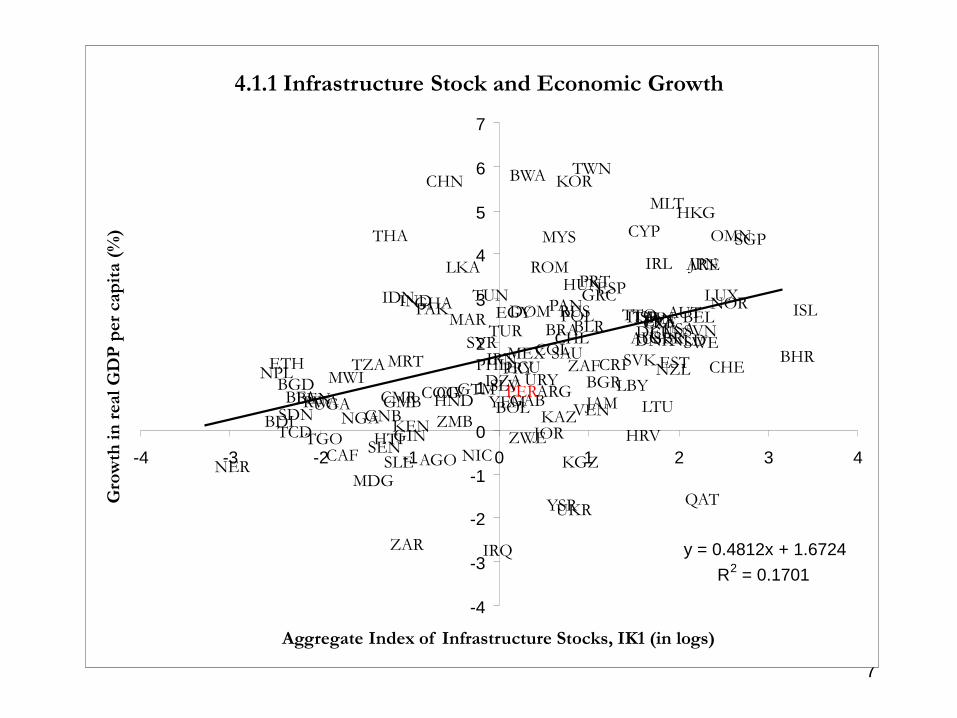
4.1.1 Infrastructure Stock and Economic Growth
AGO
ARE
ARG
AUS
AUT
BDI
BEL
BENBFABGD BGR
BHR
BLR
BOL
BRA
BWA
CAF
CAN
CHE
CHL
CHN
CIVCMR COG
COLCRI
CYP
CZEDEUDNK
DOM
DZAECU
EGY
ESP
ESTETH
FINFRA
GAB
GBR
GHA
GIN
GMBGNB
GRC
GTM
HKG
HND
HRVHTI
HUNIDNIND
IRL
IRN
IRQ
ISLISRITA
JAM
JOR
JPN
KAZKEN
KGZ
KOR
LBY
LKA
LTU
LUX
LVAMAR
MDG
MEX
MLT
MRTMWI
MYS
NER
NGA
NIC
NLD
NOR
NPL NZL
OMN
PAK PAN
PER
PHL
POL
PRT
PRY
QAT
ROM
RUS
RWA
SAU
SDN
SEN
SGP
SLE
SLV
SVK
SVNSWESYR
TCDTGO
THA
TTOTUN
TUR
TWN
TZA
UGA
UKR
URY
USA
VENYEM
YSR
ZAF
ZAR
ZMBZWE
y = 0.4812x + 1.6724
R2
= 0.1701
-4
-3
-2
-1
0
1
2
3
4
5
6
7
-4 -3 -2 -1 0 1 2 3 4
Aggregate Index of Infrastructure Stocks, IK1 (in logs)
Gro
wth
in
real
GD
P p
er
cap
ita (
%)

8
4.1.2 Infrastructure Quality and Economic Growth
ZWEZMB
ZAR
ZAF
YSR
YEM VEN
USA
URY
UKR
UGA
TZA
TWN
TUR
TUNTTO
THA
TGOTCD
SYR SWESVN
SVK
SLV
SLE
SGP
SEN
SDN
SAU
RWA
RUS
ROM
QAT
PRY
PRT
POL
PHL
PER
PANPAK
OMN
NZLNPL
NOR
NLD
NIC
NGA
NER
MYS
MWIMRT
MLT
MEX
MDG
MARLVA
LUX
LTU
LKA
LBY
KOR
KGZ
KENKAZ
JPN
JOR
JAM
ITAISRISL
IRQ
IRN
IRL
IND IDNHUN
HTI HRV
HND
HKG
GTM
GRC
GNBGMB
GIN
GHA
GBR
GAB
FRAFIN
ETHEST
ESP
EGY
ECUDZA
DOM
DNKDEU
CZE
CYP
CRICOL
COG CMRCIV
CHN
CHL
CHE
CAN
CAF
BWA
BRA
BOL
BLR
BHR
BGRBGDBFA BEN
BEL
BDI
AUT
AUS
ARG
ARE
AGO
y = 0.6312x + 1.8891
R2 = 0.2054
-4
-3
-2
-1
0
1
2
3
4
5
6
7
-4 -3 -2 -1 0 1 2 3
Aggregate Index of Infrastructure Quality, IQ (in logs)
Gro
wth
in
real
GD
P p
er
cap
ita (
%)
Not only the quantity -- the quality of infrastructure also matters
9
ARG
AUS
AUTBEL
BFA
BGD
BGR
BOL
BRA
BWA
CANCHE
CHL
CHN
CIV
COL
CRI
CYP
DEUDNK
DOM
ECU
EGY
ESP
ETH
FIN
FRA
GBR
GHA GRC
GTM
HKG
HND
HUN
IDN IND
IRL
IRN
ISR
ITA
JAM
JOR
JPN
KEN
KOR
LKAMAR
MDG
MEX
MUS
MYSNGA
NLD
NORNZL
PAK
PAN
PERPHL
PNG
POL
PRT
PRY
ROM
RWA
SEN
SGP
SLV
SWE
THA TTO
TUN
TUR
TWN
TZA
UGA
URY
USA
VEN
YSR
ZAF
ZMB
ZWE
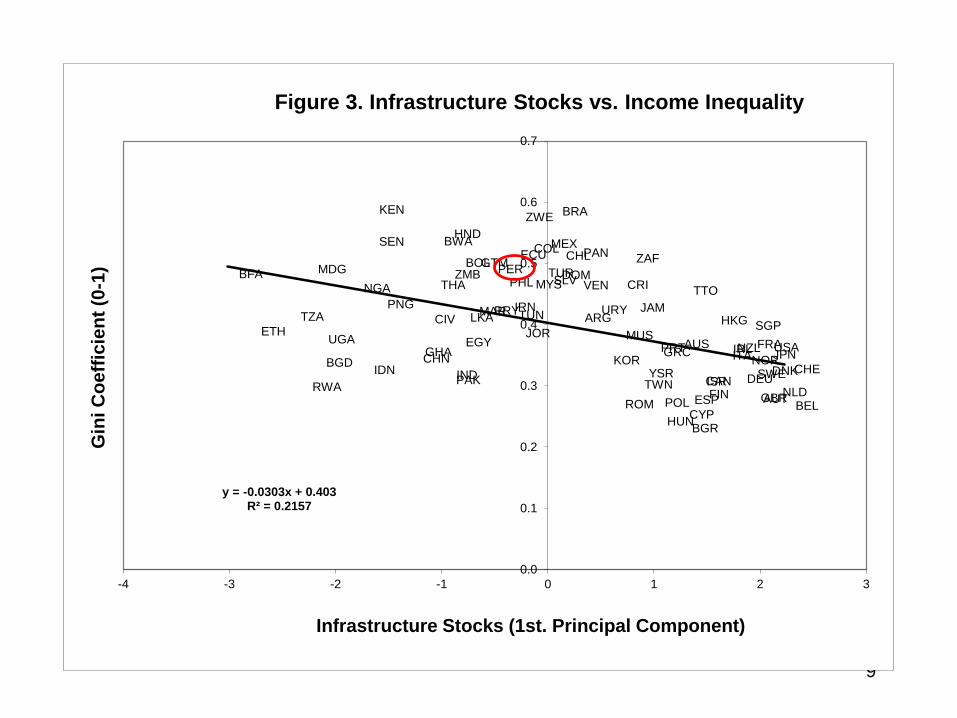
y = -0.0303x + 0.403R² = 0.2157
0.0
0.1
0.2
0.3
0.4
0.5
0.6
0.7
-4 -3 -2 -1 0 1 2 3
Gin
i C
oe
ffic
ien
t (0
-1)
Infrastructure Stocks (1st. Principal Component)
Figure 3. Infrastructure Stocks vs. Income Inequality
10
ARG
AUS
AUTBEL
BFA
BGD
BGR
BHS
BOL
BRA
BWA
CANCHE
CHL
CHN
CIV
COL
CRI
CYP
DEUDNK
DOM
ECU
EGY
ESP
ETH
FIN
FRA
GBR
GHA GRC
GTM
HKG
HND
HUN
IDNIND
IRL
IRN
ISR
ITA
JAM
JOR
JPN
KEN
KOR
LKA MAR
MDG
MEX
MUS
MYSNGA
NLD
NORNZL
PAK
PAN
PERPHL
PNG
POL
PRT
PRY
ROM
RWA
SEN
SGP
SLV
SWE
THA TTO
TUN
TUR
TWN
TZA
UGA
URY
USA
VEN
YSR
ZAF
ZMB
ZWE
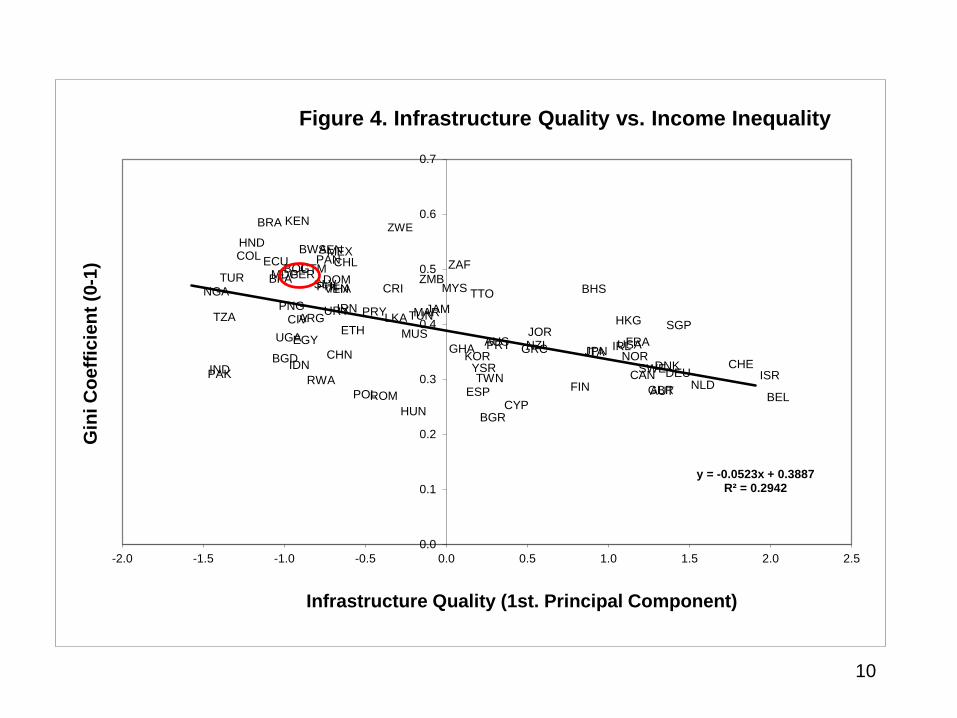
y = -0.0523x + 0.3887R² = 0.2942
0.0
0.1
0.2
0.3
0.4
0.5
0.6
0.7
-2.0 -1.5 -1.0 -0.5 0.0 0.5 1.0 1.5 2.0 2.5
Gin
i C
oe
ffic
ien
t (0
-1)
Infrastructure Quality (1st. Principal Component)
Figure 4. Infrastructure Quality vs. Income Inequality
11
How does infrastructure affect growth?
• As another productive input – just like labor or non-
infrastructure capital
– Direct + indirect effect if inputs are gross complements (from
Arrow and Kurz 1970)
• By reducing the cost of accumulating other inputs
– E.g., lower the cost of installing new capital (Turnovsky 1996) or
accessing education
• Through spillover effects on TFP
– More efficient organization of production (Duggal et al 1999)
– Lowering the cost of innovation and technological upgrading
(Bougheas et al 2000, Agenor 2013)
Infrastructure and growth
How big is the impact of infrastructure on growth?
• Big literature after finding of huge effects in the US
(Aschauer 1989)
• Reverse causality a big problem – demand for
infrastructure services typically rises with income growth
– Can lead to overstated growth effects of infrastructure supply
– Identifying information needed to separate demand and supply
effects (internal / external instruments; full structural models)
• Infrastructure measurement also an issue
– Physical assets vs investment flows (or their accumulation)
– Multidimensionality of core infrastructure – transport, power,
telecom…Synthetic índices of physical assets as an alternative
12
Infrastructure and growth
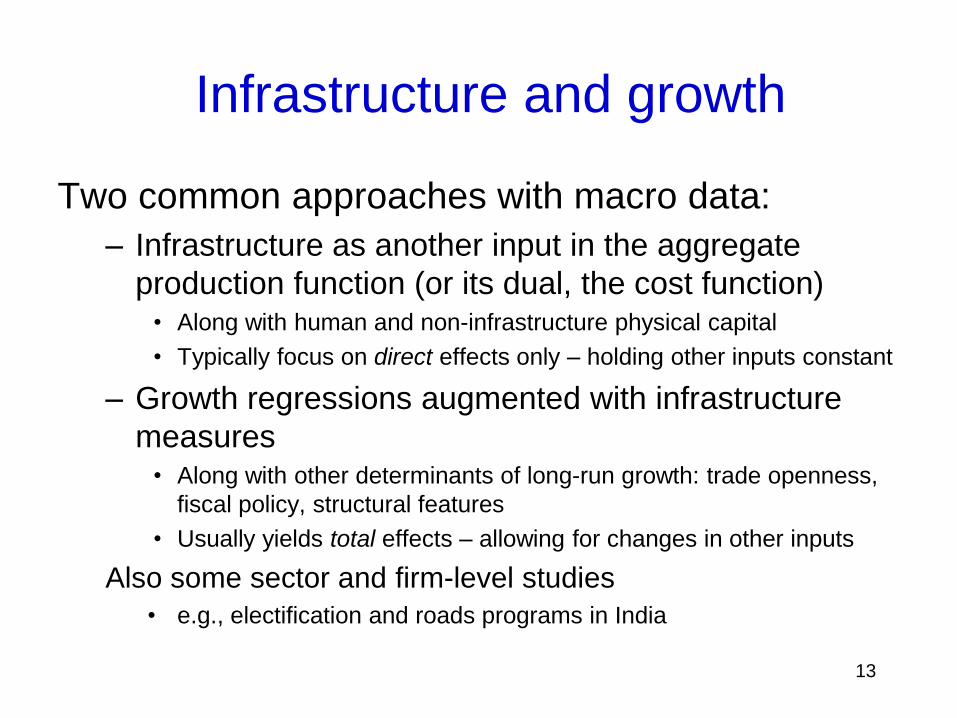
Two common approaches with macro data:
– Infrastructure as another input in the aggregate
production function (or its dual, the cost function)• Along with human and non-infrastructure physical capital
• Typically focus on direct effects only – holding other inputs constant
– Growth regressions augmented with infrastructure
measures• Along with other determinants of long-run growth: trade openness,
fiscal policy, structural features
• Usually yields total effects – allowing for changes in other inputs
Also some sector and firm-level studies
• e.g., electification and roads programs in India
13
Infrastructure and growth
Infrastructure and growth
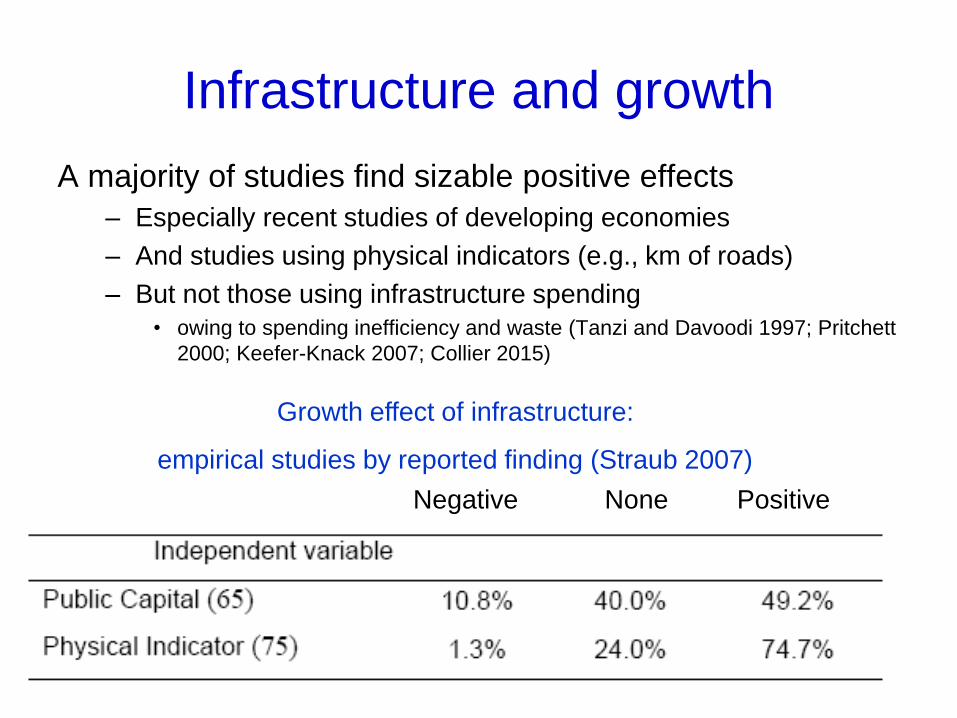
A majority of studies find sizable positive effects
– Especially recent studies of developing economies
– And studies using physical indicators (e.g., km of roads)
– But not those using infrastructure spending
• owing to spending inefficiency and waste (Tanzi and Davoodi 1997; Pritchett
2000; Keefer-Knack 2007; Collier 2015)
14
Growth effect of infrastructure:
empirical studies by reported finding (Straub 2007)
Negative None Positive
15
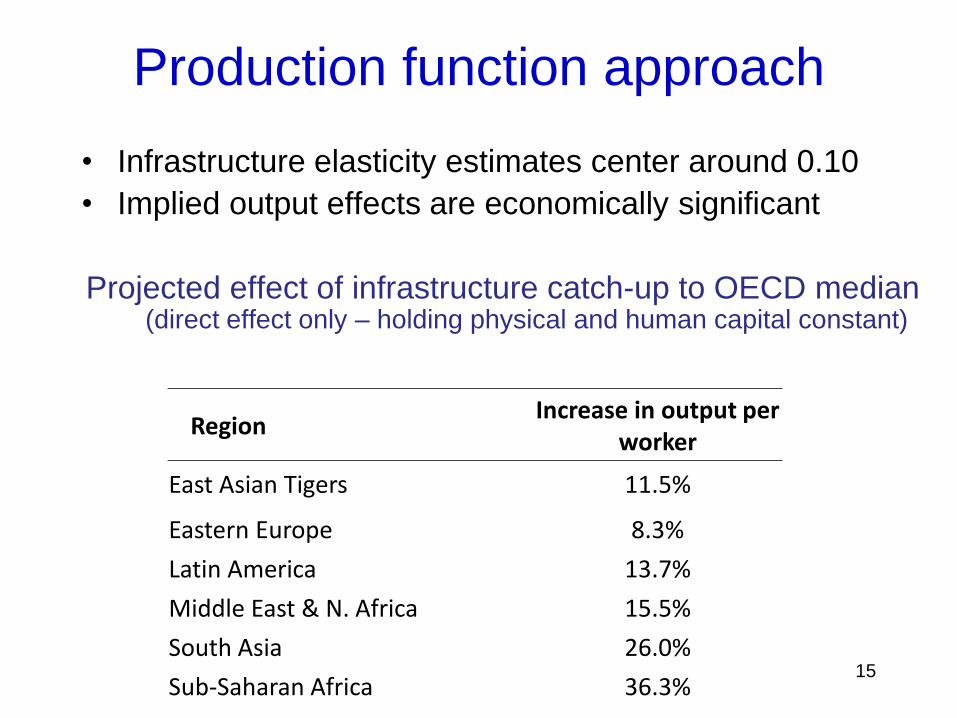
• Infrastructure elasticity estimates center around 0.10
• Implied output effects are economically significant
Projected effect of infrastructure catch-up to OECD median (direct effect only – holding physical and human capital constant)
RegionIncrease in output per
worker
East Asian Tigers 11.5%
Eastern Europe 8.3%
Latin America 13.7%
Middle East & N. Africa 15.5%
South Asia 26.0%
Sub-Saharan Africa 36.3%
Production function approach
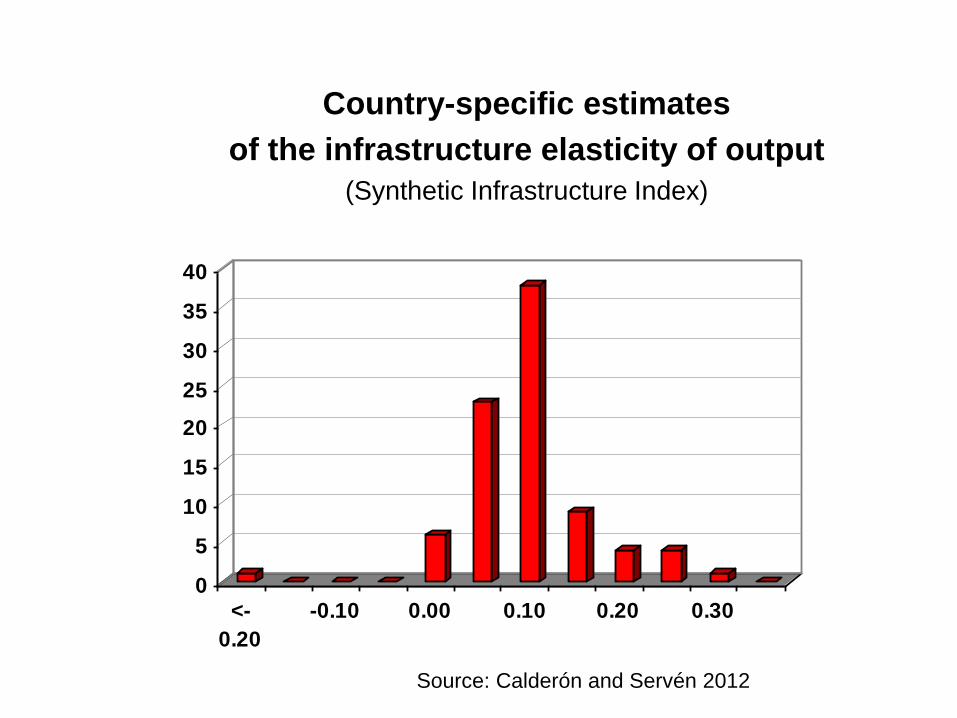
Country-specific estimates
of the infrastructure elasticity of output
(Synthetic Infrastructure Index)
0
5
10
15
20
25
30
35
40
<-
0.20
-0.10 0.00 0.10 0.20 0.30
Source: Calderón and Servén 2012
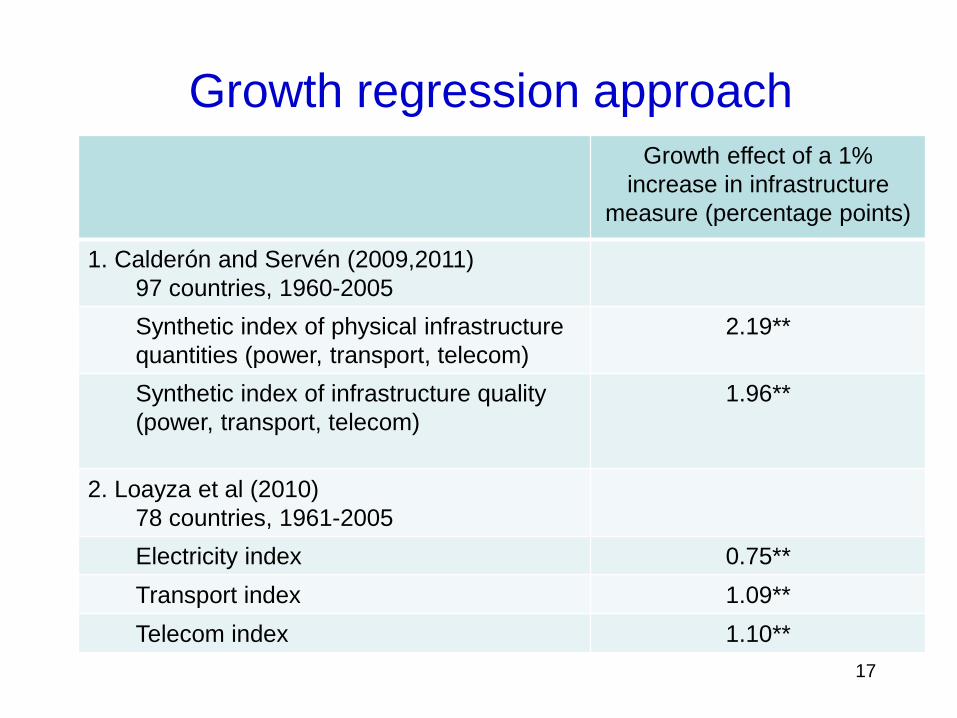
17
Growth effect of a 1%
increase in infrastructure
measure (percentage points)
1. Calderón and Servén (2009,2011)
97 countries, 1960-2005
Synthetic index of physical infrastructure
quantities (power, transport, telecom)
2.19**
Synthetic index of infrastructure quality
(power, transport, telecom)
1.96**
2. Loayza et al (2010)
78 countries, 1961-2005
Electricity index 0.75**
Transport index 1.09**
Telecom index 1.10**
Growth regression approach
18
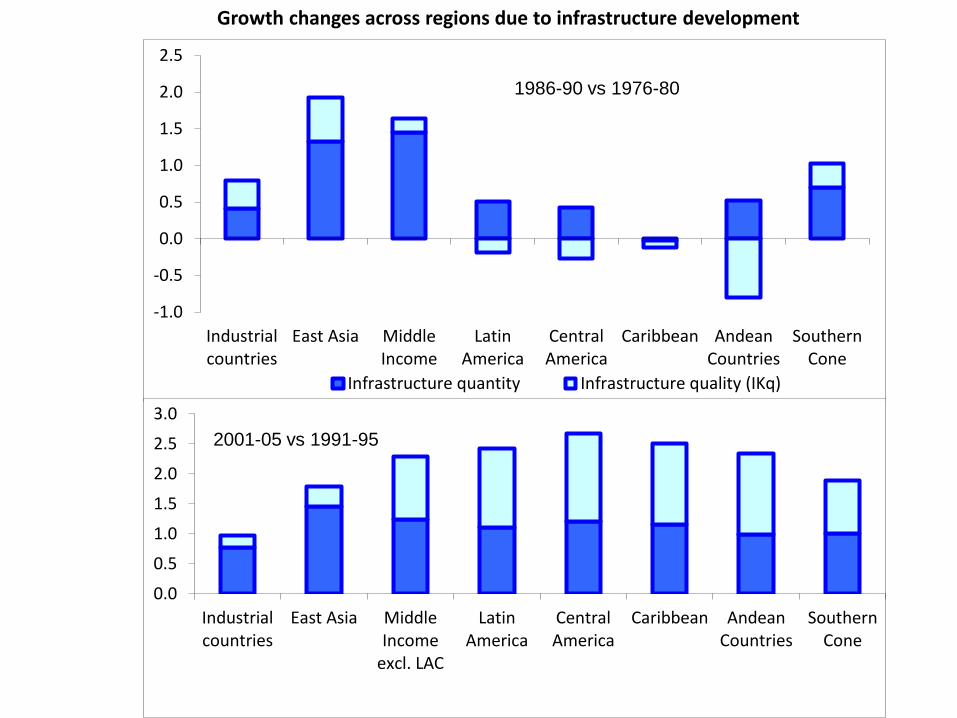
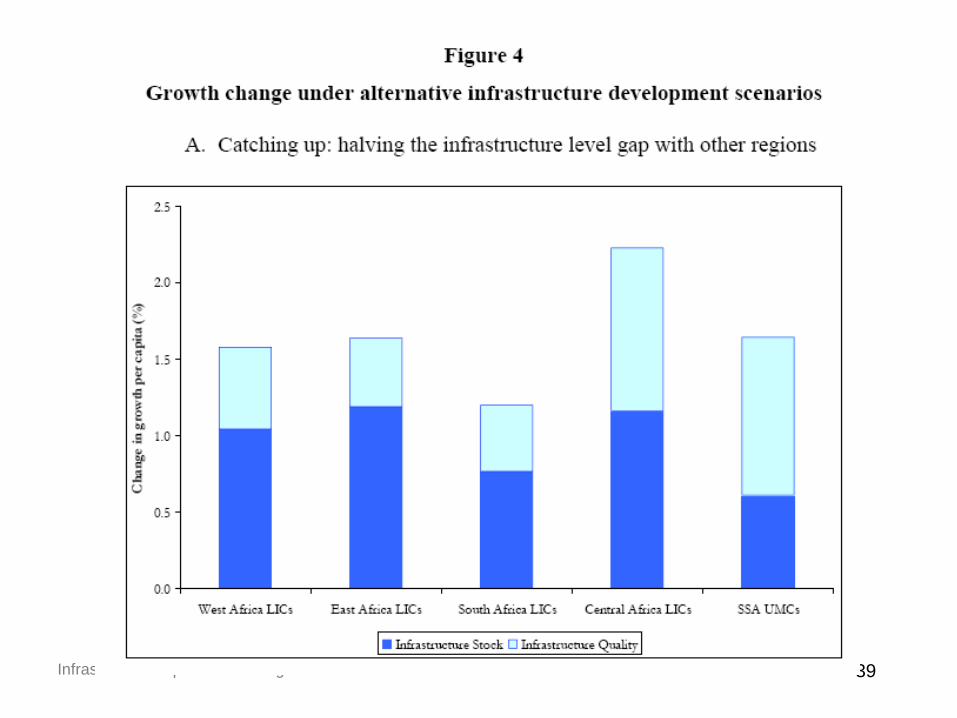
-1.0
-0.5
0.0
0.5
1.0
1.5
2.0
2.5
Industrialcountries
East Asia MiddleIncome
excl. LAC
LatinAmerica
CentralAmerica
Caribbean AndeanCountries
SouthernCone
Infrastructure quantity Infrastructure quality (IKq)
1986-90 vs 1976-80
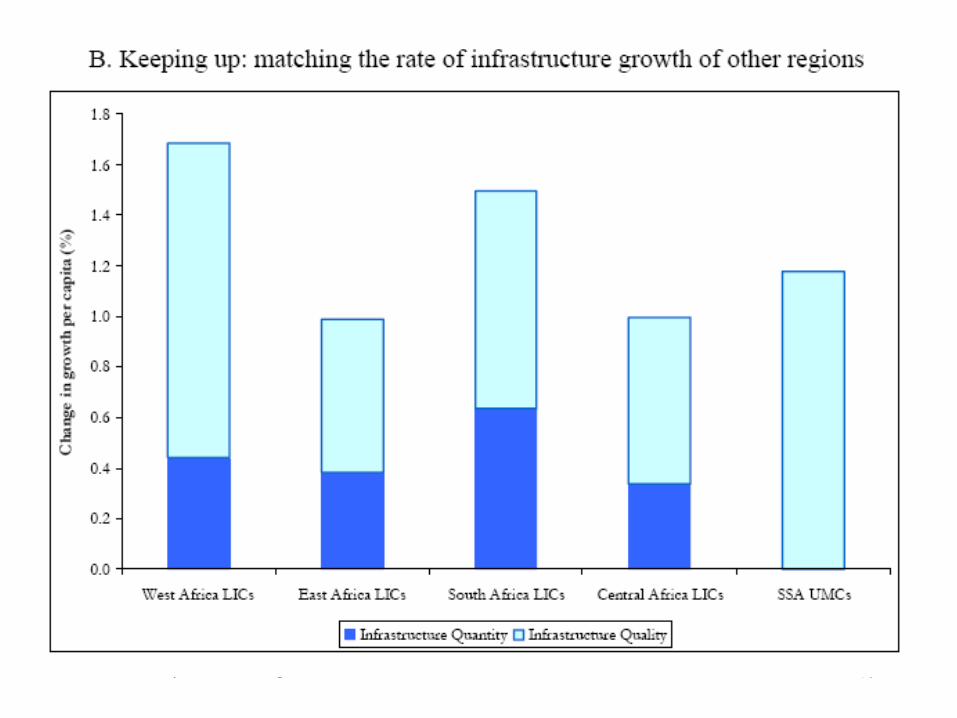
0.0
0.5
1.0
1.5
2.0
2.5
3.0
Industrialcountries
East Asia MiddleIncome
excl. LAC
LatinAmerica
CentralAmerica
Caribbean AndeanCountries
SouthernCone
2001-05 vs 1991-95
Growth changes across regions due to infrastructure development
• Improved access to infrastructure may have an especially large effect on the income of the poor– Basic setting: financial market imperfections that keep
the poor from adopting efficiency-enhancing projects
– Infrastructure development then helps by• Reducing the cost to access output and input markets (e.g.,
agricultural products; labor)
• Helping entrepreneurship among those who can’t afford private substitutes for public infrastructure services
• Facilitating human capital accumulation directly (water, sanitation effect on health) or indirectly (transport to school and health facilities)
Infrastructure and inequality
…but the result need not be invariably pro-poor– E.g., infrastructure development may disproportionately benefit
sectors intensive in high-skill labor (the case of ICT?)
– The form of infrastructure financing also matters
So what does the evidence say?– Country-level studies with macroeconomic data
• Relating infrastructure quantity and / or access to measures of income distribution (so reverse causality again an issue)
• Tend to find pro-poor effects
– Studies of the effect of specific infrastructure projects on the income of the poor
• E.g., rural roads (Peru, Vietnam, Bangladesh); irrigation (India) and electrification programs (South Africa)…
Infrastructure and inequality
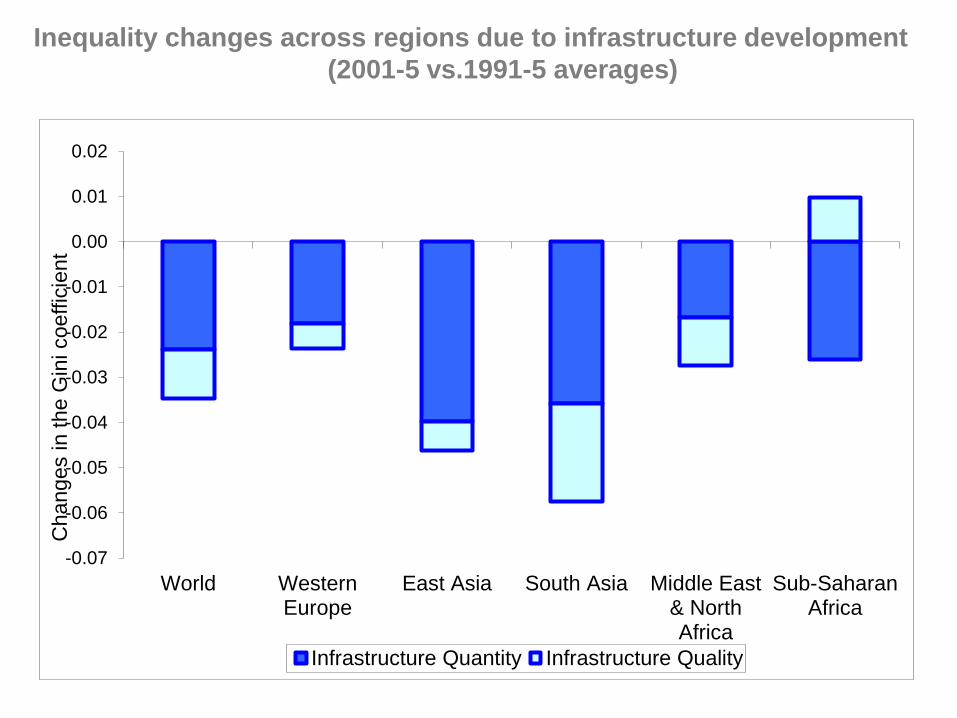
Inequality changes across regions due to infrastructure development
(2001-5 vs.1991-5 averages)
-0.07
-0.06
-0.05
-0.04
-0.03
-0.02
-0.01
0.00
0.01
0.02
World WesternEurope
East Asia South Asia Middle East& NorthAfrica
Sub-SaharanAfrica
Changes in the G
ini coeffic
ient
Infrastructure Quantity Infrastructure Quality
22
For policy-making, the key question is: how much should
be spent on infrastructure?
– Cost-benefit calculation: infrastructure spending crowds out
other inputs – through higher taxes, wages, interest rates (or
credit scarcity) – dampening the growth effect
The ‘Barro rule’: growth-maximizing spending as % of GDP
equals the infrastructure elasticity of output ( = 10%)
– This holds exactly only in a very stylized theoretical setting
– However, the growth-maximizing level of spending exceeds its
welfare-maximizing level: infrastructure takes time-to-build, and
thus involves an additional consumption sacrifice.
The cost of infrastructure
23
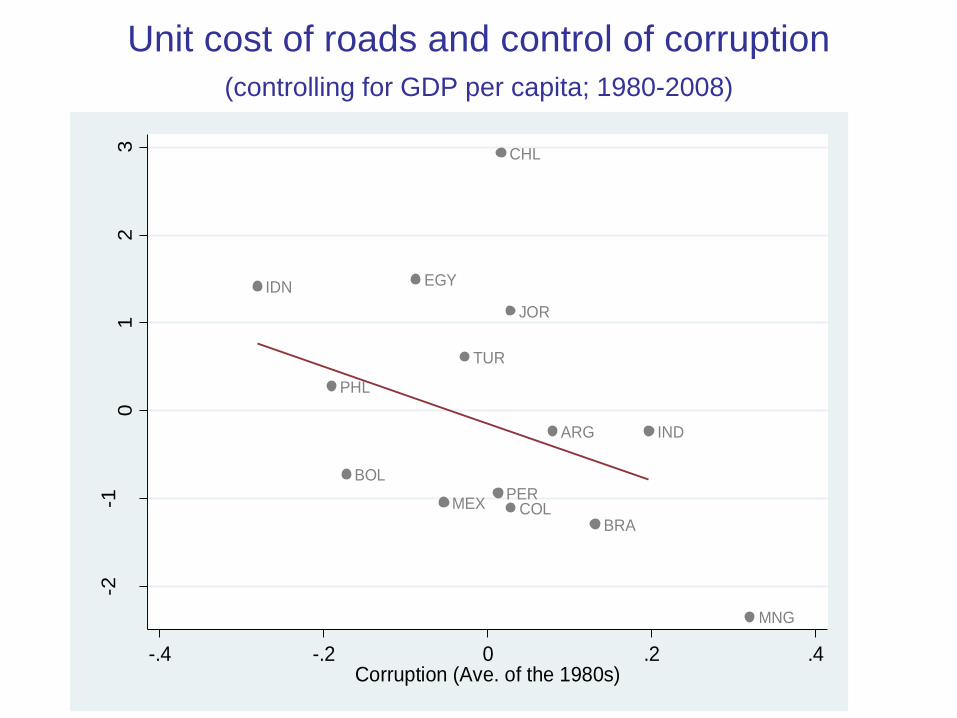
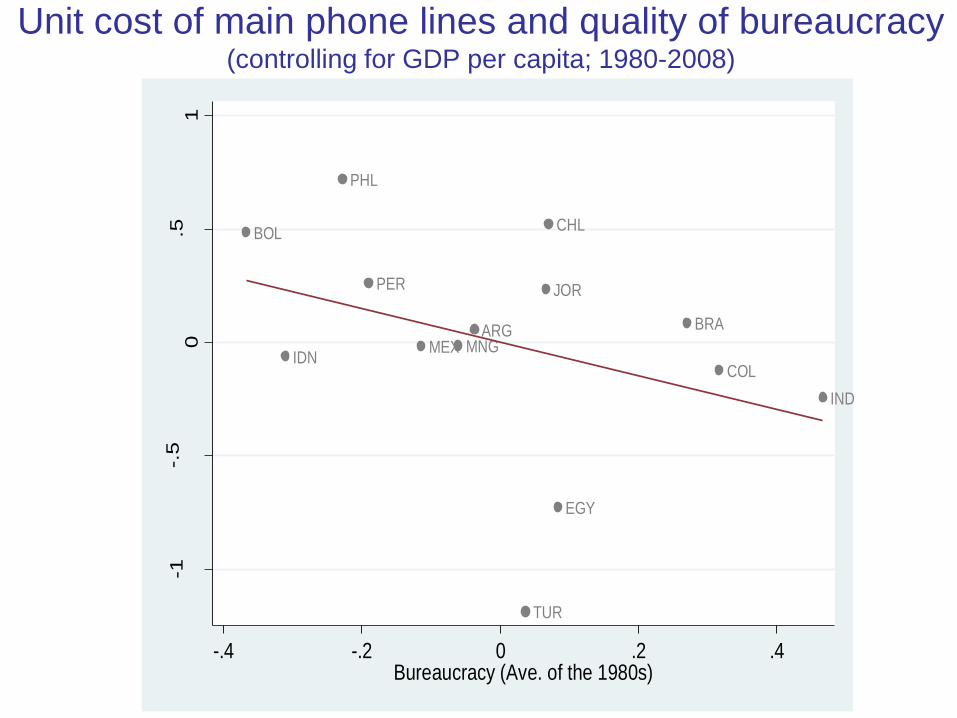
In reality the growth effects of infrastructure spending
depend on its efficiency – i.e., how it translates into assets.
Spending efficiency shows large cross-country variation:
• In part, due to technical and physical factors
• But also reflecting institutional features
– Technical capacity – project selection, implementation,
evaluation
– Governance conditions: budgetary and procurement practices,
fiscal institutions, control of corruption
• Weak governance raises reported ‘public investment’ – in reality,
the cost of acquiring assets, not their quantity or quality
• And encourages investment over O&M: bigger room for
corruption, political favors and photo-ops.
The cost of infrastructure
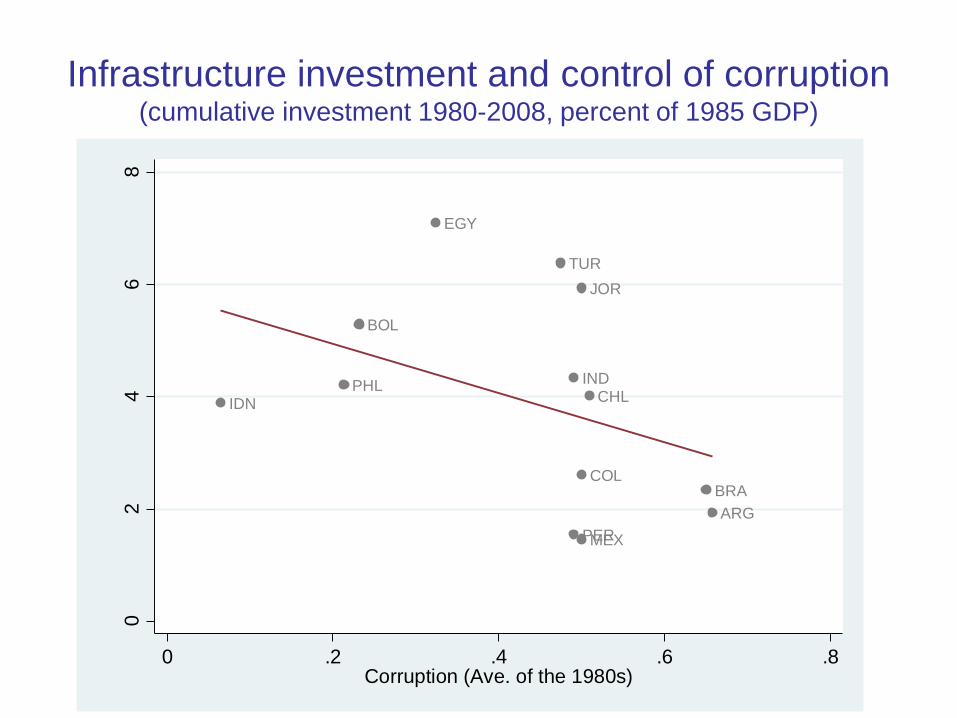
Infrastructure investment and control of corruption(cumulative investment 1980-2008, percent of 1985 GDP)
IDNPHL
BOL
EGY
TUR
PER
IND
JOR
COL
MEX
CHL
BRA
ARG
02
46
8
Cum
ula
tive in
ve
stm
ent (%
if G
DP
) ('85
-)
0 .2 .4 .6 .8Corruption (Ave. of the 1980s)
IDN
PHL
BOL
EGY
MEX
TUR
PER
CHL
JOR
COL
ARG
BRA
IND
MNG
-2-1
01
23
Unit c
osts
for
roa
ds (
'85-)
-.4 -.2 0 .2 .4Corruption (Ave. of the 1980s)
Unit cost of roads and control of corruption
(controlling for GDP per capita; 1980-2008)
BOL
IDN
PHL
PER
MEX MNGARG
TUR
JOR
CHL
EGY
BRA
COL
IND
-1-.
50
.51
Unit c
osts
for
ml ('8
5-)
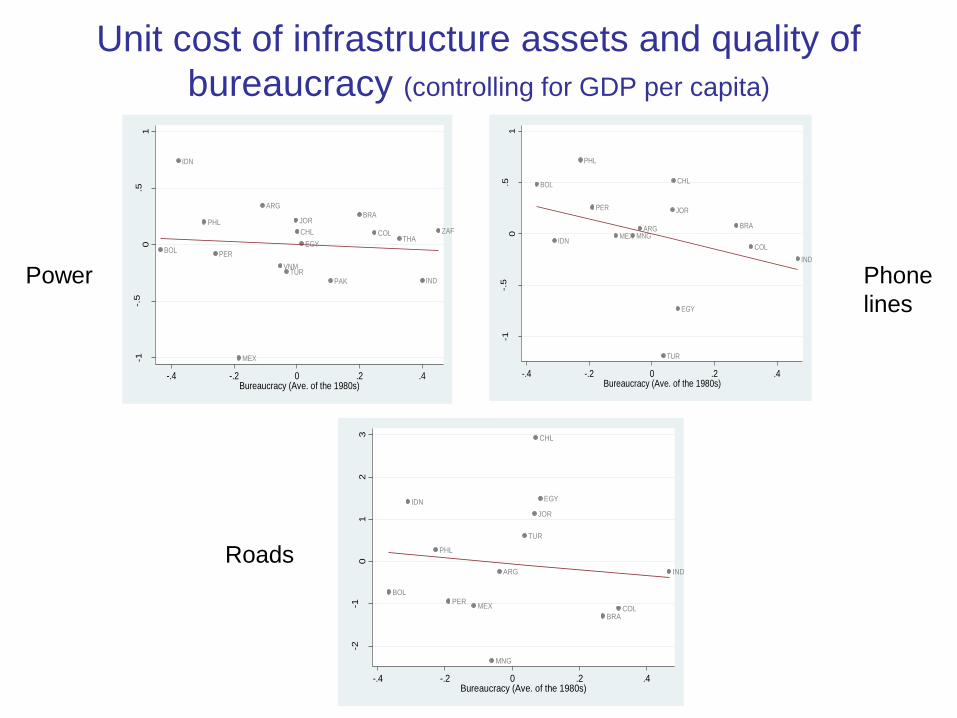
-.4 -.2 0 .2 .4Bureaucracy (Ave. of the 1980s)
Unit cost of main phone lines and quality of bureaucracy(controlling for GDP per capita; 1980-2008)
27
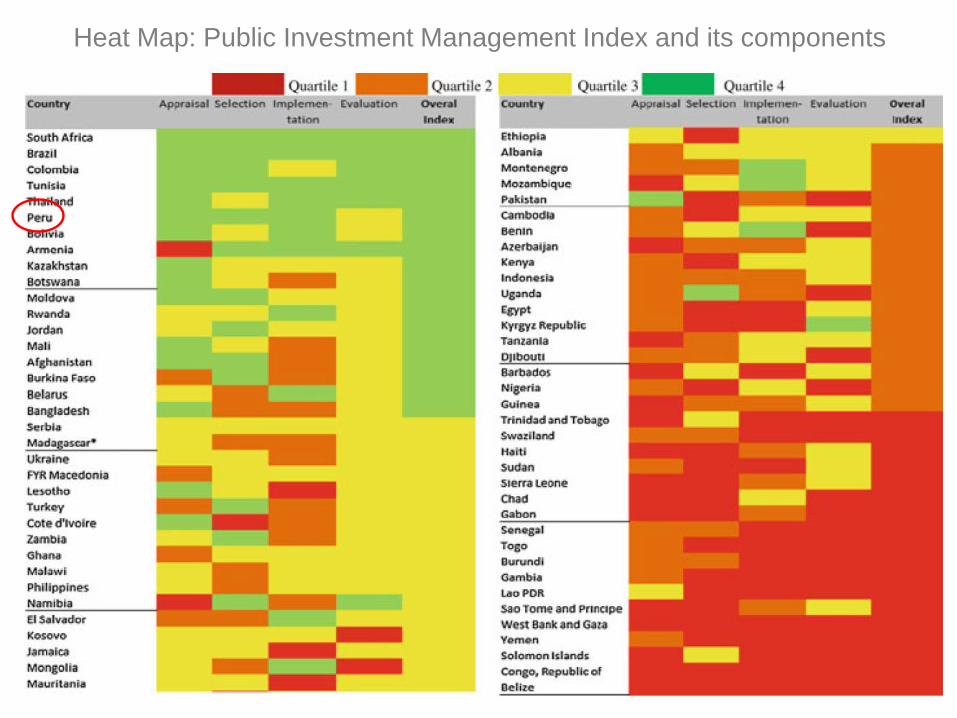
How does the efficiency of public infrastructure investment
vary across countries?
• ‘Public Investment Management Index’: summary of
four components related to different project stages:
– Appraisal
– Selection
– Implementation
– Evaluation
• Strongly correlated with overall institutional quality
The cost of infrastructure
28
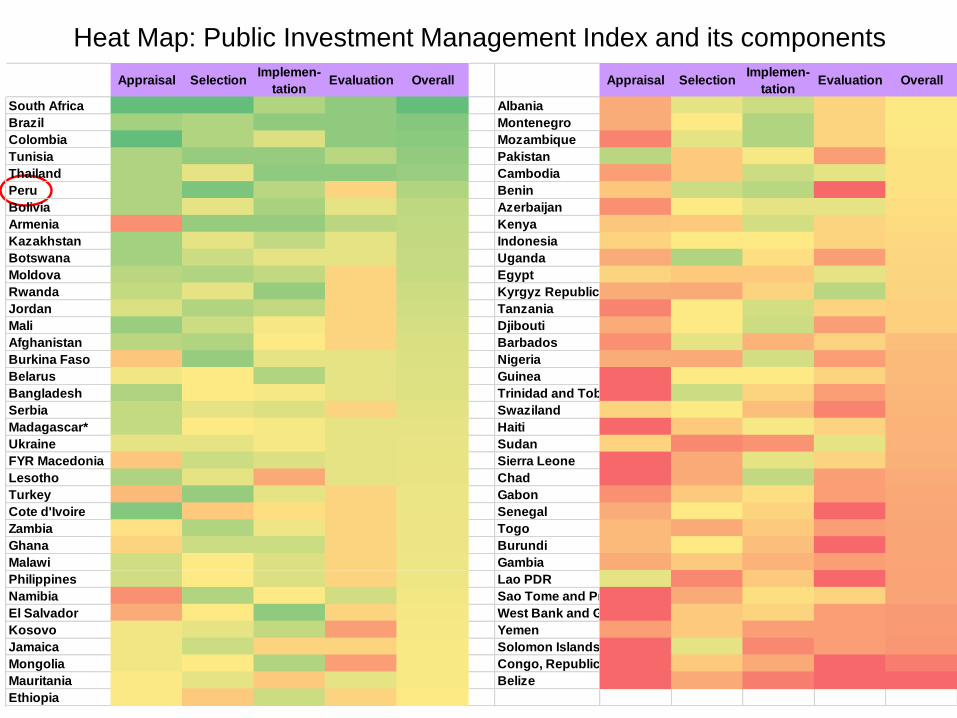
Heat Map: Public Investment Management Index and its components
Appraisal SelectionImplemen-
tationEvaluation Overall Appraisal Selection
Implemen-
tationEvaluation Overall
South Africa Albania
Brazil Montenegro
Colombia Mozambique
Tunisia Pakistan
Thailand Cambodia
Peru Benin
Bolivia Azerbaijan
Armenia Kenya
Kazakhstan Indonesia
Botswana Uganda
Moldova Egypt
Rwanda Kyrgyz Republic
Jordan Tanzania
Mali Djibouti
Afghanistan Barbados
Burkina Faso Nigeria
Belarus Guinea
Bangladesh Trinidad and Tobago
Serbia Swaziland
Madagascar* Haiti
Ukraine Sudan
FYR Macedonia Sierra Leone
Lesotho Chad
Turkey Gabon
Cote d'Ivoire Senegal
Zambia Togo
Ghana Burundi
Malawi Gambia
Philippines Lao PDR
Namibia Sao Tome and Principe
El Salvador West Bank and Gaza
Kosovo Yemen
Jamaica Solomon Islands
Mongolia Congo, Republic of
Mauritania Belize
Ethiopia
29
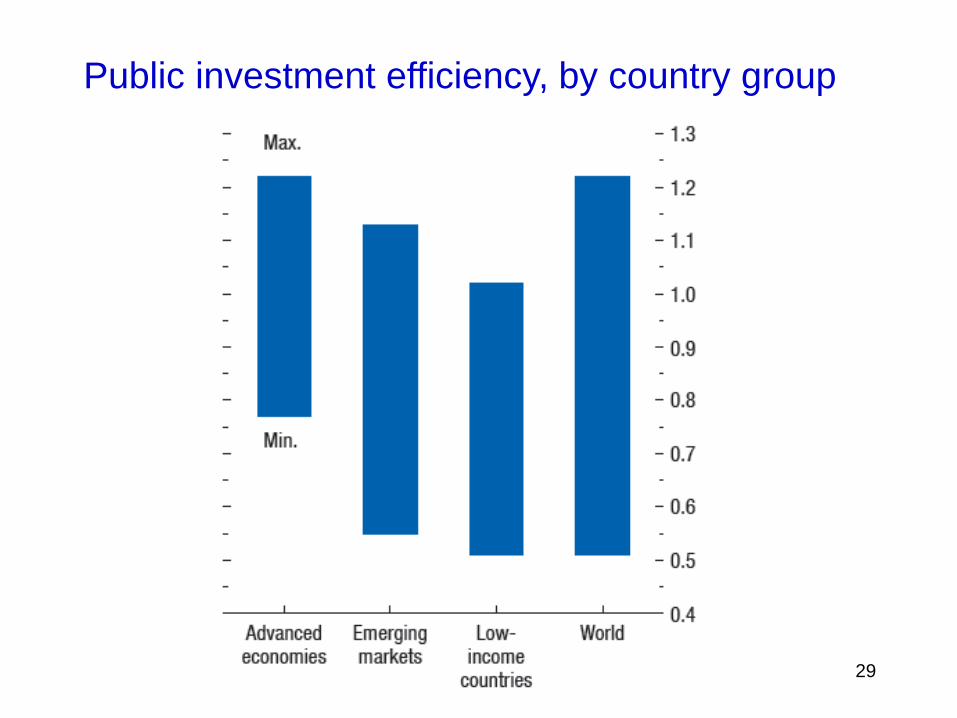
Public investment efficiency, by country group
30
• The efficiency of infrastructure spending is key to its
impact on growth and public finances
– The higher efficiency, the larger the impact of a given amount
of spending on income growth
– And, given the government’s ability to collect taxes (or user
fees), the more favorable the effect on future public revenues
and the government’s solvency position.
The cost of infrastructure
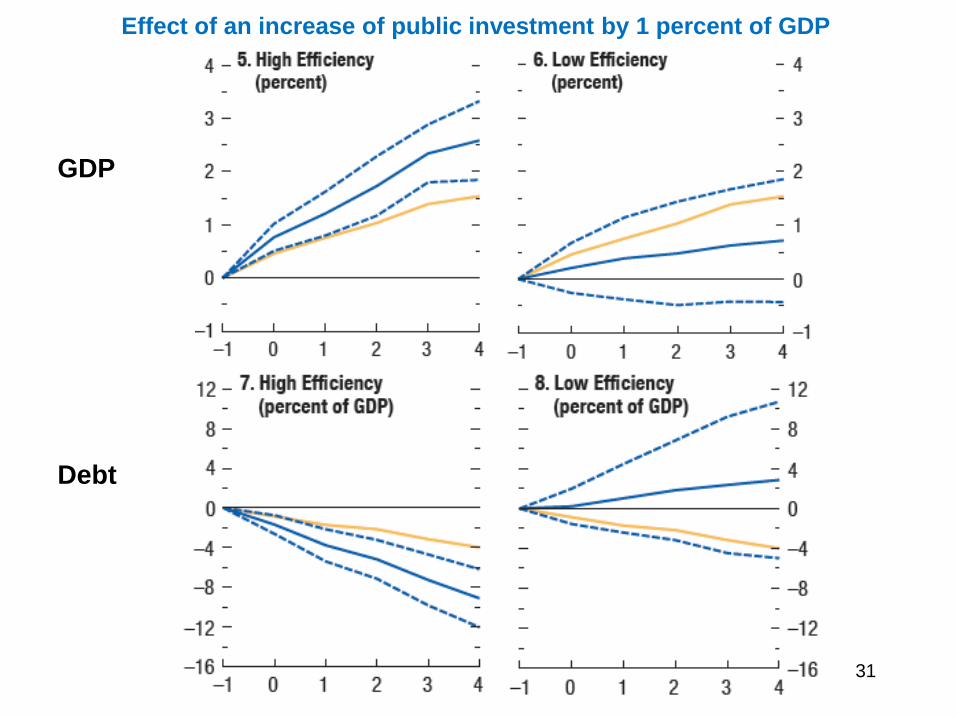
GDP
Debt
31
Effect of an increase of public investment by 1 percent of GDP
32
• There is good evidence that infrastructure developmentmakes a significant contribution to growth– Although the effect is much smaller than found in early literature
– And the relative role of the various channels at work is less clear
• Also suggestive evidence of a positive impact on equity via enhanced economic opportunities for the poor – Hence potential scope for a double poverty-reducing effect
• The growth effect of infrastructure spending is largely shaped by fiscal institutions and overall governance– Low government capacity and weak governance inflate asset
costs, discourage O&M, and reduce the efficiency of spending.
– In many countries, reforms to increase the efficiency of spending should take higher priority than more spending
Conclusions

End

Additional slides
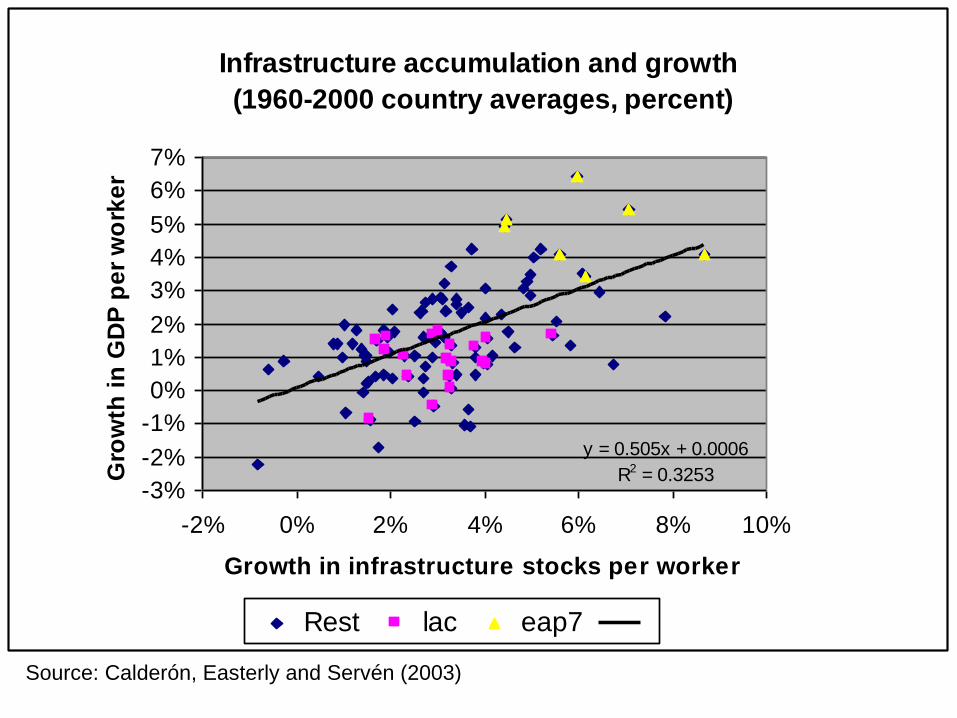
Infrastructure accumulation and growth
(1960-2000 country averages, percent)
y = 0.505x + 0.0006
R2 = 0.3253-3%
-2%
-1%
0%
1%
2%
3%
4%
5%
6%
7%
-2% 0% 2% 4% 6% 8% 10%
Growth in infrastructure stocks per worker
Gro
wth
in
GD
P p
er
wo
rke
r
Rest lac eap7
Source: Calderón, Easterly and Servén (2003)
36
Calderón-Servén 2009: empirical growth frameworkaugmented with physical measures of infrastructure
Synthetic index of telecom, transport and power
Also (noisy!) measures of quality of assets
Large panel dataset
Results:
– Infrastructure quantity and quality have robust growth effect –and economically significant.
– Not much evidence of heterogeneity (in log-log terms)
• Across developing regions
• Landlocked vs other countries
• Related to infrastructure endowment (i.e., non-linearities)
Hence the marginal contribution of infrastructure development to growth is higher wherever quantity / quality are lower.
Infrastructure and growth
37
Calderón, Moral and Servén (2010): production function
approach -- physical and human capital; infrastructure
• Focus on the contribution of infrastructure to labor productivity
(GDP per worker)
• synthetic infrastructure index (as before)
• 88 industrial and developing countries,1960-2000 (> 3,500 obs)
• Closer look at heterogeneity of infrastructure contribution – both
generic and along specific dimensions
– Empirical framework allows intercepts, error variances and short-run
dynamics to differ freely across countries.
– Imposes (testable) cross-country homogeneity of long-run
coefficients.
Infrastructure and growth
38
Main results• Infrastructure elasticity in range .07 to .10 – and robust.
• Elasticities of other inputs (physical and human capital) in line with literature (around 0.35, 0.10 respectively)
• No evidence of (general) cross-country parameter heterogeneity
– Accords with cross-country stability of factor shares (Gollin 2002)
• But country-specific estimates are noisy (especially in LICs), so tests may have low power. Test for specific forms of heterogeneity
– By income level: infrastructure elasticity could differ in rich and poor countries
– By level of infrastructure endowment: nonlinear effects of infrastructure (network effects?)
– By population size: economies of scale / congestion effects.
– By quality of policy framework: high / low distortions
Only this test comes close to 10% significance
Infrastructure and growth
Infrastructure capital -- Brookings 2010 39
Infrastructure capital -- Brookings 2010 40
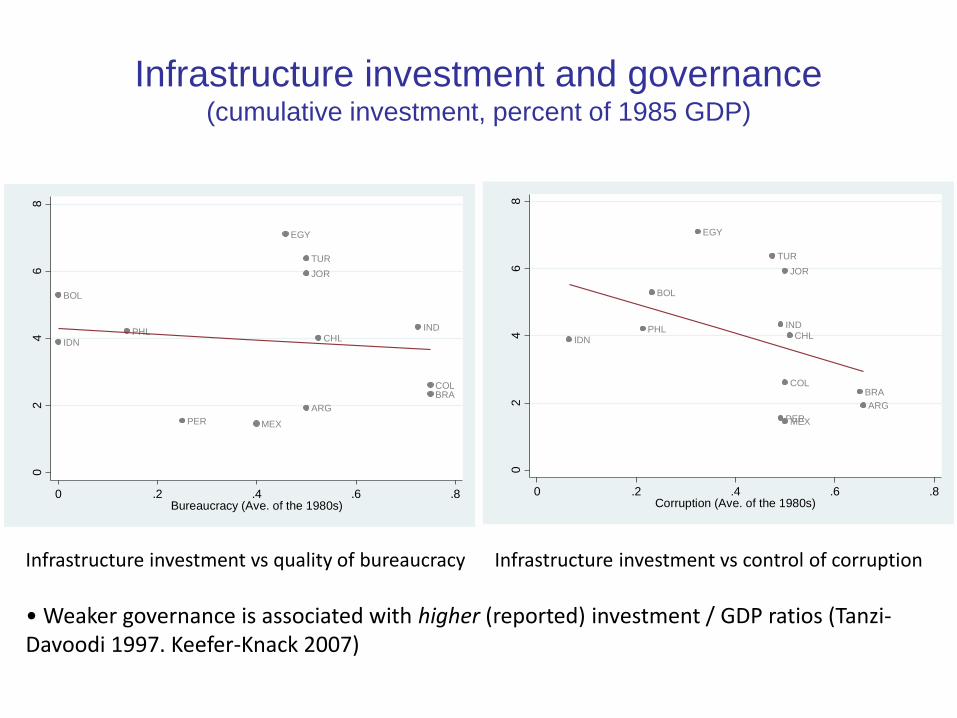
Infrastructure investment and governance(cumulative investment, percent of 1985 GDP)
IDN
BOL
PHL
PER MEX
EGY
TUR
ARG
JOR
CHLIND
COLBRA
02
46
8
Cum
ula
tive in
ve
stm
ent (%
of G
DP
) ('85
-)
0 .2 .4 .6 .8Bureaucracy (Ave. of the 1980s)
IDNPHL
BOL
EGY
TUR
PER
IND
JOR
COL
MEX
CHL
BRA
ARG
02
46
8
Cum
ula
tive in
ve
stm
ent (%
if G
DP
) ('85
-)
0 .2 .4 .6 .8Corruption (Ave. of the 1980s)
Infrastructure investment vs quality of bureaucracy Infrastructure investment vs control of corruption
• Weaker governance is associated with higher (reported) investment / GDP ratios (Tanzi-Davoodi 1997. Keefer-Knack 2007)
IDN
PHL
BOL
EGY
MEX
TUR
PER
CHL
JOR
COL
ARG
BRA
IND
MNG
-2-1
01
23
Unit c
osts
for
roa
ds (
'85-)
-.4 -.2 0 .2 .4Corruption (Ave. of the 1980s)
IDN
PHL
BOL
MEX
EGY
TUR
CHL
PER
PAK
JOR
COL
ARG
THA
BRA
VNM
IND
ZAF
-1-.
50
.51
Unit c
osts
for
EG
C (
'85
-)
-.4 -.2 0 .2 .4Corruption (Ave. of the 1980s)
IDN
PHL
BOL
EGY
MEX
TUR
PER
CHL
JOR
COL
ARG BRA
IND
MNG
-1-.
50
.51
Unit c
osts
for
ml ('8
5-)
-.4 -.2 0 .2 .4Corruption (Ave. of the 1980s)
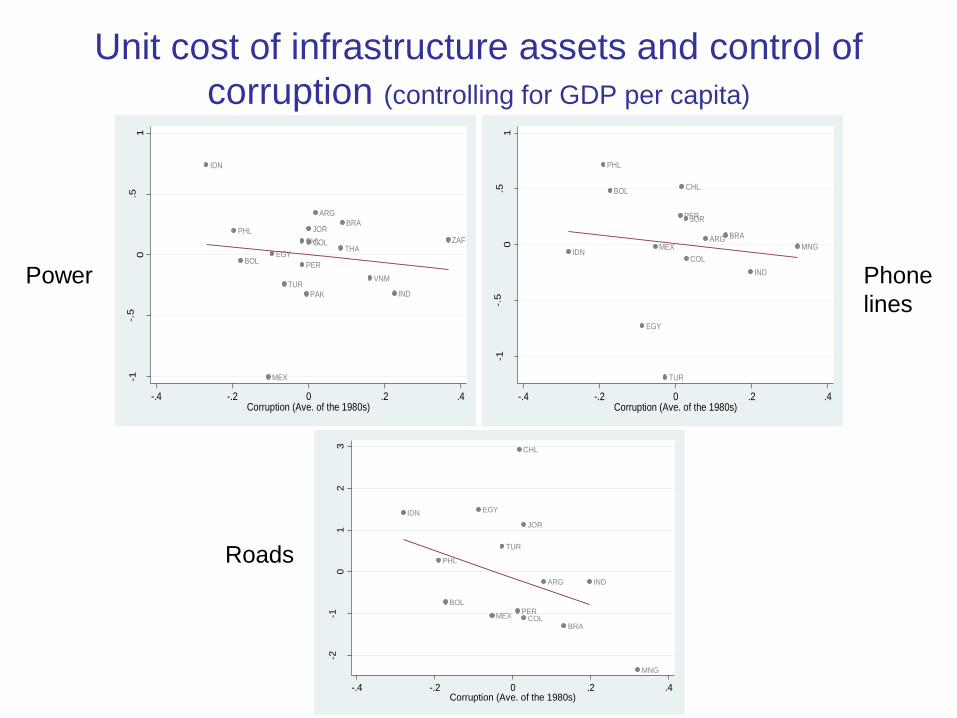
Power Phone
lines
Roads
Unit cost of infrastructure assets and control of
corruption (controlling for GDP per capita)
Power Phone
lines
Roads
BOL
IDN
PHL
PER
MEX
ARG
VNMTUR
JOR
CHL
EGY
PAK
BRA
COLTHA
IND
ZAF
-1-.
50
.51
Unit c
osts
for
EG
C (
'85
-)
-.4 -.2 0 .2 .4Bureaucracy (Ave. of the 1980s)
BOL
IDN
PHL
PER
MEX MNGARG
TUR
JOR
CHL
EGY
BRA
COL
IND
-1-.
50
.51
Unit c
osts
for
ml ('8
5-)
-.4 -.2 0 .2 .4Bureaucracy (Ave. of the 1980s)
BOL
IDN
PHL
PERMEX
MNG
ARG
TUR
JOR
CHL
EGY
BRACOL
IND
-2-1
01
23
Unit c
osts
for
roa
ds (
'85-)
-.4 -.2 0 .2 .4Bureaucracy (Ave. of the 1980s)
Unit cost of infrastructure assets and quality of
bureaucracy (controlling for GDP per capita)
44
Heat Map: Public Investment Management Index and its components

45
• Public infrastructure projects typically involve a large
upfront cost to acquire / build the assets
– e.g., (half) infrastructure catch-up in Africa would require
investment by 10% to 15% of GDP
• Over time, revenues eventually accrue from taxes on
the enlarged income or from user fees
• Addressing big public infrastructure needs poses a
fiscal challenge
Financing infrastructure
46
But two different fiscal dimensions to consider
– Short-run (liquidity): upfront investment costs lead to fiscal
deficits – unless offset by other fiscal measures
– Long-run (solvency): over time, the upfront cost can be
recovered (in part or in full) through increased revenues
– Infrastructure spending decisions need to take into account
both dimensions – not just liquidity, as often done
• Deficit reduction at the expense of infrastructure spending (as
seen in LAC in the 80s and 90s) can be self-defeating
Financing infrastructure
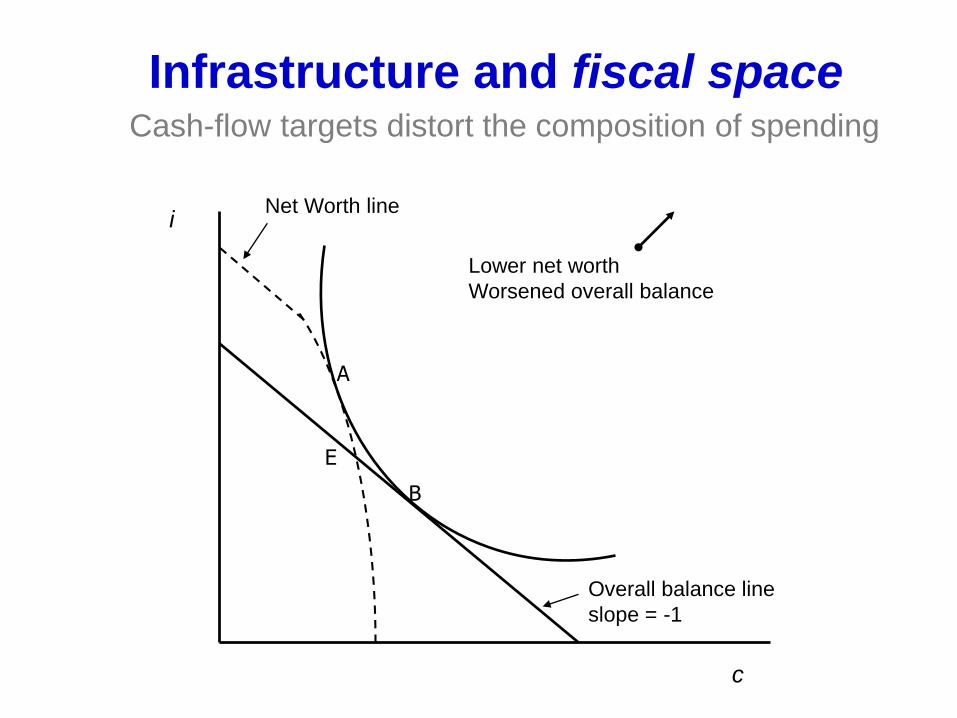
Overall balance line
slope = -1
Net Worth linei
c
A
B
E
Lower net worth
Worsened overall balance
Cash-flow targets distort the composition of spending
Infrastructure and fiscal space
48
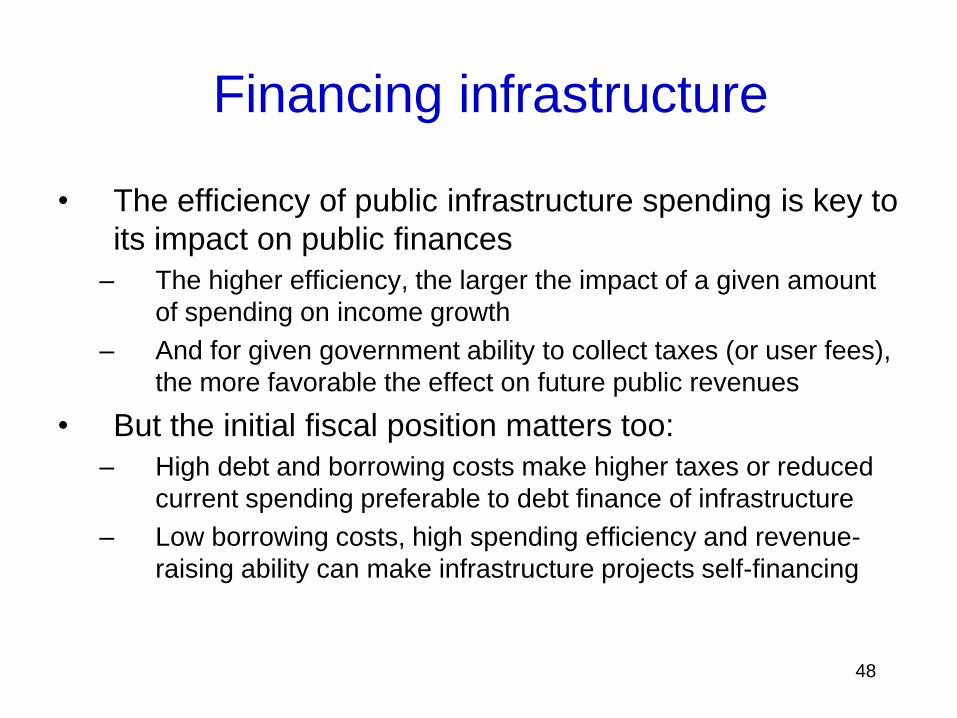
• The efficiency of public infrastructure spending is key to
its impact on public finances
– The higher efficiency, the larger the impact of a given amount
of spending on income growth
– And for given government ability to collect taxes (or user fees),
the more favorable the effect on future public revenues
• But the initial fiscal position matters too:
– High debt and borrowing costs make higher taxes or reduced
current spending preferable to debt finance of infrastructure
– Low borrowing costs, high spending efficiency and revenue-
raising ability can make infrastructure projects self-financing
Financing infrastructure
49
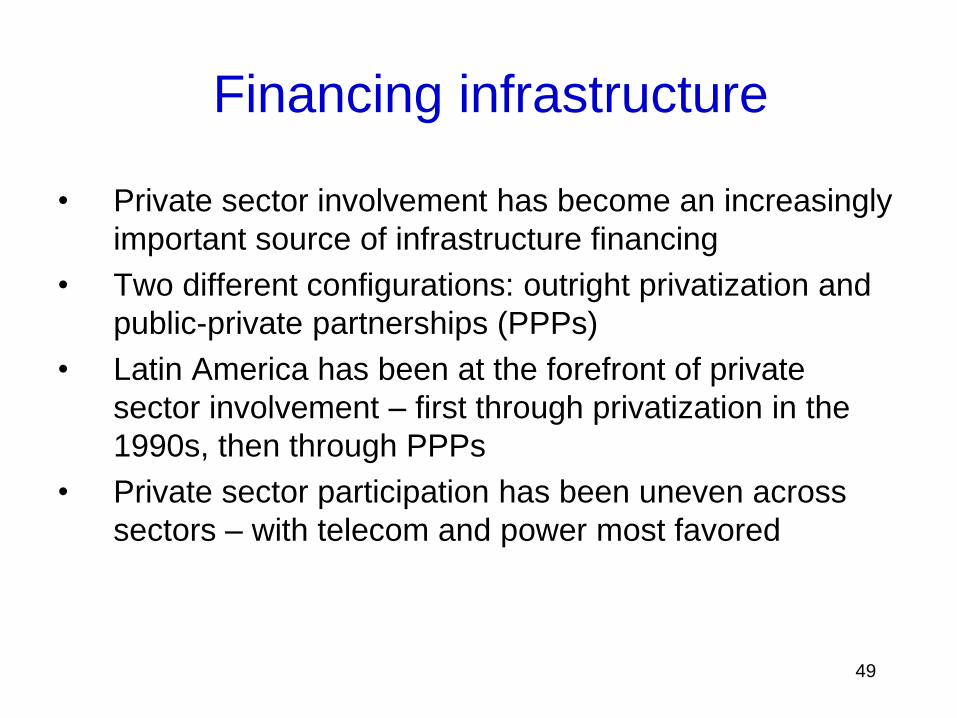
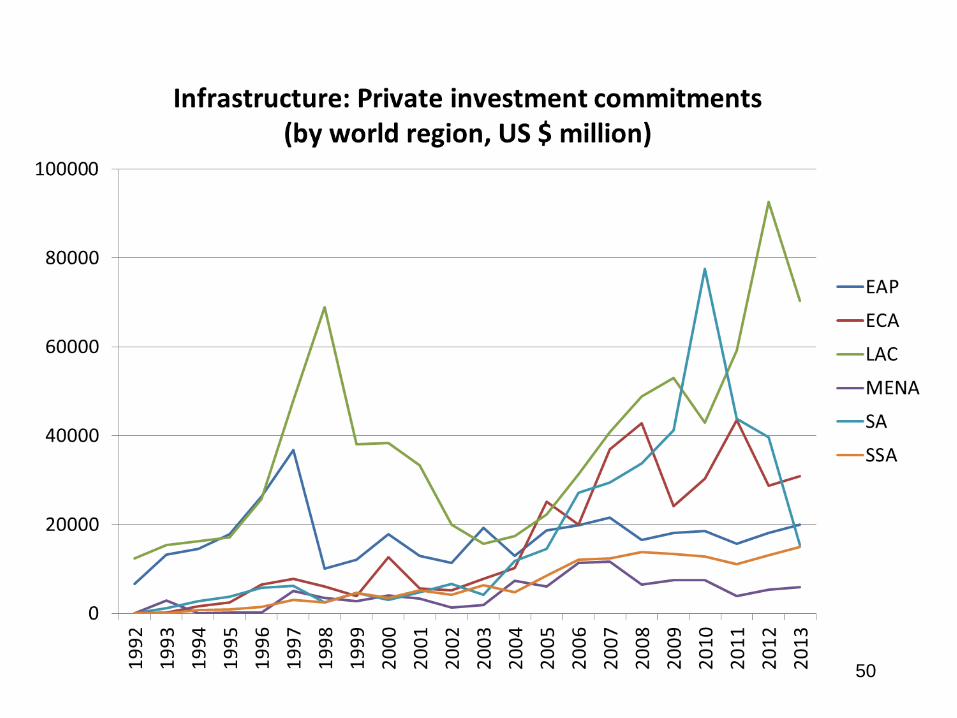
• Private sector involvement has become an increasingly
important source of infrastructure financing
• Two different configurations: outright privatization and
public-private partnerships (PPPs)
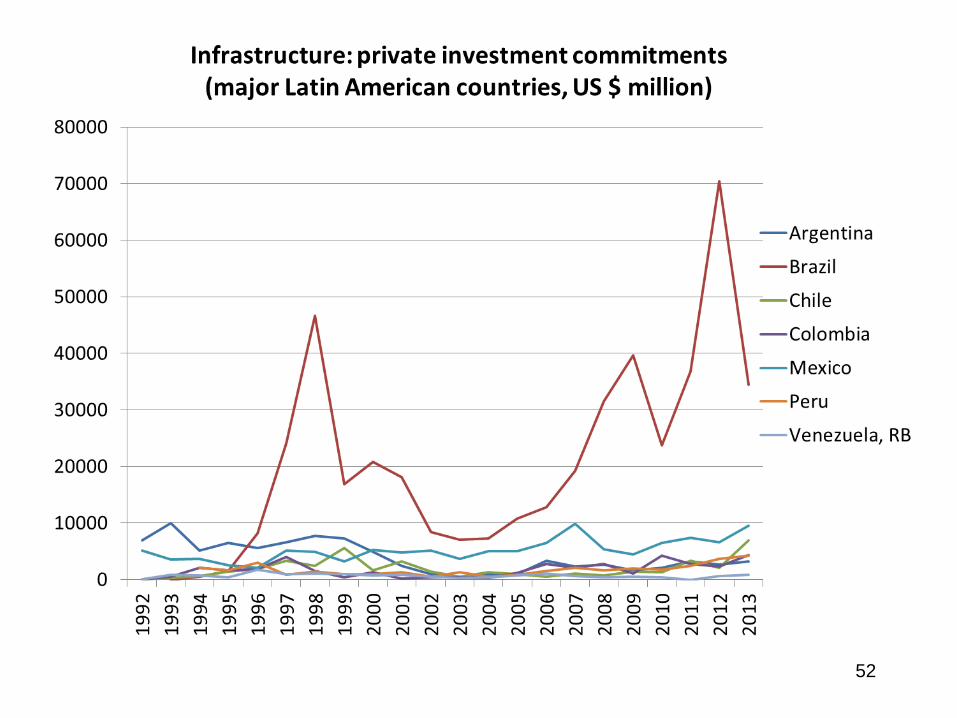
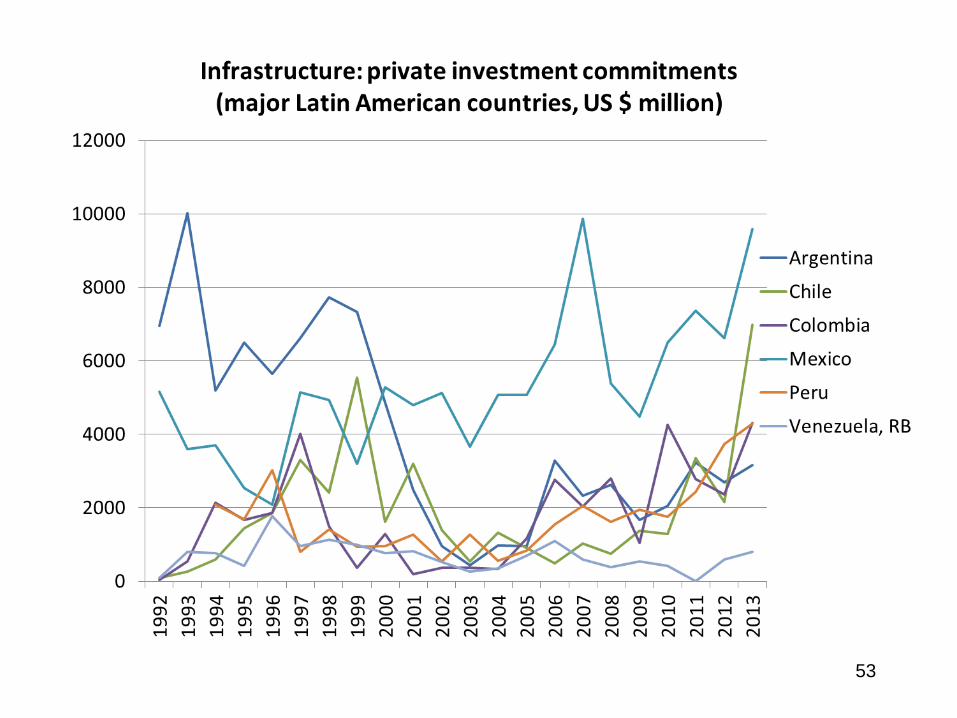
• Latin America has been at the forefront of private
sector involvement – first through privatization in the
1990s, then through PPPs
• Private sector participation has been uneven across
sectors – with telecom and power most favored
Financing infrastructure
50
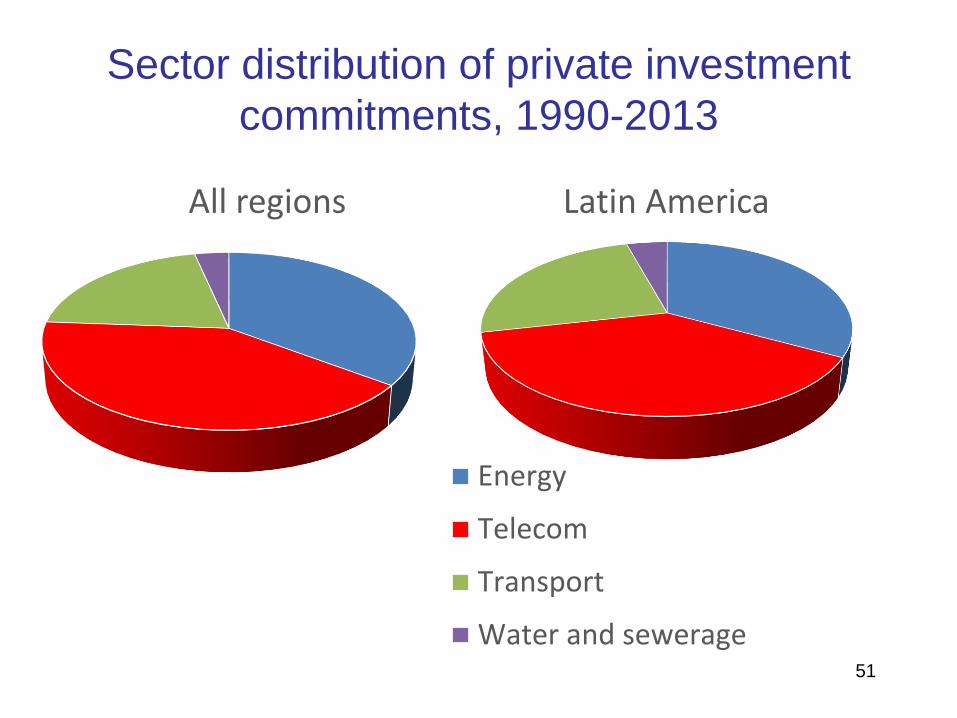
Sector distribution of private investment
commitments, 1990-2013
51
Latin America
Energy
Telecom
Transport
Water and sewerage
All regions
52
53
54
• PPPs are often advocated as preferable to public
provision on the belief that they free up public funds
• But in the long run they seldom do – they do not
materially alter the government solvency constraint
– what the government saves in initial investment expenditures, it
has to make up through foregone tax or user fee revenue
– PPPs are often motivated by the atempt to move infrastructure
spending off the fiscal accounts – taking advantage of opaque
fiscal accounting to sidestep deficit targets
• PPPs are superior only if they lead to efficiency gains
– from bundling construction, maintenance and operation
Financing infrastructure