infradeals trend report: 2015 - ipfa · infradeals trend report: 2015 including project finance and...
TRANSCRIPT
InfraDeals trend report: 2015Including project finance and advisory league tables
Criteria & contacts
Global
EMEA
North America
Latin America & the Caribbean
Asia
Renewables
PPP
United Kingdom
InfraDeals 2015 Trend Report 2 www.infra-deals.com
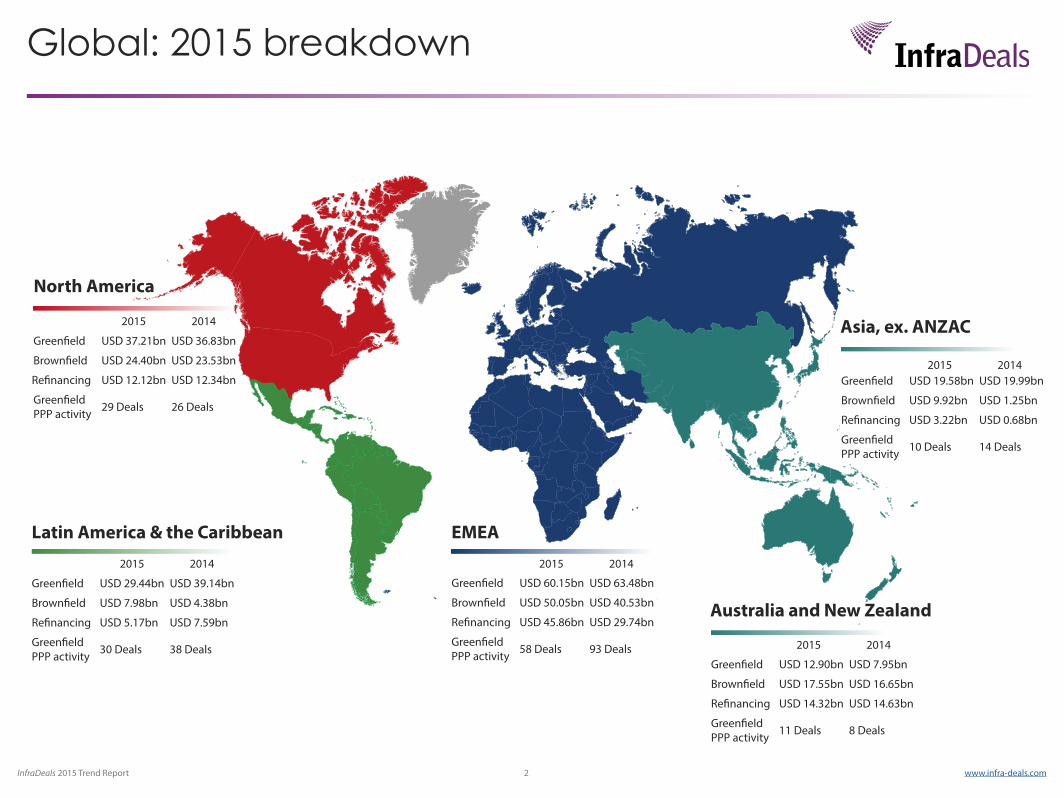
Global: 2015 breakdown
Asia, ex. ANZAC
North America
Greenfield
Greenfield PPP activity
Brownfield
Refinancing
USD 36.83bn
USD 23.53bn
USD 12.34bn
USD 37.21bn
USD 24.40bn
USD 12.12bn
26 Deals29 Deals
2015 2014
Latin America & the Caribbean
Greenfield
Greenfield PPP activity
Brownfield
Refinancing
USD 39.14bn
USD 4.38bn
USD 7.59bn
USD 29.44bn
USD 7.98bn
USD 5.17bn
38 Deals30 Deals
EMEA
Greenfield
Greenfield PPP activity
Brownfield
Refinancing
USD 63.48bn
USD 40.53bn
USD 29.74bn
USD 60.15bn
USD 50.05bn
USD 45.86bn
93 Deals58 Deals
Greenfield
Greenfield PPP activity
Brownfield
Refinancing
USD 19.99bn
USD 1.25bn
USD 0.68bn
USD 19.58bn
USD 9.92bn
USD 3.22bn
14 Deals10 Deals
Australia and New Zealand
Greenfield
Greenfield PPP activity
Brownfield
Refinancing
USD 7.95bn
USD 16.65bn
USD 14.63bn
USD 12.90bn
USD 17.55bn
USD 14.32bn
8 Deals11 Deals
2015 2014 2015 2014
2015 2014
2015 2014
* InfraDeals 2015 Trend Report 3 www.infra-deals.com
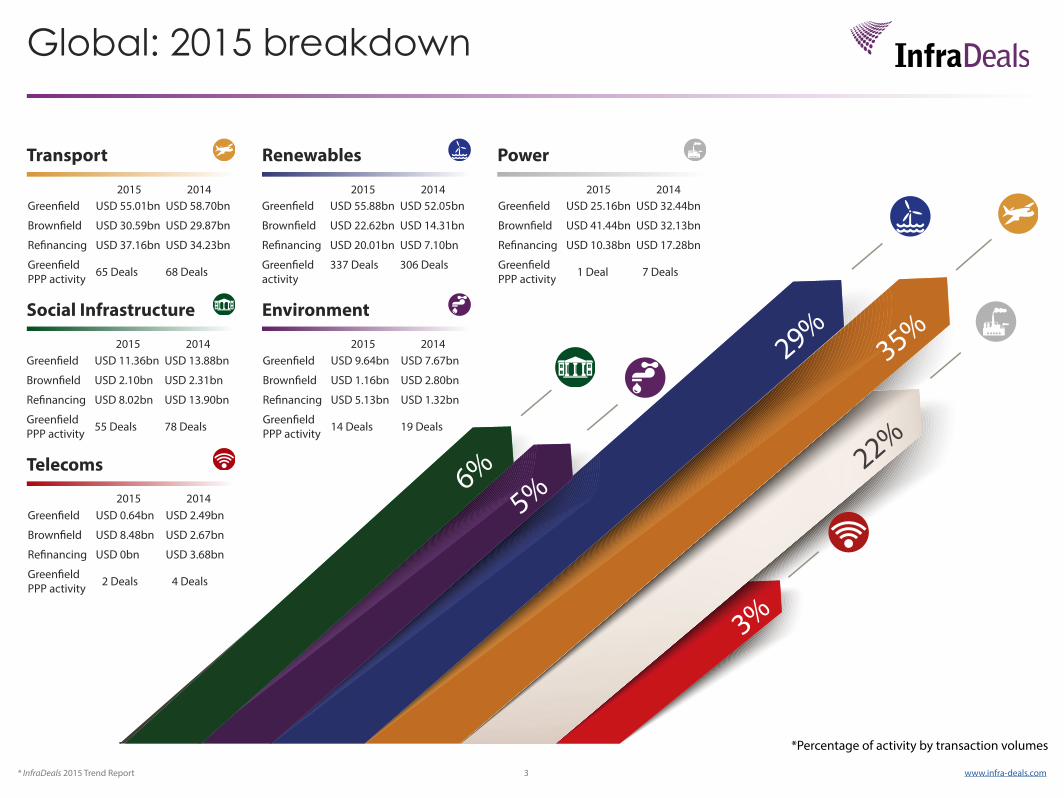
Global: 2015 breakdown
*Percentage of activity by transaction volumes
35%
22%
29%
5%
3%
6%
Transport
Greenfield
Greenfield PPP activity
Brownfield
Refinancing
USD 58.70bn
USD 29.87bn
USD 34.23bn
USD 55.01bn
USD 30.59bn
USD 37.16bn
68 Deals65 Deals
Social Infrastructure
Greenfield
Greenfield PPP activity
Brownfield
Refinancing
USD 13.88bn
USD 2.31bn
USD 13.90bn
USD 11.36bn
USD 2.10bn
USD 8.02bn
78 Deals55 Deals
Renewables
Greenfield
Brownfield
Refinancing
USD 52.05bn
USD 14.31bn
USD 7.10bn
USD 55.88bn
USD 22.62bn
USD 20.01bn
Greenfield activity
306 Deals337 Deals
Power
Greenfield
Greenfield PPP activity
Brownfield
Refinancing
USD 32.44bn
USD 32.13bn
USD 17.28bn
USD 25.16bn
USD 41.44bn
USD 10.38bn
7 Deals1 Deal
Telecoms
Greenfield
Greenfield PPP activity
Brownfield
Refinancing
USD 2.49bn
USD 2.67bn
USD 3.68bn
USD 0.64bn
USD 8.48bn
USD 0bn
4 Deals2 Deals
Environment
Greenfield
Greenfield PPP activity
Brownfield
Refinancing
USD 7.67bn
USD 2.80bn
USD 1.32bn
USD 9.64bn
USD 1.16bn
USD 5.13bn
19 Deals14 Deals
2015 2014 2015 2014 2015 2014
2015 20142015 2014
2015 2014
InfraDeals 2015 Trend Report 4 www.infra-deals.com
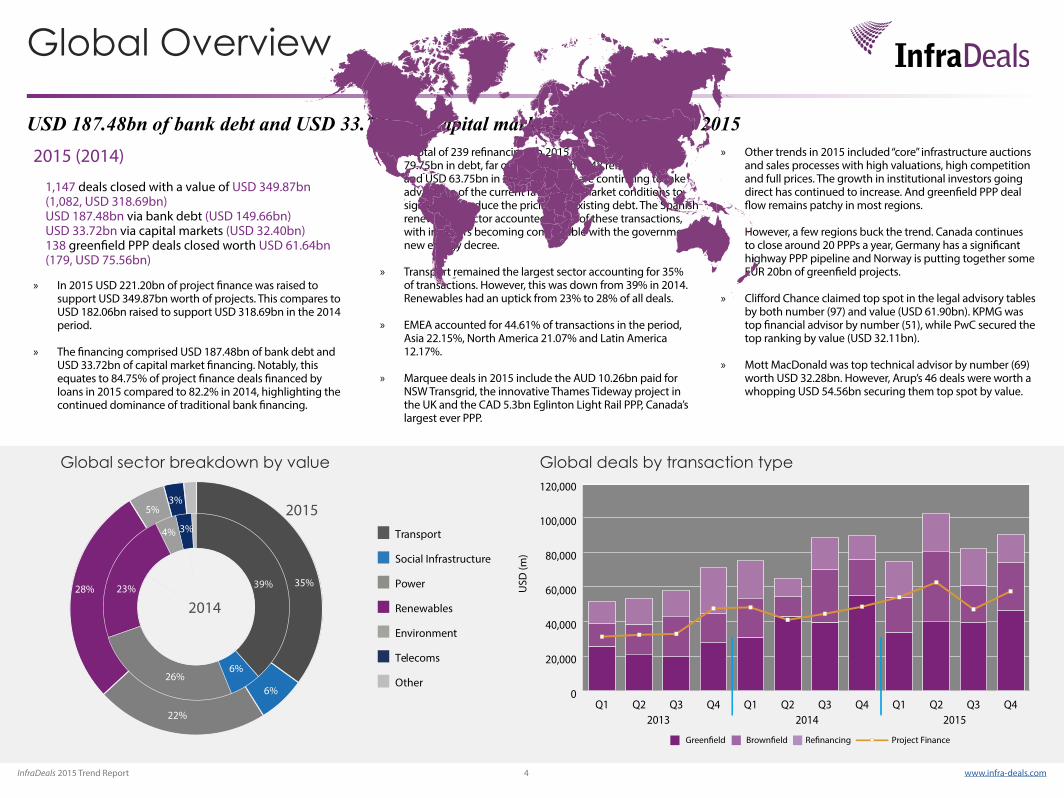
» In 2015 USD 221.20bn of project finance was raised to support USD 349.87bn worth of projects. This compares to USD 182.06bn raised to support USD 318.69bn in the 2014 period.
» The financing comprised USD 187.48bn of bank debt and USD 33.72bn of capital market financing. Notably, this equates to 84.75% of project finance deals financed by loans in 2015 compared to 82.2% in 2014, highlighting the continued dominance of traditional bank financing.
USD 187.48bn of bank debt and USD 33.72bn in capital market debt mobilised in 2015 » A total of 239 refinancings in 2015 raised a total of USD
79.75bn in debt, far outweighing the 148 refinancings and USD 63.75bn in 2014. Sponsors are continuing to take advantage of the current favourable market conditions to significantly reduce the pricing on existing debt. The Spanish renewables sector accounted for 25 of these transactions, with investors becoming comfortable with the government’s new energy decree.
» Transport remained the largest sector accounting for 35% of transactions. However, this was down from 39% in 2014. Renewables had an uptick from 23% to 28% of all deals.
» EMEA accounted for 44.61% of transactions in the period, Asia 22.15%, North America 21.07% and Latin America 12.17%.
» Marquee deals in 2015 include the AUD 10.26bn paid for NSW Transgrid, the innovative Thames Tideway project in the UK and the CAD 5.3bn Eglinton Light Rail PPP, Canada’s largest ever PPP.
» Other trends in 2015 included “core” infrastructure auctions and sales processes with high valuations, high competition and full prices. The growth in institutional investors going direct has continued to increase. And greenfield PPP deal flow remains patchy in most regions.
» However, a few regions buck the trend. Canada continues to close around 20 PPPs a year, Germany has a significant highway PPP pipeline and Norway is putting together some EUR 20bn of greenfield projects.
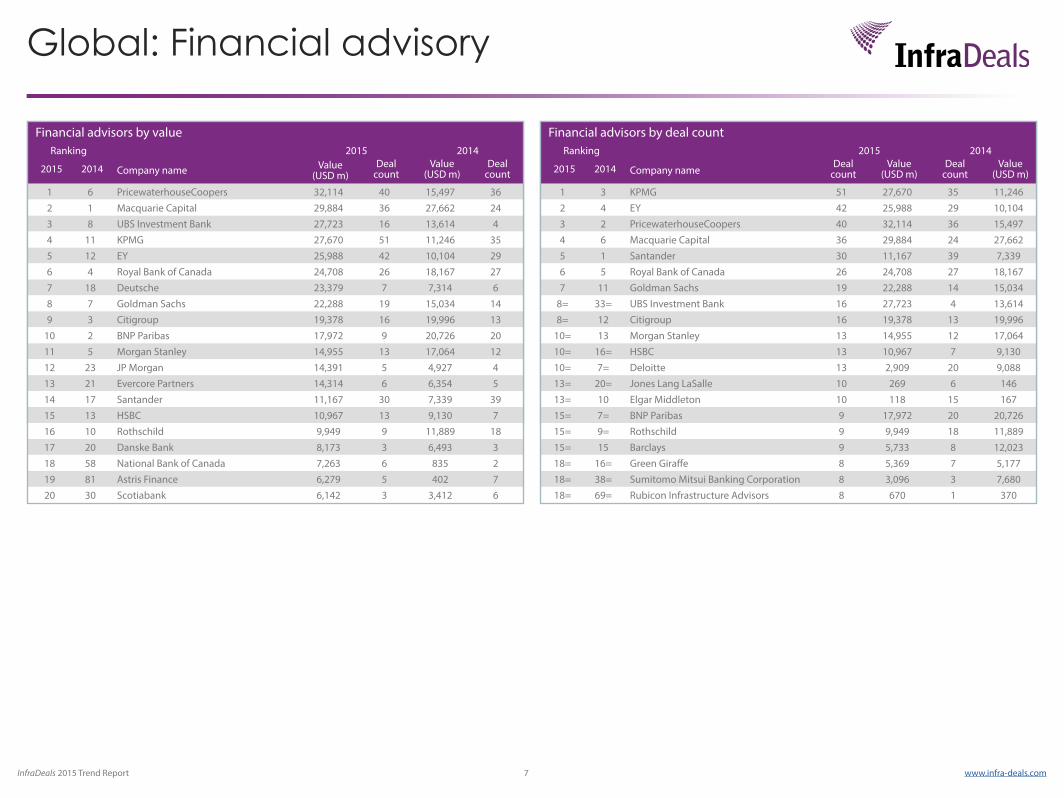
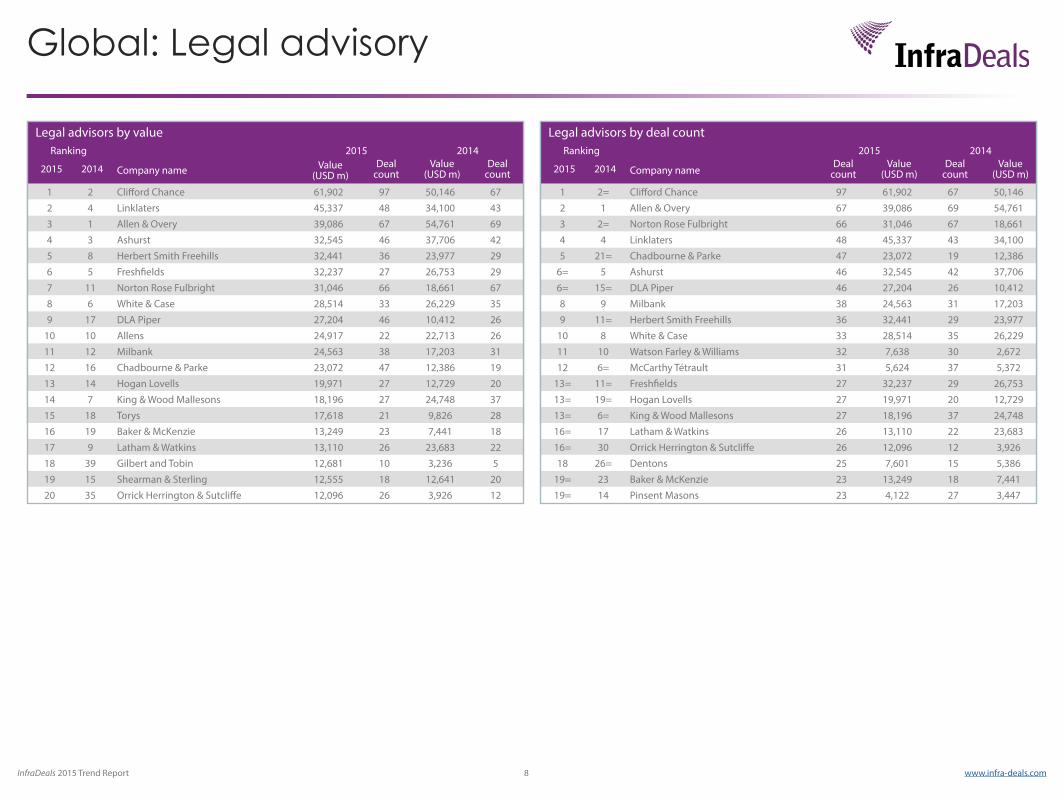
» Clifford Chance claimed top spot in the legal advisory tables by both number (97) and value (USD 61.90bn). KPMG was top financial advisor by number (51), while PwC secured the top ranking by value (USD 32.11bn).
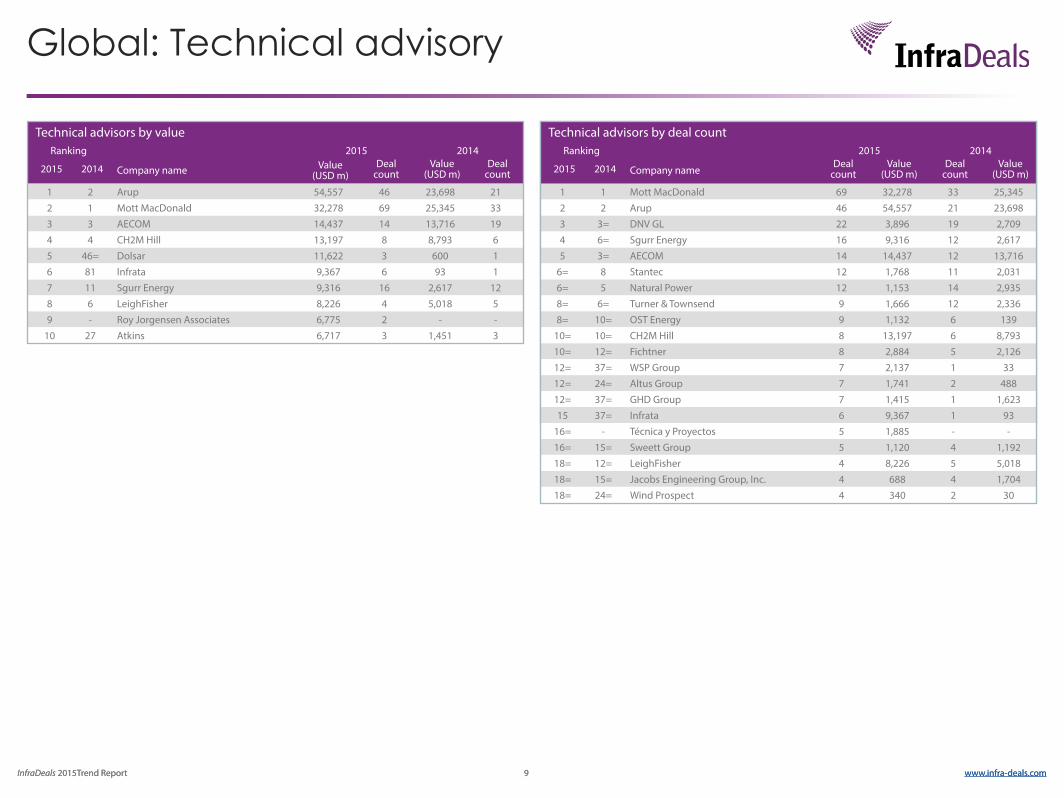
» Mott MacDonald was top technical advisor by number (69) worth USD 32.28bn. However, Arup’s 46 deals were worth a whopping USD 54.56bn securing them top spot by value.
2015 (2014)
1,147 deals closed with a value of USD 349.87bn (1,082, USD 318.69bn) USD 187.48bn via bank debt (USD 149.66bn) USD 33.72bn via capital markets (USD 32.40bn) 138 greenfield PPP deals closed worth USD 61.64bn (179, USD 75.56bn)
Global Overview
Global sector breakdown by value
22%
4%
26%
39%
6%
23%
3%
5%3%
35%
6%
28%
2014
2015
Other
Environment
Renewables
Power
Social Infrastructure
Transport
Telecoms
Global deals by transaction type
USD
(m)
0
20,000
40,000
60,000
80,000
100,000
120,000
Q4Q3Q2Q1Q4Q3Q2Q1Q4Q3Q2Q12013 2014 2015
Project Finance
InfraDeals 2015 Trend Report 5 www.infra-deals.com
Global: Top deals
The project will prevent 39m tonnes of sewage currently discharged into the River Thames in a typical year along a 25km stretch of the Thames.
Financial close - August 2015
Sponsors - Allianz Capital Partners (34.26%), Dalmore (33.76%), DIF (10.66%), INPP (15.99%), Swisslife (5.33%)
Equity - GBP 1.3bn
Financing - GBP 1bn, 10-year revolving credit facility priced at under Libor + 100bps.
USD 6,581mThames Tideway
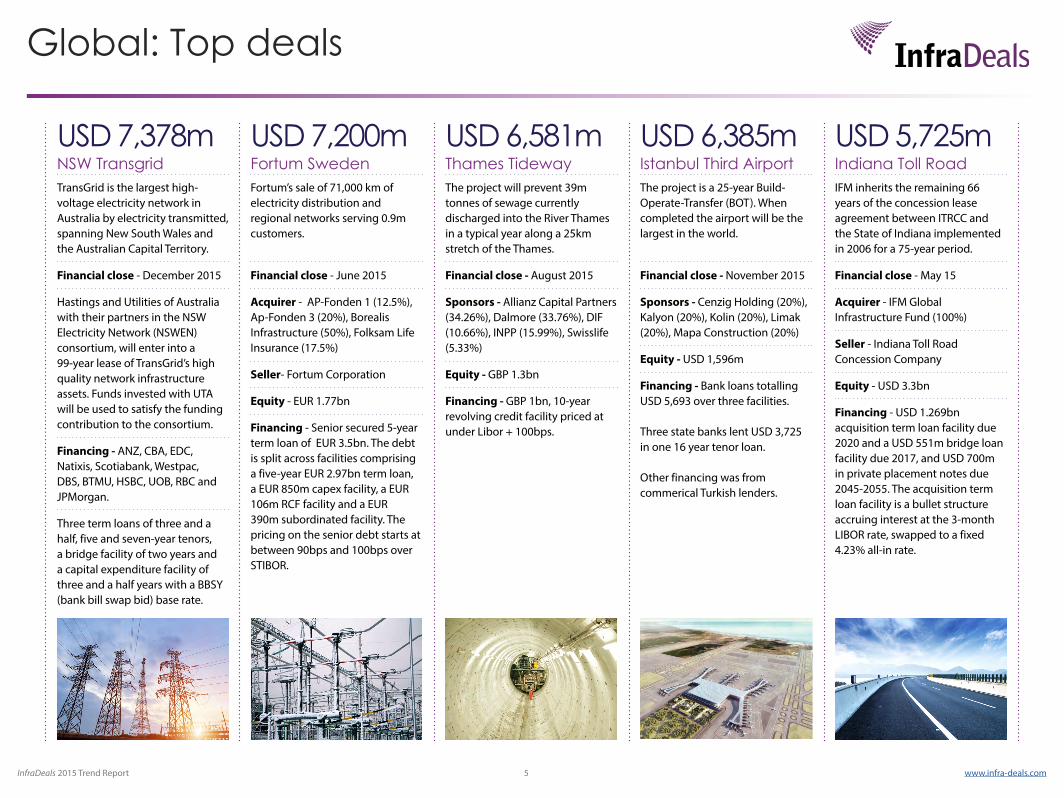
USD 7,378mNSW TransgridTransGrid is the largest high-voltage electricity network in Australia by electricity transmitted, spanning New South Wales and the Australian Capital Territory.
Financial close - December 2015
Hastings and Utilities of Australia with their partners in the NSW Electricity Network (NSWEN) consortium, will enter into a 99-year lease of TransGrid’s high quality network infrastructure assets. Funds invested with UTA will be used to satisfy the funding contribution to the consortium.
Financing - ANZ, CBA, EDC, Natixis, Scotiabank, Westpac, DBS, BTMU, HSBC, UOB, RBC and JPMorgan.
Three term loans of three and a half, five and seven-year tenors, a bridge facility of two years and a capital expenditure facility of three and a half years with a BBSY (bank bill swap bid) base rate.
The project is a 25-year Build-Operate-Transfer (BOT). When completed the airport will be the largest in the world.
Financial close - November 2015
Sponsors - Cenzig Holding (20%), Kalyon (20%), Kolin (20%), Limak (20%), Mapa Construction (20%)
Equity - USD 1,596m
Financing - Bank loans totalling USD 5,693 over three facilities. Three state banks lent USD 3,725 in one 16 year tenor loan. Other financing was from commerical Turkish lenders.
USD 6,385mIstanbul Third Airport
Fortum’s sale of 71,000 km of electricity distribution and regional networks serving 0.9m customers.
Financial close - June 2015
Acquirer - AP-Fonden 1 (12.5%), Ap-Fonden 3 (20%), Borealis Infrastructure (50%), Folksam Life Insurance (17.5%)
Seller- Fortum Corporation
Equity - EUR 1.77bn
Financing - Senior secured 5-year term loan of EUR 3.5bn. The debt is split across facilities comprising a five-year EUR 2.97bn term loan, a EUR 850m capex facility, a EUR 106m RCF facility and a EUR 390m subordinated facility. The pricing on the senior debt starts at between 90bps and 100bps over STIBOR.
USD 7,200mFortum Sweden
IFM inherits the remaining 66 years of the concession lease agreement between ITRCC and the State of Indiana implemented in 2006 for a 75-year period.
Financial close - May 15
Acquirer - IFM Global Infrastructure Fund (100%)
Seller - Indiana Toll Road Concession Company
Equity - USD 3.3bn
Financing - USD 1.269bn acquisition term loan facility due 2020 and a USD 551m bridge loan facility due 2017, and USD 700m in private placement notes due 2045-2055. The acquisition term loan facility is a bullet structure accruing interest at the 3-month LIBOR rate, swapped to a fixed 4.23% all-in rate.
USD 5,725mIndiana Toll Road
InfraDeals 2015 Trend Report 6 www.infra-deals.com
Global: Top deals
USD 4,071mEglinton Crosstown LRT Largest PPP project in Ontario. The DBFM of a 19km transit line that will include 25 stations and stops. Part of Metrolinx’s regional transportation plan designed to reduce congestion.
Financial close - July 2015
Sponsors - Aecon (25%), EllisDon (25%), Grupo ACS (25%), SNC-Lavalin (25%)
Equity - USD 73.6m
Financing - CAD 543m in short term bank debt, CAD 565m amortizing 4.651% bond due 30 September 2046 and CAD 166m bullet 4.555% bond due on 30 June 2051.
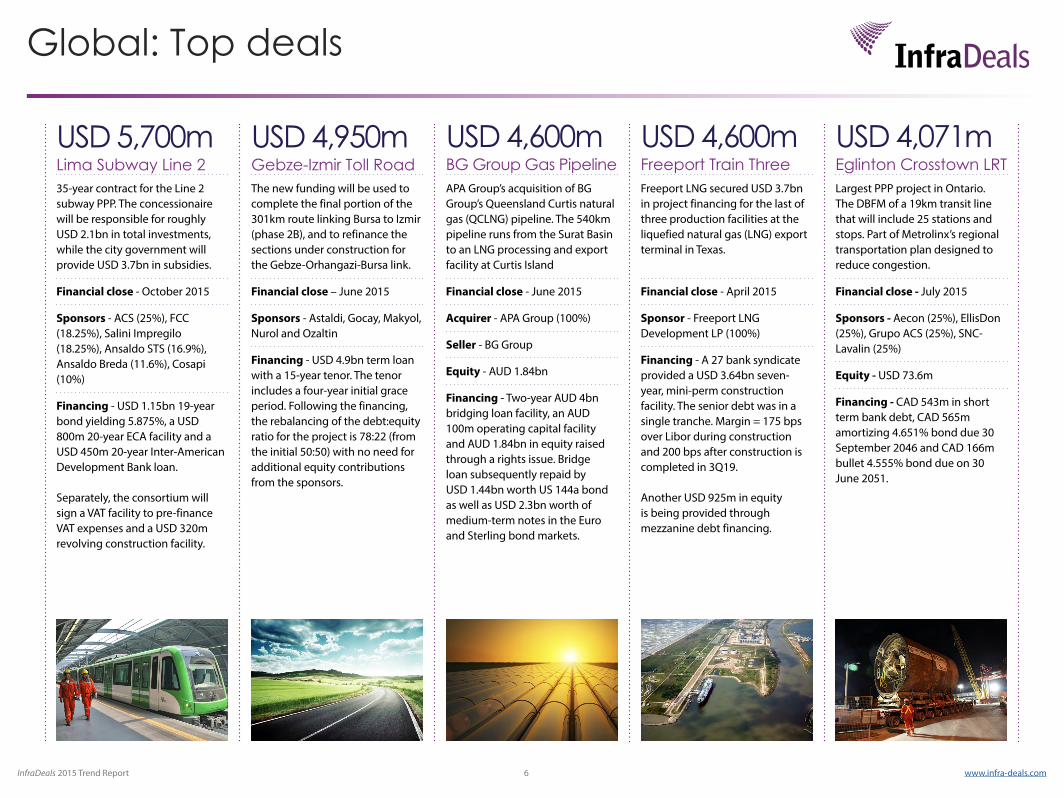
35-year contract for the Line 2 subway PPP. The concessionaire will be responsible for roughly USD 2.1bn in total investments, while the city government will provide USD 3.7bn in subsidies.
Financial close - October 2015
Sponsors - ACS (25%), FCC (18.25%), Salini Impregilo (18.25%), Ansaldo STS (16.9%), Ansaldo Breda (11.6%), Cosapi (10%)
Financing - USD 1.15bn 19-year bond yielding 5.875%, a USD 800m 20-year ECA facility and a USD 450m 20-year Inter-American Development Bank loan. Separately, the consortium will sign a VAT facility to pre-finance VAT expenses and a USD 320m revolving construction facility.
USD 5,700mLima Subway Line 2
The new funding will be used to complete the final portion of the 301km route linking Bursa to Izmir (phase 2B), and to refinance the sections under construction for the Gebze-Orhangazi-Bursa link.
Financial close – June 2015
Sponsors - Astaldi, Gocay, Makyol, Nurol and Ozaltin
Financing - USD 4.9bn term loan with a 15-year tenor. The tenor includes a four-year initial grace period. Following the financing, the rebalancing of the debt:equity ratio for the project is 78:22 (from the initial 50:50) with no need for additional equity contributions from the sponsors.
USD 4,950mGebze-Izmir Toll Road
APA Group’s acquisition of BG Group’s Queensland Curtis natural gas (QCLNG) pipeline. The 540km pipeline runs from the Surat Basin to an LNG processing and export facility at Curtis Island
Financial close - June 2015
Acquirer - APA Group (100%)
Seller - BG Group
Equity - AUD 1.84bn
Financing - Two-year AUD 4bn bridging loan facility, an AUD 100m operating capital facility and AUD 1.84bn in equity raised through a rights issue. Bridge loan subsequently repaid by USD 1.44bn worth US 144a bond as well as USD 2.3bn worth of medium-term notes in the Euro and Sterling bond markets.
USD 4,600mBG Group Gas Pipeline
Freeport LNG secured USD 3.7bn in project financing for the last of three production facilities at the liquefied natural gas (LNG) export terminal in Texas.
Financial close - April 2015
Sponsor - Freeport LNG Development LP (100%)
Financing - A 27 bank syndicate provided a USD 3.64bn seven-year, mini-perm construction facility. The senior debt was in a single tranche. Margin = 175 bps over Libor during construction and 200 bps after construction is completed in 3Q19. Another USD 925m in equity is being provided through mezzanine debt financing.
USD 4,600mFreeport Train Three
InfraDeals 2015 Trend Report 7 www.infra-deals.com
Global: Financial advisory
Financial advisors by valueRanking Q1 2015 Q1 2014
Q1 2015
Q1 2014 Company name Value
(USD m)Deal
countValue
(USD m)Deal
count
123456789
101112131415
Financial advisors by deal countRanking Q1 2015 Q1 2014
Q1 2015
Q1 2014 Company name
Deal count
Value (USD m)
Deal count
Value (USD m)
123456789
101112131415
Financial advisors by valueRanking 2015 2014
2015 2014 Company name Value (USD m)
Deal count
Value (USD m)
Deal count
1 6 PricewaterhouseCoopers 32,114 40 15,497 362 1 Macquarie Capital 29,884 36 27,662 243 8 UBS Investment Bank 27,723 16 13,614 44 11 KPMG 27,670 51 11,246 355 12 EY 25,988 42 10,104 296 4 Royal Bank of Canada 24,708 26 18,167 277 18 Deutsche 23,379 7 7,314 68 7 Goldman Sachs 22,288 19 15,034 149 3 Citigroup 19,378 16 19,996 13
10 2 BNP Paribas 17,972 9 20,726 2011 5 Morgan Stanley 14,955 13 17,064 1212 23 JP Morgan 14,391 5 4,927 413 21 Evercore Partners 14,314 6 6,354 514 17 Santander 11,167 30 7,339 3915 13 HSBC 10,967 13 9,130 716 10 Rothschild 9,949 9 11,889 1817 20 Danske Bank 8,173 3 6,493 318 58 National Bank of Canada 7,263 6 835 219 81 Astris Finance 6,279 5 402 720 30 Scotiabank 6,142 3 3,412 6
Financial advisors by deal countRanking 2015 2014
2015 2014 Company nameDeal
countValue
(USD m)Deal
countValue
(USD m)
1 3 KPMG 51 27,670 35 11,2462 4 EY 42 25,988 29 10,1043 2 PricewaterhouseCoopers 40 32,114 36 15,4974 6 Macquarie Capital 36 29,884 24 27,6625 1 Santander 30 11,167 39 7,3396 5 Royal Bank of Canada 26 24,708 27 18,1677 11 Goldman Sachs 19 22,288 14 15,034
8= 33= UBS Investment Bank 16 27,723 4 13,6148= 12 Citigroup 16 19,378 13 19,996
10= 13 Morgan Stanley 13 14,955 12 17,06410= 16= HSBC 13 10,967 7 9,13010= 7= Deloitte 13 2,909 20 9,08813= 20= Jones Lang LaSalle 10 269 6 14613= 10 Elgar Middleton 10 118 15 16715= 7= BNP Paribas 9 17,972 20 20,72615= 9= Rothschild 9 9,949 18 11,88915= 15 Barclays 9 5,733 8 12,02318= 16= Green Giraffe 8 5,369 7 5,17718= 38= Sumitomo Mitsui Banking Corporation 8 3,096 3 7,68018= 69= Rubicon Infrastructure Advisors 8 670 1 370
InfraDeals 2015 Trend Report 8 www.infra-deals.com
Global: Legal advisory
Financial advisors by valueRanking Q1 2015 Q1 2014
Q1 2015
Q1 2014 Company name Value
(USD m)Deal
countValue
(USD m)Deal
count
123456789
101112131415
Financial advisors by deal countRanking Q1 2015 Q1 2014
Q1 2015
Q1 2014 Company name
Deal count
Value (USD m)
Deal count
Value (USD m)
123456789
101112131415
Legal advisors by valueRanking 2015 2014
2015 2014 Company name Value (USD m)
Deal count
Value (USD m)
Deal count
1 2 Clifford Chance 61,902 97 50,146 672 4 Linklaters 45,337 48 34,100 433 1 Allen & Overy 39,086 67 54,761 694 3 Ashurst 32,545 46 37,706 425 8 Herbert Smith Freehills 32,441 36 23,977 296 5 Freshfields 32,237 27 26,753 297 11 Norton Rose Fulbright 31,046 66 18,661 678 6 White & Case 28,514 33 26,229 359 17 DLA Piper 27,204 46 10,412 26
10 10 Allens 24,917 22 22,713 2611 12 Milbank 24,563 38 17,203 3112 16 Chadbourne & Parke 23,072 47 12,386 1913 14 Hogan Lovells 19,971 27 12,729 2014 7 King & Wood Mallesons 18,196 27 24,748 3715 18 Torys 17,618 21 9,826 2816 19 Baker & McKenzie 13,249 23 7,441 1817 9 Latham & Watkins 13,110 26 23,683 2218 39 Gilbert and Tobin 12,681 10 3,236 519 15 Shearman & Sterling 12,555 18 12,641 2020 35 Orrick Herrington & Sutcliffe 12,096 26 3,926 12
Legal advisors by deal countRanking 2015 2014
2015 2014 Company nameDeal
countValue
(USD m)Deal
countValue
(USD m)
1 2= Clifford Chance 97 61,902 67 50,1462 1 Allen & Overy 67 39,086 69 54,7613 2= Norton Rose Fulbright 66 31,046 67 18,6614 4 Linklaters 48 45,337 43 34,1005 21= Chadbourne & Parke 47 23,072 19 12,386
6= 5 Ashurst 46 32,545 42 37,7066= 15= DLA Piper 46 27,204 26 10,4128 9 Milbank 38 24,563 31 17,2039 11= Herbert Smith Freehills 36 32,441 29 23,977
10 8 White & Case 33 28,514 35 26,22911 10 Watson Farley & Williams 32 7,638 30 2,67212 6= McCarthy Tétrault 31 5,624 37 5,372
13= 11= Freshfields 27 32,237 29 26,75313= 19= Hogan Lovells 27 19,971 20 12,72913= 6= King & Wood Mallesons 27 18,196 37 24,74816= 17 Latham & Watkins 26 13,110 22 23,68316= 30 Orrick Herrington & Sutcliffe 26 12,096 12 3,92618 26= Dentons 25 7,601 15 5,386
19= 23 Baker & McKenzie 23 13,249 18 7,44119= 14 Pinsent Masons 23 4,122 27 3,447
InfraDeals 2015Trend Report 9 www.infra-deals.com
Global: Technical advisory
InfraDeals 2015Trend Report 9 www.infra-deals.com
Financial advisors by deal countRanking Q1 2015 Q1 2014
Q1 2015
Q1 2014 Company name
Deal count
Value (USD m)
Deal count
Value (USD m)
123456789
101112131415
Technical advisors by valueRanking 2015 2014
2015 2014 Company name Value (USD m)
Deal count
Value (USD m)
Deal count
1 2 Arup 54,557 46 23,698 212 1 Mott MacDonald 32,278 69 25,345 333 3 AECOM 14,437 14 13,716 194 4 CH2M Hill 13,197 8 8,793 65 46= Dolsar 11,622 3 600 16 81 Infrata 9,367 6 93 17 11 Sgurr Energy 9,316 16 2,617 128 6 LeighFisher 8,226 4 5,018 59 - Roy Jorgensen Associates 6,775 2 - -
10 27 Atkins 6,717 3 1,451 3
Technical advisors by deal countRanking 2015 2014
2015 2014 Company nameDeal
countValue
(USD m)Deal
countValue
(USD m)
1 1 Mott MacDonald 69 32,278 33 25,3452 2 Arup 46 54,557 21 23,6983 3= DNV GL 22 3,896 19 2,7094 6= Sgurr Energy 16 9,316 12 2,6175 3= AECOM 14 14,437 12 13,716
6= 8 Stantec 12 1,768 11 2,0316= 5 Natural Power 12 1,153 14 2,9358= 6= Turner & Townsend 9 1,666 12 2,3368= 10= OST Energy 9 1,132 6 139
10= 10= CH2M Hill 8 13,197 6 8,79310= 12= Fichtner 8 2,884 5 2,12612= 37= WSP Group 7 2,137 1 3312= 24= Altus Group 7 1,741 2 48812= 37= GHD Group 7 1,415 1 1,62315 37= Infrata 6 9,367 1 93
16= - Técnica y Proyectos 5 1,885 - -16= 15= Sweett Group 5 1,120 4 1,19218= 12= LeighFisher 4 8,226 5 5,01818= 15= Jacobs Engineering Group, Inc. 4 688 4 1,70418= 24= Wind Prospect 4 340 2 30
InfraDeals 2015 Trend Report 10 www.infra-deals.com
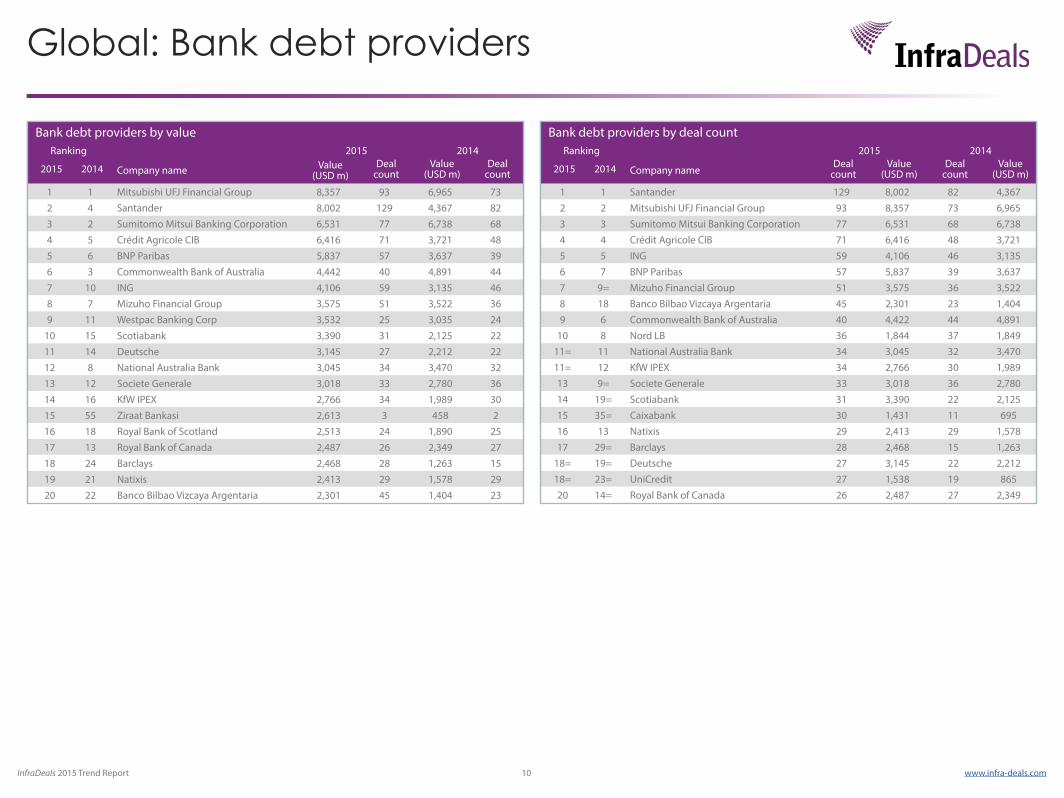
Global: Bank debt providers
Financial advisors by valueRanking Q1 2015 Q1 2014
Q1 2015
Q1 2014 Company name Value
(USD m)Deal
countValue
(USD m)Deal
count
123456789
101112131415
Financial advisors by deal countRanking Q1 2015 Q1 2014
Q1 2015
Q1 2014 Company name
Deal count
Value (USD m)
Deal count
Value (USD m)
123456789
101112131415
Bank debt providers by valueRanking 2015 2014
2015 2014 Company name Value (USD m)
Deal count
Value (USD m)
Deal count
1 1 Mitsubishi UFJ Financial Group 8,357 93 6,965 732 4 Santander 8,002 129 4,367 823 2 Sumitomo Mitsui Banking Corporation 6,531 77 6,738 684 5 Crédit Agricole CIB 6,416 71 3,721 485 6 BNP Paribas 5,837 57 3,637 396 3 Commonwealth Bank of Australia 4,442 40 4,891 447 10 ING 4,106 59 3,135 468 7 Mizuho Financial Group 3,575 51 3,522 369 11 Westpac Banking Corp 3,532 25 3,035 24
10 15 Scotiabank 3,390 31 2,125 2211 14 Deutsche 3,145 27 2,212 2212 8 National Australia Bank 3,045 34 3,470 3213 12 Societe Generale 3,018 33 2,780 3614 16 KfW IPEX 2,766 34 1,989 3015 55 Ziraat Bankasi 2,613 3 458 216 18 Royal Bank of Scotland 2,513 24 1,890 2517 13 Royal Bank of Canada 2,487 26 2,349 2718 24 Barclays 2,468 28 1,263 1519 21 Natixis 2,413 29 1,578 2920 22 Banco Bilbao Vizcaya Argentaria 2,301 45 1,404 23
Bank debt providers by deal countRanking 2015 2014
2015 2014 Company nameDeal
countValue
(USD m)Deal
countValue
(USD m)
1 1 Santander 129 8,002 82 4,3672 2 Mitsubishi UFJ Financial Group 93 8,357 73 6,9653 3 Sumitomo Mitsui Banking Corporation 77 6,531 68 6,7384 4 Crédit Agricole CIB 71 6,416 48 3,7215 5 ING 59 4,106 46 3,1356 7 BNP Paribas 57 5,837 39 3,6377 9= Mizuho Financial Group 51 3,575 36 3,5228 18 Banco Bilbao Vizcaya Argentaria 45 2,301 23 1,4049 6 Commonwealth Bank of Australia 40 4,422 44 4,891
10 8 Nord LB 36 1,844 37 1,84911= 11 National Australia Bank 34 3,045 32 3,47011= 12 KfW IPEX 34 2,766 30 1,98913 9= Societe Generale 33 3,018 36 2,78014 19= Scotiabank 31 3,390 22 2,12515 35= Caixabank 30 1,431 11 69516 13 Natixis 29 2,413 29 1,57817 29= Barclays 28 2,468 15 1,263
18= 19= Deutsche 27 3,145 22 2,21218= 23= UniCredit 27 1,538 19 86520 14= Royal Bank of Canada 26 2,487 27 2,349
InfraDeals 2015 Trend Report 11 www.infra-deals.com
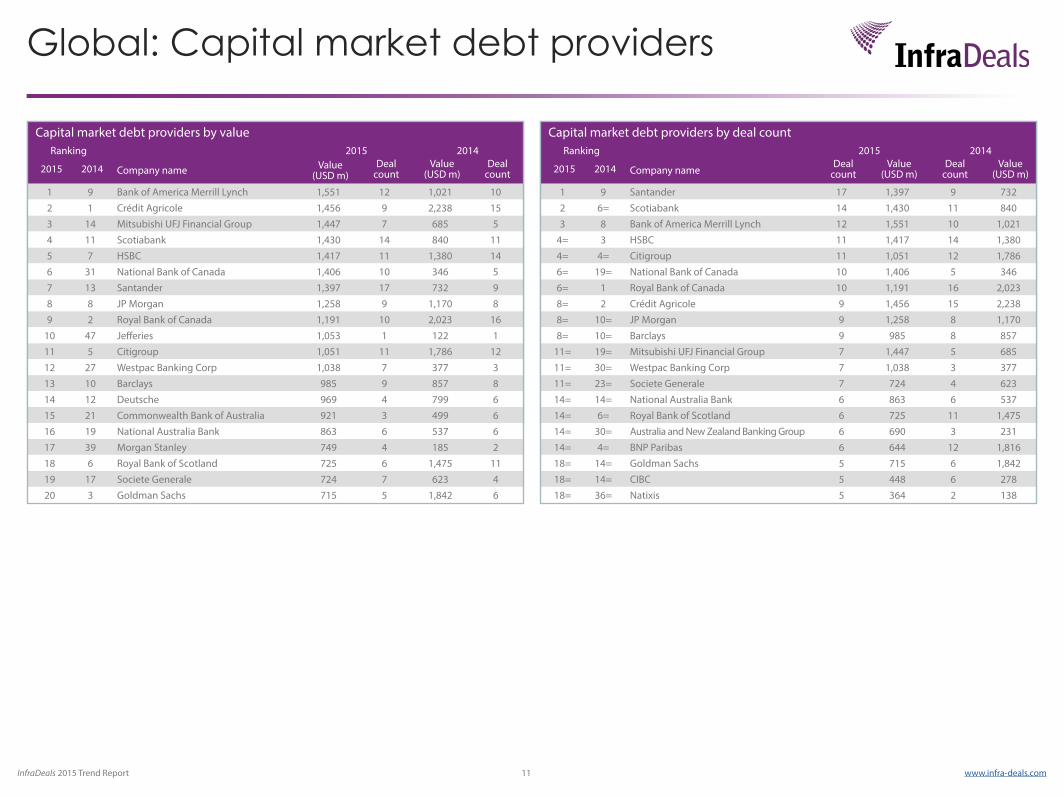
Global: Capital market debt providers
Financial advisors by valueRanking Q1 2015 Q1 2014
Q1 2015
Q1 2014 Company name Value
(USD m)Deal
countValue
(USD m)Deal
count
123456789
101112131415
Financial advisors by deal countRanking Q1 2015 Q1 2014
Q1 2015
Q1 2014 Company name
Deal count
Value (USD m)
Deal count
Value (USD m)
123456789
101112131415
Capital market debt providers by valueRanking 2015 2014
2015 2014 Company name Value (USD m)
Deal count
Value (USD m)
Deal count
1 9 Bank of America Merrill Lynch 1,551 12 1,021 102 1 Crédit Agricole 1,456 9 2,238 153 14 Mitsubishi UFJ Financial Group 1,447 7 685 54 11 Scotiabank 1,430 14 840 115 7 HSBC 1,417 11 1,380 146 31 National Bank of Canada 1,406 10 346 57 13 Santander 1,397 17 732 98 8 JP Morgan 1,258 9 1,170 89 2 Royal Bank of Canada 1,191 10 2,023 16
10 47 Jefferies 1,053 1 122 111 5 Citigroup 1,051 11 1,786 1212 27 Westpac Banking Corp 1,038 7 377 313 10 Barclays 985 9 857 814 12 Deutsche 969 4 799 615 21 Commonwealth Bank of Australia 921 3 499 616 19 National Australia Bank 863 6 537 617 39 Morgan Stanley 749 4 185 218 6 Royal Bank of Scotland 725 6 1,475 1119 17 Societe Generale 724 7 623 420 3 Goldman Sachs 715 5 1,842 6
Capital market debt providers by deal countRanking 2015 2014
2015 2014 Company nameDeal
countValue
(USD m)Deal
countValue
(USD m)
1 9 Santander 17 1,397 9 7322 6= Scotiabank 14 1,430 11 8403 8 Bank of America Merrill Lynch 12 1,551 10 1,021
4= 3 HSBC 11 1,417 14 1,3804= 4= Citigroup 11 1,051 12 1,7866= 19= National Bank of Canada 10 1,406 5 3466= 1 Royal Bank of Canada 10 1,191 16 2,0238= 2 Crédit Agricole 9 1,456 15 2,2388= 10= JP Morgan 9 1,258 8 1,1708= 10= Barclays 9 985 8 857
11= 19= Mitsubishi UFJ Financial Group 7 1,447 5 68511= 30= Westpac Banking Corp 7 1,038 3 37711= 23= Societe Generale 7 724 4 62314= 14= National Australia Bank 6 863 6 53714= 6= Royal Bank of Scotland 6 725 11 1,47514= 30= Australia and New Zealand Banking Group 6 690 3 23114= 4= BNP Paribas 6 644 12 1,81618= 14= Goldman Sachs 5 715 6 1,84218= 14= CIBC 5 448 6 27818= 36= Natixis 5 364 2 138
InfraDeals 2015 Trend Report 12 www.infra-deals.com
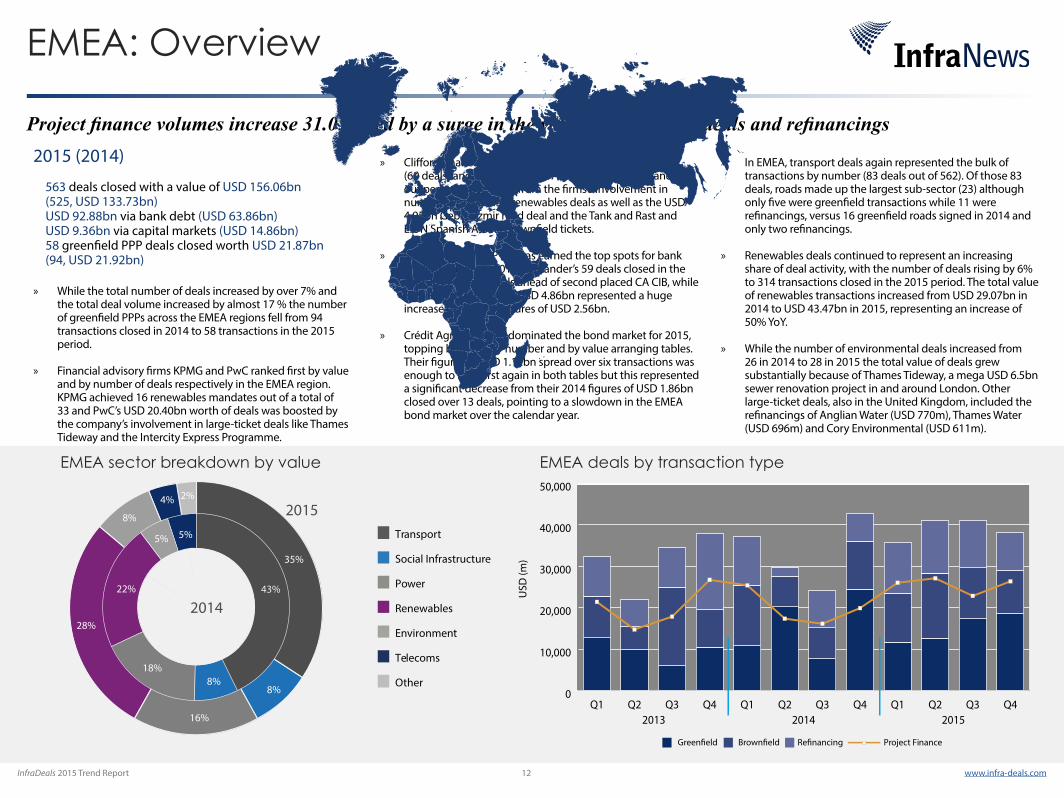
» While the total number of deals increased by over 7% and the total deal volume increased by almost 17 % the number of greenfield PPPs across the EMEA regions fell from 94 transactions closed in 2014 to 58 transactions in the 2015 period.
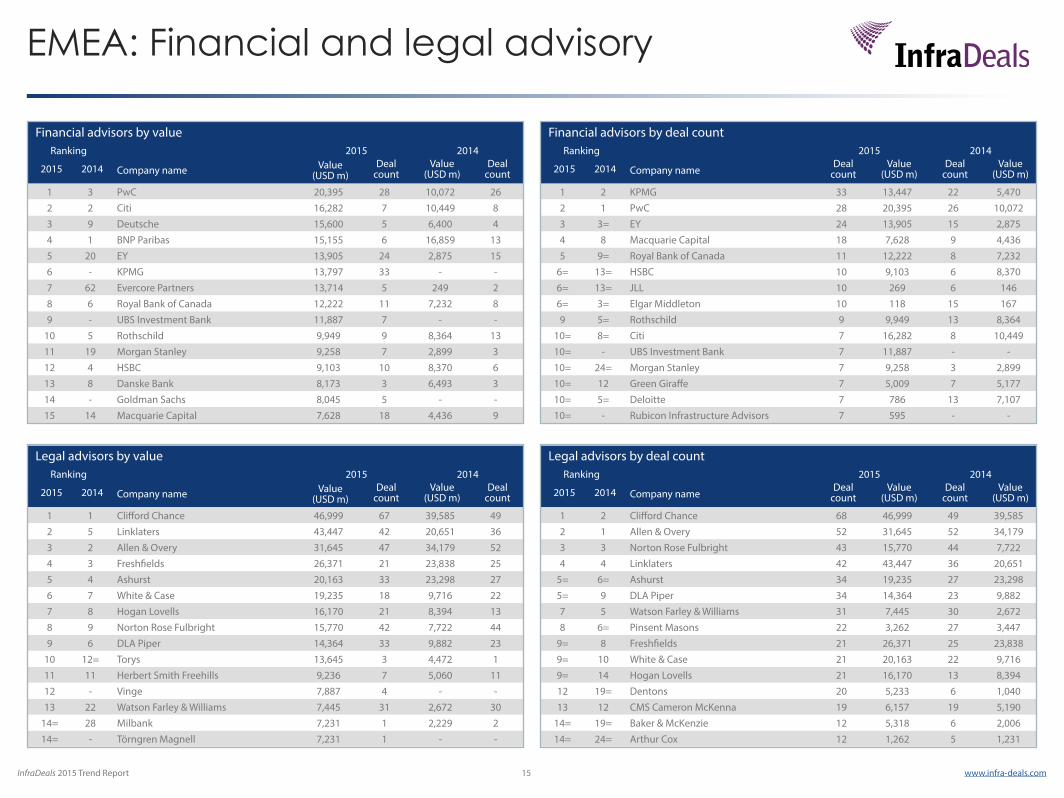
» Financial advisory firms KPMG and PwC ranked first by value and by number of deals respectively in the EMEA region. KPMG achieved 16 renewables mandates out of a total of 33 and PwC’s USD 20.40bn worth of deals was boosted by the company’s involvement in large-ticket deals like Thames Tideway and the Intercity Express Programme.
Project finance volumes increase 31.05% led by a surge in the value of brownfield deals and refinancings
» Clifford Chance came top among law firms by number (69 deals) and by value (USD 47.06bn) tables. This stand-out performance came from the firms’s involvement in numerous power and renewables deals as well as the USD 4.95bn Gebze-Izmir road deal and the Tank and Rast and E.ON Spanish Assets brownfield tickets.
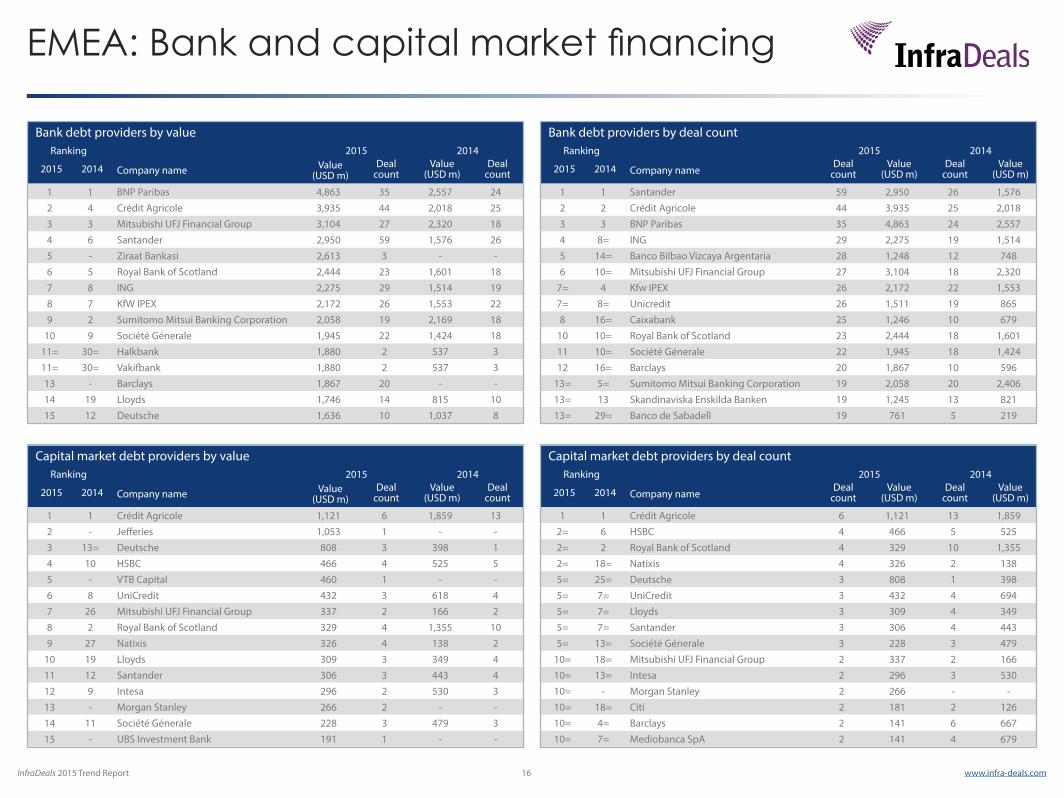
» Santander and BNP Paribas earned the top spots for bank lending activity in 2015. Santander’s 59 deals closed in the year 2015 was 15 deals ahead of second placed CA CIB, while BNP Paribas’ lending of USD 4.86bn represented a huge increase on its 2014 figures of USD 2.56bn.
» Crédit Agricole again dominated the bond market for 2015, topping both the by number and by value arranging tables. Their figures of USD 1.12bn spread over six transactions was enough to rank first again in both tables but this represented a significant decrease from their 2014 figures of USD 1.86bn closed over 13 deals, pointing to a slowdown in the EMEA bond market over the calendar year.
» In EMEA, transport deals again represented the bulk of transactions by number (83 deals out of 562). Of those 83 deals, roads made up the largest sub-sector (23) although only five were greenfield transactions while 11 were refinancings, versus 16 greenfield roads signed in 2014 and only two refinancings.
» Renewables deals continued to represent an increasing share of deal activity, with the number of deals rising by 6% to 314 transactions closed in the 2015 period. The total value of renewables transactions increased from USD 29.07bn in 2014 to USD 43.47bn in 2015, representing an increase of 50% YoY.
» While the number of environmental deals increased from 26 in 2014 to 28 in 2015 the total value of deals grew substantially because of Thames Tideway, a mega USD 6.5bn sewer renovation project in and around London. Other large-ticket deals, also in the United Kingdom, included the refinancings of Anglian Water (USD 770m), Thames Water (USD 696m) and Cory Environmental (USD 611m).
2015 (2014)
563 deals closed with a value of USD 156.06bn (525, USD 133.73bn) USD 92.88bn via bank debt (USD 63.86bn) USD 9.36bn via capital markets (USD 14.86bn) 58 greenfield PPP deals closed worth USD 21.87bn (94, USD 21.92bn)
EMEA: Overview
EMEA sector breakdown by value
16%
18%
43%
8%
22%
5%
4%
35%
8%
28%
2%
5%
8%
2014
2015
Other
Environment
Renewables
Power
Social Infrastructure
Transport
Telecoms
EMEA deals by transaction type
USD
(m)
0
10,000
20,000
30,000
40,000
50,000
Q4Q3Q2Q1Q4Q3Q2Q1Q4Q3Q2Q12013 2014 2015
Project Finance
InfraDeals 2015 Trend Report 13 www.infra-deals.com
» Social infrastructure deal activity in EMEA dropped 28% from 96 deals closed in 2014 to 69 deals closed in 2015. However, large-ticket deals like the Flemish Education Project refinancing (USD 2.23bn) and the Bilkent and Etlik Turkish hospital PPPs (USD 1.20bn and USD 1.12bn respectively), ensured that the total value of social infrastructure transactions grew to USD 12.38bn in 2015 from USD 10.04bn in 2014.
» Across the EMEA region the value of greenfield transactions dropped from USD 63.39bn in 2014 to USD 59.91bn in 2015. In contrast to this the brownfield market went up by 26.5% from USD 39.99bn in 2014 to USD 50.59bn in 2015 and refinancings jumped 54% from USD 29.74bn in 2014 to USD 45.86bn in 2015.
» Renewable refinancing activity surged in 2015 to 70 deals with the bulk of those coming in Spain (25). The Spanish government enacted a new energy decree in mid-2014 but lenders were in no rush to refinance their struggling Spanish assets before carefully analysing how the new regime would impact project returns, explaining the flurry of refinancings in 2H15.
» The number of brownfield M&A transactions over period fell 2.5% on 2014 to 195. This was due primarily to a 39% drop in the number of brownfield deals in the social infrastructure space from 41 to 25. This decrease was mitigated by a rising number of brownfield telecoms transactions (up 80%) and brownfield power deals (up 16.6%).
EMEA: Overview
EMEA project finance volumes 2013-2015
Sector Project State Status Value (USD m)
Taif International Airport Saudi Arabia Transaction Launch TBC
Kabd Municipal Solid Waste Kuwait Pre-qualified 1,000
A6 Wiesloch - Rauenberg to Weinsberg (Baden-Wurttemberg)
Germany Pre-qualified 557
Kampala-Jinja Expressway PPP Uganda Transaction Launch 892
Pedemontana Lombarda Motorway
Italy Preferred Proponent 6,223
Rosslare Port Sale Ireland Pre-launch TBC
Albert Bridges Belgium Pre-qualified 111
N18 Enschede - Groenlo Netherlands Shortlisted 334
Upcoming EMEA deals
0
5,000
10,000
15,000
20,000
25,000
30,000
Q1 Q2 Q3 Q4 Q1 Q2 Q3 Q4 Q1 Q2 Q3 Q4
2013 2014 2015
USD
(m)
Bank Debt Capital Market Financing
InfraDeals 2015 Trend Report 14 www.infra-deals.com
EMEA: Top deals
NameValue
(USD m)Country Sponsors / Acquirers Funders Advisors
Fortum Sweden 7,291 SwedenAP-Fonden 1, AP-Fonden 3, Borealis
Infrastructure, Folksam Like Insurance
BAML, BNP Paribas, CIBC, CA CIB, Danske Bank, Deutsche, DNB, EDC, HSBC, ING,
MUFG, NAB, Nordea, RBC, RBS, Scotiabank, SEB, SocGen, Swedbank, Westbourne
Capital
Citi, Danske Bank (Seller FA), Avance Attorneys, Vinge (Seller LA), Arup (Seller TA), BNP Paribas, Deutsche (Acquirer FA),
Linklaters, Torys (Acquirer LA), Milbank, Törngren Magnell (Funders LA)
Thames Tideway Tunnel Project
6,581United
Kingdom
Allianz Capital Partners, Dalmore Infrastructure Investments, DIF, INPP,
Swisslife
CA CIB, DEFRA, Lloyds, MUFG, RBC, Santander, SMBC, Thames Water
EY, KPMG, PwC, UBS (Grantor FA), Ashurst, Linklaters, Norton Rose Fulbright (Grantor LA), Evercore, RBC (SPV FA), Herbert Smith Freehills (SPV LA), Aecom (SPV TA), Freshfields, Hogan
Lovells (Funders LA)
Istanbul Third Airport
6,384 TurkeyCengiz Holding, Kalyon, Kolin, Limak,
Mapa ConstructionDenizBank, Finansbank, Garanti Bank,
Halkbank, Vakifbank, Ziraat BankasiGoksu Safi Isik (SPV LA), Arup (SPV TA), Akol, Cakmak, White &
Case (Funders LA), Dolsar, Mott MacDonald (Funders TA)
Gebze-Orhangazi-Izmir Toll Road
(Final Phase and Refinancing)
4,950 Turkey Astaldi, Gocay, Makyol, Nurol and OzaltinAkbank, Finansbank, Garanti Bank,
Halkbank, Isbank, Vafkibank, Yapi Kredi, Ziraat Bankasi. Deutsche
Hergüner Bilgen Özeke (SPV LA), LeighFisher (SPV TA), Clifford Chance, Verdi & Yazici (Funder LA), Dolsar (Funder TA)
Tank and Rast Sale 3,957 GermanyBorealis, Abu Dhabi Investment Authority, Allianz, MEAG - Munich RE & ERGO asset
management
BAML, BNP Paribas, Commerzbank, CA CIB, Mediobanca, MUFG, RBC, RBS,
Scotiabank, SEB, UniCredit Group
Deutsche, JP Morgan (Seller FA), Freshfields, Linklaters (Seller LA), BAML, BNP Paribas, (Acquirer FA), Clifford Chance, Torys,
White & Case (Acquirer LA), A&O (Funders LA)
TDF French Unit Sale
3,800 FranceArcus Infrastructure Partners, APG,
Brookfield Infrastructure II, PSP Investments
BNP Paribas, CA CIB, Lloyds, RBS, SocGen
GS, Rothschild, BNP Paribas (Seller FA), Cleary Gottlieb Steen & Hamilton (Seller LA), Morgan Stanley (Acquirer FA) Sullivan & Cromwell, Hannes Snellman (Acquirer LA), Arup (Acquirer
TA), Linklaters (Funders LA)
Intercity Express Programme (IEP)
Phase 1 Debt Repricing
3,786United
KingdomHitachi, John Laing, MetLife
DBJ, EIB, JBIC, Lloyds, MUFG, Mizuho, Norinchuken Bank, SMBC, SMTB
PwC (Grantor FA), Hogan Lovells (Grantor LA), Mott MacDonald (Grantor TA), HSBC (SPV FA), DLA Piper (SPV LA),
Ashurst, Clifford Chance (Funders LA), CH2M Hill (Funders TA)
E.ON Spanish Power and Generation
Asset Sale (Viesgo)2,746 Spain
Kuwait Investment Authority, Macquarie European Infrastructure Fund IV (MEIF IV)
Banco de Sabadell, Banco Popular, Barclays, BNP Paribas, CA CIB,
Caixabank, JP Morgan, Mediobanca, RBS, Scotiabank, Santander, SocGen
Citi (Seller FA), Bonelli Erede Pappalardo, Perez-Llorca (Seller LA), Evercore, JP Morgan (Acquirer FA), Linklaters (Acquirer LA),
Arup, (Acquirer TA), Clifford Chance (Funders LA)
Galloper 340MW Offshore Wind Farm
2,736United
KingdomGIB, Maquarie Capital, RWE, Siemens
Financial Services
ABN Amro, BNP Paribas, CA CIB, EIB, Helaba Landesbank, ING, Lloyds, MUFG, Natixis, Santander, SEB, SocGen, SMBC
Barclays, BNP Paribas (SPV FA), Clifford Chance, Freshfields (SPV LA), A&O, Linklaters (Funders LA), Sgurr (Funders TA)
Thameslink Rolling Stock Refinancing
2,472United
Kingdom3i Infrastructure, Innisfree PFI Secondary
Fund 2, Siemens Project Ventures
Bayern LB, Credit Mutuel, CA CIB, DBJ, DZ Bank, EIB, Helaba, ING, KfW IPEX,
Lloyds, MUFG, Mizuho, SEB, SMBC, SMTB
PwC (Grantor FA), DLA Piper (Grantor LA), HSBC (SPV FA), Hogan Lovells (SPV LA), Freshfields, Linklaters (Funders LA),
Atkins (Funders TA)
Key: FA = Financial Advisor, LA = Legal Advisor, TA = Technical Advisor
InfraDeals 2015 Trend Report 15 www.infra-deals.com
EMEA: Financial and legal advisory
Financial advisors by valueRanking 2015 2014
2015 2014 Company name Value (USD m)
Deal count
Value (USD m)
Deal count
1 3 PwC 20,395 28 10,072 262 2 Citi 16,282 7 10,449 83 9 Deutsche 15,600 5 6,400 44 1 BNP Paribas 15,155 6 16,859 135 20 EY 13,905 24 2,875 156 - KPMG 13,797 33 - -7 62 Evercore Partners 13,714 5 249 28 6 Royal Bank of Canada 12,222 11 7,232 89 - UBS Investment Bank 11,887 7 - -
10 5 Rothschild 9,949 9 8,364 1311 19 Morgan Stanley 9,258 7 2,899 312 4 HSBC 9,103 10 8,370 613 8 Danske Bank 8,173 3 6,493 314 - Goldman Sachs 8,045 5 - -15 14 Macquarie Capital 7,628 18 4,436 9
Financial advisors by deal countRanking 2015 2014
2015 2014 Company nameDeal
countValue
(USD m)Deal
countValue
(USD m)
1 2 KPMG 33 13,447 22 5,4702 1 PwC 28 20,395 26 10,0723 3= EY 24 13,905 15 2,8754 8 Macquarie Capital 18 7,628 9 4,4365 9= Royal Bank of Canada 11 12,222 8 7,232
6= 13= HSBC 10 9,103 6 8,3706= 13= JLL 10 269 6 1466= 3= Elgar Middleton 10 118 15 1679 5= Rothschild 9 9,949 13 8,364
10= 8= Citi 7 16,282 8 10,44910= - UBS Investment Bank 7 11,887 - -10= 24= Morgan Stanley 7 9,258 3 2,89910= 12 Green Giraffe 7 5,009 7 5,17710= 5= Deloitte 7 786 13 7,10710= - Rubicon Infrastructure Advisors 7 595 - -
Legal advisors by valueRanking 2015 2014
2015 2014 Company name Value (USD m)
Deal count
Value (USD m)
Deal count
1 1 Clifford Chance 46,999 67 39,585 492 5 Linklaters 43,447 42 20,651 363 2 Allen & Overy 31,645 47 34,179 524 3 Freshfields 26,371 21 23,838 255 4 Ashurst 20,163 33 23,298 276 7 White & Case 19,235 18 9,716 227 8 Hogan Lovells 16,170 21 8,394 138 9 Norton Rose Fulbright 15,770 42 7,722 449 6 DLA Piper 14,364 33 9,882 23
10 12= Torys 13,645 3 4,472 111 11 Herbert Smith Freehills 9,236 7 5,060 1112 - Vinge 7,887 4 - -13 22 Watson Farley & Williams 7,445 31 2,672 30
14= 28 Milbank 7,231 1 2,229 214= - Törngren Magnell 7,231 1 - -
Legal advisors by deal countRanking 2015 2014
2015 2014 Company nameDeal
countValue
(USD m)Deal
countValue
(USD m)
1 2 Clifford Chance 68 46,999 49 39,5852 1 Allen & Overy 52 31,645 52 34,1793 3 Norton Rose Fulbright 43 15,770 44 7,7224 4 Linklaters 42 43,447 36 20,651
5= 6= Ashurst 34 19,235 27 23,2985= 9 DLA Piper 34 14,364 23 9,8827 5 Watson Farley & Williams 31 7,445 30 2,6728 6= Pinsent Masons 22 3,262 27 3,447
9= 8 Freshfields 21 26,371 25 23,8389= 10 White & Case 21 20,163 22 9,7169= 14 Hogan Lovells 21 16,170 13 8,39412 19= Dentons 20 5,233 6 1,04013 12 CMS Cameron McKenna 19 6,157 19 5,190
14= 19= Baker & McKenzie 12 5,318 6 2,00614= 24= Arthur Cox 12 1,262 5 1,231
InfraDeals 2015 Trend Report 16 www.infra-deals.com
EMEA: Bank and capital market financing
Bank debt providers by valueRanking 2015 2014
2015 2014 Company name Value (USD m)
Deal count
Value (USD m)
Deal count
1 1 BNP Paribas 4,863 35 2,557 242 4 Crédit Agricole 3,935 44 2,018 253 3 Mitsubishi UFJ Financial Group 3,104 27 2,320 184 6 Santander 2,950 59 1,576 265 - Ziraat Bankasi 2,613 3 - -6 5 Royal Bank of Scotland 2,444 23 1,601 187 8 ING 2,275 29 1,514 198 7 KfW IPEX 2,172 26 1,553 229 2 Sumitomo Mitsui Banking Corporation 2,058 19 2,169 18
10 9 Société Génerale 1,945 22 1,424 1811= 30= Halkbank 1,880 2 537 311= 30= Vakifbank 1,880 2 537 313 - Barclays 1,867 20 - -14 19 Lloyds 1,746 14 815 1015 12 Deutsche 1,636 10 1,037 8
Bank debt providers by deal countRanking 2015 2014
2015 2014 Company nameDeal
countValue
(USD m)Deal
countValue
(USD m)
1 1 Santander 59 2,950 26 1,5762 2 Crédit Agricole 44 3,935 25 2,0183 3 BNP Paribas 35 4,863 24 2,5574 8= ING 29 2,275 19 1,5145 14= Banco Bilbao Vizcaya Argentaria 28 1,248 12 7486 10= Mitsubishi UFJ Financial Group 27 3,104 18 2,320
7= 4 Kfw IPEX 26 2,172 22 1,5537= 8= Unicredit 26 1,511 19 8658 16= Caixabank 25 1,246 10 679
10 10= Royal Bank of Scotland 23 2,444 18 1,60111 10= Société Génerale 22 1,945 18 1,42412 16= Barclays 20 1,867 10 596
13= 5= Sumitomo Mitsui Banking Corporation 19 2,058 20 2,40613= 13 Skandinaviska Enskilda Banken 19 1,245 13 82113= 29= Banco de Sabadell 19 761 5 219
Capital market debt providers by valueRanking 2015 2014
2015 2014 Company name Value (USD m)
Deal count
Value (USD m)
Deal count
1 1 Crédit Agricole 1,121 6 1,859 132 - Jefferies 1,053 1 - -3 13= Deutsche 808 3 398 14 10 HSBC 466 4 525 55 - VTB Capital 460 1 - -6 8 UniCredit 432 3 618 47 26 Mitsubishi UFJ Financial Group 337 2 166 28 2 Royal Bank of Scotland 329 4 1,355 109 27 Natixis 326 4 138 2
10 19 Lloyds 309 3 349 411 12 Santander 306 3 443 412 9 Intesa 296 2 530 313 - Morgan Stanley 266 2 - -14 11 Société Génerale 228 3 479 315 - UBS Investment Bank 191 1 - -
Capital market debt providers by deal countRanking 2015 2014
2015 2014 Company nameDeal
countValue
(USD m)Deal
countValue
(USD m)
1 1 Crédit Agricole 6 1,121 13 1,8592= 6 HSBC 4 466 5 5252= 2 Royal Bank of Scotland 4 329 10 1,3552= 18= Natixis 4 326 2 1385= 25= Deutsche 3 808 1 3985= 7= UniCredit 3 432 4 6945= 7= Lloyds 3 309 4 3495= 7= Santander 3 306 4 4435= 13= Société Génerale 3 228 3 479
10= 18= Mitsubishi UFJ Financial Group 2 337 2 16610= 13= Intesa 2 296 3 53010= - Morgan Stanley 2 266 - -10= 18= Citi 2 181 2 12610= 4= Barclays 2 141 6 66710= 7= Mediobanca SpA 2 141 4 679
InfraDeals 2015 Trend Report 18 www.infra-deals.com
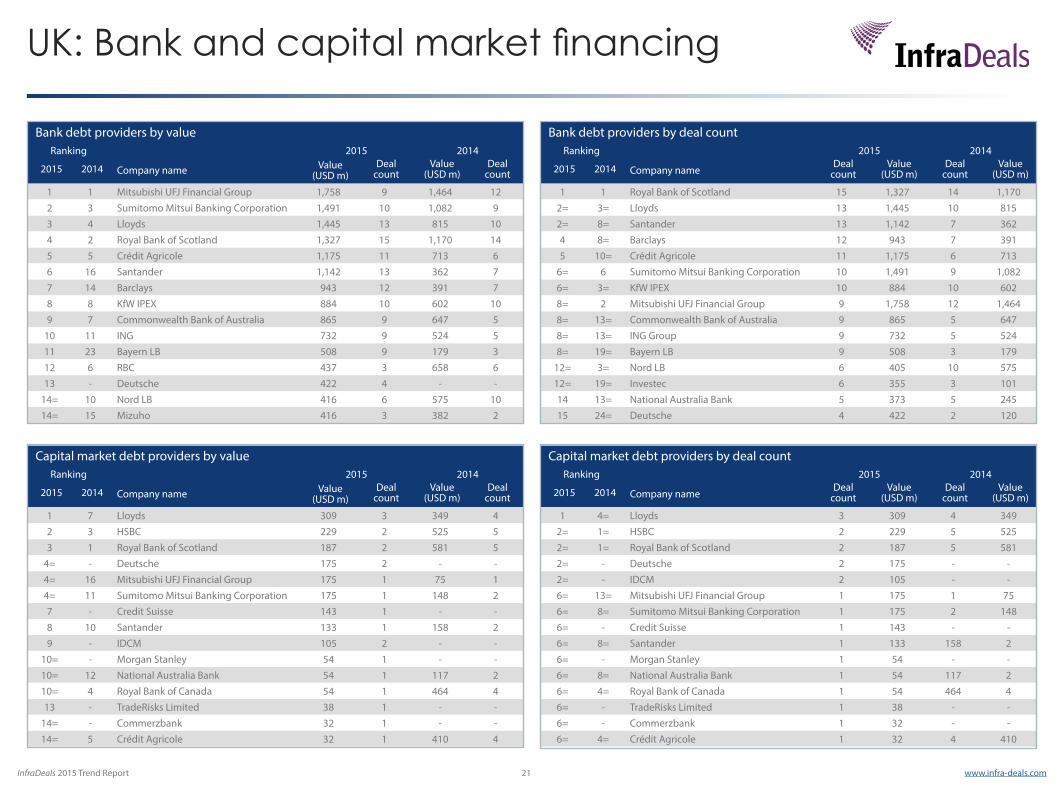
2015 (2014)
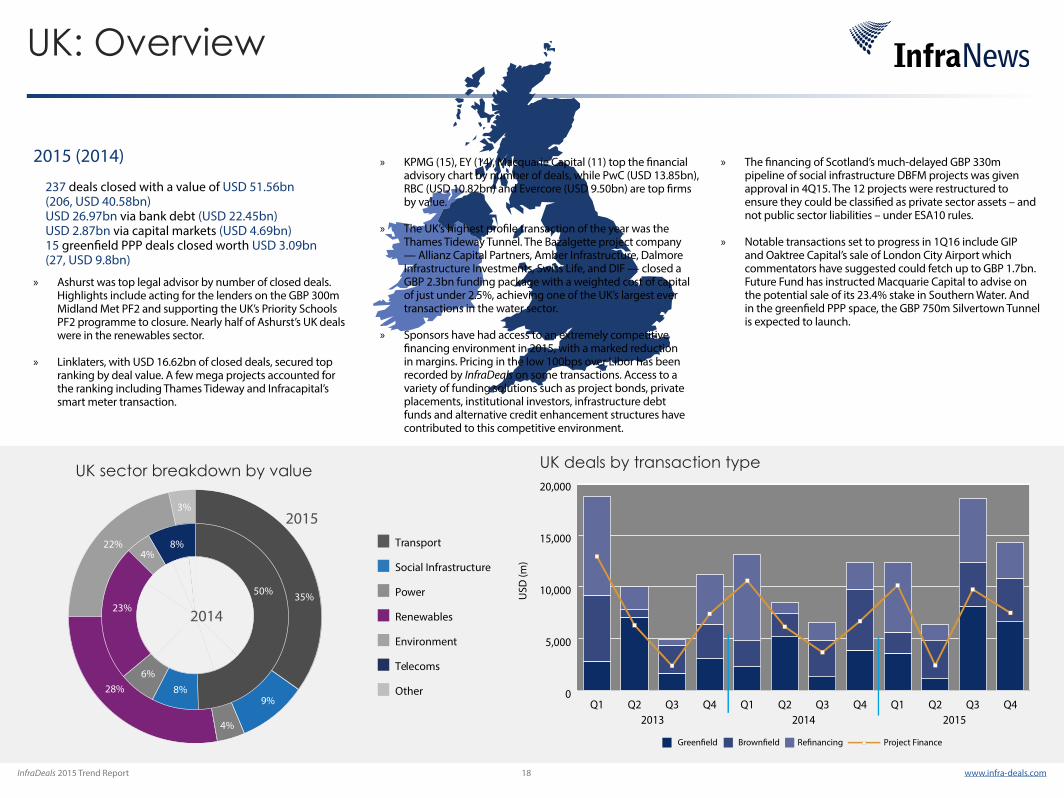
237 deals closed with a value of USD 51.56bn (206, USD 40.58bn) USD 26.97bn via bank debt (USD 22.45bn) USD 2.87bn via capital markets (USD 4.69bn) 15 greenfield PPP deals closed worth USD 3.09bn (27, USD 9.8bn)
UK sector breakdown by value
UK: Overview
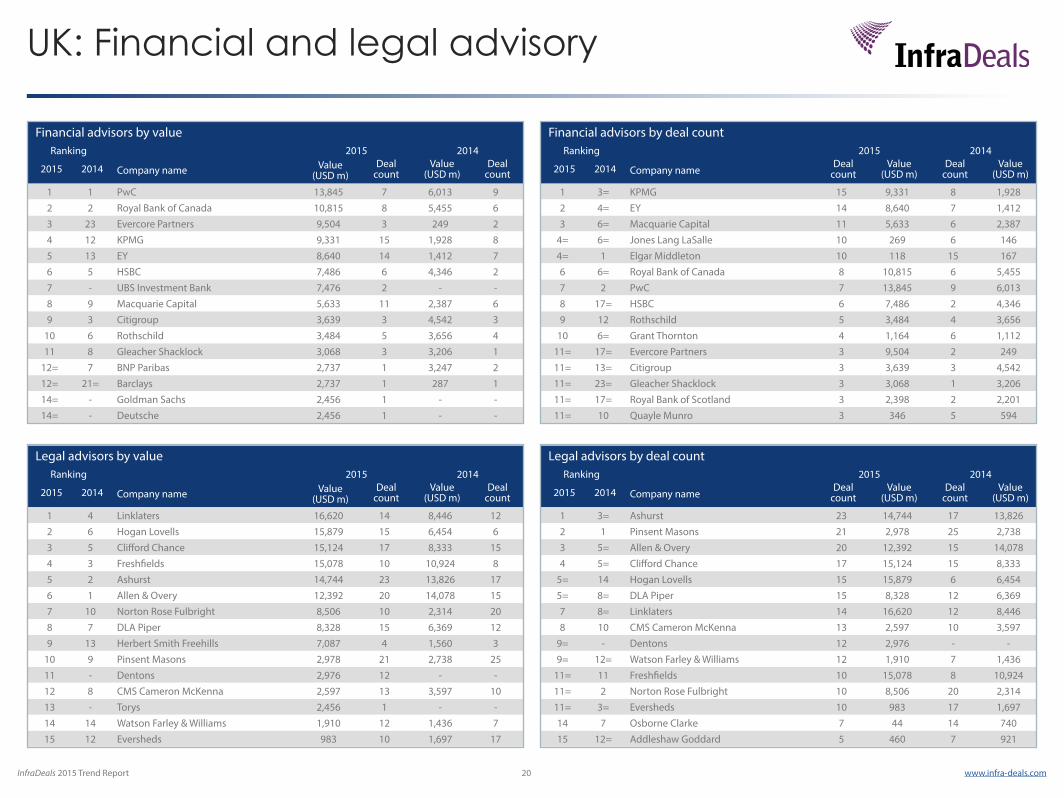
» Ashurst was top legal advisor by number of closed deals. Highlights include acting for the lenders on the GBP 300m Midland Met PF2 and supporting the UK’s Priority Schools PF2 programme to closure. Nearly half of Ashurst’s UK deals were in the renewables sector.
» Linklaters, with USD 16.62bn of closed deals, secured top ranking by deal value. A few mega projects accounted for the ranking including Thames Tideway and Infracapital’s smart meter transaction.
» KPMG (15), EY (14), Macquarie Capital (11) top the financial advisory chart by number of deals, while PwC (USD 13.85bn), RBC (USD 10.82bn) and Evercore (USD 9.50bn) are top firms by value.
» The UK’s highest profile transaction of the year was the Thames Tideway Tunnel. The Bazalgette project company — Allianz Capital Partners, Amber Infrastructure, Dalmore Infrastructure Investments, Swiss Life, and DIF — closed a GBP 2.3bn funding package with a weighted cost of capital of just under 2.5%, achieving one of the UK’s largest ever transactions in the water sector.
» Sponsors have had access to an extremely competitive financing environment in 2015, with a marked reduction in margins. Pricing in the low 100bps over Libor has been recorded by InfraDeals on some transactions. Access to a variety of funding solutions such as project bonds, private placements, institutional investors, infrastructure debt funds and alternative credit enhancement structures have contributed to this competitive environment.
» The financing of Scotland’s much-delayed GBP 330m pipeline of social infrastructure DBFM projects was given approval in 4Q15. The 12 projects were restructured to ensure they could be classified as private sector assets – and not public sector liabilities – under ESA10 rules.
» Notable transactions set to progress in 1Q16 include GIP and Oaktree Capital’s sale of London City Airport which commentators have suggested could fetch up to GBP 1.7bn. Future Fund has instructed Macquarie Capital to advise on the potential sale of its 23.4% stake in Southern Water. And in the greenfield PPP space, the GBP 750m Silvertown Tunnel is expected to launch.
35%
8%
8%22%4%
50%
4%
28%
23%
6%
9%
3%
2014
2015
Other
Environment
Renewables
Power
Social Infrastructure
Transport
Telecoms
UK deals by transaction type
USD
(m)
0
5,000
10,000
15,000
20,000
Q4Q3Q2Q1Q4Q3Q2Q1Q4Q3Q2Q12013 2014 2015
Project Finance
InfraDeals 2015 Trend Report 19 www.infra-deals.com
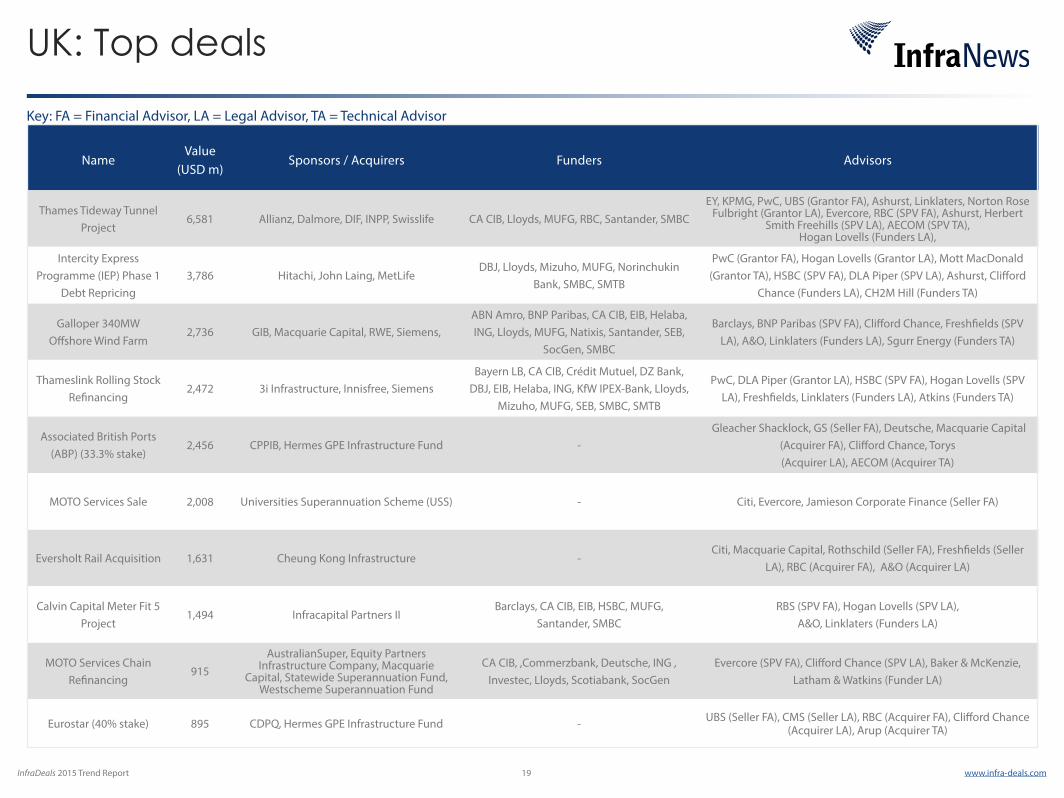
UK: Top deals
NameValue
(USD m)Sponsors / Acquirers Funders Advisors
Thames Tideway Tunnel Project
6,581 Allianz, Dalmore, DIF, INPP, Swisslife CA CIB, Lloyds, MUFG, RBC, Santander, SMBCEY, KPMG, PwC, UBS (Grantor FA), Ashurst, Linklaters, Norton Rose
Fulbright (Grantor LA), Evercore, RBC (SPV FA), Ashurst, Herbert Smith Freehills (SPV LA), AECOM (SPV TA),
Hogan Lovells (Funders LA),
Intercity Express Programme (IEP) Phase 1
Debt Repricing3,786 Hitachi, John Laing, MetLife
DBJ, Lloyds, Mizuho, MUFG, Norinchukin Bank, SMBC, SMTB
PwC (Grantor FA), Hogan Lovells (Grantor LA), Mott MacDonald (Grantor TA), HSBC (SPV FA), DLA Piper (SPV LA), Ashurst, Clifford
Chance (Funders LA), CH2M Hill (Funders TA)
Galloper 340MW Offshore Wind Farm
2,736 GIB, Macquarie Capital, RWE, Siemens, ABN Amro, BNP Paribas, CA CIB, EIB, Helaba, ING, Lloyds, MUFG, Natixis, Santander, SEB,
SocGen, SMBC
Barclays, BNP Paribas (SPV FA), Clifford Chance, Freshfields (SPV LA), A&O, Linklaters (Funders LA), Sgurr Energy (Funders TA)
Thameslink Rolling Stock Refinancing
2,472 3i Infrastructure, Innisfree, SiemensBayern LB, CA CIB, Crédit Mutuel, DZ Bank,
DBJ, EIB, Helaba, ING, KfW IPEX-Bank, Lloyds, Mizuho, MUFG, SEB, SMBC, SMTB
PwC, DLA Piper (Grantor LA), HSBC (SPV FA), Hogan Lovells (SPV LA), Freshfields, Linklaters (Funders LA), Atkins (Funders TA)
Associated British Ports (ABP) (33.3% stake)
2,456 CPPIB, Hermes GPE Infrastructure Fund - Gleacher Shacklock, GS (Seller FA), Deutsche, Macquarie Capital
(Acquirer FA), Clifford Chance, Torys (Acquirer LA), AECOM (Acquirer TA)
MOTO Services Sale 2,008 Universities Superannuation Scheme (USS) - Citi, Evercore, Jamieson Corporate Finance (Seller FA)
Eversholt Rail Acquisition 1,631 Cheung Kong Infrastructure - Citi, Macquarie Capital, Rothschild (Seller FA), Freshfields (Seller
LA), RBC (Acquirer FA), A&O (Acquirer LA)
Calvin Capital Meter Fit 5 Project
1,494 Infracapital Partners IIBarclays, CA CIB, EIB, HSBC, MUFG,
Santander, SMBCRBS (SPV FA), Hogan Lovells (SPV LA),
A&O, Linklaters (Funders LA)
MOTO Services Chain Refinancing
915AustralianSuper, Equity Partners
Infrastructure Company, Macquarie Capital, Statewide Superannuation Fund,
Westscheme Superannuation Fund
CA CIB, ,Commerzbank, Deutsche, ING , Investec, Lloyds, Scotiabank, SocGen
Evercore (SPV FA), Clifford Chance (SPV LA), Baker & McKenzie, Latham & Watkins (Funder LA)
Eurostar (40% stake) 895 CDPQ, Hermes GPE Infrastructure Fund - UBS (Seller FA), CMS (Seller LA), RBC (Acquirer FA), Clifford Chance (Acquirer LA), Arup (Acquirer TA)
Key: FA = Financial Advisor, LA = Legal Advisor, TA = Technical Advisor
InfraDeals 2015 Trend Report 20 www.infra-deals.com
UK: Financial and legal advisory
Financial advisors by valueRanking 2015 2014
2015 2014 Company name Value (USD m)
Deal count
Value (USD m)
Deal count
1 1 PwC 13,845 7 6,013 92 2 Royal Bank of Canada 10,815 8 5,455 63 23 Evercore Partners 9,504 3 249 24 12 KPMG 9,331 15 1,928 85 13 EY 8,640 14 1,412 76 5 HSBC 7,486 6 4,346 27 - UBS Investment Bank 7,476 2 - -8 9 Macquarie Capital 5,633 11 2,387 69 3 Citigroup 3,639 3 4,542 3
10 6 Rothschild 3,484 5 3,656 411 8 Gleacher Shacklock 3,068 3 3,206 1
12= 7 BNP Paribas 2,737 1 3,247 212= 21= Barclays 2,737 1 287 114= - Goldman Sachs 2,456 1 - -14= - Deutsche 2,456 1 - -
Financial advisors by deal countRanking 2015 2014
2015 2014 Company nameDeal
countValue
(USD m)Deal
countValue
(USD m)
1 3= KPMG 15 9,331 8 1,9282 4= EY 14 8,640 7 1,4123 6= Macquarie Capital 11 5,633 6 2,387
4= 6= Jones Lang LaSalle 10 269 6 1464= 1 Elgar Middleton 10 118 15 1676 6= Royal Bank of Canada 8 10,815 6 5,4557 2 PwC 7 13,845 9 6,0138 17= HSBC 6 7,486 2 4,3469 12 Rothschild 5 3,484 4 3,656
10 6= Grant Thornton 4 1,164 6 1,11211= 17= Evercore Partners 3 9,504 2 24911= 13= Citigroup 3 3,639 3 4,54211= 23= Gleacher Shacklock 3 3,068 1 3,20611= 17= Royal Bank of Scotland 3 2,398 2 2,20111= 10 Quayle Munro 3 346 5 594
Legal advisors by valueRanking 2015 2014
2015 2014 Company name Value (USD m)
Deal count
Value (USD m)
Deal count
1 4 Linklaters 16,620 14 8,446 122 6 Hogan Lovells 15,879 15 6,454 63 5 Clifford Chance 15,124 17 8,333 154 3 Freshfields 15,078 10 10,924 85 2 Ashurst 14,744 23 13,826 176 1 Allen & Overy 12,392 20 14,078 157 10 Norton Rose Fulbright 8,506 10 2,314 208 7 DLA Piper 8,328 15 6,369 129 13 Herbert Smith Freehills 7,087 4 1,560 3
10 9 Pinsent Masons 2,978 21 2,738 2511 - Dentons 2,976 12 - -12 8 CMS Cameron McKenna 2,597 13 3,597 1013 - Torys 2,456 1 - -14 14 Watson Farley & Williams 1,910 12 1,436 715 12 Eversheds 983 10 1,697 17
Legal advisors by deal countRanking 2015 2014
2015 2014 Company nameDeal
countValue
(USD m)Deal
countValue
(USD m)
1 3= Ashurst 23 14,744 17 13,8262 1 Pinsent Masons 21 2,978 25 2,7383 5= Allen & Overy 20 12,392 15 14,0784 5= Clifford Chance 17 15,124 15 8,333
5= 14 Hogan Lovells 15 15,879 6 6,4545= 8= DLA Piper 15 8,328 12 6,3697 8= Linklaters 14 16,620 12 8,4468 10 CMS Cameron McKenna 13 2,597 10 3,597
9= - Dentons 12 2,976 - -9= 12= Watson Farley & Williams 12 1,910 7 1,436
11= 11 Freshfields 10 15,078 8 10,92411= 2 Norton Rose Fulbright 10 8,506 20 2,31411= 3= Eversheds 10 983 17 1,69714 7 Osborne Clarke 7 44 14 74015 12= Addleshaw Goddard 5 460 7 921
InfraDeals 2015 Trend Report 21 www.infra-deals.com
UK: Bank and capital market financing
Bank debt providers by valueRanking 2015 2014
2015 2014 Company name Value (USD m)
Deal count
Value (USD m)
Deal count
1 1 Mitsubishi UFJ Financial Group 1,758 9 1,464 122 3 Sumitomo Mitsui Banking Corporation 1,491 10 1,082 93 4 Lloyds 1,445 13 815 104 2 Royal Bank of Scotland 1,327 15 1,170 145 5 Crédit Agricole 1,175 11 713 66 16 Santander 1,142 13 362 77 14 Barclays 943 12 391 78 8 KfW IPEX 884 10 602 109 7 Commonwealth Bank of Australia 865 9 647 5
10 11 ING 732 9 524 511 23 Bayern LB 508 9 179 312 6 RBC 437 3 658 613 - Deutsche 422 4 - -
14= 10 Nord LB 416 6 575 1014= 15 Mizuho 416 3 382 2
Bank debt providers by deal countRanking 2015 2014
2015 2014 Company nameDeal
countValue
(USD m)Deal
countValue
(USD m)
1 1 Royal Bank of Scotland 15 1,327 14 1,1702= 3= Lloyds 13 1,445 10 8152= 8= Santander 13 1,142 7 3624 8= Barclays 12 943 7 3915 10= Crédit Agricole 11 1,175 6 713
6= 6 Sumitomo Mitsui Banking Corporation 10 1,491 9 1,0826= 3= KfW IPEX 10 884 10 6028= 2 Mitsubishi UFJ Financial Group 9 1,758 12 1,4648= 13= Commonwealth Bank of Australia 9 865 5 6478= 13= ING Group 9 732 5 5248= 19= Bayern LB 9 508 3 179
12= 3= Nord LB 6 405 10 57512= 19= Investec 6 355 3 10114 13= National Australia Bank 5 373 5 24515 24= Deutsche 4 422 2 120
Capital market debt providers by valueRanking 2015 2014
2015 2014 Company name Value (USD m)
Deal count
Value (USD m)
Deal count
1 7 Lloyds 309 3 349 42 3 HSBC 229 2 525 53 1 Royal Bank of Scotland 187 2 581 5
4= - Deutsche 175 2 - -4= 16 Mitsubishi UFJ Financial Group 175 1 75 14= 11 Sumitomo Mitsui Banking Corporation 175 1 148 27 - Credit Suisse 143 1 - -8 10 Santander 133 1 158 29 - IDCM 105 2 - -
10= - Morgan Stanley 54 1 - -10= 12 National Australia Bank 54 1 117 210= 4 Royal Bank of Canada 54 1 464 413 - TradeRisks Limited 38 1 - -
14= - Commerzbank 32 1 - -14= 5 Crédit Agricole 32 1 410 4
Capital market debt providers by deal countRanking 2015 2014
2015 2014 Company nameDeal
countValue
(USD m)Deal
countValue
(USD m)
1 4= Lloyds 3 309 4 3492= 1= HSBC 2 229 5 5252= 1= Royal Bank of Scotland 2 187 5 5812= - Deutsche 2 175 - -2= - IDCM 2 105 - -6= 13= Mitsubishi UFJ Financial Group 1 175 1 756= 8= Sumitomo Mitsui Banking Corporation 1 175 2 1486= - Credit Suisse 1 143 - -6= 8= Santander 1 133 158 26= - Morgan Stanley 1 54 - -6= 8= National Australia Bank 1 54 117 26= 4= Royal Bank of Canada 1 54 464 46= - TradeRisks Limited 1 38 - -6= - Commerzbank 1 32 - -6= 4= Crédit Agricole 1 32 4 410
InfraDeals 2015 Trend Report 22 www.infra-deals.com
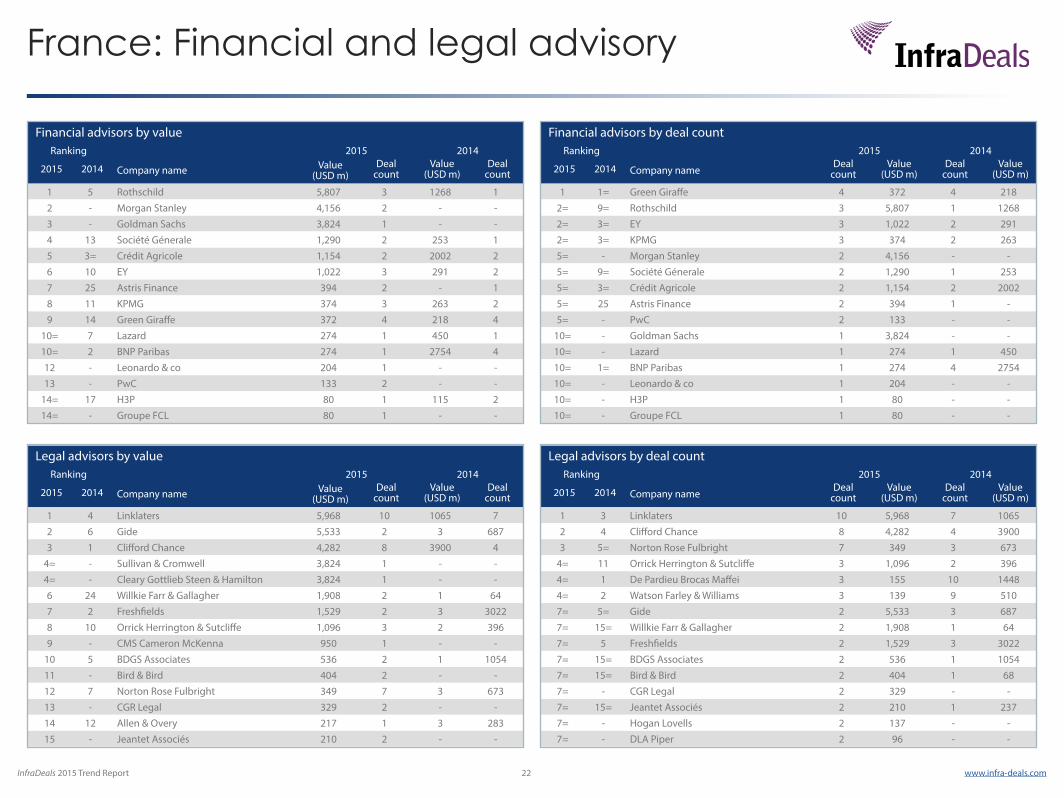
France: Financial and legal advisory
Financial advisors by valueRanking 2015 2014
2015 2014 Company name Value (USD m)
Deal count
Value (USD m)
Deal count
1 5 Rothschild 5,807 3 1268 12 - Morgan Stanley 4,156 2 - -3 - Goldman Sachs 3,824 1 - -4 13 Société Génerale 1,290 2 253 15 3= Crédit Agricole 1,154 2 2002 26 10 EY 1,022 3 291 27 25 Astris Finance 394 2 - 18 11 KPMG 374 3 263 29 14 Green Giraffe 372 4 218 4
10= 7 Lazard 274 1 450 110= 2 BNP Paribas 274 1 2754 412 - Leonardo & co 204 1 - -13 - PwC 133 2 - -
14= 17 H3P 80 1 115 214= - Groupe FCL 80 1 - -
Financial advisors by deal countRanking 2015 2014
2015 2014 Company nameDeal
countValue
(USD m)Deal
countValue
(USD m)
1 1= Green Giraffe 4 372 4 2182= 9= Rothschild 3 5,807 1 12682= 3= EY 3 1,022 2 2912= 3= KPMG 3 374 2 2635= - Morgan Stanley 2 4,156 - -5= 9= Société Génerale 2 1,290 1 2535= 3= Crédit Agricole 2 1,154 2 20025= 25 Astris Finance 2 394 1 -5= - PwC 2 133 - -
10= - Goldman Sachs 1 3,824 - -10= - Lazard 1 274 1 45010= 1= BNP Paribas 1 274 4 275410= - Leonardo & co 1 204 - -10= - H3P 1 80 - -10= - Groupe FCL 1 80 - -
Legal advisors by valueRanking 2015 2014
2015 2014 Company name Value (USD m)
Deal count
Value (USD m)
Deal count
1 4 Linklaters 5,968 10 1065 72 6 Gide 5,533 2 3 6873 1 Clifford Chance 4,282 8 3900 4
4= - Sullivan & Cromwell 3,824 1 - -4= - Cleary Gottlieb Steen & Hamilton 3,824 1 - -6 24 Willkie Farr & Gallagher 1,908 2 1 647 2 Freshfields 1,529 2 3 30228 10 Orrick Herrington & Sutcliffe 1,096 3 2 3969 - CMS Cameron McKenna 950 1 - -
10 5 BDGS Associates 536 2 1 105411 - Bird & Bird 404 2 - -12 7 Norton Rose Fulbright 349 7 3 67313 - CGR Legal 329 2 - -14 12 Allen & Overy 217 1 3 28315 - Jeantet Associés 210 2 - -
Legal advisors by deal countRanking 2015 2014
2015 2014 Company nameDeal
countValue
(USD m)Deal
countValue
(USD m)
1 3 Linklaters 10 5,968 7 10652 4 Clifford Chance 8 4,282 4 39003 5= Norton Rose Fulbright 7 349 3 673
4= 11 Orrick Herrington & Sutcliffe 3 1,096 2 3964= 1 De Pardieu Brocas Maffei 3 155 10 14484= 2 Watson Farley & Williams 3 139 9 5107= 5= Gide 2 5,533 3 6877= 15= Willkie Farr & Gallagher 2 1,908 1 647= 5 Freshfields 2 1,529 3 30227= 15= BDGS Associates 2 536 1 10547= 15= Bird & Bird 2 404 1 687= - CGR Legal 2 329 - -7= 15= Jeantet Associés 2 210 1 2377= - Hogan Lovells 2 137 - -7= - DLA Piper 2 96 - -
InfraDeals 2015 Trend Report 23 www.infra-deals.com
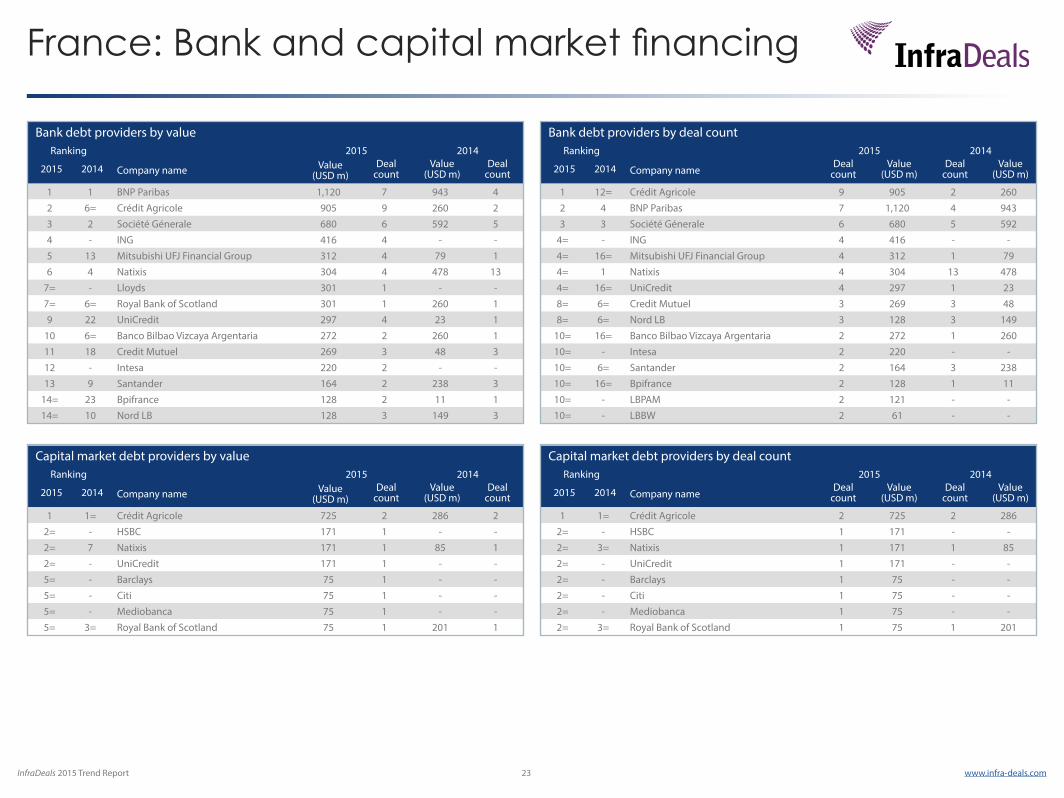
France: Bank and capital market financing
Bank debt providers by valueRanking 2015 2014
2015 2014 Company name Value (USD m)
Deal count
Value (USD m)
Deal count
1 1 BNP Paribas 1,120 7 943 42 6= Crédit Agricole 905 9 260 23 2 Société Génerale 680 6 592 54 - ING 416 4 - -5 13 Mitsubishi UFJ Financial Group 312 4 79 16 4 Natixis 304 4 478 13
7= - Lloyds 301 1 - -7= 6= Royal Bank of Scotland 301 1 260 19 22 UniCredit 297 4 23 1
10 6= Banco Bilbao Vizcaya Argentaria 272 2 260 111 18 Credit Mutuel 269 3 48 312 - Intesa 220 2 - -13 9 Santander 164 2 238 3
14= 23 Bpifrance 128 2 11 114= 10 Nord LB 128 3 149 3
Bank debt providers by deal countRanking 2015 2014
2015 2014 Company nameDeal
countValue
(USD m)Deal
countValue
(USD m)
1 12= Crédit Agricole 9 905 2 2602 4 BNP Paribas 7 1,120 4 9433 3 Société Génerale 6 680 5 592
4= - ING 4 416 - -4= 16= Mitsubishi UFJ Financial Group 4 312 1 794= 1 Natixis 4 304 13 4784= 16= UniCredit 4 297 1 238= 6= Credit Mutuel 3 269 3 488= 6= Nord LB 3 128 3 149
10= 16= Banco Bilbao Vizcaya Argentaria 2 272 1 26010= - Intesa 2 220 - -10= 6= Santander 2 164 3 23810= 16= Bpifrance 2 128 1 1110= - LBPAM 2 121 - -10= - LBBW 2 61 - -
Capital market debt providers by valueRanking 2015 2014
2015 2014 Company name Value (USD m)
Deal count
Value (USD m)
Deal count
1 1= Crédit Agricole 725 2 286 22= - HSBC 171 1 - -2= 7 Natixis 171 1 85 12= - UniCredit 171 1 - -5= - Barclays 75 1 - -5= - Citi 75 1 - -5= - Mediobanca 75 1 - -5= 3= Royal Bank of Scotland 75 1 201 1
Capital market debt providers by deal countRanking 2015 2014
2015 2014 Company nameDeal
countValue
(USD m)Deal
countValue
(USD m)
1 1= Crédit Agricole 2 725 2 2862= - HSBC 1 171 - -2= 3= Natixis 1 171 1 852= - UniCredit 1 171 - -2= - Barclays 1 75 - -2= - Citi 1 75 - -2= - Mediobanca 1 75 - -2= 3= Royal Bank of Scotland 1 75 1 201
InfraDeals 2015 Trend Report 24 www.infra-deals.com
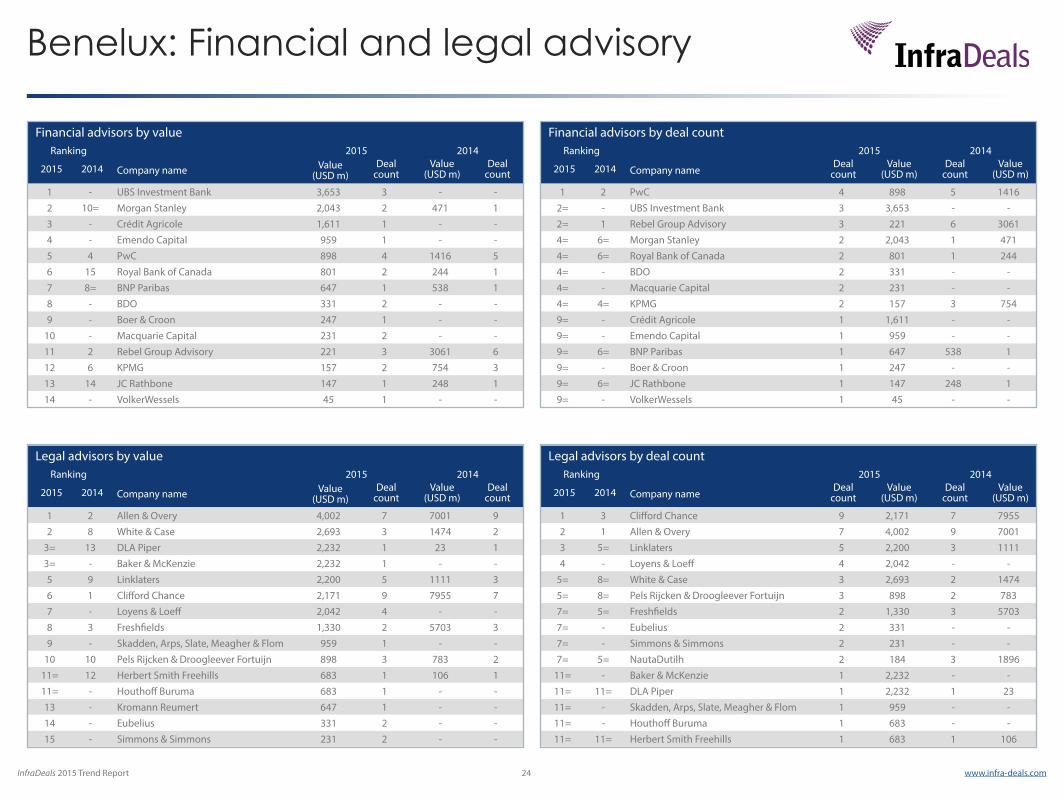
Benelux: Financial and legal advisory
Financial advisors by valueRanking 2015 2014
2015 2014 Company name Value (USD m)
Deal count
Value (USD m)
Deal count
1 - UBS Investment Bank 3,653 3 - -2 10= Morgan Stanley 2,043 2 471 13 - Crédit Agricole 1,611 1 - -4 - Emendo Capital 959 1 - -5 4 PwC 898 4 1416 56 15 Royal Bank of Canada 801 2 244 17 8= BNP Paribas 647 1 538 18 - BDO 331 2 - -9 - Boer & Croon 247 1 - -
10 - Macquarie Capital 231 2 - -11 2 Rebel Group Advisory 221 3 3061 612 6 KPMG 157 2 754 313 14 JC Rathbone 147 1 248 114 - VolkerWessels 45 1 - -
Financial advisors by deal countRanking 2015 2014
2015 2014 Company nameDeal
countValue
(USD m)Deal
countValue
(USD m)
1 2 PwC 4 898 5 14162= - UBS Investment Bank 3 3,653 - -2= 1 Rebel Group Advisory 3 221 6 30614= 6= Morgan Stanley 2 2,043 1 4714= 6= Royal Bank of Canada 2 801 1 2444= - BDO 2 331 - -4= - Macquarie Capital 2 231 - -4= 4= KPMG 2 157 3 7549= - Crédit Agricole 1 1,611 - -9= - Emendo Capital 1 959 - -9= 6= BNP Paribas 1 647 538 19= - Boer & Croon 1 247 - -9= 6= JC Rathbone 1 147 248 19= - VolkerWessels 1 45 - -
Legal advisors by valueRanking 2015 2014
2015 2014 Company name Value (USD m)
Deal count
Value (USD m)
Deal count
1 2 Allen & Overy 4,002 7 7001 92 8 White & Case 2,693 3 1474 2
3= 13 DLA Piper 2,232 1 23 13= - Baker & McKenzie 2,232 1 - -5 9 Linklaters 2,200 5 1111 36 1 Clifford Chance 2,171 9 7955 77 - Loyens & Loeff 2,042 4 - -8 3 Freshfields 1,330 2 5703 39 - Skadden, Arps, Slate, Meagher & Flom 959 1 - -
10 10 Pels Rijcken & Droogleever Fortuijn 898 3 783 211= 12 Herbert Smith Freehills 683 1 106 111= - Houthoff Buruma 683 1 - -13 - Kromann Reumert 647 1 - -14 - Eubelius 331 2 - -15 - Simmons & Simmons 231 2 - -
Legal advisors by deal countRanking 2015 2014
2015 2014 Company nameDeal
countValue
(USD m)Deal
countValue
(USD m)
1 3 Clifford Chance 9 2,171 7 79552 1 Allen & Overy 7 4,002 9 70013 5= Linklaters 5 2,200 3 11114 - Loyens & Loeff 4 2,042 - -
5= 8= White & Case 3 2,693 2 14745= 8= Pels Rijcken & Droogleever Fortuijn 3 898 2 7837= 5= Freshfields 2 1,330 3 57037= - Eubelius 2 331 - -7= - Simmons & Simmons 2 231 - -7= 5= NautaDutilh 2 184 3 1896
11= - Baker & McKenzie 1 2,232 - -11= 11= DLA Piper 1 2,232 1 2311= - Skadden, Arps, Slate, Meagher & Flom 1 959 - -11= - Houthoff Buruma 1 683 - -11= 11= Herbert Smith Freehills 1 683 1 106
InfraDeals 2015 Trend Report 25 www.infra-deals.com
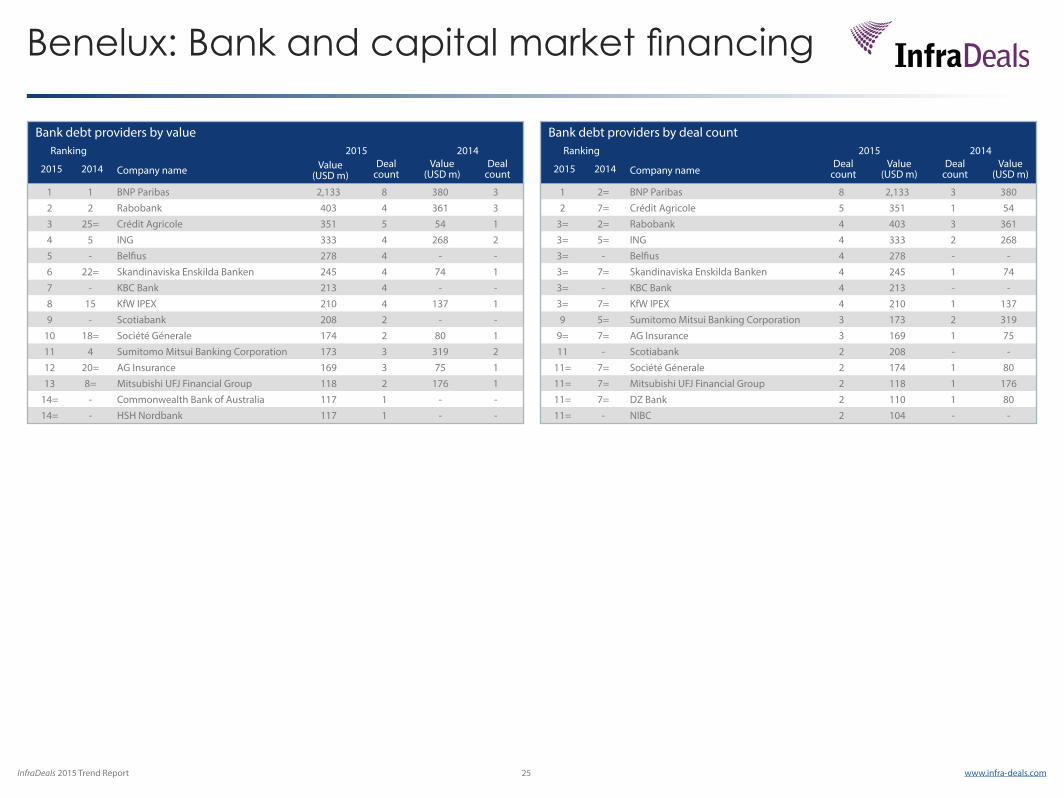
Benelux: Bank and capital market financing
Bank debt providers by valueRanking 2015 2014
2015 2014 Company name Value (USD m)
Deal count
Value (USD m)
Deal count
1 1 BNP Paribas 2,133 8 380 32 2 Rabobank 403 4 361 33 25= Crédit Agricole 351 5 54 14 5 ING 333 4 268 25 - Belfius 278 4 - -6 22= Skandinaviska Enskilda Banken 245 4 74 17 - KBC Bank 213 4 - -8 15 KfW IPEX 210 4 137 19 - Scotiabank 208 2 - -
10 18= Société Génerale 174 2 80 111 4 Sumitomo Mitsui Banking Corporation 173 3 319 212 20= AG Insurance 169 3 75 113 8= Mitsubishi UFJ Financial Group 118 2 176 1
14= - Commonwealth Bank of Australia 117 1 - -14= - HSH Nordbank 117 1 - -
Bank debt providers by deal countRanking 2015 2014
2015 2014 Company nameDeal
countValue
(USD m)Deal
countValue
(USD m)
1 2= BNP Paribas 8 2,133 3 3802 7= Crédit Agricole 5 351 1 54
3= 2= Rabobank 4 403 3 3613= 5= ING 4 333 2 2683= - Belfius 4 278 - -3= 7= Skandinaviska Enskilda Banken 4 245 1 743= - KBC Bank 4 213 - -3= 7= KfW IPEX 4 210 1 1379 5= Sumitomo Mitsui Banking Corporation 3 173 2 319
9= 7= AG Insurance 3 169 1 7511 - Scotiabank 2 208 - -
11= 7= Société Génerale 2 174 1 8011= 7= Mitsubishi UFJ Financial Group 2 118 1 17611= 7= DZ Bank 2 110 1 8011= - NIBC 2 104 - -
InfraDeals 2015 Trend Report 26 www.infra-deals.com
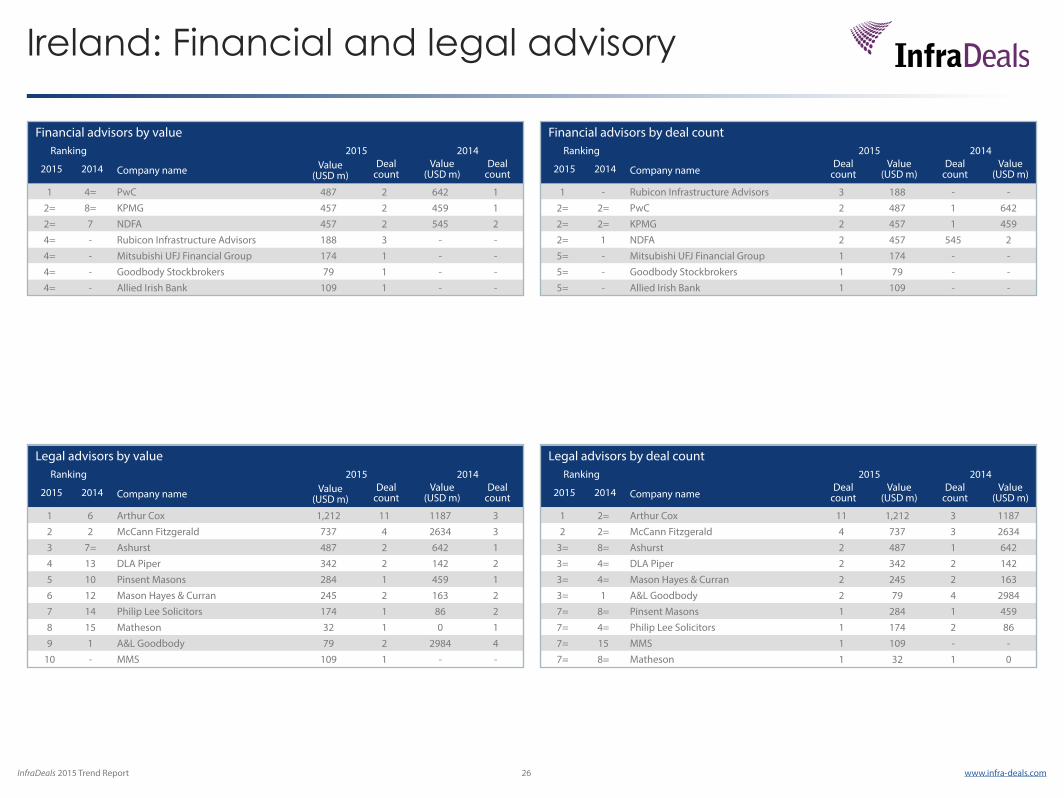
Ireland: Financial and legal advisory
Financial advisors by valueRanking 2015 2014
2015 2014 Company name Value (USD m)
Deal count
Value (USD m)
Deal count
1 4= PwC 487 2 642 12= 8= KPMG 457 2 459 12= 7 NDFA 457 2 545 24= - Rubicon Infrastructure Advisors 188 3 - -4= - Mitsubishi UFJ Financial Group 174 1 - -4= - Goodbody Stockbrokers 79 1 - -4= - Allied Irish Bank 109 1 - -
Financial advisors by deal countRanking 2015 2014
2015 2014 Company nameDeal
countValue
(USD m)Deal
countValue
(USD m)
1 - Rubicon Infrastructure Advisors 3 188 - -2= 2= PwC 2 487 1 6422= 2= KPMG 2 457 1 4592= 1 NDFA 2 457 545 25= - Mitsubishi UFJ Financial Group 1 174 - -5= - Goodbody Stockbrokers 1 79 - -5= - Allied Irish Bank 1 109 - -
Legal advisors by valueRanking 2015 2014
2015 2014 Company name Value (USD m)
Deal count
Value (USD m)
Deal count
1 6 Arthur Cox 1,212 11 1187 32 2 McCann Fitzgerald 737 4 2634 33 7= Ashurst 487 2 642 14 13 DLA Piper 342 2 142 25 10 Pinsent Masons 284 1 459 16 12 Mason Hayes & Curran 245 2 163 27 14 Philip Lee Solicitors 174 1 86 28 15 Matheson 32 1 0 19 1 A&L Goodbody 79 2 2984 4
10 - MMS 109 1 - -
Legal advisors by deal countRanking 2015 2014
2015 2014 Company nameDeal
countValue
(USD m)Deal
countValue
(USD m)
1 2= Arthur Cox 11 1,212 3 11872 2= McCann Fitzgerald 4 737 3 2634
3= 8= Ashurst 2 487 1 6423= 4= DLA Piper 2 342 2 1423= 4= Mason Hayes & Curran 2 245 2 1633= 1 A&L Goodbody 2 79 4 29847= 8= Pinsent Masons 1 284 1 4597= 4= Philip Lee Solicitors 1 174 2 867= 15 MMS 1 109 - -7= 8= Matheson 1 32 1 0
InfraDeals 2015 Trend Report 27 www.infra-deals.com
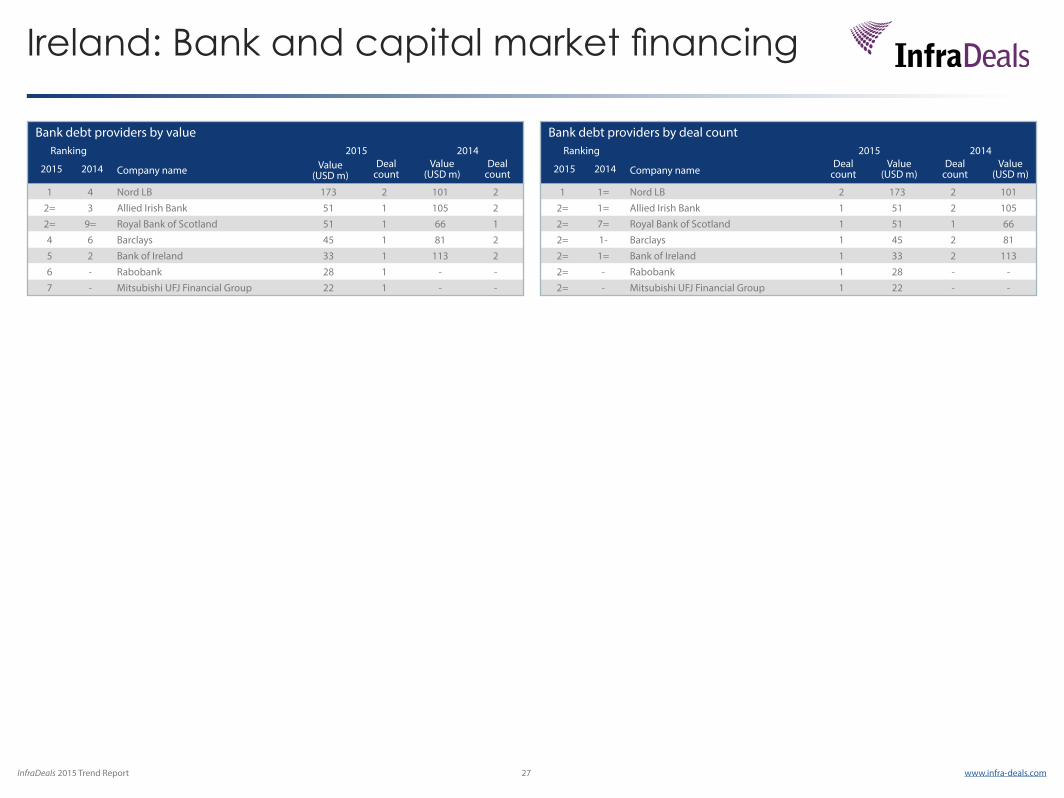
Ireland: Bank and capital market financing
Bank debt providers by valueRanking 2015 2014
2015 2014 Company name Value (USD m)
Deal count
Value (USD m)
Deal count
1 4 Nord LB 173 2 101 22= 3 Allied Irish Bank 51 1 105 22= 9= Royal Bank of Scotland 51 1 66 14 6 Barclays 45 1 81 25 2 Bank of Ireland 33 1 113 26 - Rabobank 28 1 - -7 - Mitsubishi UFJ Financial Group 22 1 - -
Bank debt providers by deal countRanking 2015 2014
2015 2014 Company nameDeal
countValue
(USD m)Deal
countValue
(USD m)
1 1= Nord LB 2 173 2 1012= 1= Allied Irish Bank 1 51 2 1052= 7= Royal Bank of Scotland 1 51 1 662= 1- Barclays 1 45 2 812= 1= Bank of Ireland 1 33 2 1132= - Rabobank 1 28 - -2= - Mitsubishi UFJ Financial Group 1 22 - -
InfraDeals 2015 Trend Report 28 www.infra-deals.com
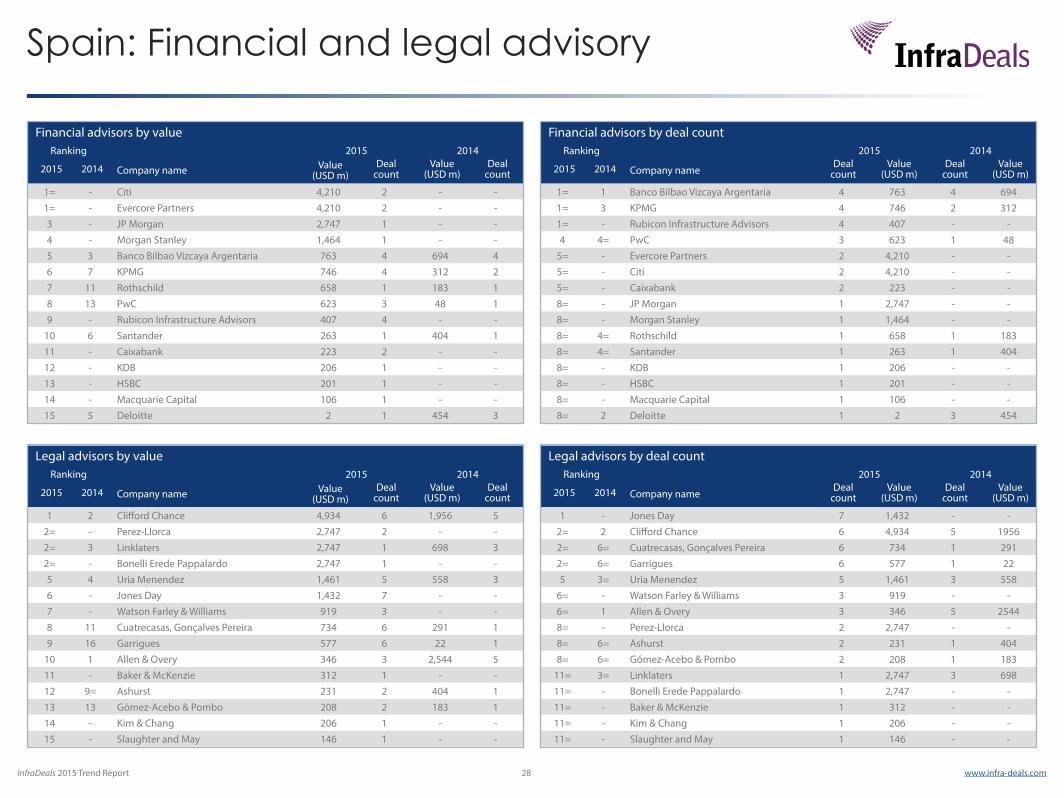
Spain: Financial and legal advisory
Financial advisors by valueRanking 2015 2014
2015 2014 Company name Value (USD m)
Deal count
Value (USD m)
Deal count
1= - Citi 4,210 2 - -1= - Evercore Partners 4,210 2 - -3 - JP Morgan 2,747 1 - -4 - Morgan Stanley 1,464 1 - -5 3 Banco Bilbao Vizcaya Argentaria 763 4 694 46 7 KPMG 746 4 312 27 11 Rothschild 658 1 183 18 13 PwC 623 3 48 19 - Rubicon Infrastructure Advisors 407 4 - -
10 6 Santander 263 1 404 111 - Caixabank 223 2 - -12 - KDB 206 1 - -13 - HSBC 201 1 - -14 - Macquarie Capital 106 1 - -15 5 Deloitte 2 1 454 3
Financial advisors by deal countRanking 2015 2014
2015 2014 Company nameDeal
countValue
(USD m)Deal
countValue
(USD m)
1= 1 Banco Bilbao Vizcaya Argentaria 4 763 4 6941= 3 KPMG 4 746 2 3121= - Rubicon Infrastructure Advisors 4 407 - -4 4= PwC 3 623 1 48
5= - Evercore Partners 2 4,210 - -5= - Citi 2 4,210 - -5= - Caixabank 2 223 - -8= - JP Morgan 1 2,747 - -8= - Morgan Stanley 1 1,464 - -8= 4= Rothschild 1 658 1 1838= 4= Santander 1 263 1 4048= - KDB 1 206 - -8= - HSBC 1 201 - -8= - Macquarie Capital 1 106 - -8= 2 Deloitte 1 2 3 454
Legal advisors by valueRanking 2015 2014
2015 2014 Company name Value (USD m)
Deal count
Value (USD m)
Deal count
1 2 Clifford Chance 4,934 6 1,956 52= - Perez-Llorca 2,747 2 - -2= 3 Linklaters 2,747 1 698 32= - Bonelli Erede Pappalardo 2,747 1 - -5 4 Uria Menendez 1,461 5 558 36 - Jones Day 1,432 7 - -7 - Watson Farley & Williams 919 3 - -8 11 Cuatrecasas, Gonçalves Pereira 734 6 291 19 16 Garrigues 577 6 22 1
10 1 Allen & Overy 346 3 2,544 511 - Baker & McKenzie 312 1 - -12 9= Ashurst 231 2 404 113 13 Gómez-Acebo & Pombo 208 2 183 114 - Kim & Chang 206 1 - -15 - Slaughter and May 146 1 - -
Legal advisors by deal countRanking 2015 2014
2015 2014 Company nameDeal
countValue
(USD m)Deal
countValue
(USD m)
1 - Jones Day 7 1,432 - -2= 2 Clifford Chance 6 4,934 5 19562= 6= Cuatrecasas, Gonçalves Pereira 6 734 1 2912= 6= Garrigues 6 577 1 225 3= Uria Menendez 5 1,461 3 558
6= - Watson Farley & Williams 3 919 - -6= 1 Allen & Overy 3 346 5 25448= - Perez-Llorca 2 2,747 - -8= 6= Ashurst 2 231 1 4048= 6= Gómez-Acebo & Pombo 2 208 1 183
11= 3= Linklaters 1 2,747 3 69811= - Bonelli Erede Pappalardo 1 2,747 - -11= - Baker & McKenzie 1 312 - -11= - Kim & Chang 1 206 - -11= - Slaughter and May 1 146 - -
InfraDeals 2015 Trend Report 29 www.infra-deals.com
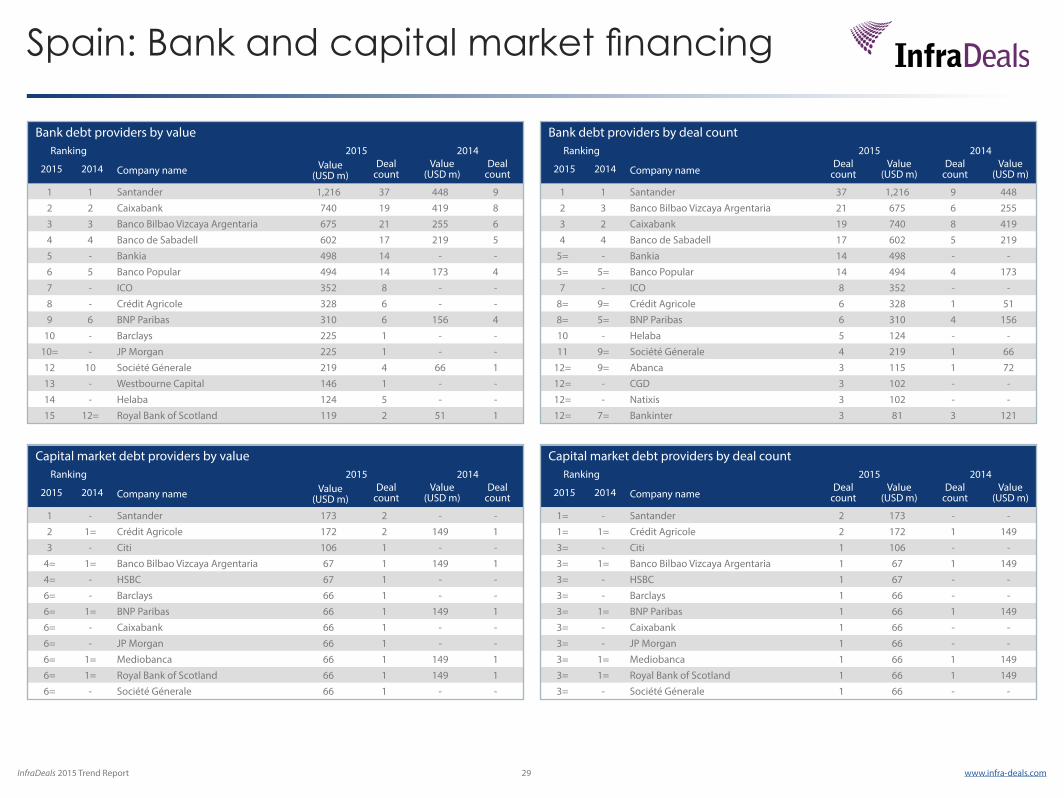
Spain: Bank and capital market financing
Bank debt providers by valueRanking 2015 2014
2015 2014 Company name Value (USD m)
Deal count
Value (USD m)
Deal count
1 1 Santander 1,216 37 448 92 2 Caixabank 740 19 419 83 3 Banco Bilbao Vizcaya Argentaria 675 21 255 64 4 Banco de Sabadell 602 17 219 55 - Bankia 498 14 - -6 5 Banco Popular 494 14 173 47 - ICO 352 8 - -8 - Crédit Agricole 328 6 - -9 6 BNP Paribas 310 6 156 4
10 - Barclays 225 1 - -10= - JP Morgan 225 1 - -12 10 Société Génerale 219 4 66 113 - Westbourne Capital 146 1 - -14 - Helaba 124 5 - -15 12= Royal Bank of Scotland 119 2 51 1
Bank debt providers by deal countRanking 2015 2014
2015 2014 Company nameDeal
countValue
(USD m)Deal
countValue
(USD m)
1 1 Santander 37 1,216 9 4482 3 Banco Bilbao Vizcaya Argentaria 21 675 6 2553 2 Caixabank 19 740 8 4194 4 Banco de Sabadell 17 602 5 219
5= - Bankia 14 498 - -5= 5= Banco Popular 14 494 4 1737 - ICO 8 352 - -
8= 9= Crédit Agricole 6 328 1 518= 5= BNP Paribas 6 310 4 15610 - Helaba 5 124 - -11 9= Société Génerale 4 219 1 66
12= 9= Abanca 3 115 1 7212= - CGD 3 102 - -12= - Natixis 3 102 - -12= 7= Bankinter 3 81 3 121
Capital market debt providers by valueRanking 2015 2014
2015 2014 Company name Value (USD m)
Deal count
Value (USD m)
Deal count
1 - Santander 173 2 - -2 1= Crédit Agricole 172 2 149 13 - Citi 106 1 - -
4= 1= Banco Bilbao Vizcaya Argentaria 67 1 149 14= - HSBC 67 1 - -6= - Barclays 66 1 - -6= 1= BNP Paribas 66 1 149 16= - Caixabank 66 1 - -6= - JP Morgan 66 1 - -6= 1= Mediobanca 66 1 149 16= 1= Royal Bank of Scotland 66 1 149 16= - Société Génerale 66 1 - -
Capital market debt providers by deal countRanking 2015 2014
2015 2014 Company nameDeal
countValue
(USD m)Deal
countValue
(USD m)
1= - Santander 2 173 - -1= 1= Crédit Agricole 2 172 1 1493= - Citi 1 106 - -3= 1= Banco Bilbao Vizcaya Argentaria 1 67 1 1493= - HSBC 1 67 - -3= - Barclays 1 66 - -3= 1= BNP Paribas 1 66 1 1493= - Caixabank 1 66 - -3= - JP Morgan 1 66 - -3= 1= Mediobanca 1 66 1 1493= 1= Royal Bank of Scotland 1 66 1 1493= - Société Génerale 1 66 - -
InfraDeals 2015 Trend Report 30 www.infra-deals.com
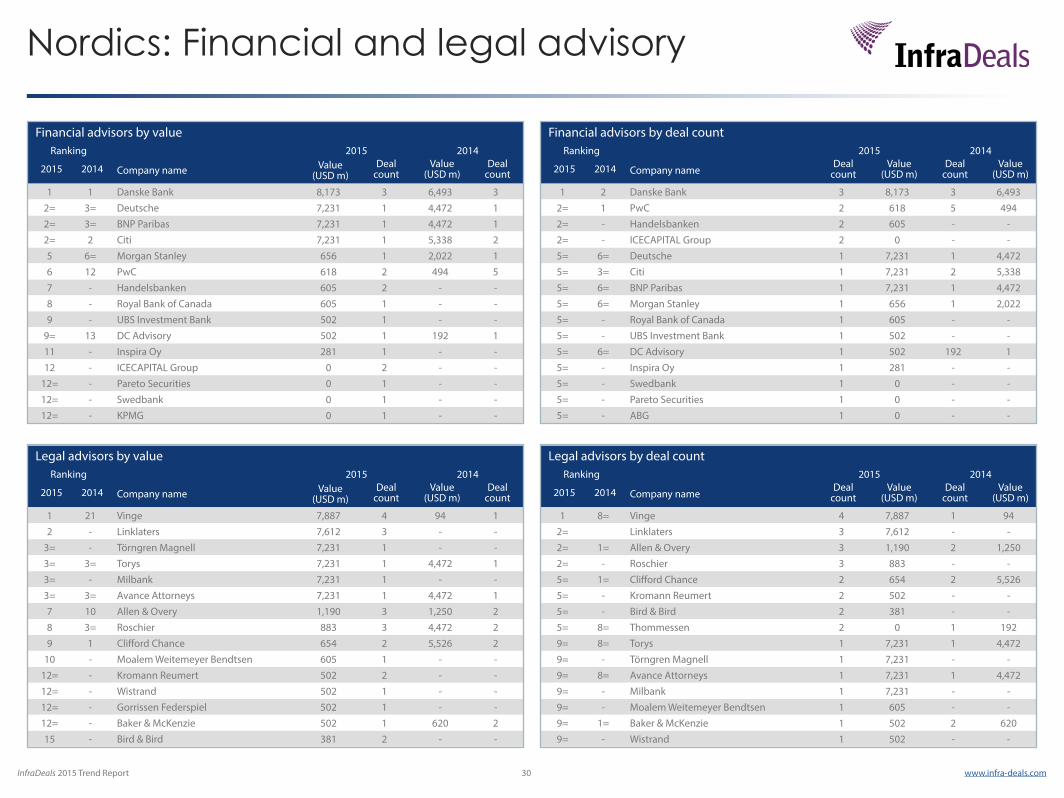
Nordics: Financial and legal advisory
Financial advisors by valueRanking 2015 2014
2015 2014 Company name Value (USD m)
Deal count
Value (USD m)
Deal count
1 1 Danske Bank 8,173 3 6,493 32= 3= Deutsche 7,231 1 4,472 12= 3= BNP Paribas 7,231 1 4,472 12= 2 Citi 7,231 1 5,338 25 6= Morgan Stanley 656 1 2,022 16 12 PwC 618 2 494 57 - Handelsbanken 605 2 - -8 - Royal Bank of Canada 605 1 - -9 - UBS Investment Bank 502 1 - -
9= 13 DC Advisory 502 1 192 111 - Inspira Oy 281 1 - -12 - ICECAPITAL Group 0 2 - -
12= - Pareto Securities 0 1 - -12= - Swedbank 0 1 - -12= - KPMG 0 1 - -
Financial advisors by deal countRanking 2015 2014
2015 2014 Company nameDeal
countValue
(USD m)Deal
countValue
(USD m)
1 2 Danske Bank 3 8,173 3 6,4932= 1 PwC 2 618 5 4942= - Handelsbanken 2 605 - -2= - ICECAPITAL Group 2 0 - -5= 6= Deutsche 1 7,231 1 4,4725= 3= Citi 1 7,231 2 5,3385= 6= BNP Paribas 1 7,231 1 4,4725= 6= Morgan Stanley 1 656 1 2,0225= - Royal Bank of Canada 1 605 - -5= - UBS Investment Bank 1 502 - -5= 6= DC Advisory 1 502 192 15= - Inspira Oy 1 281 - -5= - Swedbank 1 0 - -5= - Pareto Securities 1 0 - -5= - ABG 1 0 - -
Legal advisors by valueRanking 2015 2014
2015 2014 Company name Value (USD m)
Deal count
Value (USD m)
Deal count
1 21 Vinge 7,887 4 94 12 - Linklaters 7,612 3 - -
3= - Törngren Magnell 7,231 1 - -3= 3= Torys 7,231 1 4,472 13= - Milbank 7,231 1 - -3= 3= Avance Attorneys 7,231 1 4,472 17 10 Allen & Overy 1,190 3 1,250 28 3= Roschier 883 3 4,472 29 1 Clifford Chance 654 2 5,526 2
10 - Moalem Weitemeyer Bendtsen 605 1 - -12= - Kromann Reumert 502 2 - -12= - Wistrand 502 1 - -12= - Gorrissen Federspiel 502 1 - -12= - Baker & McKenzie 502 1 620 215 - Bird & Bird 381 2 - -
Legal advisors by deal countRanking 2015 2014
2015 2014 Company nameDeal
countValue
(USD m)Deal
countValue
(USD m)
1 8= Vinge 4 7,887 1 942= Linklaters 3 7,612 - -2= 1= Allen & Overy 3 1,190 2 1,2502= - Roschier 3 883 - -5= 1= Clifford Chance 2 654 2 5,5265= - Kromann Reumert 2 502 - -5= - Bird & Bird 2 381 - -5= 8= Thommessen 2 0 1 1929= 8= Torys 1 7,231 1 4,4729= - Törngren Magnell 1 7,231 - -9= 8= Avance Attorneys 1 7,231 1 4,4729= - Milbank 1 7,231 - -9= - Moalem Weitemeyer Bendtsen 1 605 - -9= 1= Baker & McKenzie 1 502 2 6209= - Wistrand 1 502 - -
InfraDeals 2015 Trend Report 31 www.infra-deals.com
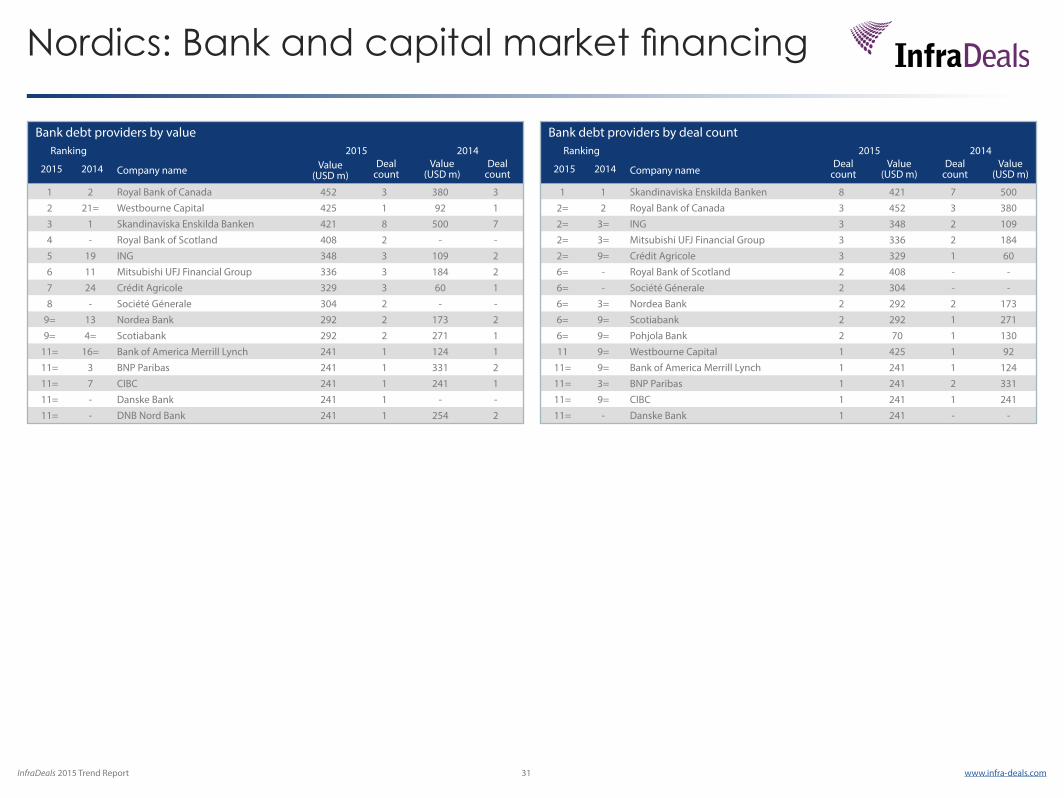
Nordics: Bank and capital market financing
Bank debt providers by valueRanking 2015 2014
2015 2014 Company name Value (USD m)
Deal count
Value (USD m)
Deal count
1 2 Royal Bank of Canada 452 3 380 32 21= Westbourne Capital 425 1 92 13 1 Skandinaviska Enskilda Banken 421 8 500 74 - Royal Bank of Scotland 408 2 - -5 19 ING 348 3 109 26 11 Mitsubishi UFJ Financial Group 336 3 184 27 24 Crédit Agricole 329 3 60 18 - Société Génerale 304 2 - -
9= 13 Nordea Bank 292 2 173 29= 4= Scotiabank 292 2 271 1
11= 16= Bank of America Merrill Lynch 241 1 124 111= 3 BNP Paribas 241 1 331 211= 7 CIBC 241 1 241 111= - Danske Bank 241 1 - -11= - DNB Nord Bank 241 1 254 2
Bank debt providers by deal countRanking 2015 2014
2015 2014 Company nameDeal
countValue
(USD m)Deal
countValue
(USD m)
1 1 Skandinaviska Enskilda Banken 8 421 7 5002= 2 Royal Bank of Canada 3 452 3 3802= 3= ING 3 348 2 1092= 3= Mitsubishi UFJ Financial Group 3 336 2 1842= 9= Crédit Agricole 3 329 1 606= - Royal Bank of Scotland 2 408 - -6= - Société Génerale 2 304 - -6= 3= Nordea Bank 2 292 2 1736= 9= Scotiabank 2 292 1 2716= 9= Pohjola Bank 2 70 1 13011 9= Westbourne Capital 1 425 1 92
11= 9= Bank of America Merrill Lynch 1 241 1 12411= 3= BNP Paribas 1 241 2 33111= 9= CIBC 1 241 1 24111= - Danske Bank 1 241 - -
InfraDeals 2015 Trend Report 32 www.infra-deals.com
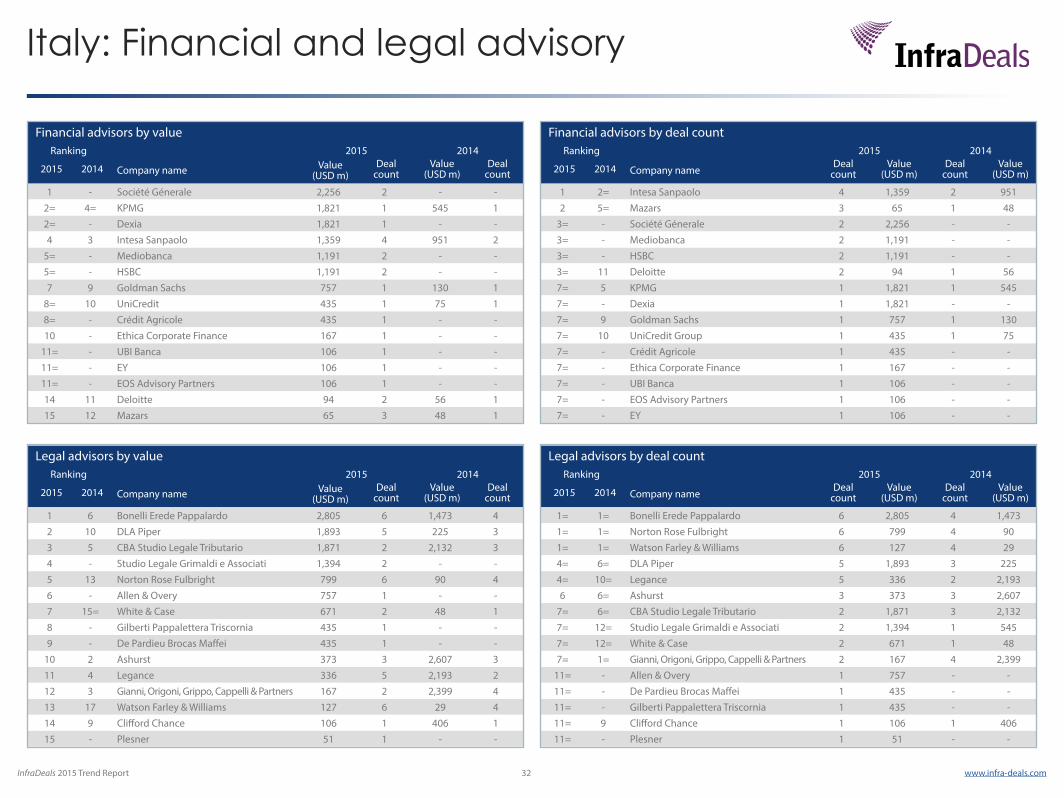
Italy: Financial and legal advisory
Financial advisors by valueRanking 2015 2014
2015 2014 Company name Value (USD m)
Deal count
Value (USD m)
Deal count
1 - Société Génerale 2,256 2 - -2= 4= KPMG 1,821 1 545 12= - Dexia 1,821 1 - -4 3 Intesa Sanpaolo 1,359 4 951 2
5= - Mediobanca 1,191 2 - -5= - HSBC 1,191 2 - -7 9 Goldman Sachs 757 1 130 1
8= 10 UniCredit 435 1 75 18= - Crédit Agricole 435 1 - -10 - Ethica Corporate Finance 167 1 - -
11= - UBI Banca 106 1 - -11= - EY 106 1 - -11= - EOS Advisory Partners 106 1 - -14 11 Deloitte 94 2 56 115 12 Mazars 65 3 48 1
Financial advisors by deal countRanking 2015 2014
2015 2014 Company nameDeal
countValue
(USD m)Deal
countValue
(USD m)
1 2= Intesa Sanpaolo 4 1,359 2 9512 5= Mazars 3 65 1 48
3= - Société Génerale 2 2,256 - -3= - Mediobanca 2 1,191 - -3= - HSBC 2 1,191 - -3= 11 Deloitte 2 94 1 567= 5 KPMG 1 1,821 1 5457= - Dexia 1 1,821 - -7= 9 Goldman Sachs 1 757 1 1307= 10 UniCredit Group 1 435 1 757= - Crédit Agricole 1 435 - -7= - Ethica Corporate Finance 1 167 - -7= - UBI Banca 1 106 - -7= - EOS Advisory Partners 1 106 - -7= - EY 1 106 - -
Legal advisors by valueRanking 2015 2014
2015 2014 Company name Value (USD m)
Deal count
Value (USD m)
Deal count
1 6 Bonelli Erede Pappalardo 2,805 6 1,473 42 10 DLA Piper 1,893 5 225 33 5 CBA Studio Legale Tributario 1,871 2 2,132 34 - Studio Legale Grimaldi e Associati 1,394 2 - -5 13 Norton Rose Fulbright 799 6 90 46 - Allen & Overy 757 1 - -7 15= White & Case 671 2 48 18 - Gilberti Pappalettera Triscornia 435 1 - -9 - De Pardieu Brocas Maffei 435 1 - -
10 2 Ashurst 373 3 2,607 311 4 Legance 336 5 2,193 212 3 Gianni, Origoni, Grippo, Cappelli & Partners 167 2 2,399 413 17 Watson Farley & Williams 127 6 29 414 9 Clifford Chance 106 1 406 115 - Plesner 51 1 - -
Legal advisors by deal countRanking 2015 2014
2015 2014 Company nameDeal
countValue
(USD m)Deal
countValue
(USD m)
1= 1= Bonelli Erede Pappalardo 6 2,805 4 1,4731= 1= Norton Rose Fulbright 6 799 4 901= 1= Watson Farley & Williams 6 127 4 294= 6= DLA Piper 5 1,893 3 2254= 10= Legance 5 336 2 2,1936 6= Ashurst 3 373 3 2,607
7= 6= CBA Studio Legale Tributario 2 1,871 3 2,1327= 12= Studio Legale Grimaldi e Associati 2 1,394 1 5457= 12= White & Case 2 671 1 487= 1= Gianni, Origoni, Grippo, Cappelli & Partners 2 167 4 2,399
11= - Allen & Overy 1 757 - -11= - De Pardieu Brocas Maffei 1 435 - -11= - Gilberti Pappalettera Triscornia 1 435 - -11= 9 Clifford Chance 1 106 1 40611= - Plesner 1 51 - -
InfraDeals 2015 Trend Report 33 www.infra-deals.com
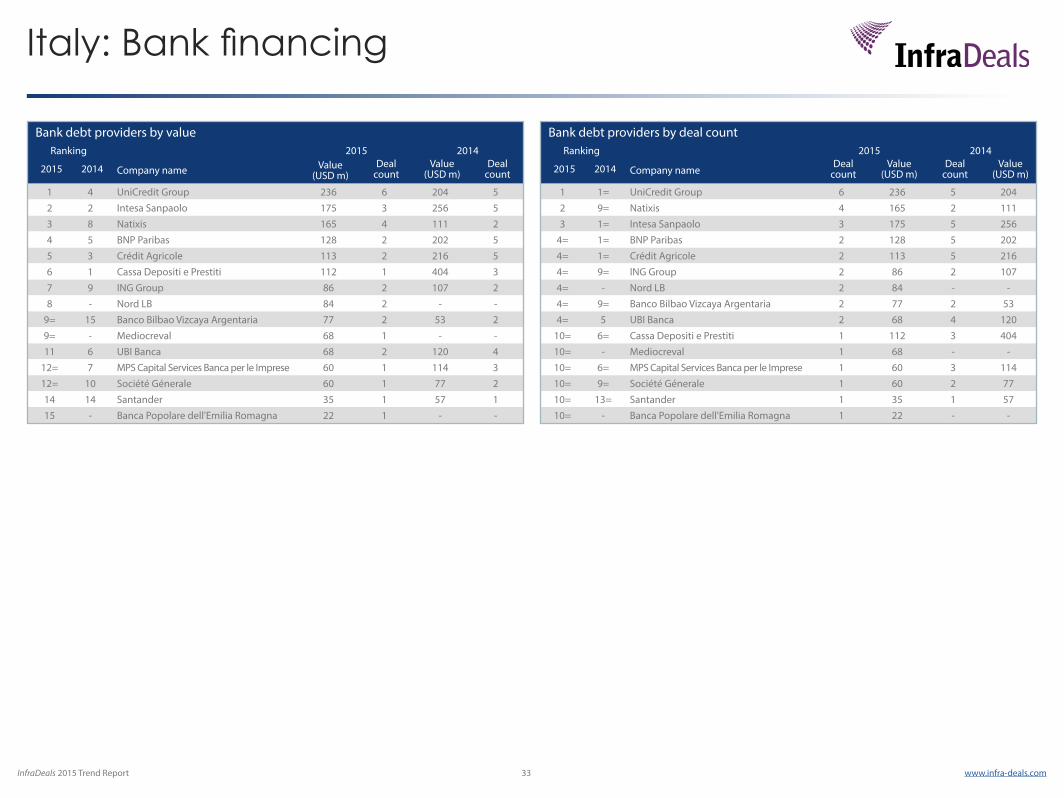
Italy: Bank financing
Bank debt providers by valueRanking 2015 2014
2015 2014 Company name Value (USD m)
Deal count
Value (USD m)
Deal count
1 4 UniCredit Group 236 6 204 52 2 Intesa Sanpaolo 175 3 256 53 8 Natixis 165 4 111 24 5 BNP Paribas 128 2 202 55 3 Crédit Agricole 113 2 216 56 1 Cassa Depositi e Prestiti 112 1 404 37 9 ING Group 86 2 107 28 - Nord LB 84 2 - -
9= 15 Banco Bilbao Vizcaya Argentaria 77 2 53 29= - Mediocreval 68 1 - -11 6 UBI Banca 68 2 120 4
12= 7 MPS Capital Services Banca per le Imprese 60 1 114 312= 10 Société Génerale 60 1 77 214 14 Santander 35 1 57 115 - Banca Popolare dell'Emilia Romagna 22 1 - -
Bank debt providers by deal countRanking 2015 2014
2015 2014 Company nameDeal
countValue
(USD m)Deal
countValue
(USD m)
1 1= UniCredit Group 6 236 5 2042 9= Natixis 4 165 2 1113 1= Intesa Sanpaolo 3 175 5 256
4= 1= BNP Paribas 2 128 5 2024= 1= Crédit Agricole 2 113 5 2164= 9= ING Group 2 86 2 1074= - Nord LB 2 84 - -4= 9= Banco Bilbao Vizcaya Argentaria 2 77 2 534= 5 UBI Banca 2 68 4 120
10= 6= Cassa Depositi e Prestiti 1 112 3 40410= - Mediocreval 1 68 - -10= 6= MPS Capital Services Banca per le Imprese 1 60 3 11410= 9= Société Génerale 1 60 2 7710= 13= Santander 1 35 1 5710= - Banca Popolare dell'Emilia Romagna 1 22 - -
InfraDeals 2015 Trend Report 34 www.infra-deals.com
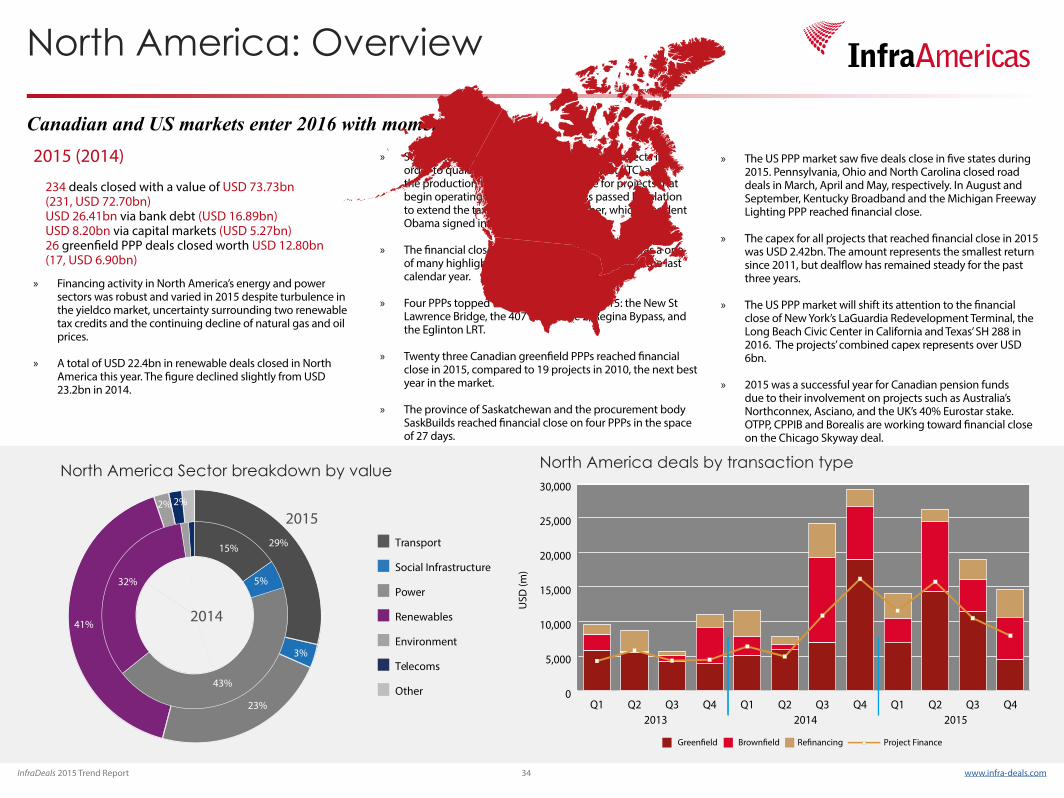
» Financing activity in North America’s energy and power sectors was robust and varied in 2015 despite turbulence in the yieldco market, uncertainty surrounding two renewable tax credits and the continuing decline of natural gas and oil prices.
» A total of USD 22.4bn in renewable deals closed in North America this year. The figure declined slightly from USD 23.2bn in 2014.
Canadian and US markets enter 2016 with momentum » Solar and wind developers rushed to finish projects in
order to qualify for the investment tax credit (ITC) and the production tax credit (PTC) available for projects that begin operating before 2017. Congress passed legislation to extend the tax credits on 18 December, which President Obama signed into law later that day.
» The financial close of the USD 4bn Eglinton LRT was a one of many highlights in the Canadian PPP market in the last calendar year.
» Four PPPs topped the CAD 1bn mark in 2015: the New St Lawrence Bridge, the 407 East Phase 2, Regina Bypass, and the Eglinton LRT.
» Twenty three Canadian greenfield PPPs reached financial close in 2015, compared to 19 projects in 2010, the next best year in the market.
» The province of Saskatchewan and the procurement body SaskBuilds reached financial close on four PPPs in the space of 27 days.
» The US PPP market saw five deals close in five states during 2015. Pennsylvania, Ohio and North Carolina closed road deals in March, April and May, respectively. In August and September, Kentucky Broadband and the Michigan Freeway Lighting PPP reached financial close.
» The capex for all projects that reached financial close in 2015 was USD 2.42bn. The amount represents the smallest return since 2011, but dealflow has remained steady for the past three years.
» The US PPP market will shift its attention to the financial close of New York’s LaGuardia Redevelopment Terminal, the Long Beach Civic Center in California and Texas’ SH 288 in 2016. The projects’ combined capex represents over USD 6bn.
» 2015 was a successful year for Canadian pension funds due to their involvement on projects such as Australia’s Northconnex, Asciano, and the UK’s 40% Eurostar stake. OTPP, CPPIB and Borealis are working toward financial close on the Chicago Skyway deal.
2015 (2014)
234 deals closed with a value of USD 73.73bn (231, USD 72.70bn) USD 26.41bn via bank debt (USD 16.89bn) USD 8.20bn via capital markets (USD 5.27bn) 26 greenfield PPP deals closed worth USD 12.80bn (17, USD 6.90bn)
North America Sector breakdown by value
North America: Overview
43%
32%
29%
3%
2%
23%
41%
15%
5%
2%
2014
2015
Other
Environment
Renewables
Power
Social Infrastructure
Transport
Telecoms
North America deals by transaction type
USD
(m)
0
5,000
10,000
15,000
20,000
25,000
30,000
Q4Q3Q2Q1Q4Q3Q2Q1Q4Q3Q2Q12013 2014 2015
Project Finance
InfraDeals 2015 Trend Report 35 www.infra-deals.com
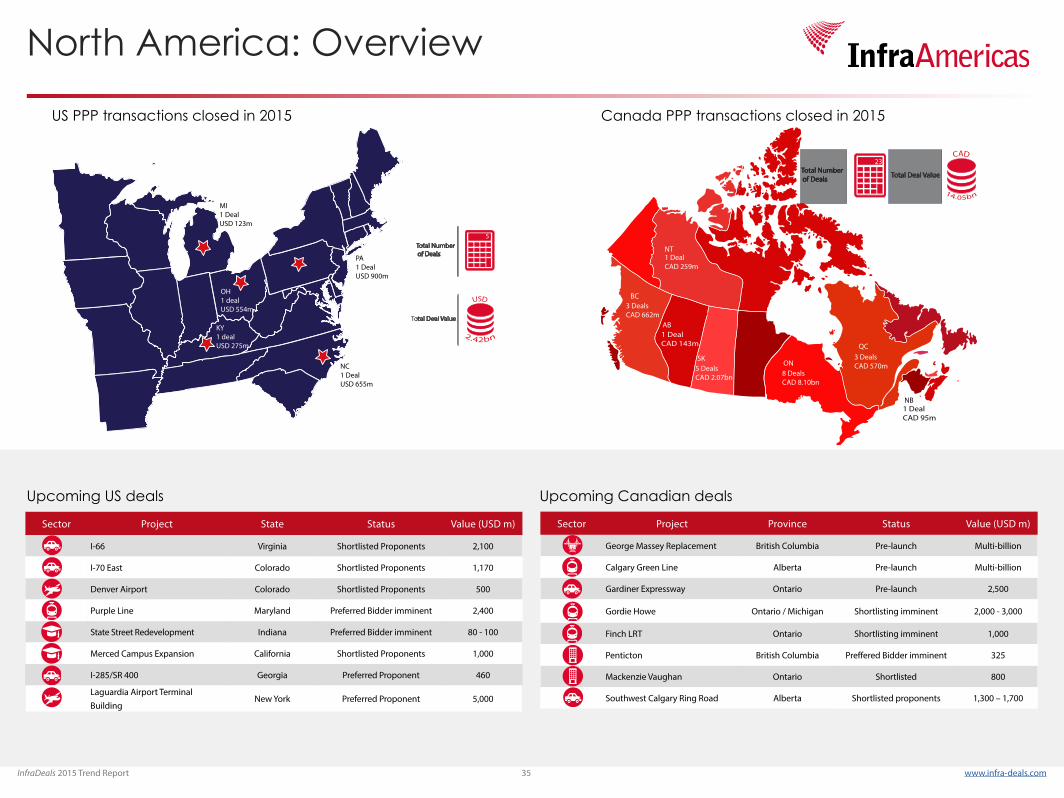
North America: Overview
Sector Project State Status Value (USD m)
I-66 Virginia Shortlisted Proponents 2,100
I-70 East Colorado Shortlisted Proponents 1,170
Denver Airport Colorado Shortlisted Proponents 500
Purple Line Maryland Preferred Bidder imminent 2,400
State Street Redevelopment Indiana Preferred Bidder imminent 80 - 100
Merced Campus Expansion California Shortlisted Proponents 1,000
I-285/SR 400 Georgia Preferred Proponent 460
Laguardia Airport Terminal Building
New York Preferred Proponent 5,000
Sector Project Province Status Value (USD m)
George Massey Replacement British Columbia Pre-launch Multi-billion
Calgary Green Line Alberta Pre-launch Multi-billion
Gardiner Expressway Ontario Pre-launch 2,500
Gordie Howe Ontario / Michigan Shortlisting imminent 2,000 - 3,000
Finch LRT Ontario Shortlisting imminent 1,000
Penticton British Columbia Preffered Bidder imminent 325
Mackenzie Vaughan Ontario Shortlisted 800
Southwest Calgary Ring Road Alberta Shortlisted proponents 1,300 – 1,700
Upcoming Canadian dealsUpcoming US deals
NC1 DealUSD 655m
KY1 dealUSD 275m
MI1 DealUSD 123m
PA1 DealUSD 900m
OH1 dealUSD 554m
Total Deal Value
5 Total Number of Deals
US PPP transactions closed in 2015
11
8 DealsCAD 8.10bn
5 DealsCAD 2.07bn
3 DealsCAD 662m
1 DealCAD 259m
1 DealCAD 143m
1 DealCAD 95m
3 DealsCAD 570m
NB
23 Total Number of Deals Total Deal Value
NT
QC
ONSK
AB
BC
Canada PPP transactions closed in 2015
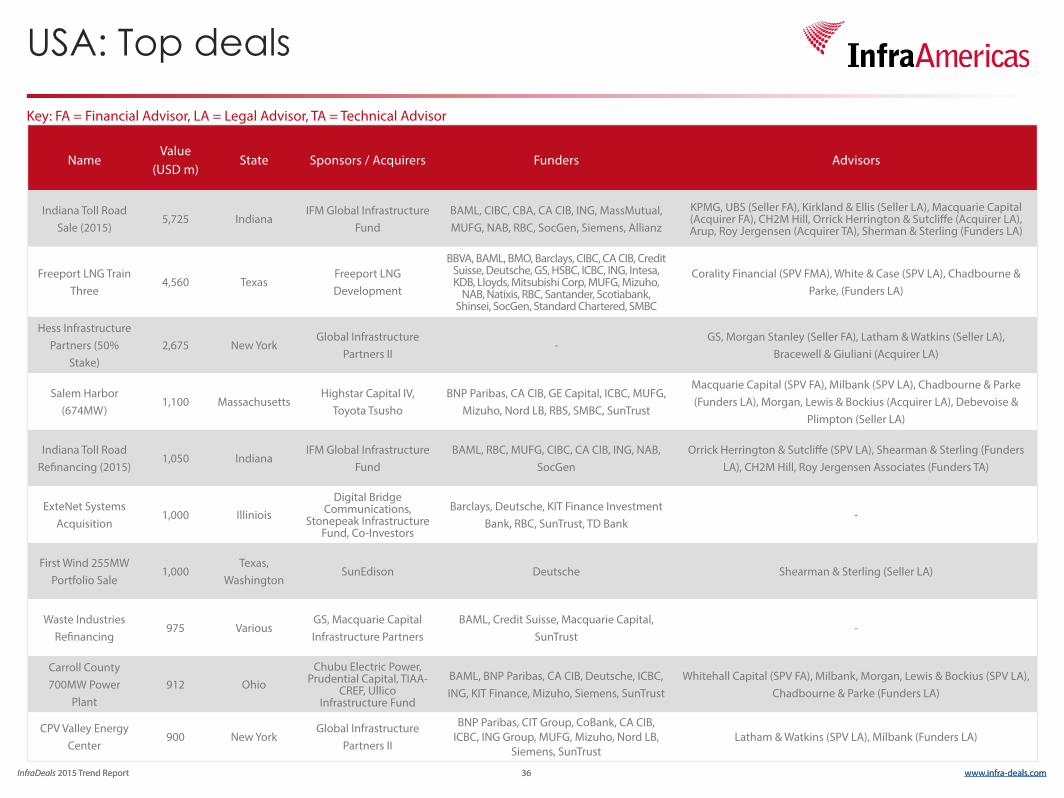
InfraDeals 2015 Trend Report 36 www.infra-deals.comInfraDeals 2015 Trend Report 36 www.infra-deals.com
USA: Top deals
NameValue
(USD m)State Sponsors / Acquirers Funders Advisors
Indiana Toll Road Sale (2015)
5,725 IndianaIFM Global Infrastructure
FundBAML, CIBC, CBA, CA CIB, ING, MassMutual, MUFG, NAB, RBC, SocGen, Siemens, Allianz
KPMG, UBS (Seller FA), Kirkland & Ellis (Seller LA), Macquarie Capital (Acquirer FA), CH2M Hill, Orrick Herrington & Sutcliffe (Acquirer LA), Arup, Roy Jergensen (Acquirer TA), Sherman & Sterling (Funders LA)
Freeport LNG Train Three
4,560 TexasFreeport LNG Development
BBVA, BAML, BMO, Barclays, CIBC, CA CIB, Credit Suisse, Deutsche, GS, HSBC, ICBC, ING, Intesa, KDB, Lloyds, Mitsubishi Corp, MUFG, Mizuho,
NAB, Natixis, RBC, Santander, Scotiabank, Shinsei, SocGen, Standard Chartered, SMBC
Corality Financial (SPV FMA), White & Case (SPV LA), Chadbourne & Parke, (Funders LA)
Hess Infrastructure Partners (50%
Stake)2,675 New York
Global Infrastructure Partners II
-GS, Morgan Stanley (Seller FA), Latham & Watkins (Seller LA),
Bracewell & Giuliani (Acquirer LA)
Salem Harbor (674MW)
1,100 MassachusettsHighstar Capital IV,
Toyota TsushoBNP Paribas, CA CIB, GE Capital, ICBC, MUFG,
Mizuho, Nord LB, RBS, SMBC, SunTrust
Macquarie Capital (SPV FA), Milbank (SPV LA), Chadbourne & Parke (Funders LA), Morgan, Lewis & Bockius (Acquirer LA), Debevoise &
Plimpton (Seller LA)
Indiana Toll Road Refinancing (2015)
1,050 IndianaIFM Global Infrastructure
FundBAML, RBC, MUFG, CIBC, CA CIB, ING, NAB,
SocGenOrrick Herrington & Sutcliffe (SPV LA), Shearman & Sterling (Funders
LA), CH2M Hill, Roy Jergensen Associates (Funders TA)
ExteNet Systems Acquisition
1,000 IllinioisDigital Bridge
Communications, Stonepeak Infrastructure
Fund, Co-Investors
Barclays, Deutsche, KIT Finance Investment Bank, RBC, SunTrust, TD Bank
-
First Wind 255MW Portfolio Sale
1,000Texas,
WashingtonSunEdison Deutsche Shearman & Sterling (Seller LA)
Waste Industries Refinancing
975 VariousGS, Macquarie Capital Infrastructure Partners
BAML, Credit Suisse, Macquarie Capital, SunTrust
-
Carroll County 700MW Power
Plant912 Ohio
Chubu Electric Power, Prudential Capital, TIAA-
CREF, Ullico Infrastructure Fund
BAML, BNP Paribas, CA CIB, Deutsche, ICBC, ING, KIT Finance, Mizuho, Siemens, SunTrust
Whitehall Capital (SPV FA), Milbank, Morgan, Lewis & Bockius (SPV LA), Chadbourne & Parke (Funders LA)
CPV Valley Energy Center
900 New YorkGlobal Infrastructure
Partners II
BNP Paribas, CIT Group, CoBank, CA CIB, ICBC, ING Group, MUFG, Mizuho, Nord LB,
Siemens, SunTrust Latham & Watkins (SPV LA), Milbank (Funders LA)
Key: FA = Financial Advisor, LA = Legal Advisor, TA = Technical Advisor
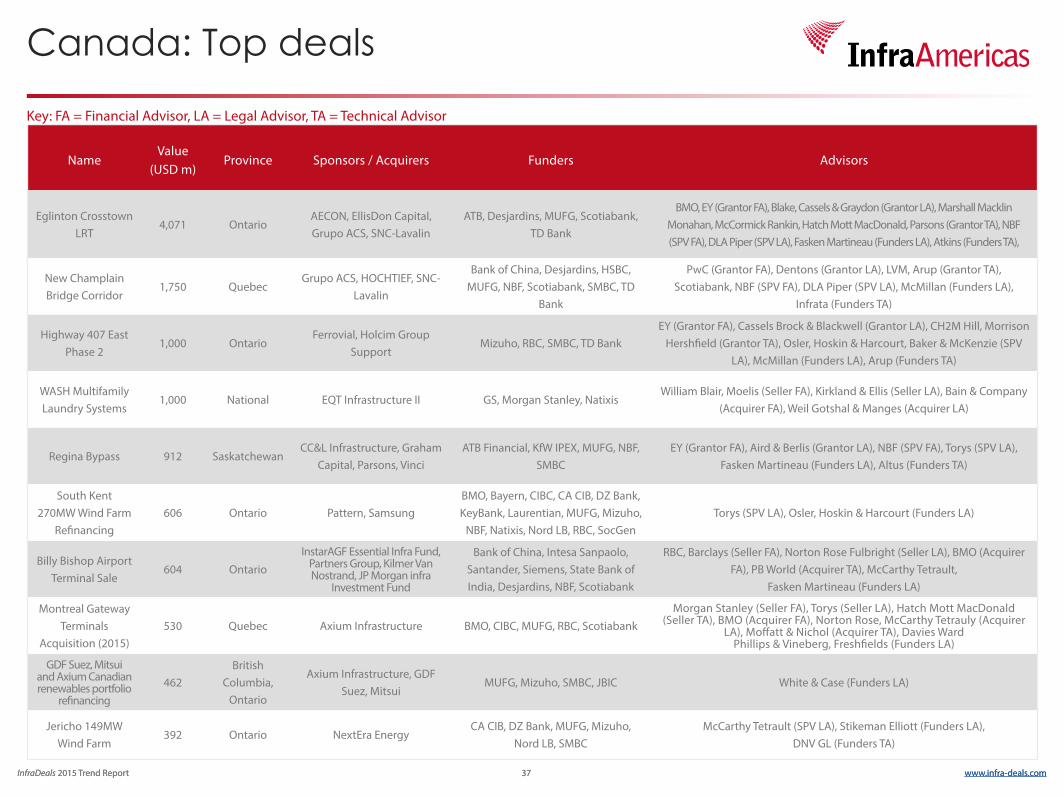
InfraDeals 2015 Trend Report 37 www.infra-deals.comInfraDeals 2015 Trend Report 37 www.infra-deals.com
Canada: Top deals
NameValue
(USD m)Province Sponsors / Acquirers Funders Advisors
Eglinton Crosstown LRT
4,071 OntarioAECON, EllisDon Capital, Grupo ACS, SNC-Lavalin
ATB, Desjardins, MUFG, Scotiabank, TD Bank
BMO, EY (Grantor FA), Blake, Cassels & Graydon (Grantor LA), Marshall Macklin Monahan, McCormick Rankin, Hatch Mott MacDonald, Parsons (Grantor TA), NBF (SPV FA), DLA Piper (SPV LA), Fasken Martineau (Funders LA), Atkins (Funders TA),
New Champlain Bridge Corridor
1,750 QuebecGrupo ACS, HOCHTIEF, SNC-
Lavalin
Bank of China, Desjardins, HSBC, MUFG, NBF, Scotiabank, SMBC, TD
Bank
PwC (Grantor FA), Dentons (Grantor LA), LVM, Arup (Grantor TA), Scotiabank, NBF (SPV FA), DLA Piper (SPV LA), McMillan (Funders LA),
Infrata (Funders TA)
Highway 407 East Phase 2
1,000 OntarioFerrovial, Holcim Group
SupportMizuho, RBC, SMBC, TD Bank
EY (Grantor FA), Cassels Brock & Blackwell (Grantor LA), CH2M Hill, Morrison Hershfield (Grantor TA), Osler, Hoskin & Harcourt, Baker & McKenzie (SPV
LA), McMillan (Funders LA), Arup (Funders TA)
WASH Multifamily Laundry Systems
1,000 National EQT Infrastructure II GS, Morgan Stanley, NatixisWilliam Blair, Moelis (Seller FA), Kirkland & Ellis (Seller LA), Bain & Company
(Acquirer FA), Weil Gotshal & Manges (Acquirer LA)
Regina Bypass 912 SaskatchewanCC&L Infrastructure, Graham
Capital, Parsons, VinciATB Financial, KfW IPEX, MUFG, NBF,
SMBCEY (Grantor FA), Aird & Berlis (Grantor LA), NBF (SPV FA), Torys (SPV LA),
Fasken Martineau (Funders LA), Altus (Funders TA)
South Kent 270MW Wind Farm
Refinancing606 Ontario Pattern, Samsung
BMO, Bayern, CIBC, CA CIB, DZ Bank, KeyBank, Laurentian, MUFG, Mizuho,
NBF, Natixis, Nord LB, RBC, SocGenTorys (SPV LA), Osler, Hoskin & Harcourt (Funders LA)
Billy Bishop Airport Terminal Sale
604 OntarioInstarAGF Essential Infra Fund,
Partners Group, Kilmer Van Nostrand, JP Morgan infra
Investment Fund
Bank of China, Intesa Sanpaolo, Santander, Siemens, State Bank of India, Desjardins, NBF, Scotiabank
RBC, Barclays (Seller FA), Norton Rose Fulbright (Seller LA), BMO (Acquirer FA), PB World (Acquirer TA), McCarthy Tetrault,
Fasken Martineau (Funders LA)
Montreal Gateway Terminals
Acquisition (2015)530 Quebec Axium Infrastructure BMO, CIBC, MUFG, RBC, Scotiabank
Morgan Stanley (Seller FA), Torys (Seller LA), Hatch Mott MacDonald (Seller TA), BMO (Acquirer FA), Norton Rose, McCarthy Tetrauly (Acquirer
LA), Moffatt & Nichol (Acquirer TA), Davies Ward Phillips & Vineberg, Freshfields (Funders LA)
GDF Suez, Mitsui and Axium Canadian renewables portfolio
refinancing462
British Columbia,
Ontario
Axium Infrastructure, GDF Suez, Mitsui
MUFG, Mizuho, SMBC, JBIC White & Case (Funders LA)
Jericho 149MW Wind Farm
392 Ontario NextEra EnergyCA CIB, DZ Bank, MUFG, Mizuho,
Nord LB, SMBCMcCarthy Tetrault (SPV LA), Stikeman Elliott (Funders LA),
DNV GL (Funders TA)
Key: FA = Financial Advisor, LA = Legal Advisor, TA = Technical Advisor
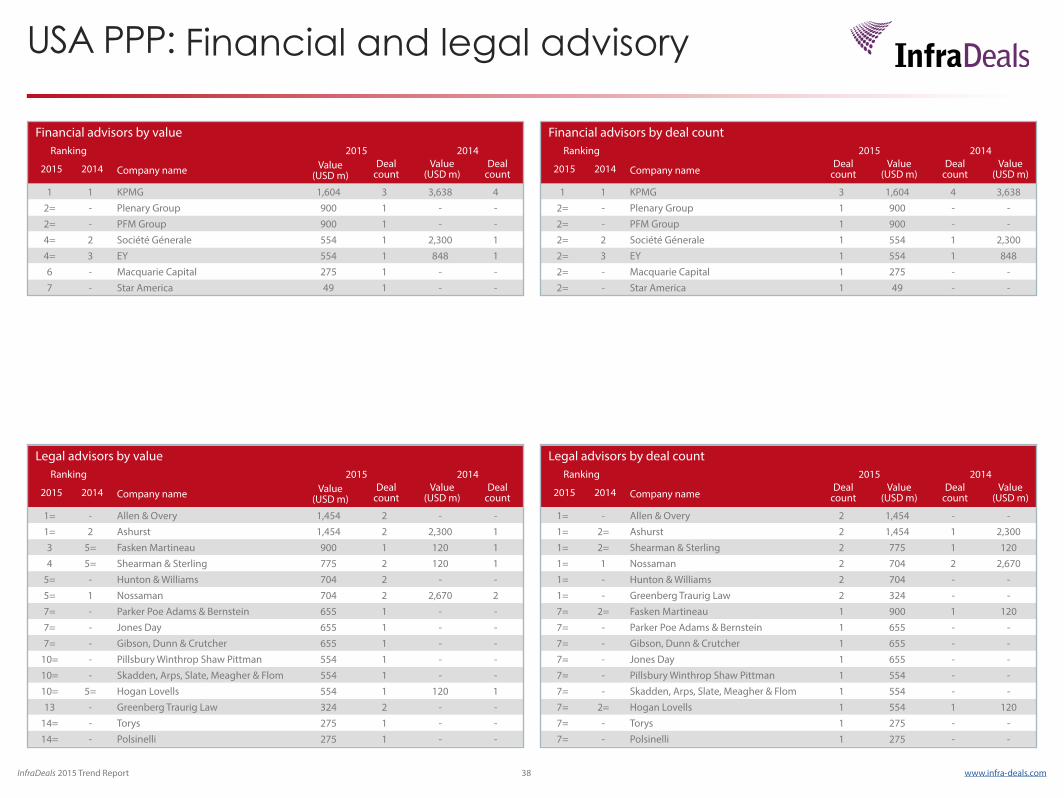
InfraDeals 2015 Trend Report 38 www.infra-deals.com
USA PPP: Financial and legal advisory
Financial advisors by valueRanking 2015 2014
2015 2014 Company name Value (USD m)
Deal count
Value (USD m)
Deal count
1 1 KPMG 1,604 3 3,638 42= - Plenary Group 900 1 - -2= - PFM Group 900 1 - -4= 2 Société Génerale 554 1 2,300 14= 3 EY 554 1 848 16 - Macquarie Capital 275 1 - -7 - Star America 49 1 - -
Financial advisors by deal countRanking 2015 2014
2015 2014 Company nameDeal
countValue
(USD m)Deal
countValue
(USD m)
1 1 KPMG 3 1,604 4 3,6382= - Plenary Group 1 900 - -2= - PFM Group 1 900 - -2= 2 Société Génerale 1 554 1 2,3002= 3 EY 1 554 1 8482= - Macquarie Capital 1 275 - -2= - Star America 1 49 - -
Legal advisors by valueRanking 2015 2014
2015 2014 Company name Value (USD m)
Deal count
Value (USD m)
Deal count
1= - Allen & Overy 1,454 2 - -1= 2 Ashurst 1,454 2 2,300 13 5= Fasken Martineau 900 1 120 14 5= Shearman & Sterling 775 2 120 1
5= - Hunton & Williams 704 2 - -5= 1 Nossaman 704 2 2,670 27= - Parker Poe Adams & Bernstein 655 1 - -7= - Jones Day 655 1 - -7= - Gibson, Dunn & Crutcher 655 1 - -
10= - Pillsbury Winthrop Shaw Pittman 554 1 - -10= - Skadden, Arps, Slate, Meagher & Flom 554 1 - -10= 5= Hogan Lovells 554 1 120 113 - Greenberg Traurig Law 324 2 - -
14= - Torys 275 1 - -14= - Polsinelli 275 1 - -
Legal advisors by deal countRanking 2015 2014
2015 2014 Company nameDeal
countValue
(USD m)Deal
countValue
(USD m)
1= - Allen & Overy 2 1,454 - -1= 2= Ashurst 2 1,454 1 2,3001= 2= Shearman & Sterling 2 775 1 1201= 1 Nossaman 2 704 2 2,6701= - Hunton & Williams 2 704 - -1= - Greenberg Traurig Law 2 324 - -7= 2= Fasken Martineau 1 900 1 1207= - Parker Poe Adams & Bernstein 1 655 - -7= - Gibson, Dunn & Crutcher 1 655 - -7= - Jones Day 1 655 - -7= - Pillsbury Winthrop Shaw Pittman 1 554 - -7= - Skadden, Arps, Slate, Meagher & Flom 1 554 - -7= 2= Hogan Lovells 1 554 1 1207= - Torys 1 275 - -7= - Polsinelli 1 275 - -

InfraDeals 2015 Trend Report 39 www.infra-deals.com
Canada PPP: Financial and legal advisory
Financial advisors by valueRanking 2015 2014
2015 2014 Company name Value (USD m)
Deal count
Value (USD m)
Deal count
1 9 National Bank Financial 7,263 6 460 12 2 EY 7,208 8 1,971 63 3 Scotiabank 5,822 2 1,229 24 11 PwC 2,064 4 176 15 5 KPMG 527 4 790 46 - Brookfield Financial 390 3 - -7 1 Deloitte 384 3 1,982 6
8= 6 TD Securities 365 1 700 58= - Plenary Group 365 1 - -10 - EllisDon Capital 313 2 - -11 7 Rocklynn Capital 300 1 583 512 12 BMO 194 1 128 113 8 Royal Bank of Canada 180 1 487 1
14= - Stonebridge Financial Corporation 71 1 - -14= - Bird Capital 71 1 - -
Financial advisors by deal countRanking 2015 2014
2015 2014 Company nameDeal
countValue
(USD m)Deal
countValue
(USD m)
1 1= EY 8 7,208 6 1,9712 5= National Bank Financial 6 7,263 1 460
3= 5= PwC 4 2,064 1 1763= 3 KPMG 4 527 4 7905= - Brookfield Financial 3 390 - -5= 1= Deloitte 3 384 6 1,9827= 4 Scotiabank 2 5,822 2 1,2297= - EllisDon Capital 2 313 - -9= - Plenary Group 1 365 - -9= 2= TD Securities 1 365 5 7009= 2= Rocklynn Capital 1 300 5 5839= - BMO 1 194 1 1289= 5= Royal Bank of Canada 1 180 1 4879= - Stonebridge Financial Corporation 1 71 - -9= - Bird Capital 1 71 - -
Legal advisors by valueRanking 2015 2014
2015 2014 Company name Value (USD m)
Deal count
Value (USD m)
Deal count
1 15 DLA Piper 6,349 6 460 12 1 Fasken Martineau 5,626 5 2,198 73 2 Blake, Cassels & Graydon 5,320 10 2,034 54 4 McMillan 3,247 7 1,636 55 17 Dentons 2,164 3 21 16 9 Osler, Hoskin & Harcourt 1,753 5 905 57 8 Aird & Berlis 1,568 4 967 58 5 McCarthy Tétrault 1,330 8 1,427 89 12 Torys 1,106 2 680 5
10= 10 Baker & McKenzie 1,000 1 789 210= - Cassels Brock & Blackwell 1,000 1 - -12 6 Farris 946 4 1,404 513 11 Davies Ward Phillips & Vineberg 545 2 736 314 16 Stikeman Elliott 291 2 329 115 14 Bull Housser & Tupper 186 1 533 2
Legal advisors by deal countRanking 2015 2014
2015 2014 Company nameDeal
countValue
(USD m)Deal
countValue
(USD m)
1 3= Blake, Cassels & Graydon 10 5,320 5 2,0342 1 McCarthy Tétrault 8 1,330 8 -3 3= McMillan 7 3,247 5 1,6364 6= DLA Piper 6 6,349 1 460
5= 2 Fasken Martineau 5 5,626 7 2,1985= 3= Osler, Hoskin & Harcourt 5 1,753 5 9057= 3= Aird & Berlis 4 1,568 5 9677= 3= Farris 4 946 5 1,4049 7= Dentons 3 2,164 1 21
10= 3= Torys 2 1,106 5 68010= 5 Davies Ward Phillips & Vineberg 2 545 3 73610= 7= Stikeman Elliott 2 291 1 32910= 3= Gowling Lafleur Henderson 2 75 5 57414= - Cassels Brock & Blackwell 1 1,000 - -14= 6= Baker & McKenzie 1 1,000 2 -
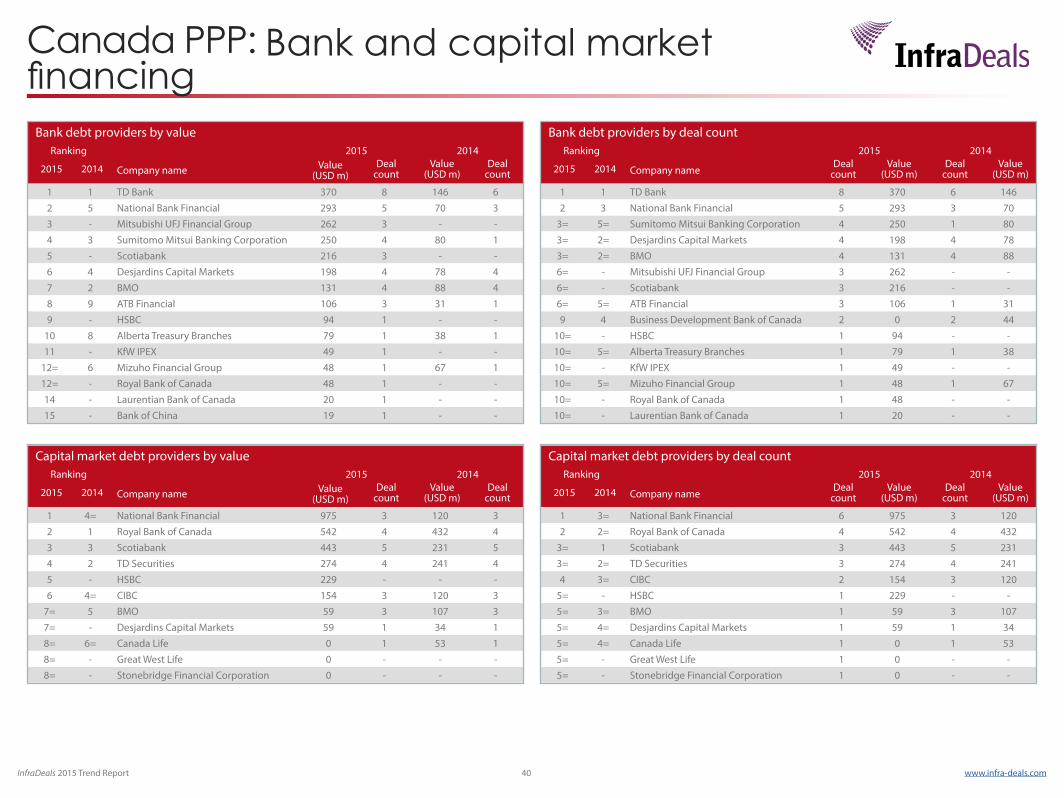
InfraDeals 2015 Trend Report 40 www.infra-deals.com
Canada PPP: Bank and capital market financing
Bank debt providers by valueRanking 2015 2014
2015 2014 Company name Value (USD m)
Deal count
Value (USD m)
Deal count
1 1 TD Bank 370 8 146 62 5 National Bank Financial 293 5 70 33 - Mitsubishi UFJ Financial Group 262 3 - -4 3 Sumitomo Mitsui Banking Corporation 250 4 80 15 - Scotiabank 216 3 - -6 4 Desjardins Capital Markets 198 4 78 47 2 BMO 131 4 88 48 9 ATB Financial 106 3 31 19 - HSBC 94 1 - -
10 8 Alberta Treasury Branches 79 1 38 111 - KfW IPEX 49 1 - -
12= 6 Mizuho Financial Group 48 1 67 112= - Royal Bank of Canada 48 1 - -14 - Laurentian Bank of Canada 20 1 - -15 - Bank of China 19 1 - -
Bank debt providers by deal countRanking 2015 2014
2015 2014 Company nameDeal
countValue
(USD m)Deal
countValue
(USD m)
1 1 TD Bank 8 370 6 1462 3 National Bank Financial 5 293 3 70
3= 5= Sumitomo Mitsui Banking Corporation 4 250 1 803= 2= Desjardins Capital Markets 4 198 4 783= 2= BMO 4 131 4 886= - Mitsubishi UFJ Financial Group 3 262 - -6= - Scotiabank 3 216 - -6= 5= ATB Financial 3 106 1 319 4 Business Development Bank of Canada 2 0 2 44
10= - HSBC 1 94 - -10= 5= Alberta Treasury Branches 1 79 1 3810= - KfW IPEX 1 49 - -10= 5= Mizuho Financial Group 1 48 1 6710= - Royal Bank of Canada 1 48 - -10= - Laurentian Bank of Canada 1 20 - -
Capital market debt providers by valueRanking 2015 2014
2015 2014 Company name Value (USD m)
Deal count
Value (USD m)
Deal count
1 4= National Bank Financial 975 3 120 32 1 Royal Bank of Canada 542 4 432 43 3 Scotiabank 443 5 231 54 2 TD Securities 274 4 241 45 - HSBC 229 - - -6 4= CIBC 154 3 120 3
7= 5 BMO 59 3 107 37= - Desjardins Capital Markets 59 1 34 18= 6= Canada Life 0 1 53 18= - Great West Life 0 - - -8= - Stonebridge Financial Corporation 0 - - -
Capital market debt providers by deal countRanking 2015 2014
2015 2014 Company nameDeal
countValue
(USD m)Deal
countValue
(USD m)
1 3= National Bank Financial 6 975 3 1202 2= Royal Bank of Canada 4 542 4 432
3= 1 Scotiabank 3 443 5 2313= 2= TD Securities 3 274 4 2414 3= CIBC 2 154 3 120
5= - HSBC 1 229 - -5= 3= BMO 1 59 3 1075= 4= Desjardins Capital Markets 1 59 1 345= 4= Canada Life 1 0 1 535= - Great West Life 1 0 - -5= - Stonebridge Financial Corporation 1 0 - -
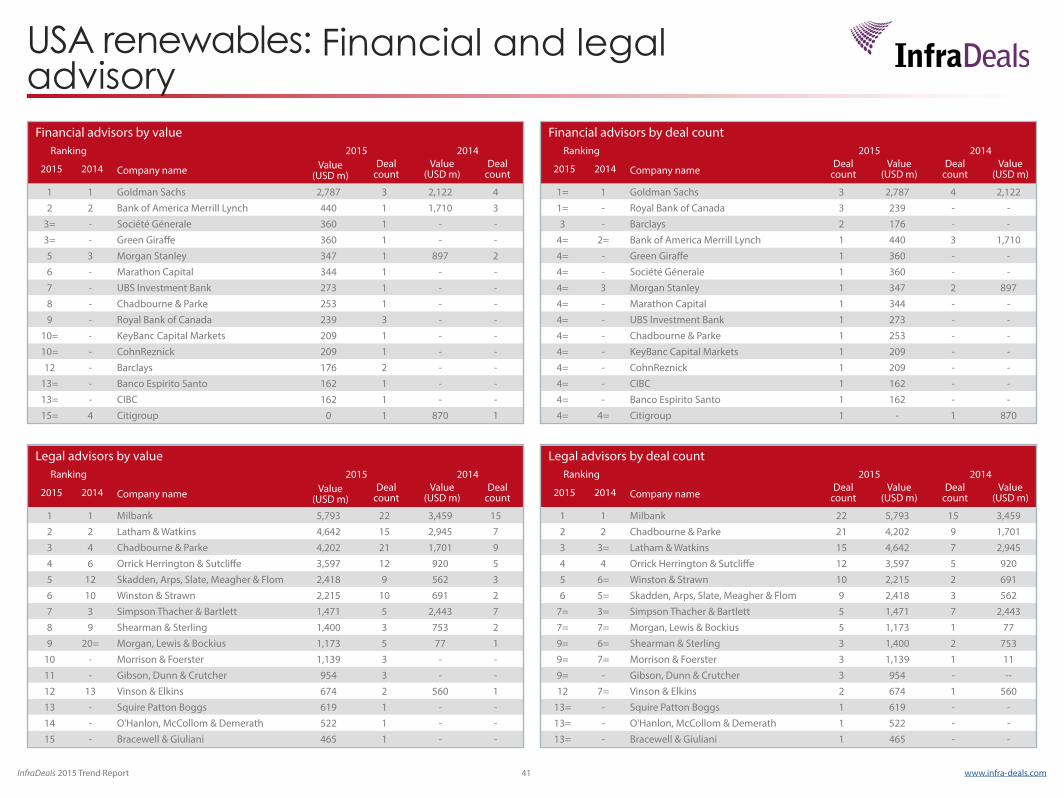
InfraDeals 2015 Trend Report 41 www.infra-deals.com
USA renewables: Financial and legal advisory
Financial advisors by valueRanking 2015 2014
2015 2014 Company name Value (USD m)
Deal count
Value (USD m)
Deal count
1 1 Goldman Sachs 2,787 3 2,122 42 2 Bank of America Merrill Lynch 440 1 1,710 3
3= - Société Génerale 360 1 - -3= - Green Giraffe 360 1 - -5 3 Morgan Stanley 347 1 897 26 - Marathon Capital 344 1 - -7 - UBS Investment Bank 273 1 - -8 - Chadbourne & Parke 253 1 - -9 - Royal Bank of Canada 239 3 - -
10= - KeyBanc Capital Markets 209 1 - -10= - CohnReznick 209 1 - -12 - Barclays 176 2 - -
13= - Banco Espirito Santo 162 1 - -13= - CIBC 162 1 - -15= 4 Citigroup 0 1 870 1
Financial advisors by deal countRanking 2015 2014
2015 2014 Company nameDeal
countValue
(USD m)Deal
countValue
(USD m)
1= 1 Goldman Sachs 3 2,787 4 2,1221= - Royal Bank of Canada 3 239 - -3 - Barclays 2 176 - -
4= 2= Bank of America Merrill Lynch 1 440 3 1,7104= - Green Giraffe 1 360 - -4= - Société Génerale 1 360 - -4= 3 Morgan Stanley 1 347 2 8974= - Marathon Capital 1 344 - -4= - UBS Investment Bank 1 273 - -4= - Chadbourne & Parke 1 253 - -4= - KeyBanc Capital Markets 1 209 - -4= - CohnReznick 1 209 - -4= - CIBC 1 162 - -4= - Banco Espirito Santo 1 162 - -4= 4= Citigroup 1 - 1 870
Legal advisors by valueRanking 2015 2014
2015 2014 Company name Value (USD m)
Deal count
Value (USD m)
Deal count
1 1 Milbank 5,793 22 3,459 152 2 Latham & Watkins 4,642 15 2,945 73 4 Chadbourne & Parke 4,202 21 1,701 94 6 Orrick Herrington & Sutcliffe 3,597 12 920 55 12 Skadden, Arps, Slate, Meagher & Flom 2,418 9 562 36 10 Winston & Strawn 2,215 10 691 27 3 Simpson Thacher & Bartlett 1,471 5 2,443 78 9 Shearman & Sterling 1,400 3 753 29 20= Morgan, Lewis & Bockius 1,173 5 77 1
10 - Morrison & Foerster 1,139 3 - -11 - Gibson, Dunn & Crutcher 954 3 - -12 13 Vinson & Elkins 674 2 560 113 - Squire Patton Boggs 619 1 - -14 - O'Hanlon, McCollom & Demerath 522 1 - -15 - Bracewell & Giuliani 465 1 - -
Legal advisors by deal countRanking 2015 2014
2015 2014 Company nameDeal
countValue
(USD m)Deal
countValue
(USD m)
1 1 Milbank 22 5,793 15 3,4592 2 Chadbourne & Parke 21 4,202 9 1,7013 3= Latham & Watkins 15 4,642 7 2,9454 4 Orrick Herrington & Sutcliffe 12 3,597 5 9205 6= Winston & Strawn 10 2,215 2 6916 5= Skadden, Arps, Slate, Meagher & Flom 9 2,418 3 562
7= 3= Simpson Thacher & Bartlett 5 1,471 7 2,4437= 7= Morgan, Lewis & Bockius 5 1,173 1 779= 6= Shearman & Sterling 3 1,400 2 7539= 7= Morrison & Foerster 3 1,139 1 119= - Gibson, Dunn & Crutcher 3 954 - --12 7= Vinson & Elkins 2 674 1 560
13= - Squire Patton Boggs 1 619 - -13= - O'Hanlon, McCollom & Demerath 1 522 - -13= - Bracewell & Giuliani 1 465 - -
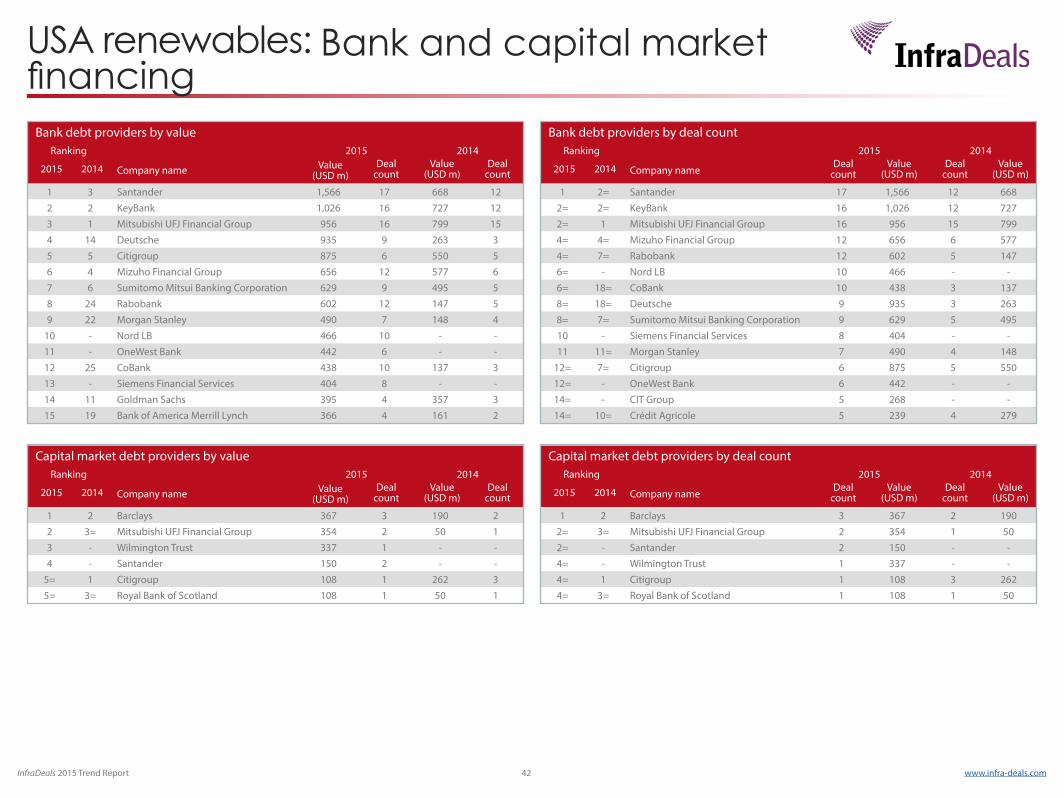
InfraDeals 2015 Trend Report 42 www.infra-deals.com
USA renewables: Bank and capital market financing
Bank debt providers by valueRanking 2015 2014
2015 2014 Company name Value (USD m)
Deal count
Value (USD m)
Deal count
1 3 Santander 1,566 17 668 122 2 KeyBank 1,026 16 727 123 1 Mitsubishi UFJ Financial Group 956 16 799 154 14 Deutsche 935 9 263 35 5 Citigroup 875 6 550 56 4 Mizuho Financial Group 656 12 577 67 6 Sumitomo Mitsui Banking Corporation 629 9 495 58 24 Rabobank 602 12 147 59 22 Morgan Stanley 490 7 148 4
10 - Nord LB 466 10 - -11 - OneWest Bank 442 6 - -12 25 CoBank 438 10 137 313 - Siemens Financial Services 404 8 - -14 11 Goldman Sachs 395 4 357 315 19 Bank of America Merrill Lynch 366 4 161 2
Bank debt providers by deal countRanking 2015 2014
2015 2014 Company nameDeal
countValue
(USD m)Deal
countValue
(USD m)
1 2= Santander 17 1,566 12 6682= 2= KeyBank 16 1,026 12 7272= 1 Mitsubishi UFJ Financial Group 16 956 15 7994= 4= Mizuho Financial Group 12 656 6 5774= 7= Rabobank 12 602 5 1476= - Nord LB 10 466 - -6= 18= CoBank 10 438 3 1378= 18= Deutsche 9 935 3 2638= 7= Sumitomo Mitsui Banking Corporation 9 629 5 49510 - Siemens Financial Services 8 404 - -11 11= Morgan Stanley 7 490 4 148
12= 7= Citigroup 6 875 5 55012= - OneWest Bank 6 442 - -14= - CIT Group 5 268 - -14= 10= Crédit Agricole 5 239 4 279
Capital market debt providers by valueRanking 2015 2014
2015 2014 Company name Value (USD m)
Deal count
Value (USD m)
Deal count
1 2 Barclays 367 3 190 22 3= Mitsubishi UFJ Financial Group 354 2 50 13 - Wilmington Trust 337 1 - -4 - Santander 150 2 - -
5= 1 Citigroup 108 1 262 35= 3= Royal Bank of Scotland 108 1 50 1
Capital market debt providers by deal countRanking 2015 2014
2015 2014 Company nameDeal
countValue
(USD m)Deal
countValue
(USD m)
1 2 Barclays 3 367 2 1902= 3= Mitsubishi UFJ Financial Group 2 354 1 502= - Santander 2 150 - -4= - Wilmington Trust 1 337 - -4= 1 Citigroup 1 108 3 2624= 3= Royal Bank of Scotland 1 108 1 50
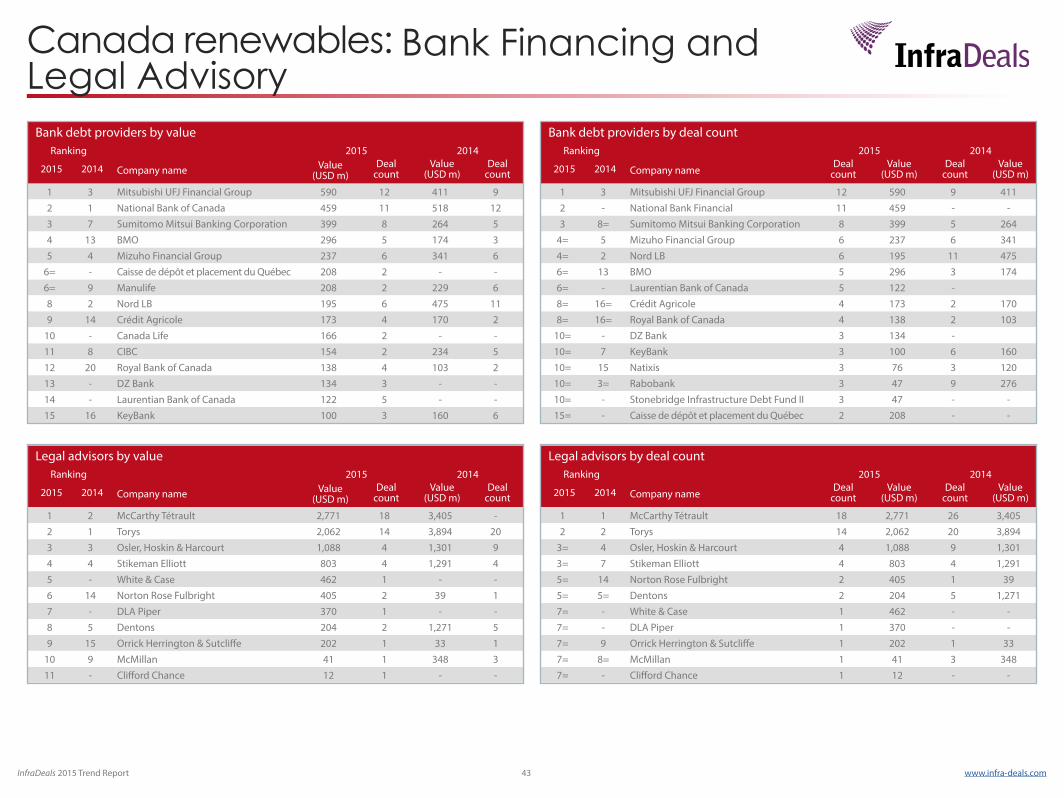
InfraDeals 2015 Trend Report 43 www.infra-deals.com
Canada renewables: Bank Financing and Legal Advisory
Bank debt providers by valueRanking 2015 2014
2015 2014 Company name Value (USD m)
Deal count
Value (USD m)
Deal count
1 3 Mitsubishi UFJ Financial Group 590 12 411 92 1 National Bank of Canada 459 11 518 123 7 Sumitomo Mitsui Banking Corporation 399 8 264 54 13 BMO 296 5 174 35 4 Mizuho Financial Group 237 6 341 6
6= - Caisse de dépôt et placement du Québec 208 2 - -6= 9 Manulife 208 2 229 68 2 Nord LB 195 6 475 119 14 Crédit Agricole 173 4 170 2
10 - Canada Life 166 2 - -11 8 CIBC 154 2 234 512 20 Royal Bank of Canada 138 4 103 213 - DZ Bank 134 3 - -14 - Laurentian Bank of Canada 122 5 - -15 16 KeyBank 100 3 160 6
Bank debt providers by deal countRanking 2015 2014
2015 2014 Company nameDeal
countValue
(USD m)Deal
countValue
(USD m)
1 3 Mitsubishi UFJ Financial Group 12 590 9 4112 - National Bank Financial 11 459 - -3 8= Sumitomo Mitsui Banking Corporation 8 399 5 264
4= 5 Mizuho Financial Group 6 237 6 3414= 2 Nord LB 6 195 11 4756= 13 BMO 5 296 3 1746= - Laurentian Bank of Canada 5 122 -8= 16= Crédit Agricole 4 173 2 1708= 16= Royal Bank of Canada 4 138 2 103
10= - DZ Bank 3 134 -10= 7 KeyBank 3 100 6 16010= 15 Natixis 3 76 3 12010= 3= Rabobank 3 47 9 27610= - Stonebridge Infrastructure Debt Fund II 3 47 - -15= - Caisse de dépôt et placement du Québec 2 208 - -
Legal advisors by valueRanking 2015 2014
2015 2014 Company name Value (USD m)
Deal count
Value (USD m)
Deal count
1 2 McCarthy Tétrault 2,771 18 3,405 -2 1 Torys 2,062 14 3,894 203 3 Osler, Hoskin & Harcourt 1,088 4 1,301 94 4 Stikeman Elliott 803 4 1,291 45 - White & Case 462 1 - -6 14 Norton Rose Fulbright 405 2 39 17 - DLA Piper 370 1 - -8 5 Dentons 204 2 1,271 59 15 Orrick Herrington & Sutcliffe 202 1 33 1
10 9 McMillan 41 1 348 311 - Clifford Chance 12 1 - -
Legal advisors by deal countRanking 2015 2014
2015 2014 Company nameDeal
countValue
(USD m)Deal
countValue
(USD m)
1 1 McCarthy Tétrault 18 2,771 26 3,4052 2 Torys 14 2,062 20 3,894
3= 4 Osler, Hoskin & Harcourt 4 1,088 9 1,3013= 7 Stikeman Elliott 4 803 4 1,2915= 14 Norton Rose Fulbright 2 405 1 395= 5= Dentons 2 204 5 1,2717= - White & Case 1 462 - -7= - DLA Piper 1 370 - -7= 9 Orrick Herrington & Sutcliffe 1 202 1 337= 8= McMillan 1 41 3 3487= - Clifford Chance 1 12 - -
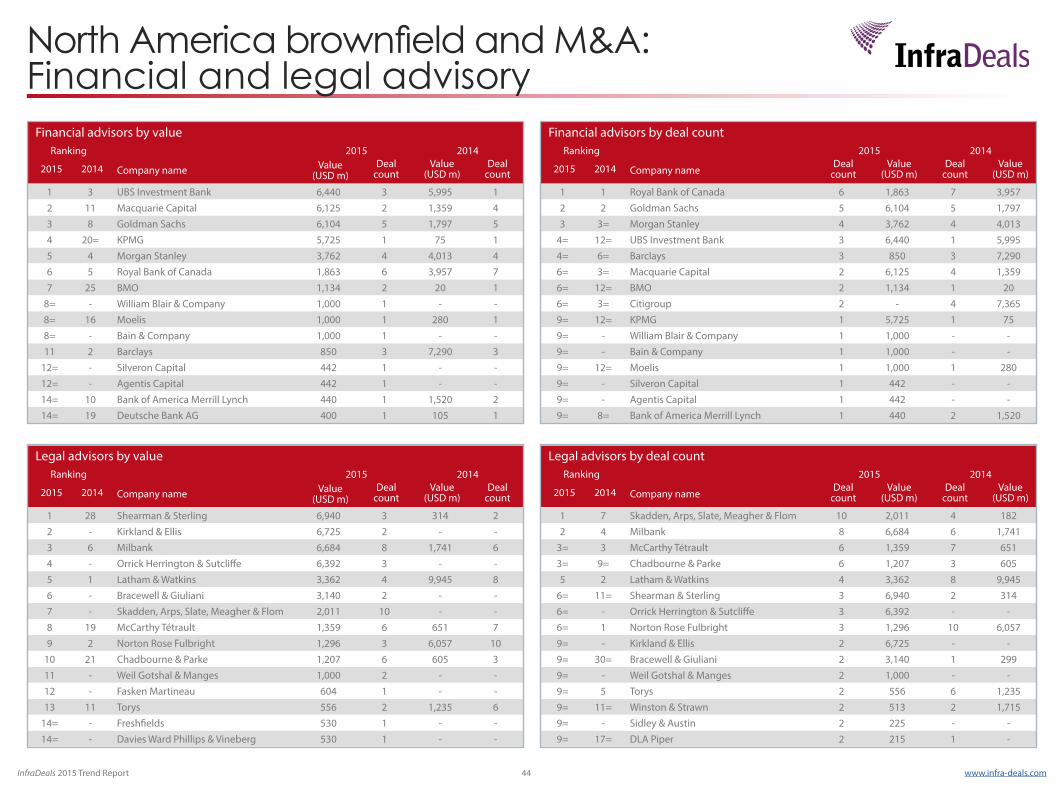
InfraDeals 2015 Trend Report 44 www.infra-deals.com
North America brownfield and M&A: Financial and legal advisory
Financial advisors by valueRanking 2015 2014
2015 2014 Company name Value (USD m)
Deal count
Value (USD m)
Deal count
1 3 UBS Investment Bank 6,440 3 5,995 12 11 Macquarie Capital 6,125 2 1,359 43 8 Goldman Sachs 6,104 5 1,797 54 20= KPMG 5,725 1 75 15 4 Morgan Stanley 3,762 4 4,013 46 5 Royal Bank of Canada 1,863 6 3,957 77 25 BMO 1,134 2 20 1
8= - William Blair & Company 1,000 1 - -8= 16 Moelis 1,000 1 280 18= - Bain & Company 1,000 1 - -11 2 Barclays 850 3 7,290 3
12= - Silveron Capital 442 1 - -12= - Agentis Capital 442 1 - -14= 10 Bank of America Merrill Lynch 440 1 1,520 214= 19 Deutsche Bank AG 400 1 105 1
Financial advisors by deal countRanking 2015 2014
2015 2014 Company nameDeal
countValue
(USD m)Deal
countValue
(USD m)
1 1 Royal Bank of Canada 6 1,863 7 3,9572 2 Goldman Sachs 5 6,104 5 1,7973 3= Morgan Stanley 4 3,762 4 4,013
4= 12= UBS Investment Bank 3 6,440 1 5,9954= 6= Barclays 3 850 3 7,2906= 3= Macquarie Capital 2 6,125 4 1,3596= 12= BMO 2 1,134 1 206= 3= Citigroup 2 - 4 7,3659= 12= KPMG 1 5,725 1 759= - William Blair & Company 1 1,000 - -9= - Bain & Company 1 1,000 - -9= 12= Moelis 1 1,000 1 2809= - Silveron Capital 1 442 - -9= - Agentis Capital 1 442 - -9= 8= Bank of America Merrill Lynch 1 440 2 1,520
Legal advisors by valueRanking 2015 2014
2015 2014 Company name Value (USD m)
Deal count
Value (USD m)
Deal count
1 28 Shearman & Sterling 6,940 3 314 22 - Kirkland & Ellis 6,725 2 - -3 6 Milbank 6,684 8 1,741 64 - Orrick Herrington & Sutcliffe 6,392 3 - -5 1 Latham & Watkins 3,362 4 9,945 86 - Bracewell & Giuliani 3,140 2 - -7 - Skadden, Arps, Slate, Meagher & Flom 2,011 10 - -8 19 McCarthy Tétrault 1,359 6 651 79 2 Norton Rose Fulbright 1,296 3 6,057 10
10 21 Chadbourne & Parke 1,207 6 605 311 - Weil Gotshal & Manges 1,000 2 - -12 - Fasken Martineau 604 1 - -13 11 Torys 556 2 1,235 6
14= - Freshfields 530 1 - -14= - Davies Ward Phillips & Vineberg 530 1 - -
Legal advisors by deal countRanking 2015 2014
2015 2014 Company nameDeal
countValue
(USD m)Deal
countValue
(USD m)
1 7 Skadden, Arps, Slate, Meagher & Flom 10 2,011 4 1822 4 Milbank 8 6,684 6 1,741
3= 3 McCarthy Tétrault 6 1,359 7 6513= 9= Chadbourne & Parke 6 1,207 3 6055 2 Latham & Watkins 4 3,362 8 9,945
6= 11= Shearman & Sterling 3 6,940 2 3146= - Orrick Herrington & Sutcliffe 3 6,392 - -6= 1 Norton Rose Fulbright 3 1,296 10 6,0579= - Kirkland & Ellis 2 6,725 - -9= 30= Bracewell & Giuliani 2 3,140 1 2999= - Weil Gotshal & Manges 2 1,000 - -9= 5 Torys 2 556 6 1,2359= 11= Winston & Strawn 2 513 2 1,7159= - Sidley & Austin 2 225 - -9= 17= DLA Piper 2 215 1 -
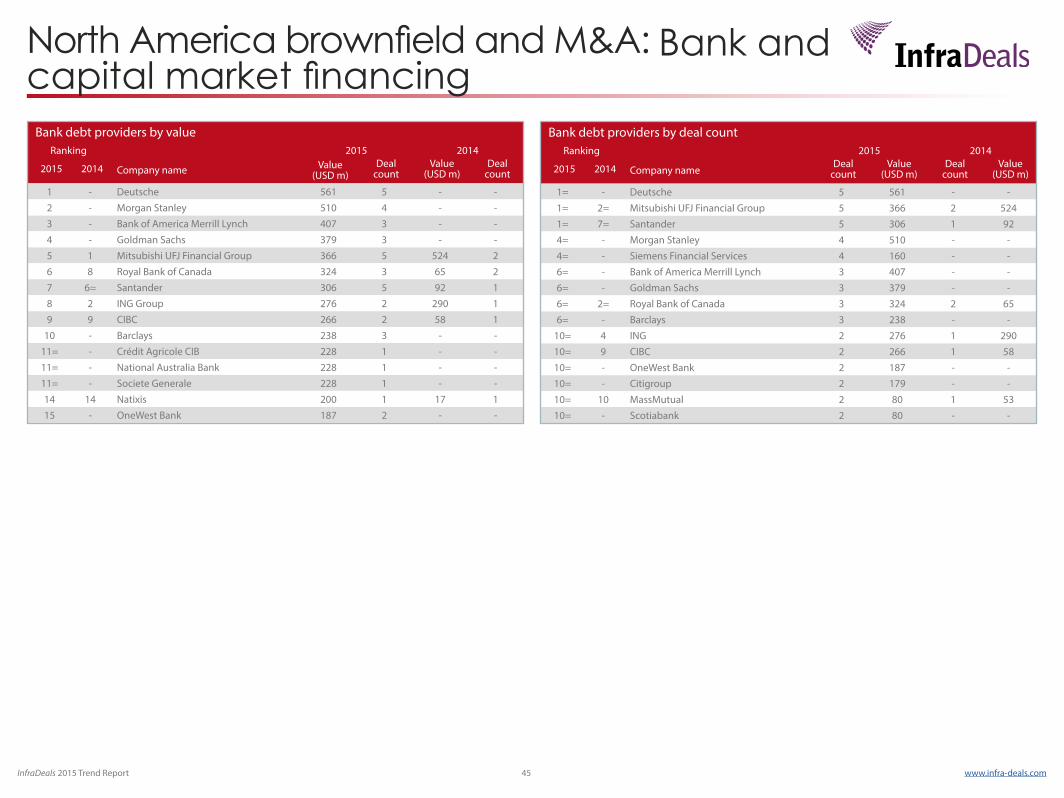
InfraDeals 2015 Trend Report 45 www.infra-deals.com
North America brownfield and M&A: Bank and capital market financing
Bank debt providers by deal countRanking 2015 2014
2015 2014 Company nameDeal
countValue
(USD m)Deal
countValue
(USD m)
1= - Deutsche 5 561 - -1= 2= Mitsubishi UFJ Financial Group 5 366 2 5241= 7= Santander 5 306 1 924= - Morgan Stanley 4 510 - -4= - Siemens Financial Services 4 160 - -6= - Bank of America Merrill Lynch 3 407 - -6= - Goldman Sachs 3 379 - -6= 2= Royal Bank of Canada 3 324 2 656= - Barclays 3 238 - -
10= 4 ING 2 276 1 29010= 9 CIBC 2 266 1 5810= - OneWest Bank 2 187 - -10= - Citigroup 2 179 - -10= 10 MassMutual 2 80 1 5310= - Scotiabank 2 80 - -
Bank debt providers by valueRanking 2015 2014
2015 2014 Company name Value (USD m)
Deal count
Value (USD m)
Deal count
1 - Deutsche 561 5 - -2 - Morgan Stanley 510 4 - -3 - Bank of America Merrill Lynch 407 3 - -4 - Goldman Sachs 379 3 - -5 1 Mitsubishi UFJ Financial Group 366 5 524 26 8 Royal Bank of Canada 324 3 65 27 6= Santander 306 5 92 18 2 ING Group 276 2 290 19 9 CIBC 266 2 58 1
10 - Barclays 238 3 - -11= - Crédit Agricole CIB 228 1 - -11= - National Australia Bank 228 1 - -11= - Societe Generale 228 1 - -14 14 Natixis 200 1 17 115 - OneWest Bank 187 2 - -

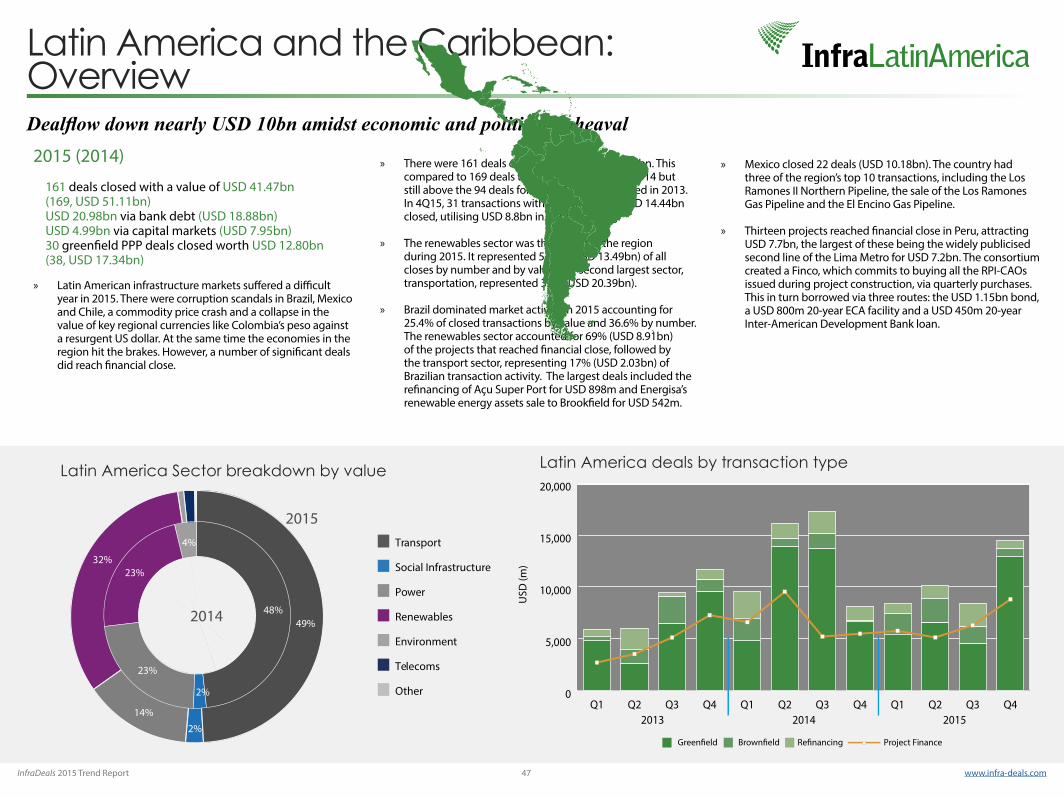
InfraDeals 2015 Trend Report 47 www.infra-deals.com
» Latin American infrastructure markets suffered a difficult year in 2015. There were corruption scandals in Brazil, Mexico and Chile, a commodity price crash and a collapse in the value of key regional currencies like Colombia’s peso against a resurgent US dollar. At the same time the economies in the region hit the brakes. However, a number of significant deals did reach financial close.
Dealflow down nearly USD 10bn amidst economic and political upheaval
» There were 161 deals closed, totalling USD 41.47bn. This compared to 169 deals totalling USD 51.1bn in 2014 but still above the 94 deals for USD 33.07bn registered in 2013. In 4Q15, 31 transactions with a total value of USD 14.44bn closed, utilising USD 8.8bn in debt financing.
» The renewables sector was the largest in the region during 2015. It represented 51.5% (USD 13.49bn) of all closes by number and by value. The second largest sector, transportation, represented 32% (USD 20.39bn).
» Brazil dominated market activity in 2015 accounting for 25.4% of closed transactions by value and 36.6% by number. The renewables sector accounted for 69% (USD 8.91bn) of the projects that reached financial close, followed by the transport sector, representing 17% (USD 2.03bn) of Brazilian transaction activity. The largest deals included the refinancing of Açu Super Port for USD 898m and Energisa’s renewable energy assets sale to Brookfield for USD 542m.
» Mexico closed 22 deals (USD 10.18bn). The country had three of the region’s top 10 transactions, including the Los Ramones II Northern Pipeline, the sale of the Los Ramones Gas Pipeline and the El Encino Gas Pipeline.
» Thirteen projects reached financial close in Peru, attracting USD 7.7bn, the largest of these being the widely publicised second line of the Lima Metro for USD 7.2bn. The consortium created a Finco, which commits to buying all the RPI-CAOs issued during project construction, via quarterly purchases. This in turn borrowed via three routes: the USD 1.15bn bond, a USD 800m 20-year ECA facility and a USD 450m 20-year Inter-American Development Bank loan.
2015 (2014)
161 deals closed with a value of USD 41.47bn (169, USD 51.11bn) USD 20.98bn via bank debt (USD 18.88bn) USD 4.99bn via capital markets (USD 7.95bn) 30 greenfield PPP deals closed worth USD 12.80bn (38, USD 17.34bn)
Latin America Sector breakdown by value
Latin America and the Caribbean: Overview
48%
23%
23%
14%
49%
2%
2%
32%
4%
2014
2015
Other
Environment
Renewables
Power
Social Infrastructure
Transport
Telecoms
Latin America deals by transaction type
USD
(m)
0
5,000
10,000
15,000
20,000
Q4Q3Q2Q1Q4Q3Q2Q1Q4Q3Q2Q12013 2014 2015
Project Finance
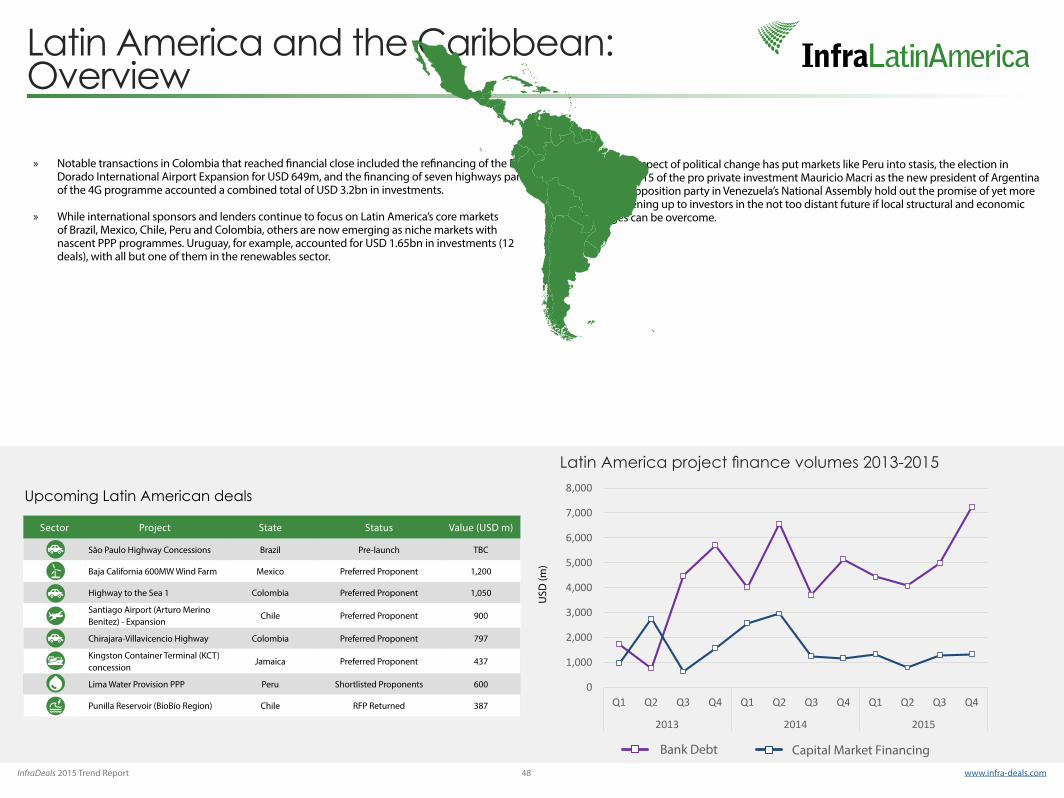
InfraDeals 2015 Trend Report 48 www.infra-deals.com
» Notable transactions in Colombia that reached financial close included the refinancing of the El Dorado International Airport Expansion for USD 649m, and the financing of seven highways part of the 4G programme accounted a combined total of USD 3.2bn in investments.
» While international sponsors and lenders continue to focus on Latin America’s core markets of Brazil, Mexico, Chile, Peru and Colombia, others are now emerging as niche markets with nascent PPP programmes. Uruguay, for example, accounted for USD 1.65bn in investments (12 deals), with all but one of them in the renewables sector.
» While the prospect of political change has put markets like Peru into stasis, the election in November 2015 of the pro private investment Mauricio Macri as the new president of Argentina and of the opposition party in Venezuela’s National Assembly hold out the promise of yet more markets opening up to investors in the not too distant future if local structural and economic challenges can be overcome.
Latin America and the Caribbean: Overview
USD
(m)
0
1,000
2,000
3,000
4,000
5,000
6,000
7,000
8,000
Q1 Q2 Q3 Q4 Q1 Q2 Q3 Q4 Q1 Q2 Q3 Q4
2013 2014 2015
Latin America project finance volumes 2013-2015
Bank Debt Capital Market Financing
Sector Project State Status Value (USD m)
São Paulo Highway Concessions Brazil Pre-launch TBC
Baja California 600MW Wind Farm Mexico Preferred Proponent 1,200
Highway to the Sea 1 Colombia Preferred Proponent 1,050
Santiago Airport (Arturo Merino Benitez) - Expansion
Chile Preferred Proponent 900
Chirajara-Villavicencio Highway Colombia Preferred Proponent 797
Kingston Container Terminal (KCT) concession
Jamaica Preferred Proponent 437
Lima Water Provision PPP Peru Shortlisted Proponents 600
Punilla Reservoir (BíoBío Region) Chile RFP Returned 387
Upcoming Latin American deals
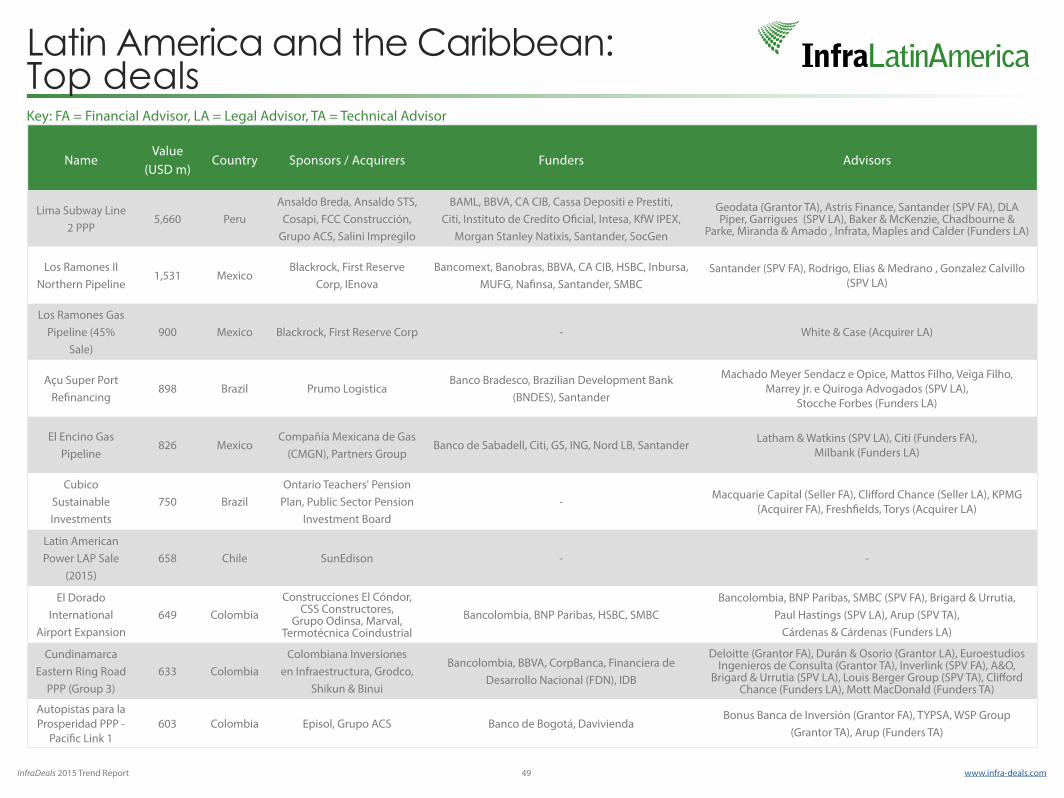
InfraDeals 2015 Trend Report 49 www.infra-deals.com
Latin America and the Caribbean: Top deals
NameValue
(USD m)Country Sponsors / Acquirers Funders Advisors
Lima Subway Line 2 PPP
5,660 PeruAnsaldo Breda, Ansaldo STS,
Cosapi, FCC Construcción, Grupo ACS, Salini Impregilo
BAML, BBVA, CA CIB, Cassa Depositi e Prestiti, Citi, Instituto de Credito Oficial, Intesa, KfW IPEX,
Morgan Stanley Natixis, Santander, SocGen
Geodata (Grantor TA), Astris Finance, Santander (SPV FA), DLA Piper, Garrigues (SPV LA), Baker & McKenzie, Chadbourne &
Parke, Miranda & Amado , Infrata, Maples and Calder (Funders LA)
Los Ramones II Northern Pipeline
1,531 MexicoBlackrock, First Reserve
Corp, IEnova Bancomext, Banobras, BBVA, CA CIB, HSBC, Inbursa,
MUFG, Nafinsa, Santander, SMBCSantander (SPV FA), Rodrigo, Elias & Medrano , Gonzalez Calvillo
(SPV LA)
Los Ramones Gas Pipeline (45%
Sale)900 Mexico Blackrock, First Reserve Corp - White & Case (Acquirer LA)
Açu Super Port Refinancing
898 Brazil Prumo LogisticaBanco Bradesco, Brazilian Development Bank
(BNDES), Santander
Machado Meyer Sendacz e Opice, Mattos Filho, Veiga Filho, Marrey jr. e Quiroga Advogados (SPV LA),
Stocche Forbes (Funders LA)
El Encino Gas Pipeline
826 MexicoCompañía Mexicana de Gas
(CMGN), Partners GroupBanco de Sabadell, Citi, GS, ING, Nord LB, Santander
Latham & Watkins (SPV LA), Citi (Funders FA), Milbank (Funders LA)
Cubico Sustainable Investments
750 BrazilOntario Teachers' Pension
Plan, Public Sector Pension Investment Board
-Macquarie Capital (Seller FA), Clifford Chance (Seller LA), KPMG
(Acquirer FA), Freshfields, Torys (Acquirer LA)
Latin American Power LAP Sale
(2015)658 Chile SunEdison - -
El Dorado International
Airport Expansion649 Colombia
Construcciones El Cóndor, CSS Constructores,
Grupo Odinsa, Marval, Termotécnica Coindustrial
Bancolombia, BNP Paribas, HSBC, SMBCBancolombia, BNP Paribas, SMBC (SPV FA), Brigard & Urrutia,
Paul Hastings (SPV LA), Arup (SPV TA), Cárdenas & Cárdenas (Funders LA)
Cundinamarca Eastern Ring Road
PPP (Group 3)633 Colombia
Colombiana Inversiones en Infraestructura, Grodco,
Shikun & Binui
Bancolombia, BBVA, CorpBanca, Financiera de Desarrollo Nacional (FDN), IDB
Deloitte (Grantor FA), Durán & Osorio (Grantor LA), Euroestudios Ingenieros de Consulta (Grantor TA), Inverlink (SPV FA), A&O,
Brigard & Urrutia (SPV LA), Louis Berger Group (SPV TA), Clifford Chance (Funders LA), Mott MacDonald (Funders TA)
Autopistas para la Prosperidad PPP -
Pacific Link 1603 Colombia Episol, Grupo ACS Banco de Bogotá, Davivienda
Bonus Banca de Inversión (Grantor FA), TYPSA, WSP Group (Grantor TA), Arup (Funders TA)
Key: FA = Financial Advisor, LA = Legal Advisor, TA = Technical Advisor
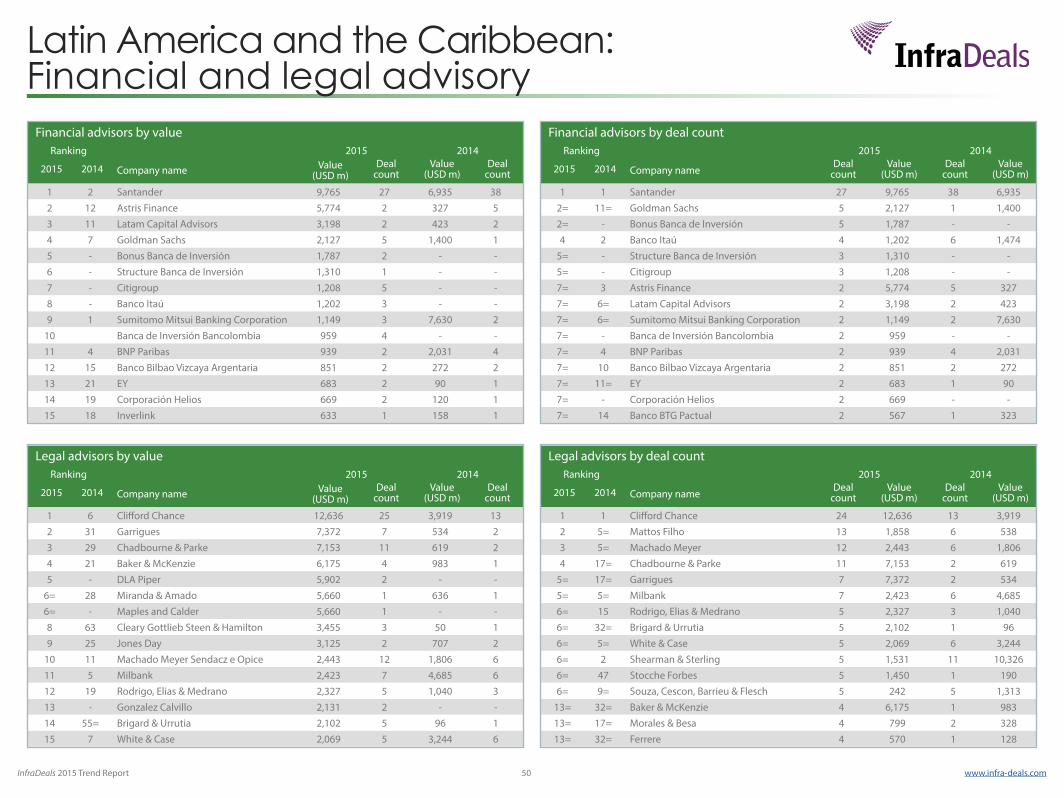
InfraDeals 2015 Trend Report 50 www.infra-deals.com
Latin America and the Caribbean: Financial and legal advisory
Financial advisors by valueRanking 2015 2014
2015 2014 Company name Value (USD m)
Deal count
Value (USD m)
Deal count
1 2 Santander 9,765 27 6,935 382 12 Astris Finance 5,774 2 327 53 11 Latam Capital Advisors 3,198 2 423 24 7 Goldman Sachs 2,127 5 1,400 15 - Bonus Banca de Inversión 1,787 2 - -6 - Structure Banca de Inversión 1,310 1 - -7 - Citigroup 1,208 5 - -8 - Banco Itaú 1,202 3 - -9 1 Sumitomo Mitsui Banking Corporation 1,149 3 7,630 2
10 Banca de Inversión Bancolombia 959 4 - -11 4 BNP Paribas 939 2 2,031 412 15 Banco Bilbao Vizcaya Argentaria 851 2 272 213 21 EY 683 2 90 114 19 Corporación Helios 669 2 120 115 18 Inverlink 633 1 158 1
Financial advisors by deal countRanking 2015 2014
2015 2014 Company nameDeal
countValue
(USD m)Deal
countValue
(USD m)
1 1 Santander 27 9,765 38 6,9352= 11= Goldman Sachs 5 2,127 1 1,4002= - Bonus Banca de Inversión 5 1,787 - -4 2 Banco Itaú 4 1,202 6 1,474
5= - Structure Banca de Inversión 3 1,310 - -5= - Citigroup 3 1,208 - -7= 3 Astris Finance 2 5,774 5 3277= 6= Latam Capital Advisors 2 3,198 2 4237= 6= Sumitomo Mitsui Banking Corporation 2 1,149 2 7,6307= - Banca de Inversión Bancolombia 2 959 - -7= 4 BNP Paribas 2 939 4 2,0317= 10 Banco Bilbao Vizcaya Argentaria 2 851 2 2727= 11= EY 2 683 1 907= - Corporación Helios 2 669 - -7= 14 Banco BTG Pactual 2 567 1 323
Legal advisors by valueRanking 2015 2014
2015 2014 Company name Value (USD m)
Deal count
Value (USD m)
Deal count
1 6 Clifford Chance 12,636 25 3,919 132 31 Garrigues 7,372 7 534 23 29 Chadbourne & Parke 7,153 11 619 24 21 Baker & McKenzie 6,175 4 983 15 - DLA Piper 5,902 2 - -
6= 28 Miranda & Amado 5,660 1 636 16= - Maples and Calder 5,660 1 - -8 63 Cleary Gottlieb Steen & Hamilton 3,455 3 50 19 25 Jones Day 3,125 2 707 2
10 11 Machado Meyer Sendacz e Opice 2,443 12 1,806 611 5 Milbank 2,423 7 4,685 612 19 Rodrigo, Elias & Medrano 2,327 5 1,040 313 - Gonzalez Calvillo 2,131 2 - -14 55= Brigard & Urrutia 2,102 5 96 115 7 White & Case 2,069 5 3,244 6
Legal advisors by deal countRanking 2015 2014
2015 2014 Company nameDeal
countValue
(USD m)Deal
countValue
(USD m)
1 1 Clifford Chance 24 12,636 13 3,9192 5= Mattos Filho 13 1,858 6 5383 5= Machado Meyer 12 2,443 6 1,8064 17= Chadbourne & Parke 11 7,153 2 619
5= 17= Garrigues 7 7,372 2 5345= 5= Milbank 7 2,423 6 4,6856= 15 Rodrigo, Elias & Medrano 5 2,327 3 1,0406= 32= Brigard & Urrutia 5 2,102 1 966= 5= White & Case 5 2,069 6 3,2446= 2 Shearman & Sterling 5 1,531 11 10,3266= 47 Stocche Forbes 5 1,450 1 1906= 9= Souza, Cescon, Barrieu & Flesch 5 242 5 1,313
13= 32= Baker & McKenzie 4 6,175 1 98313= 17= Morales & Besa 4 799 2 32813= 32= Ferrere 4 570 1 128

InfraDeals 2015 Trend Report 51 www.infra-deals.com
Latin America and the Caribbean: Bank and Capital Market Financing
Bank debt providers by valueRanking 2015 2014
2015 2014 Company name Value (USD m)
Deal count
Value (USD m)
Deal count
1 1 Santander 3,016 47 1,722 392 2 Goldman Sachs 1,059 5 794 13 20 Scotiabank 788 6 133 14 12 Sumitomo Mitsui Banking Corporation 763 9 277 45 8 Banco Bilbao Vizcaya Argentaria 710 11 375 66 3 Banco Bradesco 697 11 640 167 19 Banco Itaú 604 8 184 98 7 HSBC 575 4 382 49 5 CorpBanca 490 7 563 6
10 49= KfW IPEX 488 5 15 111 9 Citigroup 473 3 312 312 17 Crédit Agricole 404 5 189 413 - JP Morgan 400 2 - -14 33 BNP Paribas 394 12 64 315 - Industrial and Commercial Bank of China 359 3 - -
Bank debt providers by deal countRanking 2015 2014
2015 2014 Company nameDeal
countValue
(USD m)Deal
countValue
(USD m)
1 1 Santander 47 3,016 39 1,7222 15= BNP Paribas 12 394 3 64
3= 6= Banco Bilbao Vizcaya Argentaria 11 710 6 3753= 2 Banco Bradesco 11 697 16 6403= 6= Banco BTG Pactual 11 277 6 4636 4 ING 10 359 8 1137 12 Sumitomo Mitsui Banking Corporation 9 763 4 2778 3 Banco Itaú 8 604 9 1849 6= CorpBanca 7 490 6 563
10 25= Scotiabank 6 788 1 13311= 25= Goldman Sachs 5 1,059 1 79411= 25= KfW IPEX 5 488 - -11= 14 Crédit Agricole 5 404 4 18911= 25= Bancolombia 5 315 1 3111= - Davivienda 5 103 - -
Capital market debt providers by valueRanking 2015 2014
2015 2014 Company name Value (USD m)
Deal count
Value (USD m)
Deal count
1 7 Santander 775 11 289 52 1 Goldman Sachs 665 4 1,772 43 3 Citigroup 458 3 564 34 10 Banco Itaú 381 2 230 45 12 Scotiabank 314 4 200 26 - Morgan Stanley 308 1 - -7 17 Bank of America Merrill Lynch 251 3 102 28 4 Banco BTG Pactual 180 4 384 59 20 Banorte 140 2 61 1
10= 11 Banco Espirito Santo 137 1 209 110= - Credit Suisse 137 1 - -12 8 BNP Paribas 126 2 279 213 - Itaúsa 106 2 - -14 2 HSBC 101 2 855 9
15= 16 JP Morgan 85 1 131 1
Capital market debt providers by deal countRanking 2015 2014
2015 2014 Company nameDeal
countValue
(USD m)Deal
countValue
(USD m)
1 3= Santander 11 775 5 2892= 5= Goldman Sachs 4 665 4 1,7722= 11= Scotiabank 4 314 2 2002= 3= Banco BTG Pactual 4 180 5 3845= 7= Citigroup 3 458 3 5645= 11= Bank of America Merrill Lynch 3 251 2 1027= 5= Banco Itaú 2 381 4 2307= 14= Banorte 2 140 1 617= 11= BNP Paribas 2 126 2 2797= - Itaúsa 2 106 - -7= 1 HSBC 2 101 9 8557= 2 Banco do Brasil 2 78 7 2497= 7= Banco Bilbao Vizcaya Argentaria 2 56 3 33314 - Morgan Stanley 1 308 - -
15= 14 Banco Espirito Santo 1 137 1 209
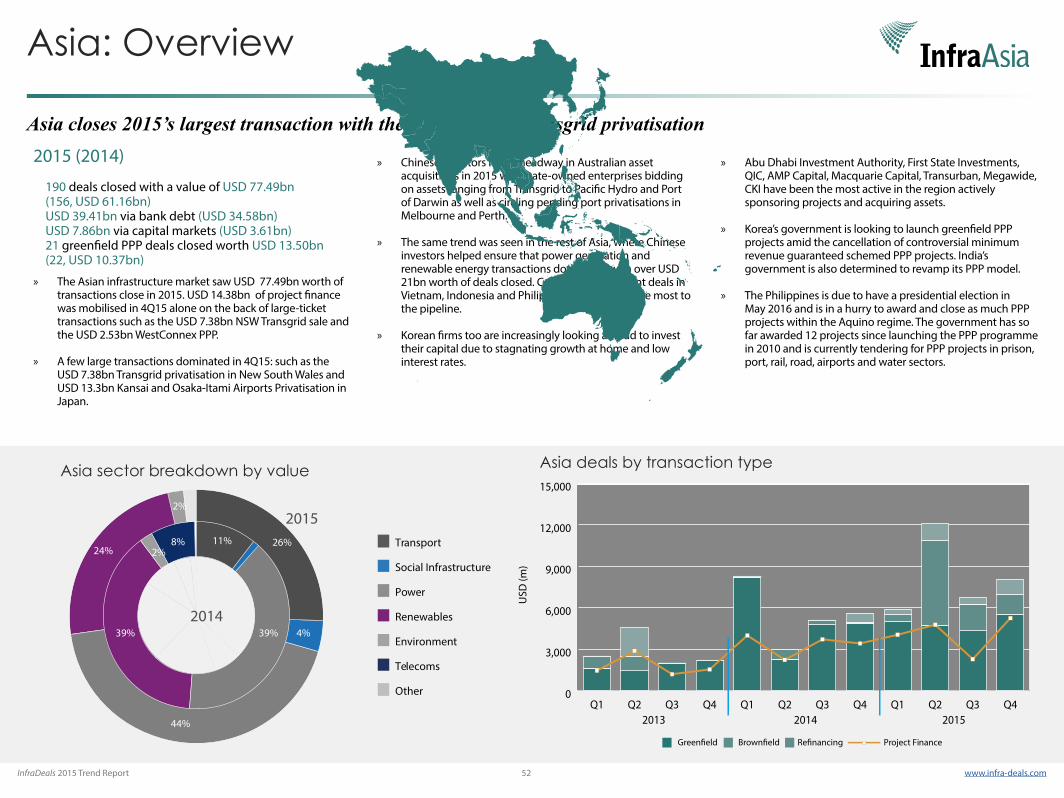
InfraDeals 2015 Trend Report 52 www.infra-deals.com
» The Asian infrastructure market saw USD 77.49bn worth of transactions close in 2015. USD 14.38bn of project finance was mobilised in 4Q15 alone on the back of large-ticket transactions such as the USD 7.38bn NSW Transgrid sale and the USD 2.53bn WestConnex PPP.
» A few large transactions dominated in 4Q15: such as the USD 7.38bn Transgrid privatisation in New South Wales and USD 13.3bn Kansai and Osaka-Itami Airports Privatisation in Japan.
Asia closes 2015’s largest transaction with the USD 7.38bn Transgrid privatisation
» Chinese investors made headway in Australian asset acquisitions in 2015 with state-owned enterprises bidding on assets ranging from Transgrid to Pacific Hydro and Port of Darwin as well as circling pending port privatisations in Melbourne and Perth.
» The same trend was seen in the rest of Asia, where Chinese investors helped ensure that power generation and renewable energy transactions dominated with over USD 21bn worth of deals closed. Coal-fired power plant deals in Vietnam, Indonesia and Philippines contributed the most to the pipeline.
» Korean firms too are increasingly looking abroad to invest their capital due to stagnating growth at home and low interest rates.
2015 (2014)
190 deals closed with a value of USD 77.49bn (156, USD 61.16bn) USD 39.41bn via bank debt (USD 34.58bn) USD 7.86bn via capital markets (USD 3.61bn) 21 greenfield PPP deals closed worth USD 13.50bn (22, USD 10.37bn)
Asia sector breakdown by value
Asia: Overview
» Abu Dhabi Investment Authority, First State Investments, QIC, AMP Capital, Macquarie Capital, Transurban, Megawide, CKI have been the most active in the region actively sponsoring projects and acquiring assets.
» Korea’s government is looking to launch greenfield PPP projects amid the cancellation of controversial minimum revenue guaranteed schemed PPP projects. India’s government is also determined to revamp its PPP model.
» The Philippines is due to have a presidential election in May 2016 and is in a hurry to award and close as much PPP projects within the Aquino regime. The government has so far awarded 12 projects since launching the PPP programme in 2010 and is currently tendering for PPP projects in prison, port, rail, road, airports and water sectors.
26%8%
39%
44%
24% 2%
39%
11%
2%
4%2014
2015
Other
Environment
Renewables
Power
Social Infrastructure
Transport
Telecoms
Asia deals by transaction type
USD
(m)
0
3,000
6,000
9,000
12,000
15,000
Q4Q3Q2Q1Q4Q3Q2Q1Q4Q3Q2Q12013 2014 2015
Project Finance
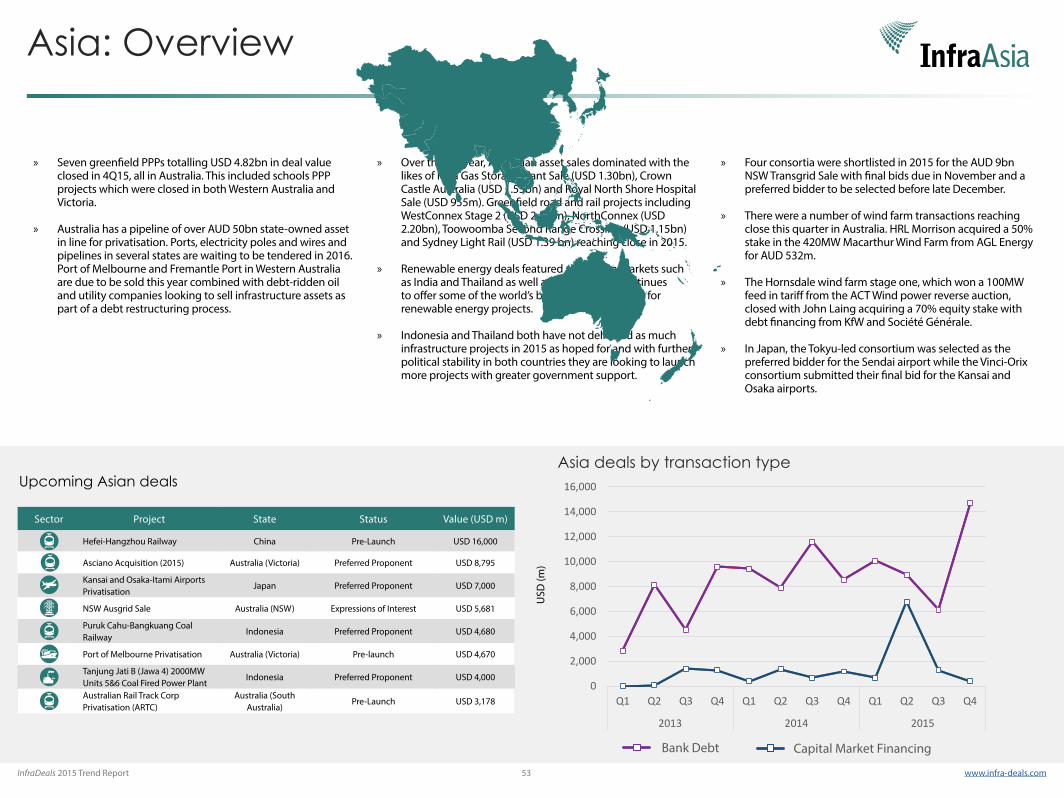
InfraDeals 2015 Trend Report 53 www.infra-deals.com
» Seven greenfield PPPs totalling USD 4.82bn in deal value closed in 4Q15, all in Australia. This included schools PPP projects which were closed in both Western Australia and Victoria.
» Australia has a pipeline of over AUD 50bn state-owned asset in line for privatisation. Ports, electricity poles and wires and pipelines in several states are waiting to be tendered in 2016. Port of Melbourne and Fremantle Port in Western Australia are due to be sold this year combined with debt-ridden oil and utility companies looking to sell infrastructure assets as part of a debt restructuring process.
» Over the full year, Australian asset sales dominated with the likes of Iona Gas Storage Plant Sale (USD 1.30bn), Crown Castle Australia (USD 1.55bn) and Royal North Shore Hospital Sale (USD 955m). Greenfield road and rail projects including WestConnex Stage 2 (USD 2.53bn), NorthConnex (USD 2.20bn), Toowoomba Second Range Crossing (USD 1.15bn) and Sydney Light Rail (USD 1.39 bn) reaching close in 2015.
» Renewable energy deals featured strongly in markets such as India and Thailand as well as Japan, which continues to offer some of the world’s best feed-in tariff rates for renewable energy projects.
» Indonesia and Thailand both have not delivered as much infrastructure projects in 2015 as hoped for and with further political stability in both countries they are looking to launch more projects with greater government support.
Asia: Overview
» Four consortia were shortlisted in 2015 for the AUD 9bn NSW Transgrid Sale with final bids due in November and a preferred bidder to be selected before late December.
» There were a number of wind farm transactions reaching close this quarter in Australia. HRL Morrison acquired a 50% stake in the 420MW Macarthur Wind Farm from AGL Energy for AUD 532m.
» The Hornsdale wind farm stage one, which won a 100MW feed in tariff from the ACT Wind power reverse auction, closed with John Laing acquiring a 70% equity stake with debt financing from KfW and Société Générale.
» In Japan, the Tokyu-led consortium was selected as the preferred bidder for the Sendai airport while the Vinci-Orix consortium submitted their final bid for the Kansai and Osaka airports.
USD
(m)
Sector Project State Status Value (USD m)
Hefei-Hangzhou Railway China Pre-Launch USD 16,000
Asciano Acquisition (2015) Australia (Victoria) Preferred Proponent USD 8,795
Kansai and Osaka-Itami Airports Privatisation
Japan Preferred Proponent USD 7,000
NSW Ausgrid Sale Australia (NSW) Expressions of Interest USD 5,681
Puruk Cahu-Bangkuang Coal Railway
Indonesia Preferred Proponent USD 4,680
Port of Melbourne Privatisation Australia (Victoria) Pre-launch USD 4,670
Tanjung Jati B (Jawa 4) 2000MW Units 5&6 Coal Fired Power Plant
Indonesia Preferred Proponent USD 4,000
Australian Rail Track Corp Privatisation (ARTC)
Australia (South Australia)
Pre-Launch USD 3,178
Upcoming Asian dealsAsia deals by transaction type
Bank Debt Capital Market Financing
0
2,000
4,000
6,000
8,000
10,000
12,000
14,000
16,000
Q1 Q2 Q3 Q4 Q1 Q2 Q3 Q4 Q1 Q2 Q3 Q4
2013 2014 2015
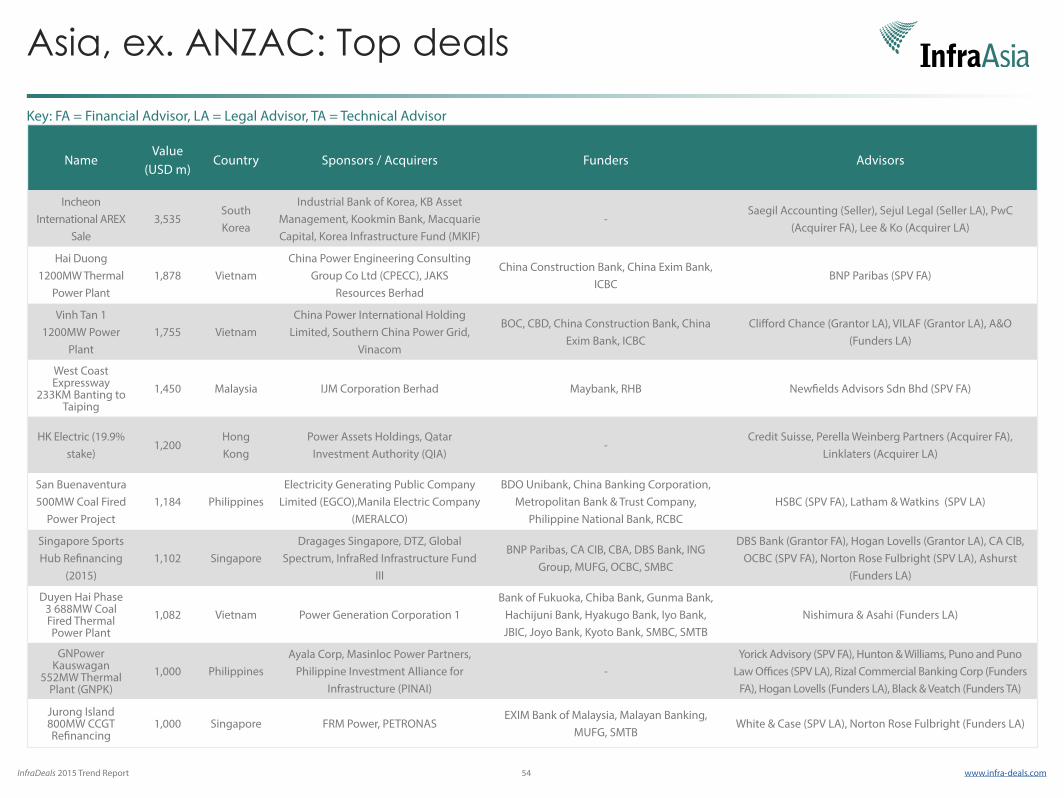
InfraDeals 2015 Trend Report 54 www.infra-deals.com
Asia, ex. ANZAC: Top deals
NameValue
(USD m)Country Sponsors / Acquirers Funders Advisors
Incheon International AREX
Sale3,535
South Korea
Industrial Bank of Korea, KB Asset Management, Kookmin Bank, Macquarie Capital, Korea Infrastructure Fund (MKIF)
- Saegil Accounting (Seller), Sejul Legal (Seller LA), PwC
(Acquirer FA), Lee & Ko (Acquirer LA)
Hai Duong 1200MW Thermal
Power Plant1,878 Vietnam
China Power Engineering Consulting Group Co Ltd (CPECC), JAKS
Resources Berhad
China Construction Bank, China Exim Bank, ICBC
BNP Paribas (SPV FA)
Vinh Tan 1 1200MW Power
Plant1,755 Vietnam
China Power International Holding Limited, Southern China Power Grid,
Vinacom
BOC, CBD, China Construction Bank, China Exim Bank, ICBC
Clifford Chance (Grantor LA), VILAF (Grantor LA), A&O (Funders LA)
West Coast Expressway
233KM Banting to Taiping
1,450 Malaysia IJM Corporation Berhad Maybank, RHB Newfields Advisors Sdn Bhd (SPV FA)
HK Electric (19.9% stake)
1,200Hong Kong
Power Assets Holdings, Qatar Investment Authority (QIA)
- Credit Suisse, Perella Weinberg Partners (Acquirer FA),
Linklaters (Acquirer LA)
San Buenaventura 500MW Coal Fired
Power Project1,184 Philippines
Electricity Generating Public Company Limited (EGCO),Manila Electric Company
(MERALCO)
BDO Unibank, China Banking Corporation, Metropolitan Bank & Trust Company,
Philippine National Bank, RCBCHSBC (SPV FA), Latham & Watkins (SPV LA)
Singapore Sports Hub Refinancing
(2015)1,102 Singapore
Dragages Singapore, DTZ, Global Spectrum, InfraRed Infrastructure Fund
III
BNP Paribas, CA CIB, CBA, DBS Bank, ING Group, MUFG, OCBC, SMBC
DBS Bank (Grantor FA), Hogan Lovells (Grantor LA), CA CIB, OCBC (SPV FA), Norton Rose Fulbright (SPV LA), Ashurst
(Funders LA)
Duyen Hai Phase 3 688MW Coal Fired Thermal Power Plant
1,082 Vietnam Power Generation Corporation 1Bank of Fukuoka, Chiba Bank, Gunma Bank,
Hachijuni Bank, Hyakugo Bank, Iyo Bank, JBIC, Joyo Bank, Kyoto Bank, SMBC, SMTB
Nishimura & Asahi (Funders LA)
GNPower Kauswagan
552MW Thermal Plant (GNPK)
1,000 PhilippinesAyala Corp, Masinloc Power Partners,
Philippine Investment Alliance for Infrastructure (PINAI)
- Yorick Advisory (SPV FA), Hunton & Williams, Puno and Puno
Law Offices (SPV LA), Rizal Commercial Banking Corp (Funders FA), Hogan Lovells (Funders LA), Black & Veatch (Funders TA)
Jurong Island 800MW CCGT Refinancing
1,000 Singapore FRM Power, PETRONASEXIM Bank of Malaysia, Malayan Banking,
MUFG, SMTBWhite & Case (SPV LA), Norton Rose Fulbright (Funders LA)
Key: FA = Financial Advisor, LA = Legal Advisor, TA = Technical Advisor
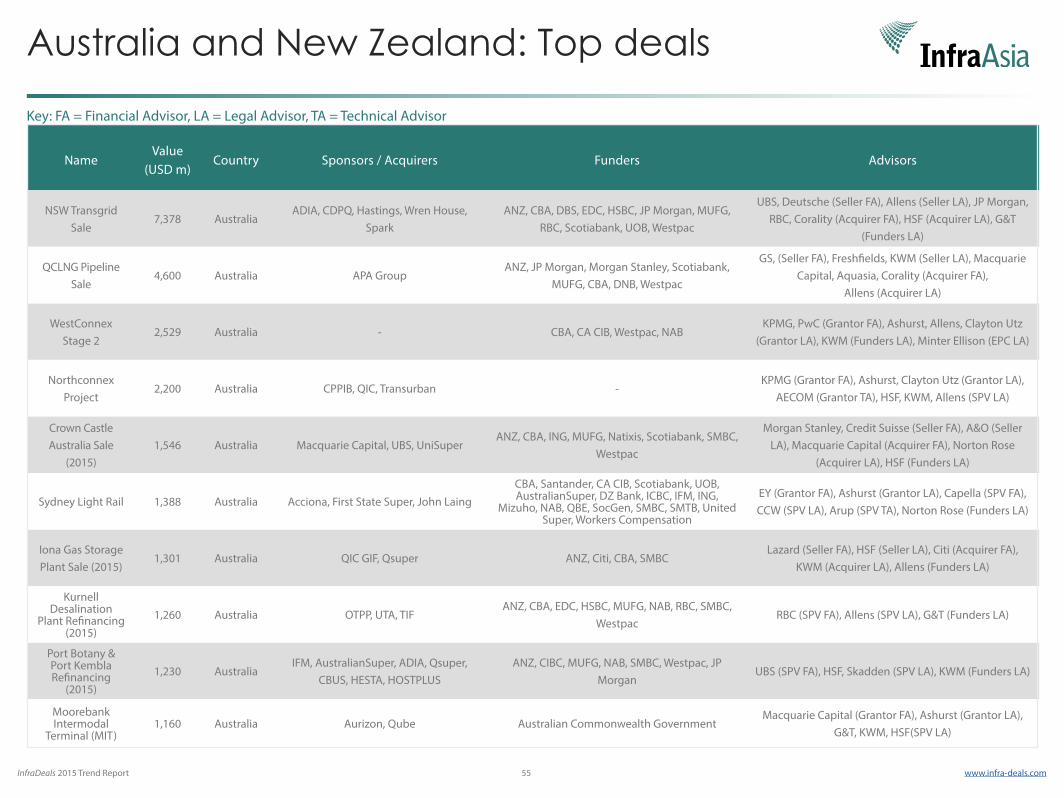
InfraDeals 2015 Trend Report 55 www.infra-deals.com
Australia and New Zealand: Top deals
NameValue
(USD m)Country Sponsors / Acquirers Funders Advisors
NSW Transgrid Sale
7,378 AustraliaADIA, CDPQ, Hastings, Wren House,
SparkANZ, CBA, DBS, EDC, HSBC, JP Morgan, MUFG,
RBC, Scotiabank, UOB, Westpac
UBS, Deutsche (Seller FA), Allens (Seller LA), JP Morgan, RBC, Corality (Acquirer FA), HSF (Acquirer LA), G&T
(Funders LA)
QCLNG Pipeline Sale
4,600 Australia APA GroupANZ, JP Morgan, Morgan Stanley, Scotiabank,
MUFG, CBA, DNB, Westpac
GS, (Seller FA), Freshfields, KWM (Seller LA), Macquarie Capital, Aquasia, Corality (Acquirer FA),
Allens (Acquirer LA)
WestConnex Stage 2
2,529 Australia - CBA, CA CIB, Westpac, NABKPMG, PwC (Grantor FA), Ashurst, Allens, Clayton Utz
(Grantor LA), KWM (Funders LA), Minter Ellison (EPC LA)
Northconnex Project
2,200 Australia CPPIB, QIC, Transurban -KPMG (Grantor FA), Ashurst, Clayton Utz (Grantor LA),
AECOM (Grantor TA), HSF, KWM, Allens (SPV LA)
Crown Castle Australia Sale
(2015)1,546 Australia Macquarie Capital, UBS, UniSuper
ANZ, CBA, ING, MUFG, Natixis, Scotiabank, SMBC, Westpac
Morgan Stanley, Credit Suisse (Seller FA), A&O (Seller LA), Macquarie Capital (Acquirer FA), Norton Rose
(Acquirer LA), HSF (Funders LA)
Sydney Light Rail 1,388 Australia Acciona, First State Super, John LaingCBA, Santander, CA CIB, Scotiabank, UOB, AustralianSuper, DZ Bank, ICBC, IFM, ING,
Mizuho, NAB, QBE, SocGen, SMBC, SMTB, United Super, Workers Compensation
EY (Grantor FA), Ashurst (Grantor LA), Capella (SPV FA), CCW (SPV LA), Arup (SPV TA), Norton Rose (Funders LA)
Iona Gas Storage Plant Sale (2015)
1,301 Australia QIC GIF, Qsuper ANZ, Citi, CBA, SMBCLazard (Seller FA), HSF (Seller LA), Citi (Acquirer FA),
KWM (Acquirer LA), Allens (Funders LA)
Kurnell Desalination
Plant Refinancing (2015)
1,260 Australia OTPP, UTA, TIFANZ, CBA, EDC, HSBC, MUFG, NAB, RBC, SMBC,
WestpacRBC (SPV FA), Allens (SPV LA), G&T (Funders LA)
Port Botany & Port Kembla Refinancing
(2015)1,230 Australia
IFM, AustralianSuper, ADIA, Qsuper, CBUS, HESTA, HOSTPLUS
ANZ, CIBC, MUFG, NAB, SMBC, Westpac, JP Morgan
UBS (SPV FA), HSF, Skadden (SPV LA), KWM (Funders LA)
Moorebank Intermodal
Terminal (MIT)1,160 Australia Aurizon, Qube Australian Commonwealth Government
Macquarie Capital (Grantor FA), Ashurst (Grantor LA), G&T, KWM, HSF(SPV LA)
Key: FA = Financial Advisor, LA = Legal Advisor, TA = Technical Advisor
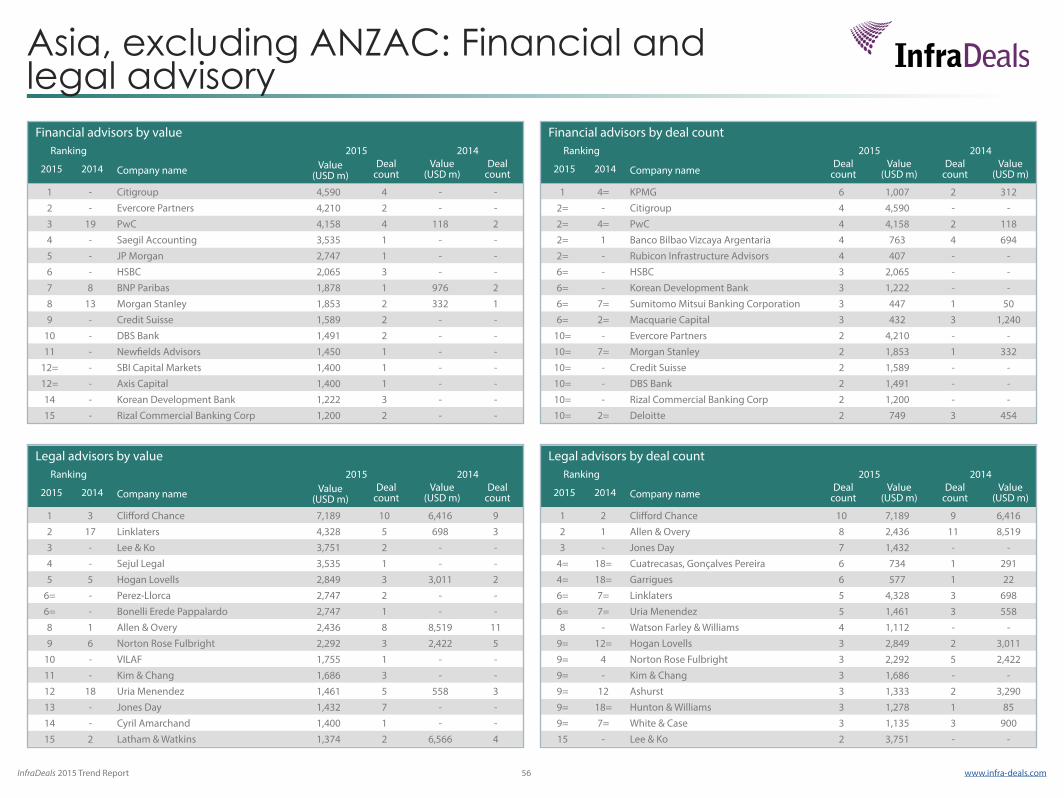
InfraDeals 2015 Trend Report 56 www.infra-deals.com
Asia, excluding ANZAC: Financial and legal advisory
Financial advisors by valueRanking 2015 2014
2015 2014 Company name Value (USD m)
Deal count
Value (USD m)
Deal count
1 - Citigroup 4,590 4 - -2 - Evercore Partners 4,210 2 - -3 19 PwC 4,158 4 118 24 - Saegil Accounting 3,535 1 - -5 - JP Morgan 2,747 1 - -6 - HSBC 2,065 3 - -7 8 BNP Paribas 1,878 1 976 28 13 Morgan Stanley 1,853 2 332 19 - Credit Suisse 1,589 2 - -
10 - DBS Bank 1,491 2 - -11 - Newfields Advisors 1,450 1 - -
12= - SBI Capital Markets 1,400 1 - -12= - Axis Capital 1,400 1 - -14 - Korean Development Bank 1,222 3 - -15 - Rizal Commercial Banking Corp 1,200 2 - -
Financial advisors by deal countRanking 2015 2014
2015 2014 Company nameDeal
countValue
(USD m)Deal
countValue
(USD m)
1 4= KPMG 6 1,007 2 3122= - Citigroup 4 4,590 - -2= 4= PwC 4 4,158 2 1182= 1 Banco Bilbao Vizcaya Argentaria 4 763 4 6942= - Rubicon Infrastructure Advisors 4 407 - -6= - HSBC 3 2,065 - -6= - Korean Development Bank 3 1,222 - -6= 7= Sumitomo Mitsui Banking Corporation 3 447 1 506= 2= Macquarie Capital 3 432 3 1,240
10= - Evercore Partners 2 4,210 - -10= 7= Morgan Stanley 2 1,853 1 33210= - Credit Suisse 2 1,589 - -10= - DBS Bank 2 1,491 - -10= - Rizal Commercial Banking Corp 2 1,200 - -10= 2= Deloitte 2 749 3 454
Legal advisors by valueRanking 2015 2014
2015 2014 Company name Value (USD m)
Deal count
Value (USD m)
Deal count
1 3 Clifford Chance 7,189 10 6,416 92 17 Linklaters 4,328 5 698 33 - Lee & Ko 3,751 2 - -4 - Sejul Legal 3,535 1 - -5 5 Hogan Lovells 2,849 3 3,011 2
6= - Perez-Llorca 2,747 2 - -6= - Bonelli Erede Pappalardo 2,747 1 - -8 1 Allen & Overy 2,436 8 8,519 119 6 Norton Rose Fulbright 2,292 3 2,422 5
10 - VILAF 1,755 1 - -11 - Kim & Chang 1,686 3 - -12 18 Uria Menendez 1,461 5 558 313 - Jones Day 1,432 7 - -14 - Cyril Amarchand 1,400 1 - -15 2 Latham & Watkins 1,374 2 6,566 4
Legal advisors by deal countRanking 2015 2014
2015 2014 Company nameDeal
countValue
(USD m)Deal
countValue
(USD m)
1 2 Clifford Chance 10 7,189 9 6,4162 1 Allen & Overy 8 2,436 11 8,5193 - Jones Day 7 1,432 - -
4= 18= Cuatrecasas, Gonçalves Pereira 6 734 1 2914= 18= Garrigues 6 577 1 226= 7= Linklaters 5 4,328 3 6986= 7= Uria Menendez 5 1,461 3 5588 - Watson Farley & Williams 4 1,112 - -
9= 12= Hogan Lovells 3 2,849 2 3,0119= 4 Norton Rose Fulbright 3 2,292 5 2,4229= - Kim & Chang 3 1,686 - -9= 12 Ashurst 3 1,333 2 3,2909= 18= Hunton & Williams 3 1,278 1 859= 7= White & Case 3 1,135 3 90015 - Lee & Ko 2 3,751 - -
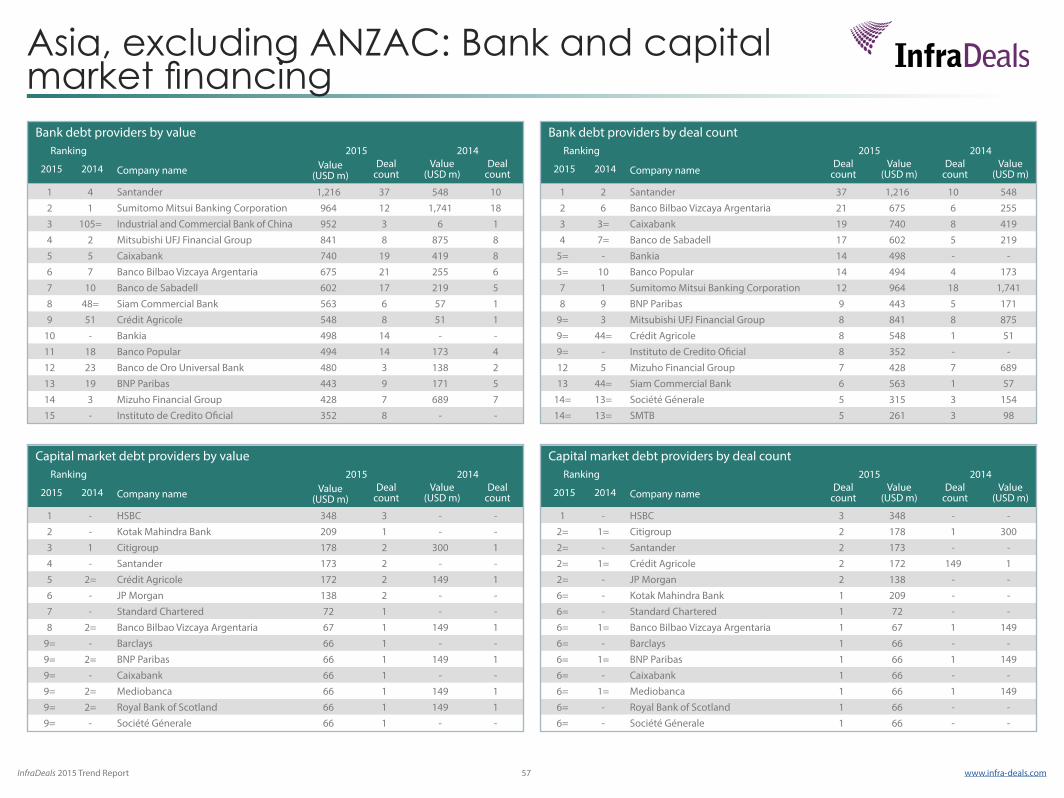
InfraDeals 2015 Trend Report 57 www.infra-deals.com
Asia, excluding ANZAC: Bank and capital market financing
Bank debt providers by valueRanking 2015 2014
2015 2014 Company name Value (USD m)
Deal count
Value (USD m)
Deal count
1 4 Santander 1,216 37 548 102 1 Sumitomo Mitsui Banking Corporation 964 12 1,741 183 105= Industrial and Commercial Bank of China 952 3 6 14 2 Mitsubishi UFJ Financial Group 841 8 875 85 5 Caixabank 740 19 419 86 7 Banco Bilbao Vizcaya Argentaria 675 21 255 67 10 Banco de Sabadell 602 17 219 58 48= Siam Commercial Bank 563 6 57 19 51 Crédit Agricole 548 8 51 1
10 - Bankia 498 14 - -11 18 Banco Popular 494 14 173 412 23 Banco de Oro Universal Bank 480 3 138 213 19 BNP Paribas 443 9 171 514 3 Mizuho Financial Group 428 7 689 715 - Instituto de Credito Oficial 352 8 - -
Bank debt providers by deal countRanking 2015 2014
2015 2014 Company nameDeal
countValue
(USD m)Deal
countValue
(USD m)
1 2 Santander 37 1,216 10 5482 6 Banco Bilbao Vizcaya Argentaria 21 675 6 2553 3= Caixabank 19 740 8 4194 7= Banco de Sabadell 17 602 5 219
5= - Bankia 14 498 - -5= 10 Banco Popular 14 494 4 1737 1 Sumitomo Mitsui Banking Corporation 12 964 18 1,7418 9 BNP Paribas 9 443 5 171
9= 3 Mitsubishi UFJ Financial Group 8 841 8 8759= 44= Crédit Agricole 8 548 1 519= - Instituto de Credito Oficial 8 352 - -12 5 Mizuho Financial Group 7 428 7 68913 44= Siam Commercial Bank 6 563 1 57
14= 13= Société Génerale 5 315 3 15414= 13= SMTB 5 261 3 98
Capital market debt providers by valueRanking 2015 2014
2015 2014 Company name Value (USD m)
Deal count
Value (USD m)
Deal count
1 - HSBC 348 3 - -2 - Kotak Mahindra Bank 209 1 - -3 1 Citigroup 178 2 300 14 - Santander 173 2 - -5 2= Crédit Agricole 172 2 149 16 - JP Morgan 138 2 - -7 - Standard Chartered 72 1 - -8 2= Banco Bilbao Vizcaya Argentaria 67 1 149 1
9= - Barclays 66 1 - -9= 2= BNP Paribas 66 1 149 19= - Caixabank 66 1 - -9= 2= Mediobanca 66 1 149 19= 2= Royal Bank of Scotland 66 1 149 19= - Société Génerale 66 1 - -
Capital market debt providers by deal countRanking 2015 2014
2015 2014 Company nameDeal
countValue
(USD m)Deal
countValue
(USD m)
1 - HSBC 3 348 - -2= 1= Citigroup 2 178 1 3002= - Santander 2 173 - -2= 1= Crédit Agricole 2 172 149 12= - JP Morgan 2 138 - -6= - Kotak Mahindra Bank 1 209 - -6= - Standard Chartered 1 72 - -6= 1= Banco Bilbao Vizcaya Argentaria 1 67 1 1496= - Barclays 1 66 - -6= 1= BNP Paribas 1 66 1 1496= - Caixabank 1 66 - -6= 1= Mediobanca 1 66 1 1496= - Royal Bank of Scotland 1 66 - -6= - Société Génerale 1 66 - -
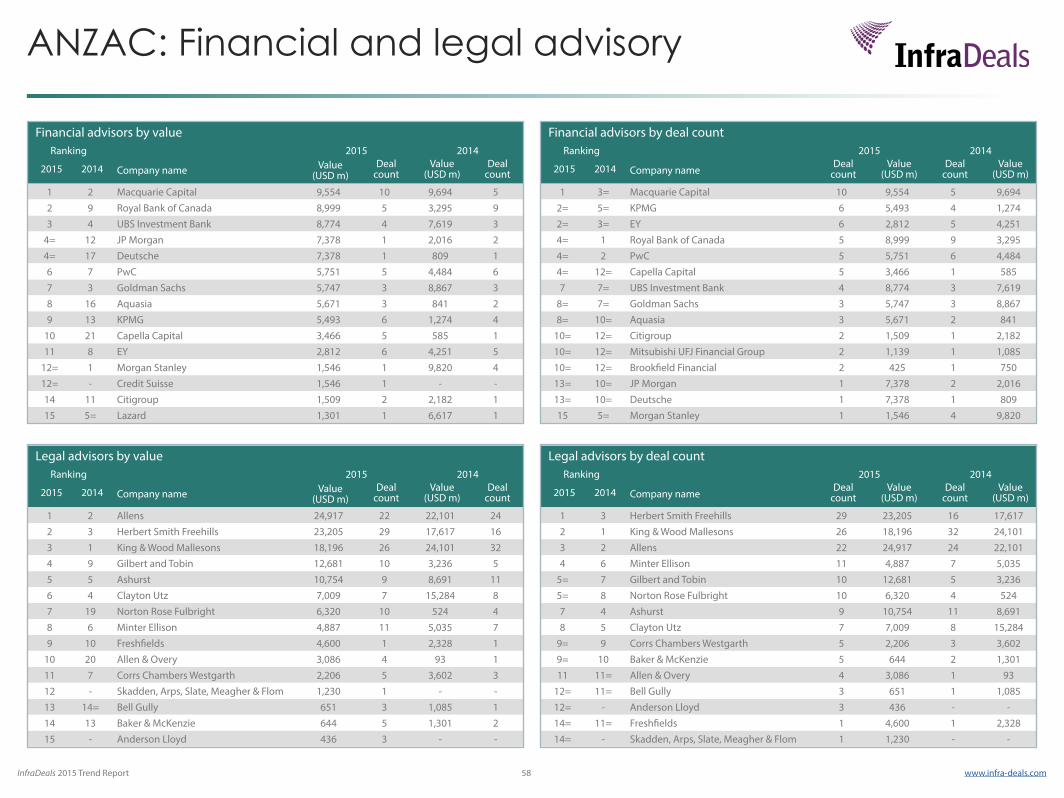
InfraDeals 2015 Trend Report 58 www.infra-deals.com
ANZAC: Financial and legal advisory
Financial advisors by valueRanking 2015 2014
2015 2014 Company name Value (USD m)
Deal count
Value (USD m)
Deal count
1 2 Macquarie Capital 9,554 10 9,694 52 9 Royal Bank of Canada 8,999 5 3,295 93 4 UBS Investment Bank 8,774 4 7,619 3
4= 12 JP Morgan 7,378 1 2,016 24= 17 Deutsche 7,378 1 809 16 7 PwC 5,751 5 4,484 67 3 Goldman Sachs 5,747 3 8,867 38 16 Aquasia 5,671 3 841 29 13 KPMG 5,493 6 1,274 4
10 21 Capella Capital 3,466 5 585 111 8 EY 2,812 6 4,251 5
12= 1 Morgan Stanley 1,546 1 9,820 412= - Credit Suisse 1,546 1 - -14 11 Citigroup 1,509 2 2,182 115 5= Lazard 1,301 1 6,617 1
Financial advisors by deal countRanking 2015 2014
2015 2014 Company nameDeal
countValue
(USD m)Deal
countValue
(USD m)
1 3= Macquarie Capital 10 9,554 5 9,6942= 5= KPMG 6 5,493 4 1,2742= 3= EY 6 2,812 5 4,2514= 1 Royal Bank of Canada 5 8,999 9 3,2954= 2 PwC 5 5,751 6 4,4844= 12= Capella Capital 5 3,466 1 5857 7= UBS Investment Bank 4 8,774 3 7,619
8= 7= Goldman Sachs 3 5,747 3 8,8678= 10= Aquasia 3 5,671 2 841
10= 12= Citigroup 2 1,509 1 2,18210= 12= Mitsubishi UFJ Financial Group 2 1,139 1 1,08510= 12= Brookfield Financial 2 425 1 75013= 10= JP Morgan 1 7,378 2 2,01613= 10= Deutsche 1 7,378 1 80915 5= Morgan Stanley 1 1,546 4 9,820
Legal advisors by valueRanking 2015 2014
2015 2014 Company name Value (USD m)
Deal count
Value (USD m)
Deal count
1 2 Allens 24,917 22 22,101 242 3 Herbert Smith Freehills 23,205 29 17,617 163 1 King & Wood Mallesons 18,196 26 24,101 324 9 Gilbert and Tobin 12,681 10 3,236 55 5 Ashurst 10,754 9 8,691 116 4 Clayton Utz 7,009 7 15,284 87 19 Norton Rose Fulbright 6,320 10 524 48 6 Minter Ellison 4,887 11 5,035 79 10 Freshfields 4,600 1 2,328 1
10 20 Allen & Overy 3,086 4 93 111 7 Corrs Chambers Westgarth 2,206 5 3,602 312 - Skadden, Arps, Slate, Meagher & Flom 1,230 1 - -13 14= Bell Gully 651 3 1,085 114 13 Baker & McKenzie 644 5 1,301 215 - Anderson Lloyd 436 3 - -
Legal advisors by deal countRanking 2015 2014
2015 2014 Company nameDeal
countValue
(USD m)Deal
countValue
(USD m)
1 3 Herbert Smith Freehills 29 23,205 16 17,6172 1 King & Wood Mallesons 26 18,196 32 24,1013 2 Allens 22 24,917 24 22,1014 6 Minter Ellison 11 4,887 7 5,035
5= 7 Gilbert and Tobin 10 12,681 5 3,2365= 8 Norton Rose Fulbright 10 6,320 4 5247 4 Ashurst 9 10,754 11 8,6918 5 Clayton Utz 7 7,009 8 15,284
9= 9 Corrs Chambers Westgarth 5 2,206 3 3,6029= 10 Baker & McKenzie 5 644 2 1,30111 11= Allen & Overy 4 3,086 1 93
12= 11= Bell Gully 3 651 1 1,08512= - Anderson Lloyd 3 436 - -14= 11= Freshfields 1 4,600 1 2,32814= - Skadden, Arps, Slate, Meagher & Flom 1 1,230 - -
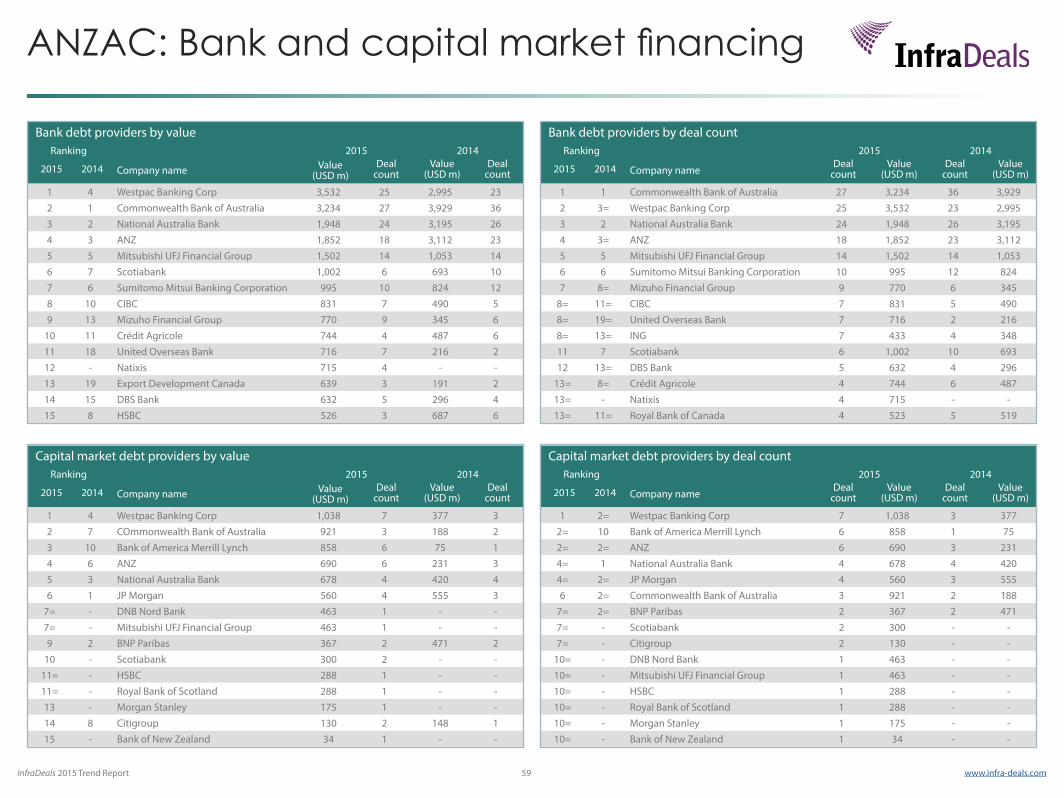
InfraDeals 2015 Trend Report 59 www.infra-deals.com
ANZAC: Bank and capital market financing
Bank debt providers by valueRanking 2015 2014
2015 2014 Company name Value (USD m)
Deal count
Value (USD m)
Deal count
1 4 Westpac Banking Corp 3,532 25 2,995 232 1 Commonwealth Bank of Australia 3,234 27 3,929 363 2 National Australia Bank 1,948 24 3,195 264 3 ANZ 1,852 18 3,112 235 5 Mitsubishi UFJ Financial Group 1,502 14 1,053 146 7 Scotiabank 1,002 6 693 107 6 Sumitomo Mitsui Banking Corporation 995 10 824 128 10 CIBC 831 7 490 59 13 Mizuho Financial Group 770 9 345 6
10 11 Crédit Agricole 744 4 487 611 18 United Overseas Bank 716 7 216 212 - Natixis 715 4 - -13 19 Export Development Canada 639 3 191 214 15 DBS Bank 632 5 296 415 8 HSBC 526 3 687 6
Bank debt providers by deal countRanking 2015 2014
2015 2014 Company nameDeal
countValue
(USD m)Deal
countValue
(USD m)
1 1 Commonwealth Bank of Australia 27 3,234 36 3,9292 3= Westpac Banking Corp 25 3,532 23 2,9953 2 National Australia Bank 24 1,948 26 3,1954 3= ANZ 18 1,852 23 3,1125 5 Mitsubishi UFJ Financial Group 14 1,502 14 1,0536 6 Sumitomo Mitsui Banking Corporation 10 995 12 8247 8= Mizuho Financial Group 9 770 6 345
8= 11= CIBC 7 831 5 4908= 19= United Overseas Bank 7 716 2 2168= 13= ING 7 433 4 34811 7 Scotiabank 6 1,002 10 69312 13= DBS Bank 5 632 4 296
13= 8= Crédit Agricole 4 744 6 48713= - Natixis 4 715 - -13= 11= Royal Bank of Canada 4 523 5 519
Capital market debt providers by valueRanking 2015 2014
2015 2014 Company name Value (USD m)
Deal count
Value (USD m)
Deal count
1 4 Westpac Banking Corp 1,038 7 377 32 7 COmmonwealth Bank of Australia 921 3 188 23 10 Bank of America Merrill Lynch 858 6 75 14 6 ANZ 690 6 231 35 3 National Australia Bank 678 4 420 46 1 JP Morgan 560 4 555 3
7= - DNB Nord Bank 463 1 - -7= - Mitsubishi UFJ Financial Group 463 1 - -9 2 BNP Paribas 367 2 471 2
10 - Scotiabank 300 2 - -11= - HSBC 288 1 - -11= - Royal Bank of Scotland 288 1 - -13 - Morgan Stanley 175 1 - -14 8 Citigroup 130 2 148 115 - Bank of New Zealand 34 1 - -
Capital market debt providers by deal countRanking 2015 2014
2015 2014 Company nameDeal
countValue
(USD m)Deal
countValue
(USD m)
1 2= Westpac Banking Corp 7 1,038 3 3772= 10 Bank of America Merrill Lynch 6 858 1 752= 2= ANZ 6 690 3 2314= 1 National Australia Bank 4 678 4 4204= 2= JP Morgan 4 560 3 5556 2= Commonwealth Bank of Australia 3 921 2 188
7= 2= BNP Paribas 2 367 2 4717= - Scotiabank 2 300 - -7= - Citigroup 2 130 - -
10= - DNB Nord Bank 1 463 - -10= - Mitsubishi UFJ Financial Group 1 463 - -10= - HSBC 1 288 - -10= - Royal Bank of Scotland 1 288 - -10= - Morgan Stanley 1 175 - -10= - Bank of New Zealand 1 34 - -
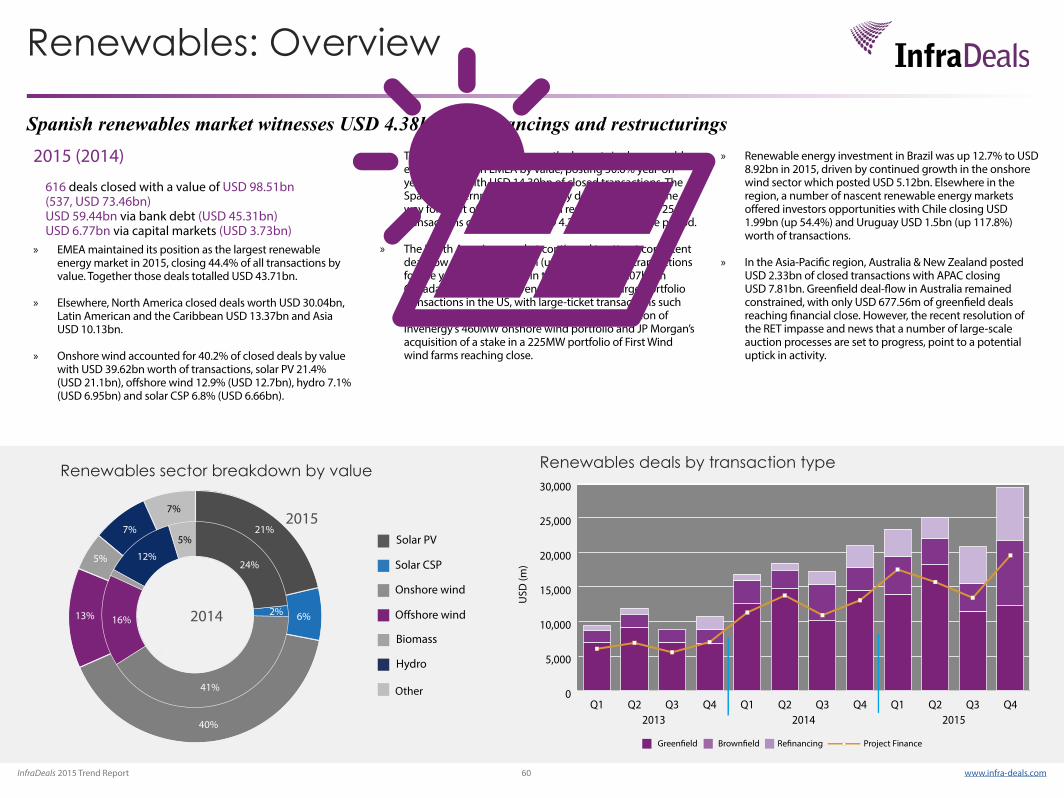
InfraDeals 2015 Trend Report 60 www.infra-deals.com
» EMEA maintained its position as the largest renewable energy market in 2015, closing 44.4% of all transactions by value. Together those deals totalled USD 43.71bn.
» Elsewhere, North America closed deals worth USD 30.04bn, Latin American and the Caribbean USD 13.37bn and Asia USD 10.13bn.
» Onshore wind accounted for 40.2% of closed deals by value with USD 39.62bn worth of transactions, solar PV 21.4% (USD 21.1bn), offshore wind 12.9% (USD 12.7bn), hydro 7.1% (USD 6.95bn) and solar CSP 6.8% (USD 6.66bn).
Spanish renewables market witnesses USD 4.38bn of refinancings and restructurings » The UK retained its position as the largest single renewable
energy market in EMEA by value, posting 50.6% year-on-year growth with USD 14.30bn of closed transactions. The Spanish government’s new energy decree has paved the way for a raft of refinancings and restructurings, with 25 transactions closing worth USD 4.38bn closing in the period.
» The North American market continued to attract consistent deal flow with USD 30.04bn (up 28%) of closed transactions for the year: USD 23.98bn in the US and USD 6.07bn in Canada. Growth was driven by a number of large portfolio transactions in the US, with large-ticket transactions such as TerraForm and SunEdison’s USD 2.0bn acquisition of Invenergy’s 460MW onshore wind portfolio and JP Morgan’s acquisition of a stake in a 225MW portfolio of First Wind wind farms reaching close.
2015 (2014)
616 deals closed with a value of USD 98.51bn (537, USD 73.46bn) USD 59.44bn via bank debt (USD 45.31bn) USD 6.77bn via capital markets (USD 3.73bn)
Renewables sector breakdown by value
Renewables: Overview
» Renewable energy investment in Brazil was up 12.7% to USD 8.92bn in 2015, driven by continued growth in the onshore wind sector which posted USD 5.12bn. Elsewhere in the region, a number of nascent renewable energy markets offered investors opportunities with Chile closing USD 1.99bn (up 54.4%) and Uruguay USD 1.5bn (up 117.8%) worth of transactions.
» In the Asia-Pacific region, Australia & New Zealand posted USD 2.33bn of closed transactions with APAC closing USD 7.81bn. Greenfield deal-flow in Australia remained constrained, with only USD 677.56m of greenfield deals reaching financial close. However, the recent resolution of the RET impasse and news that a number of large-scale auction processes are set to progress, point to a potential uptick in activity.
5%
40%
21%
41%
16%
24%12%
2% 6%13%
7%
5%
7%
2014
2015
Other
Renewables deals by transaction type
USD
(m)
0
5,000
10,000
15,000
20,000
25,000
30,000
Q4Q3Q2Q1Q4Q3Q2Q1Q4Q3Q2Q12013 2014 2015
Solar PV
Solar CSP
Onshore wind
Offshore wind
Biomass
Hydro
Project Finance
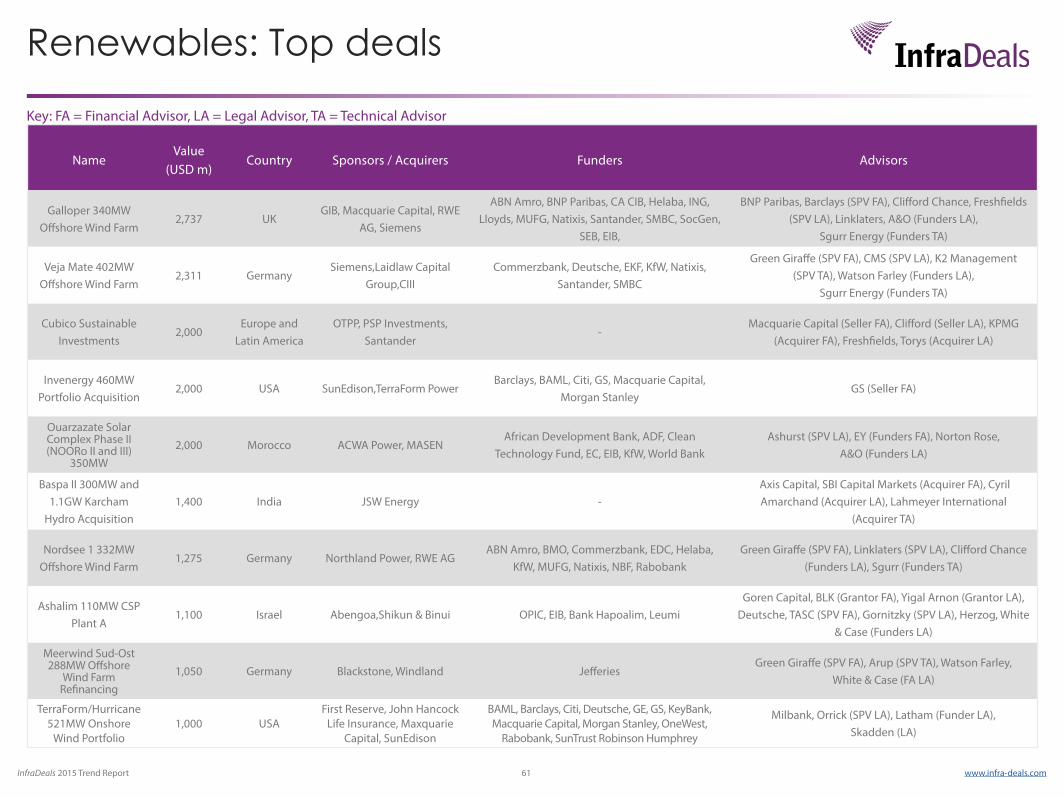
InfraDeals 2015 Trend Report 61 www.infra-deals.com
Renewables: Top deals
NameValue
(USD m)Country Sponsors / Acquirers Funders Advisors
Galloper 340MW Offshore Wind Farm
2,737 UKGIB, Macquarie Capital, RWE
AG, Siemens
ABN Amro, BNP Paribas, CA CIB, Helaba, ING, Lloyds, MUFG, Natixis, Santander, SMBC, SocGen,
SEB, EIB,
BNP Paribas, Barclays (SPV FA), Clifford Chance, Freshfields (SPV LA), Linklaters, A&O (Funders LA),
Sgurr Energy (Funders TA)
Veja Mate 402MW Offshore Wind Farm
2,311 GermanySiemens,Laidlaw Capital
Group,CIIICommerzbank, Deutsche, EKF, KfW, Natixis,
Santander, SMBC
Green Giraffe (SPV FA), CMS (SPV LA), K2 Management (SPV TA), Watson Farley (Funders LA),
Sgurr Energy (Funders TA)
Cubico Sustainable Investments
2,000 Europe and
Latin AmericaOTPP, PSP Investments,
Santander-
Macquarie Capital (Seller FA), Clifford (Seller LA), KPMG (Acquirer FA), Freshfields, Torys (Acquirer LA)
Invenergy 460MW Portfolio Acquisition
2,000 USA SunEdison,TerraForm PowerBarclays, BAML, Citi, GS, Macquarie Capital,
Morgan StanleyGS (Seller FA)
Ouarzazate Solar Complex Phase II (NOORo II and III)
350MW2,000 Morocco ACWA Power, MASEN
African Development Bank, ADF, Clean Technology Fund, EC, EIB, KfW, World Bank
Ashurst (SPV LA), EY (Funders FA), Norton Rose, A&O (Funders LA)
Baspa II 300MW and 1.1GW Karcham
Hydro Acquisition1,400 India JSW Energy -
Axis Capital, SBI Capital Markets (Acquirer FA), Cyril Amarchand (Acquirer LA), Lahmeyer International
(Acquirer TA)
Nordsee 1 332MW Offshore Wind Farm
1,275 Germany Northland Power, RWE AGABN Amro, BMO, Commerzbank, EDC, Helaba,
KfW, MUFG, Natixis, NBF, RabobankGreen Giraffe (SPV FA), Linklaters (SPV LA), Clifford Chance
(Funders LA), Sgurr (Funders TA)
Ashalim 110MW CSP Plant A
1,100 Israel Abengoa,Shikun & Binui OPIC, EIB, Bank Hapoalim, LeumiGoren Capital, BLK (Grantor FA), Yigal Arnon (Grantor LA),
Deutsche, TASC (SPV FA), Gornitzky (SPV LA), Herzog, White & Case (Funders LA)
Meerwind Sud-Ost 288MW Offshore
Wind Farm Refinancing
1,050 Germany Blackstone, Windland JefferiesGreen Giraffe (SPV FA), Arup (SPV TA), Watson Farley,
White & Case (FA LA)
TerraForm/Hurricane 521MW Onshore
Wind Portfolio1,000 USA
First Reserve, John Hancock Life Insurance, Maxquarie
Capital, SunEdison
BAML, Barclays, Citi, Deutsche, GE, GS, KeyBank, Macquarie Capital, Morgan Stanley, OneWest,
Rabobank, SunTrust Robinson Humphrey
Milbank, Orrick (SPV LA), Latham (Funder LA), Skadden (LA)
Key: FA = Financial Advisor, LA = Legal Advisor, TA = Technical Advisor
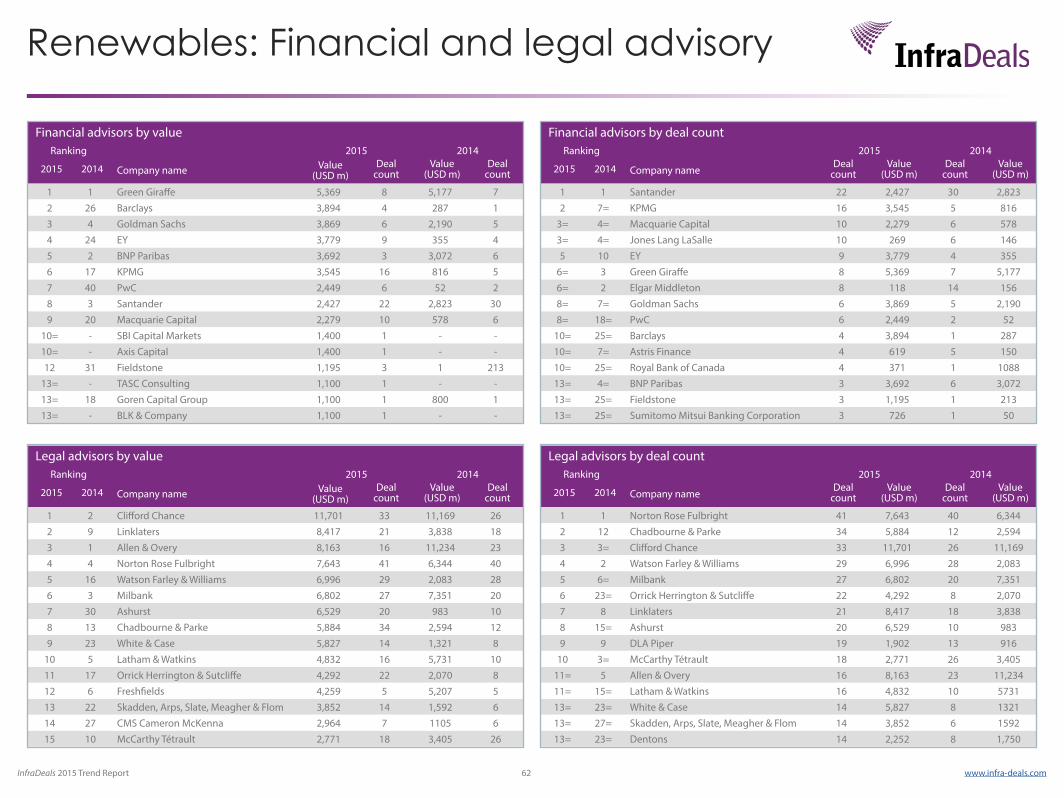
InfraDeals 2015 Trend Report 62 www.infra-deals.com
Renewables: Financial and legal advisory
Financial advisors by valueRanking 2015 2014
2015 2014 Company name Value (USD m)
Deal count
Value (USD m)
Deal count
1 1 Green Giraffe 5,369 8 5,177 72 26 Barclays 3,894 4 287 13 4 Goldman Sachs 3,869 6 2,190 54 24 EY 3,779 9 355 45 2 BNP Paribas 3,692 3 3,072 66 17 KPMG 3,545 16 816 57 40 PwC 2,449 6 52 28 3 Santander 2,427 22 2,823 309 20 Macquarie Capital 2,279 10 578 6
10= - SBI Capital Markets 1,400 1 - -10= - Axis Capital 1,400 1 - -12 31 Fieldstone 1,195 3 1 213
13= - TASC Consulting 1,100 1 - -13= 18 Goren Capital Group 1,100 1 800 113= - BLK & Company 1,100 1 - -
Financial advisors by deal countRanking 2015 2014
2015 2014 Company nameDeal
countValue
(USD m)Deal
countValue
(USD m)
1 1 Santander 22 2,427 30 2,8232 7= KPMG 16 3,545 5 816
3= 4= Macquarie Capital 10 2,279 6 5783= 4= Jones Lang LaSalle 10 269 6 1465 10 EY 9 3,779 4 355
6= 3 Green Giraffe 8 5,369 7 5,1776= 2 Elgar Middleton 8 118 14 1568= 7= Goldman Sachs 6 3,869 5 2,1908= 18= PwC 6 2,449 2 52
10= 25= Barclays 4 3,894 1 28710= 7= Astris Finance 4 619 5 15010= 25= Royal Bank of Canada 4 371 1 108813= 4= BNP Paribas 3 3,692 6 3,07213= 25= Fieldstone 3 1,195 1 21313= 25= Sumitomo Mitsui Banking Corporation 3 726 1 50
Legal advisors by valueRanking 2015 2014
2015 2014 Company name Value (USD m)
Deal count
Value (USD m)
Deal count
1 2 Clifford Chance 11,701 33 11,169 262 9 Linklaters 8,417 21 3,838 183 1 Allen & Overy 8,163 16 11,234 234 4 Norton Rose Fulbright 7,643 41 6,344 405 16 Watson Farley & Williams 6,996 29 2,083 286 3 Milbank 6,802 27 7,351 207 30 Ashurst 6,529 20 983 108 13 Chadbourne & Parke 5,884 34 2,594 129 23 White & Case 5,827 14 1,321 8
10 5 Latham & Watkins 4,832 16 5,731 1011 17 Orrick Herrington & Sutcliffe 4,292 22 2,070 812 6 Freshfields 4,259 5 5,207 513 22 Skadden, Arps, Slate, Meagher & Flom 3,852 14 1,592 614 27 CMS Cameron McKenna 2,964 7 1105 615 10 McCarthy Tétrault 2,771 18 3,405 26
Legal advisors by deal countRanking 2015 2014
2015 2014 Company nameDeal
countValue
(USD m)Deal
countValue
(USD m)
1 1 Norton Rose Fulbright 41 7,643 40 6,3442 12 Chadbourne & Parke 34 5,884 12 2,5943 3= Clifford Chance 33 11,701 26 11,1694 2 Watson Farley & Williams 29 6,996 28 2,0835 6= Milbank 27 6,802 20 7,3516 23= Orrick Herrington & Sutcliffe 22 4,292 8 2,0707 8 Linklaters 21 8,417 18 3,8388 15= Ashurst 20 6,529 10 9839 9 DLA Piper 19 1,902 13 916
10 3= McCarthy Tétrault 18 2,771 26 3,40511= 5 Allen & Overy 16 8,163 23 11,23411= 15= Latham & Watkins 16 4,832 10 573113= 23= White & Case 14 5,827 8 132113= 27= Skadden, Arps, Slate, Meagher & Flom 14 3,852 6 159213= 23= Dentons 14 2,252 8 1,750
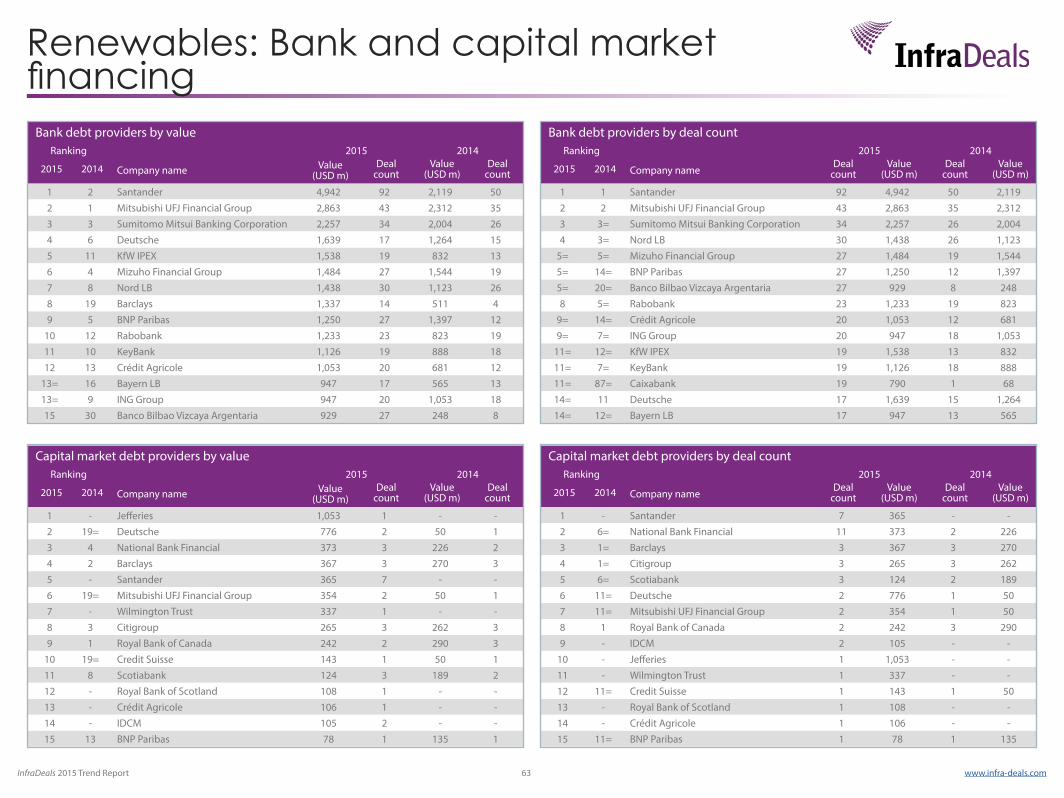
InfraDeals 2015 Trend Report 63 www.infra-deals.com
Renewables: Bank and capital market financing
Bank debt providers by valueRanking 2015 2014
2015 2014 Company name Value (USD m)
Deal count
Value (USD m)
Deal count
1 2 Santander 4,942 92 2,119 502 1 Mitsubishi UFJ Financial Group 2,863 43 2,312 353 3 Sumitomo Mitsui Banking Corporation 2,257 34 2,004 264 6 Deutsche 1,639 17 1,264 155 11 KfW IPEX 1,538 19 832 136 4 Mizuho Financial Group 1,484 27 1,544 197 8 Nord LB 1,438 30 1,123 268 19 Barclays 1,337 14 511 49 5 BNP Paribas 1,250 27 1,397 12
10 12 Rabobank 1,233 23 823 1911 10 KeyBank 1,126 19 888 1812 13 Crédit Agricole 1,053 20 681 12
13= 16 Bayern LB 947 17 565 1313= 9 ING Group 947 20 1,053 1815 30 Banco Bilbao Vizcaya Argentaria 929 27 248 8
Bank debt providers by deal countRanking 2015 2014
2015 2014 Company nameDeal
countValue
(USD m)Deal
countValue
(USD m)
1 1 Santander 92 4,942 50 2,1192 2 Mitsubishi UFJ Financial Group 43 2,863 35 2,3123 3= Sumitomo Mitsui Banking Corporation 34 2,257 26 2,0044 3= Nord LB 30 1,438 26 1,123
5= 5= Mizuho Financial Group 27 1,484 19 1,5445= 14= BNP Paribas 27 1,250 12 1,3975= 20= Banco Bilbao Vizcaya Argentaria 27 929 8 2488 5= Rabobank 23 1,233 19 823
9= 14= Crédit Agricole 20 1,053 12 6819= 7= ING Group 20 947 18 1,053
11= 12= KfW IPEX 19 1,538 13 83211= 7= KeyBank 19 1,126 18 88811= 87= Caixabank 19 790 1 6814= 11 Deutsche 17 1,639 15 1,26414= 12= Bayern LB 17 947 13 565
Capital market debt providers by valueRanking 2015 2014
2015 2014 Company name Value (USD m)
Deal count
Value (USD m)
Deal count
1 - Jefferies 1,053 1 - -2 19= Deutsche 776 2 50 13 4 National Bank Financial 373 3 226 24 2 Barclays 367 3 270 35 - Santander 365 7 - -6 19= Mitsubishi UFJ Financial Group 354 2 50 17 - Wilmington Trust 337 1 - -8 3 Citigroup 265 3 262 39 1 Royal Bank of Canada 242 2 290 3
10 19= Credit Suisse 143 1 50 111 8 Scotiabank 124 3 189 212 - Royal Bank of Scotland 108 1 - -13 - Crédit Agricole 106 1 - -14 - IDCM 105 2 - -15 13 BNP Paribas 78 1 135 1
Capital market debt providers by deal countRanking 2015 2014
2015 2014 Company nameDeal
countValue
(USD m)Deal
countValue
(USD m)
1 - Santander 7 365 - -2 6= National Bank Financial 11 373 2 2263 1= Barclays 3 367 3 2704 1= Citigroup 3 265 3 2625 6= Scotiabank 3 124 2 1896 11= Deutsche 2 776 1 507 11= Mitsubishi UFJ Financial Group 2 354 1 508 1 Royal Bank of Canada 2 242 3 2909 - IDCM 2 105 - -
10 - Jefferies 1 1,053 - -11 - Wilmington Trust 1 337 - -12 11= Credit Suisse 1 143 1 5013 - Royal Bank of Scotland 1 108 - -14 - Crédit Agricole 1 106 - -15 11= BNP Paribas 1 78 1 135
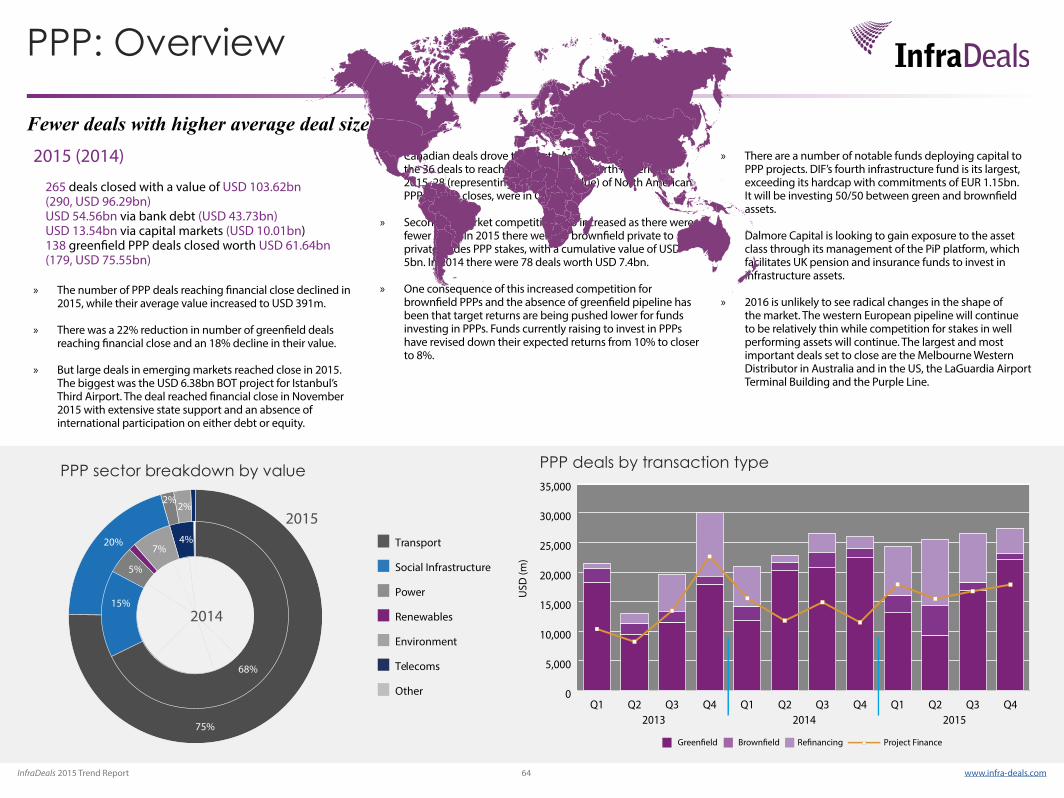
InfraDeals 2015 Trend Report 64 www.infra-deals.com
» The number of PPP deals reaching financial close declined in 2015, while their average value increased to USD 391m.
» There was a 22% reduction in number of greenfield deals reaching financial close and an 18% decline in their value.
» But large deals in emerging markets reached close in 2015. The biggest was the USD 6.38bn BOT project for Istanbul’s Third Airport. The deal reached financial close in November 2015 with extensive state support and an absence of international participation on either debt or equity.
Fewer deals with higher average deal sizes » Canadian deals drove the North American PPP market. Of
the 36 deals to reach financial close in North America in 2015, 28 (representing 77% of the value) of North American PPP project closes, were in Canada.
» Secondary market competition also increased as there were fewer deals. In 2015 there were 63 brownfield private to private trades PPP stakes, with a cumulative value of USD 5bn. In 2014 there were 78 deals worth USD 7.4bn.
» One consequence of this increased competition for brownfield PPPs and the absence of greenfield pipeline has been that target returns are being pushed lower for funds investing in PPPs. Funds currently raising to invest in PPPs have revised down their expected returns from 10% to closer to 8%.
» There are a number of notable funds deploying capital to PPP projects. DIF’s fourth infrastructure fund is its largest, exceeding its hardcap with commitments of EUR 1.15bn. It will be investing 50/50 between green and brownfield assets.
» Dalmore Capital is looking to gain exposure to the asset class through its management of the PiP platform, which facilitates UK pension and insurance funds to invest in infrastructure assets.
» 2016 is unlikely to see radical changes in the shape of the market. The western European pipeline will continue to be relatively thin while competition for stakes in well performing assets will continue. The largest and most important deals set to close are the Melbourne Western Distributor in Australia and in the US, the LaGuardia Airport Terminal Building and the Purple Line.
2015 (2014)
265 deals closed with a value of USD 103.62bn (290, USD 96.29bn) USD 54.56bn via bank debt (USD 43.73bn) USD 13.54bn via capital markets (USD 10.01bn) 138 greenfield PPP deals closed worth USD 61.64bn (179, USD 75.55bn)
PPP sector breakdown by value
PPP: Overview
75%
5%
68%
20%
15%
2%
4%7%
2%
2014
2015
Other
Environment
Renewables
Power
Social Infrastructure
Transport
Telecoms
PPP deals by transaction type
USD
(m)
0
5,000
10,000
15,000
20,000
25,000
30,000
35,000
Q4Q3Q2Q1Q4Q3Q2Q1Q4Q3Q2Q12013 2014 2015
Project Finance
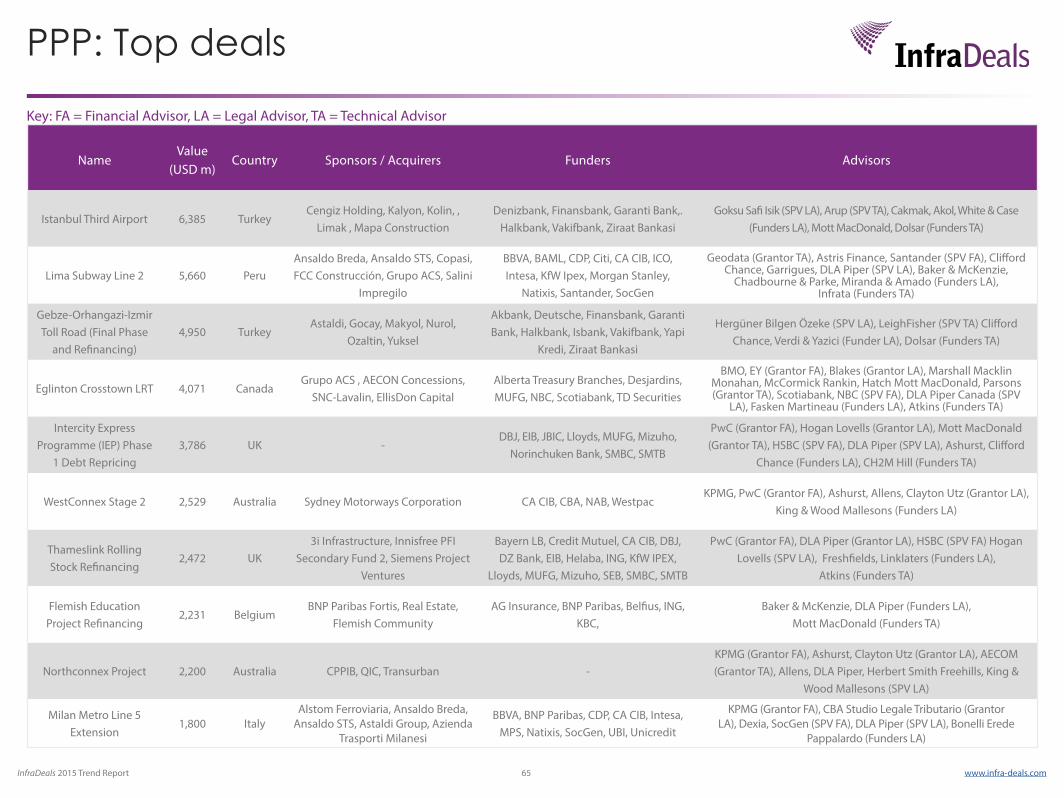
InfraDeals 2015 Trend Report 65 www.infra-deals.com
PPP: Top deals
NameValue
(USD m)Country Sponsors / Acquirers Funders Advisors
Istanbul Third Airport 6,385 TurkeyCengiz Holding, Kalyon, Kolin, ,
Limak , Mapa ConstructionDenizbank, Finansbank, Garanti Bank,.
Halkbank, Vakifbank, Ziraat BankasiGoksu Safi Isik (SPV LA), Arup (SPV TA), Cakmak, Akol, White & Case
(Funders LA), Mott MacDonald, Dolsar (Funders TA)
Lima Subway Line 2 5,660 PeruAnsaldo Breda, Ansaldo STS, Copasi, FCC Construcción, Grupo ACS, Salini
Impregilo
BBVA, BAML, CDP, Citi, CA CIB, ICO, Intesa, KfW Ipex, Morgan Stanley,
Natixis, Santander, SocGen
Geodata (Grantor TA), Astris Finance, Santander (SPV FA), Clifford Chance, Garrigues, DLA Piper (SPV LA), Baker & McKenzie,
Chadbourne & Parke, Miranda & Amado (Funders LA), Infrata (Funders TA)
Gebze-Orhangazi-Izmir Toll Road (Final Phase
and Refinancing)4,950 Turkey
Astaldi, Gocay, Makyol, Nurol, Ozaltin, Yuksel
Akbank, Deutsche, Finansbank, Garanti Bank, Halkbank, Isbank, Vakifbank, Yapi
Kredi, Ziraat Bankasi
Hergüner Bilgen Özeke (SPV LA), LeighFisher (SPV TA) Clifford Chance, Verdi & Yazici (Funder LA), Dolsar (Funders TA)
Eglinton Crosstown LRT 4,071 CanadaGrupo ACS , AECON Concessions,
SNC-Lavalin, EllisDon Capital Alberta Treasury Branches, Desjardins, MUFG, NBC, Scotiabank, TD Securities
BMO, EY (Grantor FA), Blakes (Grantor LA), Marshall Macklin Monahan, McCormick Rankin, Hatch Mott MacDonald, Parsons (Grantor TA), Scotiabank, NBC (SPV FA), DLA Piper Canada (SPV
LA), Fasken Martineau (Funders LA), Atkins (Funders TA)
Intercity Express Programme (IEP) Phase
1 Debt Repricing3,786 UK -
DBJ, EIB, JBIC, Lloyds, MUFG, Mizuho, Norinchuken Bank, SMBC, SMTB
PwC (Grantor FA), Hogan Lovells (Grantor LA), Mott MacDonald (Grantor TA), HSBC (SPV FA), DLA Piper (SPV LA), Ashurst, Clifford
Chance (Funders LA), CH2M Hill (Funders TA)
WestConnex Stage 2 2,529 Australia Sydney Motorways Corporation CA CIB, CBA, NAB, WestpacKPMG, PwC (Grantor FA), Ashurst, Allens, Clayton Utz (Grantor LA),
King & Wood Mallesons (Funders LA)
Thameslink Rolling Stock Refinancing
2,472 UK3i Infrastructure, Innisfree PFI
Secondary Fund 2, Siemens Project Ventures
Bayern LB, Credit Mutuel, CA CIB, DBJ, DZ Bank, EIB, Helaba, ING, KfW IPEX,
Lloyds, MUFG, Mizuho, SEB, SMBC, SMTB
PwC (Grantor FA), DLA Piper (Grantor LA), HSBC (SPV FA) Hogan Lovells (SPV LA), Freshfields, Linklaters (Funders LA),
Atkins (Funders TA)
Flemish Education Project Refinancing
2,231 BelgiumBNP Paribas Fortis, Real Estate,
Flemish CommunityAG Insurance, BNP Paribas, Belfius, ING,
KBC,Baker & McKenzie, DLA Piper (Funders LA),
Mott MacDonald (Funders TA)
Northconnex Project 2,200 Australia CPPIB, QIC, Transurban -KPMG (Grantor FA), Ashurst, Clayton Utz (Grantor LA), AECOM (Grantor TA), Allens, DLA Piper, Herbert Smith Freehills, King &
Wood Mallesons (SPV LA)
Milan Metro Line 5 Extension
1,800 ItalyAlstom Ferroviaria, Ansaldo Breda,
Ansaldo STS, Astaldi Group, Azienda Trasporti Milanesi
BBVA, BNP Paribas, CDP, CA CIB, Intesa, MPS, Natixis, SocGen, UBI, Unicredit
KPMG (Grantor FA), CBA Studio Legale Tributario (Grantor LA), Dexia, SocGen (SPV FA), DLA Piper (SPV LA), Bonelli Erede
Pappalardo (Funders LA)
Key: FA = Financial Advisor, LA = Legal Advisor, TA = Technical Advisor
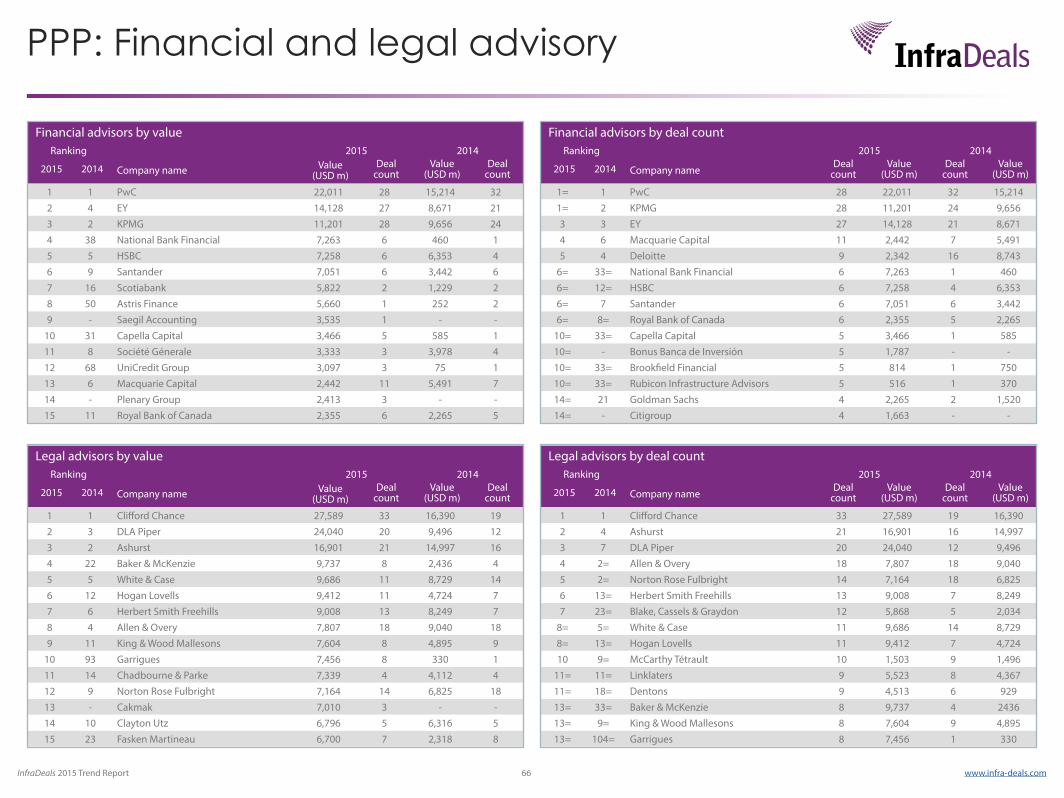
InfraDeals 2015 Trend Report 66 www.infra-deals.com
PPP: Financial and legal advisory
Financial advisors by valueRanking 2015 2014
2015 2014 Company name Value (USD m)
Deal count
Value (USD m)
Deal count
1 1 PwC 22,011 28 15,214 322 4 EY 14,128 27 8,671 213 2 KPMG 11,201 28 9,656 244 38 National Bank Financial 7,263 6 460 15 5 HSBC 7,258 6 6,353 46 9 Santander 7,051 6 3,442 67 16 Scotiabank 5,822 2 1,229 28 50 Astris Finance 5,660 1 252 29 - Saegil Accounting 3,535 1 - -
10 31 Capella Capital 3,466 5 585 111 8 Société Génerale 3,333 3 3,978 412 68 UniCredit Group 3,097 3 75 113 6 Macquarie Capital 2,442 11 5,491 714 - Plenary Group 2,413 3 - -15 11 Royal Bank of Canada 2,355 6 2,265 5
Financial advisors by deal countRanking 2015 2014
2015 2014 Company nameDeal
countValue
(USD m)Deal
countValue
(USD m)
1= 1 PwC 28 22,011 32 15,2141= 2 KPMG 28 11,201 24 9,6563 3 EY 27 14,128 21 8,6714 6 Macquarie Capital 11 2,442 7 5,4915 4 Deloitte 9 2,342 16 8,743
6= 33= National Bank Financial 6 7,263 1 4606= 12= HSBC 6 7,258 4 6,3536= 7 Santander 6 7,051 6 3,4426= 8= Royal Bank of Canada 6 2,355 5 2,265
10= 33= Capella Capital 5 3,466 1 58510= - Bonus Banca de Inversión 5 1,787 - -10= 33= Brookfield Financial 5 814 1 75010= 33= Rubicon Infrastructure Advisors 5 516 1 37014= 21 Goldman Sachs 4 2,265 2 1,52014= - Citigroup 4 1,663 - -
Legal advisors by valueRanking 2015 2014
2015 2014 Company name Value (USD m)
Deal count
Value (USD m)
Deal count
1 1 Clifford Chance 27,589 33 16,390 192 3 DLA Piper 24,040 20 9,496 123 2 Ashurst 16,901 21 14,997 164 22 Baker & McKenzie 9,737 8 2,436 45 5 White & Case 9,686 11 8,729 146 12 Hogan Lovells 9,412 11 4,724 77 6 Herbert Smith Freehills 9,008 13 8,249 78 4 Allen & Overy 7,807 18 9,040 189 11 King & Wood Mallesons 7,604 8 4,895 9
10 93 Garrigues 7,456 8 330 111 14 Chadbourne & Parke 7,339 4 4,112 412 9 Norton Rose Fulbright 7,164 14 6,825 1813 - Cakmak 7,010 3 - -14 10 Clayton Utz 6,796 5 6,316 515 23 Fasken Martineau 6,700 7 2,318 8
Legal advisors by deal countRanking 2015 2014
2015 2014 Company nameDeal
countValue
(USD m)Deal
countValue
(USD m)
1 1 Clifford Chance 33 27,589 19 16,3902 4 Ashurst 21 16,901 16 14,9973 7 DLA Piper 20 24,040 12 9,4964 2= Allen & Overy 18 7,807 18 9,0405 2= Norton Rose Fulbright 14 7,164 18 6,8256 13= Herbert Smith Freehills 13 9,008 7 8,2497 23= Blake, Cassels & Graydon 12 5,868 5 2,034
8= 5= White & Case 11 9,686 14 8,7298= 13= Hogan Lovells 11 9,412 7 4,72410 9= McCarthy Tétrault 10 1,503 9 1,496
11= 11= Linklaters 9 5,523 8 4,36711= 18= Dentons 9 4,513 6 92913= 33= Baker & McKenzie 8 9,737 4 243613= 9= King & Wood Mallesons 8 7,604 9 4,89513= 104= Garrigues 8 7,456 1 330
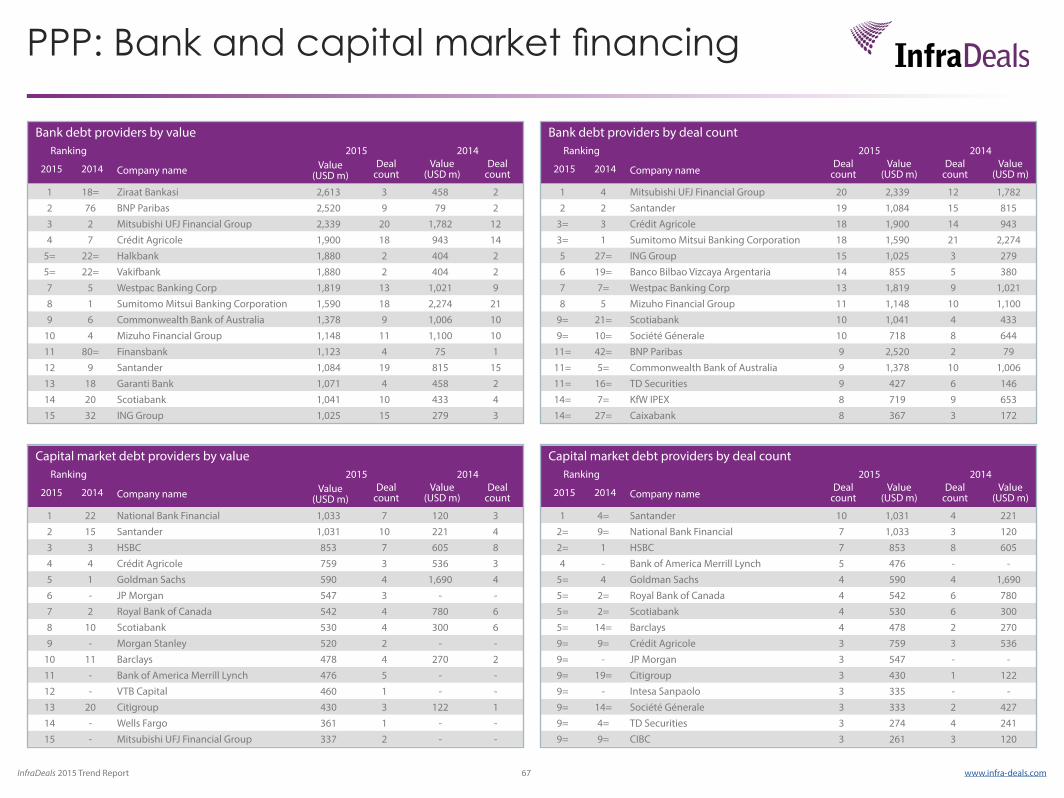
InfraDeals 2015 Trend Report 67 www.infra-deals.com
PPP: Bank and capital market financing
Bank debt providers by valueRanking 2015 2014
2015 2014 Company name Value (USD m)
Deal count
Value (USD m)
Deal count
1 18= Ziraat Bankasi 2,613 3 458 22 76 BNP Paribas 2,520 9 79 23 2 Mitsubishi UFJ Financial Group 2,339 20 1,782 124 7 Crédit Agricole 1,900 18 943 14
5= 22= Halkbank 1,880 2 404 25= 22= Vakifbank 1,880 2 404 27 5 Westpac Banking Corp 1,819 13 1,021 98 1 Sumitomo Mitsui Banking Corporation 1,590 18 2,274 219 6 Commonwealth Bank of Australia 1,378 9 1,006 10
10 4 Mizuho Financial Group 1,148 11 1,100 1011 80= Finansbank 1,123 4 75 112 9 Santander 1,084 19 815 1513 18 Garanti Bank 1,071 4 458 214 20 Scotiabank 1,041 10 433 415 32 ING Group 1,025 15 279 3
Bank debt providers by deal countRanking 2015 2014
2015 2014 Company nameDeal
countValue
(USD m)Deal
countValue
(USD m)
1 4 Mitsubishi UFJ Financial Group 20 2,339 12 1,7822 2 Santander 19 1,084 15 815
3= 3 Crédit Agricole 18 1,900 14 9433= 1 Sumitomo Mitsui Banking Corporation 18 1,590 21 2,2745 27= ING Group 15 1,025 3 2796 19= Banco Bilbao Vizcaya Argentaria 14 855 5 3807 7= Westpac Banking Corp 13 1,819 9 1,0218 5 Mizuho Financial Group 11 1,148 10 1,100
9= 21= Scotiabank 10 1,041 4 4339= 10= Société Génerale 10 718 8 644
11= 42= BNP Paribas 9 2,520 2 7911= 5= Commonwealth Bank of Australia 9 1,378 10 1,00611= 16= TD Securities 9 427 6 14614= 7= KfW IPEX 8 719 9 65314= 27= Caixabank 8 367 3 172
Capital market debt providers by valueRanking 2015 2014
2015 2014 Company name Value (USD m)
Deal count
Value (USD m)
Deal count
1 22 National Bank Financial 1,033 7 120 32 15 Santander 1,031 10 221 43 3 HSBC 853 7 605 84 4 Crédit Agricole 759 3 536 35 1 Goldman Sachs 590 4 1,690 46 - JP Morgan 547 3 - -7 2 Royal Bank of Canada 542 4 780 68 10 Scotiabank 530 4 300 69 - Morgan Stanley 520 2 - -
10 11 Barclays 478 4 270 211 - Bank of America Merrill Lynch 476 5 - -12 - VTB Capital 460 1 - -13 20 Citigroup 430 3 122 114 - Wells Fargo 361 1 - -15 - Mitsubishi UFJ Financial Group 337 2 - -
Capital market debt providers by deal countRanking 2015 2014
2015 2014 Company nameDeal
countValue
(USD m)Deal
countValue
(USD m)
1 4= Santander 10 1,031 4 2212= 9= National Bank Financial 7 1,033 3 1202= 1 HSBC 7 853 8 6054 - Bank of America Merrill Lynch 5 476 - -
5= 4 Goldman Sachs 4 590 4 1,6905= 2= Royal Bank of Canada 4 542 6 7805= 2= Scotiabank 4 530 6 3005= 14= Barclays 4 478 2 2709= 9= Crédit Agricole 3 759 3 5369= - JP Morgan 3 547 - -9= 19= Citigroup 3 430 1 1229= - Intesa Sanpaolo 3 335 - -9= 14= Société Génerale 3 333 2 4279= 4= TD Securities 3 274 4 2419= 9= CIBC 3 261 3 120
InfraDeals 2015 Trend Report 68 www.infra-deals.com
About Inframation Group
Established in 2002, The Inframation Group employs over 45 people with offices in London, Hong Kong, New York, Sao Paulo, Singapore and Sydney. The company, and everything we do, is dedicated to the global infrastructure finance market, covering both greenfield and brownfield transactions. We provide real-time news, market intelligence, research and data that enables individuals and companies working in infrastructure finance to gain a competitive business advantage. We are the leading provider of high value business information to the sector with over 600 corporate subscribers including many of the world’s leading developers, institutional investors, private equity funds, banks, developers, law firms, advisors and insurers. InfraDeals endeavours to guarantee the accuracy of the transaction information used to compile the league tables. At the end of each quarter, organisations are invited to email us a quarterly deal summary to ensure that all relevant deals are reflected in the league tables.
League table submission forms are available from the InfraDeals website. All submissions should be emailed to [email protected] or [email protected].
Data used in InfraDeals is subject to retroactive modifications and may differ from published league tables.
By submitting material, each contributor acknowledges and accepts as reasonable that InfraDeals reserves exclusively and in its sole discretion the right to review all submissions, the right to determine at any time whether or not to include and/or withdraw them, the right to determine valuation, database and league table eligibility, and the right to determine the validity of any challenge (including the right to request further information as required).
Please note – All information supplied for inclusion in this document will enter the public domain. Do not supply any information which may not enter the public domain.
The 2015 league tables have been compiled using submissions received from banks, financial, legal and technical advisors and research conducted by InfraDeals.
Our coverage includes the project financing of greenfield and brownfield projects, the expansion of existing assets, the refinancing of existing project finance debt and the financing of acquisitions globally across the following sectors:
-Environment: Waste, wastewater and water treatment facilities; -Power: The acquisition of energy assets by infrastructure funds and institutional investors along the following parts of the energy value chain:
1.) Generation of power with a single contracted off-taker; 2.) Energy storage including gas storage facilities; 3.) Energy transmission assets; 4.) In some circumstances, the acquisition of vertically integrated energy utility companies.
-Renewables: Onshore wind, offshore wind, solar, biomass, hydro; -Social Infrastructure: Healthcare, education, prisons, defence, social accommodation, street lighting, leisure; -Telecommunications: Fixed line, wireless, broadcast and telecoms tower assets; -Transport: Airports, roads, rail, ports, bridges, tunnels, light rail, car parks.
Qualifying transactions must have reached financial close between 1 January 2015 and 31 December 2015.
NB: As a rule InfraDeals league tables exclude mining, oil & gas and greenfield non-renewable energy transactions. However, transactions in this sector may be included on an ad-hoc basis when backed by infrastructure funds.
Advisors to grantors/sellers, acquirers/sponsors and lenders are eligible for inclusion. For advisor league tables, deal credit is defined as the total value of the completed transaction.
Non-US dollar denominated transactions are converted to the US dollar equivalent at the time of financial close.
The United Kingdom is included in the EMEA section but its importance is reflected with a unique UK section.
Group Contacts
Head of Research - Paul Tilt T: +44 20 7010 5122 E: [email protected]
Managing Editor - Thomas Williams T: +44 20 7010 6126 E: [email protected]
Managing Director - Jonathan Goor T: +44 20 7010 6132 E: [email protected]
Head of Sales Asia - Laurence Edwards T: +852 2158 9771 E: [email protected]
Head of Sales EMEA - Felipe Poveda Palacios T: +44 (0) 207 010 6322 E: [email protected]
Head of Sales Americas - Brett Birman T: +1 212 686 3015 E: [email protected]
Part of
Criteria