informing, transforming, and persuading: disentangling the multiple effects of advertising on brand...
TRANSCRIPT

Vol. 27, No. 3, May–June 2008, pp. 334–355issn 0732-2399 �eissn 1526-548X �08 �2703 �0334
informs ®
doi 10.1287/mksc.1070.0310©2008 INFORMS
Informing, Transforming, and Persuading:Disentangling the Multiple Effects of Advertising on
Brand Choice Decisions
Nitin MehtaRotman School of Management, University of Toronto, Toronto, Ontario M5S 3H7, Canada,
Xinlei (Jack) ChenSauder School of Business, University of British Columbia, Vancouver, British Columbia V6T 1Z4,
Om NarasimhanCarlson School of Management, University of Minnesota, Minneapolis, Minnesota 55455
Prior behavioral research has suggested that advertising can influence a consumer’s quality evaluationthrough informative and transformative effects. The informative effect acts directly to inform a consumer
of product attributes and hence shapes her evaluations of brand quality. The transformative effect affects theconsumer’s evaluation of brand quality by enhancing her assessment of her subsequent consumption experi-ence. In addition, advertising may influence a consumer’s utility directly, even without providing any explicitinformation—this is the persuasive effect.
In this paper, we propose a framework that formally models the processes through which all three effectsof advertisements impact consumers’ brand evaluations and their subsequent brand choice decisions. In par-ticular, we model source credibility, confirmatory bias, and bounded rationality on the part of consumers, byappropriately modifying the standard Bayesian learning approach. Our model conforms closely to prior behav-ioral literature and the experimental findings therein. In our empirical analysis, we get significant estimatesof both informative and transformative effects across brands. We find interesting temporal patterns across theeffects; for instance, the importance of transformative effects seem to grow over time, while that of informativeeffects diminishes. Finally, we conduct policy experiments to examine the impact of increased ad intensity onadvertising effects, as well as the role played by consumption ambiguity.
Key words : advertising effects; informative effects; persuasive effects; structural models; consumer learning;policy experiments; bounded rationality; confirmatory bias
History : This paper was received June 7, 2004, and was with the authors 19 months for 3 revisions processedby Tulin Erdem.
1. IntroductionAdvertising, it has been conjectured in prior litera-ture, shapes consumer preferences in multiple ways.The first, most obvious effect is that advertisinginforms the consumer of product attributes and henceraises awareness and knowledge of the true qual-ity of the brand. This has been called the infor-mative effect of advertising (Bucklin 1965, Lavidgeand Steiner 1961). Second, advertising may directlyinfluence a consumer’s brand evaluations throughsuch cues as celebrity endorsements and music, evenwithout providing any explicit information. This hasbeen referred to as the persuasive or prestige effectof ads (Aaker and Stayman 1990, Batra and Ray1986). Third, advertising can influence how con-sumers experience and evaluate the quality of the
product from subsequent consumption. This effecthas been evocatively referred to as the transformativeeffect of advertising (Deighton 1984, 1988) and is thefocus of our paper. It is important at the outset to dif-ferentiate the transformative effect from the informa-tive and persuasive effects. One key feature helps usdo that—transformative effects have an impact onlyin the presence of consumption. If the consumer watchesthe ad and does not consume thereafter, there can be,by definition, no transformative effect. By contrast,both informative and persuasive effects exist indepen-dently of subsequent consumption. Thus, unlike theinformative or persuasive effects, the transformativeeffect does not change consumers’ brand evaluationsimmediately after they are exposed to the advertise-ments, but instead shapes consumers’ evaluations
334

Mehta, Chen, and Narasimhan: Disentangling the Multiple Effects of Advertising on Brand Choice DecisionsMarketing Science 27(3), pp. 334–355, © 2008 INFORMS 335
by influencing what they learn about the brand’squality/attributes from their subsequent consumptionexperience. Prior research suggests that these effectsare not mutually exclusive, i.e., an advertisementcan have informative, persuasive, and transformativeeffects. Our goal in this paper is to develop a modelthat accommodates all three effects, while hewingclosely to behavioral and economic theories of adver-tising, and to estimate this model using real-worlddata.
A number of papers have suggested diverse theo-retical rationale for the informative effects of advertis-ing (e.g., hierarchy-of-effects models, such as Lavidgeand Steiner 1961 or Aaker et al. 1992; alternativeframeworks are provided by Greenwald 1968 andFishbein and Ajzen 1975). This literature suggeststhat the effect is strongest when involvement is highand when advertisements provide information aboutbrand attributes that are relevant and verifiable, lead-ing to greater confidence on the part of the consumerin her assessments of the brand’s quality (Nelson1970, 1974; Holbrook 1978).
Regarding the persuasive effect, a stream of lit-erature based on the Elaboration Likelihood Model(Petty et al. 1983) suggests that under low involve-ment situations, the peripheral route to persuasiondominates, and consumers pay attention to the exe-cution elements of the ad more than to any infor-mation provided. The key is that consumers’ brandevaluations are enhanced even without the cogni-tive evaluation of attributes (Aaker and Norris 1982,Zajonc and Markus 1980).1 Before we move on to thetransformative effect, for the sake of completeness,we should mention the “signaling” role of advertis-ing that has been modeled theoretically (Kihlstromand Riordan 1984, Milgrom and Roberts 1986), andestimated econometrically (Ackerberg 2003, Erdemet al. 2006). These papers suggest that the quantityof advertising can itself signal quality—the consumerinterprets higher advertising intensity as a signal ofhigher quality.2
A relatively smaller literature has examined thetransformative role of advertising. A major strand ofthis work draws on behavioral literature to suggestthat message and subsequent consumption experi-ence interact (Slovic et al. 1977, Gilovich 1981). Hochand Deighton (1989) suggest the following process oftransformation. Consumers perceive ads to be biased,because they realize that ads are coming from a parti-san source whose interests are not necessarily aligned
1 Econometrically, the persuasive effect has been modeled througha term directly affecting the utility. As we discuss later, this is bestunderstood, conceptually, using the Becker-Murphy (1993) notionof advertising as a complementary good.2 While we mention the signaling effect here for completeness, wedo not model it in the paper.
with their own. However, because they do not knowthe exact amount of this bias, consumers treat the adas a tentative hypothesis, which they test during sub-sequent consumption. If the advertising message con-nects tightly with the consumption experience, i.e., insome sense, the ad tells consumers which attributesto look out for during subsequent consumption, itleads to a confirmatory bias in learning from the con-sumption experience. In other words, learning fromconsumption serves to confirm the expectations cre-ated by the ad, and biases in the ad message getmanifested in learning from consumption. Becausethe behavioral underpinnings and econometric esti-mation of the transformative effect are a cornerstoneof this paper, it helps to elaborate on the process justoutlined.The transformative effect. To start with, why would
ads result in consumers forming a tentative hypoth-esis about the quality of the brand? This is becauseeven though consumers perceive the ads to be biased,they are not aware of the extent of the bias, and theydo not reject the message altogether. The ad facilitatesthis process when it encourages a “willing suspen-sion of disbelief” (the attributes are presented in asuggestive rather than didactic fashion). Clearly, onthis point alone, ads can influence subsequent con-sumption experiences. However, crucially, the impactis a great deal more than this—prior literature sug-gests that consumers are predisposed to confirmingthe hypotheses suggested by the ad, while verifyingits claims during consumption.
Why does this happen? Researchers suggest this isbecause of consumers’ information processing limita-tions. During consumption, consumers get evidencethat is both consistent and inconsistent with the ad-based expectations. If consumption occurs duringlow involvement conditions, consumers learn throughtop-down learning, or passive observation, wherethey pay more attention to ad-consistent evidence andless to ad inconsistent evidence (Hoch and Deighton1989, Snyder and Swann 1978). Thus, what consumerslearn about the brand’s quality/attributes throughconsumption is consistent with the expectations laidout by the ads. This would happen if there is a matchbetween the attributes suggested by the ad and theattributes observed during consumption. In sum, thebiases in the ad get transferred to the informationthe consumer learns about the product from subse-quent consumption.
The above description of the transformative effectstill leaves two important questions unanswered.First, what determines the strength of the transfor-mative effect? Apart from the content of the ad itself(appropriately suggestive of the attributes and thebest way to evaluate them during the subsequentconsumption experience), and consumer involvement

Mehta, Chen, and Narasimhan: Disentangling the Multiple Effects of Advertising on Brand Choice Decisions336 Marketing Science 27(3), pp. 334–355, © 2008 INFORMS
(lower is better because it encourages learning by pas-sive observation), an important determinant is theambiguity of the consumption experience. Hoch andHa (1986) found that top-down processing of infor-mation (thus enhancing the transformative effect) wasthe norm when the consumption experience wasambiguous. Clearly, if consumption provides unam-biguous evidence, it also allows any ad claims that arepotentially biased to be easily refuted, and the infor-mation learned from consumption dominates con-sumers’ brand evaluations. On the other hand, ifthe consumption experience is noisy, then consumerscould interpret the consumption experience as beingconsistent with their ad-based expectations.
Second, are consumers aware that their evaluationsfrom consumption are being influenced by their ad-based expectations in this fashion? If they are awareof this influence, they will discount it, hence negatingthe transformative effect. Prior literature suggests thatthis is unlikely to happen, because consumers privi-lege their product experiences, i.e., they grant a spe-cial status to conclusions learned from experience andsuffer from an illusion of control (Langer 1975). Assuch, they do not doubt the credibility of what theylearn from consumption (Hoch and Ha 1986, Hochand Deighton 1989).Modeling challenges. The modeling of all three effects
of advertising carries with it a number of chal-lenges. Prior literature has used the Bayesian learn-ing paradigm to model informative and persuasiveeffects structurally (Erdem and Keane 1996, Ackerberg2003). We argue that the standard Bayesian learn-ing model has to be modified along multiple dimen-sions to model transformative effects for the followingreasons.
(a) Source credibility. Standard Bayesian learningmodels assume that each ad is an independent andunbiased signal of the brand’s true quality, or even ifthe signal is biased, the consumer knows the extentof the bias exactly. In practice, consumers are awarethat advertising messages are motivated by a desireto influence, and are generally wary of the credibil-ity of the source. This suggests that consumers knowadvertising messages are biased, but do not know theexact extent of this bias. The first challenge is to buildan appropriate model of how consumers form expec-tations of the brand’s quality from ads, which accom-modates this feature.
(b) Confirmatory bias. In a standard Bayesian learn-ing model, (prior) ad signals and (post) consump-tion signals are assumed to be independent pieces ofinformation. That is, ad signals have no impact onhow subsequent consumption is evaluated. The ideabehind confirmatory bias, however, is that ad-basedexpectations influence what the consumer sees during
subsequent consumption. As discussed earlier, adver-tising provides a frame for consumers to evaluate con-sumption experiences within. This leads to preciselythe kind of nonindependence suggested by Fischoffand Beyth-Marom (1983) and Hoch and Deighton(1989), i.e., one piece of data (ad signals) creates acontext that affects the interpretation of a new pieceof data (the consumption experience). A modifiedBayesian learning model has to account for the cor-relation between ad expectations about the brand’squality, and the information that the consumer learnsabout the brand’s quality from subsequent consump-tion evaluations.
(c) Consumer bounded rationality. The confirmatorybias just discussed clearly suggests that consumers arenot unboundedly rational. This sits uneasily with thetenets of the standard Bayesian learning model, whereconsumers get independent ad and consumption sig-nals, and update their quality beliefs each period onthe basis of both these signals in a rational Bayesianfashion. Carried to its logical extreme, consumerswould be aware of the confirmatory bias inducedby ads and would accordingly discount informationlearned from consumption in a rational Bayesian fash-ion. Clearly, one cannot have transformation in thisscenario. As argued above, consumers do not seemto take into account the transference of biases fromad-based expectations to consumption, while evalu-ating consumption experiences. It seems appropriate,therefore, to allow consumers to not discount whatthey learn from consumption experiences, even if thatlearning is biased by prior ads.3
All this suggests two ways to proceed. One caneither abandon the Bayesian learning framework(with no clear alternative in sight) or modify itto accommodate the deviations mentioned above.We choose the latter approach, because it lets usretain a relatively parsimonious framework that hasproved useful in earlier work, while also providinga ready benchmark for comparison purposes. A for-mal treatment of how we modify the Bayesian learn-ing model is deferred to §2, where we discuss modeldevelopment.
In the rest of the introduction, we list our researchobjectives and discuss briefly how we accomplishthem. In so doing, we also present a gist of our mainfindings. This is followed by a brief review of the rel-evant literature.
3 Bounded rationality enters our model only as it relates to theimpact of ads, i.e., consumers are unaware that their consumptionevaluations are being transformed by ads. Further discussion ofother aspects of bounded rationality is provided in the conclusionssection.

Mehta, Chen, and Narasimhan: Disentangling the Multiple Effects of Advertising on Brand Choice DecisionsMarketing Science 27(3), pp. 334–355, © 2008 INFORMS 337
1.1. Research Objectives and Contributions(a) To propose a formal framework that explicitly mod-
els the process though which the informative and transfor-mative effects of advertisements impact consumers’ brandevaluations and their subsequent brand choice decisions:4
We view the modeling of source credibility, confirma-tory bias, and bounded rationality as a major contri-bution of the paper. These three components are at theheart of our structural model of advertising’s impacton brand choice, and we accommodate them so as tohew closely to behavioral theories of advertising.
(b) To calibrate our model on observed data: We cali-brate our proposed model on single-source data forliquid laundry detergents. In our empirical analy-sis, we find significant, albeit modest, informativeand transformative effects of advertisements acrossbrands. Among our results, we find that the parame-ter capturing the extent to which consumers suspectthe credibility of ads as a source of information is sig-nificant and varies across brands. Similarly, the confir-matory bias (the extent of transference of biases fromads to subsequent consumption experiences) is signif-icant and varies across brands.
(c) To conduct policy experiments to assess the impactof changing advertising effects: We conduct a numberof policy experiments to tease out the pattern ofvariation in the effects of advertising across brands.For instance, we examine what the temporal patternsof informative, transformative, and persuasive effectsare, i.e.—are some effects more powerful at the begin-ning of the learning period versus later? We alsolook at the impact of informative and transforma-tive effects on the clout and vulnerability of brands.Thus we conjecture that increasing informative effectsprimarily serves to increase the brand’s competitiveclout but does not substantially change its vulnerabil-ity, while increasing transformative effects primarilyserves to decrease the brand’s vulnerability but doesnot significantly impact its competitive clout. We findevidence supporting this conjecture. We also investi-gate the impact of changes in ad intensity on marketshare, again intertemporally for all three effects.
1.2. Related Empirical LiteratureWhile the literature on the effects of advertising isvast, there are two main streams that are of relevanceto this study. Both of these examine the effects ofadvertising in a field setting, typically using econo-metric methods on scanner panel data for frequentlypurchased consumer goods. The first set of studiesincludes, among many others, Pedrick and Zufryden
4 As mentioned earlier, while we do model persuasive effects, thisis done in a fairly simple fashion, consistent with prior literature.We include persuasive effects for the sake of completeness and donot view their modeling as an important contribution of this paper.
(1991) and Lodish et al. (1995) for testing informativeeffects, and Tellis (1988) and Deighton et al. (1994)for testing transformative effects. These studies haveemployed reduced-form specifications to capture theeffects of advertising on consumer evaluations—theygenerally find weak informative effects and non-significant transformative effects. We suggest thatthey find nonsignificant results because they do notmodel the process by which consumers’ brand eval-uations are shaped by the different effects of adver-tising. Modeling the process helps avoid errors thatcould result in biasing the effects.
Another set of papers consists of structural ap-proaches to testing the impact of advertising (Ching2003, Erdem and Keane 1996, Erdem et al. 2006,Mukherji et al. 2004, Narayanan et al. 2005) invari-ably using a quality learning specification. Erdem andKeane (1996) is a pioneering effort that models theinformative effect of ads in the laundry detergentcategory, accounting for forward-looking risk-averseconsumers. Consumers are modeled as learning aboutquality through advertising and consumption signalsin a standard Bayesian learning setting. Ackerberg(2003) and Narayanan et al. (2005) build on thiswork—the former models persuasive and signalingeffects in the yogurt category, while the latter modelsinformative and persuasive effects in pharmaceuticaldrugs. Both these papers model persuasive effects asdirectly influencing the utility of the consumer (e.g.,ads enhancing the prestige associated with the brand).This direct term affecting a consumer’s utility essen-tially captures all the effects of advertising that arenot otherwise modeled structurally. The way the per-suasive effect has been modeled econometrically isperhaps best understood by conceptualizing it a laBecker and Murphy (1993). In their story, advertis-ing can be viewed as a complement to the productdesired, which makes it natural to include advertising“consumed” directly in the utility the product pro-vides. While calling this a “persuasive” effect does notmap on exactly to the behavioral literature on the sub-ject, it is a more satisfactory way to explain why oneneeds a term directly affecting the utility of the con-sumer. Finally, Erdem et al. (2006) also consider theinformative, signaling, and persuasive effect of ads,but adds a role for price as a signal of quality.
None of the above papers explicitly allows ads toinfluence the evaluation of consumption experiencesin a manner consistent with the notion of transforma-tion. In addition, none of them accounts for featuressuch as source credibility or confirmatory bias, bothof which are the impetus behind our modification ofthe standard Bayesian learning framework.
Mukherji et al. (2004) is the only paper that hasattempted to explicitly model the interaction of con-sumption with marketing communication. However,

Mehta, Chen, and Narasimhan: Disentangling the Multiple Effects of Advertising on Brand Choice Decisions338 Marketing Science 27(3), pp. 334–355, © 2008 INFORMS
their specification has no role for transformation asis conceptualized in the literature. In the model ofMukherji et al. (2004), the ads are assumed to beunbiased signals of the brand’s true quality (therebyassuming that ads are a credible source of informa-tion), and the only interaction that is allowed betweenads and consumption is one that makes for fasterlearning about the brand’s true quality from con-sumption if the consumer has watched ads before(thereby implying that there is no confirmatory bias).
The rest of the paper is organized as follows. In §2,we discuss our model specification, followed by adiscussion of the data, estimation methodology, andestimation results in §3. We also report the resultsof a number of policy experiments in §3. Section 4concludes with limitations and suggestions for futureresearch.
2. Model Development2.1. Model OverviewThe basic premise of our model is that consumers areuncertain about product quality, and hence attemptto learn about it. There are two sources that canshape a consumer’s evaluations: advertising and con-sumption. In our model, the consumer’s informationfrom advertising constitutes an advertising set, whileher information from consumption experiences con-stitutes a consumption set. She updates each of thesesets as she gets more information from an adver-tising message or from her consumption experience.Therefore, the informative effect of ads, which isthe immediate impact of ads on quality learning,comes through the advertising set; while the infor-mation learned from consumption and, consequently,the transformative effect of ads, comes through theconsumption set. On each purchase occasion, the con-sumer mixes evaluations from the two sets to comeup with her overall quality evaluation for each brand.At this point, it is useful to highlight the follow-ing fact. Of the three advertising effects that wewish to model, only the informative and transforma-tive effects impact consumer learning. The persua-sive effect enters the utility function directly and doesnot affect learning about quality. The discussion thatfollows focuses exclusively on how consumers learnabout true quality and, consequently, ignores the per-suasive effect. We incorporate the persuasive effectwhen we obtain the final utility expression for theconsumer.
2.2. Utility Specification and Evolution ofConsumer’s Overall Quality Evaluations
On each purchase occasion, a consumer forms qual-ity evaluations of each brand on offer and, based onthese evaluations, picks a brand to purchase. Con-sider a product category with j = 1 to J brands. We
assume that the consumer’s expected indirect utilityfrom brand j on purchase occasion t can be approx-imated as a function of brand j’s overall qualityevaluation, qj� t , price, pj� t , and feature and displayvariables. Because prior literature has found signif-icant risk aversion in many categories (Erdem andKeane 1996) and highlighted the possible misspecifi-cation arising from ignoring this term (Byzalov andShachar 2004), we incorporate risk aversion througha mean-variance specification. The indirect utility isgiven as:5
EtUj� t = Etqj� t�+ rEt qj� t −Etqj� t��2 −�ppj� t
+�f Featj� t +�dDispj� t +�per� jPerj� t + �j� t� (1)
The parameter denotes the consumer’s intensity ofpreference for quality, r represents her degree of riskaversion, �p represents her price sensitivity, �f repre-sents the impact of features, �d represents the impactof display, �per� j represents the brand-specific persua-sive effect of advertising, and �j� t represents a type 1extreme-valued random variable that is independentacross all consumers, brands, and purchase occasions.Featj� t and Dispj� t represent the presence or absenceof features and displays, respectively, for brand j attime t. Perj� t is defined as the number of ads seen by aconsumer between t−1 and t, divided by the numberof minutes of television watched during that period(Ackerberg 2003). This term captures the persuasiveeffect of ads. The rationale of including it directly inthe utility function follows Becker and Murphy (1993),in that the intensity of advertising is a product char-acteristic like calories or taste that provides utility toconsumers. The specification here suggests that con-sumers receive more utility from consuming a prod-uct with higher ad intensities.
We assume the true quality of brand j to be qj . Theconsumer does not have enough information to esti-mate precisely the true quality of any brand in theproduct category.6
Formally,
qj� t ∼N�j� t��2j� t� ∀ j� t� (2)
where �j� t denotes the consumer’s estimate of theexpected overall quality of brand j at purchase occa-sion t, and �2
j� t denotes the extent of her uncertaintyabout brand j’s quality at purchase occasion t.
5 For notational convenience, we have suppressed the subscript forthe consumer.6 An alternative formulation would be in terms of productattributes and uncertainty surrounding the mean levels of theseattributes. To the extent that one considers only one attribute, as inErdem and Keane (1996), the two approaches are identical (see alsoMehta et al. 2003).
Mehta, Chen, and Narasimhan: Disentangling the Multiple Effects of Advertising on Brand Choice DecisionsMarketing Science 27(3), pp. 334–355, © 2008 INFORMS 339
Figure 1 Sequence of Events between Purchase Occasions t − 1 and t
qj, t ~N(ωj, t,ξj, t)
At beginning ofoccasion t–1:
Purchases brand j
Between t–1 and t:Watches nj, t
advertisements forbrand j
At occasion t : Mixesevaluations from both
sets to form newoverall evaluation
At end of t–1: Formsbeliefs based onadvertising set as
2
2
a a
qj, t ~N(ωj, t,ψj, t)2c c
qj, t ~N(ωj, t,σj, t)
Consumes brand j:Updates evaluations based
on consumption set
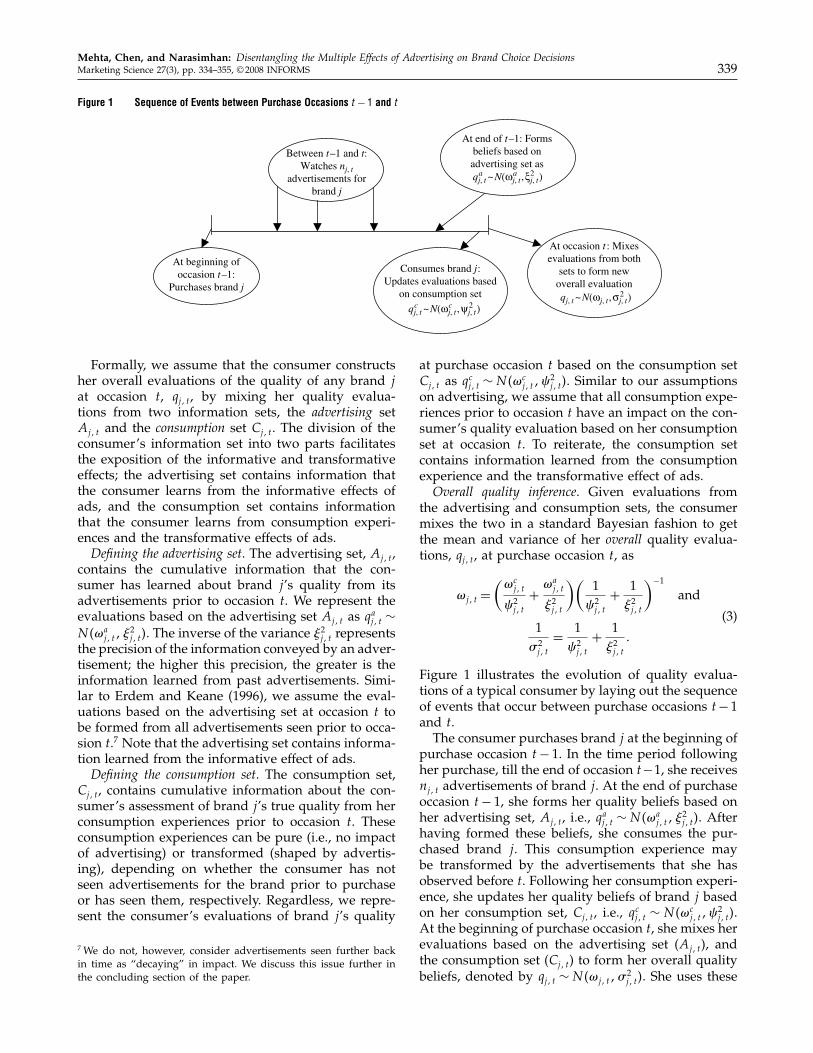
Formally, we assume that the consumer constructsher overall evaluations of the quality of any brand jat occasion t, qj� t , by mixing her quality evalua-tions from two information sets, the advertising setAj� t and the consumption set Cj� t . The division of theconsumer’s information set into two parts facilitatesthe exposition of the informative and transformativeeffects; the advertising set contains information thatthe consumer learns from the informative effects ofads, and the consumption set contains informationthat the consumer learns from consumption experi-ences and the transformative effects of ads.Defining the advertising set. The advertising set, Aj� t ,
contains the cumulative information that the con-sumer has learned about brand j’s quality from itsadvertisements prior to occasion t. We represent theevaluations based on the advertising set Aj� t as qaj� t ∼N�a
j� t� 2j� t�. The inverse of the variance 2
j� t representsthe precision of the information conveyed by an adver-tisement; the higher this precision, the greater is theinformation learned from past advertisements. Simi-lar to Erdem and Keane (1996), we assume the eval-uations based on the advertising set at occasion t tobe formed from all advertisements seen prior to occa-sion t.7 Note that the advertising set contains informa-tion learned from the informative effect of ads.Defining the consumption set. The consumption set,
Cj� t , contains cumulative information about the con-sumer’s assessment of brand j’s true quality from herconsumption experiences prior to occasion t. Theseconsumption experiences can be pure (i.e., no impactof advertising) or transformed (shaped by advertis-ing), depending on whether the consumer has notseen advertisements for the brand prior to purchaseor has seen them, respectively. Regardless, we repre-sent the consumer’s evaluations of brand j’s quality
7 We do not, however, consider advertisements seen further backin time as “decaying” in impact. We discuss this issue further inthe concluding section of the paper.
at purchase occasion t based on the consumption setCj� t as qcj� t ∼N�c
j� t�"2j� t�. Similar to our assumptions
on advertising, we assume that all consumption expe-riences prior to occasion t have an impact on the con-sumer’s quality evaluation based on her consumptionset at occasion t. To reiterate, the consumption setcontains information learned from the consumptionexperience and the transformative effect of ads.Overall quality inference. Given evaluations from
the advertising and consumption sets, the consumermixes the two in a standard Bayesian fashion to getthe mean and variance of her overall quality evalua-tions, qj� t , at purchase occasion t, as
�j� t =(�c
j� t
"2j� t
+ �aj� t
2j� t
)(1
"2j� t
+ 1 2j� t
)−1
and
1�2j� t
= 1"2j� t
+ 1 2j� t
�
(3)
Figure 1 illustrates the evolution of quality evalua-tions of a typical consumer by laying out the sequenceof events that occur between purchase occasions t−1and t.
The consumer purchases brand j at the beginning ofpurchase occasion t− 1. In the time period followingher purchase, till the end of occasion t−1, she receivesnj� t advertisements of brand j . At the end of purchaseoccasion t− 1, she forms her quality beliefs based onher advertising set, Aj� t , i.e., qaj� t ∼ N�a
j� t� 2j� t�. After
having formed these beliefs, she consumes the pur-chased brand j . This consumption experience maybe transformed by the advertisements that she hasobserved before t. Following her consumption experi-ence, she updates her quality beliefs of brand j basedon her consumption set, Cj� t , i.e., qcj� t ∼ N�c
j� t�"2j� t�.
At the beginning of purchase occasion t, she mixes herevaluations based on the advertising set (Aj� t), andthe consumption set (Cj� t) to form her overall qualitybeliefs, denoted by qj� t ∼N�j� t��
2j� t�. She uses these

Mehta, Chen, and Narasimhan: Disentangling the Multiple Effects of Advertising on Brand Choice Decisions340 Marketing Science 27(3), pp. 334–355, © 2008 INFORMS
overall quality beliefs to make her purchase decisionat occasion t. Note from Equation (3) that the evolu-tion of quality beliefs, qj� t , depends on the evolutionof beliefs based on her advertising set, qaj� t , and theevolution of beliefs based on her consumption set, qcj� t .We now discuss how each of these component beliefsevolves, while emphasizing the changes made to thestandard Bayesian learning model necessitated by aconsideration of source credibility, confirmatory bias,and bounded rationality.
2.2.1. Evolution of Consumer’s Quality Evalua-tions Based on Her Advertising Set: Accounting forSource Credibility. Consider the case where the con-sumer receives Nj� t (where Nj� t is the sum of adver-tisements received between all purchase occasions,i.e., Nj� t =
∑ts=0 nj� s) advertising exposures of brand j
between occasions 0 and t. Let $ij� r be the rth (wherer ∈ 1� � � � �Nj� t) advertising signal for brand j receivedby the consumer between purchase occasions t − 1and t. In the standard Bayesian learning model, wewould assume that the signals $ij� r are distributedaround the true quality qj , and are independent acrossall brands and all consumers. Neither of these holdsonce we consider source credibility issues. As discussedearlier, we now have to account for the fact thatadvertisers are not viewed as nonpartisan communi-cators.
We can accommodate source credibility by incor-porating the idea that the advertising signal attemptsto convey a quality that differs from the true qual-ity by some amount, which represents the “bias” inthe signal. Formally, we can write the rth ad signal ofbrand j as follows:
$ij� r = qj + bj + &j'ij� r � (4)
where qj is the true quality of brand j , bj is the truebias in the ad, &j is the inverse of the level of precisionin the ad message about the quality it is trying to por-tray, and 'ij� r is a random error that is independentlyand identically distributed (IID) across all r and t.
Now, if the consumer knows the extent of the biasexactly, she can discount it to obtain an unbiased adsignal, centered on the true quality qj . It is not veryreasonable to believe that the consumer knows theamount of bias exactly (but, for instance, does notknow the quality of the product). We therefore con-sider the more realistic (and interesting) case wherethe consumer has beliefs about the bias, denoted asNb̄j��
2bj �, where b̄j is her belief of the mean bias,
and �2bj reflects her uncertainty around this mean.8
Note that her belief of the mean bias could well be
8 Note that the consumer assumes a constant bias in advertise-ments. The implication of this is that the consumer does not letwhat she learns from consumption in the current period influence
greater than the “actual” bias in the ads—this wouldcapture the situation where the consumer thinks thatthe source is less credible than it actually is. Theuncertainty, in turn, could be high for a number ofreasons—perhaps most obviously, because the brandis new and the consumer does not know much aboutthe source yet. Given these beliefs, the consumer dis-counts the ad signal by the mean bias, and gets theadjusted ad signal
$adjij� r = qj + bj − b̄j + &j'ij� r � (5)
It is important to note that the consumer’s ad-basedexpectations are based on this discounted ad signal.However, she does not know the value of (bj − b̄j ).Thus, from her perspective, (bj − b̄j ) will be a randomvariable, �bj�bj , whose value remains the same acrossall ads. This implies that the discounted ad signalfrom the consumer’s perspective would be given by
$adjj� r = qj +�bj�bj + &j'j� r � (6)
The discounted ad signal leads to two differencesfrom the standard Bayesian learning model. First,observe that because the consumer discounts each adby a constant amount b̄j , the random error �bj�bj is thesame for all ads of a brand j . This suggests that adsignals of brand j get serially correlated.9 Note thatthis correlation arises endogenously because of theassumption that advertisers suffer from source credi-bility issues, and the consequent discounting. Second,the variance of the discounted ad signal is larger thanin the standard Bayesian learning case; &2
j +�2bj in the
discounted case, as compared to just &2j for the stan-
dard case.The correlation between ad signals engendered by
the presence of source credibility, in turn, suggeststhat the informativeness of N ad signals is no longerN times the informativeness of a single signal. Ifthe consumer receives Nj� t advertising exposures forbrand j between purchase occasions 0 and t, herquality evaluations based on her advertising signalsat purchase occasion t would be qaj� t ∼ N�a
j� t� 2j� t�,
where
�aj� t =
1Nj� t
Nj� t∑r=1
$adjj� r and 2
j� t = &2j /Nj� t +�2
bj � (7)
her beliefs about ad bias in the next period. One could think of amore complicated situation where the consumer constantly updatesher beliefs on the bias, based on what she learns about the product.This would set up a feedback loop from consumption to advertisingthat is absent from the current model. While making for a more sat-isfactory description, it would likely render the model intractable.9 The result that source credibility leads to serial correlationbetween the ad signals accords well with the findings of Hoch andDeighton (1989, p. 7), who state that “in learning through educa-tion, they [consumers] are alert to source credibility and are sen-sitive to the fact that repeated ads from a manufacturer are notindependent.”

Mehta, Chen, and Narasimhan: Disentangling the Multiple Effects of Advertising on Brand Choice DecisionsMarketing Science 27(3), pp. 334–355, © 2008 INFORMS 341
How much extra do Nj� t ads convey, versus onead? To answer this, note that the informativeness ofone ad signal is just 1/&2
j + �2bj �, while the informa-
tional value of Nj� t ads can be obtained from Equa-tion (7) above as 1/&2
j /Nj� t +�2bj �. Therefore, the ratio
of the informational value of Nj� t ads to the informa-tional value of one ad is )2
jt = &2j +�2
bj �/&2j /Nj� t +�2
bj �,or simply )2
jt = Nj� ts2j + 1�/Nj� ts
2j + 1��, where s2j =
�2bj/&
2j is the ratio of the uncertainty in the consumer’s
beliefs of the bias in the ads of brand j relative tothe noise in the advertising signal of brand j . Noticethat )2
jt is less than Nj� t , the ratio for the standardBayesian learning model. Also note that as the uncer-tainty around the bias increases, the ratio declines;for zero uncertainty, the ratio becomes Nj� t , exactly asin the standard case. Finally, note from Equation (7)that the presence of �2
bj ensures that the consumer’sbeliefs will never converge to the true quality, evenwith infinite exposures. There is a bias in ad expec-tations, �bj�bj , which never goes to zero. This is incontrast to the Bayesian learning model, where theconsumer converges to the true quality given a suffi-ciently large number of ad signals.
2.2.2. The Evolution of a Consumer’s Qual-ity Evaluations Based on Her Consumption Set:Accounting for Confirmatory Bias and BoundedRationality. Consider the case where the consumerpurchases brand j in period t − 1. Let *j� t−1 bethe noisy quality signal received by the consumerfrom brand j’s consumption at the end of occasiont − 1. In the standard Bayesian learning model, theconsumption signal can be written as *j� t−1 = qj ++�c� jt−1, which is equivalent to saying that the signalis distributed around the true quality qj as *j� t−1 ∼Nqj�+
2�. Here, + is the extent of ambiguity in theconsumption signal, or equivalently the inverse of theinformational value of one consumption experience.The greater the ambiguity, the less useful is a con-sumption experience in informing the consumer ofthe true quality of the brand. Given this signal, wecan easily update beliefs based on the consumptionset in a Bayesian manner.
A crucial assumption in the standard Bayesianlearning model, however, is that advertising doesnot alter evaluations of the subsequent consumptionexperience, i.e., prior ads and subsequent consump-tion signals are independent pieces of informationabout the brand’s quality. The transformative effectsuggests the opposite. This effect suggests that as theconsumer uses the consumption experience to test thetentative hypotheses that ad signals have led her toform, her ad-based expectations influence what shelearns.
Formally, consider the case where the consumerreceives Nj� t advertisements for brand j , ,$jr -
nj� tr=1,
between occasions 0 and t, and the consumer con-sumes brand j just prior to occasion t. From Equa-tion (7), the consumer’s ad-based expectations aregiven as �a
j� t = 1/Nj� t�∑Nj� t
r=1 $adjj� r , whose stochastic
specification we can write as �aj� t = qj + �bj�bj +
&j/Nj� t�∑Nj� t
r=1 'j� r . The presence of the �bj�bj termclearly introduces a bias in the ad-based expectations.Now, the consumer treats these ad-based expectationsof brand j as a tentative hypothesis and tests themon consumption of brand j at the end of occasiont− 1 (assuming brand j was purchased at occasiont− 1). As suggested by Hoch and Deighton (1989),this results in a confirmatory bias in which the biasesin the ad-based expectations get transferred to theinformation about the quality learned from subse-quent consumption. We parsimoniously model this byletting the ad-based expectations be correlated withthe consumption signal—or specifically, we let thebias error in the ad-based expectations be correlatedwith the consumption signal with a correlation .j . Toreiterate, .j determines the extent to which biases inad-based expectations are transferred onto consump-tion, i.e., the extent to which they help transform eval-uations of the consumption experience. This would,in turn, be a reflection of the extent to which thereis a match between the attributes suggested in thead and the brand attributes that can be seen duringconsumption.10
Given the assumption that the consumption signalis correlated with the bias in the ad signal, �bj�bj , witha correlation .j , it can be shown that the consump-tion signal is correlated with the ad-based expecta-tions with a correlation of .j�bj/
√�2bj + &2
j /Nj� t . Thisexpression accords well with much of the behavioralliterature discussed earlier. In particular:
(a) It depends on .j—the greater the tightnessbetween ads and consumption, the greater is theimpact of ads on subsequent consumption.
(b) It depends on the uncertainty surrounding themean bias belief. The lower the �bj , the lower thebiases in ad-based expectations, and hence the lowerthe correlation between ad-based expectations andconsumption. This maps well into behavioral liter-ature suggesting that if �bj is small, consumers donot perceive ads to be biased and thus have littleincentive to test the attributes suggested by the ads.This, in turn, suggests a smaller impact of ads onconsumption.
(c) It depends on the number of ads seen prior toconsumption. This follows from behavioral literature,which says that the greater the N , the lower the noise
10 Note that we have modeled confirmatory bias in a semistructuralfashion using the exogenous correlation .. A discussion of how onecould relax this is deferred to the conclusions section.

Mehta, Chen, and Narasimhan: Disentangling the Multiple Effects of Advertising on Brand Choice Decisions342 Marketing Science 27(3), pp. 334–355, © 2008 INFORMS
in the ad-based expectations, the clearer the hypothe-ses (or frame) that needs to be tested by the consump-tion experience, and hence the higher the impact ofads on consumption.
Once we accommodate the fact that the consump-tion signal is correlated with ad-based expectations,the distribution of the consumption signal that isreceived at the end of occasion t−1 would depend onpast advertisements, ,$jr -
Nj� t
r=1 . It can be shown that thedistribution of the consumption signal conditional onpast advertisements is given as
*Tj� t−1 ∼N
(qj +
+.j�bj
�2bj + &2
j /Nj� t
(1
Nj� t
Nj� t∑r=1
$adjj� r − qj
)�
+2
(1− .2
j �2bj
�2bj + &2
j /Nj� t
))� (8)
We have already modified the standard Bayesianlearning model to accommodate source credibil-ity and confirmatory bias. The third aspect of thetransformative effect—namely, bounded rationality—is implied in the following question: Is the consumeraware of the transference of bias from ads to con-sumption? If the consumer were aware of this trans-ference, then she would rationally discount it, andthere would be no transformation of consumption. Wehave already discussed this issue at some length inthe section on modeling challenges, drawing on Hochand Deighton (1989). Briefly, we suggest that the ratio-nal discounting does not happen because consumersseldom suspect the credibility of their own consump-tion experiences, instead naively believing that con-sumption is an unbiased source of information that isnot affected by external forces such as ads (Hoch andHa 1986). In this sense, the consumer is boundedlyrational.
Bounded rationality implies that the consumerassumes the transformed consumption signals (*T
j� t−1)to be independent of the ad-based expectations whileupdating her evaluations from consumption. For theconsumer, the transformed consumption signals arethus IID draws across purchase occasions, distributedas *T
j� t−1 ∼Nqj�+2). Therefore, we can obtain the con-
sumer’s evaluations based on her consumption set atoccasion t (qcj� t) by updating her beliefs based on herconsumption set at occasion t − 1 (qcj� t−1), with thetransformed consumption signal (*T
j� t−1), in a simpleBayesian fashion as follows:
�cj� t =
�cj� t−1/"
2j� t−1 + dj� t−1*
Tj� t−1/+
2�
1/"2j� t−1 + dj� t−11/+2�
and
1"2j� t
= 1"2j� t−1
+ dj� t−11+2
�
(9)
Equation (9) shows the updating mechanism of thequality evaluations from the consumer’s perspec-tive. It is worthwhile again to highlight the com-parison with the standard Bayesian learning model.Because the consumer is unaware that transforma-tion is truly taking place, the updating mechanism ofbeliefs (based on the consumption set) from the con-sumer’s perspective is the same in both the standard caseand in our modified model.
2.2.3. Mixing Advertising and ConsumptionSets: The Evolution of a Consumer’s Overall Qual-ity Evaluations.
(a) From the consumer’s perspective. So far, we havederived the evolution of the consumer’s brand evalu-ation based on her advertising set in Equation (7) andthe evolution of her brand evaluation based on herconsumption set in Equation (9). Furthermore, Equa-tion (3) shows how the consumer mixes her evalua-tions from the advertising and consumption sets toget her overall quality evaluation of a brand. Combin-ing Equations (7), (9), and (3), we get the expressionfor the evolution of the mean and precision of con-sumer’s overall quality evaluations at occasion t as
�j� t =(0j� t−1�j� t−1 + dj� t−1*
Tj� t−1
+12j
()2j� t
Nj� t
Nj� t∑r=1
$adjj� r −
)2j� t−1
Nj� t−1
Nj� t−1∑r=1
$adjj� r
))
· 0j� t−1 + dj� t−1 +12j )
2j� t − )2
j� t−1��−1
0j� t = 0j� t−1 + dj� t−1 +12j
()2j� t − )2
j� t−1
)�
(10)
where 0j� t = +2/�2j� t can be interpreted as the pre-
cision in the overall quality beliefs of brand j atoccasion t; )2
jt = &2j + �2
bj �/&2j /Nj� t + �2
bj �, introducedearlier, is the ratio of the informational value of Nj� t
ads to one ad; and 12j = +2/&2
j + �2bj � is the ratio of
the informational value of one ad to the informa-tional value of one consumption experience. The term0j� t−1�j� t−1 represents the impact of overall evalua-tions at t − 1. Intuitively, if precision at t − 1 (0j� t−1)is high, evaluations at t− 1 would be weighted heav-ily, thus reducing the impact of informative effectsand of transformed consumption. The term dj� t−1*
Tj� t−1
captures the impact of transformed consumption ofthe brand purchased at occasion t − 1 and con-sumed at the end of occasion t − 1, and the term12j )
2j� t/Nj� t�
∑Nj� t
r=1 $adjj� r − )2
j� t−1/Nj� t−1�∑Nj� t−1
r=1 $adjj� r � cap-
tures the informational value of Nj� t −Nj� t−1 ads seenbetween occasions t− 1 and t.
(b) From the analyst’s perspective—the stochastic spec-ification of the model. While the consumer observesthe realizations of the advertising signals receivedbetween occasions 0 and t, ,$j� r -
Nj� s
r=1 , and observes therealization of the transformed consumption signal,

Mehta, Chen, and Narasimhan: Disentangling the Multiple Effects of Advertising on Brand Choice DecisionsMarketing Science 27(3), pp. 334–355, © 2008 INFORMS 343
*Tj� t−1, the analyst does not. The analyst observes
only the choices made by the consumer, the num-ber of ads seen between consecutive occasions, andthe occurrence of purchase (which is mapped to con-sumption). Therefore, the terms )2
j� t/Nj� t�∑Nj� t
r=1 $adjj� r −
)2j� t−1/Nj� t−1�
∑Nj� t−1
r=1 $adjj�r and *T
j� t−1 in Equation (10),while deterministic from the consumer’s perspec-tive, are random variables from the analyst’s perspec-tive. Deriving the stochastic specification of these twoterms is necessary to get the stochastic specificationfor the evolution of the overall mean quality evalua-tions. We do this below.
First, consider the advertising signal, $adjj� r . The con-
sumer has beliefs about the true bias, bj ; in particular,she assumes a mean bias of b̄j , with some uncertaintydenoted by �bj . The analyst does not know either thetrue bias or the consumer’s mean belief, b̄j . However,given a string of purchase observations across a set ofconsumers, he can estimate 2bj = bj − b̄j . Thus, fromthe analyst’s perspective, the rth ad signal wouldbe given as $
adjj� r = qj + bj − b̄j + &j'j� r , which can be
written as$adjj� r = qj +2bj + &j'j� r � (11)
This implies that the ad-based expectation at occa-sion t from the analyst’s perspective will be
1Nj� t
Nj� t∑r=1
$adjj� r = qj +2bj +
&j
Nj� t
Nj� t∑r=1
'j� r �
which can be written as
1Nj� t
Nj� t∑r=1
$adjj� r = qj +2bj +
&j√Nj� t
3j� t� (12)
where 3ij� t−1 = 1/√Nj� t�
∑Nj� t
r=1 'j� r is the cumulative aderror, which is a standard normal random variablethat is IID across all brands, all purchase occasions,and all consumers. We can now write the stochas-tic specification of the term )2
j� t/Nj� t�∑Nj� t
r=1 $adjj� r −
)2j� t−1/Nj� t−1�
∑Nj� t−1
r=1 $adjj� r . This would be given as
)2j� t
Nj� t
Nj� t∑r=1
$adjj� r −
)2j� t−1
Nj� t−1
Nj� t−1∑r=1
$adjj� r
= qj +2bj�)2j� t − )2
j� t−1�
+ &j
()2j� t√Nj� t
3j� t −)2j� t−1√Nj� t−1
3j� t−1
)� (13)
Next, consider the consumption signal at t − 1(*T
j� t−1) from the analyst’s perspective. While the con-sumer believes her consumption is not transformedby past ad expectations, i.e., that the consumption sig-nal is an unbiased and IID random draw from *j� t−1 ∼Nqj�+
2), the analyst knows that the consumption
signal is transformed, with a distribution given inEquation (8). We can rewrite Equation (8) as
*Tj� t−1 = qj +
+.jk�bj
�2bj + &2
j /Nj� t
(1
Nj� t
Nj� t−1∑r=1
$adjj� r − qj
)
+ �cj� t−1+
√1− .2
j �2bj
�2bj + &2
j /Nj� t
� (14)
where �cj� t−1 is the pure consumption error, which isa standard normal random variable that is IID acrossall brands, all purchase occasions, and all consumers.Substituting the stochastic specification for the ad sig-nal from Equation (12), we get the stochastic specifi-cation of the transformed consumption signal as
*Tj�t−1 = qj+2bj
�bj+.j
�2bj+&2
j /Nj�t−1+ �bj+.j
�2bj+&2
j /Nj�t−1
· &j√Nj�t−1
3ij�t−1++
√(1− .2
j �2bj
�2bj+&2
j /Nj�t−1
)�cj�t−1�
which we can rewrite as
*Tj� t−1 = qj +
+.j)2j� ts
2j
1+ s2j
(2bj
�bj
)+ +.j)
2j� tsj
1+ s2j
(3j� t√Nj� t
)
+ �cj� t−1+
√1− .2
j s2j )
2j� t
1+ s2j� (15)
where s2j = �2bj/&
2j has been defined earlier as the ratio
of the uncertainty in the bias beliefs of the consumerto the noise in the advertising signal. Intuitively, thereis no transformative effect if �bj = 0 or + = 0, i.e.,if either the consumer knows the exact bias in theads or if the consumption experience is completelyunambiguous. Both of these follow from our concep-tualization, wherein source credibility and consump-tion ambiguity are cornerstones of the transformativeeffect.
Finally, substituting the stochastic specification of)2
j� t/Nj� t�∑Nj� t
r=1 $adjj� r − )2
j� t−1/Nj� t−1�∑Nj� t−1
r=1 $adjj� r from
Equation (13) and *Tj� t−1 from Equation (15) into
Equation (10), we get the expression for the evolutionof the mean of the overall quality evaluations atoccasion t, from the analyst’s perspective, as
�j�t = �j�t−1,0j�t−10−1j�t -+0−1
j�t
{12j
(qj+2bj�)
2j�t−)2
j�t−1�
+&j
()2j�t√Nj�t
3j�t−)2j�t√
Nj�t−1
3j�t−1
))}
+0−1j�t
{dj�t−1
(qj+
+.j)2j�ts
2j
1+s2j
(2bj
�bj
)+ +.j)
2j�tsj
1+s2j
·(
3j�t√Nj�t
)+�cj�t−1+
√1− .2
j s2j )
2j�t
1+s2j
)}� (16)

Mehta, Chen, and Narasimhan: Disentangling the Multiple Effects of Advertising on Brand Choice Decisions344 Marketing Science 27(3), pp. 334–355, © 2008 INFORMS
The first term in curly brackets on the right-hand side(RHS) of Equation (16), 0j� t−10
−1j� t , captures the weight
the consumer puts on the quality evaluation of theprevious purchase occasion, �j� t−1, i.e., the effect ofthe previous quality evaluation on the current qualityevaluation. The second term in curly brackets on theRHS,
12j
(qj +2bj�)
2j� t − )2
j� t−1�
+ &j
()2j� t√Nj� t
3j� t −)2j� t√
Nj� t−1
3j� t−1
))�
captures the informative effect of ads seen betweenoccasions t − 1 and t. Finally, the third term in curlybrackets on the RHS of Equation (16) captures theimpact of the transformed consumption experiencebetween occasions t − 1 and t. More accurately, theterms qj and �cj� t−1+
√1−.2
j s2j )
2j� t/1+ s2j � capture the
pure consumption effect, while
+.j)2j� ts
2j
1+ s2j
(2bj
�bj
)+ +.j)
2j� tsj
1+ s2j
(3j� t√Nj� t
)
captures the transformative effect of ads of brand jpurchased at occasion t− 1 and consumed at the endof occasion t − 1. Clearly, the transformative effectincreases as +, .j , and 2bj increase. We summarizewhat our model has to say about informative andtransformative effects below.
2.3. Summarizing Informative andTransformative Effects
The informative effect of advertisements. 12j 2)
2j� tqj +
2bj� captures the informative effect of nj� t advertise-ments. This has three elements to it: (a) the informa-tional value of one ad, as captured by 12
j (definedearlier in §2.2.3 as 12
j = +2/&2j + �2
bj �), which is aninverse function of the sum of the two variancesin the ad signals—the variance of the noise thatresults from message clarity, &2
j , and the varianceof the perceived bias of brand j , �2
bj ; (b) the differ-ence between the mean of the advertising signals,qj +2bj , and the consumer’s prior mean quality beliefof brand j at t− 1, �ej� t−1. The greater this difference,the greater the informative effect of ads; (c) the ratioof the informational value of nj� t ads to the informa-tional value of one ad, as captured by the term )2
jt =Nj� ts
2j + 1�/Nj� ts
2j +1��. Note that this term decreases
as s2j =�2bj/&
2j � increases.
The Transformative Effect of Advertisements. The im-pact of the transformed consumption signal is given as
dj� t−1
(qj +
+.j)2j� ts
2j
1+ s2j
(2bj
�bj
)+ +.j)
2j� tsj
1+ s2j
(3j� t√Nj� t
)
+ �cj� t−1+
√1− .2
j s2j )
2j� t
1+ s2j
)�
This implies that the total effect of the transformedconsumption signal is split between the effect of pureconsumption (i.e., when .j = 0) and the transforma-tional effect of advertising. In effect, the formulationis an averaging process where the effect of pure con-sumption gets reduced when transformation takesplace. The strength of the averaging is determined bythe extent of transformation (.j ), the ambiguity in theconsumption experience (+), the extent of consumeruncertainty about the biases in the ads (�2
bj ; note thatsj and )j are functions of �2
bj ), and the estimated dif-ference between the true bias in ads and consumerbeliefs of the mean bias (2bj ).
3. Data, Estimation, and Analysis3.1. DataWe estimate the model on single-source scanner paneldata on liquid and powdered laundry detergent, col-lected by A. C. Nielsen, Inc. in the Sioux Falls, SouthDakota market. Our reasons for choosing the liq-uid detergent product category are fourfold. First,some prior research efforts that have tried to demon-strate the multiple effects of advertisements have usedthe same category (Deighton et al. 1994, Erdem andKeane 1996), permitting easy comparison. Second,prior behavioral research has suggested that trans-formative effects are usually associated with low-involvement routinized purchase behavior that istypical for the liquid detergent category (Vakratsasand Ambler 1999). Third, Erdem and Keane (1996)have found significant consumption ambiguity in thisproduct category (a result we replicate in §3.3.2), thussuggesting transformation can play a significant role.Fourth, the data set contains the introduction of twonew products, which makes it well suited for study-ing the learning process. Finally, Mehta et al. (2004)have found significant consumer forgetting of qualityevaluations in this category. They find a half-life of 20weeks for information learned from consumption—because our data span more than twice this period, itseems reasonable to suppose that all learning has notceased.
The liquid detergent data span a 153-week periodfrom 1986 to 1988. Advertising information, how-ever, is available for only the last 51 weeks of thisperiod. We select households for our sample accord-ing to the following criteria, which are similar to priorpapers that have used these data (e.g., Erdem andKeane 1996). We select households that have (a) a his-tory of purchase as well as of viewing commercials,(b) purchase liquid detergent products more than 80%of the time (as compared to powdered detergent), and(c) purchase liquid detergent at least 20 times in the153-week period. This leaves us with information on

Mehta, Chen, and Narasimhan: Disentangling the Multiple Effects of Advertising on Brand Choice DecisionsMarketing Science 27(3), pp. 334–355, © 2008 INFORMS 345
Table 1 Descriptive Statistics for Liquid Detergent Data Set
Price MarketBrand #ad/(week ∗ person)∗∗ (cents/oz.) share Feature Display
Cheer 0�1544 5�7524 0�0702 0�0149 0�0046Surf 0�2359 5�2740 0�1283 0�0556 0�0717Era 0�5284 5�7262 0�2351 0�0604 0�0620Wisk 0�7252 4�8803 0�2525 0�0767 0�1535Tide 0�4737 5�6014 0�3140 0�0727 0�1453
Note. ∗∗The average across households and weeks of the number of ads seenfor this brand.
shopping trips and advertising exposures for a panelof 221 households consisting of 2,549 purchase occa-sions. We use 150 households (1,750 purchase occa-sions) as our estimation sample and 71 households(739 purchase occasions) as our holdout sample. Wehave data on five brands: Cheer, Surf, Era, Wisk, andTide, which together account for 65.4% of the mar-ket share in this product category. Of these, Cheerand Surf were introduced in the sample period—the presence of new products means that qualityuncertainty is likely to be high, suggesting a role forlearning and possibly of advertising influencing thislearning. Finally, note that we aggregate data fromthe SKU level to the brand level using a weightedsum, with the market shares within the brand asweights. Table 1 presents key descriptive statistics forthe data.Specifying Initial Conditions. We know that our data
do not encompass the entire choice history of eachhousehold in our sample (i.e., they are left truncated).This has implications for what we assume aboutthe prior mean and variance of the quality percep-tions. If one does not control for initial choice history,the implicit assumption is that every household hasthe same prior mean and variance across all brands.Clearly, this is erroneous. A household that has pur-chased a brand multiple times in the past wouldpresumably have more informed priors than anotherhousehold that has purchased that brand very little.Similarly, a household that has purchased brand jmultiple times would know its quality better than thatof brand k, which it rarely buys. In essence, we haveto account for the heterogeneity of priors in the sam-ple. To do so, we follow an approach that is simi-lar in spirit to that used in Mehta et al. (2004) andErdem et al. (2006). Note that because our advertis-ing data cover only the last 51 weeks of our 153-weeksample period, we can use the first 102 weeks as apre-estimation sample to estimate the distribution ofpriors. To aid exposition, we label the start and endof the preestimation period as T0 and T1, respectively.Formally, at T0, let quality perceptions for brand j bedistributed as
qij�0 ∼N�0��20 �� (17)
where (following the reparameterization used in§2.2.3) the prior variance of household i’s qualitybelief of brand j at the beginning of the preestimationsample (�2
0 ), can be written in terms of the prior pre-cision at the beginning of the preestimation sample(00) and the variance in the noise in the consumptionsignal (+2) as �2
0 = +20−10 . Note that the mean and the
variance of these priors are assumed to be the sameacross all consumers and all brands.
At T1 (which is also the beginning of the estimationsample), quality perceptions are distributed as
qe� ij ∼N�e� ij ��2e� ij �� (18)
where �2e� ij , the variance of household i’s quality belief
of brand j at the end of the preestimation sample,can be written in terms of the precision at the end ofthe preestimation sample (0e� ij ), and the noise in theconsumption signal (+2), as �2
e� ij = +20−1e� ij .
Our objective is to get the specifications of the meanand precision at the end of the preestimation sample(Equation (18)) as a function of (a) the priors in thepreestimation sample, Equation (17), and (b) the num-ber of consumption experiences that household i hashad with brand j in the preestimation sample.
Consider the case in which household i has had∑T1t=To
dij� t consumption experiences (which is equal tothe number of times household i has purchased j inthe preestimation sample). This implies that house-hold i would have received
∑T1t=To
dij� t consumptionsignals of brand j in the preestimation sample. Thesesignals would result in (a) a reduction in house-hold i’s variance in the quality beliefs of brand j from00 to 0e� ij , and (b) a shift in the mean of household i’squality evaluations of brand j from �0 to �e� ij . Similarin spirit to Erdem et al. (2006), we specify 0e� ij as afunction of 00 and the number of purchases
∑T1t=To
dij� tin the preestimation sample in the following reduced-form fashion:
0e� ij = 00 + k1
∑dijt6 0< k1 < 1� (19)
The specification in Equation (19) suggests that thegreater the number of purchases of brand j , the higheris∑
dijt , and hence the greater the increase in preci-sion over the preestimation time period. Furthermore,the parameter k1 captures the notion of forgetting in anonstructural way—as k1 approaches 1, the extent offorgetting diminishes. To specify the mean of house-hold i’s quality evaluations of brand j at the endof the preestimation sample, we need to specify the∑T1
t=Todij� t consumption signals. However, instead of
specifying each consumption signal that the house-hold receives over the preestimation period, we canequivalently think of the consumer as receiving onecumulative consumption signal that results in an

Mehta, Chen, and Narasimhan: Disentangling the Multiple Effects of Advertising on Brand Choice Decisions346 Marketing Science 27(3), pp. 334–355, © 2008 INFORMS
increase in the precision of household i’s quality belieffor brand j from 00 to 0e� ij . As shown by Erdemet al. (2006), this cumulative consumption signal canbe represented as xm
ij , which is distributed as
xmij ∼Nqj��
2xij�� (20)
where the variance of the cumulative consumptionsignal is related to the variance of a single consump-tion signal (+2), and the increase in precision fromconsumer i’s quality beliefs of brand j in the pre-estimation period, as �2
xij = +20e� ij −00�−1, or equiva-
lently �2xij = +2k1
∑T1t=T0
dij� t�−1. We thus represent the
cumulative consumption signal as xmij = qj + �xij�ij ,
where �ij is a standard normal random variable thatis independent across brands and consumers.
Therefore, given the cumulative consumption sig-nal (xm
ij ) in Equation (20) and the distribution ofthe household’s prior mean quality of brand j atthe beginning of the preestimation sample in Equa-tion (17), the mean quality evaluation at the end ofthe preestimation sample can be specified as
�e� ij = �000
00 + k1∑T1
t=T0dij� t
+ qjk1∑T1
t=T0dij� t
00 + k1∑T1
t=T0dij� t
++
√k1∑T1
t=T0dij� t
00 + k1∑T1
t=T0dij� t
�ij � (21)
Equations (21) and (19), respectively, specify the meanand the precision of consumer i’s beliefs about thequality of brand j at the end of the preestimation sam-ple. For identification, similar to Mehta et al. (2004),we impose �0 = 0 for all brands. Thus the parametersto be estimated from the pre-estimation sample are 00and k1.
3.2. Model EstimationWe have introduced 14 parameters in the model sofar: (a) the true qualities of the five brands, ,qj -5j=1;(b) the ratio of the informative effects of a single adver-tising exposure to that of consumption, ,1j-
5j=1; (c) the
correlation between ads and consumption, ,.j-5j=1;
(d) the difference between the actual bias in thebrands’ advertisements and the consumers’ meanbelief of that bias, ,2bj-5j=1; (e) the ratio of the uncer-tainty in bias beliefs to the noise in the advertisingsignal, ,s2j -
5j=1; (f) the persuasive effect for the five
brands, ,�per� j -5j=1; (g) the consumer’s price sensitiv-
ity, �p; (h) the noise in the consumption signals, +;(i) the consumer’s feature sensitivity, �f ; (j) the con-sumer’s sensitivity to displays, �d; (k) the consumer’squality sensitivity, ; (l) the risk-aversion parameter, r ;(m) the precision of overall quality beliefs in the prees-timation sample, 00; and (n) the parameter k1 definedin the estimation of initial conditions earlier.
Table 2 Summarizing Parameters
Parameter What it represents
qjt True quality of brand j in time t
�2j =
�2
�2j + � 2b
Ratio of informational value of one ad for brand j to pureconsumption effect
sj = �bj /�j Ratio of uncertainty in bias belief for brand j to noise in theadvertising signal
�j Correlation between advertising and the consumption set bj The difference between true bias in advertising and
consumer’s common belief for product j�j Noise in the advertising signal for product j� Noise in the consumption signal�bj Uncertainty in the bias belief for product jr Risk-aversion parameter��p Mean value of price sensitivity across consumers��p Standard deviation of the distribution of price sensitivity
across consumers��f Mean value of feature sensitivity across consumers��f Standard deviation of the distribution of feature sensitivity
across consumers��d Mean value of display sensitivity across consumers��d Standard deviation of the distribution of display sensitivity
across consumers��per � j Mean value of persuasive effect across consumers for
product j��per Standard deviation of the distribution of persuasive effects
across consumers�0 Consumers’ initial rate of learning through consumptionk1 Parameter used to calibrate initial conditions�0j Consumers’ prior belief on mean quality
We also account for unobserved heterogeneity inthe price sensitivity, feature and display variables, andin the persuasive effect of ads. To do this, we let theconsumer’s price sensitivity be normally distributedacross the population with mean ��p and variance �2
�p,
the feature sensitivity be normally distributedwith mean ��f and variance �2
�f, the display sensitivity
be normally distributedwithmean ��d and variance�2�d,
and the persuasive effect be normally distributed withmean ��per� j and variance �2
�per. For expositional ease, we
summarize each of the parameters in Table 2.Similar to Mehta et al. (2004), we normalize the
mean quality sensitivity, , to 1. This leaves us with6J +11 parameters to estimate (where J = 5 is the totalnumber of brands), denoted as ' ≡ ,,qj�1j�.j�2bj�
s2j � ��per� j -Jj=1� ��p��
2�p�+��2
�per� ��f ��
2�f� ��d��
2�d� r�00� k1-.
We use the method of simulated maximum likelihoodto estimate these parameters. For reasons of space, werelegate further details on the exact likelihood func-tion, the estimation algorithm, and issues related tothe identification of various parameters to the techni-cal appendix.
3.3. Parameter Estimates andDiscussion of Results
Goodness of Fit Tests. Table 3 reports log-likeli-hood values and hit rates for our model for estimation

Mehta, Chen, and Narasimhan: Disentangling the Multiple Effects of Advertising on Brand Choice DecisionsMarketing Science 27(3), pp. 334–355, © 2008 INFORMS 347
Table 3 Model Fit for Estimation and Holdout Sample
Model Estimation sample Holdout sample
Proposed modelHit rate (%) 69�88 67�85Log likelihood −1�455�71 −698�61AIC 2�993�42
Deighton et al. (1994) modelHit rate (%) 64�89 63�55Log likelihood −1�643�34 −754�22AIC 3�366�68
Notes. The Akaike Information Criterion (AIC) is given as −2L+ 2k,where L is the log-likelihood function, and k is the number of param-eters. The proposed model has 41 estimable parameters, while theDeighton et al. (1994) model has 24. A model with a lower AIC ispreferred.
and holdout samples. We also report the fit compar-ison with a modified version of the model specifica-tion in Deighton et al. (1994)—for space, parameterestimates for the comparison model are providedin the Technical Appendix, which can be found athttp://mksci.pubs.informs.org. The utility specifica-tion of the modified Deighton et al. (1994) model isgiven as
Uij� t = qij + ai1pj� t�+ ai2pj� tNj� t−1�+ bi1√Nj� t−1�
+ bi2√Nj� t−2�+ bi3dj� t−1�+ bi4dj� t−1
√Nj� t−1�
+ ci1Featj� t�+ ci2Dispj� t�+ �ij� t�
where Nj� t−1 represents the number of advertisementsseen by the consumer between purchase occasions 0and t, Nj� t−2 represents the number of advertisementsseen by the consumer between purchase occasions 0and t−1, and dj� t−1 is an indicator variable, equal to 1if the consumer purchases brand j on occasion t − 1and 0 otherwise.
To compare models, we calculate the AIC for bothmodels. The AIC is given as −2 lnL�+ 2k, where L isthe likelihood and k is the number of parameters. Themodel with the lower value of AIC is preferred. Ourproposed model does better than the reduced formmodel (AIC of 2,993.42 versus 3,366.68), even thoughit has a greater number of parameters (41 versus 24).
3.3.1. Results and Discussion of Insights. Para-meter estimates for the model are reported in Table 4.We summarize our discussion of the parameter esti-mates under the following broad substantive areas.True qualities. Tide has the highest true quality (q5 =
4�1653), followed by Era (q3 = 4�1028), Cheer (q1 =3�9217), Surf (q2 = 3�4792), and Wisk (q4 = 3�1096). Onecan think of these as constituting two groupings, withEra and Tide constituting the “high-quality” groupand the other three brands forming the “low-quality”group.Perceived quality beliefs at the beginning of the estima-
tion sample. Based on the estimates of k1 and 00 at the
beginning of the preestimation sample (as discussedin §3.1), we can calculate the mean and variance ofthe perceived quality beliefs averaged across all con-sumers in the sample. The estimates of these tell uswhether there is still potential for learning (and hencea role for informative and transformative effects ofads) in the estimation sample. We get the perceivedmean quality belief at the beginning of the estimationsample averaged across all consumers for Cheer as0.46, for Surf as 0.62, for Era as 1.05, for Wisk as 0.94,and for Tide as 1.10. Similarly, we get the average per-ceived variance in the consumers’ quality beliefs atthe beginning of the estimation sample for Cheer as1.50, for Surf as 1.44, for Era as 1.34, for Wisk as 1.29,and for Tide as 1.33. Notice that although the newbrands (Cheer and Surf) are associated with higheruncertainty in their perceived qualities, the averageuncertainty in the established brands is also reason-ably high. Even though our context is a mature prod-uct category, the uncertainty about perceived qualitiescan come from various sources—it could be becauseof the introduction of two new products during thesample period, or because consumers are aware of thequality of only a few products and not the entire set.Perceived bias in advertisements. In our formulation,
consumers attributed a certain mean bias to a brand’sads (b̄j ), with some variance around this mean (�bj ).We are able to estimate 2bj (which is bj − b̄j ). Forthe variance, we calculate �bj from estimated param-eters (to see this, note that we have estimates of s2j =�2bj/&
2j , 1
2j = +2/&2
j + �2bj � and +2. From these, we can
calculate �bj ). Focusing on the variance of the per-ceived biases in the ads of each of the brands first, onewould expect older brands to have a lower variance.Also, to the extent that the ads have been successfulin informing consumers of true quality in the past, thevariance of the bias should be lower. In line with intu-ition, the two new products, Cheer (�b1 = 4�5992) andSurf (�b2 = 4�1677), have the highest variances, i.e., theconsumer is most uncertain about the bias in the adsof Cheer and Surf. These are followed by Tide (�b5 =3�9937), Wisk (�b4 = 3�2429), and Era (�b3 = 2�8166).
As for 2bj , a positive value for a brand wouldsuggest that the consumer thinks ads for this brandare less biased than what they actually are, whilea negative value would suggest the opposite. Theseperceptions could be affected by a variety of fac-tors, such as the content of the ad or informationthat affects the credibility of the source. Both Cheer(2b1 = −0�9221) and Wisk (2b4 = −2�1250) seem tosuffer from worse source credibility issues than they“deserve”; on the other hand, the consumer discountsthe bias in the advertisements of Era (2b3 = 2�3707),Surf (2b2 = 1�6819), and Tide (2b5 = 1�1290) less thanis warranted.

Mehta, Chen, and Narasimhan: Disentangling the Multiple Effects of Advertising on Brand Choice Decisions348 Marketing Science 27(3), pp. 334–355, © 2008 INFORMS
Table 4 Parameter Estimates for Proposed Model
Parameter What it represents Estimate Standard error
q1 True quality of Cheer 3�9217∗∗ 0�5478q2 True quality of Surf 3�4792∗∗ 0�5411q3 True quality of Era 4�1028∗∗ 0�3998q4 True quality of Wisk 3�1096∗∗ 0�4030q5 True quality of Tide 4�1653∗∗ 0�3696�1 Ratio of informational value of one ad for Cheer to pure consumption effect 0�3222∗ 0�1842�2 Ratio of informational value of one ad for Surf to pure consumption effect 0�3704∗ 0�1556�3 Ratio of informational value of one ad for Era to pure consumption effect 0�5361∗∗ 0�1801�4 Ratio of informational value of one ad for Wisk to pure consumption effect 0�4879∗ 0�2104�5 Ratio of informational value of one ad for Tide to pure consumption effect 0�3906∗ 0�1735s1 Ratio of uncertainty in bias belief for Cheer to noise in the consumption signal 1�1041∗∗ 0�2733s2 Ratio of uncertainty in bias belief for Surf to noise in the consumption signal 1�1400∗∗ 0�3345s3 Ratio of uncertainty in bias belief for Era to noise in the consumption signal 0�9915∗∗ 0�3614s4 Ratio of uncertainty in bias belief for Wisk to noise in the consumption signal 1�0791∗∗ 0�4212s5 Ratio of uncertainty in bias belief for Tide to noise in the consumption signal 1�0299∗∗ 0�3932�1 Correlation between advertising and the consumption set for Cheer 0�1158 0�1273�2 Correlation between advertising and the consumption set for Surf 0�4965∗∗ 0�1622�3 Correlation between advertising and the consumption set for Era 0�5828∗∗ 0�1841�4 Correlation between advertising and the consumption set for Wisk 0�0906 0�1332�5 Correlation between advertising and the consumption set for Tide 0�3533∗∗ 0�1253 b1 The difference between true bias in advertising and consumer’s common belief for Cheer −0�9221∗ 0�4400 b2 The difference between true bias in advertising and consumer’s common belief for Surf 1�6819∗∗ 0�4531 b3 The difference between true bias in advertising and consumer’s common belief for Era 2�3707∗∗ 0�4660 b4 The difference between true bias in advertising and consumer’s common belief for Wisk −2�1250∗∗ 0�8246 b5 The difference between true bias in advertising and consumer’s common belief for Tide 1�1290∗∗ 0�3404� Noise in the consumption signal 2�0843∗∗ 0�3725�per �1 Persuasive effect for Cheer 0�0000 0�0141�per �2 Persuasive effect for Surf 0�0001 0�0062�per �3 Persuasive effect for Era 0�0109 0�0567�per �4 Persuasive effect for Wisk 0�0211 0�0113�per �5 Persuasive effect for Tide 0�0048∗ 0�0251��per Standard deviation of the distribution of the persuasive effect 0�0093 0�0071r Risk-aversion parameter −1�1590∗∗ 0�1391��p Mean value of the price sensitivity across the consumer population 0�6294∗∗ 0�1045��p Standard deviation of the distribution of price sensitivity 0�3357∗ 0�1822��d Mean display sensitivity 0�7042∗∗ 0�1873��d Standard deviation of the distribution of display sensitivity 0�7245∗ 0�3264��f Mean feature sensitivity 1�0856∗∗ 0�2173��f Standard deviation of the distribution of feature sensitivity 1�2677∗∗ 0�3159�0 Consumers’ initial precision of quality beliefs 1�6708∗∗ 0�1110k1 Parameter used to calibrate initial conditions 0�4791∗∗ 0�1321
−Log likelihood 1,455.7134
Notes. ∗Significant at 5% level. ∗∗Significant at 1% level.
Extent of ambiguity in consumption. We follow Hochand Ha (1986) and operationalize ambiguity in con-sumption as an increasing function of the consump-tion experience variability and a decreasing functionof the variability between the true qualities of the dif-ferent brands. Note that experience variability is justthe noise in the consumption signal, +, whose esti-mate is 2.0843. Furthermore, the variability betweenthe true qualities of the brands can be represented bythe standard deviation across the estimates of the truequalities of the five brands, i.e., stdev (q1� q2� q3� q4� q5).Therefore, we can mathematically represent consump-tion ambiguity as the ratio of the noise in consump-tion to the standard deviation of the estimates ofthe true qualities across brands. If the value of this
ratio is greater than 1, consumption ambiguity is high;if the ratio is close to zero, consumption ambigu-ity is low. Using our estimates of the true qualitiesfor the five brands, we obtain a standard deviationof 0.4499. Therefore, the consumption ambiguity is2�0843/0�4499 = 4�6329, which is significantly greaterthan 1. This implies that consumption ambiguity issignificant in the liquid detergent category, and wecan reasonably expect advertising to have a transfor-mative effect.Risk aversion. We find that consumers are signif-
icantly risk averse in this category (r = −1�1590).This is consistent with prior literature (Erdem andKeane 1996, Byzalov and Shachar 2004), which hasalso emphasized the importance of controlling for risk

Mehta, Chen, and Narasimhan: Disentangling the Multiple Effects of Advertising on Brand Choice DecisionsMarketing Science 27(3), pp. 334–355, © 2008 INFORMS 349
Table 5 Advertising Elasticity Matrix
Total advertising Informative TransformativeBrand elasticity elasticity elasticity
Cheer 0�0297 0�0297 −0�0000(0�0228�0�0366) (0�0227�0�0368) (−0�0002�0�0002)
Surf 0�0791 0�0689 0�0177(0�0677�0�0906) (0�0582�0�0795) (0�0150�0�0204)
Era 0�1151 0�0973 0�0103(0�0976�0�1325) (0�0821�0�1126) (0�0091�0�0115)
Wisk 0�0017 0�0038 −0�0022(−0�0023�0�0057) (−0�0003�0�0081) (−0�0027�−0�0017)
Tide 0�0383 0�0324 0�0059(0�0327�0�0439) (0�0274�0�0375) (0�0053�0�0064)
Note. Numbers in parenthesis represent the 95% confidence interval fromparametric bootstrapping.
aversion to obtain unbiased estimates of advertisingeffects.Total ad elasticity. Table 5 summarizes ad effects
in the form of elasticities. Note that Surf, Era, andTide do reasonably well on total advertising elastic-ity, while Cheer and Wisk do poorly. We examine theinformative and transformative components of thetotal advertising elasticity below.Informative effect of advertisements. As discussed ear-
lier, the informative effect depends on three things.First, the informational value of one ad, as capturedby 12
j , which is an inverse function of the sum of twovariances in the ad signals (the variance of the noisethat results from message clarity (&2
j ) and the vari-ance of the perceived bias of brand j �2
bj )). Note thatthe greater the value of 12
j for brand j , the greaterthe informational value of each brand j’s ad, imply-ing a higher informative effect. Second, the differenceor the gap between the mean of the advertising sig-nals (qj +2bj ) and the consumer’s prior mean qualitybelief of brand j at the beginning of the estimationsample (�e� ij ); the larger the gap, the greater the extentof change in quality evaluations after seeing the ads,leading to a greater informative effect. Third, the ratioof the variance of the perceived biases in brand j’s adto the noise in brand j’s ad (s2j = �2
bj/&2j ). The higher
the value of s2j , the lower the marginal impact of eachsuccessive ad on the quality evaluations, leading to alower informative effect. To aid comparison, we cal-culate the informative elasticities for all five brands,shown in Table 5. Furthermore, Table 6a shows eachof the components affecting the informative elasticityfor all the brands.
Focusing on the elasticities, note that the rankordering, from greatest to least informative effectsis Era, Surf, Tide, Wisk, and Cheer. This result canbe explained on the basis of the three factors dis-cussed above. The result for Era can be understoodby observing that Era has a high value of the gap
Table 6a Factors Affecting Informative Elasticity
Brand �2j s2j qj + bj −�e� ij
Cheer 0.1038 1.2191 2.5362Surf 0.1371 1.2998 4.5371Era 0.2874 0.9831 5.4140Wisk 0.2380 1.1645 0.0375Tide 0.1526 1.0608 4.1861
Table 6b Factors Affecting Transformative Elasticity
Brand �j �bj bj
Cheer 0.1158 4.5992 −0�9221Surf 0.4965 4.1677 1�6819Era 0.5828 2.8166 2�3707Wisk 0.0906 3.2429 −2�1250Tide 0.3533 3.9937 1�1290
=5�4140�, the highest value of 12j =0�2874�, and the
lowest value of s2j (=0�9831) among the five brands.Also, Cheer is the worst in informative effects becauseit has the lowest value of 12
j (=0�1038), a high valueof s2j (=1�2191), and a low value of the gap (=2�3562).Similarly, Wisk has low informative effects becauseeven though 12
j (=0�2380) is high, the gap (=0�0375)is very small and s2j (=1�1645) is high. Finally, Surfand Tide have relatively higher informative effects.Tide has high informative effects primarily becauseits s2j (=1�0608) is low, while Surf has high informa-tive effects because its gap (=4�5371) is high (perhapsbecause it is a new brand and consumers discount itsads less than they should).Transformative effect of advertisements. The transfor-
mative effect goes up as (a) .j , the closeness withwhich the ad is associated with the consumption eval-uation goes up, (b) �2
bj , the perceived variance ofthe biases in the ad signals goes up, and (c) 2bj ,the magnitude of the residual bias in the ad-basedexpectations goes up. Given the number of factors inplay, it is easiest to compare transformative effects bycomputing the transformative elasticities, shown inTable 5. Observe that Surf is the highest, followed byEra and Tide. Wisk and Cheer have extremely smalltransformative elasticities. To gain further insight intoeach of the factors affecting the transformative elas-ticity, Table 6b gives values for each of three elements(.j , �2
bj , 2bj ) for each of the brands.We can see why Surf has the highest transforma-
tive elasticity—its .j , �bj , and 2bj are all high. Era andTide have reasonable .j and high 2bj , but their trans-formative effects are not as high as Surf because their�bj is lower (which could be because they are well-established brands). Finally, Cheer and Wisk have lowtransformation in spite of having a high �bj , becausetheir .j and 2bj are both low.

Mehta, Chen, and Narasimhan: Disentangling the Multiple Effects of Advertising on Brand Choice Decisions350 Marketing Science 27(3), pp. 334–355, © 2008 INFORMS
Persuasive effect of advertisements. Most of the per-suasive effects (�per ) are insignificant. The only signif-icant effect is that for Wisk. We conjecture that Wiskmight be forced to rely on persuasive effects becauseit has low informative and transformative elastici-ties. We should note that Ackerberg (2001, 2003), whomodeled persuasive effects in the yogurt category,in a manner similar to ours, also found insignificanteffects. While some prior papers have found signifi-cant persuasive effects, it is important to observe twothings. First, as discussed earlier, modeling the per-suasive effect through a direct term in the utility cap-tures advertising effects that have not been modeledstructurally. It is not clear that these effects constitutewhat the behavioral literature has called “persuasiveeffects.” Second, Byzalov and Shachar (2004) showthat significant persuasive effects could be a result ofspecification error, namely, the omission of consumerrisk aversion. Because we model both informativeand transformative effects structurally, and accountfor risk aversion, our result on persuasive effects isnot surprising.
3.3.2. Further Analysis of the Results.1. Decomposing advertising effects. Temporal Pattern.
To examine the impact of advertising effects overtime, we conduct the following analysis. Control-ling for marketing mix effects, we plot the adver-tising elasticities for Era over the sample period.We pick Era as a useful brand to focus on becauseit has reasonable values of both informative andtransformative effects. To isolate the effects, we con-trol for variations in consumer purchase patterns andmarketing mix effects. To do this, we fix the price,feature, display, and ad intensity for each brand toits average level, and assume each consumer pur-chases once every four weeks. The curves for the totaladvertising elasticity as well as the three individualeffects are shown in Figure 2a. As expected, infor-mative elasticities are much larger than either trans-formative or persuasive elasticities. Persuasive effectsseem to show no obvious pattern and are fairly lowthroughout. To see differences in patterns for infor-mative and transformative effects more clearly, weplot two more figures—again for Era. First, we plotthe informative and transformative elasticities as afraction of the total advertising elasticity over time(Figure 2b). Second, we plot the ratio of transforma-tive to informative elasticities over time (Figure 2c).All three figures tell a consistent story, i.e., informa-tive effects are important early on, while transforma-tive elasticities start very low and increase over time.
To understand these patterns, note that for informa-tive effects, the temporal pattern comes from learning.As the consumer learns through ads or through con-sumption, her uncertainty decreases and the marginal
Figure 2a Advertising Elasticities Over Time (Era)
0
0.02
0.04
0.06
0.08
0.10
0.12
0.14
0.16
0.18
0 2 4 6 8 10 12 14Month
Adv
erti
sing
ela
stic
ity
e_total e_inf e_tran e_per
Notes. e_total: Total advertising elasticity; e_inf: Informative advertisingelasticity; e_tran: Transformative advertising elasticity; e_per: Persuasiveadvertising elasticity.
Figure 2b Informative/Transformative Elasticities as Proportions ofTotal Advertising Elasticities Over Time (Era)
Month
0
0.2
0.4
0.6
0.8
1.0
1.2
0 2 4 6 8 10 12 14
Pro
port
ion
Inf/TotalTran/Total
Notes. Inf/Total: Informative elasticity/Total advertising elasticity;Tran/Total: Transformative elasticity/Total advertising elasticity.
Figure 2c Ratio of Transformative to Informative Advertising ElasticityOver Time (Era)
Month0 2 4 6
0
0.02
0.04
0.06
0.08
0.10
0.12
0.14
0.16
0.18
0.20
8 10 12 14
Rat
io
impact of the informative effect of ads on brand util-ities decreases. This is exactly what happens for thetransformative effect also. However, there is a coun-tervailing force in the latter case. As the consumer

Mehta, Chen, and Narasimhan: Disentangling the Multiple Effects of Advertising on Brand Choice DecisionsMarketing Science 27(3), pp. 334–355, © 2008 INFORMS 351
progresses over her purchase history, the numberof cumulative ads she sees for a given brand alsoincreases, leading to an increase in the transformativeimpact of ads on consumption. Thus the total inter-temporal change in the transformative elasticitiesdepends on the relative strength of these two forces.Note that in Figures 2a–2c, the transformative elastic-ities increase over time, which implies that the latterfactor (the number of cumulative ads seen) outweighsthe former (the extent of uncertainty about qualityevaluations).
3.3.3. Policy Experiments.1. Impact of advertising intensity on advertising effects.
In this experiment, we change ad intensity for eachbrand, defined as the average number of ads seenper household per week, and we examine how thisaffects the impact of informative and transformativeeffects on the market share for each brand. We wouldexpect advertising effects to increase with increase inad intensity. We perform the experiment by varyingad intensity from 0.1 to 0.7 (the average ad intensityin the data for Era is 0.5). To isolate the effect of adintensity, we control for variations in consumer pur-chase patterns and marketing mix effects. To do this,we fix the price, feature, and display for each brandto its average level and assume that each consumerpurchases once every four weeks. Instead of plot-ting multiple curves at each ad intensity level, we dothe following. We first calculate the overall differencein market share at an ad intensity of 0.7 versus 0.1.Figure 3a shows that the market share is greater withthe higher ad intensity, as one would expect. We thendivide the market share difference calculated above,at each time, into three components, representingthe market share change because of the informative,transformative, and persuasive effects, respectively.We divide each of these components by the total mar-ket share change, to normalize. Figure 3b plots theseratios for Era. The pattern buttresses our earlier find-ings about the temporal pattern of these effects. Theinitial sharp change in market share is almost entirelybecause of the informative effect. This attenuates overtime, with the transformative effect taking over. Thepersuasive effect, by contrast, remains fairly constantin its impact on market share.
2. Impact of advertising effects on competitive clout andvulnerability. Viewing advertising effects in terms ofcurrent users and nonusers, one can say that infor-mative effects are most useful in influencing currentnonusers of the product (a group that mainly con-sists of those that have little experience with thebrand), while transformative effects have their max-imum impact on current users. Because this is thecase, enhancing informative effects should help a
Figure 3a Impact of Ad Intensity on Market Share
0.235
0.240
0.245
0.250
0.255
0.260
0.265
0.270
Mar
ket
shar
e
s0s1
0 10 20 30 40 50 60
Week
Notes. s0: Market share when ad intensity= 0�1; s1: Market share when adintensity= 0�7.
Figure 3b Impact of Ad Intensity: Informative, Transformative, andPersuasive Advertising Effects as Proportions of TotalMarket Share Change Over Time
0.0
0.2
0.4
0.6
0.8
1.0
1.2
0 10 20 30 40 50 60
Week
Pro
port
ion
Per/TotalInf/TotalTran/Total
Notes. Per/Total: Proportion of market share change because of persuasiveeffect; Inf/Total: Proportion of market share change because of informativeeffect; Tran/Total: Proportion of market share change because of transfor-mative effect.
brand attract a greater number of current nonusers—it should have less impact on current users. Con-versely, enhancing transformative effects should helpa brand keep a greater number of users who might betempted to switch brands otherwise—it should haveless impact on current nonusers. This maps on in anobvious manner to the concepts of clout and vul-nerability, that we now turn to.11 The price elasticitymatrix for all the brands, as well their clout and vul-nerability, is shown in Table 7.
11 Competitive clout is defined as the share of customers that a brandwould attract from the competing brands if it engages in a pricecut. Clout for brand j is given as
∑k �=j E
2kj , where Ekj is the per-
centage change in the market share of brand k when there is a 1%decrease in the price of brand j (Kamakura and Russell 1989). Vul-nerability is defined as the fractional share brand would lose to thecompeting brands if they were to offer a price discount. For brandj it is defined as
∑k �=j E
2jk, where Ejk is the percentage change in the
market share of brand j when there is a 1% decrease in the priceof brand k (Kamakura and Russell 1989).

Mehta, Chen, and Narasimhan: Disentangling the Multiple Effects of Advertising on Brand Choice Decisions352 Marketing Science 27(3), pp. 334–355, © 2008 INFORMS
Table 7 Price Elasticities, Clout, and Vulnerability (Era)
Price elasticity
Brand Cheer Surf Era Wisk Tide
Cheer −1�9338 0�1669 0�1132 0�1233 0�1446(−2�7106�−1�157� (−0�0309�0�3647) (0�0018�0�2245) (−0�0156�0�2623) (−0�0585�0�3478)
Surf 0�3095 −1�7541 0�2384 0�2406 0�2551(0�1150�0�5040) (−2�4041�−1�1040) (0�1375�0�3393) (0�1208�0�3604) (0�0149�0�4953)
Era 0�4828 0�5447 −1�2141 0�3847 0�3207(0�3188�0�6469) (0�3911�0�6982) (−1�6726�−0�7555) (0�2781�0�4913) (0�0548�0�5865)
Wisk 0�4901 0�5241 0�3677 −1�1094 0�3762(0�3046�0�6757) (0�3562�0�6921) (0�2676�0�4677) (−1�5582�−0�6606) (0�0917�0�6607)
Tide 0�7329 0�7035 0�3889 0�4725 −1�2066(0�5819�0�8839) (0�5546�0�8524) (0�3085�0�4695) (0�3743�0�5707) (−1�4542�−0�9591)
Clout 0�0768 0�2756 0�7807 0�7917 1�4067(0�0572�0�0964) (0�1158�0�4355) (0�5575�1�0039) (0�3779�1�2055) (1�0949�1�7184)
Vulnerability 1�1064 1�0942 0�3561 0�4444 0�3304(0�8381�1�3746) (0�8233�1�3652) (0�2680�0�4443) (0�3141�0�5747) (0�1379�0�5230)
Notes. (a) Ejk is the percentage change in the market share of brand j when there is a 1% decrease in the price of brand k; (b) Cloutj =∑
k �=j E2kj and
Vulnerabilityj =∑
k �=j E2jk ; (c) Numbers in parenthesis represent the 95% confidence interval from parametric bootstrapping.
Informative effects. Consider a brand (subsequentlyreferred to as the focal brand) whose true quality isgreater than the quality beliefs of its current non-users. If such a brand engages in a price cut, it willattract some current nonusers (i.e., consumers whowere purchasing the competing brands). If the focalbrand enhances the informative effects of its adver-tising, it can increase consumers’ perceived qualityevaluations. In such a case, if the brand engages ina price cut, it will be able to attract a much largerfraction of its nonusers. This implies that an increasein informative effects serves to increase the compet-itive clout for such a brand. Next, if a competingbrand were to offer a price discount, it would attractsome of the current users of the focal brand. Becauseinformative effects have relatively little impact on thequality evaluations of current users, enhancing theseeffects will not help the focal brand prevent the lossof its customers because of a competitor’s price cut.In other words, increasing informative effects wouldonly have a marginal impact on the focal brand’s vul-nerability. In summary, if a brand’s true quality ishigher than the perceived quality evaluations of itsnonusers, enhancing informative effects would primarilyserve to increase the brand’s competitive clout, but will notsignificantly impact its vulnerability.
To see if this conjecture holds, we run the follow-ing experiment. We vary the informative effect forEra by varying 1 (recall that 12
j = +2/&2j + �2
bj ) is theratio of the informational value of one ad to the infor-mational value of one consumption experience), from20% of its estimated value to 180% of its estimatedvalue. Next, we compute Era’s competitive clout andvulnerability. Figure 4a shows the change in cloutand vulnerability as the magnitude of the informative
Figure 4a Impact of Changing Informative Effect on Clout andVulnerability
0
0.2
0.4
0.6
0.8
1.0
1.2
1.4
1.6
1.8VulnerabilityClout
0 0.5 1.0 1.5 2.0Percentage of current informative effect
Figure 4b Impact of Changing Transformative Effect on Clout andVulnerability
0
0.2
0.1
0.4
0.3
0.5
0.6
0.9
0.8
0.7
0 0.5 1.0 1.5 2.0Percentage of current transformative effect

Mehta, Chen, and Narasimhan: Disentangling the Multiple Effects of Advertising on Brand Choice DecisionsMarketing Science 27(3), pp. 334–355, © 2008 INFORMS 353
effect increases. The conjecture seems clearly borneout—increasing informative effects primarily servesto increase the brand’s competitive clout but doesnot substantially change its vulnerability. The man-agerial implication of this is clear: for a brand witha sufficiently loyal base of consumers, such that los-ing customers to competing brands is a smaller issuethan attracting new customers, enhancing informativeeffects is very useful. On the other hand, emphasizinginformative effects will be of little value for brandswith a customer base prone to switching.Transformative effects. Transformative effects acquire
relevance only when accompanied by consumption;clearly, they have no impact on consumers who havenever used the focal brand. This suggests that empha-sizing transformative effects is not an effective acqui-sition strategy; in other words, increasing this effectshould have little impact on the clout of the focalbrand. On the other hand, if the competing brandsengage in a price cut, they will attract the currentusers of the focal brand. Because the focal brand canincrease the perceived quality evaluations of its cur-rent users by engaging in high transformative effects,increasing transformative effects would make thebrand less vulnerable. In summary, increasing transfor-mative effects would primarily serve to decrease the brand’svulnerability but will not significantly impact its competi-tive clout.
To see if this conjecture holds, we run the followingexperiment. We vary the transformative effect for Era,by varying .j (the tightness of the connection betweenads and the consumption experience) from 20% of itsestimated value to 180% of its estimated value. Fol-lowing that, we compute Era’s competitive clout andvulnerability. Figure 4b shows the change in clout andvulnerability as the magnitude of the transformativeeffect increases. Observe that vulnerability is affectedmore than clout. The managerial implication of thisis clear: for a brand with a relatively weak base ofloyal consumers, such that losing customers to com-peting brands is a bigger issue than attracting newcustomers, enhancing transformative effects is veryuseful.
3. Impact of Consumption Ambiguity on AdvertisingEffects. Our model suggests that greater levels of con-sumption ambiguity would lead to greater advertis-ing effects, consistent with prior behavioral literature.This is reasonable—the smaller the role of consump-tion in reducing uncertainty about quality evalua-tions, the greater the role of other signals, such asadvertising. To see this, we perform an exercise simi-lar to Hoch and Ha (1986), who considered transfor-mative effects for two categories with varying levelsof ambiguity—paper towels and polo shirts. Theyfound that the transformative effect was higher forthe category with a higher level of ambiguity; namely,
Figure 5 Impact of Consumption Ambiguity on Informative/Transformative Advertising Elasticities (Era)
0
0.05
0.10
0.15
0.20
0.25
0 0.5 1.0 1.5 2.0
Percentage of current consumption ambiguity
Adv
erti
sing
ela
stic
ity
e_infe_tran
Notes. e_inf: Informative advertising elasticity; e_tran: transformative adver-tising elasticity.
polo shirts. In a similar fashion, we plot informa-tive and transformative elasticities versus consump-tion ambiguity by varying the latter from 20% to 180%of its estimated value in our sample. Figure 5 showsthe plot for Era. As expected, increasing consumptionambiguity has a positive impact on both informativeand transformative effects.
4. ConclusionsIn this paper, we propose a formal model of con-sumer behavior that explicitly details the processesthrough which the informative and transformativeeffects of advertisements impact a consumer’s brandevaluations and subsequent brand choice decisions. Inaddition, we also account for persuasive effects. Ourmodel hews closely to prior behavioral research thathas discussed the transformative effect and the con-firmatory bias at the heart of the effect. In our empir-ical analysis, we find significant effects of advertisingalong both informative and transformative dimen-sions. We perform policy experiments to uncover thetemporal variation in informative and transformativeeffects across time. We find that informative effectspredominate early on in the learning period but thentaper off. Transformative effects follow exactly theopposite pattern.
Our study suffers from some limitations, whichcould be avenues for future research. First, we havenot modeled the decay of advertising effects explic-itly. One way to incorporate advertising decay in ourstructural framework would be to model evaluationsas being recalled imperfectly because of forgetting.While an interesting extension, this would complicatethe model significantly. Furthermore, as suggested byMehta et al. (2004), the impact of advertising would

Mehta, Chen, and Narasimhan: Disentangling the Multiple Effects of Advertising on Brand Choice Decisions354 Marketing Science 27(3), pp. 334–355, © 2008 INFORMS
only be enhanced if we were to incorporate the for-getting of advertisements in our model. Second, wehave modeled confirmatory bias in a semi-structuralway by allowing an exogenous correlation betweenad-based expectations and the subsequent consump-tion signal. A completely structural approach wouldbe to formally model the hypothesis testing behav-ior of the consumer. To do so, we would need tomodel the fact that the consumer forms a hypothe-sis that the ad-based expectation is the true qualityand tests this hypothesis using the subsequent con-sumption signal as a datum. As a result of this exer-cise, the transformed consumption signal would be aconvex combination of the true consumption signaland the ad-based expectations. Thus the biases in thead-based expectations would flow to the transformedconsumption signal, endogenously creating correla-tions between the consumption signal and the ad-based expectations. Modeling this is likely to involvesignificant complications (Boulding et al. 1999, theonly other paper that has modeled confirmatory bias,also does so in a semi-structural manner).
Third, bounded rationality enters our model onlyas it relates to the impact of ads, i.e., consumers areunaware that their consumption evaluations are beingtransformed by ads. Future research could considerother elements of bounded rationality, e.g., biasessuch as the “base rate fallacy” that lead consumers toupdate in a fashion that deviates from the Bayesianrule (Bar-Hillel 1980). Fourth, we do not have infor-mation on the content of advertising in our data. Ifone had access to such data, one could correlate spe-cific features of ads to the magnitude of the infor-mative and transformative effects. Fifth, while ourdata are on purchase, the model is formulated aroundconsumption. If consumers consume at a time verydifferent from the purchase time, that could impactour results. It would certainly be useful to modelconsumption decisions explicitly (Erdem et al. 2006,Sun et al. 2003, Sun 2005). Finally, while we haveexamined the impact of changing informative andtransformative effects, it would be useful to considerhow the differential roles played by such advertisingcould lead to better targeting of advertising (Iyer et al.2005). In a similar vein, it would be useful to supple-ment our analysis by considering the profitability ofenhancing one or more of advertising’s effects (Sriramet al. 2006), or examining competitive strategy morefinely along various dimensions of advertising effects(Steenkamp et al. 2005).
AcknowledgmentsThe authors thank S. Siddarth for the data used inthis paper. The authors also thank Rajesh Chandy, JohnDeighton, Jane Ebert, Steve Hoch, George John, AndyMitchell, Jaideep Prabhu, Akshay Rao, Dilip Soman, and
seminar participants at the University of California atBerkeley, the University of Minnesota, and Washington Uni-versity, St. Louis for helpful comments. This research wasfunded by a Petro-Canada research grant to the first author,a dissertation fellowship to the second author, and a McK-night Summer Research Grant to the third author. Theauthors are listed in random order and contributed equallyto the research.
ReferencesAaker, D., D. Norris. 1982. Characteristics of TV commercials per-
ceived as informative. J. Advertising Res. 22 61–70.Aaker, D., D. Stayman. 1990. Measuring audience perceptions of
commercials and relating them to ad impact. J. Advertising Res.30(Aug/Sep) 7–17.
Aaker, D. A., R. Batra, J. G. Myers. 1992. Advertising Management,4th ed. Prentice-Hall, Inc., Englewood Cliffs, NJ.
Ackerberg, D. 2001. Empirically distinguishing informative andprestige effects of advertising. Rand J. Econom. 32 100–118.
Ackerberg, D. 2003. Advertising, learning, and consumer choice inexperience goods markets: An empirical examination. Internat.Econom. Rev. 44(3) 1007–1040.
Bar-Hillel, M. 1980. The base-rate fallacy in probability judgements.Acta Psych. 44 211–233.
Batra, R., M. Ray. 1986. Affective responses mediating responses toadvertising. J. Consumer Res. 13(September) 234–249.
Becker, G., K. Murphy. 1993. A simple theory of advertising as agood or bad. Quart. J. Econom. (November) 941–964.
Boulding, W., A. Kalra, R. Staeling. 1999. The quality doublewhammy. Marketing Sci. 18(4) 463–484.
Bucklin, L. P. 1965. The informative roles of advertising. J. Adver-tising Res. (January) 35–53.
Byzalov, D., R. Shachar. 2004. The risk reduction role of advertising.Quant. Marketing Econom. 2 283–320.
Ching, A. T. 2003. Consumer learning and heterogeneity: Dynam-ics of demand for prescription drugs after patent expiration.Working paper, Ohio State University, Columbus.
Deighton, J. 1984. The interaction of advertising and evidence.J. Consumer Res. 11(December) 763–770.
Deighton, J. 1988. Two meanings of transformation. Advances inConsumer Research, Vol. 15, 262–264.
Deighton, J., C. Henderson, S. A. Neslin. 1994. The effects of adver-tising on brand switching and repeat purchases. J. MarketingRes. 31(February) 28–43.
Erdem, T., M. P. Keane. 1996. Decision-making under uncertainty:Capturing dynamic brand choice process in turbulent con-sumer goods market. Marketing Sci. 15(1) 1–20.
Erdem, T., M. Keane, B. Sun. 2006. A dynamic model of brandchoice when price and advertising signal product quality.Working paper, University of California at Berkeley.
Fischoff, B., R. Beyth-Marom. 1983. Hypothesis evaluation from aBayesian perspective. Psych. Rev. 90(3) 239–260.
Fishbein, M., I. Ajzen. 1975. Belief Attitudes, Intention and Behav-ior: An Introduction to Theory and Research. Addison-Wesley,Reading, MA.
Gilovich, T. 1981. Seeing the past in the present: The effect of asso-ciation to familiar events on judgments and decisions. J. Per-sonality Soc. Psych. 4 797–808.
Greenwald, A. G. 1968. Cognitive learning, cognitive response topersuasion, and attitude change. A. G. Greenwald, T. C. Brock,T. M. Ostrom, eds. Psychological Foundations of Attitudes. Aca-demic Press, New York.
Hoch, S. J., J. Deighton. 1989. Managing what consumers learn fromexperience. J. Marketing 53(April) 1–20.

Mehta, Chen, and Narasimhan: Disentangling the Multiple Effects of Advertising on Brand Choice DecisionsMarketing Science 27(3), pp. 334–355, © 2008 INFORMS 355
Hoch, S. J., Y.-W. Ha. 1986. Consumer learning: Advertising and theambiguity of product experience. J. Consumer Res. 13(October)221–233.
Holbrook, M. B. 1978. Beyond attitude structure: Toward theinformational determinants of attitude. J. Marketing Res.15(November) 545–546.
Iyer, G., D. Soberman, J. M. Villas-Boas. 2005. The targeting ofadvertising. Marketing Sci. 24(3) 461–476.
Kamakura, W. A., G. J. Russell. 1989. A probabilistic choice modelfor market segmentation and elasticity structure. J. MarketingRes. 26(November) 379–390.
Kihlstrom, R., M. Riordan. 1984. Advertising as a signal. J. PoliticalEconom. 92(3) 427–450.
Langer, E. J. 1975. Illusion of control. J. Personality Soc. Psych. 32(2)311–328.
Lavidge, R. J., G. A. Steiner. 1961. A model for predictive mea-surements of advertising effectiveness. J. Marketing 25(October)59–62.
Lodish, L. M., M. Abraham, S. Kalmenson, J. Livelsberger,B. Lubetkin, B. Richardson, M. E. Stevens. 1995. How TVadvertising works: A meta-analysis of 389 real-world splitcable TV advertising experiments. J. Marketing Res. 32(May)125–139.
Mehta, N., S. Rajiv, K. Srinivasan. 2003. Role of forgetting inmemory-based choice decisions: A structural model. Quant.Marketing Econom. 2 107–140.
Mehta, N., S. Rajiv, K. Srinivasan. 2004. Price uncertainty and con-sumer search: A structural model of consideration set forma-tion. Marketing Sci. 22(1) 40–57.
Milgrom, P., J. Roberts. 1986. Price and advertising signals of prod-uct quality. J. Political Econom. 94(4) 796–821.
Mukherji, P., S. Dutta, S. Rajiv. 2004. A structural model of learningfor new products. Working paper, University of Minnesota.
Narayanan, S., P. Manchanda, P. Chintagunta. 2005. Temporal dif-ferences in the role of marketing communication in new prod-uct categories. J. Marketing Res. 42(3) 278–290.
Nelson, P. 1970. Information and consumer behavior. J. PoliticalEconom. 78 311–329.
Nelson, P. 1974. Advertising as information. J. Political Econom. 82729–754.
Pedrick, J. H., F. S. Zufryden. 1991. Evaluating the impact of adver-tising media plans: A model of consumer purchase dynamicsusing single-source data. Marketing Sci. 10(2) 111–130.
Petty, R., J. Caciopo, D. Schumann. 1983. Central and peripheralroutes to advertising effectiveness: The moderating role ofinvolvement. J. Consumer Res. 10 135–146.
Slovic, P., B. Fischoff, S. Lichtenstein. 1977. Behavioral decision the-ory. Annual Rev. Psych. 28 1–39.
Snyder, M., W. B. Swann. 1978. Hypothesis-testing processes insocial interaction. J. Res. Personality 10 183–194.
Sriram, S., P. K. Chintagunta, R. Neelamegham. 2006. Effects ofbrand preference, product attributes, and marketing mix vari-ables in technology product markets. Marketing Sci. 25(5).
Steenkamp, J.-B. E., V. R. Nijs, D. M. Hanssens, M. G. Dekimpe.2005. Competitive reactions to advertising and promotionattacks. Marketing Sci. 24(1) 35–54.
Sun, B. 2005. Promotion effect on endogenous consumption.Marketing Sci. 430–443.
Sun, B., S. Neslin, K. Srinivasan. 2003. Measuring the impact of pro-motions on brand switching under rational consumer behavior.J. Marketing Res. 40 389–405.
Tellis, G. J. 1988. Advertising exposure, loyalty and brand purchase:A two-stage model of choice. J. Marketing Res. 25(May) 134–144.
Vakratsas, D., T. Ambler. 1999. How advertising works: What dowe really know. J. Marketing 63(1) 26–43.
Zajonc, R., H. Markus. 1980. Affective and cognitive factors in pref-erences. J. Consumer Res. 9 123–131.