inferring social activities with mobile sensor...
TRANSCRIPT

Inferring social activities with mobile sensor networks
Trinh Minh Tri DoIdiap Research Institute
Kyriaki KalimeriFondazione Bruno Kessler
(FBK-irst)[email protected]
Bruno LepriFondazione Bruno Kessler
(FBK-irst)[email protected]
Fabio PianesiFondazione Bruno Kessler
(FBK-irst)[email protected]
Daniel Gatica-PerezIdiap Research Institute
EPF Lausanne, [email protected]
ABSTRACTWhile our daily activities usually involve interactions with oth-ers, the state-of-the-art methods on activity recognition do not ex-ploit the relationship between social interactions and human activ-ity. This paper addresses the problem of interpreting social activityfrom human-human interactions captured by mobile sensing net-works. Our first goal is to discover different social activities such aschatting with friends from human-human interaction logs and thencharacterize them by the set of people involved, time and locationof the occurring event. Our second goal is to perform automatic la-beling of the discovered activities using predefined semantic labelssuch as coffee breaks, weekly meetings, or random discussions.Our analysis was conducted on interaction networks sensed withBluetooth and infrared sensors by about fifty subjects who carriedsociometric badges over 6 weeks. We show that the proposed sys-tem reliably recognized coffee breaks with 99% accuracy, whileweekly meetings were recognized with 88% accuracy.
Categories and Subject DescriptorsH.4 [Information Systems Applications]: Miscellaneous; D.2.8[Software Engineering]: Metrics—complexity measures, perfor-mance measures
General TermsHuman Factors
Keywordsface-to-face interaction, mobile sensing, social activity
1. INTRODUCTIONMost of our daily activities involve interactions with others as
humans are social by nature. Besides the relationship between hu-man activity and location and time [24], movement and action [4],it also relates to some form of interactions such as having lunch
Permission to make digital or hard copies of all or part of this work forpersonal or classroom use is granted without fee provided that copies arenot made or distributed for profit or commercial advantage and that copiesbear this notice and the full citation on the first page. To copy otherwise, torepublish, to post on servers or to redistribute to lists, requires prior specificpermission and/or a fee.ICMI ’13 Sydney, AustraliaCopyright 20XX ACM X-XXXXX-XX-X/XX/XX ...$15.00.
with colleagues, dining with friends, traveling with family. Yet,the relationship between human activity and human-human inter-actions has not been thoroughly explored.
The challenge of relating social interaction to activity comesfrom the nature of collected interaction data. Online social, com-munication, and webpage networks are examples of large-scale in-teraction networks which have advanced the state of the art in socialnetwork analysis [2, 16, 3]. However, the analysis on these data isusually limited to static, aggregated patterns since these networksdo not correspond well to in-person interactions in daily life. In-terestingly, the introduction of people-centric sensing [6] has openthe opportunity to collect and analyze daily social interaction, withvarious sensing methods such as Bluetooth proximity or WiFi [13].
Bluetooth has been used as a platform for social interaction andcommunication among groups of users [17]. By analyzing Blue-tooth proximity network, a recently proposed instance of topic model,called GroupUs, was able to discover multiple group activities fromtimestamped social interaction links [11]. While the discovered ac-tivity topics were reported to be relatively relevant and can be in-terpreted by experts, the automatic transformation from discoveredactivity topics to general semantic meanings (e.g., meeting, chat-ting, eating) is still missing.
This work was inspired from the above seminal work and ourfirst goal is to generalize the idea to the case of multimodal interac-tion data. Specifically, our study was conducted on data collectedwith Bluetooth (BT) and infrared sensors (IR), where interactionlinks were localized by their proximity to fixed stations. Our re-search questions for this goal were then closely related to typicalmultimodal research questions: (a) How to exploit multiple typesof interaction sensors, in particular BT and IR sensors?, (b) How touse location data to enhance the social interaction patterns?, and (c)How well does the method perform on this multimodal dataset?.
The second goal of this paper was to build a fully automatic sys-tem which senses social interactions, discovers emerging activitytopics, then labels the discovered activity topics with a set of pre-defined activity labels. We believe that such a system has poten-tial applications in several fields such as context-aware applications(e.g., change ringtone when the user enters a meeting) or individ-ual and social behavior analysis (e.g., the dependency between so-cial activity and mood). To achieve this, we proposed a supervisedlearning framework where activity topics were represented as fea-ture vectors and random forest was used to learn and predict if agiven activity topic corresponded to a specific activity label.
This paper makes three major contributions. First, we extendedan existing algorithm to handle spatio-temporal context of interac-tions and allowed the model to work with both BT and IR data.Second, we introduced an automatic labeling method for the set
of discovered activity topics. This component allows us to havea fully automatic framework for sensing and interpreting human-human interaction. Finally, our paper presents a case study of socialinteractions in a real organization, in which we provided detailedanalysis on sensing quality and how well actual activities could berecognized.
The rest of the paper is organized as follows. Section 2 discussesrelated work in the context of human activity and social interactionanalysis. Section 3 presents the corpus on which our analysis wereconducted. Then, the proposed extension of GroupUs algorithm ispresented in Section 4. Section 5 presents our findings on manualinterpretation and automatic labeling of discovered activity topics.Finally, Section 6 provides concluding remarks.
2. RELATED WORKResearch on human activity has been focused on individual ac-
tivity inferred from a variety of data types such as video and audio,accelerometer, and indoor location [25, 8, 19]. While the numberof sensors for capturing individual activity keeps increasing overtime, another direction is to exploit social media for studying hu-man activity. For example, Noulas et al. collected check-in datafrom Foursquare, a location-based social network which connectsonline social networks with physical world, and show that humanactivity varies withIn the course of a day and of a week [21]. Us-ing data from Twitter, Golder and Macy revealed the dependenciesbetween mood and physical/social activities [14].
Our study on the relationship between human activity and so-cial interactions was inspired from an emerging body of work thatis investigating the possibilities of analyzing human and social be-havior using mobile sensors. At present, Bluetooth and Wi-Fi net-works allow the collection of data on specific structural and tempo-ral aspects of social interaction, offering ways to approximate so-cial interaction as spatial proximity or as the co-location of wear-able devices, e.g., by means of Bluetooth hits [20, 1, 12]. Thesemeans, however, do not always yield good proxies to the social in-teractions occurring between the individuals carrying the devices.Mobile phone traces suffer the same problem: they can be usedto model human mobility [15] with the great advantage of eas-ily scaling up to millions of individuals; they too, however, offeronly rough approximations to social interaction in terms of spatialco-location. Cattuto et al. [7] proposed a framework for monitor-ing social interactions that reconciles scalability and resolution bymeans of a sensing tier consisting of inexpensive and unobtrusiveactive RFID devices. The devices are capable of sensing face-to-face interactions of individuals as well as spatial proximity overdifferent length scales down to one meter or less. Another strategyfor behavioral data collection is to resort to image and video pro-cessing based on cameras placed in the environment [9]. This ap-proach provides very rich datasets that are, in turn, computationallyvery complex: they require line-of-sight access to the monitoredspaces and people, specific effort for equipping the relevant phys-ical spaces and can hardly cope with large scales of data. By us-ing sociometric badges, some previous studies revealed importantinsights into organizational processes, such as the impact of elec-tronic communications on the business performance of teams [23]or the relationship between several behavioral features captured bysociometric badges, employee self-perceptions (from surveys) andproductivity [22].
Finally, unsupervised learning approach has been used for hu-man activity discovery in the past, both for individual activities andsocial activities. Vahdatpour et al. [26] find recurrent patterns frommultidimensional time-series given by multiple wearable sensors.In a few recent papers, we proposed several topic models for captur-
ing group interaction patterns from Bluetooth proximity networks[10, 11]. While these previous studies focus on activity discovery,this paper also considers the automatic labeling task for the discov-ered activities.
3. SOCIOMETRIC BADGES CORPUSThe aim of our study is to investigate the behavioral patterns
within organizational environments. The SocioMetric Badges Cor-pus [18], which is exploited in this work, is a multimodal corpuswhich has been collected in a research institute for over a six weekconsecutive period, involving a population of 54 subjects (46 sub-jects that belong to four computer science research groups and 7subjects of the IT department), during their working hours. TheSociometric Badge sensors were employed for this study; thesesensors are equipped with accelerometers, microphones, bluetoothand infrared sensors which capture: the body movements, prosodicspeech features, collocation and face-to-face interactions respec-tively [23]. For the purposes of our study we have exploited thedata provided from the Infrared and Bluetooth sensors.
3.1 Data collectionOrganizational Information. The subjects involved in the study
take part in two distinct categories of employees; the administrativegroup and the research units. The population of the study consistedof 54 subjects, males=90.8%, females=9.2% with a mean of 36.83years of age and standard deviation of 8.61 years. Due to technicalissues, the Bluetooth data was missing for 5 subjects. This study isthen conducted on the data of 49 subjects.
Bluetooth Data. Bluetooth detections can be used as a coarseindicator of proximity between devices. Radio signal strength in-dicator (RSSI) is a measure of the signal strength between trans-mitting and receiving devices. The range of RSSI values for the ra-dio transceiver in the badge is (-128, 127). All sociometric badgesbroadcast their ID every five seconds using a 2.4 GHz transceiver(TRradio = 12 transmissions per minute). Figure 1(a) shows theBluetooth proximity network where nodes correspond to subjects(colored by office number) and the strengths of ties correspondto the number of Bluetooth hits. The sensed network is relativelydense and highly affected by the locations of subjects’ office. Thisfinding is not surprising given that the physical range of Bluetoothis around 10 meters (Class 2), meaning that a large proportion ofBT hits do not correspond to an actual face-to-face interaction.
Infrared data. Infrared transmissions are used to detect face-to-face interactions between people. In order for a badge to be de-tected through an IR sensor, two individuals must have a direct lineof sight and the receiving badge’s IR must be within the transmit-ting badge’s IR signal cone of height h ≤ 1 meter and a radius ofr ≤ htanθ, where θ = ±15o degrees. The infrared transmissionrate (TRir) was set to 1Hz. The accumulated IR network is visual-ized in Figure 1(c) in the same way as the one for the BT network.Since IR hits corresponds well to face-to-face interactions, the IRnetwork is less influenced by desk locations. Its structure is thenmore complex than the BT networks.
Localizing interaction data. Seventeen BT devices were usedas fixed stations at key locations in order to infer the location ofsubjects and their interactions. These points were the restaurant,the cafeteria and the coffee machines as well the meeting and sem-inar rooms at the hosting organization. The BT devices used forlocalization have been grouped in four broader categories meetingrooms, admin meeting room, restaurant, and cafeteria. For eachBT or IR hit (interaction hit), we find the nearest BT hit between

501
502
503504
505
506
507
508
509
510512
513514
516
517
518
519
520
521
522
523
524
525
526
527
528
529
530
531
532
533534
535
536
537
539
540
541
542
543544
545
546
547
548
549
550
552
555
(a) Raw Bluetooth hits
501
502
503
504
505
506
507
508
509
510
512
513
514516
517
518
519 520
521
522
523
524
525
526
527
528
529
530
531
532
533
534535
536
537
539
540
541
542543
544
545
546
547
548
549
550
552
555
(b) Strong Bluetooth hits
501
502
503
504
505
506
507
508
509
510
512
513
514
516
517
518
519
520
521
522
523
524 525
526
527
528
529
530
531
532
533
534
535
536
537
539
540
541
542
543
544545
546
547
548
549
550
552
555
(c) Infrared hits
Figure 1: In-person interaction networks captured by Bluetooth and Infrared sensors. Nodes are colored by the office numbers.
the observer and one of the fixed stations (localization hit), thenadded the found location to the interaction hit if the time differencebetween two hits is less than one minute. At the end, the locationsof BT or IR hits among subjects belong to one of the four categoriesabove or a special category called others in case where there is noBT hit to any fixed station during the interaction.
3.2 BT or IR for interaction sensing?While IR hits imply actual interaction between two people, the
strict detection conditions (of a direct line of sight and angles) meanthat the device may fail to capture actual interaction in several situ-ations such as group meeting (e.g., people sit around a big table) orwhen two interlocutors look at the same object (e.g., screen, board).In practice, we found that IR data is very sparse and its density isabout 2% of the BT data set.
As an alternative to IR, BT proximity can be used as a reliablemethod to sense face-to-face interaction with low false negativerate. When using Bluetooth proximity data, the challenge is how toreduce its high false positive detection rate which comes from itsrelatively long range compared to the face-to-face interaction.
With these discussions in mind, we chose to combine both IRand BT data, for which we only keep BT hits with strong sig-nal strength (high RSSI value). In our experiment, a RSSI valuegreater or equal than −80 is considered as strong, which is gener-ally produced when the distance of the two devices is less than 5meters (which is sufficient to detect interactions among people in ameeting room of medium size). Figure 2 shows the distributions ofRSSI values of BT hits when there is an IR hit (that is, when thereis a face-to-face interaction) and when there is not (i.e., we are notsure if there is a real interaction). For the given threshold, the plotshows that 88% of IR hits can be captured by strong BT hits, and24% of BT hits were classified as strong. The accumulated networkconstructing from strong BT hits is showed in Figure 1(b).
4. SOCIAL ACTIVITY DISCOVERY WITHTOPIC MODEL
Topic models are widely used for text analysis to find differenttopics from text corpora and to summarize documents based on theset of addressed topics. For example, latent Dirichlet allocation(LDA) takes as input a corpus of documents, represented as bagsof words, and outputs the set of discovered topics, characterizedby their most frequent words [5]. In LDA, each word is assumed
−100 −95 −90 −85 −80 −75 −70 −65 −60 −55 −500
0.1
0.2
0.3
0.4
0.5
BT signal strength
frac
tion
BT links with infraredBT links without infrared
Figure 2: BT signal strength distributions change significantlydepending on whether the face-to-face interaction is capturedby IR or not.
to be generated from a (latent) topic, and each document can besummarized by a multinomial distribution over topics.
The LDA framework can be applied to human-human interactionmining where a word is an interaction between two individuals anda document consists of interactions captured within a time inter-val, as in the GroupUs algorithm [11]. While this algorithm workson BT links with temporal context, we extend it to handle spatio-temporal links sensed with BT and IR.
Data representation. The recording period is divided into timeslice of W minutes, where W should be large enough so that face-to-face interactions can be captured reliably by at least BT or IR.Each link i contains the following attributes:- ui: the head of the link (observer)- vi: the head of the link (observed person)- di: day-of-week when the link was observed.- hi: time-of-day when the link was observed.- li: the location where the link was observed.- qi: the type of the link (BT or IR).- si: the identifier of the time slice that the link belongs to. si ∈{1..S} where S is the total number of time slices.
In the data, we had di ∈ {Mon, ..., F ri} and hi ∈ {8am..6pm}according to the data collection setting. The location variable canbe one of the five location categories described in Section 3.
Probabilistic model. Our extended GroupUs model is illus-trated in Figure 3 where shaded nodes correspond to observed vari-
u
v
dt
S Ls
θ
ϕ1
ϕ2
ϕ3
T
h
l
q
ϕ4
ϕ5
ϕ6
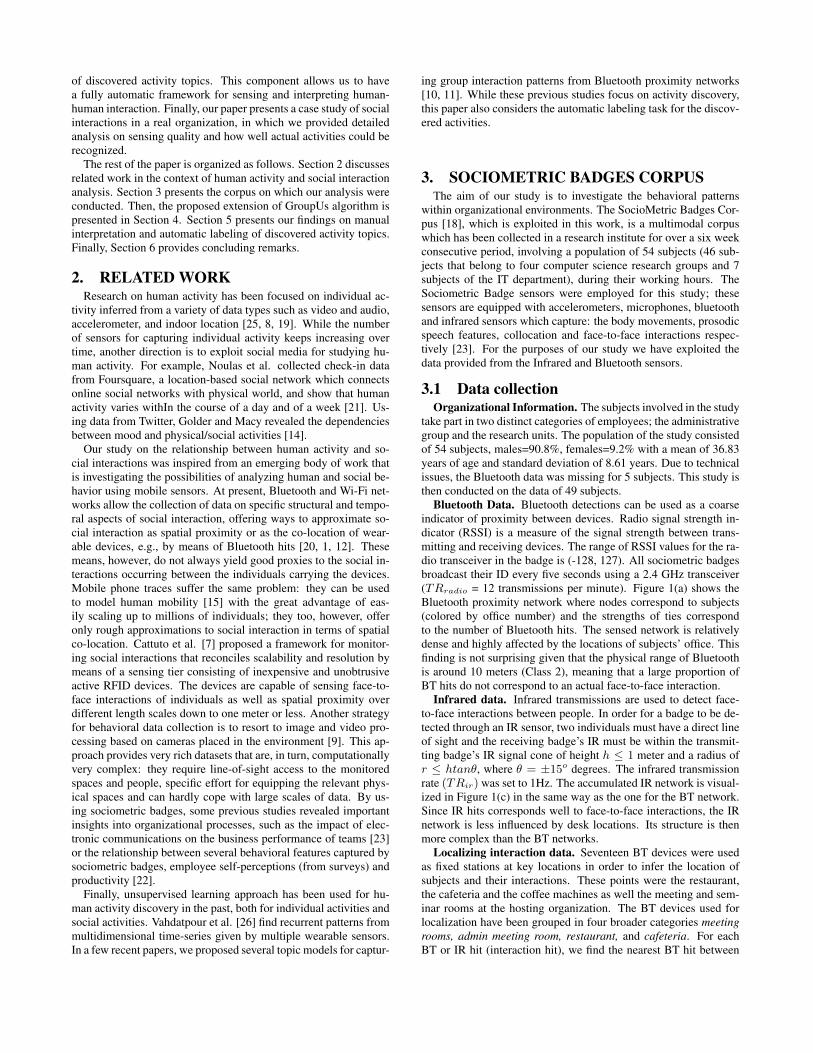
Figure 3: Graphical model of the extended GroupUs for han-dling spatio-temporal context and other additional attributes ofinteraction links.
ables, latent variables t correspond hidden activity topics of links,and θ and φ are model parameters. We use a plate representationwhere each node corresponds to a set of random variables, whosesize is given by the capital letter in the corner. S stands for the num-ber of slices, Ls stands for the number of links in slice s, and T isthe number of activity topics. Compared to GroupUs, the proposedmodel has similar structure but contains more observed variables(location l and data type q), its generative process is then similar tothe original algorithm:Initialization:
Draw distribution θs ∼ Dirichlet(α) for each slice s.Draw distribution φt ∼ Dirichlet(β) for each activity topic t.
For each link of the slice s:Draw an activity topic t|s ∼Multinomial(θs).Draw a first person u|t ∼Multinomial(φ1t).Draw a second person v|t ∼Multinomial(φ2t).Draw a day of week d|t ∼Multinomial(φ3t).Draw a time of day h|t ∼Multinomial(φ4t).Draw a location l|t ∼Multinomial(φ5t).Draw a data type q|t ∼ Binomial(φ6t).The model parameter φ is key for the interpretation of activ-
ity topics as it encodes the conditional distributions of observationgiven activity topics. φ1t and φ2t characterize who were activemembers of the group activity corresponding to activity topic t. φ3t
and φ4t reveal when the activity happened while φ5t indicate wherethe activity was usually observed. Finally, φ6t indicates which typeof link is usually observed in the activity topic t. The joint proba-bility of observed and unobserved variables can be written by:
P (u,v,d,h, l,q, s, t;α,β)=
∫θ,φ
P (u,v,d,h, l,q, s, t, θ, φ;α,β)∂θ∂φ
=∫θP (t|θ)P (θ;α)∂θ
∫φP (u,v,d,h, l,q|t, φ)P (φ;β)∂φ
(1)where the integration over model parameters θ and φ can be com-puted efficiently since we use conjugate priors all link attributes.The model can be learned by collapsed Gibb sampling which sam-ples the posterior distribution P (t|u,v,d,h, l,q α,β) and pro-vides estimates of θ and φ.
The output of extended GroupUs algorithm consists of the learnedparameters (θ and φ) and the vector of topic assignment t. Asdiscussed earlier, each activity topic t can be characterized by thecorresponding distributions over people (parameterized by φ1t andφ2t), time (φ3t and φ4t), locations (φ5t), and link types (φ6t).However, the topic assignment t is also helpful for interpreting thediscovered activity topics. Basically, this vector t assigns each linkin the dataset to a discovered activity topic, so that we know exactly
40 60 80 100 120 140 160 180 200−1.65
−1.6
−1.55
x 106
number of topics
log
lik
elih
oo
d
original topics
merged topics
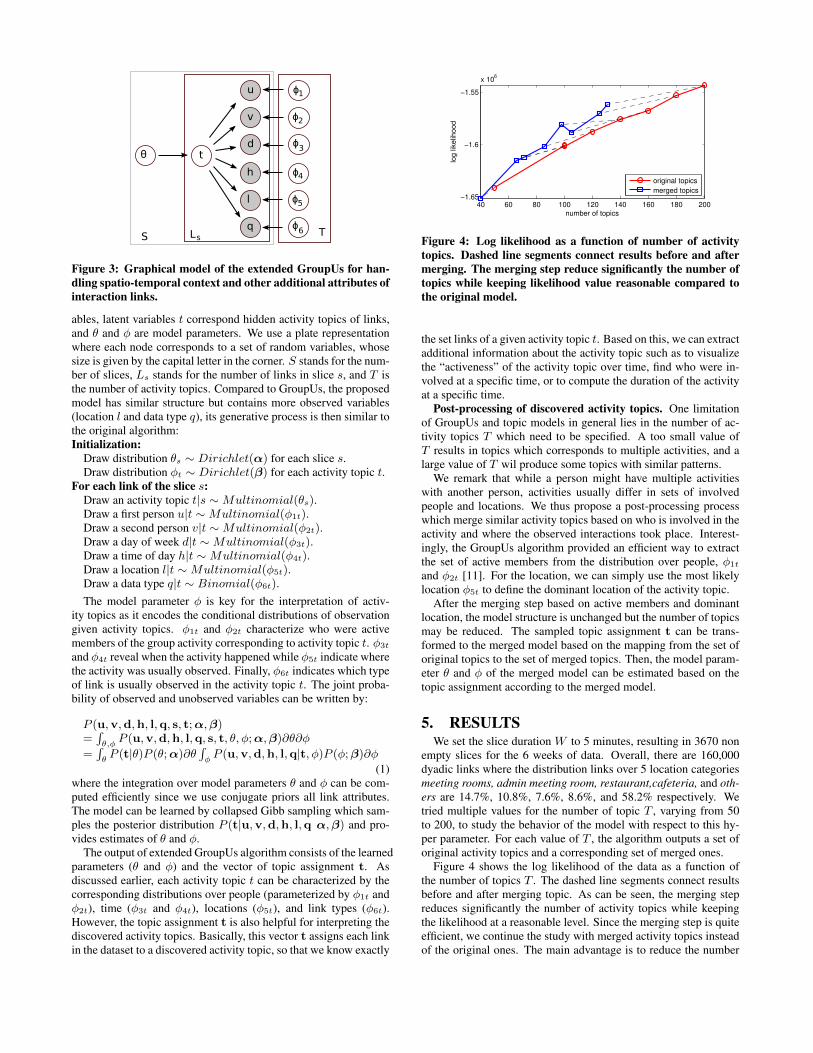
Figure 4: Log likelihood as a function of number of activitytopics. Dashed line segments connect results before and aftermerging. The merging step reduce significantly the number oftopics while keeping likelihood value reasonable compared tothe original model.
the set links of a given activity topic t. Based on this, we can extractadditional information about the activity topic such as to visualizethe “activeness” of the activity topic over time, find who were in-volved at a specific time, or to compute the duration of the activityat a specific time.
Post-processing of discovered activity topics. One limitationof GroupUs and topic models in general lies in the number of ac-tivity topics T which need to be specified. A too small value ofT results in topics which corresponds to multiple activities, and alarge value of T wil produce some topics with similar patterns.
We remark that while a person might have multiple activitieswith another person, activities usually differ in sets of involvedpeople and locations. We thus propose a post-processing processwhich merge similar activity topics based on who is involved in theactivity and where the observed interactions took place. Interest-ingly, the GroupUs algorithm provided an efficient way to extractthe set of active members from the distribution over people, φ1t
and φ2t [11]. For the location, we can simply use the most likelylocation φ5t to define the dominant location of the activity topic.
After the merging step based on active members and dominantlocation, the model structure is unchanged but the number of topicsmay be reduced. The sampled topic assignment t can be trans-formed to the merged model based on the mapping from the set oforiginal topics to the set of merged topics. Then, the model param-eter θ and φ of the merged model can be estimated based on thetopic assignment according to the merged model.
5. RESULTSWe set the slice duration W to 5 minutes, resulting in 3670 non
empty slices for the 6 weeks of data. Overall, there are 160,000dyadic links where the distribution links over 5 location categoriesmeeting rooms, admin meeting room, restaurant,cafeteria, and oth-ers are 14.7%, 10.8%, 7.6%, 8.6%, and 58.2% respectively. Wetried multiple values for the number of topic T , varying from 50to 200, to study the behavior of the model with respect to this hy-per parameter. For each value of T , the algorithm outputs a set oforiginal activity topics and a corresponding set of merged ones.
Figure 4 shows the log likelihood of the data as a function ofthe number of topics T . The dashed line segments connect resultsbefore and after merging topic. As can be seen, the merging stepreduces significantly the number of activity topics while keepingthe likelihood at a reasonable level. Since the merging step is quiteefficient, we continue the study with merged activity topics insteadof the original ones. The main advantage is to reduce the number
501502
503
504
505
506 507
508
509
510 512
513
514
516
517
518519
520
521
522
523
524
525
526
527
528
529
530
531
532
533534 535
536
537
539
540
541
542
543
544
545
546
547
548
549
550
552
(a) Network visualization
0 20 40 600
0.1
0.2
0.3
0.4
0.5
userID
mem
bers
hip
scor
e
0 0.5 1
meet
coffee
rest.
admin
others
1 8 15 22 29 360
5
10
15
#lin
ks
type=31 518,519,532,
Mo Tu We Th Fr
00:00
03:00
06:00
09:00
12:00
15:00
18:00
21:00
0 0.2 0.4
<15min
15!30min
30!60min
1!2h
>2h
duration distribution0 0.5 1
23456789
1011
#people distributionx
y
0 20 40 600
0.1
0.2
0.3
0.4
userID
mem
bers
hip
scor
e
0 0.5 1
meet
coffee
rest.
admin
others
1 8 15 22 29 360
2
4
6
8
10
12
#lin
ks
type=32 517,518,519,522,523,532,
Mo Tu We Th Fr
00:00
03:00
06:00
09:00
12:00
15:00
18:00
21:00
0 0.2 0.4
<15min
15!30min
30!60min
1!2h
>2h
duration distribution0 0.5 1
23456789
1011
#people distributionx
y
0 20 40 600
0.05
0.1
0.15
0.2
0.25
userID
mem
bers
hip
scor
e
0 0.5 1
meet
coffee
rest.
admin
others
1 8 15 22 29 360
5
10
15
20
#lin
ks
type=33 517,518,519,522,523,524,525,526,527,528,530,531,532,
Mo Tu We Th Fr
00:00
03:00
06:00
09:00
12:00
15:00
18:00
21:00
0 0.5 1
<15min
15!30min
30!60min
1!2h
>2h
duration distribution0 0.5 1
23456789
1011
#people distributionx
y
0 20 40 600
0.1
0.2
0.3
0.4
0.5
userID
mem
bers
hip
scor
e
0 0.5 1
meet
coffee
rest.
admin
others
1 8 15 22 29 360
2
4
6
8
10
12
#lin
kstype=34 516,520,
Mo Tu We Th Fr
00:00
03:00
06:00
09:00
12:00
15:00
18:00
21:00
0 0.2 0.4
<15min
15!30min
30!60min
1!2h
>2h
duration distribution0 0.5 1
23456789
1011
#people distributionx
y
0 20 40 600
0.1
0.2
0.3
0.4
0.5
userID
mem
bers
hip
scor
e
0 0.5 1
meet
coffee
rest.
admin
others
1 8 15 22 29 360
5
10
15
#lin
ks
type=35 516,519,521,527,528,
Mo Tu We Th Fr
00:00
03:00
06:00
09:00
12:00
15:00
18:00
21:00
0 0.5 1
<15min
15!30min
30!60min
1!2h
>2h
duration distribution0 0.5 1
23456789
1011
#people distributionx
y
0 20 40 600
0.1
0.2
0.3
0.4
userID
mem
bers
hip
scor
e
0 0.5 1
meet
coffee
rest.
admin
others
1 8 15 22 29 360
5
10
15
20
25
30
#lin
ks
type=36 516,519,520,522,523,
Mo Tu We Th Fr
00:00
03:00
06:00
09:00
12:00
15:00
18:00
21:00
0 0.5 1
<15min
15!30min
30!60min
1!2h
>2h
duration distribution0 0.2 0.4
23456789
1011
#people distributionx
y
0 20 40 600
0.1
0.2
0.3
0.4
userID
mem
bers
hip
scor
e
0 0.5 1
meet
coffee
rest.
admin
others
1 8 15 22 29 360
5
10
15
20
25
30
#lin
ks
type=37 516,519,520,522,523,530,532,
Mo Tu We Th Fr
00:00
03:00
06:00
09:00
12:00
15:00
18:00
21:00
0 0.5 1
<15min
15!30min
30!60min
1!2h
>2h
duration distribution0 0.2 0.4
23456789
1011
#people distributionx
y
0 20 40 600
0.1
0.2
0.3
0.4
userID
mem
bers
hip
scor
e
0 0.5 1
meet
coffee
rest.
admin
others
1 8 15 22 29 360
5
10
15
20
25
30
#lin
ks
type=38 516,519,520,522,523,527,
Mo Tu We Th Fr
00:00
03:00
06:00
09:00
12:00
15:00
18:00
21:00
0 0.2 0.4
<15min
15!30min
30!60min
1!2h
>2h
duration distribution0 0.2 0.4
23456789
1011
#people distributionx
y
0 20 40 600
0.1
0.2
0.3
0.4
userID
mem
bers
hip
scor
e
0 0.5 1
meet
coffee
rest.
admin
others
1 8 15 22 29 360
5
10
15
#lin
ks
type=39 516,518,519,520,528,532,
Mo Tu We Th Fr
00:00
03:00
06:00
09:00
12:00
15:00
18:00
21:00
0 0.2 0.4
<15min
15!30min
30!60min
1!2h
>2h
duration distribution0 0.5 1
23456789
1011
#people distributionx
y
0 20 40 600
0.05
0.1
0.15
0.2
0.25
userID
mem
bers
hip
scor
e
0 0.5 1
meet
coffee
rest.
admin
others
1 8 15 22 29 360
5
10
15
20
25
#lin
ks
type=40 516,517,520,521,523,528,529,
Mo Tu We Th Fr
00:00
03:00
06:00
09:00
12:00
15:00
18:00
21:00
0 0.2 0.4
<15min
15!30min
30!60min
1!2h
>2h
duration distribution0 0.2 0.4
23456789
1011
#people distributionx
y
(b) time and location
0 20 40 600
0.1
0.2
0.3
0.4
0.5
userID
me
mb
ers
hip
sco
re
0 0.5 1
meet
coffee
rest.
admin
others
1 8 15 22 29 360
5
10
15
#lin
ks
type=31 518,519,532,
Mo Tu We Th Fr
00:00
03:00
06:00
09:00
12:00
15:00
18:00
21:00
0 0.2 0.4
<15min
15!30min
30!60min
1!2h
>2h
duration distribution0 0.5 1
23456789
1011
#people distributionx
y
0 20 40 600
0.1
0.2
0.3
0.4
userID
me
mb
ers
hip
sco
re
0 0.5 1
meet
coffee
rest.
admin
others
1 8 15 22 29 360
2
4
6
8
10
12
#lin
ks
type=32 517,518,519,522,523,532,
Mo Tu We Th Fr
00:00
03:00
06:00
09:00
12:00
15:00
18:00
21:00
0 0.2 0.4
<15min
15!30min
30!60min
1!2h
>2h
duration distribution0 0.5 1
23456789
1011
#people distributionx
y
0 20 40 600
0.05
0.1
0.15
0.2
0.25
userID
me
mb
ers
hip
sco
re
0 0.5 1
meet
coffee
rest.
admin
others
1 8 15 22 29 360
5
10
15
20
#lin
ks
type=33 517,518,519,522,523,524,525,526,527,528,530,531,532,
Mo Tu We Th Fr
00:00
03:00
06:00
09:00
12:00
15:00
18:00
21:00
0 0.5 1
<15min
15!30min
30!60min
1!2h
>2h
duration distribution0 0.5 1
23456789
1011
#people distributionx
y0 20 40 60
0
0.1
0.2
0.3
0.4
0.5
userID
me
mb
ers
hip
sco
re
0 0.5 1
meet
coffee
rest.
admin
others
1 8 15 22 29 360
2
4
6
8
10
12
#lin
ks
type=34 516,520,
Mo Tu We Th Fr
00:00
03:00
06:00
09:00
12:00
15:00
18:00
21:00
0 0.2 0.4
<15min
15!30min
30!60min
1!2h
>2h
duration distribution0 0.5 1
23456789
1011
#people distributionx
y
0 20 40 600
0.1
0.2
0.3
0.4
0.5
userID
me
mb
ers
hip
sco
re
0 0.5 1
meet
coffee
rest.
admin
others
1 8 15 22 29 360
5
10
15
#lin
ks
type=35 516,519,521,527,528,
Mo Tu We Th Fr
00:00
03:00
06:00
09:00
12:00
15:00
18:00
21:00
0 0.5 1
<15min
15!30min
30!60min
1!2h
>2h
duration distribution0 0.5 1
23456789
1011
#people distributionx
y
0 20 40 600
0.1
0.2
0.3
0.4
userID
me
mb
ers
hip
sco
re
0 0.5 1
meet
coffee
rest.
admin
others
1 8 15 22 29 360
5
10
15
20
25
30
#lin
ks
type=36 516,519,520,522,523,
Mo Tu We Th Fr
00:00
03:00
06:00
09:00
12:00
15:00
18:00
21:00
0 0.5 1
<15min
15!30min
30!60min
1!2h
>2h
duration distribution0 0.2 0.4
23456789
1011
#people distributionx
y
0 20 40 600
0.1
0.2
0.3
0.4
userID
me
mb
ers
hip
sco
re
0 0.5 1
meet
coffee
rest.
admin
others
1 8 15 22 29 360
5
10
15
20
25
30
#lin
ks
type=37 516,519,520,522,523,530,532,
Mo Tu We Th Fr
00:00
03:00
06:00
09:00
12:00
15:00
18:00
21:00
0 0.5 1
<15min
15!30min
30!60min
1!2h
>2h
duration distribution0 0.2 0.4
23456789
1011
#people distributionx
y
0 20 40 600
0.1
0.2
0.3
0.4
userID
me
mb
ers
hip
sco
re
0 0.5 1
meet
coffee
rest.
admin
others
1 8 15 22 29 360
5
10
15
20
25
30
#lin
ks
type=38 516,519,520,522,523,527,
Mo Tu We Th Fr
00:00
03:00
06:00
09:00
12:00
15:00
18:00
21:00
0 0.2 0.4
<15min
15!30min
30!60min
1!2h
>2h
duration distribution0 0.2 0.4
23456789
1011
#people distributionx
y
0 20 40 600
0.1
0.2
0.3
0.4
userID
me
mb
ers
hip
sco
re
0 0.5 1
meet
coffee
rest.
admin
others
1 8 15 22 29 360
5
10
15
#lin
ks
type=39 516,518,519,520,528,532,
Mo Tu We Th Fr
00:00
03:00
06:00
09:00
12:00
15:00
18:00
21:00
0 0.2 0.4
<15min
15!30min
30!60min
1!2h
>2h
duration distribution0 0.5 1
23456789
1011
#people distributionx
y
0 20 40 600
0.05
0.1
0.15
0.2
0.25
userID
me
mb
ers
hip
sco
re
0 0.5 1
meet
coffee
rest.
admin
others
1 8 15 22 29 360
5
10
15
20
25
#lin
ks
type=40 516,517,520,521,523,528,529,
Mo Tu We Th Fr
00:00
03:00
06:00
09:00
12:00
15:00
18:00
21:00
0 0.2 0.4
<15min
15!30min
30!60min
1!2h
>2h
duration distribution0 0.2 0.4
23456789
1011
#people distributionx
y
(c) number of link over time (days)
0 20 40 600
0.1
0.2
0.3
0.4
0.5
userID
mem
bers
hip
scor
e
0 0.5 1
meet
coffee
rest.
admin
others
1 8 15 22 29 360
5
10
15
#lin
ks
type=31 518,519,532,
Mo Tu We Th Fr
00:00
03:00
06:00
09:00
12:00
15:00
18:00
21:00
0 0.2 0.4
<15min
15!30min
30!60min
1!2h
>2h
duration distribution0 0.5 1
23456789
1011
#people distributionx
y
0 20 40 600
0.1
0.2
0.3
0.4
userID
mem
bers
hip
scor
e
0 0.5 1
meet
coffee
rest.
admin
others
1 8 15 22 29 360
2
4
6
8
10
12
#lin
ks
type=32 517,518,519,522,523,532,
Mo Tu We Th Fr
00:00
03:00
06:00
09:00
12:00
15:00
18:00
21:00
0 0.2 0.4
<15min
15!30min
30!60min
1!2h
>2h
duration distribution0 0.5 1
23456789
1011
#people distributionx
y
0 20 40 600
0.05
0.1
0.15
0.2
0.25
userID
mem
bers
hip
scor
e
0 0.5 1
meet
coffee
rest.
admin
others
1 8 15 22 29 360
5
10
15
20
#lin
ks
type=33 517,518,519,522,523,524,525,526,527,528,530,531,532,
Mo Tu We Th Fr
00:00
03:00
06:00
09:00
12:00
15:00
18:00
21:00
0 0.5 1
<15min
15!30min
30!60min
1!2h
>2h
duration distribution0 0.5 1
23456789
1011
#people distributionx
y
0 20 40 600
0.1
0.2
0.3
0.4
0.5
userID
mem
bers
hip
scor
e
0 0.5 1
meet
coffee
rest.
admin
others
1 8 15 22 29 360
2
4
6
8
10
12
#lin
ks
type=34 516,520,
Mo Tu We Th Fr
00:00
03:00
06:00
09:00
12:00
15:00
18:00
21:00
0 0.2 0.4
<15min
15!30min
30!60min
1!2h
>2h
duration distribution0 0.5 1
23456789
1011
#people distributionx
y
0 20 40 600
0.1
0.2
0.3
0.4
0.5
userID
mem
bers
hip
scor
e
0 0.5 1
meet
coffee
rest.
admin
others
1 8 15 22 29 360
5
10
15
#lin
ks
type=35 516,519,521,527,528,
Mo Tu We Th Fr
00:00
03:00
06:00
09:00
12:00
15:00
18:00
21:00
0 0.5 1
<15min
15!30min
30!60min
1!2h
>2h
duration distribution0 0.5 1
23456789
1011
#people distributionx
y
0 20 40 600
0.1
0.2
0.3
0.4
userID
mem
bers
hip
scor
e
0 0.5 1
meet
coffee
rest.
admin
others
1 8 15 22 29 360
5
10
15
20
25
30
#lin
ks
type=36 516,519,520,522,523,
Mo Tu We Th Fr
00:00
03:00
06:00
09:00
12:00
15:00
18:00
21:00
0 0.5 1
<15min
15!30min
30!60min
1!2h
>2h
duration distribution0 0.2 0.4
23456789
1011
#people distributionx
y
0 20 40 600
0.1
0.2
0.3
0.4
userID
mem
bers
hip
scor
e
0 0.5 1
meet
coffee
rest.
admin
others
1 8 15 22 29 360
5
10
15
20
25
30
#lin
ks
type=37 516,519,520,522,523,530,532,
Mo Tu We Th Fr
00:00
03:00
06:00
09:00
12:00
15:00
18:00
21:00
0 0.5 1
<15min
15!30min
30!60min
1!2h
>2h
duration distribution0 0.2 0.4
23456789
1011
#people distributionx
y
0 20 40 600
0.1
0.2
0.3
0.4
userID
mem
bers
hip
scor
e
0 0.5 1
meet
coffee
rest.
admin
others
1 8 15 22 29 360
5
10
15
20
25
30
#lin
ks
type=38 516,519,520,522,523,527,
Mo Tu We Th Fr
00:00
03:00
06:00
09:00
12:00
15:00
18:00
21:00
0 0.2 0.4
<15min
15!30min
30!60min
1!2h
>2h
duration distribution0 0.2 0.4
23456789
1011
#people distributionx
y
0 20 40 600
0.1
0.2
0.3
0.4
userID
mem
bers
hip
scor
e
0 0.5 1
meet
coffee
rest.
admin
others
1 8 15 22 29 360
5
10
15
#lin
ks
type=39 516,518,519,520,528,532,
Mo Tu We Th Fr
00:00
03:00
06:00
09:00
12:00
15:00
18:00
21:00
0 0.2 0.4
<15min
15!30min
30!60min
1!2h
>2h
duration distribution0 0.5 1
23456789
1011
#people distributionx
y
0 20 40 600
0.05
0.1
0.15
0.2
0.25
userID
mem
bers
hip
scor
e
0 0.5 1
meet
coffee
rest.
admin
others
1 8 15 22 29 360
5
10
15
20
25
#lin
ks
type=40 516,517,520,521,523,528,529,
Mo Tu We Th Fr
00:00
03:00
06:00
09:00
12:00
15:00
18:00
21:00
0 0.2 0.4
<15min
15!30min
30!60min
1!2h
>2h
duration distribution0 0.2 0.4
23456789
1011
#people distributionx
y
(d) duration and number of people
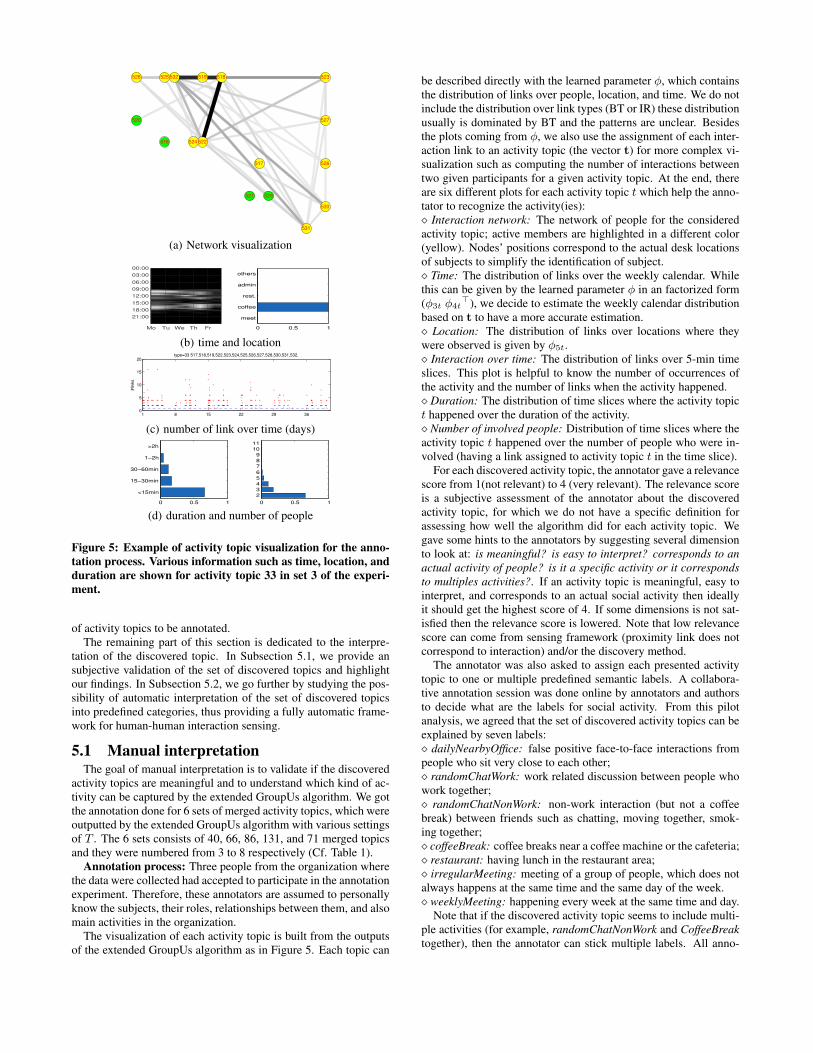
Figure 5: Example of activity topic visualization for the anno-tation process. Various information such as time, location, andduration are shown for activity topic 33 in set 3 of the experi-ment.
of activity topics to be annotated.The remaining part of this section is dedicated to the interpre-
tation of the discovered topic. In Subsection 5.1, we provide ansubjective validation of the set of discovered topics and highlightour findings. In Subsection 5.2, we go further by studying the pos-sibility of automatic interpretation of the set of discovered topicsinto predefined categories, thus providing a fully automatic frame-work for human-human interaction sensing.
5.1 Manual interpretationThe goal of manual interpretation is to validate if the discovered
activity topics are meaningful and to understand which kind of ac-tivity can be captured by the extended GroupUs algorithm. We gotthe annotation done for 6 sets of merged activity topics, which wereoutputted by the extended GroupUs algorithm with various settingsof T . The 6 sets consists of 40, 66, 86, 131, and 71 merged topicsand they were numbered from 3 to 8 respectively (Cf. Table 1).
Annotation process: Three people from the organization wherethe data were collected had accepted to participate in the annotationexperiment. Therefore, these annotators are assumed to personallyknow the subjects, their roles, relationships between them, and alsomain activities in the organization.
The visualization of each activity topic is built from the outputsof the extended GroupUs algorithm as in Figure 5. Each topic can
be described directly with the learned parameter φ, which containsthe distribution of links over people, location, and time. We do notinclude the distribution over link types (BT or IR) these distributionusually is dominated by BT and the patterns are unclear. Besidesthe plots coming from φ, we also use the assignment of each inter-action link to an activity topic (the vector t) for more complex vi-sualization such as computing the number of interactions betweentwo given participants for a given activity topic. At the end, thereare six different plots for each activity topic t which help the anno-tator to recognize the activity(ies):� Interaction network: The network of people for the consideredactivity topic; active members are highlighted in a different color(yellow). Nodes’ positions correspond to the actual desk locationsof subjects to simplify the identification of subject.� Time: The distribution of links over the weekly calendar. Whilethis can be given by the learned parameter φ in an factorized form(φ3t φ4t
>), we decide to estimate the weekly calendar distributionbased on t to have a more accurate estimation.� Location: The distribution of links over locations where theywere observed is given by φ5t.� Interaction over time: The distribution of links over 5-min timeslices. This plot is helpful to know the number of occurrences ofthe activity and the number of links when the activity happened.� Duration: The distribution of time slices where the activity topict happened over the duration of the activity.� Number of involved people: Distribution of time slices where theactivity topic t happened over the number of people who were in-volved (having a link assigned to activity topic t in the time slice).
For each discovered activity topic, the annotator gave a relevancescore from 1(not relevant) to 4 (very relevant). The relevance scoreis a subjective assessment of the annotator about the discoveredactivity topic, for which we do not have a specific definition forassessing how well the algorithm did for each activity topic. Wegave some hints to the annotators by suggesting several dimensionto look at: is meaningful? is easy to interpret? corresponds to anactual activity of people? is it a specific activity or it correspondsto multiples activities?. If an activity topic is meaningful, easy tointerpret, and corresponds to an actual social activity then ideallyit should get the highest score of 4. If some dimensions is not sat-isfied then the relevance score is lowered. Note that low relevancescore can come from sensing framework (proximity link does notcorrespond to interaction) and/or the discovery method.
The annotator was also asked to assign each presented activitytopic to one or multiple predefined semantic labels. A collabora-tive annotation session was done online by annotators and authorsto decide what are the labels for social activity. From this pilotanalysis, we agreed that the set of discovered activity topics can beexplained by seven labels:� dailyNearbyOffice: false positive face-to-face interactions frompeople who sit very close to each other;� randomChatWork: work related discussion between people whowork together;� randomChatNonWork: non-work interaction (but not a coffeebreak) between friends such as chatting, moving together, smok-ing together;� coffeeBreak: coffee breaks near a coffee machine or the cafeteria;� restaurant: having lunch in the restaurant area;� irregularMeeting: meeting of a group of people, which does notalways happens at the same time and the same day of the week.� weeklyMeeting: happening every week at the same time and day.
Note that if the discovered activity topic seems to include multi-ple activities (for example, randomChatNonWork and CoffeeBreaktogether), then the annotator can stick multiple labels. All anno-

tations were done on a shared Google spreadsheet, each set corre-sponds to one separate sheet. Each annotator was the responsibleperson of one or multiple sets and need to finish the assigned sets.Furthermore, other annotators can look at his/her annotations andcomment. The objective was to find an agreement between annota-tors rather than averaging annotation from multiple annotators.
Discovered activity topics. Examples of discovered topics aregiven in Table 1 for which we report the experience of the annota-tor when she/he look at the visualization of the activity topic. The“Code” field corresponds to the set and the number of the discov-ered activity topic. The “Observation” field is our text descriptionfor the activity topic in terms of who, when, and where. Theseinformation can be easily extracted from the activity topic visual-ization. The “Annotation” field corresponds to the annotated la-bel(s) and relevance score. Finally, we report the annotator com-ment about the discovered activity topic in italic.
We selected a number of activity topics to demonstrate what kindof activities were discovered and report the justifications from theannotators about their annotations. The topic 3 in set3 correspondsto coffee break interactions of 13 people in several offices, its visu-alization is shown in Figure 5. From the plots, we can extract easilythat there are this particular activity topic involved 13 people (yel-low nodes in the network plot), could happen any time, and tookplace at the coffee machine. The timeline slot in Figure 5(c) showthat this activity happened every working day of the week, and thedistributions in Figure 5(d) shows that the events of this activity areusually short (lest than 15minutes) and that people usually come ingroup of 2 or 3 people. These findings are summarized in Table 1and they correspond to the comment from the annotator.
Due to space constraint, we put the visualization of other activitytopics in a separated supplementary document, and only report thesummarization of these activity topics in Table 1. The topic 30 ofset6 is an example of unreal interaction between four people com-ing from a small office. The annotator can recognize this activitytopic as a dailyNearbyOffice since the interaction links occur al-most everyday and lasts several hours. The topic 57 in set6 is an ex-ample of interaction between friends and between colleagues. Theannotator thinks that it is a mix of randomChatWork and random-ChatNonWork since these kind of social activity usually involveonly 2 or 3 people; and the durations of interaction are usually short(quick chat) but can be relatively long (probably work related dis-cussion). The activity topic 43 of set6 involve 7 people who workstogether in several projects. Based on the duration and relationshipbetween these people, the annotator labeled it as randomChatWork.
In some case, the discovered activity topic does not correspondto a single activity label. We found that randomChatNonWork isusually confused with randomChatWork since their patterns aboutnumber of people, time, and location are very similar. The maindifference between the two activity labels lies in the duration ofinteraction of event and the relationship between people. These in-formation, however, had not been exploited by the model so thatthe discovered activity topics are not discriminative between thetwo activity labels. The activity topic 5 of set6 is a typical exampleof the confusion between randomChatWork and randomChatNon-Work. These are interactions between two people from the sameroom, which are relatively short but it is unclear if the discussionis work-related. Similarly, the activity topic 57 of set6 is anotherexample of the confusion, but involve more people, and some ofthem are friends.
The three remaining examples are dedicated to restaurant (set3-29), irregularMeeting (set6-12), and weeklyMeeting (set4-18). Whilethe patterns of these two examples of restaurant and weeklyMeet-
Table 1: Examples of discovered activity topics, their annota-tions, and comments from annotators.Code Observation Annotationset4-33(Fig. 5)
Who: 13 peopleWhen: can be any time, most pop-ular around 10am and 4pmWhere: coffee machine
coffeeBreakrelevance: 4
“This activity topic corresponds to interactions during coffeebreaks; people usually came in group of 2 or 3; lasted around 15minutes; this activity topic is relevant and it reflects the actual ac-tivity.”set6-30 Who: 4 people
When: can be any time of the dayWhere: not available (no connec-tion to any fixed station)
dailyNearbyOfficerelevance: 1
“Happened almost everyday from 10am to 7pm with a break atlunch; this activity topic does not seem to correspond to real face-to-face discussion since these 4 people came from a small office andthe activity happened almost everyday and lasts several hours. Nota relevant activity.”set6-43 Who: 7 people
When: any time, usually afterlunchWhere: not available
randomChatWorkrelevance: 4
“Two or three people discuss together; usually short but can belong up to 2 hours; these people work together thus the topic is veryrelevant; these seven people come from different offices.”set6-5 Who: two people
When: can be any time of the dayWhere: not available
randomChatWork,randomChatNonWorkrelevance: 3
“Interaction between two colleagues from the same office; usuallylast less than 15 minutes but it is not clear if the discussion is work-related since these two people also work together.”set6-57 Who: 7 people
When: can be any time of the dayWhere: not available
randomChatWork,randomChatNonWorkrelevance: 3
“Irregular interactions involving 2 or 3 people; interaction dura-tions are usually less than 15 minutes but can be up to 2 hours; canbe a discussion about work or non-work chatting since some peopleare friends; The seven people come from different offices.”set3-29 Who: 4 people
When: between 12:00 and 14:00Where: restaurant area
restaurantrelevance: 4
“These 4 people (sitting in the same office) usually come togetherto have lunch, lasts usually one hour.”set6-12 Who: 8 people
When: some Mondays and Tues-days, 5pm-6pmWhere: usually at meeting rooms
irregularMeetingrelevance: 2
“It is clear that this activity topic corresponds to one-hour meet-ings; the 8 people actually work together; the number of attendeesvary from 5 to 10, make it hard to interpret the activity topic.”set4-18 Who: 11 people
When: every Monday at 12pm-1pmWhere: not available
weeklyMeetingrelevance: 4
“Group meeting where members are supposed to participate everyweek; lasting one hour; happened every Monday in the 6 week pe-riod.”

0
20
40
60
80
100
120
140#to
pic
s
dailyNearbyOffice
randomChatWork
randomChatNonWork
coffeeBreak
restaurant
irregularM
eeting
weeklyMeeting
1 (Not relevant)
2
3
4 (Very relevant)
Figure 6: Relevance scores of activity topics in different cate-gories of activity.
ing are clean (with the highest relevance score), the chosen activitytopics of irregularMeeting was not easy to interpret for the annota-tor. More specifically, the activity topics correspond to meetings ofone hour, but the number (and the composition) of attendees variedsignificantly from one meeting to another, making it hard to recog-nize in which context these meetings were held (for which projects,held by which group of people, etc.)
Subjective evaluation. In overall, 16% of the activity topics getrelevance score 1 (Not relevant), another 16% of them get score 2(OK - but not so good), 25% with score 3 (Good), and the remain-ing 44% of activity topics get score 4 (Very relevant). After a closeinspection, we found clear patterns on the dependencies betweenrelevance score and the activity label. On one hand, most activitytopics with low relevance score were annotated as dailyNearbyOf-fice, corresponding to groups of people whose desks are very close.While the captured interaction links did not correspond to real in-teraction due to sensing method (proximity does not always meaninteraction), the model was able to regroup them in several activitytopics. We see in the next section that there is the possibility to rec-ognize these "unreal" interactions automatically. On the other hand,coffee breaks, lunch in the restaurant, and weekly meetings werewell discovered by the model which are relatively easy to interpret.The relevance of the remaining activity topics were dominated byscore 3 and 2, corresponding to Good and OK, respectively. Asstated earlier in the description of the annotation process, low rel-evance scores may come from sensing quality and/or the method.Our results confirmed that low relevance scores come mainly fromthe sensing part (false positive interaction links) while the activitydiscovery algorithm performs relatively well.
5.2 Automatic labeling of topicIn the previous section, we show that many of the discovered ac-
tivity topics correspond to the actual group activity, and they can beinterpreted by people who know the organization well. As the nextstep, it would be practical to have a system that uncovers multipleactivity topics and recognizes automatically their semantic mean-ing such as weekly meetings or coffee breaks. We formalize therecognition problem in a supervised learning framework where datapoints correspond to discovered activity topics and the ground-truthis a whether an activity topic correspond to a given label.
As location and social activity are closely related, one may in-fer the social activity directly from the location of interaction (e.g.,having coffee break at the coffee machine). However, location in-formation is not always available, and people may have multipleactivities at the same location (e.g., irregular meeting or weeklymeeting at the meeting room). We propose to use random forest forlabeling discovered activity topics based on various information,
Table 2: Feature extraction for automatic labeling of discov-ered activity topics.Group DescriptionLocation The distribution of links over locations.Time The distributions over time-of-day and day-of-week.People Number of active members and distribution of time
slices over the number of involved people.Duration The distribution of time slices over durations.Link The distribution of number of links per time slice.
including location or not. By studying two prediction systems withand without location features, we can see whether it is possible toinfer the activity without the need of location data (e.g., for datasetwhich does not contain location information or the semantic mean-ing of location is unknown) and how much location informationcan help improving the prediction performance.
Feature extraction. For the automatic labeling task, each dis-covered activity topic t is represented by a vector of 49 featuresbelonging to six groups as shown in Table 2. The set of locationfeatures consists of the distribution over the file categories of loca-tion, which is encoded by φ5t. The entropy of these multinomialdistributions is also used as a feature. Time features come from thedistribution over day of the week, φ3t, and time of the day, φht, aswell as their entropy. People features are computed based on thedetected number of people involved in the activity topic. We usedthe number of active members (given by GroupUs algorithm) andthe distribution over number of attendees (i.e., fraction of activetime slices in which there are exactly X people being involved inactivity topic t, with X varying from 2 to 49), as showed in Figure5(d,right). Similarly, duration features are computed as the fractionof active time slices of activity topic t which are parts of an activitylasting Y minutes (Figure 5(d,left)). Finally, for link features, wecompute the fraction of time slices of the activity topic t which hasZ interaction links being assigned to the activity topic.
Automatic labeling performance. The labeling task is to pre-dict if a discovered activity topic corresponds to an activity label.Thus, for the seven activity labels, we have seven binary classifica-tion tasks. We use random forest classifier with 1000 trees and allresults are obtained with a 10-fold cross-validation process on 492annotated activity topics.
Table 3 reports automatic labeling accuracies for the seven pre-defined activity labels. We use majority class predictor as a baselineand compare its performances with two random forest systems: onewith location features and one without location features. As can beseen, all activity labels are predictable to some degrees. coffee-Break and restaurant can be reliably recognized by random forestsystems with and without location features. On the contrary, theautomatic recognition systems do not outperform the baseline per-formance for randomChatNonWork. This issue may come from thefact that it not easy to distinguish between randomChatNonWorkand randomChatWork without knowing the actual relationship be-tween people (e.g., close friends, collaborators of same project).This assumption is confirmed by the prediction results of the spe-cial activity label randomChat which merges randomChatWork andrandomChatNonWork. The reduction in the number of errors (be-tween RF and Baseline) for randomChatNonWork, randomChat-Work, and randomChat are respectively 0%, 32% and 47%.
Comparing the two random forest systems with and without lo-cation features, we found that their performances are comparablefor many activity labels except randomChat and coffeeBreak. Toverify if the location information is key to distinguish these two

Table 3: Automatic labeling accuracies of random forest sys-tems with and without location features. Baseline performancewas computed based on majority class predictor.
Category Baseline RF RF w/o locationdailyNearbyOffice 0.86 0.90 0.89randomChatWork 0.75 0.83 0.81randomChatNonWork 0.85 0.85 0.85coffeeBreak 0.80 0.99 0.95restaurant 0.99 0.99 0.98irregularMeeting 0.88 0.89 0.88weeklyMeeting 0.78 0.88 0.88randomChat 0.70 0.84 0.79randomChatCoffee 0.52 0.85 0.86
categories, we apply merging technique again to have a new labelcalled randomChatCoffee. Not surprisingly, the location informa-tion is not helpful to distinguish activity topics of the merged cate-gory randomChatCoffee and the rest. At the end, location informa-tion is helpful to distinguish between randomChat and coffeeBreak,while the prediction performance for other activity categories doesnot depend significantly on location information.
6. CONCLUSIONThis study contributes to the understanding of social activity and
opens the possibility to infer social activity from interaction be-tween people. We have proposed a variant of topic model whichcan discover various activity topics from timestamped, localizedsocial interactions being sensed by BT and IR sensors. We alsoshowed how to assign these discovered topics to common senseactivity label, thus enabling a fully automatic framework for sens-ing and inferring social activity based on mobile sensor network.The analysis was conducted on a real interaction data set in anorganization, and the method was validated by their people. Thesubjective evaluation results suggest that many discovered activitytopic are highly relevant, while false positive interactions were notfiltered completely from the data set. Interestingly, these sensingnoise were regrouped in several activity topics, thus the noise maybe filtered by the proposed probabilistic method. Finally, our ex-periment on the automatic labeling demonstrates that some socialactivity can be recognized reliably by social interaction, even whenthe location of the interaction is not available.
As future work, we are interested in applying the framework tohuman behavior analysis to characterize the relationship betweensocial activity and personal state such as mood or job performance.Our framework can be extended to incorporate more behavioralfeatures such as speech or body activity. While this study considerssocial network sensed by multiple subjects, some of the ideas canbe applied to interaction data being sensed by a single individual.Another direction that we want to investigate is to compare ourglobal network analysis with ego network analysis to understandthe advantages and shortcomings of each approach.
AcknowledgmentsThis research was funded by SNSF SONVB project.
7. REFERENCES[1] N. Aharony, W. Pan, C. Ip, I. Khayal, and A. Pentland.
Social fmri: Investigating and shaping social mechanisms inthe real world. Pervasive and Mobile Computing,7(6):643–659, 2011.
[2] R. Albert, H. Jeong, and A.-L. Barabási. Internet: Diameterof the world-wide web. Nature, 401(6749):130–131, 1999.
[3] L. Backstrom, E. Sun, and C. Marlow. Find me if you can:improving geographical prediction with social and spatialproximity. In Proc. WWW, pages 61–70, 2010.
[4] L. Bao and S. S. Intille. Activity recognition fromuser-annotated acceleration data. In Pervasive Computing,pages 1–17. Springer, 2004.
[5] D. M. Blei, A. Y. Ng, and M. I. Jordan. Latent dirichletallocation. the Journal of machine Learning research,3:993–1022, 2003.
[6] A. T. Campbell, S. B. Eisenman, N. D. Lane, E. Miluzzo,and R. A. Peterson. People-centric urban sensing. In Proc.WICON, page 18, 2006.
[7] C. Cattuto, W. Van den Broeck, A. Barrat, V. Colizza, J.-F.Pinton, and A. Vespignani. Dynamics of person-to-personinteractions from distributed rfid sensor networks. PloS one,5(7):e11596, 2010.
[8] X. Chen and J. Yang. Towards monitoring human activitiesusing an omnidirectional camera. In Proc. ICMI, pages423–428, 2002.
[9] M. Cristani, R. Raghavendra, A. Del Bue, and V. Murino.Human behavior analysis in video surveillance: a socialsignal processing perspective. Neurocomputing, 2012.
[10] T. M. T. Do and D. Gatica-Perez. Contextual grouping:discovering real-life interaction types from longitudinalbluetooth data. In Proc. MDM, volume 1, pages 256–265,2011.
[11] T. M. T. Do and D. Gatica-Perez. Human interactiondiscovery in smartphone proximity networks. Personal andUbiquitous Computing, 17(3):413–431, 2013.
[12] W. Dong, B. Lepri, and A. S. Pentland. Modeling theco-evolution of behaviors and social relationships usingmobile phone data. In Proc. MUM, pages 134–143, 2011.
[13] N. Eagle and A. Pentland. Reality mining: sensing complexsocial systems. Personal and ubiquitous computing,10(4):255–268, 2006.
[14] S. A. Golder and M. W. Macy. Diurnal and seasonal moodvary with work, sleep, and daylength across diverse cultures.Science, 333(6051):1878–1881, 2011.
[15] M. C. Gonzalez, C. A. Hidalgo, and A.-L. Barabasi.Understanding individual human mobility patterns. Nature,453(7196):779–782, 2008.
[16] C. A. Hidalgo and C. Rodriguez-Sickert. The dynamics of amobile phone network. Physica A: Statistical Mechanics andits Applications, 387(12):3017–3024, 2008.
[17] B. Lavelle, D. Byrne, G. J. Jones, and A. F. Smeaton.Bluetooth friendly names: bringing classic hci questions intothe mobile space. In Proceedings of the 21st British HCIGroup Annual Conference on People and Computers: HCI...but not as we know it-Volume 2, pages 63–66. BritishComputer Society, 2007.
[18] B. Lepri, J. Staiano, G. Rigato, K. Kalimeri, A. Finnerty,F. Pianesi, N. Sebe, and A. Pentland. The sociometric badgescorpus: A multilevel behavioral dataset for social behavior incomplex organizations. In SocialCom/PASSAT, pages623–628, 2012.
[19] C.-H. Lu and L.-C. Fu. Robust location-aware activityrecognition using wireless sensor network in an attentivehome. Automation Science and Engineering, IEEETransactions on, 6(4):598–609, 2009.
[20] A. Madan, M. Cebrian, D. Lazer, and A. Pentland. Socialsensing for epidemiological behavior change. In Proc.
UbiComp, pages 291–300, 2010.[21] A. Noulas, S. Scellato, C. Mascolo, and M. Pontil. An
empirical study of geographic user activity patterns infoursquare. ICWSMâAZ11, 2011.
[22] D. O. Olguın, P. A. Gloor, and A. S. Pentland. Capturingindividual and group behavior with wearable sensors. Proc.AAAI Spring Symposium, 9, 2009.
[23] D. Olguin-Olguin, B. N. Waber, T. Kim, A. Mohan, K. Ara,and A. Pentland. Sensible organizations: technology andmethodology for automatically measuring organizationalbehavior. Trans. Sys. Man Cyber. Part B, 39(1):43–55, Feb.2009.
[24] S. Phithakkitnukoon, T. Horanont, G. Di Lorenzo,R. Shibasaki, and C. Ratti. Activity-aware map: Identifyinghuman daily activity pattern using mobile phone data. InHuman Behavior Understanding, pages 14–25. Springer,2010.
[25] Y. Song, L.-P. Morency, and R. Davis. Multimodal humanbehavior analysis: learning correlation and interaction acrossmodalities. In Proc. ICMI, pages 27–30, 2012.
[26] A. Vahdatpour, N. Amini, and M. Sarrafzadeh. Towardunsupervised activity discovery using multi-dimensionalmotif detection in time series. In Proc. IJCAI, pages1261–1266. Morgan Kaufmann Publishers Inc., 2009.