industry membership and capital structure dynamics in the uk
TRANSCRIPT
International Review of Financial Analysis 20 (2011) 207–214
Contents lists available at ScienceDirect
International Review of Financial Analysis
Industry membership and capital structure dynamics in the UK☆
Jon Tucker a,⁎, Evarist Stoja b
a Centre for Global Finance, Faculty of Business and Law, University of the West of England, Frenchay Campus, Coldharbour Lane, Bristol BS16 1QY, United Kingdomb Department of Accounting and Finance, School of Economics, Finance and Management, University of Bristol, 8 Woodland Road, Bristol BS8 1TN, United Kingdom
☆ We thank an anonymous referee, David Ashton, MDraper, and seminar participants at Queen's ManagemenSchool, Durham Business School, and the UWE Centrecomments and suggestions. The usual disclaimer applie⁎ Corresponding author. Tel.: +44 1173283754; fax:
E-mail addresses: [email protected] (J. Tucker),
1057-5219/$ – see front matter © 2011 Elsevier Inc. Aldoi:10.1016/j.irfa.2011.03.002
a b s t r a c t
a r t i c l e i n f oArticle history:Received 4 May 2010Received in revised form 14 March 2011Accepted 30 March 2011Available online 7 April 2011
JEL classification:G32
Keywords:GearingTargetingPecking orderTrade-off theoryCointegration
We examine the impact of industry membership on the capital structure dynamics of UK quoted firms overthe period 1968 to 2006 by analysing how the components of common gearing ratios are adjusted in relationto one another. More specifically, if we find evidence of a cointegrating relationship between thesecomponents then we argue that this provides us with evidence of target gearing behaviour. Further,employing a novel approach, we test whether firms engage in targeting behaviour in the long-run whilst ahierarchy or pecking order of financing arises in the short-run. The paper is motivated by the conjecture that asynthesis of the pecking-order theory and the trade-off theory is necessary. Arguably, whilst both theories canexplain certain aspects of capital structure setting behaviour, neither provides a satisfactory generalexplanation of behaviour in the real-world. The results reveal that in the long-run, most firms demonstratetarget gearing behaviour, though targeting is restricted to those measures most meaningful to a firm'sparticular industry. Adjustment towards a given target is rapid, taking on average no more than four years.In the short-run, old economy firms follow a standard pecking order whilst new economy firms choose equityin preference to debt when external financing is required. This provides some evidence in support of asynthesis approach to the determination of gearing whilst also highlighting the importance of industrymembership to capital structure determination.
ike Jones, Richard Harris, Pault School, Manchester Businessfor Global Finance for useful
s.+44 [email protected] (E. Stoja).
l rights reserved.
© 2011 Elsevier Inc. All rights reserved.
1. Introduction
The debate regarding whether a firm's capital structure impactsupon its value, which commenced with Modigliani and Miller's(1958) irrelevance proposition, is even today far from over. However,the balance of argument has arguably swung in favour of capitalstructure relevance, that is, there exists a certain capital structurewhich will minimise the cost of capital, thereby maximising firmvalue. An optimal gearing ratio which maximises firm value resultsfrom a trade-off of tax shields against financial distress costs (Brealey,Myers, & Allen, 2007). Given that the costs and benefits of debtfinancing will vary across industries, firms most likely set theirgearing ratios in relation to the norm for their industry. Indeed,Beattie, Goodacre, and Thomson (2006) argue that business risk, assetstructure, growth opportunities, and other industry-specific charac-teristics, drive gearing ratios (see also Aggarwal & Kyaw, 2010; Billet,King, & Mauer, 2007; Lord & McIntyre, 2003). Whilst we cannotobserve directly firm gearing optimisation, we can observe industry
norm targeting, and authors such as Antoniou, Guney, and Paudyal(2006), Kayhan and Titman (2007), and Lemmon, Roberts, and Zender(2008), inter alia, argue that the existence of an optimal gearingratio implies the existence of a target ratio. Further, they argue that ifit can be shown that debt ratios vary significantly by industry, it will beproved that finance managers have found different optimal gearingratios that are a function of their firm's business risk. More recently,there is evidence that UK, French and German firms adjust theirgearing towards targets at different speeds depending on whetherthey are manufacturers or service sector firms. If we are to conduct anempirical study of target gearing, then, an industry level study shouldenable us not only to test for the occurrence of targeting behaviour, butalso to examine the speed of adjustment towards targets.
The objective of this paper is to examine the impact of industrymembership on the capital structure dynamics of UK firms, thecountry of study selected on the basis of the length and quality ofgearing data available across a wide range of industries. Morespecifically, we investigate whether industry-optimal gearing ratiotargeting behaviour occurs in the long run whilst a hierarchy offinancing arises in the short-run. As the impact of gearing de-terminants will vary across industries, we expect different gearingratios to be targeted across those industries. We apply a novelapproach by testing for evidence of a cointegrating relationshipbetween the component variables of commonly employed capitalstructure ratios. This approach is more appropriate than previous
208 J. Tucker, E. Stoja / International Review of Financial Analysis 20 (2011) 207–214
cross-sectional studies as it enables the study of capital structuredynamics and allows for the variability of gearing ratios and multi-period adjustment, consistent with, inter alia, Dissanaike, Lambrecht,and Saragga (2001), Elsas and Florysiak (forthcoming), Flannery andRangan (2006), Hui, Lo, and Huang (2006), and Lemmon et al. (2008).The approach enables us to consider a synthesis capital structuremodel where the long-run gearing ratio is determined by the trade-offtheory whilst the short-run variations may be driven by the peckingorder theory.
The results show that generally firms target industry gearingnorms, though the precise measure targeted varies across industries.Retained earnings are used to close the majority of any deviation fromthe target in preference to external financing, and when externalfinancing is required, mature-industry firms prefer to employ debtwhilst younger-industry firms prefer equity. These results areconsistent with the general version of the pecking order theoryproposed by Halov and Heider (2008).
This paper proceeds as follows: in Section 2, we briefly review therelevant target capital structure literature. The dataset employed isdescribed and the hypotheses are discussed in Section 3. Section 4briefly explains the Johansen cointegration methodology and errorcorrection model. In Section 5, the cointegration analysis results arediscussed, whilst Section 6 presents the results of the error correctionmodel. Section 7 summarises the salient findings and concludes.
2. The need for some synthesis
The literature in general provides support for the existence ofoptimal gearing ratios and, by implication, target gearing behaviour infirms (see, for example, the recent review of literature by Graham &Leary, forthcoming). Such behaviour is explained well by the trade-offtheory whereby an optimal ratio is reached by trading off the debtinterest tax shield against financial distress costs or by trading offthe agency costs and benefits of debt (see, for example, the classicalstudies of Jensen, 1986 and Kim, 1978, respectively). Evidencesupporting targeting behaviour is provided, inter alia, by Flanneryand Rangan (2006), Francis and Leachman (1994), Leary and Roberts(2005), Lemmon et al. (2008) and Philosophov and Philosophov(2005) for US firms, and Antoniou et al. (2006), Beattie et al. (2006),Bunn and Young (2004) and Ozkan (2001) for UK firms. The impact ofcapital structure determinants is likely to vary significantly acrossindustries, and as a result, optimal ratios will vary across industriesnot just in terms of magnitude but also in terms of ratio definition.
Dissanaike et al. (2001), Fischer, Zechner, and Heinkel (1989),Flannery and Rangan (2006) and Lemmon et al. (2008) argue thatsome researchers fail to acknowledge the multiple time periodsrequired by firms to achieve their target capital structure ratios.Estimating target gearing in a simple cross-sectional regressionimplicitly assumes that firms always attain their target gearing ratioswithin one time period. However, if adjustment costs are non-trivial,restricting the adjustment speed to unity will bias coefficientestimates. Thus, a functional form that permits partial adjustment ofthe firm's gearing ratio to its target is essential.
Fischer et al. (1989) develop a model of dynamic optimal gearingchoice and demonstrate that debt ratios are characterised by wideswings. Bunn and Young (2004) and Flannery and Rangan (2006) findthat US and UK firms, respectively, allow their gearing ratios to varysignificantly around a target, suggesting that firms do not identify astrict, single optimal capital structure ratio, but rather a range overwhich their capital structures are allowed to vary (see also Bhamra,Kuehn, & Strebulaev, 2010; Goldstein, Ju, & Leland, 2001; Hackbarth,Miao, & Morellec, 2006; and Kurshev & Strebulaev, 2007 for otherframeworks of target adjustments).
The alternative to the trade-off theory, suggests that firms prefer touse retained earnings to external finance, and that when externalfunds are required, debt is preferred to new equity (Shyam-Sunder &
Myers, 1999). This pecking order to financing could arise due to: theasymmetry in the tax code (Stiglitz, 1973); or asymmetric informa-tion and adverse selection (Heaton, 2002; Myers, 2003; Shyam-Sunder & Myers, 1999). However, Nachman and Noe (1994) note thatthe standard pecking order implicitly assumes that debt is correctlypriced because all firms have the same risk or because uninformedoutside investors do not care about risk. However, debt is a concaveclaim with significant adverse selection costs leading to mispricing ifrisk matters. Halov and Heider (2008) address this issue and advancea new version of the pecking order theory, arguing that when there isgreater asymmetric information about risk rather than value, debt ischaracterised by a more severe adverse selection problem and hencefirms would only issue equity. They show that as asset volatilityincreases, firms use equity rather than debt to finance their deficits.Moreover, the standard pecking order obtains only when debt isunlikely to be mispriced. Thus, the standard pecking order may bemore appropriate in explaining the financing behaviour of maturefirms (Brealey et al., 2007) as these may have lower adverse selectioncosts for debt. In other words, their debt may be correctly priced, asa result of bond ratings, analysts' coverage and higher transparency.On the other hand, Fama and French (2002) and Rampini andViswanathan (2010) find that small, high-growth firms tend to makelarge net issues of new stock and are thus the least levered, eventhough theywould appear to be characterised by higher debt capacity.Hence, Halov and Heider's new version of the pecking order may bemore appropriate in explaining the financing behaviour of small,young and/or high-growth firms as these may have higher adverseselection costs for debt. This may be because their lack of bond ratings,lower analysts' coverage and transparency could lead to debtmispricing.
The trade-off theory contrasts sharply with the pecking ordertheory as the former implies an optimal gearing ratio whereas thelatter does not (Barclay & Morellec, 2006). However, Beattie et al.(2006) argue that once we introduce the concept of a target rangewe can reconcile the two competing theories: within an optimalrange, the gearing ratio may vary in accordance with investmentrequirements, earnings generation and external financing opportuni-ties as explained by the pecking order theory. However, when thegearing ratio significantly departs from the optimal range, then firmstake steps ‘to force’ the gearing ratio to mean revert. Since these stepsare costly, then firms must believe that the benefits of mean reversionare higher than the costs, and hencemaximise firm value as argued bythe trade-off theory. Beattie et al. highlight the need for a modelcombining elements of trade-off and pecking order theories andHovakimian, Opler, and Titman (2001) and Kayhan and Titman(2007) find that firms have target debt ratios whilst also preferringinternal financing to external funds. Further, Flannery and Rangan(2006) find strong evidence that firms pursue long-run target capitalstructures and also that the pecking order variables have someexplanatory power in their tests. The implication for empirical testinghere is that studies should employ methods capable of modelling thedynamic adjustment of capital structures under such a synthesismodel. The approach taken in this study facilitates such testing.
Which ratios should we expect firms in different industries totarget? On the basis of the ‘control hypothesis’ for debt creation, highfree cash flow generating firms with low growth prospects have anincentive to have more debt in their capital structures to commitmanagers to pay out future cash flows, thereby reducing agency costs(Jensen, 1986). Firms with high tangible, fixed assets should targetgearing ratios which include either total assets or book equity (Barclay& Morellec, 2006). Well-established firms with a history of valuecreation over and above book value should target ratios which includemarket rather than book value equity (Brealey et al., 2007). Further, assuch firms should evidence significant accumulated retained earnings,then gearing ratios which include total equity as opposed to baseequity (issued share capital alone) are more likely to be targeted. In
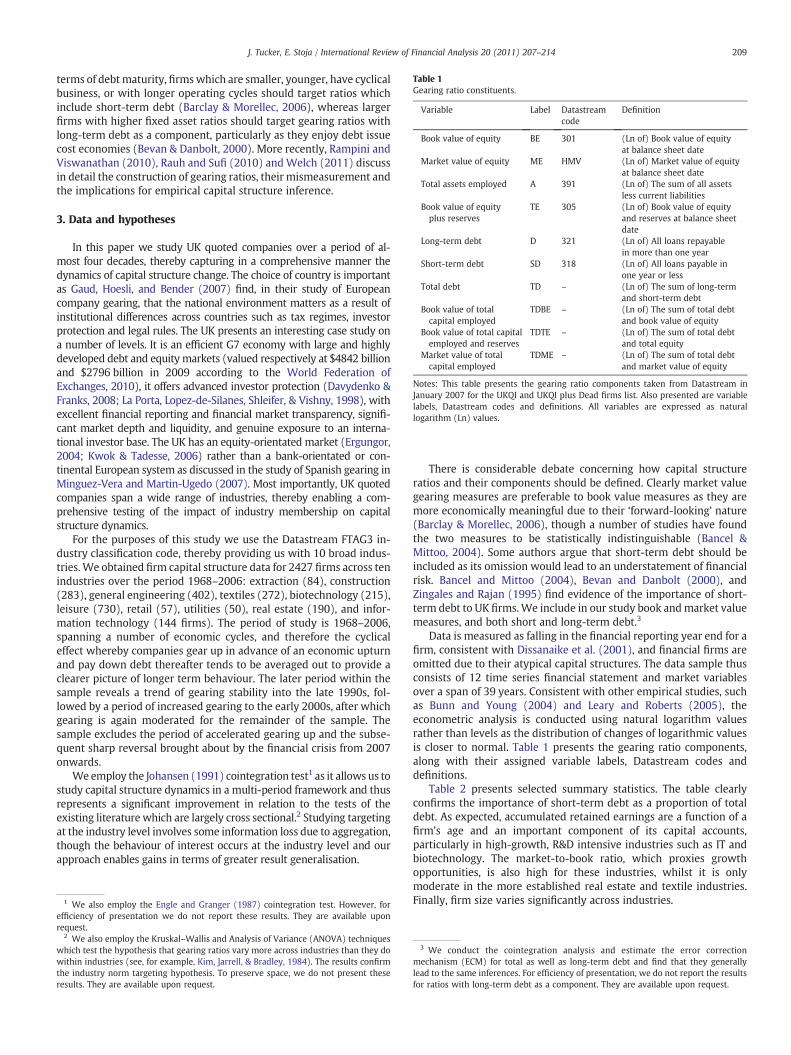
Table 1Gearing ratio constituents.
Variable Label Datastreamcode
Definition
Book value of equity BE 301 (Ln of) Book value of equityat balance sheet date
Market value of equity ME HMV (Ln of) Market value of equityat balance sheet date
Total assets employed A 391 (Ln of) The sum of all assetsless current liabilities
Book value of equityplus reserves
TE 305 (Ln of) Book value of equityand reserves at balance sheetdate
Long-term debt D 321 (Ln of) All loans repayablein more than one year
Short-term debt SD 318 (Ln of) All loans payable inone year or less
Total debt TD – (Ln of) The sum of long-termand short-term debt
Book value of totalcapital employed
TDBE – (Ln of) The sum of total debtand book value of equity
Book value of total capitalemployed and reserves
TDTE – (Ln of) The sum of total debtand total equity
Market value of totalcapital employed
TDME – (Ln of) The sum of total debtand market value of equity
Notes: This table presents the gearing ratio components taken from Datastream inJanuary 2007 for the UKQI and UKQI plus Dead firms list. Also presented are variablelabels, Datastream codes and definitions. All variables are expressed as naturallogarithm (Ln) values.
209J. Tucker, E. Stoja / International Review of Financial Analysis 20 (2011) 207–214
terms of debtmaturity, firmswhich are smaller, younger, have cyclicalbusiness, or with longer operating cycles should target ratios whichinclude short-term debt (Barclay & Morellec, 2006), whereas largerfirms with higher fixed asset ratios should target gearing ratios withlong-term debt as a component, particularly as they enjoy debt issuecost economies (Bevan & Danbolt, 2000). More recently, Rampini andViswanathan (2010), Rauh and Sufi (2010) andWelch (2011) discussin detail the construction of gearing ratios, their mismeasurement andthe implications for empirical capital structure inference.
3. Data and hypotheses
In this paper we study UK quoted companies over a period of al-most four decades, thereby capturing in a comprehensive manner thedynamics of capital structure change. The choice of country is importantas Gaud, Hoesli, and Bender (2007) find, in their study of Europeancompany gearing, that the national environment matters as a result ofinstitutional differences across countries such as tax regimes, investorprotection and legal rules. The UK presents an interesting case study ona number of levels. It is an efficient G7 economy with large and highlydeveloped debt and equity markets (valued respectively at $4842 billionand $2796 billion in 2009 according to the World Federation ofExchanges, 2010), it offers advanced investor protection (Davydenko &Franks, 2008; La Porta, Lopez-de-Silanes, Shleifer, & Vishny, 1998), withexcellent financial reporting and financial market transparency, signifi-cant market depth and liquidity, and genuine exposure to an interna-tional investor base. The UK has an equity-orientated market (Ergungor,2004; Kwok & Tadesse, 2006) rather than a bank-orientated or con-tinental European system as discussed in the study of Spanish gearing inMinguez-Vera and Martin-Ugedo (2007). Most importantly, UK quotedcompanies span a wide range of industries, thereby enabling a com-prehensive testing of the impact of industry membership on capitalstructure dynamics.
For the purposes of this study we use the Datastream FTAG3 in-dustry classification code, thereby providing us with 10 broad indus-tries. We obtained firm capital structure data for 2427 firms across tenindustries over the period 1968–2006: extraction (84), construction(283), general engineering (402), textiles (272), biotechnology (215),leisure (730), retail (57), utilities (50), real estate (190), and infor-mation technology (144 firms). The period of study is 1968–2006,spanning a number of economic cycles, and therefore the cyclicaleffect whereby companies gear up in advance of an economic upturnand pay down debt thereafter tends to be averaged out to provide aclearer picture of longer term behaviour. The later period within thesample reveals a trend of gearing stability into the late 1990s, fol-lowed by a period of increased gearing to the early 2000s, after whichgearing is again moderated for the remainder of the sample. Thesample excludes the period of accelerated gearing up and the subse-quent sharp reversal brought about by the financial crisis from 2007onwards.
We employ the Johansen (1991) cointegration test1 as it allows us tostudy capital structure dynamics in a multi-period framework and thusrepresents a significant improvement in relation to the tests of theexisting literature which are largely cross sectional.2 Studying targetingat the industry level involves some information loss due to aggregation,though the behaviour of interest occurs at the industry level and ourapproach enables gains in terms of greater result generalisation.
1 We also employ the Engle and Granger (1987) cointegration test. However, forefficiency of presentation we do not report these results. They are available uponrequest.
2 We also employ the Kruskal–Wallis and Analysis of Variance (ANOVA) techniqueswhich test the hypothesis that gearing ratios vary more across industries than they dowithin industries (see, for example, Kim, Jarrell, & Bradley, 1984). The results confirmthe industry norm targeting hypothesis. To preserve space, we do not present theseresults. They are available upon request.
There is considerable debate concerning how capital structureratios and their components should be defined. Clearly market valuegearing measures are preferable to book value measures as they aremore economically meaningful due to their ‘forward-looking’ nature(Barclay & Morellec, 2006), though a number of studies have foundthe two measures to be statistically indistinguishable (Bancel &Mittoo, 2004). Some authors argue that short-term debt should beincluded as its omission would lead to an understatement of financialrisk. Bancel and Mittoo (2004), Bevan and Danbolt (2000), andZingales and Rajan (1995) find evidence of the importance of short-term debt to UK firms.We include in our study book andmarket valuemeasures, and both short and long-term debt.3
Data is measured as falling in the financial reporting year end for afirm, consistent with Dissanaike et al. (2001), and financial firms areomitted due to their atypical capital structures. The data sample thusconsists of 12 time series financial statement and market variablesover a span of 39 years. Consistent with other empirical studies, suchas Bunn and Young (2004) and Leary and Roberts (2005), theeconometric analysis is conducted using natural logarithm valuesrather than levels as the distribution of changes of logarithmic valuesis closer to normal. Table 1 presents the gearing ratio components,along with their assigned variable labels, Datastream codes anddefinitions.
Table 2 presents selected summary statistics. The table clearlyconfirms the importance of short-term debt as a proportion of totaldebt. As expected, accumulated retained earnings are a function of afirm's age and an important component of its capital accounts,particularly in high-growth, R&D intensive industries such as IT andbiotechnology. The market-to-book ratio, which proxies growthopportunities, is also high for these industries, whilst it is onlymoderate in the more established real estate and textile industries.Finally, firm size varies significantly across industries.
3 We conduct the cointegration analysis and estimate the error correctionmechanism (ECM) for total as well as long-term debt and find that they generallylead to the same inferences. For efficiency of presentation, we do not report the resultsfor ratios with long-term debt as a component. They are available upon request.
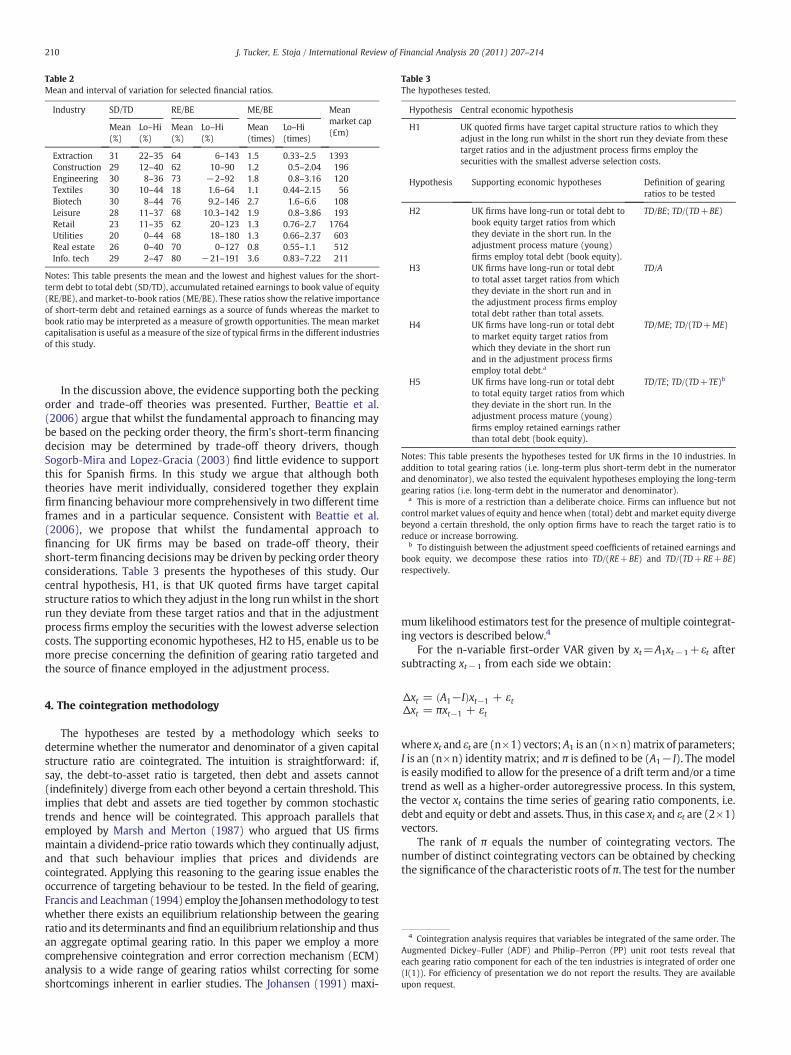
Table 3The hypotheses tested.
Hypothesis Central economic hypothesis
H1 UK quoted firms have target capital structure ratios to which theyadjust in the long run whilst in the short run they deviate from thesetarget ratios and in the adjustment process firms employ thesecurities with the smallest adverse selection costs.
Hypothesis Supporting economic hypotheses Definition of gearingratios to be tested
H2 UK firms have long-run or total debt tobook equity target ratios from whichthey deviate in the short run. In theadjustment process mature (young)firms employ total debt (book equity).
TD/BE; TD/(TD+BE)
H3 UK firms have long-run or total debtto total asset target ratios from whichthey deviate in the short run and inthe adjustment process firms employtotal debt rather than total assets.
TD/A
H4 UK firms have long-run or total debtto market equity target ratios fromwhich they deviate in the short runand in the adjustment process firmsemploy total debt.a
TD/ME; TD/(TD+ME)
H5 UK firms have long-run or total debtto total equity target ratios from whichthey deviate in the short run. In theadjustment process mature (young)firms employ retained earnings ratherthan total debt (book equity).
TD/TE; TD/(TD+TE)b
Notes: This table presents the hypotheses tested for UK firms in the 10 industries. Inaddition to total gearing ratios (i.e. long-term plus short-term debt in the numeratorand denominator), we also tested the equivalent hypotheses employing the long-termgearing ratios (i.e. long-term debt in the numerator and denominator).
a This is more of a restriction than a deliberate choice. Firms can influence but notcontrol market values of equity and hence when (total) debt andmarket equity divergebeyond a certain threshold, the only option firms have to reach the target ratio is toreduce or increase borrowing.
b To distinguish between the adjustment speed coefficients of retained earnings andbook equity, we decompose these ratios into TD/(RE+BE) and TD/(TD+RE+BE)respectively.
Table 2Mean and interval of variation for selected financial ratios.
Industry SD/TD RE/BE ME/BE Meanmarket cap(£m)
Mean(%)
Lo–Hi(%)
Mean(%)
Lo–Hi(%)
Mean(times)
Lo–Hi(times)
Extraction 31 22–35 64 6–143 1.5 0.33–2.5 1393Construction 29 12–40 62 10–90 1.2 0.5–2.04 196Engineering 30 8–36 73 −2–92 1.8 0.8–3.16 120Textiles 30 10–44 18 1.6–64 1.1 0.44–2.15 56Biotech 30 8–44 76 9.2–146 2.7 1.6–6.6 108Leisure 28 11–37 68 10.3–142 1.9 0.8–3.86 193Retail 23 11–35 62 20–123 1.3 0.76–2.7 1764Utilities 20 0–44 68 18–180 1.3 0.66–2.37 603Real estate 26 0–40 70 0–127 0.8 0.55–1.1 512Info. tech 29 2–47 80 −21–191 3.6 0.83–7.22 211
Notes: This table presents the mean and the lowest and highest values for the short-term debt to total debt (SD/TD), accumulated retained earnings to book value of equity(RE/BE), andmarket-to-book ratios (ME/BE). These ratios show the relative importanceof short-term debt and retained earnings as a source of funds whereas the market tobook ratio may be interpreted as a measure of growth opportunities. The mean marketcapitalisation is useful as a measure of the size of typical firms in the different industriesof this study.
210 J. Tucker, E. Stoja / International Review of Financial Analysis 20 (2011) 207–214
In the discussion above, the evidence supporting both the peckingorder and trade-off theories was presented. Further, Beattie et al.(2006) argue that whilst the fundamental approach to financing maybe based on the pecking order theory, the firm's short-term financingdecision may be determined by trade-off theory drivers, thoughSogorb-Mira and Lopez-Gracia (2003) find little evidence to supportthis for Spanish firms. In this study we argue that although boththeories have merit individually, considered together they explainfirm financing behaviour more comprehensively in two different timeframes and in a particular sequence. Consistent with Beattie et al.(2006), we propose that whilst the fundamental approach tofinancing for UK firms may be based on trade-off theory, theirshort-term financing decisions may be driven by pecking order theoryconsiderations. Table 3 presents the hypotheses of this study. Ourcentral hypothesis, H1, is that UK quoted firms have target capitalstructure ratios to which they adjust in the long runwhilst in the shortrun they deviate from these target ratios and that in the adjustmentprocess firms employ the securities with the lowest adverse selectioncosts. The supporting economic hypotheses, H2 to H5, enable us to bemore precise concerning the definition of gearing ratio targeted andthe source of finance employed in the adjustment process.
4 Cointegration analysis requires that variables be integrated of the same order. TheAugmented Dickey–Fuller (ADF) and Philip–Perron (PP) unit root tests reveal thateach gearing ratio component for each of the ten industries is integrated of order one(I(1)). For efficiency of presentation we do not report the results. They are availableupon request.
4. The cointegration methodology
The hypotheses are tested by a methodology which seeks todetermine whether the numerator and denominator of a given capitalstructure ratio are cointegrated. The intuition is straightforward: if,say, the debt-to-asset ratio is targeted, then debt and assets cannot(indefinitely) diverge from each other beyond a certain threshold. Thisimplies that debt and assets are tied together by common stochastictrends and hence will be cointegrated. This approach parallels thatemployed by Marsh and Merton (1987) who argued that US firmsmaintain a dividend-price ratio towards which they continually adjust,and that such behaviour implies that prices and dividends arecointegrated. Applying this reasoning to the gearing issue enables theoccurrence of targeting behaviour to be tested. In the field of gearing,Francis and Leachman (1994) employ the Johansenmethodology to testwhether there exists an equilibrium relationship between the gearingratio and its determinants and find an equilibrium relationship and thusan aggregate optimal gearing ratio. In this paper we employ a morecomprehensive cointegration and error correction mechanism (ECM)analysis to a wide range of gearing ratios whilst correcting for someshortcomings inherent in earlier studies. The Johansen (1991) maxi-
mum likelihood estimators test for the presence of multiple cointegrat-ing vectors is described below.4
For the n-variable first-order VAR given by xt=A1xt−1+εt aftersubtracting xt−1 from each side we obtain:
Δxt = A1−Ið Þxt−1 + εtΔxt = πxt−1 + εt
where xt and εt are (n×1) vectors;A1 is an (n×n)matrix of parameters;I is an (n×n) identity matrix; and π is defined to be (A1− I). The modelis easily modified to allow for the presence of a drift term and/or a timetrend as well as a higher-order autoregressive process. In this system,the vector xt contains the time series of gearing ratio components, i.e.debt and equity or debt and assets. Thus, in this case xt and εt are (2×1)vectors.
The rank of π equals the number of cointegrating vectors. Thenumber of distinct cointegrating vectors can be obtained by checkingthe significance of the characteristic roots of π. The test for the number
211J. Tucker, E. Stoja / International Review of Financial Analysis 20 (2011) 207–214
of the characteristic roots that are significantly different from unitycan be constructed using the following two test statistics:
λtraceðrÞ = −T ∑n
i= r+1ln 1−λ
^i
� �ð1Þ
λmaxðr; r + 1Þ = −T ln 1−λ^r+1
� �ð2Þ
where λ^ i are the estimated values of the characteristic roots (oreigenvalues) obtained from the estimated π matrix. The first statistictests the null hypothesis that the number of distinct cointegratingvectors is less than or equal to r against a general alternative, thusλtrace=0 when all λ^ i = 0. The further the estimated characteristicroots are from zero, the larger the λtrace statistic. The second statistictests the null hypothesis that the number of the cointegrating vectorsis r against the alternative of r+1 cointegrating vectors. Again, if theestimated value of the characteristic root is close to zero, λmax will besmall. Although asymptotically the statistics have a χ2 distributionwith (n− r) degrees of freedom, the critical values depend on thenumber of nonstationary components under the null hypothesis (i.e.n−r) and the form of the vector A0 (i.e. the presence or not of the driftand time trend terms). An advantage of this approach is that it allowssimultaneous estimation of the cointegrating vector β and adjustmentspeed coefficients a as a function of π (π=aβ′).
A principal feature of cointegrated variables is that their time pathsare influencedby the extent of any deviation from long-runequilibrium.After all, if the system is to return to the long-run equilibrium, themovements of at least some of the variables must respond to themagnitude of the disequilibrium. Thus, the short-term dynamics mustbe influenced by the deviation from the long-run relationship. Thedynamic model implied is one of error correction whereby the short-term dynamics of the variables in the system is influenced by thedeviation from equilibrium. A simple, two-variable ECM could bespecified:
Δx1t = α1 x1;t−1−βx2;t−1
� �+ ε1t ð3Þ
Δx2t = −α2 x1;t−1−βx2;t−1
� �+ ε2t ð4Þ
where at least one of the adjustment speed coefficients α1 and α2
must be non-zero, otherwise a cointegrating relationship would notexist.5 The two terms ε1t and ε2t are white noise that may becorrelated. More recently, the error correction framework has beenemployed by Lemmon et al. (2008) whilst Bhamra et al. (2010) andHackbarth et al. (2006) present costly adjustment models that canaccount for the dynamic relation between gearing and macroeco-nomic characteristics.
The industry-optimal gearing ratio targeting hypothesis, H1, istested by means of cointegration analysis tests: we test the nullhypothesis that gearing ratio components i.e. the numerator (debt)and denominator (equity or assets) are not cointegrated against thealternative that these ratio components are cointegrated. If the nullhypothesis of no cointegration is rejected in favour of the alternative,this implies adjustment of gearing ratio components to correct thedeviation from the long-run equilibrium representing the target ratio.Therefore, if gearing ratio components are found to adjust to eliminate
5 From the estimated adjustment speed coefficients we compute also the half-life,i.e. the time required by the process to return halfway to the equilibrium state after ashock which is given by t = lnð0:5Þ�
αi i=1, 2 (see, for example, Leary & Roberts, 2005).However, since we are more interested in the relative magnitude of the adjustmentspeed coefficients, we do not report the half-life estimates. They are available uponrequest.
any deviation that has occurred in the past, then this is interpreted asevidence in favour of the optimal gearing ratio targeting hypothesis.The rationale here is that adjusting one gearing ratio component inrelation to the other is an expensive process and would be irrationalunless managers believed the adjustment would benefit their firmin the long-run given macroeconomic, industry and firm-specificconditions.
Wealsomodel thedynamicsof theadjustmentprocess byestimatingthe ECM. This modelling exercise enables us to consider the occurrence,or otherwise, of a hierarchy of financing when firms correct the devi-ation from target. For example, we decompose the TD/TE ratio into TD/(BE+RE) employing the accounting identity total equity=book valueof equity+accumulated retained earnings. If the adjustment speedcoefficients of the ECM suggest that when the actual ratio deviates fromthe target, it is the retained earnings which close the majority of thedeviation from the target, followed by total debt, then this mightindicate a standard pecking order effect. Further, to check the con-sistency of the ECM results, in addition to the TD/(BE+RE) ratio, we alsoexamine the adjustment speed coefficients of the D/(BE+RE), TD/BEand D/BE ratios. If the adjustment speed coefficients suggest thatretained earnings close the majority of the deviation from the target,followed by debt, then this again might indicate a standard peckingorder effect. Similarly, in the case of (T)D/BE ratios, if (total) debt closesthemajority of the deviation from the target, whilst book equity closes asmaller part of the deviation, then this also might indicate a standardpecking order effect. However, since firms adjust their gearing ratios tothe long-run ratio, this should override any pecking order effect andprovide evidence in favour of the trade-off theory.
5. Testing for the occurrence of targeting behaviour
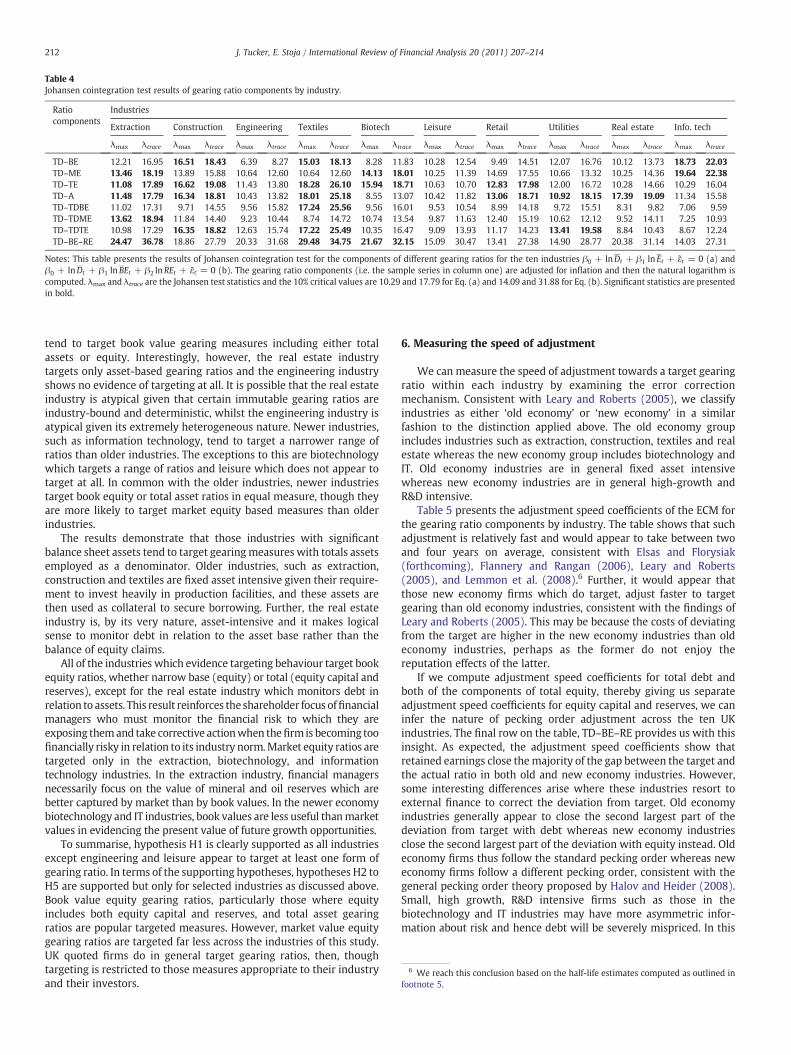
Table 4 presents the results of the Johansen cointegration analysisto test whether firms across the 10 industries target different gearingratios. In the table significant statistics, that is, incidences where thehypothesis of no cointegration is rejected, are presented in bold,thereby indicating which ratios are targeted by firms in a givenindustry.
The results show that: whilst targeting behaviour occurs in themajority of industries, the precise gearing ratio targeted variesmarkedly; gearing measures which include total assets are the mostpopular; measures which include total equity (including reserves)appear to be more widely employed than those which include baseequity alone or those which include the market value of equity.Clearly, gearing ratios including the book value of equity alone, that is,issued share capital, do not adequately capture financial risk for mostUK firms. Evidently, the ‘equity cushion’ enjoyed by debt holders is afar broader concept, and should include accumulated retainedearnings and other reserves, hence the greater popularity of thetotal equity gearing ratios. The popularity of the total debt to totalasset ratio emphasises the importance of the balance sheet to financialmanagers in two respects: firstly, accounting assets are an importantconsideration in their own right as a stock concept of productive andworking capital assets giving rise to the continuity of the firm; andsecondly, financial managers are clearly mindful of the balance sheetequation whereby shareholders are residual claimants on the firm'stotal assets after other claims such as debt have been settled. Finally,given the ‘forward-looking’ nature of market equity, it is somewhatsurprising that gearing ratios containing market value equity are nottargeted more across the industries studied. Perhaps firms simplyprefer book measures, as the fluctuation of market measures renderstheir practical use as metrics in strategic financial planningproblematic.
Further insights are gained by examining which industries tend totarget their gearing ratios. In general, it is evident that ‘old industry’firms are more prone to targeting than ‘new industry’ firms. Olderindustries such as the extraction, construction and textiles industries
6 We reach this conclusion based on the half-life estimates computed as outlined infootnote 5.
Table 4Johansen cointegration test results of gearing ratio components by industry.
Ratiocomponents
Industries
Extraction Construction Engineering Textiles Biotech Leisure Retail Utilities Real estate Info. tech
λmax λtrace λmax λtrace λmax λtrace λmax λtrace λmax λtrace λmax λtrace λmax λtrace λmax λtrace λmax λtrace λmax λtrace
TD–BE 12.21 16.95 16.51 18.43 6.39 8.27 15.03 18.13 8.28 11.83 10.28 12.54 9.49 14.51 12.07 16.76 10.12 13.73 18.73 22.03TD–ME 13.46 18.19 13.89 15.88 10.64 12.60 10.64 12.60 14.13 18.01 10.25 11.39 14.69 17.55 10.66 13.32 10.25 14.36 19.64 22.38TD–TE 11.08 17.89 16.62 19.08 11.43 13.80 18.28 26.10 15.94 18.71 10.63 10.70 12.83 17.98 12.00 16.72 10.28 14.66 10.29 16.04TD–A 11.48 17.79 16.34 18.81 10.43 13.82 18.01 25.18 8.55 13.07 10.42 11.82 13.06 18.71 10.92 18.15 17.39 19.09 11.34 15.58TD–TDBE 11.02 17.31 9.71 14.55 9.56 15.82 17.24 25.56 9.56 16.01 9.53 10.54 8.99 14.18 9.72 15.51 8.31 9.82 7.06 9.59TD–TDME 13.62 18.94 11.84 14.40 9.23 10.44 8.74 14.72 10.74 13.54 9.87 11.63 12.40 15.19 10.62 12.12 9.52 14.11 7.25 10.93TD–TDTE 10.98 17.29 16.35 18.82 12.63 15.74 17.22 25.49 10.35 16.47 9.09 13.93 11.17 14.23 13.41 19.58 8.84 10.43 8.67 12.24TD–BE–RE 24.47 36.78 18.86 27.79 20.33 31.68 29.48 34.75 21.67 32.15 15.09 30.47 13.41 27.38 14.90 28.77 20.38 31.14 14.03 27.31
Notes: This table presents the results of Johansen cointegration test for the components of different gearing ratios for the ten industries β0 + lnDt + β1 ln Et + ε̃t = 0 (a) andβ0 + lnDt + β1 ln BEt + β2 lnREt + ε̃t = 0 (b). The gearing ratio components (i.e. the sample series in column one) are adjusted for inflation and then the natural logarithm iscomputed. λmax and λtrace are the Johansen test statistics and the 10% critical values are 10.29 and 17.79 for Eq. (a) and 14.09 and 31.88 for Eq. (b). Significant statistics are presentedin bold.
212 J. Tucker, E. Stoja / International Review of Financial Analysis 20 (2011) 207–214
tend to target book value gearing measures including either totalassets or equity. Interestingly, however, the real estate industrytargets only asset-based gearing ratios and the engineering industryshows no evidence of targeting at all. It is possible that the real estateindustry is atypical given that certain immutable gearing ratios areindustry-bound and deterministic, whilst the engineering industry isatypical given its extremely heterogeneous nature. Newer industries,such as information technology, tend to target a narrower range ofratios than older industries. The exceptions to this are biotechnologywhich targets a range of ratios and leisure which does not appear totarget at all. In common with the older industries, newer industriestarget book equity or total asset ratios in equal measure, though theyare more likely to target market equity based measures than olderindustries.
The results demonstrate that those industries with significantbalance sheet assets tend to target gearingmeasures with totals assetsemployed as a denominator. Older industries, such as extraction,construction and textiles are fixed asset intensive given their require-ment to invest heavily in production facilities, and these assets arethen used as collateral to secure borrowing. Further, the real estateindustry is, by its very nature, asset-intensive and it makes logicalsense to monitor debt in relation to the asset base rather than thebalance of equity claims.
All of the industries which evidence targeting behaviour target bookequity ratios, whether narrow base (equity) or total (equity capital andreserves), except for the real estate industry which monitors debt inrelation to assets. This result reinforces the shareholder focus offinancialmanagers who must monitor the financial risk to which they areexposing themand take corrective actionwhen thefirm is becoming toofinancially risky in relation to its industry norm.Market equity ratios aretargeted only in the extraction, biotechnology, and informationtechnology industries. In the extraction industry, financial managersnecessarily focus on the value of mineral and oil reserves which arebetter captured by market than by book values. In the newer economybiotechnology and IT industries, book values are less useful thanmarketvalues in evidencing the present value of future growth opportunities.
To summarise, hypothesis H1 is clearly supported as all industriesexcept engineering and leisure appear to target at least one form ofgearing ratio. In terms of the supporting hypotheses, hypotheses H2 toH5 are supported but only for selected industries as discussed above.Book value equity gearing ratios, particularly those where equityincludes both equity capital and reserves, and total asset gearingratios are popular targeted measures. However, market value equitygearing ratios are targeted far less across the industries of this study.UK quoted firms do in general target gearing ratios, then, thoughtargeting is restricted to those measures appropriate to their industryand their investors.
6. Measuring the speed of adjustment
We can measure the speed of adjustment towards a target gearingratio within each industry by examining the error correctionmechanism. Consistent with Leary and Roberts (2005), we classifyindustries as either ‘old economy’ or ‘new economy’ in a similarfashion to the distinction applied above. The old economy groupincludes industries such as extraction, construction, textiles and realestate whereas the new economy group includes biotechnology andIT. Old economy industries are in general fixed asset intensivewhereas new economy industries are in general high-growth andR&D intensive.
Table 5 presents the adjustment speed coefficients of the ECM forthe gearing ratio components by industry. The table shows that suchadjustment is relatively fast and would appear to take between twoand four years on average, consistent with Elsas and Florysiak(forthcoming), Flannery and Rangan (2006), Leary and Roberts(2005), and Lemmon et al. (2008).6 Further, it would appear thatthose new economy firms which do target, adjust faster to targetgearing than old economy industries, consistent with the findings ofLeary and Roberts (2005). This may be because the costs of deviatingfrom the target are higher in the new economy industries than oldeconomy industries, perhaps as the former do not enjoy thereputation effects of the latter.
If we compute adjustment speed coefficients for total debt andboth of the components of total equity, thereby giving us separateadjustment speed coefficients for equity capital and reserves, we caninfer the nature of pecking order adjustment across the ten UKindustries. The final row on the table, TD–BE–RE provides us with thisinsight. As expected, the adjustment speed coefficients show thatretained earnings close themajority of the gap between the target andthe actual ratio in both old and new economy industries. However,some interesting differences arise where these industries resort toexternal finance to correct the deviation from target. Old economyindustries generally appear to close the second largest part of thedeviation from target with debt whereas new economy industriesclose the second largest part of the deviation with equity instead. Oldeconomy firms thus follow the standard pecking order whereas neweconomy firms follow a different pecking order, consistent with thegeneral pecking order theory proposed by Halov and Heider (2008).Small, high growth, R&D intensive firms such as those in thebiotechnology and IT industries may have more asymmetric infor-mation about risk and hence debt will be severely mispriced. In this
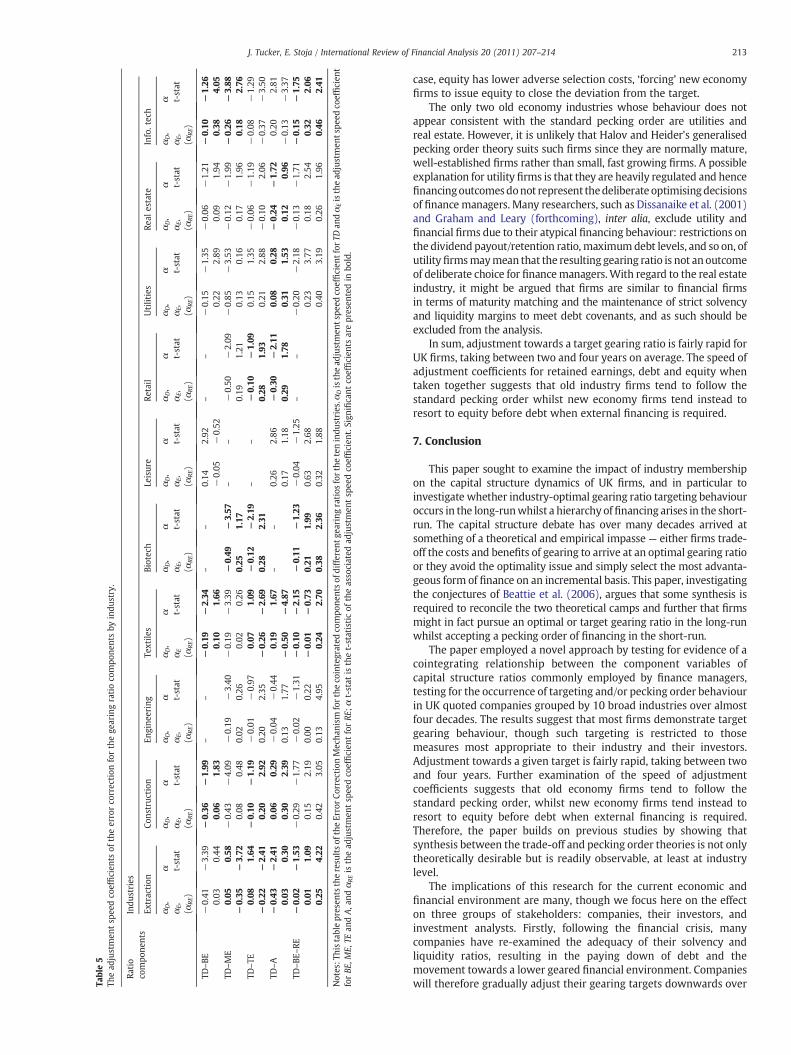
Table5
Thead
justmen
tsp
eedco
efficien
tsof
theerrorco
rrection
forthege
aringratioco
mpo
nentsby
indu
stry.
Ratio
compo
nents
Indu
stries
Extraction
Cons
truc
tion
Engine
ering
Textile
sBiotech
Leisure
Retail
Utilities
Real
estate
Info.tech
αD,
αE,
(αRE)
α t-stat
αD,
αE,
(αRE)
α t-stat
αD,
αE,
(αRE)
α t-stat
αD,
αE
(αRE)
α t-stat
αD,
αE,
(αRE)
α t-stat
αD,
αE,
(αRE)
α t-stat
αD,
αE,
(αRE)
α t-stat
αD,
αE,
(αRE)
α t-stat
αD,
αE,
(αRE)
α t-stat
αD,
αE,
(αRE)
α t-stat
TD–BE
−0.41
0.03
−3.39
0.44
−0.36
0.06
−1.99
1.83
––
−0.19
0.10
−2.34
1.66
––
0.14
−0.05
2.92
−0.52
––
−0.15
0.22
−1.35
2.89
−0.06
0.09
−1.21
1.94
−0.10
0.38
−1.26
4.05
TD–ME
0.05
−0.35
0.58
−3.72
−0.43
0.08
−4.09
0.48
−0.19
0.02
−3.40
0.26
−0.19
0.02
−3.39
0.26
−0.49
0.25
−3.57
1.17
––
−0.50
0.19
−2.09
1.21
−0.85
0.13
−3.53
0.16
−0.12
0.17
−1.99
1.96
−0.26
0.18
−3.88
2.76
TD–TE
0.08
−0.22
1.64
−2.41
−0.10
0.20
−1.19
2.92
−0.01
0.20
−0.97
2.35
0.07
−0.26
1.09
−2.69
−0.12
0.28
−2.19
2.31
––
−0.10
0.28
−1.09
1.93
0.15
0.21
1.35
2.88
−0.06
−0.10
−1.19
2.06
−0.08
−0.37
−1.29
−3.50
TD–A
−0.43
0.03
−2.41
0.30
0.06
0.30
0.29
2.39
−0.04
0.13
−0.44
1.77
0.19
−0.50
1.67
−4.87
––
0.26
0.17
2.86
1.18
−0.30
0.29
−2.11
1.78
0.08
0.31
0.28
1.53
−0.24
0.12
−1.72
0.96
0.20
−0.13
2.81
−3.37
TD–BE
–RE
−0.02
0.01
0.25
−1.53
1.09
4.22
−0.29
0.15
0.42
−1.77
2.19
3.05
−0.02
0.00
0.13
−1.31
0.22
4.95
−0.10
−0.01
0.24
−2.15
−0.73
2.70
−0.11
0.21
0.38
−1.23
1.99
2.36
−0.04
0.63
0.32
−1.25
2.68
1.88
––
−0.20
0.23
0.40
−2.18
3.77
3.19
−0.13
0.18
0.26
−1.71
2.54
1.96
−0.15
0.32
0.46
−1.75
2.06
2.41
Notes:T
histablepresen
tstheresu
ltsof
theErrorCo
rrection
Mecha
nism
fortheco
integrated
compo
nentsof
differen
tgea
ring
ratios
forthetenindu
stries.α
Disthead
justmen
tspe
edco
efficien
tfor
TDan
dαEisthead
justmen
tspe
edco
efficien
tforBE
,ME,
TEan
dA,a
ndαREis
thead
justmen
tsp
eedco
efficien
tforRE
;αt-stat
isthet-statisticof
theassociated
adjustmen
tsp
eedco
efficien
t.Sign
ificant
coefficien
tsarepresen
tedin
bold.
213J. Tucker, E. Stoja / International Review of Financial Analysis 20 (2011) 207–214
case, equity has lower adverse selection costs, ‘forcing’ new economyfirms to issue equity to close the deviation from the target.
The only two old economy industries whose behaviour does notappear consistent with the standard pecking order are utilities andreal estate. However, it is unlikely that Halov and Heider's generalisedpecking order theory suits such firms since they are normally mature,well-established firms rather than small, fast growing firms. A possibleexplanation for utility firms is that they are heavily regulated and hencefinancingoutcomesdonot represent thedeliberate optimisingdecisionsof finance managers. Many researchers, such as Dissanaike et al. (2001)and Graham and Leary (forthcoming), inter alia, exclude utility andfinancial firms due to their atypical financing behaviour: restrictions onthe dividend payout/retention ratio, maximumdebt levels, and so on, ofutility firmsmaymean that the resulting gearing ratio is not an outcomeof deliberate choice for financemanagers.With regard to the real estateindustry, it might be argued that firms are similar to financial firmsin terms of maturity matching and the maintenance of strict solvencyand liquidity margins to meet debt covenants, and as such should beexcluded from the analysis.
In sum, adjustment towards a target gearing ratio is fairly rapid forUK firms, taking between two and four years on average. The speed ofadjustment coefficients for retained earnings, debt and equity whentaken together suggests that old industry firms tend to follow thestandard pecking order whilst new economy firms tend instead toresort to equity before debt when external financing is required.
7. Conclusion
This paper sought to examine the impact of industry membershipon the capital structure dynamics of UK firms, and in particular toinvestigate whether industry-optimal gearing ratio targeting behaviouroccurs in the long-runwhilst a hierarchy offinancing arises in the short-run. The capital structure debate has over many decades arrived atsomething of a theoretical and empirical impasse — either firms trade-off the costs and benefits of gearing to arrive at an optimal gearing ratioor they avoid the optimality issue and simply select the most advanta-geous form of finance on an incremental basis. This paper, investigatingthe conjectures of Beattie et al. (2006), argues that some synthesis isrequired to reconcile the two theoretical camps and further that firmsmight in fact pursue an optimal or target gearing ratio in the long-runwhilst accepting a pecking order of financing in the short-run.
The paper employed a novel approach by testing for evidence of acointegrating relationship between the component variables ofcapital structure ratios commonly employed by finance managers,testing for the occurrence of targeting and/or pecking order behaviourin UK quoted companies grouped by 10 broad industries over almostfour decades. The results suggest that most firms demonstrate targetgearing behaviour, though such targeting is restricted to thosemeasures most appropriate to their industry and their investors.Adjustment towards a given target is fairly rapid, taking between twoand four years. Further examination of the speed of adjustmentcoefficients suggests that old economy firms tend to follow thestandard pecking order, whilst new economy firms tend instead toresort to equity before debt when external financing is required.Therefore, the paper builds on previous studies by showing thatsynthesis between the trade-off and pecking order theories is not onlytheoretically desirable but is readily observable, at least at industrylevel.
The implications of this research for the current economic andfinancial environment are many, though we focus here on the effecton three groups of stakeholders: companies, their investors, andinvestment analysts. Firstly, following the financial crisis, manycompanies have re-examined the adequacy of their solvency andliquidity ratios, resulting in the paying down of debt and themovement towards a lower geared financial environment. Companieswill therefore gradually adjust their gearing targets downwards over
214 J. Tucker, E. Stoja / International Review of Financial Analysis 20 (2011) 207–214
the subsequent two to four years, though the precise ratio adjustedand the speed of adjustment will depend on the industry concerned.Secondly, from an investor perspective, following the crisis the cost ofcorporate debt has increased markedly as banks rebuild their balancesheets through spread expansion, and debt investors remainconcerned about the risks inherent in corporate debt. At the sametime, the UK equity market has recovered well. Taken together, thisleads to lower equilibrium target gearing ratios across the industrialbase. Whilst we expect that new economy companies will adjust theirgearing ratios downwards by issuing equity when new externalfinancing is required, in the more buoyant post-crisis equity marketthere may also be a greater propensity for older economy companiesto depart from expectations and issue equity rather than debt at themargin, at least until the UK market has adjusted fully to the newbalance sheet conservatism. Thirdly, given the uncertainty during therecovery phase regarding the growth path of the economy, invest-ment analysts will revise downwards their benchmarks for acceptablecorporate financial risk in the equities that they follow, even in theface of strong cash flow recovery in many industries. On the debt side,covenant restrictions are likely to remain tight. In this new valuationparadigm, and consistent with the implications above, gearing rationorms and ranges will moderate downwards, at least until consensusexpectations regarding the longer term growth path of the economyare more stable. Extensions to this study might include an examina-tion of capital structure dynamics at firm-level, particularly as it isclear that certain industries are far from homogeneous, or a study for abank-based country where institutional influences may differ.
References
Aggarwal, R., & Kyaw, N. A. (2010). Capital structure, dividend policy and multi-nationality: Theory versus empirical evidence. International Review of FinancialAnalysis, 19(2), 140–150.
Antoniou, A., Guney, Y., & Paudyal, K. (2006). The determinants of debt maturitystructure: Evidence from France, Germany and the UK. European FinancialManagement, 12(2), 161–194.
Bhamra, H. S., Kuehn, L. A., & Strebulaev, I. A. (2010). The aggregate dynamics of capitalstructure and macroeconomic risk. Review of Financial Studies, 23(12), 4187–4241.
Bancel, F., & Mittoo, U. (2004). Cross-country determinants of capital structure choice:A survey of European firms. Financial Management, 33, 103–132.
Barclay, M., & Morellec, E. (2006). On the debt capacity of growth options. Journal ofBusiness, 79(1), 37–60.
Beattie, V., Goodacre, A., & Thomson, S. (2006). Corporate financing decisions: UKsurvey evidence. Journal of Business Finance & Accounting, 33(9&10), 1402–1434.
Bevan, A., & Danbolt, J. (2000). Capital structure and its determinants in the UK — Adecompositional analysis. Applied Financial Economics, 12(3), 159–170.
Billet, M., King, T., & Mauer, D. (2007). Growth opportunities and choice of leverage,debt maturity, and covenants. Journal of Finance, 62(2), 697–730.
Brealey, R., Myers, S., & Allen, F. (2007). Principles of corporate finance (9th Ed.). NewYork: McGraw-Hill.
Bunn, P., & Young, G. (2004). Corporate capital structure in the United Kingdom:Determinants and adjustment. Bank of England Working Paper, No. 226.
Davydenko, S. A., & Franks, J. R. (2008). Do bankruptcy codesmatter? A study of defaultsin France, Germany, and the UK. Journal of Finance, 63(2), 565–608.
Dissanaike, G., Lambrecht, B., & Saragga, A. (2001). Differentiating debt target from non-target firms: An empirical study on corporate capital structure. University ofCambridge, JIMSWorking Paper, No. 18/2001, Available on the internet at http://ssrn.com/abstract=293103
Elsas, R., Florysiak, D. (forthcoming). Heterogeneity in the speed of adjustment towardstarget leverage. International Review of Finance.
Engle, R., & Granger, C. (1987). Co-integration and error correction: Representation,estimation and testing. Econometrica, 55(2), 251–276.
Ergungor, O. E. (2004). Market- vs. bank-based financial systems: Do rights andregulations really matter? Journal of Banking and Finance, 28(12), 2869–2887.
Fama, E. F., & French, K. R. (2002). Testing tradeoff and pecking order predictions aboutdividends and debt. Review of Financial Studies, 15(1), 1–33.
Fischer, E., Zechner, J., & Heinkel, R. (1989). Dynamic capital structure choice: Theoryand tests. Journal of Finance, 44(1), 19–40.
Flannery, M. J., & Rangan, K. P. (2006). Partial adjustment toward target capitalstructures. Journal of Financial Economics, 79(3), 469–506.
Francis, B., & Leachman, L. (1994). A time-series approach to exploring aggregateoptimal capital structure: Cointegration analysis. Applied Financial Economics, 4(1),41–54.
Gaud, P., Hoesli, M., & Bender, A. (2007). Debt–equity choice in Europe. InternationalReview of Financial Analysis, 16(3), 201–222.
Goldstein, R., Ju, N., & Leland, H. (2001). An EBIT-based model of dynamic capitalstructure. Journal of Business, 74(4), 483–512.
Graham, J., Leary, M. (forthcoming). A review of empirical capital structure researchand directions for the future. Annual Review of Financial Economics, (3).
Hackbarth, D., Miao, J., & Morellec, E. (2006). Capital structure, credit risk, andmacroeconomic conditions. Journal of Financial Economics, 82(3), 519–550.
Halov, N., & Heider, F. (2008). Capital structure with asymmetric information aboutvalue and risk: Theory and empirical analysis. NYU Working Paper No. FIN-03-026.Available at http://papers.ssrn.com/sol3/papers.cfm?abstract_id=1299467
Heaton, J. B. (2002). Managerial optimism and corporate finance. Financial Management,31(2), 33–45.
Hovakimian, A., Opler, T., & Titman, S. (2001). The debt–equity choice. Journal ofFinancial and Quantitative Analysis, 36(1), 1–24.
Hui, C. H., Lo, C. F., & Huang, M. X. (2006). Are corporates' target leverage ratios time-dependent? International Review of Financial Analysis, 15(3), 220–236.
Jensen, M. (1986). The agency costs of free cash flow: Corporate finance and takeovers.Papers and Proceedings of the Ninety-Eighth Annual Meeting of the A.E.A. AmericanEconomic Review, 76 (2). (pp. 323–329).
Johansen, S. (1991). Estimation and hypothesis testing of cointegration vectors inGaussian vector autoregressive models. Econometrica, 59(6), 1551–1580.
Kayhan, A., & Titman, S. (2007). Firms' histories and their capital structures. Journal ofFinancial Economics, 83(1), 1–32.
Kim, E. (1978). A mean-variance theory of optimal capital structure and corporate debtcapacity. Journal of Finance, 33(1), 45–63.
Kim, E., Jarrell, G., & Bradley, M. (1984). On the existence of an optimal capital structure:Theory and evidence. Journal of Finance, 39(3), 857–878.
Kurshev, A., & Strebulaev, I. A. (2007). Firm size and capital structure. AFA 2008 NewOrleans Meetings Paper. Available at SSRN: http://ssrn.com/abstract=686412
Kwok, C., & Tadesse, S. (2006). National culture and financial systems. Journal ofInternational Business Studies, 37(2), 227–247.
La Porta, R., Lopez-de-Silanes, F., Shleifer, A., & Vishny, R. W. (1998). Law and finance.Journal of Political Economy, 106(6), 1113–1155.
Leary, M., & Roberts, M. (2005). Do firms rebalance their capital structure? Journal ofFinance, 60(6), 2575–2619.
Lemmon, M. L., Roberts, M. R., & Zender, J. F. (2008). Back to the beginning: Persistenceand the cross-section of corporate capital structure. Journal of Finance, 63(4),1575–1608.
Lord, R. A., & McIntyre, J. E. (2003). Leverage, imports, profitability, exchange rates,and capital investment: A panel data study of the textile and apparel industries1974–1987. International Review of Financial Analysis, 12(3), 287–310.
Marsh, T., & Merton, R. (1987). Dividend behavior for the aggregate stock market.Journal of Business, 60(1), 1–40.
Minguez-Vera, A., & Martin-Ugedo, J. F. (2007). Does ownership structure affect value?A panel data analysis for the Spanish market. International Review of FinancialAnalysis, 16(1), 81–98.
Modigliani, F., & Miller, M. (1958). The cost of capital, corporation finance and thetheory of investment. American Economic Review, 48(3), 261–297.
Myers, S. (2003). Financing of corporations. In G. M. Constantinides, M. Harris, & R.Stulz (Eds.), Handbook of the economics of finance, Volume 1, part 1. (pp. 215–253).Elsevier North-Holland.
Nachman, D., & Noe, T. H. (1994). Optimal design of securities under asymmetricinformation. Review of Financial Studies, 7(1), 1–44.
Ozkan, A. (2001). Determinants of capital structure and adjustment to long run target:Evidence from UK company panel data. Journal of Business Finance & Accounting,28(1&2), 175–198.
Philosophov, L. V., & Philosophov, V. L. (2005). Optimization of a firm's capital structure:A quantitative approach based on a probabilistic prognosis of risk and time ofbankruptcy. International Review of Financial Analysis, 14(2), 191–209.
Rampini, A. A., & Viswanathan, S. (2010). Collateral, risk management, and thedistribution of debt capacity. Journal of Finance, 65(6), 2293–2322.
Rauh, J. D., & Sufi, A. (2010). Capital structure and debt structure. Review of FinancialStudies, 23(12), 4242–4280.
Shyam-Sunder, L., & Myers, S. (1999). Testing static tradeoff against pecking ordermodels of capital structure. Journal of Financial Economics, 51(2), 219–244.
Sogorb-Mira, F., & Lopez-Gracia, J. (2003). Pecking order versus trade-off: An empiricalapproach to the small and medium enterprise capital structure. Available on theinternet at http://ssrn.com/abstract=393160
Stiglitz, J. E. (1973). Taxation, corporate financial policy and the cost of capital. Journalof Public Economics, 2(1), 1–34.
Welch, I. (2011). Two Common problems in capital structure research: The financialdebt-to-asset ratio, and issuing activity vs. leverage changes. International Review ofFinance, 11(1), 1–17.
World Federation of Exchanges (2010). Annual Report and Statistics 2009.Zingales, L., & Rajan, R. (1995). What do we know about capital structure? Some
evidence from international data. Journal of Finance, 50(5), 1421–1460.