industry cluster using cluster analysis to support industry...
TRANSCRIPT

INDUSTRY CLUSTER USING CLUSTER ANALYSIS TO SUPPORT
INDUSTRY CLUSTER POLICY OF THAILAND
Kanogkan Leerojanaprapa Komn Bhundarak Kittiwat Sirikasemsuk
Department of Statistics Thammasat Business School Department of Industrial Engineering
King Mongkut's Institute of
Technology Ladkrabang (KMITL)
Thammasat University
Bangkok, Thailand, 10200
King Mongkut's Institute of
Technology Ladkrabang (KMITL)
Bangkok, Thailand, 10520 [email protected] Bangkok, Thailand, 10520
[email protected] [email protected]
KEYWORDS
k-Means, Cluster analysis, Industry cluster.
ABSTRACT
This research implies clustering into three clusters for
five industries by means of k-Means clustering method.
Agro-processing, textiles and clothing, petrochemicals
and chemicals, electronics and telecommunications
equipment and automotive and parts are selected for
this study as they are main target promoting industries
for Thailand. There were 23,628 firms in this study.
From this study, we can identify different patterns of
demanded resources in three different groups. One
cluster required low level of resourced demands for all
variables while the other two clusters required capital
and manpower interchangeable between high and
medium level. Only the electronics and
telecommunications equipment sector showed high to
medium demand for all variables. After all firms were
divided into three clusters, we were able to define
cluster regions by provinces, for particular types of
clusters in order to evaluate the potential of each region
and also define supporting policy for those firms to
meet their demands following the regional economic
development strategy.
INTRODUCTION
An industry cluster is defined broadly as a cluster of
firms that are related economics actors and located
near one another to gain competitive and productive
advantages (Sureephong and Chakpitak 2007).
Industrial policy generally determines for the future
development by considering national development
policies such as new motorway or new high speed
trains through various areas. Different areas, such as a
province, have been assigned as target areas under
policies that lead to further growth. However, the policy
makers may face limits of their understanding of the
composition the cluster is and how to identify industry
clusters in order to build economic development
strategies around them. Therefore, cluster analysis can
help to define a region’s economic strength and to
shape the regional economic future (Cortright 2006).
The regional economic development challenges are to
identify and to inspire common economic strategies, for
government, to shape the region’s economic future and
to harmonize with national development policies. The
key policy success is to launch suitable policies for their
region. Furthermore, the definition of a cluster is often
seen in relation to the Boundaries of Governance Unit,
but this is less important than the Boundaries of
Economic Activities (Bennett 1997). As a result, a
conflict of interest, between central agencies and local
authorities to support different types of firms, may
arise. Therefore, cluster analysis is a suitable tool for
policy makers for three reasons (Cortright 2006):
1. To understand and improve the performance
of regional economies,
2. To identify groups of firms, rather than
individual firms, and
3. To build the unique strengths of particular
regions, to develop different strategies for
different clusters.
Furthermore, the concept of business or industry
clusters is important: Porter (1998) presented the
cluster concept to support the competition in three
ways: increasing production efficiency of cluster firms,
encouraging innovation in competition and
encouraging new businesses in the industry.
The Thai government announced policies for industrial
development, in the form of Cluster and Super Clusters,
to follow the idea of leading entrepreneurs in the right
direction; their policies led to the budget support or
regulations for the target area. Business groups with
geographic concentrations will be connected to each
other in the relevant clusters. The integration aims to
increase productivity and enhance competitiveness at
the national and global level. Also, this integration is
important in the perspective of strategic plans for
industrial management in each group.
Communications of the ECMS, Volume 33, Issue 1, Proceedings, ©ECMS Mauro Iacono, Francesco Palmieri, Marco Gribaudo, Massimo Ficco (Editors) ISBN: 978-3-937436-65-4/978-3-937436-66-1(CD) ISSN 2522-2414
An example of the success of cluster policy in
Thailand, is the special economic development zone
policy to promote the integration of investment clusters
consistent with the potential of various areas. The
Office of the Board of Investment (BOI) is a
government agency, under the office of the Prime
Minister. Its core roles are to promote valuable
investment in Thailand and overseas, including
implementation of the Cluster and Super Clusters
policy, to create investment concentration in
accordance with regional potential and to strengthen
value chains (The Office of the Board of Investment
(BOI) 2018). However, some policies may not suitable
for all firms in all industries. The abilities and
characters of firms in particular areas are different. If
we can cluster firms with similar levels of resource
requirements, they can guide suitable policies, to meet
their demands, which can enhance their potential
efficiently.
In this regard, we aimed to cluster Thai industrial firms
with statistical techniques so as to understand the
pattern of the cluster by considering their different
demands for production resources. In the remainder of
this paper: Section 2 is a brief overview of the
literature. In Section 3, we introduce our material and
methods. Section 4 shows the results of the analysis,
before concluding and discussing further research.
LITERATURE REVIEW
Industry cluster research focuses on four areas (Smith
2003): 1) Workforce Development 2) Education 3)
Economic Development and 4) Industry. Roelandt &
Hertog (1999) proposed a cluster methodology
framework that was implemented in organizing
industry policy, based on research using four concepts:
1) Input-output analysis, by studying trade links
between industry groups in value chains,
2) Graph analysis, using graph theory to define
the connection of the network or industry
group,
3) Correspondence analysis consists of various
techniques such as factor analysis, Principal
Component Analysis (PCA), aiming to define
groups or classify factories or industries with
similar patterns and
4) Qualitative case study by implementing the
Porter framework in studies in several
countries.
This study implements the third group to classify
industry clusters in Thailand. Therefore the next
section will focus on literature applying correspondence
analysis.
Nagy & Ormos (2018) introduced the financial market
implied industry classification standard, with a spectral
clustering based quantitative methodology, to overcome
the main drawback of current standards leading from
qualitative classification techniques. They employed
The Financial Market Implied Classification (FMIC)
based on daily closing prices between 01/01/2007 and
01/03/2017. They showed that comparing market
implied clusters with global industry classification
provided better statistical results.
Zhu et al. (2010), with questionnaires from 334
respondents, analyzed the industry cluster from the
concept of Circular Economy (CE) to examine
Environmentally oriented Supply Chain Cooperation
(ESCC) to classify industrial manufacturers in China.
They used multivariate analysis of variance
(MANOVA) among the four identified types of Chinese
manufacturers, varying in environmental-oriented
supply chain cooperation, to highlight the importance
of intensifying cooperation with upstream and
downstream supply chain partners for a CE initiative to
succeed.
Arvanitis & Hollenstein (1998) used Swiss data to
group similar firms into innovation types based on a
cluster analysis of nine innovation indicators and 17
knowledge sources. Their study yielded five innovation
types, which have been characterized by additional
structural properties (e.g. firm size) and factors relevant
for innovation (e.g. market conditions). They started
with factor analysis to define four factors and then
applied PCA, which led to a grouping of the firms in
terms of innovation indicators into five categories.
Their analysis had an overall R2 = 0.56, i.e. a good fit
of data to the underlying cluster model.
Kuo et al. (2002) compared cluster analysis methods for
market segmentation with methods based on Self-
organizing feature maps and k-Means methods. They
compared a conventional two-stage method with a new
two-stage method through the simulated data. Their
simulation showed that their scheme was better than
the conventional two-stage method based on the rate of
misclassification by using simulated data based on t-test
and ANOVA.
MATERIAL AND METHODS
Data
This research defined five target industries: agro-
processing, textiles and clothing, petrochemicals and
chemicals, electronics and telecommunications
equipment, and automotive and parts. These five
industries are currently the major Thai industries and
also part of the cluster and super cluster government
policy. Secondary data were acquired from the Thai
Department of Industrial Works, to which registered
companies submitted their essential data and obtained
business approvals. Data from individual registered
firms were used for the cluster analysis completed by
five focused Thai industries, distinguished by their
Thailand Standard Industrial Classification (TSIC)
code (Employment Promotion Division: Department of
Employment 2009).
Variables
The defined variables are related to the demanded
resources in the production for general industries as 10
variables. All variables are recorded and collected by
the Thai Department of Industrial Works. According to
the limitations of available recorded data, seven
variables are used here: Horsepower (HP), Land Capital
(CAPLAND), Building Capital (CAPBUID),
Machinery Capital (CAPMACH), Working Capital
(CAPWORK), Skilled Worker (Total Skill), and Total
Worker (Total Worker).
k-Means
k-Means is a well-known cluster analysis technique
which is an unsupervised learning technique. Given a
set of observations (x1, x2, …, xn), where each
observation is a d-dimensional real vector, k-Means
clustering aims to partition the n observations
into k (≤ n) so the objective of k-Means is to minimize
the within-cluster sum of squares (WCSS)
(i.e. variance) or to minimize total intra-cluster
variance, Equation (1).
2
( )
1 1
k nj
i j
j i
x c
(1)
where:
k is number of cluster,
n is number of cases,
cj is centroid for cluster j,
xi is case ith
j = 1, 2, 3, …, k
i = 1, 2, 3, …, n.
Because the total variance is constant, this is equivalent
to maximizing the sum of squared deviations between
points in different clusters (between-cluster sum of
squares, BCSS), which follows from the law of total
variance.
The k-Means algorithm is proposed of following steps,
(1) Define k points into the space represented
by the objects that are being clustered. The k-points
represent initial group of centroids.
(2) Assign each object the group that has the
closest centroid according to the Euclidean distance
function.
(3) After the assignment of centroids to each
object, recalculate the positions of the k centroids:
1
jn
ij
ij
j
x
cn
(2)
(4) Repeat steps 2 and 3 until the centroids no
longer move. This produces a separation of the objects
into groups of the objects into groups from which the
metric to be minimized can be calculated.
Since k-Means is unsupervised model, we employ the
unsupervised evaluation so that it does not rely on
external information. In this paper we evaluate the
k-Means results of industry clustering by considering
the p-value of F-test from ANOVA by comparing with
inter-cluster (within cluster sum of squares) and intra-
cluster (between cluster sum of squares) variances to
decide whether the results were good enough.
The algorithm is extremely sensitive to the initial
randomly selected cluster centers. The k-Means
algorithm can be run iteratively to minimize this effect.
Furthermore, SPSS software is selected for analyzing
data of this research.
RESULTS
Current Firm Distribution in Thailand
Data for registered firms, distributed around the 77
provinces in Thailand, is divided into five regions:
Northern, Northeastern, Central, Eastern and Southern
area. Figure 1 shows density of firms represented by
color for all five industries. It shows that the major
firms are in Central Thailand. Agro-processing is the
major industry, 13,851 firms in a total of 23,628 firms.
As figures 1(a) and (b) show the distribution of agro-
processing industries is similar to the distribution of all
industries.
Agro-processing firms are mainly concentrated in the
Bangkok Metropolitan Region (BMR), which covers
five provinces (Samutprakarn, Patumthani,
Samutsakorn, Nakornpatom and Nonthaburi), with
high density and also in the northeastern region (e.g.
Nakhon Ratchasima and Ubon Ratchathani) and the
northern region (e.g. Chiang Mai and Chiang Rai).
Textiles and clothing firms are mainly located in the
BMR and Tak province. Petrochemical and chemical
firms are mainly found in the BMR and Ratchaburi,
Chiang Mai and Surat Thani provinces. Electronics
and telecommunications equipment firms are mainly
found in the BMR and Ratchaburi, Samut Prakan and
Ayuttaya Provinces. Automotive and parts firms are
found in the BMR, Samut Prakan, Pathum Thani and
Ratchaburi Provinces.

(a) All five industries (b) Agro-processing
(c) Textiles and Clothing (d) Petrochemicals and Chemicals
(e) Electronics and telecom-
munications equipment
(f) Automotive and parts
Figures 1: Current Firms Distribution
Results of k-Means Cluster Analysis
We defined three clusters for k-Means cluster analysis
in order to classify firms into three groups of demanded
resources into three levels: high, medium, and low
groups. Results of analysis for particular industries are
presented in table 1 and table 2.
Agro-processing Industry
Most agro-processing firms are clustered in Cluster 2
which had negative mean of standardized (z) scores of
all resourced variables, i.e. less than average required
resources. Furthermore, there are similar number of
firms in the other two clusters which are 184 firms and
158 firms respectively. The characteristics of Cluster 1
show high and positive mean z scores for both capital
variables (CAPLAND, CAPBUID and CAPMACH).
Cluster 3 shows high and positive mean z score for
number of skilled and total workers, 2.177 and 3.228
i.e. values of those variables are significantly greater
than the overall mean ~2.177 and 3.228 . In addition,
HP for Cluster 1 and Cluster 3 showed similar mean z
scores.
Textile and Clothing sector
In the textile and apparel sector, most firms are in
Cluster 3 (4,643 of 5,019 firms) with the lowest and
negative mean z scores for all resourced variables.
Firms in Cluster 1 spend the highest amounts of
investment and horsepower, while Cluster 2 contains
the least number of firms, but they use the highest labor
resources. The mean z score for number of skilled
workers and total workers of Cluster 2 are the highest
compared to other factors, 3.557 and 3.390.
Petrochemicals and Chemicals
Most firms in the petrochemicals and chemicals
industry were established in Cluster 1 and followed by
Cluster 2 and Cluster 3. Cluster 1 contains 571 firms
with the lowest mean z score for all resourced variables.
Only 2 firms are assigned in Cluster 3. The highest
mean z score for working capital in Cluster 3 is 7.674.
Cluster 2 contains 17 firms which spend the highest
mean z score in various factors.
Electronics and Telecommunications Equipment
Most of firms in Electronics & telecommunications
equipment sector are allocated in Cluster 3 (2,089
firms) while the least firms are assigned in Cluster 2.
The highest mean z scores of all resource and
investment variables are in Cluster 2 (18 firms). The
top two mean z scores are Building capital and
Machine capital.

Table 1: Mean z Scores for Resourced Variables for
Three Clusters of Five Industries
z score Cluster
1 2 3
Agro-processing
HP 0.606 -0.070 0.699
CAPLAND 1.345 -0.054 0.320
CAPBUID 3.197 -0.108 0.550
CAPMACH 2.088 -0.087 0.558
CAPWORK 0.536 -0.033 0.208
Total Skill 0.540 -0.080 2.177
Total Worker 0.867 -0.097 3.228
Textiles and Clothing
HP 1.849 0.209 -0.145
CAPLAND 1.062 0.272 -0.091
CAPBUID 2.140 0.726 -0.175
CAPMACH 1.697 0.209 -0.143
CAPWORK 1.077 0.427 -0.127
Total Skill 0.160 3.557 -0.155
Total Worker 0.807 3.390 -0.183
Petrochemicals and Chemicals*
HP -0.101 0.711 1.420
CAPBUID -0.069 0.254 -0.078
CAPMACH -0.083 0.661 -0.098
CAPWORK -0.086 0.070 7.674
Total Skill -0.110 1.300 -0.260
Total Worker -0.167 3.460 3.488
Electronics and Telecommunications Equipment
HP 1.055 3.376 -0.150
CAPLAND 1.547 2.855 -0.169
CAPBUID 0.685 4.168 -0.138
CAPMACH 0.647 3.864 -0.128
CAPWORK 1.126 2.725 -0.152
Total Skill 0.722 2.043 -0.130
Total Worker 1.136 3.650 -0.172
Automotive and Parts
HP 0.871 -0.179 4.464
CAPLAND 0.077 -0.048 0.934
CAPBUID 0.213 -0.072 1.135
CAPMACH 0.348 -0.097 1.562
CAPWORK 0.568 -0.099 0.988
Total Skill 1.355 -0.148 0.886
Total Worker 1.824 -0.194 1.797
* only 5 factors were used for this model
Automotive and Parts
Most firms in Automotive and parts sector established
in Cluster 2 (1,780 firms) and followed by Cluster 1
(109 firms) and Cluster 3 (32 firms) respectively. Mean
scores of all resourced variables in Cluster 2 are the
lowest. Whereas the highest mean z scores of
horsepower and capital variables are in Cluster 3, the
mean z scores of two worker variables are on Cluster 1.
The highest mean z score of all variables is 4.464 of
horsepower in Cluster 3.
Table 2: Number of Firms Represented by Cluster and
Type of Industry
Cluster
Agro
-
pro
cess
ing
Tex
tile
s an
d
clo
thin
g
Petr
och
em
ica
ls
an
d c
hem
ica
ls
Ele
ctr
on
ics
an
d
tele
co
mm
un
ica
tio
ns
eq
uip
men
t
Au
tom
oti
ve
an
d p
arts
1 184 236 571 140 109
2 13,509 140 17 18 1,780
3 158 4,643 2 2,089 32
Total 13,851 5,019 590 2,247 1,921
Average Distance from Centroid
Computing centroids of each cluster are essential for
center-based clustering in k-Means analysis. The
average of all objects in each cluster is represented as
the centroid. In these results, the average distance
between centroid of each cluster in particular industries
are shown in Table 3.
Table 3: Distances between Cluster Centroids
Cluster Cluster
1 2 3
Agro-processing
1 4.434 4.332
2 4.434 4.216
3 4.332 4.216
Textiles and Clothing
1 5.115 4.072
2 5.115 5.296
3 4.072 5.296
Petrochemicals and Chemicals
1 4.061 8.712
2 4.061 7.838
3 8.712 7.838
Electronics and telecommunications equipment
1 6.340 3.121
2 6.340 9.146
3 3.121 9.146
Automotive and parts
1 2.858 4.045
2 2.858 5.739
3 4.045 5.739

Table 4: ANOVA
Factors ANOVA
Df 1 Df 2 F P-value
Agro-processing
HP 2 13,848 994.669 0.000
CAPLAND 2 13,848 1,829.923 0.000
CAPBUID 2 13,848 9,033.274 0.000
CAPMACH 2 13,848 5,247.654 0.000
CAPWORK 2 13,848 1,082.858 0.000
Total Skill 2 13,848 4,784.224 0.000
Total Worker 2 13,848 8,790.757 0.000
Textiles and Clothing
HP 2 5016 1,243.658 0.000
CAPLAND 2 5016 622.476 0.000
CAPBUID 2 5016 1,909.216 0.000
CAPMACH 2 5016 1,709.992 0.000
CAPWORK 2 5016 834.731 0.000
Total Skill 2 5016 4,051.716 0.000
Total Worker 2 5016 3,182.784 0.000
Petrochemicals and& Chemicals*
HP 2 587 46.563 0.000
CAPBUID 2 587 37.737 0.000
CAPMACH 2 587 27.301 0.000
CAPWORK 2 587 1,241.612 0.000
Total Skill 2 587 200.751 0.000
Total Worker 2 587 763.812 0.000
Electronics and& Telecommunications Equipment
HP 2 2,244 640.378 0.000
CAPLAND 2 2,244 680.216 0.000
CAPBUID 2 2,244 1,743.421 0.000
CAPMACH 2 2,244 1,383.371 0.000
CAPWORK 2 2,244 569.258 0.000
Total Skill 2 2,244 436.677 0.000
Total Worker 2 2,244 1,001.742 0.000
Automotive & Parts
HP 2 1,918 2,528.218 0.000
CAPLAND 2 1,918 225.367 0.000
CAPBUID 2 1,918 327.219 0.000
CAPMACH 2 1,918 514.801 0.000
CAPWORK 2 1,918 205.950 0.000
Total Skill 2 1,918 543.099 0.000
Total Worker 2 1,918 1,073.262 0.000
CONCLUSIONS AND FURTHER RESEARCH
This paper summarizes the different patterns of
spending demanded resources into 3 clusters of firms
by using k-Means technique as shown in Table 5. When
we know requirements of particular clusters, we can
specify suitable resources needed for production.
Therefore, policy makers can provide suitable policy to
meet their demands in particular clusters.
Table 5: Summary Industry Patterns from Cluster
Analysis
Industry Cluster 1 Cluster 2 Cluster 3
Agro-processing High demand
of investment
Low
horsepower,
demand of
investment, and
manpower
High
horsepower
and manpower
Textiles and
Clothing
High
horsepower
and demand
of investment
High
manpower
Low
horsepower,
demand of
investment,
and manpower
Petrochemicals
and Chemicals
Low
horsepower,
demand of
investment,
and
manpower
High demand
of machinery
capital, and
manpower
(Skilled
workers)
High
horsepower,
demand of
working
capital, and
manpower
(total workers)
Electronics and
telecommunications
equipment
Moderate
horsepower,
demand of
investment,
and
manpower
High
horsepower,
demand of
investment, and
manpower
Low
horsepower,
demand of
investment,
and manpower
Automotive and
parts
High
manpower
Low
horsepower,
demand of
investment, and
manpower
High
horsepower
and demand of
investment
This research presents one of the usefulness of defining
patterns for particular clusters in each industry by
k-Means analysis. The further analysis can define
clusters by provinces in order to represent potential of
particular provinces by considering the regional
clusters. According to the results of analysis above,
there are many firms required low level of resources, so
all available resources in the region should be sufficient
to support their production. However, a few firms
require high level of resources; we need to provide the
special supports for potential firms. For example, some
clusters required general workers but another requires
skilled workers so this can help to decide for setting a
skilled labor development center for particular regions.
We believe that classify provinces as regional cluster by
considering only number of firms without consider the
other factors such as level of resource demands may
lead to the difficulty because potential firms can be
overlooked.
In addition, we can compare between significant
provinces, which are defined by current demanded
resources in particular clusters, and the target provinces
determined by Thailand policy such as the Cluster and
Super Cluster Policy or the S-curve policy. The results
of the comparison can help the policy makers to
identify provinces that comply with the policy,
provinces that need to be promoted to achieve their
goals, and provinces that can reduce benefit supports.
ACKNOWLEDGMENTS
This research was supported by Faculty of Science,
King Mongkut’s Institute of Technology Ladkrabang
[No. 2560 01 05 018]. We thank the Department of
Industrial Works, Thailand, for providing helpful
datasets.
REFERENCES
Arvanitis, Spyros, and Heinz Hollenstein. 1998. “Innovative
Activity and Firm Characteristics - A Cluster Analysis
with Firm-Level Data of Swiss Manufacturing.” Pp. 1–28
in 25th Annual Conference of the European Association
for Research in Industrial Economics.
Bennett, Robert J. 1997. “Administrative Systems and
Economic Spaces.” Regional Studies 31(3):323–36.
Retrieved April 11, 2019
(http://www.tandfonline.com/doi/abs/10.1080/003434097
50134728).
Cortright, Joseph. 2006. Making Sense of Clusters: Regional
Competitiveness and Economic Development.
Employment Promotion Division: Department of
Employment. 2009. Thailand Standard Industrial
Classification TSCI 2009.
Kuo, R. J., L. M. Ho, and C. M. Hu. 2002. “Cluster Analysis
in Industrial Market Segmentation through Artificial
Neural Network.” Computers & Industrial Engineering
42(2):391–99.
Michael E. Porter. 1998. “Clusters and the New Economics
of Competition.” Harvard Business Review 76(6):77–90.
Retrieved April 11, 2019
(https://hbr.org/1998/11/clusters-and-the-new-economics-
of-competition).
Nagy, Laszlo, and Mihaly Ormos. 2018. “Review Of Global
Industry Classification.” Pp. 66–73 in. Retrieved
February 28, 2019 (http://www.scs-
europe.net/dlib/2018/ecms2018acceptedpapers/0066_fes_
ecms2018_0840.pdf).
Roelandt, J. A. Theo, and Pim den Hertog. 1999. “Cluster
Analysis and Cluster-Based Policy Making in OECD
Countries: An Introduction to the Theme.” in Boosting
Innovation the Cluster Approach: The Cluster Approach,
edited by Organisation for Economic Co-Operation and
Development (OECD).
Smith, Rachel V. 2003. “Industry Cluster Analysis: Inspiring
a Common Strategy for Community Development.” P.
296 in Central Pennsylvania Workforce Development
Corporation Report.
Sureephong, P., and N. Chakpitak. 2007. “Knowledge
Management System Architecture for the Industry
Cluster.” in Industrial Engineering and Engineering
Management. Retrieved March 14, 2016
(http://ieeexplore.ieee.org/xpls/abs_all.jsp?arnumber=441
9536).
The Office of the Board of Investment (BOI). 2018. “What
We DO.” Retrieved
(https://www.boi.go.th/index.php?page=what_we_do2).
Zhu, Qinghua, Yong Geng, and Kee-hung Lai. 2010.
“Circular Economy Practices among Chinese
Manufacturers Varying in Environmental-Oriented
Supply Chain Cooperation and the Performance
Implications.” Journal of Environmental Management
91(6):1324–31.
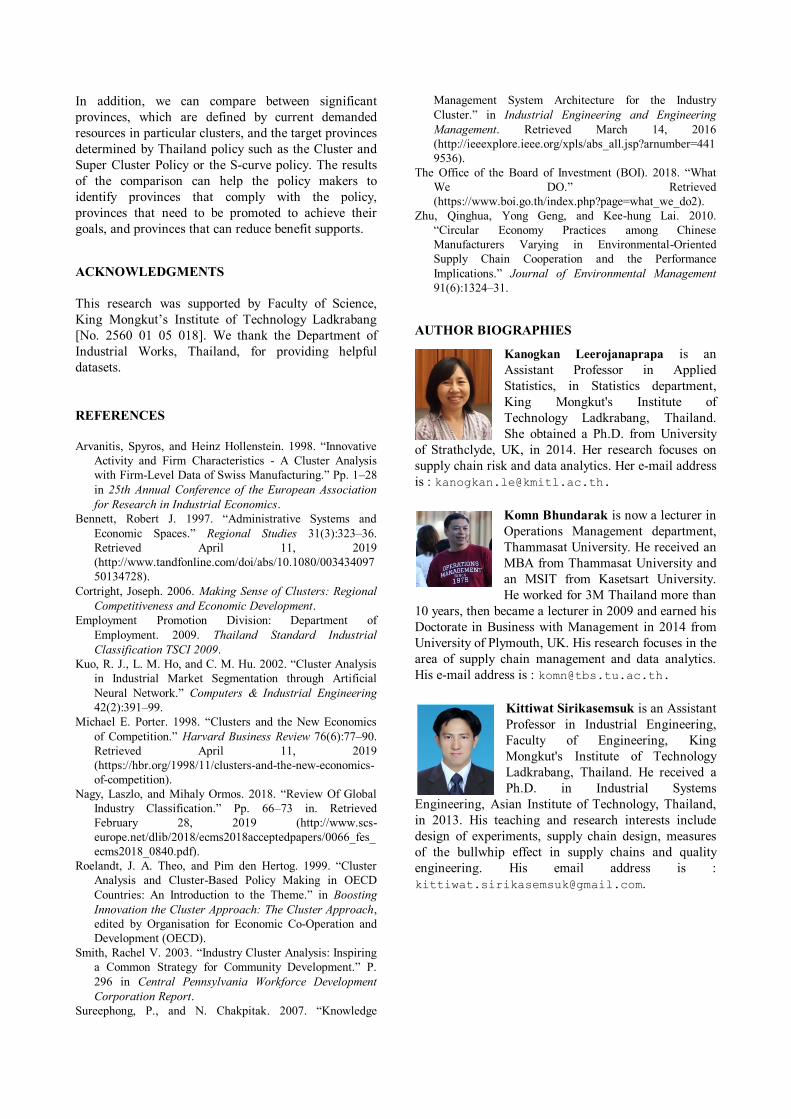
AUTHOR BIOGRAPHIES
Kanogkan Leerojanaprapa is an
Assistant Professor in Applied
Statistics, in Statistics department,
King Mongkut's Institute of
Technology Ladkrabang, Thailand.
She obtained a Ph.D. from University
of Strathclyde, UK, in 2014. Her research focuses on
supply chain risk and data analytics. Her e-mail address
is : [email protected].
Komn Bhundarak is now a lecturer in
Operations Management department,
Thammasat University. He received an
MBA from Thammasat University and
an MSIT from Kasetsart University.
He worked for 3M Thailand more than
10 years, then became a lecturer in 2009 and earned his
Doctorate in Business with Management in 2014 from
University of Plymouth, UK. His research focuses in the
area of supply chain management and data analytics.
His e-mail address is : [email protected].
Kittiwat Sirikasemsuk is an Assistant
Professor in Industrial Engineering,
Faculty of Engineering, King
Mongkut's Institute of Technology
Ladkrabang, Thailand. He received a
Ph.D. in Industrial Systems
Engineering, Asian Institute of Technology, Thailand,
in 2013. His teaching and research interests include
design of experiments, supply chain design, measures
of the bullwhip effect in supply chains and quality
engineering. His email address is :