indoor air quality in ice skating rinks in hong kong
TRANSCRIPT

Environmental Research 94 (2004) 327–335
ARTICLE IN PRESS
�Corresp
E-mail a
0013-9351/0
doi:10.1016
Indoor air quality in ice skating rinks in Hong Kong
H. Guo, S.C. Lee,� and L.Y. Chan
Department of Civil and Structural Engineering, Research Centre for Urban Environmental Technology and Management,
The Hong Kong Polytechnic University, Hung Hom, Kowloon, Hong Kong
Received 17 February 2003; received in revised form 13 May 2003; accepted 27 May 2003
Abstract
Indoor air quality in ice skating rinks has become a public concern due to the use of propane- or gasoline-powered ice resurfacers
and edgers. In this study, the indoor air quality in three ice rinks with different volumes and resurfacer power sources (propane and
gasoline) was monitored during usual operating hours. The measurements included continuous recording of carbon monoxide (CO),
carbon dioxide (CO2), total volatile organic compounds (TVOC), particulate matter with a diameter less than 2.5 mm (PM2.5),
particulate matter with diameter less than 10 mm (PM10), nitric oxide (NO), nitrogen dioxide (NO2), nitrogen oxide (NOx), and
sulfur dioxide (SO2). The average CO, CO2, and TVOC concentrations ranged from 3190 to 6749 mg/m3, 851 to 1329 ppm, and 550
to 765mg/m3, respectively. The average NO and NO2 concentrations ranged from 69 to 1006mg/m3 and 58 to 242mg/m3,
respectively. The highest CO and TVOC levels were observed in the ice rink which a gasoline-fueled resurfacer was used. The
highest NO and NO2 levels were recorded in the ice rink with propane-fueled ice resurfacers. The air quality parameters of PM2.5,
PM10, and SO2 were fully acceptable in these ice rinks according to HKIAQO standards. Overall, ice resurfacers with combustion
engines cause indoor air pollution in ice rinks in Hong Kong. This conclusion is similar to those of previous studies in Europe and
North America.
r 2003 Elsevier Inc. All rights reserved.
Keywords: Indoor air quality; Ice skating rink; Resurfacer; HKIAQO
1. Introduction
Indoor air quality in ice skating rinks has become apublic concern due to the use of propane- or gasoline-powered ice resurfacers and edgers. The operation of theequipment to clean and resurface the ice leads toelevated concentrations of air pollutants. The mainpollutants emitted are carbon monoxide (CO), nitrogenoxides (NOx), volatile organic compounds (VOCs), andparticulate matter (PM). High levels of CO and nitrogendioxide (NO2) have been reported in many ice skatingrinks (Anderson, 1971; Berglund et al., 1994; Brauer andSpengler, 1994; Brauer et al., 1997; Lee et al., 1994;Levesque et al., 1990; Levy et al., 1998; Pennanen et al.,1997a, b; Yoon et al., 1996). In general, propane-powered ice resurfacers emit more NOx and less CO,VOCs, and particles than gasoline-powered resurfacers(Clarck, 1988; Pennanen et al., 1997a).
onding author. Fax: 852-2334-6389.
ddress: [email protected] (S.C. Lee).
3/$ - see front matter r 2003 Elsevier Inc. All rights reserved.
/S0013-9351(03)00116-6
Studies of indoor air quality in ice skating rinks havebeen conducted in North America and Europeancountries, where ice skating activities are popular(Brauer and Spengler, 1994; Pennanen et al., 1997a;Rosenlund and Bluhm, 1999; Yoon et al., 1996). Brauerand Spengler (1994) reported that 1-week average NO2
concentrations above 1000 ppb were measured in 10%of 70 northeastern US rinks. The median NO2 levelinside rinks was 180 ppb, more than 10 times higher thanthe median outdoor concentration. Indoor NO2 con-centrations in 19 enclosed ice skating rinks weremeasured by Levy et al. (1998). Rinks in whichpropane-fueled resurfacers were used had a daily meanindoor NO2 concentration of 206 ppb, compared with132 ppb for gasoline-fueled and 37 ppb for electric-powered resurfacers. In Scandinavian countries, Penna-nen and colleagues (1997a) characterized air quality infive Finnish indoor ice arenas and reported that thehighest 1-h average CO and NO2 concentrations rangedfrom 17 to 29 ppm and 0.14 to 3.96 ppm, respectively.The 3-h total VOC concentrations ranged from 150 to1200 mg/m3. Scientists from Sweden identified that the
ARTICLE IN PRESS
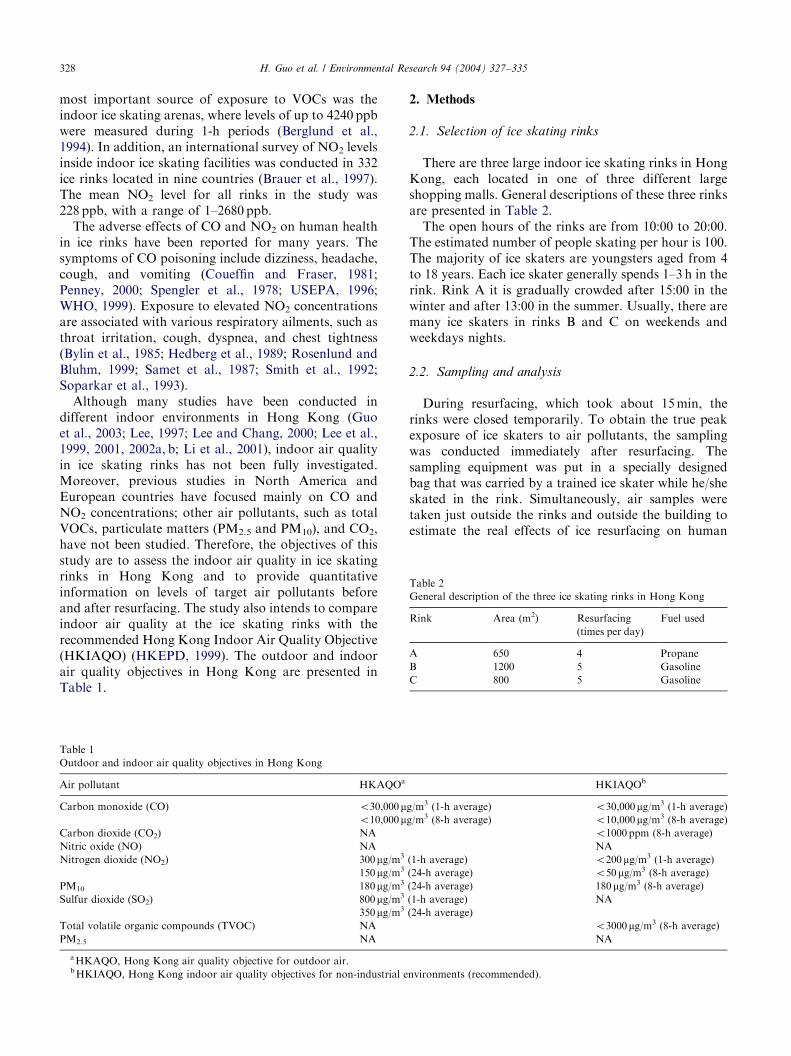
Table 2
General description of the three ice skating rinks in Hong Kong
Rink Area (m2) Resurfacing
(times per day)
Fuel used
A 650 4 Propane
B 1200 5 Gasoline
C 800 5 Gasoline
H. Guo et al. / Environmental Research 94 (2004) 327–335328
most important source of exposure to VOCs was theindoor ice skating arenas, where levels of up to 4240 ppbwere measured during 1-h periods (Berglund et al.,1994). In addition, an international survey of NO2 levelsinside indoor ice skating facilities was conducted in 332ice rinks located in nine countries (Brauer et al., 1997).The mean NO2 level for all rinks in the study was228 ppb, with a range of 1–2680 ppb.
The adverse effects of CO and NO2 on human healthin ice rinks have been reported for many years. Thesymptoms of CO poisoning include dizziness, headache,cough, and vomiting (Coueffin and Fraser, 1981;Penney, 2000; Spengler et al., 1978; USEPA, 1996;WHO, 1999). Exposure to elevated NO2 concentrationsare associated with various respiratory ailments, such asthroat irritation, cough, dyspnea, and chest tightness(Bylin et al., 1985; Hedberg et al., 1989; Rosenlund andBluhm, 1999; Samet et al., 1987; Smith et al., 1992;Soparkar et al., 1993).
Although many studies have been conducted indifferent indoor environments in Hong Kong (Guoet al., 2003; Lee, 1997; Lee and Chang, 2000; Lee et al.,1999, 2001, 2002a, b; Li et al., 2001), indoor air qualityin ice skating rinks has not been fully investigated.Moreover, previous studies in North America andEuropean countries have focused mainly on CO andNO2 concentrations; other air pollutants, such as totalVOCs, particulate matters (PM2.5 and PM10), and CO2,have not been studied. Therefore, the objectives of thisstudy are to assess the indoor air quality in ice skatingrinks in Hong Kong and to provide quantitativeinformation on levels of target air pollutants beforeand after resurfacing. The study also intends to compareindoor air quality at the ice skating rinks with therecommended Hong Kong Indoor Air Quality Objective(HKIAQO) (HKEPD, 1999). The outdoor and indoorair quality objectives in Hong Kong are presented inTable 1.
Table 1
Outdoor and indoor air quality objectives in Hong Kong
Air pollutant HKAQOa
Carbon monoxide (CO) o30,000mo10,000m
Carbon dioxide (CO2) NA
Nitric oxide (NO) NA
Nitrogen dioxide (NO2) 300mg/m3
150mg/m3
PM10 180mg/m3
Sulfur dioxide (SO2) 800mg/m3
350mg/m3
Total volatile organic compounds (TVOC) NA
PM2.5 NA
aHKAQO, Hong Kong air quality objective for outdoor air.bHKIAQO, Hong Kong indoor air quality objectives for non-industrial e
2. Methods
2.1. Selection of ice skating rinks
There are three large indoor ice skating rinks in HongKong, each located in one of three different largeshopping malls. General descriptions of these three rinksare presented in Table 2.
The open hours of the rinks are from 10:00 to 20:00.The estimated number of people skating per hour is 100.The majority of ice skaters are youngsters aged from 4to 18 years. Each ice skater generally spends 1–3 h in therink. Rink A it is gradually crowded after 15:00 in thewinter and after 13:00 in the summer. Usually, there aremany ice skaters in rinks B and C on weekends andweekdays nights.
2.2. Sampling and analysis
During resurfacing, which took about 15min, therinks were closed temporarily. To obtain the true peakexposure of ice skaters to air pollutants, the samplingwas conducted immediately after resurfacing. Thesampling equipment was put in a specially designedbag that was carried by a trained ice skater while he/sheskated in the rink. Simultaneously, air samples weretaken just outside the rinks and outside the building toestimate the real effects of ice resurfacing on human
HKIAQOb
g/m3 (1-h average) o30,000mg/m3 (1-h average)
g/m3 (8-h average) o10,000mg/m3 (8-h average)
o1000 ppm (8-h average)
NA
(1-h average) o200mg/m3 (1-h average)
(24-h average) o50 mg/m3 (8-h average)
(24-h average) 180mg/m3 (8-h average)
(1-h average) NA
(24-h average)
o3000mg/m3 (8-h average)
NA
nvironments (recommended).

ARTICLE IN PRESSH. Guo et al. / Environmental Research 94 (2004) 327–335 329
health. Since resurfacing was conducted 4–5 times perday, two to three sets of samples were collected each dayto reflect the effects of ice resurfacing.
The air pollutants investigated included CO, carbondioxide (CO2), nitric oxide (NO), NO2, NOx, totalvolatile organic compounds (TVOCs), sulfur dioxide(SO2), particulate matters 2.5 (PM2.5, aerodynamicdiameter o2.5 mm), and particulate matters 10 (PM10,aerodynamic diameter o10 mm). Relative humidity(RH) and temperature were also recorded in the iceskating rinks. Although the major source of particulatematters was the ice resurfacer and the ice resurfacer isknown to generate particles less than 10 mm in aero-dynamic diameter, PM10 were still measured in thisstudy. This is due to the fact that in the HKIAQO thereis a recommended standard for PM10 in indoorenvironments. We wanted to determine whether thePM10 concentrations in the rinks abided the HKIAQOstandard.
A portable Q-Trak monitor (Model 8551, TSI Inc.,St. Paul, MN, USA) was used to monitor the indoor andoutdoor CO and CO2 concentrations, RH, and tem-perature. Two Dust-Trak air monitors (Model 8520,TSI Inc.) were used to measure PM2.5 and PM10
concentrations in indoor and outdoor air. The dustmonitors measured PM2.5 and PM10 at 30-s intervalsat a flow rate of 1.7 L/min. A ppbRAE monitor (ModelPGM 7240, RAE Systems, Sunyvale, CA, USA) wasused to measure TVOC concentrations. All sampleswere taken beginning at 15min before ice resurfacingand stopping at 60min after resurfacing. The samples ofNO, NO2, NOx, CO, and SO2 were collected during thetarget sampling periods. The sampled air was drawninto 12-L Tedlar bags by a portable air pump (ModelHFS-513A, Gillian Ltd.) for 15min before, during, andafter ice resurfacing. A short exposure time was adoptedbecause it corresponded to the relevant exposure timeof an ice skater during training.
After sampling, the air bags were shipped to thelaboratory for analysis. CO was measured with aThermo Electron Gas Filter Correlation CO AmbientAnalyzer (Model 48, Thermo Environmental Instru-ments Inc., Franklin, MA, USA). NO–NO2–NOx wasanalyzed with a Chemiluminescence NO–NO2–NOx
Analyzer (Model 42, Thermo Environmental Instru-ments Inc.). SO2 was measured with a Pulsed Fluores-cence SO2 analyzer (Model 43B, Thermo EnvironmentalInstruments Inc.).
2.3. Quality assurance and quality control
Before sampling, the Q-Trak was calibrated withstandard CO2 gas at a known concentration. Pre- andpostzero checks of the Dust-Trak monitors were carriedout. Before each measurement, the Dust-Trak wasrezeroed. The Dust-Trak is an optical instrument that
detects particles in the air matrix by optical scattering,using the optical diameter instead of the aerodynamicdiameter. Therefore, a separate calibration was carriedout to convert the Dust-Trak data into correspondingconcentrations obtained by the gravimetric method.Details for calibration can be found in our previouspublications (Lee et al., 2001, 2002a, b; Li et al., 2001).The ppbRAE TVOC monitor was calibrated using acalibration gas (isobutylene) with a known concentra-tion of 10 ppm supplied by the manufacturer.
Prior to sampling, the air bags used for sampling wereflushed with zero air at least five times. The cleaned airbags were then filled with zero air and analyzed by thegas instruments to ensure that they were clean. Aftersampling, the air bags were put into a large black plasticbag to avoid exposure to sunlight and transported to thelaboratory for analysis within 1 h.
3. Results and discussion
3.1. CO and CO2 concentrations
Temporal variations of CO and CO2 inside the threeice skating rinks were measured and are presented inFig. 1. Continuous measurements showed that the COlevels inside the rinks were closely associated with theuse of combustion-powered resurfacers. It was foundthat the CO concentrations increased due to engineemissions and then declined due to the mixing andexchange of air by the ventilation system. Whenresurfacing was started, the CO concentration in rinkA increased from a background level of 2286 to amaximum concentration of 5714 mg/m3. When resurfa-cing was completed, the CO level fell to 2286 mg/m3 after60min. In rink B, the CO concentration sharplyincreased from 2286 to 16,000 mg/m3 and then fell to3429 m/m3 60min after resurfacing. The CO concentra-tion in rink C increased from 3429 to 8000 mg/m3 duringresurfacing and then decreased to 2286 mg/m3 afterresurfacing. The percentages of CO increase in rinks Band C were much higher than that in rink A. This wasdue to the gasoline-fueled resurfacers used in rink B andC and the propane-fueled resurfacer used in rink A.
The CO2 concentrations in the three rinks were almostconstant, indicating that ice resurfacing did not sub-stantially affect the levels of CO2 in the rinks.
3.2. NO and NO2 concentrations
The levels of NO and NO2 in the three rinks arepresented in Fig. 2. The measurements were conductedbefore, during, and after resurfacing. The samplingduration was 15min, as this is the time needed forresurfacing. We found that the concentrations of NOand NO2 significantly increased in rink A while

ARTICLE IN PRESS
0
200
400
600
800
1000
1200
NO
con
cent
ratio
n (µ
g/m
3 )N
O2
conc
entr
atio
n (µ
g/m
3 )
Before resurfacing
During resurfacing
After resurfacing
0
50
100
150
200
250
300
Rink A Rink B Rink C
Rink A Rink B Rink C
Before resurfacing
During resurfacing
After resurfacing
Fig. 2. Indoor levels of NO and NO2 in the three rinks.
Rink A
0100020003000400050006000
0 30 60 90 120
Time (min)
0 30 60 90 120
Time (min)
0 30 60 90 120
Time (min)
Con
cent
ratio
n
CO2 (ppm)
CO (µg/m3)
CO2 (ppm)
CO (µg/m3)Rink B
0
5000
10000
15000
20000
Con
cent
ratio
n
CO2 (ppm)
CO (µg/m3)Rink C
0
2000
4000
6000
8000
10000
Con
cent
ratio
n
Fig. 1. Continuous measurements of CO and CO2 inside the ice
skating rinks; and the duration of each resurfacing was about 15min.
H. Guo et al. / Environmental Research 94 (2004) 327–335330
resurfacing occurred. The levels of NO and NO2 in rinksB and C, however, rose only slightly during resurfacing.The NO concentration in rink A was 1006 mg/m3 duringresurfacing, which was more than 13 times the pre-resurfacing level. However, the NO levels in rinks B andC during resurfacing were only 1.65 and 1.32 times,respectively, pre-resurfacing levels. Similarly, the aver-age NO2 concentration in rink A during resurfacing was242 mg/m3, 2.4 times that before resurfacing. In rinks Band C, however, the NO2 levels were relatively stablebefore and during resurfacing.
The concentrations of NO and NO2 in rink A were 7.3and 4.2 times, respectively, those in rink B and 11 and3.9 times, respectively those in rink C. The higher NOand NO2 concentrations in rink A compared to those inthe other rinks were due to the difference in engineemissions in rink A and gasoline fuel in (propane fuelrinks B and C). This result is consistent with those ofprevious studies (Clarck, 1988; Pennanen et al., 1997a).The average NO2 concentration in rink A duringresurfacing exceeded the HKIAQO standard of200 mg/m3 (1-h average), and in rinks B and C the levelsof NO2 were below the standard. (In general, the resultsobtained in this study were compared to the 1-h averageObjectives; if this was not applicable, the pollutantconcentrations were compared to the 8-h averageObjectives.)
There were several factors that affected the actuallevels of CO and NO2 in the rinks, such as the type offuel used by the resurfacers, resurfacing frequency,volume and air exchange rates of the rinks, and otheremission sources. NO2 levels inside the rinks were alsoaffected by the rate of formation of NO2 from NO(Brauer et al., 1997; Pennanen et al., 1997a).
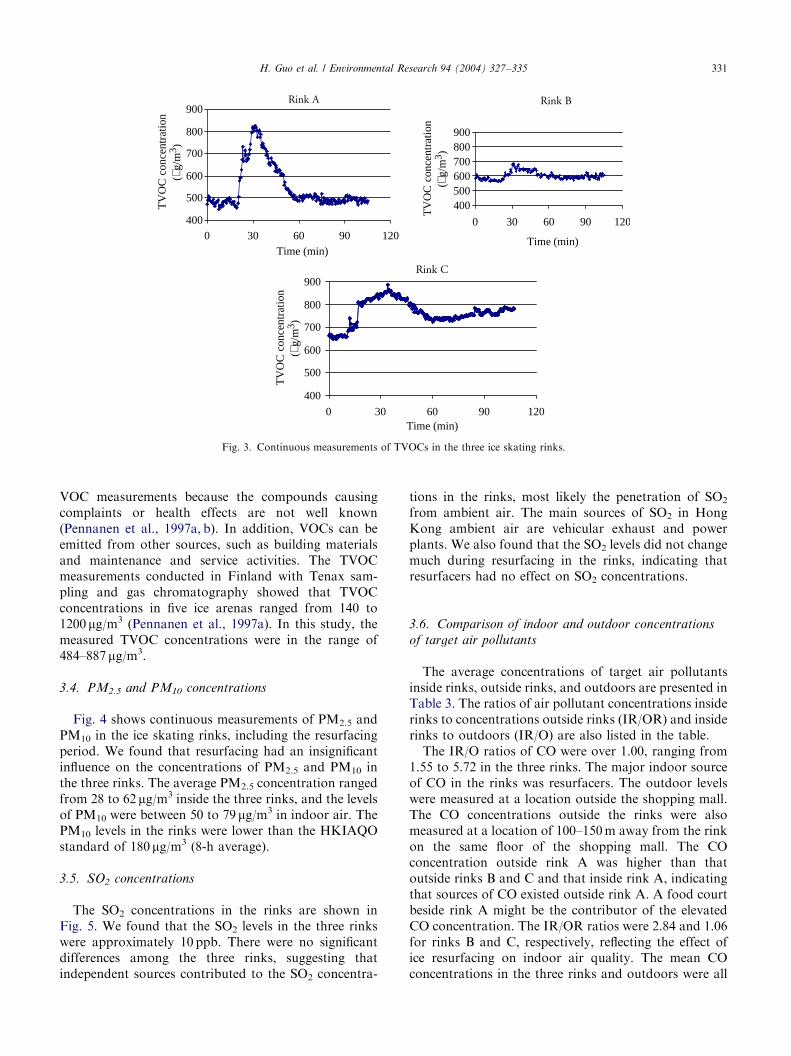
3.3. TVOC concentrations
The TVOC concentrations in the three rinks werecontinuously monitored and the temporal changes areshown in Fig. 3.
In rink A, the TVOC concentration increased fromabout 484 mg/m3 to a maximum value of 827 mg/m3
during resurfacing and then decreased to 500 mg/m3
30min after resurfacing. The increase in the rate ofTVOCs due to resurfacing was 71%. The TVOCconcentration in rink B started at around 560 mg/m3
and increased to 682 mg/m3 during resurfacing, fallingto 600 mg/m3 afterword, an increase of TVOCs duringresurfacing of 22%. The TVOC concentration in rink Cincreased from 660 to 887 mg/m3 during resurfacing anincrease of 34%, and then fell to 740 mg/m3 30min afterresurfacing. The results indicate that resurfacing sig-nificantly affected the TVOC levels inside the rinks.
It is difficult to compare the results obtained bydifferent studies due to the differences in sampling andanalytical methods. It is even more difficult to interpret
ARTICLE IN PRESS
Rink A
400
500
600
700
800
900
Time (min)
Rink B
Rink C
400500600700800900
0 30 60 90 1200 30 60 90 120
0 30 60 90 120
Time (min)
400
500
600
700
800
900
Time (min)
TV
OC
con
cent
ratio
n (µ
g/m
3 )
TV
OC
con
cent
ratio
n (µ
g/m
3 )
TV
OC
con
cent
ratio
n (µ
g/m
3 )Fig. 3. Continuous measurements of TVOCs in the three ice skating rinks.
H. Guo et al. / Environmental Research 94 (2004) 327–335 331
VOC measurements because the compounds causingcomplaints or health effects are not well known(Pennanen et al., 1997a, b). In addition, VOCs can beemitted from other sources, such as building materialsand maintenance and service activities. The TVOCmeasurements conducted in Finland with Tenax sam-pling and gas chromatography showed that TVOCconcentrations in five ice arenas ranged from 140 to1200 mg/m3 (Pennanen et al., 1997a). In this study, themeasured TVOC concentrations were in the range of484–887 mg/m3.
3.4. PM2.5 and PM10 concentrations
Fig. 4 shows continuous measurements of PM2.5 andPM10 in the ice skating rinks, including the resurfacingperiod. We found that resurfacing had an insignificantinfluence on the concentrations of PM2.5 and PM10 inthe three rinks. The average PM2.5 concentration rangedfrom 28 to 62 mg/m3 inside the three rinks, and the levelsof PM10 were between 50 to 79 mg/m3 in indoor air. ThePM10 levels in the rinks were lower than the HKIAQOstandard of 180 mg/m3 (8-h average).
3.5. SO2 concentrations
The SO2 concentrations in the rinks are shown inFig. 5. We found that the SO2 levels in the three rinkswere approximately 10 ppb. There were no significantdifferences among the three rinks, suggesting thatindependent sources contributed to the SO2 concentra-
tions in the rinks, most likely the penetration of SO2
from ambient air. The main sources of SO2 in HongKong ambient air are vehicular exhaust and powerplants. We also found that the SO2 levels did not changemuch during resurfacing in the rinks, indicating thatresurfacers had no effect on SO2 concentrations.
3.6. Comparison of indoor and outdoor concentrations
of target air pollutants
The average concentrations of target air pollutantsinside rinks, outside rinks, and outdoors are presented inTable 3. The ratios of air pollutant concentrations insiderinks to concentrations outside rinks (IR/OR) and insiderinks to outdoors (IR/O) are also listed in the table.
The IR/O ratios of CO were over 1.00, ranging from1.55 to 5.72 in the three rinks. The major indoor sourceof CO in the rinks was resurfacers. The outdoor levelswere measured at a location outside the shopping mall.The CO concentrations outside the rinks were alsomeasured at a location of 100–150m away from the rinkon the same floor of the shopping mall. The COconcentration outside rink A was higher than thatoutside rinks B and C and that inside rink A, indicatingthat sources of CO existed outside rink A. A food courtbeside rink A might be the contributor of the elevatedCO concentration. The IR/OR ratios were 2.84 and 1.06for rinks B and C, respectively, reflecting the effect ofice resurfacing on indoor air quality. The mean COconcentrations in the three rinks and outdoors were all

ARTICLE IN PRESS
Rink A
0
20
40
60
80
100
0 30 60 90 120Time (min)
0 30 60 90 120Time (min)
0 30 60 90 120Time (min)
0 30 60 90 120Time (min)
0 30 60 90 120
Time (min)
0 30 60 90 120Time (min)
Con
cent
ratio
n (µ
g/m
3 )
PM-2.5 Rink A
Rink C Rink C
Rink B Rink B
0
20
40
60
80
100
120
0
20
40
60
80
100
120
Con
cent
ratio
n (µ
g/m
3 )C
once
ntra
tion
(µg/
m3 )
Con
cent
ratio
n (µ
g/m
3 )
Con
cent
ratio
n (µ
g/m
3 )
Con
cent
ratio
n (µ
g/m
3 )
PM-10
PM2.5 PM-10
PM-2.5
0
20
40
60
80
100
0
20
40
60
80
100
0
20
40
60
80
100
PM-10
Fig. 4. Continuous measurements of PM2.5 and PM10 in the three ice skating rinks.
0
2
4
6
8
10
12
14
16
Rink A Rink B Rink C
SO2
conc
entr
atio
n(pp
b)
Before resurfacing
During resurfacing
After resurfacing
Fig. 5. SO2 concentrations in the three ice skating rinks.
H. Guo et al. / Environmental Research 94 (2004) 327–335332
below the HKIAQO and HKAQO (the standard foroutdoor air) standards of 30,000 mg/m3 (1-h average).
The average CO2 concentration in rink B was higherthan the 1000 ppm stated in the HKIAQO standard (8-haverage). Indoor CO2 levels were found to be variable.Besides the combustion of fuel by resurfacers, the highCO2 levels recorded in the rinks were attributed toovercrowding and an insufficient supply of fresh air. TheIR/O ratios were between 1.68 and 2.76.
The average PM2.5 and PM10 concentrations insidethe rinks were lower than those measured outdoors. Inoutdoor air the mean PM2.5 concentrations ranged from
97 to 134 mg/m3 and the average PM10 concentrationswere between 138 and 157 mg/m3. The increasedconcentrations of PM2.5 and PM10 were probablyrelated to the locations of the outdoor air samples andnearby heavily trafficked roads. In Hong Kong, manypublic buildings are ventilated with an MVAC system.PM2.5 and PM10 carried in ambient air are drawn intothe public buildings and are filtered through thesesystems. Air conditioner filters are used to reduce theamounts of particulate matter from entering buildings.These PM values and the use of these filtering systemslead to the conclusion that the resurfacers had littleeffects on the levels of particulate matters in the rinks.
The mean TVOC concentrations were below theHKIAQO standard inside and outside the rinks. TheTVOC concentrations inside the rinks were higher thanthose outside the rinks and in outdoor air, reflecting theinfluence of resurfaces inside the rinks. The TVOCconcentrations inside rinks B and C (gasoline-fueledresurfacer) were higher than that inside rink A(propane-fueled resurfacer). This suggests that gaso-line-fueled resurfacers generated more TVOCs than thepropane-fueled resurfacer. This result is consistent withprevious studies (Clarck, 1988; Pennanen et al., 1997a).

ARTICLE IN PRESS
Table 3
Concentration of air pollutants inside rinks, outside rinks and outdoors
Rink Inside rink Outside rink Outdoors IR/OR IR/O
CO (mg/m3) (mean7SD)
A 319071101 38417553 19487638 0.83 1.64
B 674973616 23797316 11807205 2.84 5.72
C 368971540 34667293 23797316 1.06 1.55
CO2 (ppm) (mean7SD)
A 851738 929743 506716 0.92 1.68
B 13297102 922727 482711 1.44 2.76
C 848732 744716 47979.2 1.34 1.77
PM2.5 (mg/m3) (mean7SD)
A 6277 125720 134713 0.50 0.46
B 3776 3872.2 9776.6 0.97 0.38
C 2877 2973.1 12677 0.96 0.22
PM10 (mg/m3) (mean7SD)
A 7979 159730 157716 0.50 0.50
B 50712 5075.8 13878 1.00 0.36
C 5078 4375.5 15379.1 1.16 0.33
TVOCs (mg/m3) (mean7SD)
A 550799 552732 394771 1.00 1.40
B 602726 550721 427715 1.09 1.41
C 765754 673714 641756 1.14 1.19
NO (mg/m3) (mean7SD)
A 10067655 6579 180711 15.48 5.59
B 137710 7673.3 168721 1.80 0.82
C 6976 7272.8 172715 0.96 0.40
NO2 (mg/m3) (mean7SD)
A 242737 9876.3 5172.8 2.47 4.74
B 5875 4473.5 7074.5 1.32 0.83
C 9178 6972.5 6877.3 1.32 1.34
SO2 (ppb) (mean7SD)
A 1370.7 1371.6 1572.1 1.00 0.87
B 1070.6 970.7 1371.2 1.11 0.77
C 1371.0 1370.9 1571.5 1.00 0.87
H. Guo et al. / Environmental Research 94 (2004) 327–335 333
The TVOC concentrations outside the rinks were alsohigher than those of in outdoor air, indicating theexistence of TVOC sources outside the rinks. Theelevated TVOC concentrations outside the rinks wereprobably due to the food-preparation activities of thevendors outside the three rinks while vehicular emissionsmight be the source of the TVOC concentrations in thenearby outdoors.
The average NO concentration inside rink A was415times that outside the rink A and 45 times that inthe outdoor air. However, in rinks B and C theNO concentrations inside the rinks were lower thanthose of the outdoor air. We attribute this to thecombustion of the fuel in rink A, which is consi-stent with results reported by Clarck (1988) andPennanen et al. (1997a). The average NO concent-rations of the outdoor air of the three rinks werevery similar indicating that the NO level throughout
Hong Kong is constant, likely coming from vehicularemissions.
The NO2 concentration in rink A was 242mg/m3,which was above the HKIAQO standard of 200mg/m3
and higher than that outside the rink and in the outdoorair. In rinks B and C the NO2 levels inside the rinks wereclose to these observed outside the rinks and in outdoorair, suggesting that propane-powered resurfacing gener-ated much more NOx than gasoline-powered resurfacing.
The SO2 concentrations inside the rinks, outside therinks, and in the outdoor air were very similar, indicatingthat resurfacing did not contribute to SO2 levels.
4. Conclusions
Ice resurfacers caused air pollution problems in allthree ice rinks. The main pollutants produced by ice

ARTICLE IN PRESSH. Guo et al. / Environmental Research 94 (2004) 327–335334
resurfacers were CO, NO, NO2, and TVOCs. Theconcentrations of CO, NO, NO2, and TVOCs increasedduring ice resurfacing and fell following ice resurfacing.All concentrations fell to background levels 60min afterthe cessation of ice resurfacing, except for that of NO inall three rinks and for CO that of rink B.
The inside rink concentrations of CO, CO2, TVOCs,NO and NO2 in all three rinks were higher than theconcentrations outside the rinks and outdoors. Incontrast, the PM2.5 and PM10 concentrations in outdoorair were higher than those inside and outside the rinks,likely due to the PM entitled by vehicles.
The average CO2 concentration in rink B and the NO2
concentration in rink A exceeded the HKIAQOstandard. The mean CO, TVOC, and CO2 concentra-tions in the three rinks and outdoors were all below theHKIAQO and HKAQO standards. Although occa-sional low-level exposure may not produce any im-mediate symptoms, long-term exposure could havesignificant health effects on the very young and elderly.
Some countermeasures can be taken to reduce theadverse effects of ice resurfacing such as increasingventilation at the skating rinks and checking thesesystems regularly; retuning or repairing resurfacingequipment regularly; installing a catalytic converter onresurfacing equipment; installing an oxygen sensor inresurfacing equipment to regulate fuel leanness orrichness; and decreasing the resurfacing schedule toreduce the frequency of emissions of exhaust. Over thelong term, the existing resurfacers should be replaced byelectric ice-resurfacing equipment; electric resurfacersare able to reduce and even eliminate exhaust emissions.Other advantages of electric resurfacers include reducedoperational expenses and that ventilation is not requiredduring resurfacing. However, the cost of these resurfa-cers, approximately 60% higher than that of fuelledequipment, is a barrier for many arena operators. Acompromise alternative is the use of resurfacing equip-ment powered by natural gas.
Acknowledgments
This project was financially supported by the HongKong Polytechnic University. The authors thank Mr.W.F. Tam and Mr. W.K. Kwong for their technicalassistance. We also thank the rink managers andresurfacer operators for assisting us with the samplingand providing us with information about their rinks.
References
Anderson, D.E., 1971. Problems created for ice arenas by engine
exhaust. Am. Ind. Hyg. Assoc. J. 32, 790–801.
Berglund, M., Braback, L., Bylin, G., Jonson, J.O., Vahter, M.,
1994. Personal NO2 exposure monitoring shows high exposure
among ice-skating schoolchildren. Arch. Environ. Health 49,
17–24.
Brauer, M., Spengler, J.D., 1994. Nitrogen dioxide exposures inside ice
skating rinks. Am. J. Public Health 84, 429–433.
Brauer, M., Lee, K., Spengler, J.D., Salonen, R.O., Pennanen, A.S.,
Braathen, O.A., Mihalikova, E., Miskovic, P., Nozaki, A.,
Tsuzuki, T., Song, R.-J., Yang, X., Zeng, Q.-X., Drahonovska,
H., Kj rgaard, S., 1997. Nitrogen dioxide in indoor ice skating
facilities: an international survey. J. Air Waste Manage. Assoc.
47, 1095–1102.
Bylin, G., Lindvall, T., Rehn, T., Sundin, B., 1985. Effects of short
term exposure to ambient nitrogen dioxide concentrations on
human bronchial reactivity and lung function. Eur. J. Respir. Dis.
66, 205–217.
Clarck, G.H., 1988. Industrial and Marine Fuels Reference Book.
Butterworths, London.
Coueffin, K., Fraser, S., 1981. Carbon monoxide—a problem in
enclosed ice arenas. Environ. Health Rev. 25, 64–66.
Guo, H., Lee, S.C., Li, W.M., Cao, J.J., 2003. Source characterization
of BTEX in indoor microenvironments in Hong Kong. Atmos.
Environ. 37, 73–82.
Hedberg, K., Hedberg, C.W., Iber, C., White, K.E., Osterholm, M.T.,
Jones, D.B., Flink, J.R., MacDonald, K.L., 1989. An outbreak of
nitrogen dioxide-induced respiratory illness among ice hockey
players. J. Am. Med. Assoc. 202, 3014–3017.
HKEPD (Hong Kong Environmental Protection Department). 1999.
Guideline notes for the management of indoor air quality in offices
and public places (draft). Indoor Air Quality Management Group,
HKEPD.
Lee, S.C., 1997. Comparison of indoor and outdoor air quality
at two staff quarters in Hong Kong. Environ. Int. 23,
791–797.
Lee, S.C., Chang, M., 2000. Indoor and outdoor air
quality investigation at schools in Hong Kong. Chemosphere 41,
109–113.
Lee, K., Yanagisawa, Y., Spengler, J.D., 1994. Carbon monoxide and
nitrogen dioxide exposures in indoor ice skating rinks. J. Sports
Sci. 12, 279–283.
Lee, S.C., Chan, L.Y., Chiu, M.Y., 1999. Indoor and outdoor air
quality investigation at 14 public places in Hong Kong. Environ.
Int. 25, 443–450.
Lee, S.C., Li, W.M., Chan, L.Y., 2001. Indoor air quality at
restaurants with different styles of cooking in metropolitan Hong
Kong. Sci. Total Environ. 279, 181–193.
Lee, S.C., Guo, H., Li, W.M., Chan, L.Y., 2002a. Inter-comparison of
air pollutant concentrations in different indoor environment in
Hong Kong. Atmos. Environ. 36, 1929–1940.
Lee, S.C., Li, W.M., Ao, C.H., 2002b. Investigation of indoor air
quality at residential homes in Hong Kong—case study. Atmos.
Environ. 36, 225–237.
Levesque, B., Dewailly, E., Lavoie, R., Prud’Homme, D., Allaire, S.,
1990. Carbon monoxide in indoor ice skating rinks: evaluation
of absorption by adult hockey players. Am. J. Public Health
80, 594–598.
Levy, J.I., Lee, K., Yanagisawa, Y., Hutchinson, P., Spengler, J.D.,
1998. Determinants of nitrogen dioxide concentrations in indoor
ice skating rinks. Am. J. Public Health 88, 1781–1786.
Li, W.M., Lee, S.C., Chan, L.Y., 2001. Indoor air quality at
nine shopping malls in Hong Kong. Sci. Total Environ. 273,
27–40.
Pennanen, A.S., Salonen, R.O., Alm, S., Jantunen, M.J., Pasanen, P.,
1997a. Characterization of air quality problems in five
Finnish indoor ice arenas. J. Air Waste Manage. Assoc. 47,
1079–1986.

ARTICLE IN PRESSH. Guo et al. / Environmental Research 94 (2004) 327–335 335
Pennanen, A.S., Salonen, R.O., Eklund, T., Nylund, N.-O., Lee, K.,
Spengler, J.D., 1997b. Improvement of air quality in small indoor
ice arenas by effective emission control in ice resurfacers. J. Air
Waste Manage. Assoc. 47, 1087–1094.
Penney, D.G., 2000. Carbon Monoxide Toxicity. CRC Press, Boca
Raton, FL.
Rosenlund, M., Bluhm, G., 1999. Health effects resulting from
nitrogen dioxide exposure in an indoor ice arenas. Arch. Environ.
Health 54, 52–57.
Samet, J.M., Marbury, M.C., Spengler, J.D., 1987. Health effects
and sources of indoor air pollution. Am. Rev. Respir. Dis. Part I
136, 1486–1508.
Smith, W., Anderson, T., Anderson, H.A., Remington, P.L., 1992.
Nitrogen dioxide and carbon monoxide intoxication in an indoor
ice arena—Wisconsin, 1992. MMWR 41, 383–385.
Soparkar, G., Mayers, I., Edouard, L., Hoeppner, V.H., 1993. Toxic
effects from nitrogen dioxide in ice-skating arenas. Can. Med.
Assoc. J. 148, 1181–1182.
Spengler, J.D., Stone, K.R., Lilley, F.W., 1978. High carbon monoxide
levels measured in enclosed skating rinks. J. Air Pollut. Control
Assoc. 28, 776–779.
USEPA, 1996. Protect your family and yourself from carbon
monoxide poisoning. Indoor Environments Division, Office of
Air and Radiation, US Environmental Protection Agency,
Washington, DC, EPA-402-F-96-005.
WHO, 1999. Environmental Health Criteria, No. 213: Carbon Mon-
oxide, second ed. World Health Organization, Geneva, Switzerland.
Yoon, D.-W., Lee, K., Yanagisawa, Y., Spengler, J.D., 1996.
Surveillance of indoor air quality in ice skating rinks. Environ.
Int. 22, 309–314.