indonesia manufacturing industry
TRANSCRIPT
Indonesia Manufacturing Industry: Opportunities for foreign investment
Presented byH.E. Lt. Gen. (Retd.) Andi M. Ghalib
Ambassador of the Republic of Indonesiaat the Seminar on Focus – ASEAN
Mumbai, 7th October 2009
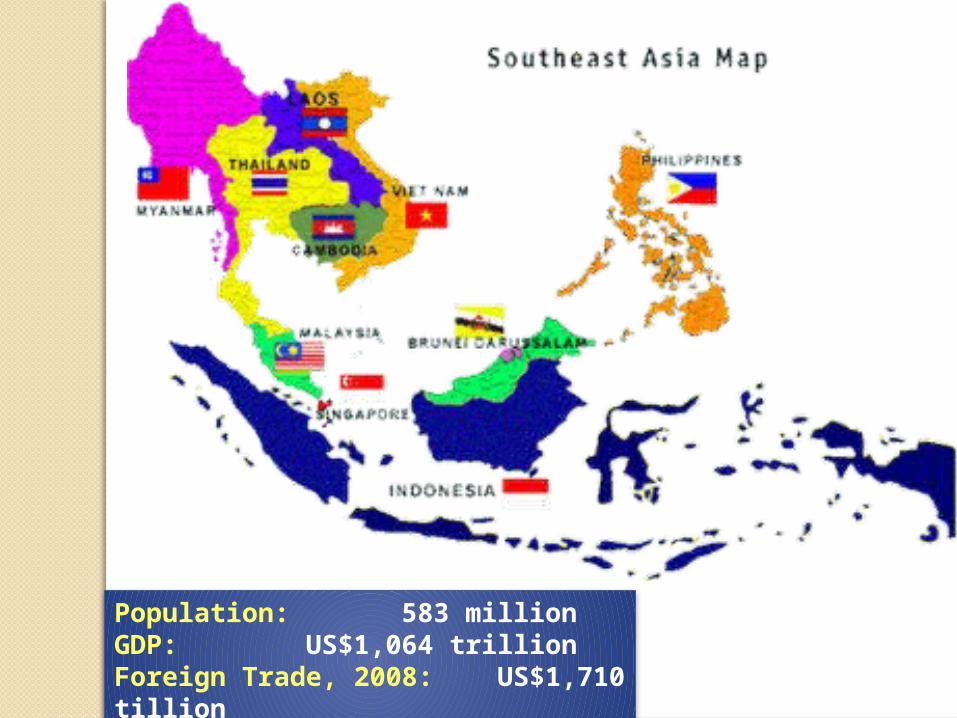
Population: 583 millionGDP: US$1,064 trillionForeign Trade, 2008: US$1,710 tillion
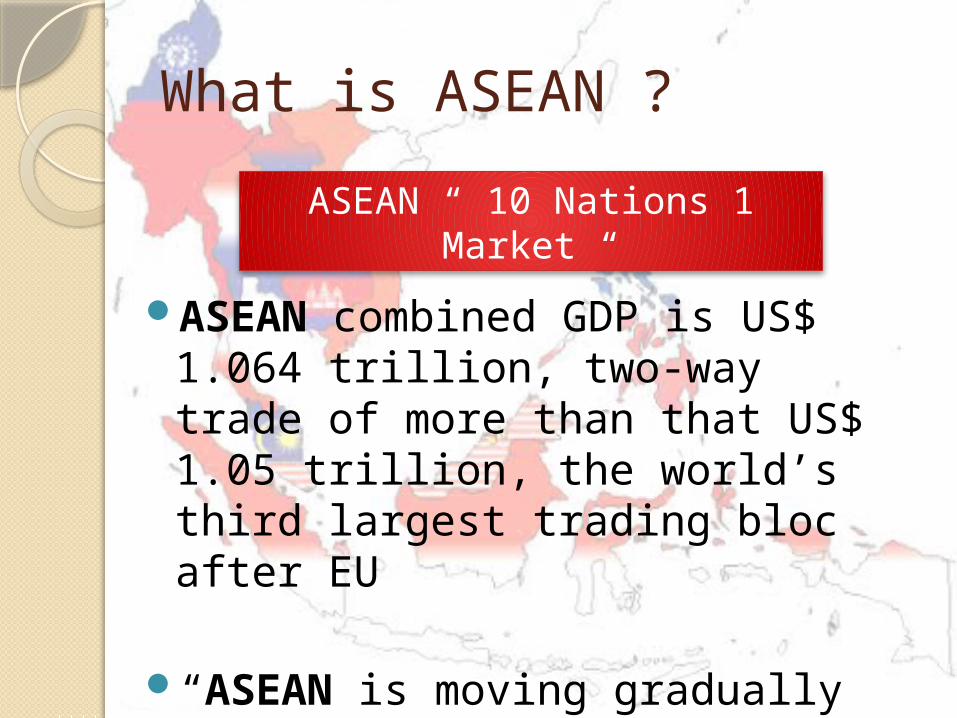
What is ASEAN ?
ASEAN combined GDP is US$ 1.064 trillion, two-way trade of more than that US$ 1.05 trillion, the world’s third largest trading bloc after EU
“ASEAN is moving gradually but progressively towards a shared future!”
ASEAN “ 10 Nations 1 Market “
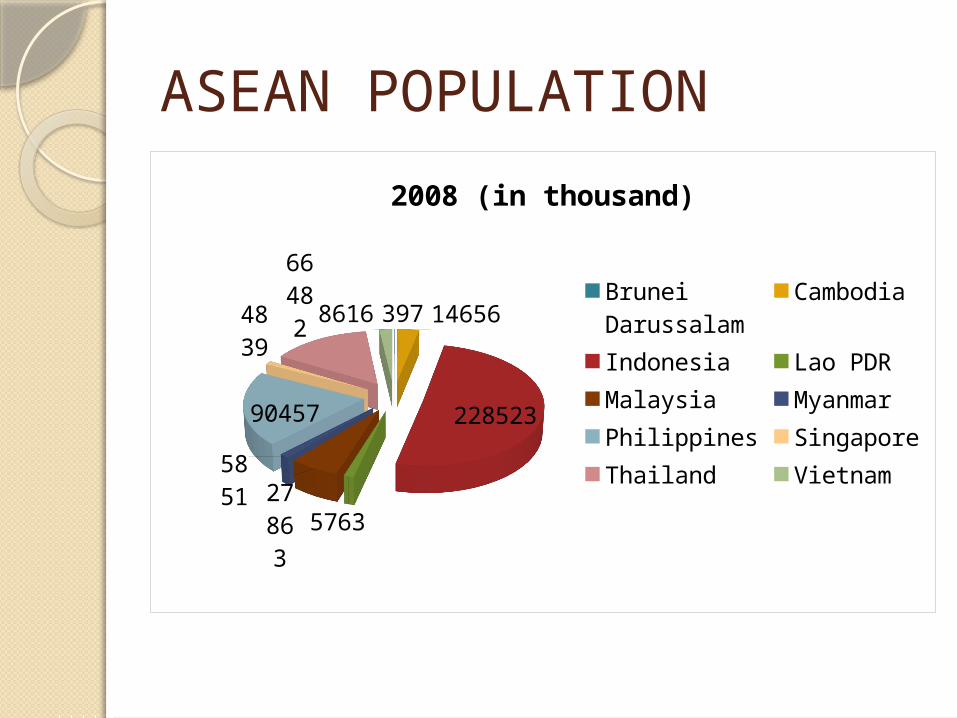
ASEAN POPULATION
397 14656
228523
576327863
5851
90457
4839
66482 8616
2008 (in thousand)Brunei DarussalamCambodiaIndonesiaLao PDRMalaysiaMyanmarPhilippinesSingaporeThailandVietnam
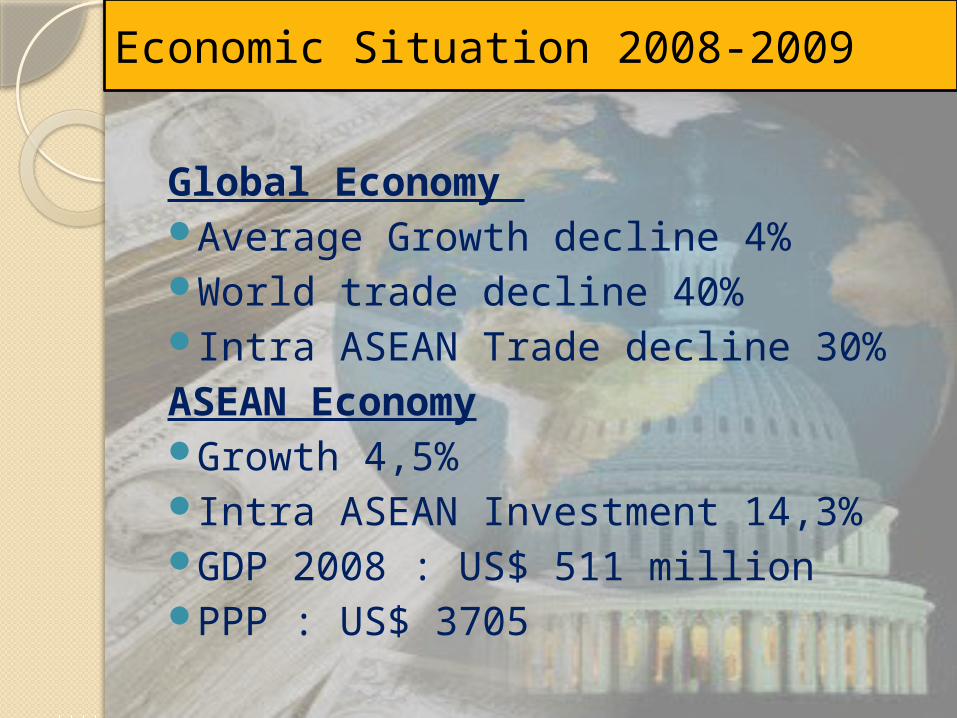
Economic Situation 2008-2009
Global Economy Average Growth decline 4%World trade decline 40%Intra ASEAN Trade decline 30%ASEAN EconomyGrowth 4,5%Intra ASEAN Investment 14,3%GDP 2008 : US$ 511 millionPPP : US$ 3705
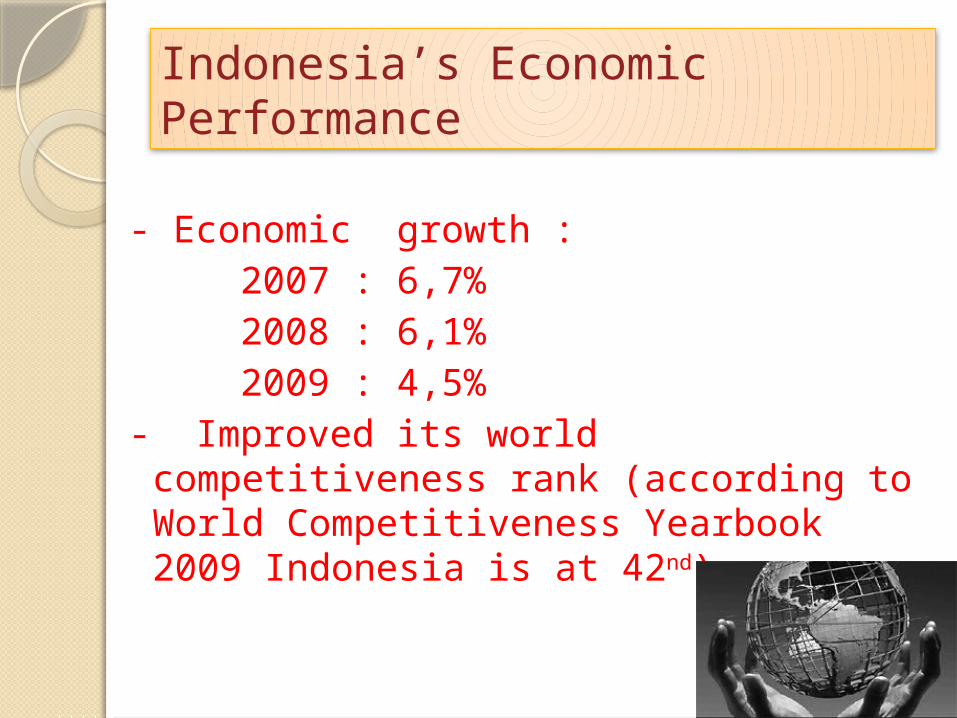
Indonesia’s Economic Performance
- Economic growth : 2007 : 6,7% 2008 : 6,1% 2009 : 4,5%- Improved its world competitiveness
rank (according to World Competitiveness Yearbook 2009 Indonesia is at 42nd)
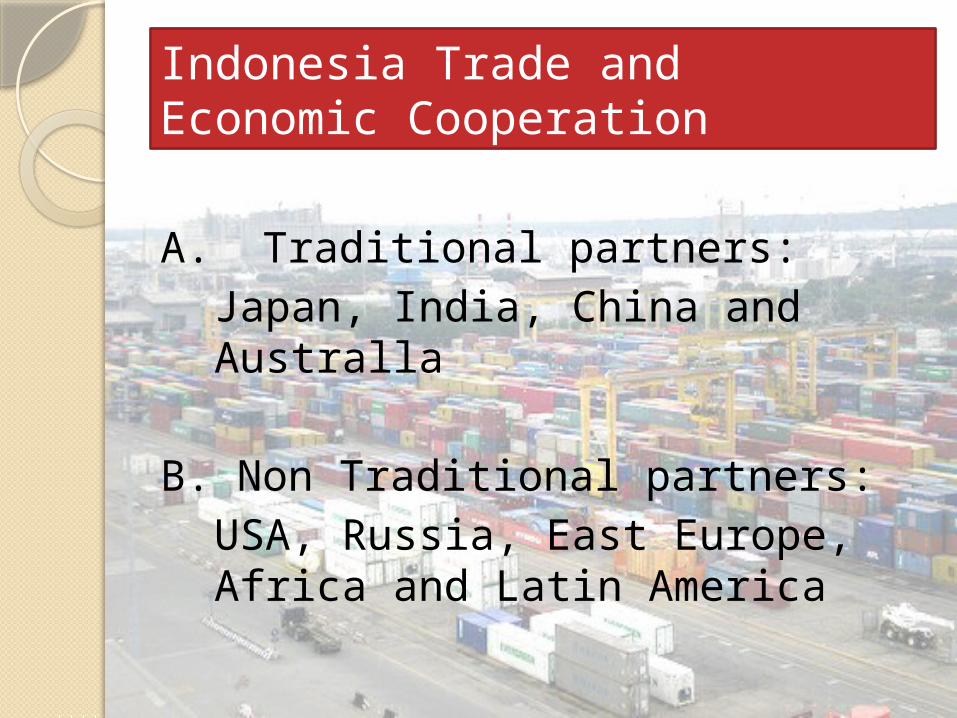
Indonesia Trade and Economic Cooperation
A. Traditional partners: Japan, India, China and Australla
B. Non Traditional partners:USA, Russia, East Europe, Africa and Latin America
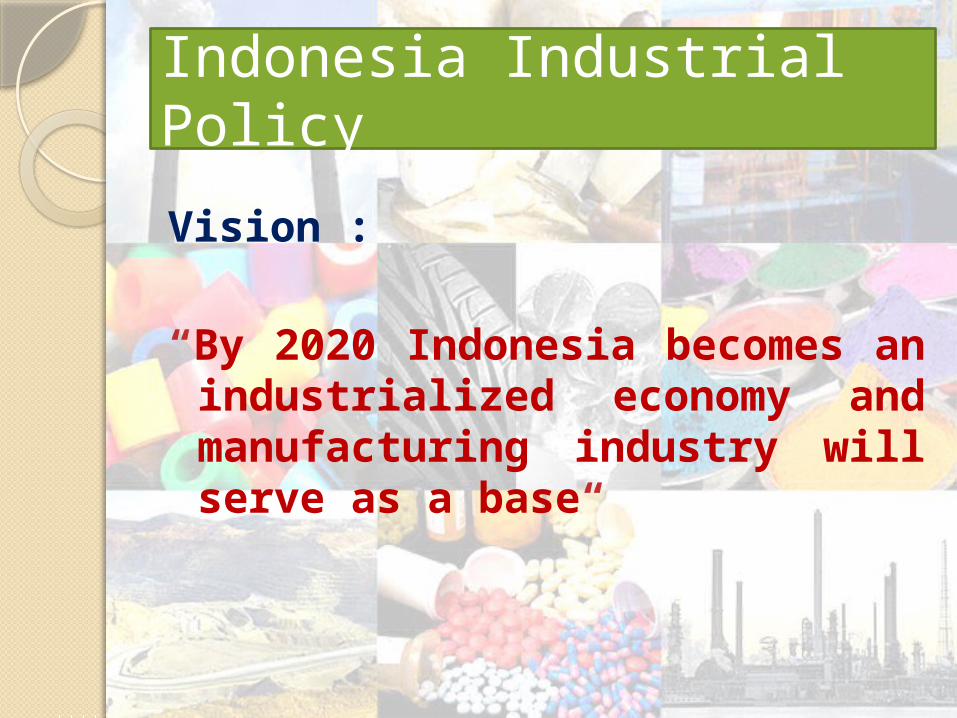
Indonesia Industrial Policy
Vision :
“By 2020 Indonesia becomes an industrialized economy and manufacturing industry will serve as a base“
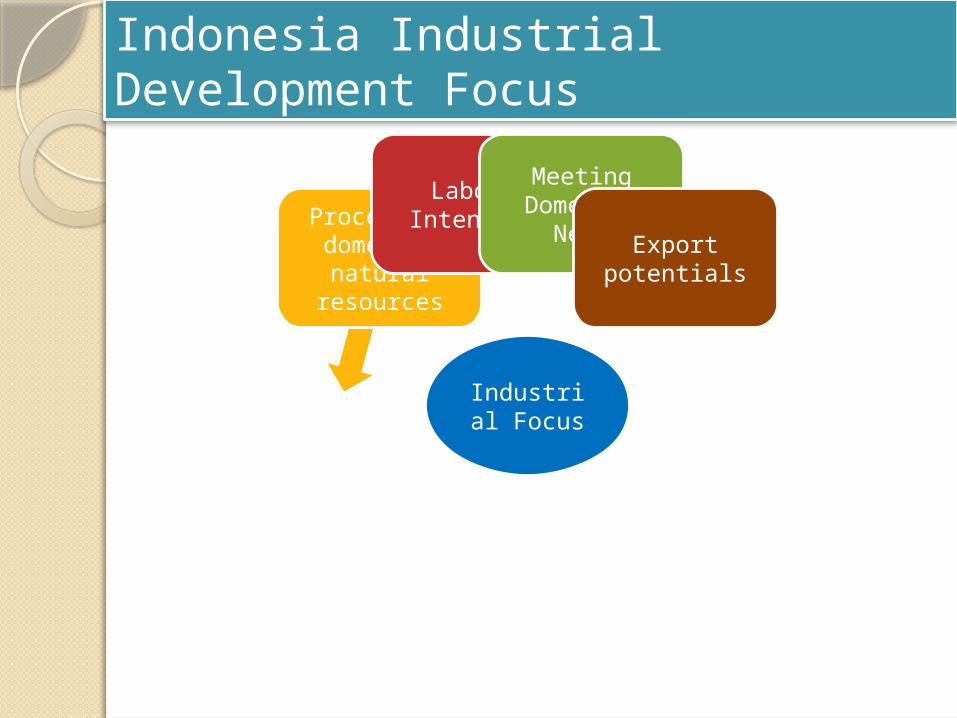
Indonesia Industrial Development Focus
Industrial Focus
Processing domestic natural
resources
Labour Intensive
Meeting Domestic
Need Export potentials
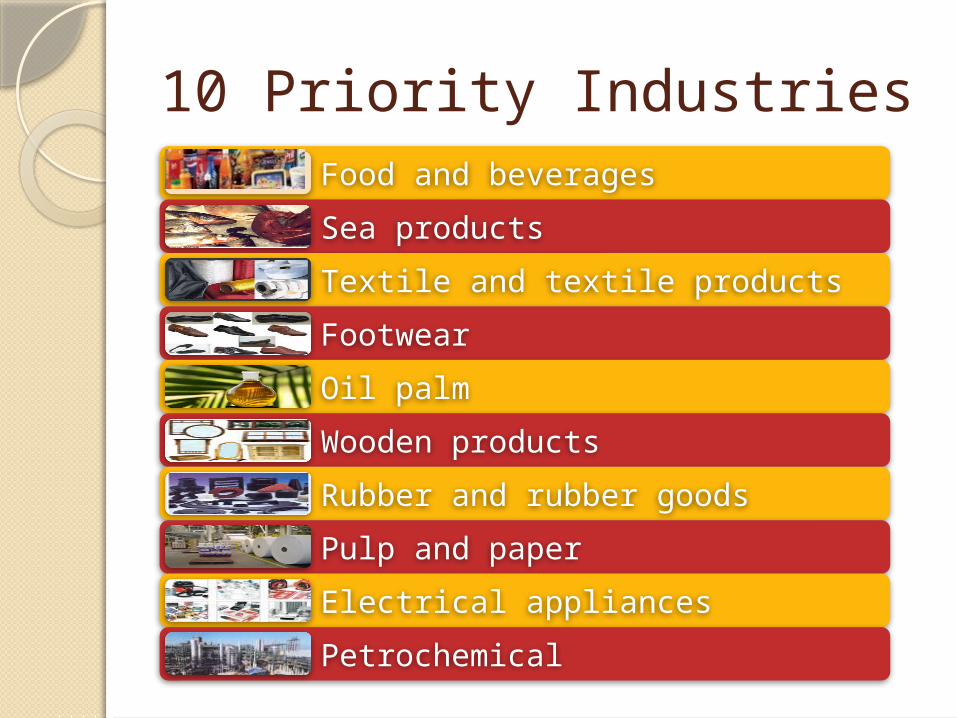
10 Priority IndustriesFood and beveragesSea productsTextile and textile products
FootwearOil palmWooden productsRubber and rubber goods
Pulp and paperElectrical appliancesPetrochemical
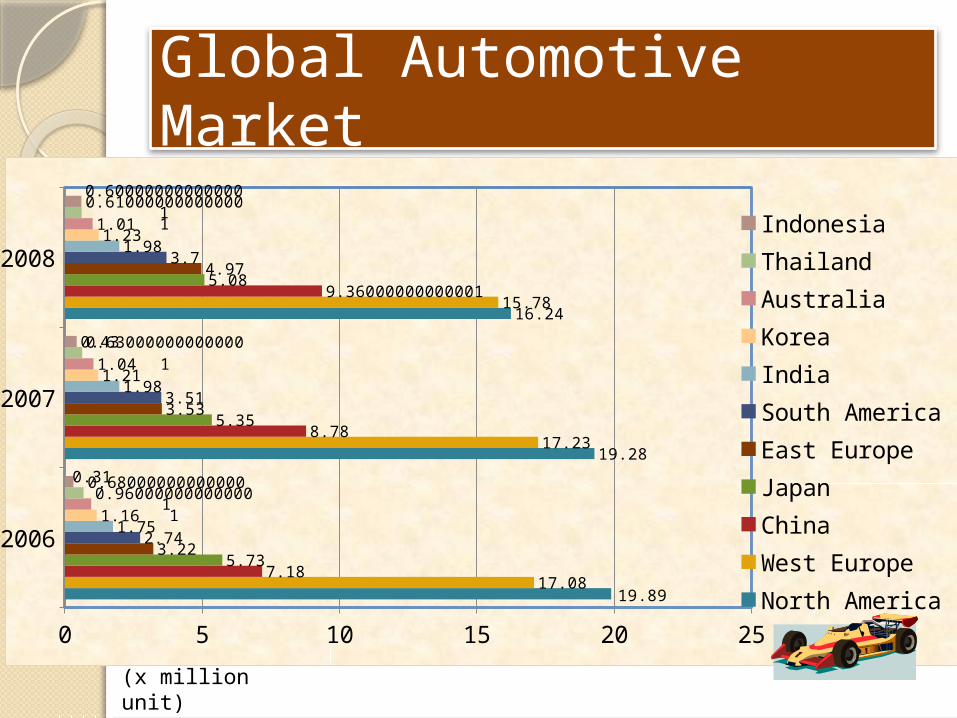
Global Automotive Market
2006
2007
2008
0 5 10 15 20 25
19.89
19.28
16.24
17.08
17.23
15.78
7.18
8.78
9.36000000000001
5.73
5.35
5.08
3.22
3.53
4.97
2.74
3.51
3.7
1.75
1.98
1.98
1.16
1.21
1.23
0.960000000000001
1.04
1.01
0.680000000000001
0.630000000000001
0.610000000000001
0.31
0.43
0.600000000000001
IndonesiaThailandAustraliaKoreaIndiaSouth AmericaEast EuropeJapanChinaWest EuropeNorth America
(x million unit)
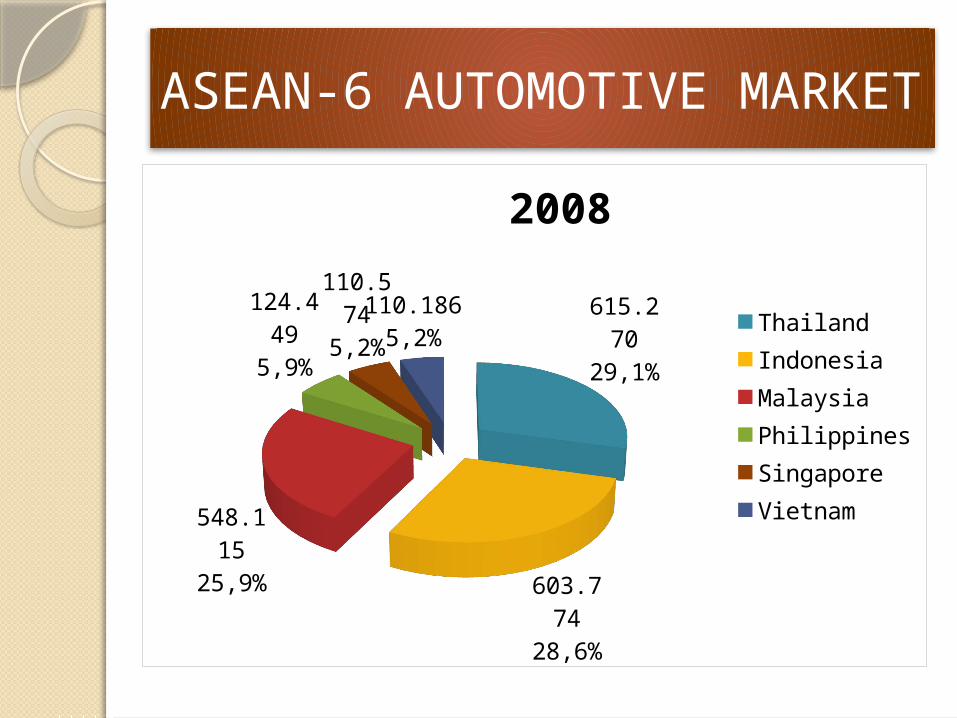
ASEAN-6 AUTOMOTIVE MARKET
615.270
29,1%
603.774
28,6%
548.115
25,9%
124.449
5,9%
110.574
5,2%
110.1865,2%
2008
ThailandIndonesiaMalaysiaPhilippinesSingaporeVietnam
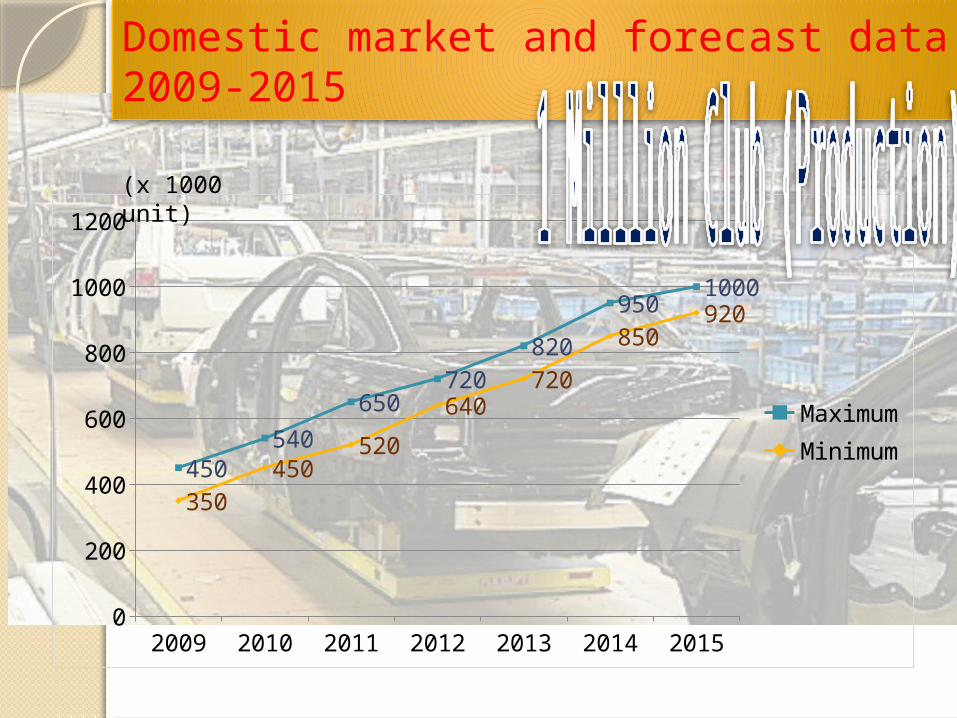
Domestic market and forecast data2009-2015
2009 2010 2011 2012 2013 2014 20150
200
400
600
800
1000
1200
450540
650720
820
9501000
350450
520
640720
850920
MaximumMinimum
(x 1000 unit)
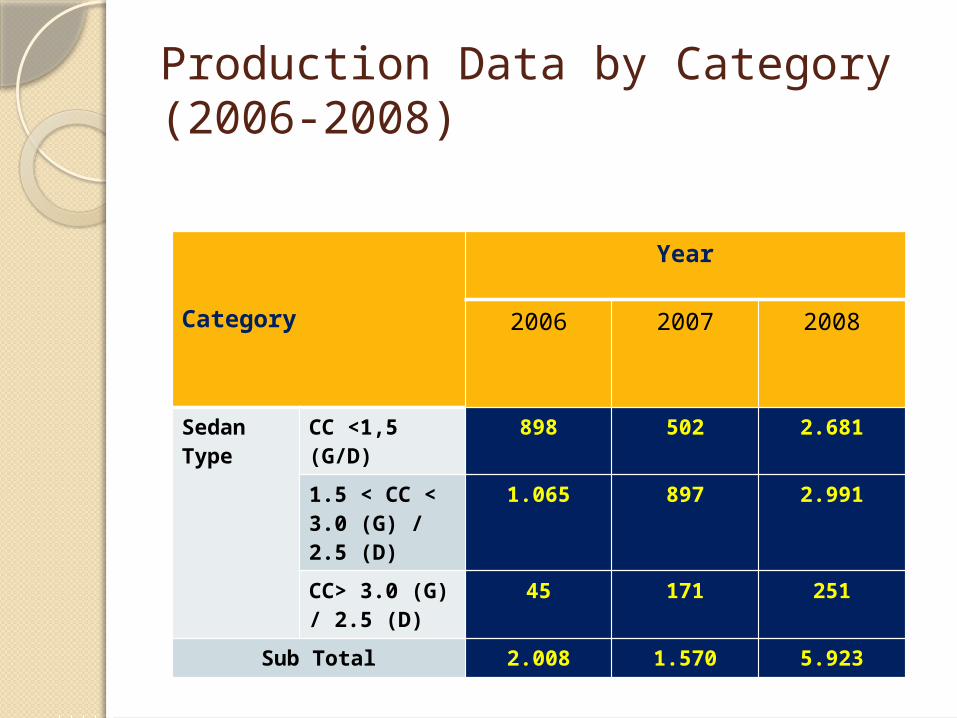
Production Data by Category(2006-2008)
Category
Year
2006 2007 2008
Sedan Type
CC <1,5 (G/D)
898 502 2.681
1.5 < CC < 3.0 (G) / 2.5 (D)
1.065 897 2.991
CC> 3.0 (G) / 2.5 (D)
45 171 251
Sub Total 2.008 1.570 5.923
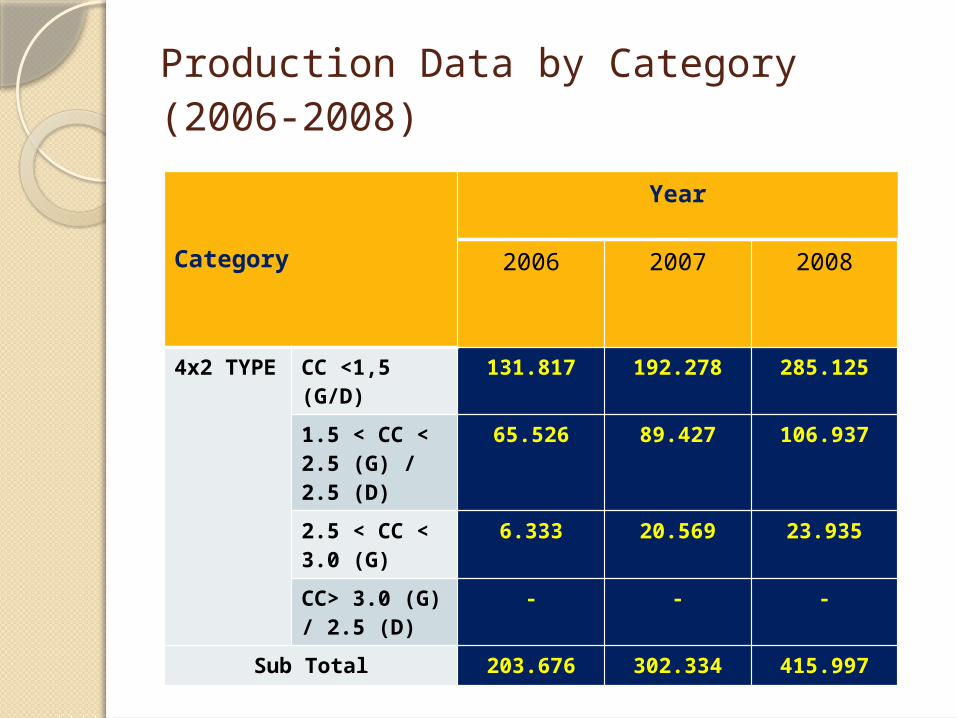
Production Data by Category(2006-2008) Category
Year
2006 2007 2008
4x2 TYPE
CC <1,5 (G/D)
131.817 192.278 285.125
1.5 < CC < 2.5 (G) / 2.5 (D)
65.526 89.427 106.937
2.5 < CC < 3.0 (G)
6.333 20.569 23.935
CC> 3.0 (G) / 2.5 (D)
- - -
Sub Total 203.676 302.334 415.997
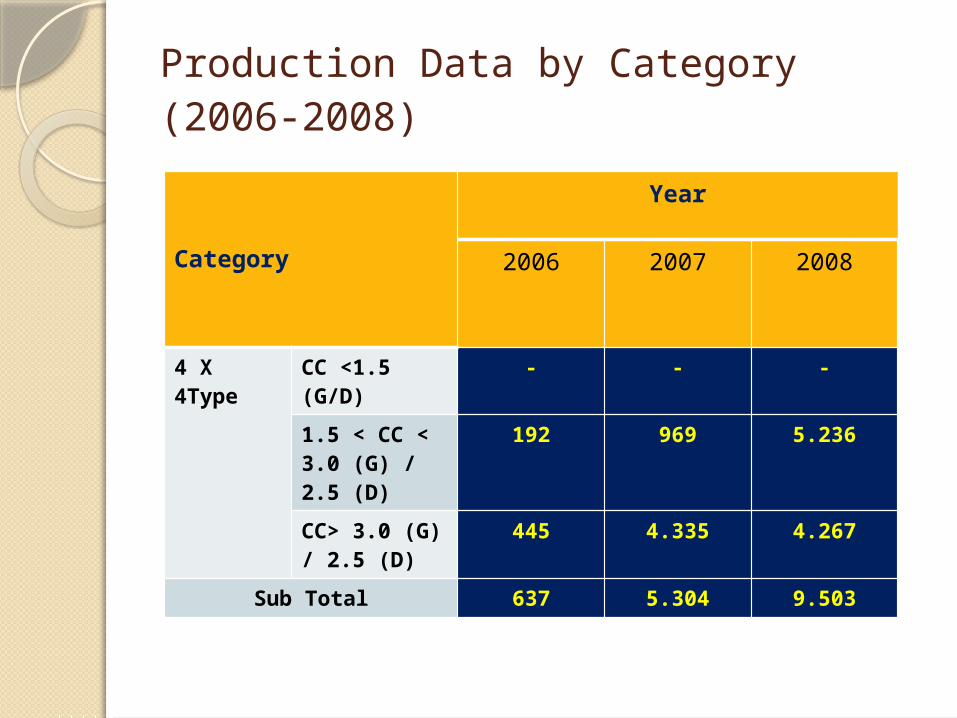
Production Data by Category(2006-2008) Category
Year
2006 2007 2008
4 X 4Type
CC <1.5 (G/D)
- - -
1.5 < CC < 3.0 (G) / 2.5 (D)
192 969 5.236
CC> 3.0 (G) / 2.5 (D)
445 4.335 4.267
Sub Total 637 5.304 9.503
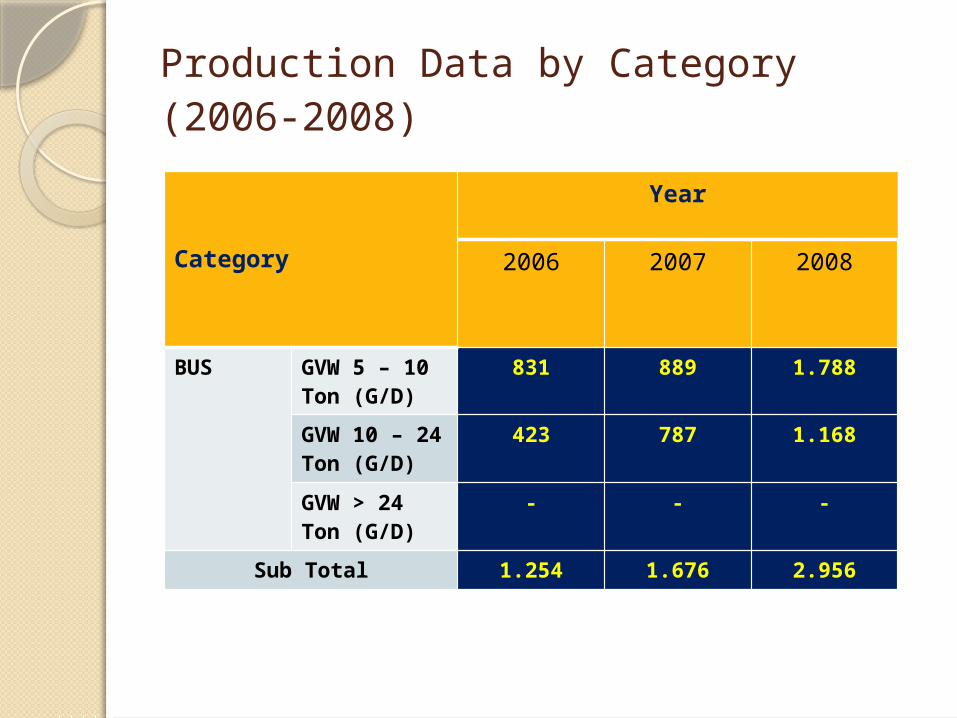
Production Data by Category(2006-2008) Category
Year
2006 2007 2008
BUS GVW 5 – 10 Ton (G/D)
831 889 1.788
GVW 10 – 24 Ton (G/D)
423 787 1.168
GVW > 24 Ton (G/D)
- - -
Sub Total 1.254 1.676 2.956
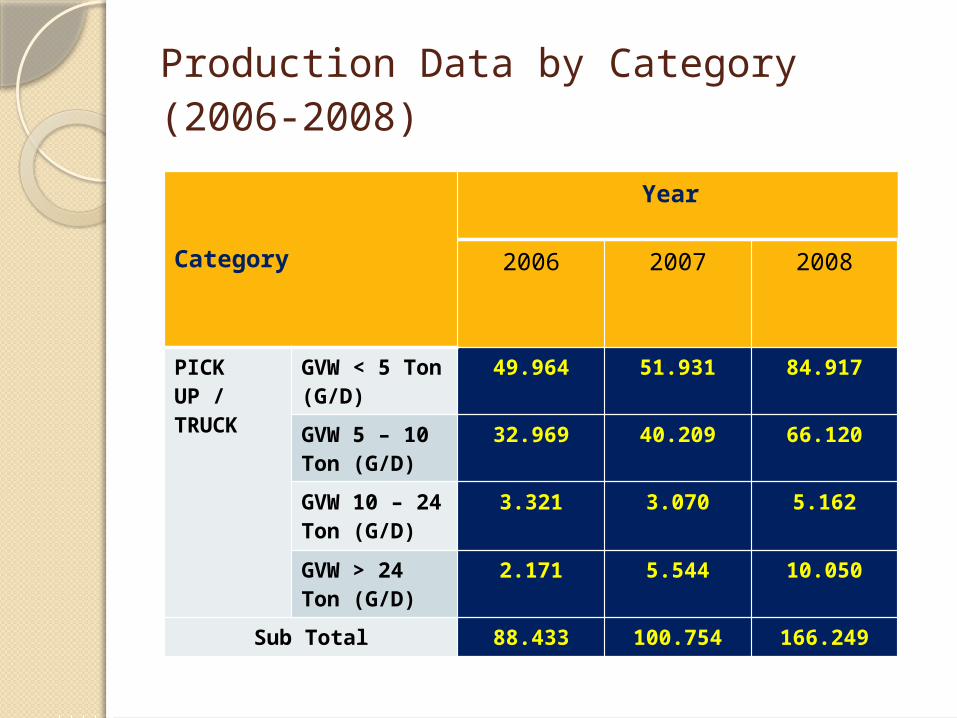
Production Data by Category(2006-2008) Category
Year
2006 2007 2008
PICK UP / TRUCK
GVW < 5 Ton (G/D)
49.964 51.931 84.917
GVW 5 – 10 Ton (G/D)
32.969 40.209 66.120
GVW 10 – 24 Ton (G/D)
3.321 3.070 5.162
GVW > 24 Ton (G/D)
2.171 5.544 10.050
Sub Total 88.433 100.754 166.249
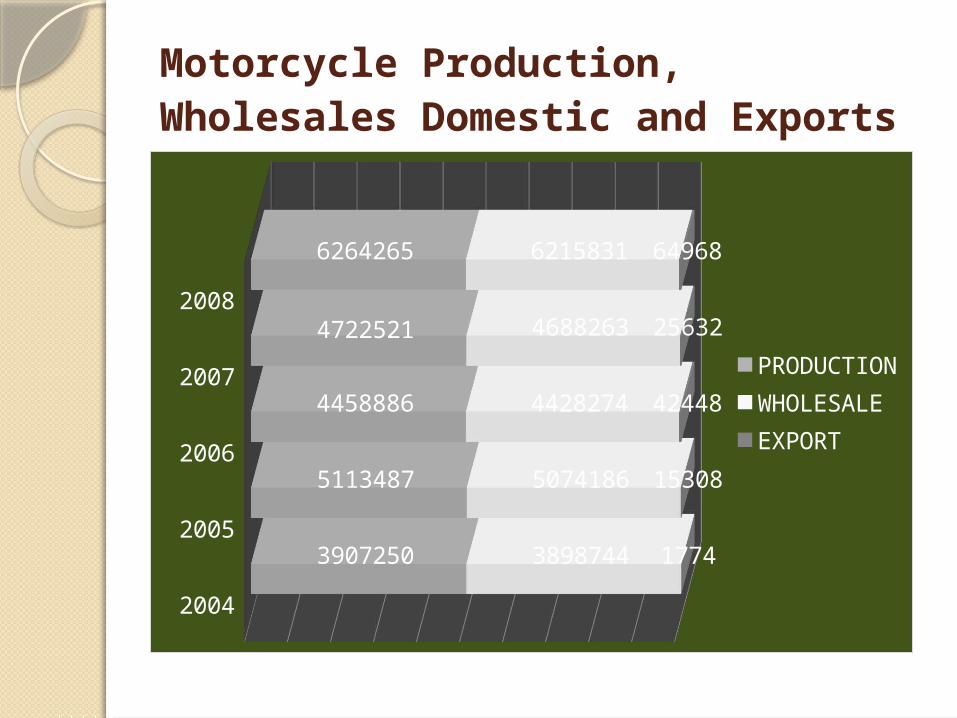
Motorcycle Production, Wholesales Domestic and Exports
2004
2005
2006
2007
2008
3907250
5113487
4458886
4722521
6264265
3898744
5074186
4428274
4688263
6215831
1774
15308
42448
25632
64968
PRODUCTIONWHOLESALEEXPORT
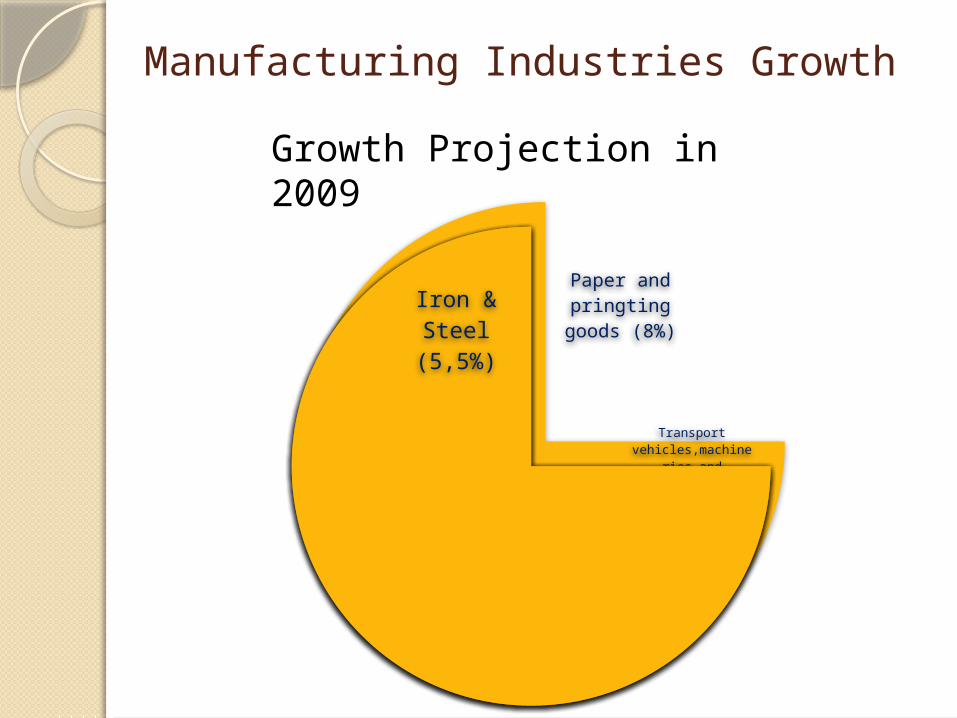
Manufacturing Industries Growth
Paper and pringting
goods (8%)
Transport vehicles,machin
eries and equipments (9,6
%)
Food beverage
s (8%)
Cement & Non metal mines (7%)
Chemical fertilizers &
Rubber products (6,5%)
Iron & Steel
(5,5%)
Growth Projection in 2009