indonesia cotton and products annual indonesia … gain publications/cotton and... · international...
TRANSCRIPT

THIS REPORT CONTAINS ASSESSMENTS OF COMMODITY AND TRADE ISSUES MADE BY
USDA STAFF AND NOT NECESSARILY STATEMENTS OF OFFICIAL U.S. GOVERNMENT
POLICY
Date:
GAIN Report Number:
Approved By:
Prepared By:
Report Highlights:
International cotton price volatility throughout calendar year (CY) 2011 severely impacted Indonesian
cotton spinners’ capacity to import. For marketing year (MY) 2011/12, Post expects that Indonesian
cotton imports will decline to 1.8 million bales, compared to 2.1 million bales in MY 2010/11. In MY
2011/12, the market share for U.S. cotton in Indonesia is also estimated to decline, primarily due to
strong competition from Australia.
Jonn Slette, Sugiarti Meylinah
Dennis Voboril
Indonesia Cotton and Products Annual Report 2012
Cotton and Products Annual
Indonesia
ID1209
4/3/2012
Required Report - public distribution
Executive Summary:
The Indonesian Ministry of Industry reported that in CY 2011, Indonesia was the world’s 11th
largest
textile exporter, with total exports valued at $10.1 billion. However, international cotton price volatility
during CY 2011 led to an overall decline in Indonesian cotton imports. Concurrently, Indonesian yarn
exports to China have decreased in MY 2011/12 due to lower Chinese demand. As a result, Post
estimated MY 2011/12 Indonesian cotton imports to decline to 1.8 million bales. In MY 2010/11, the
United States continues to be the largest supplier of cotton to Indonesia, despite fierce competition from
Brazil, Australia and India.
Commodities:
Production:
Indonesia produces only 0.5 percent of its total domestic demand for cotton. Indonesian cotton
producers receive little support from the Government of Indonesia (GOI) and cotton farmers generally
find greater economic incentives to grow other crops. Increased land conversion to nonagricultural uses
also reduces the area dedicated to cotton. However, favorable weather during 2011 provided
opportunities for a slight expansion of cotton area which led to an increase in Indonesian production.
Post estimates that in MY 2011/12, Indonesia’s cotton production will increase to 30,000 bales, up from
25,000 bales in MY 2010/11. South Sulawesi, East Java, West Nusa Tenggara, and Central Java are the
main cotton producing areas in Indonesia.
Consumption:
According to a local industry publication, the Indonesian textile and textile products sectors employ
about 1.4 million workers, which equated to just over 10 percent of the total Indonesian manufacturing
workforce in 2011. The Indonesian textile industry also plays a significant and strategic role in the
overall Indonesian macro-economy. In 2010 there were a total of 2,853 textile and textile production
companies in the country with a total investment of Rp. 146 trillion ($ 16 billion). According to the
Indonesian National Statistics Agency (BPS) estimates that textile products contributed almost two
percent toward total Indonesian national gross domestic product (GDP) in 2011. According to data
from BPS, during the period of January to December 2011, the Indonesian textile and related product
exports amounted to 6.6 percent of total Indonesian national exports. In CY 2010, Indonesia exported
about 37 percent of its textile and textile products to the United States, 15 percent to the European
Union, 5.2 percent to other ASEAN countries, and 5.6 percent to Japan.
According to industry publications, the volume of Indonesia’s textile and related product exports in CY
2010 increased by 11.85 percent to 1.97 million tons over 2009. Perhaps even more significantly, the
actual value increased by 21.17 percent to $11.2 billion. Indonesian textile industry grew by 8.6 percent
during the first nine months of 2011 after experiencing a contraction in 2007 and 2008. However, in
2012 the growth in textiles is not expected to remain as strong as during 2011. The Indonesian Textile
Select
Association (Asosiasi Pertekstilan Indonesia API ) estimates that local growth will only reach two
percent, primarily due to contracting demand from major Indonesian textile export destination countries
namely the European countries, China, and the United States.
In the domestic market, Indonesian textile and related products continue to face tough competition from
imported products. In CY 2010, Indonesia imported approximately 1.5 million tons of textile products,
valued at $6.2 billion. China (27.3 percent) and the Republic of Korea (16 percent) account for the
largest suppliers of textiles to Indonesia. Also, with the implementation of the second phase of the
ASEAN - China Free Trade Agreement (ACFTA), the import duties of specific products under Normal
Track 1, which include textiles and textile products, were reduced to zero percent. This became
effective in January 2010, and has been advantageous for Chinese textiles. Chinese products are
generally cheaper than domestically produced textiles and are considered comparable in terms of
quality.
In CY 2011, Indonesian textile mills ran at about 70 - 80 percent capacity - with a total of 7.85 million
spindles and 110,000 rotors. Several fundamental problems hampered the growth of the industry. The
majority of the machines used by the Indonesian industry are at least 20 years old. A GOI industry
revitalization program, launched in 2007, has assisted in upgrading only six percent of the textile
machines currently in use. Furthermore, higher interest rates make it more difficult for textile
businesses to get commercial bank loans.
International cotton prices have fluctuated broadly in 2011, which has impacted on small and medium
sized cotton spinners. After seven months of consecutive rises, prices of cotton suddenly decreased in
April 2011. Some Indonesian spinners panicked, as they had already contracted up to five month
supply of cotton when prices were high. Concurrently, the sale price of yarn began to fall faster than the
buying price of cotton, which is the raw material. The impacts of the sharp decline in cotton prices at
that time are still being felt up to a year later. Many small scale Indonesian spinners are currently
struggling to increase their working capital to continue operations. These same spinners are also
experiencing significant cash flow problems. Current market conditions are forcing some spinners to
make major cost reduction decisions, to include:
1. Switching their raw materials to synthetic fibers, or to cotton/synthetic blends as a cost saving
measure.
2. Switching from producing course count yarn to high and/or fine count yarn as to reduce raw
material expenses.
3. Switching to use lower quality raw materials.
4. Taking job orders from other manufacturers instead of producing for their own sales.
5. Reducing production levels, or
6. Closing down operations. Closing operation is becoming more common among the smaller
mills with cash flow problems.
For manufacturing process, the Indonesian textile industry sources about 70 percent of its energy needs
from the National Electricity Company (Perusahaan Listrik Negara PLN). The balance is met by self-
owned generators, and gas and/or coal powered industrial equipment. Compared to other Asian
countries, Indonesian electricity tariffs are relatively high. The electricity supply is also inconsistent,
which can lead to production slow-downs and/or stoppages. The PLN annually increases the electricity
tariff which adds additional expenses to the textile industry. For 2012, the GOI has decided to postpone
any electricity tariff hikes to 2013. However, the GOI currently plans to decrease gasoline subsidies,
which will lead to a 33.3 percent to Rp. 6,000 ($ 0.65) price increase per liter as of April 1, 2012. The
textile industry reports that the increased fuel prices will drag production costs up by approximately 10
percent, as well as increase transportation costs, and decrease the purchasing power of domestic
consumers. It may lead to lower Indonesian textile and textile products competitiveness in both
domestic and international market.
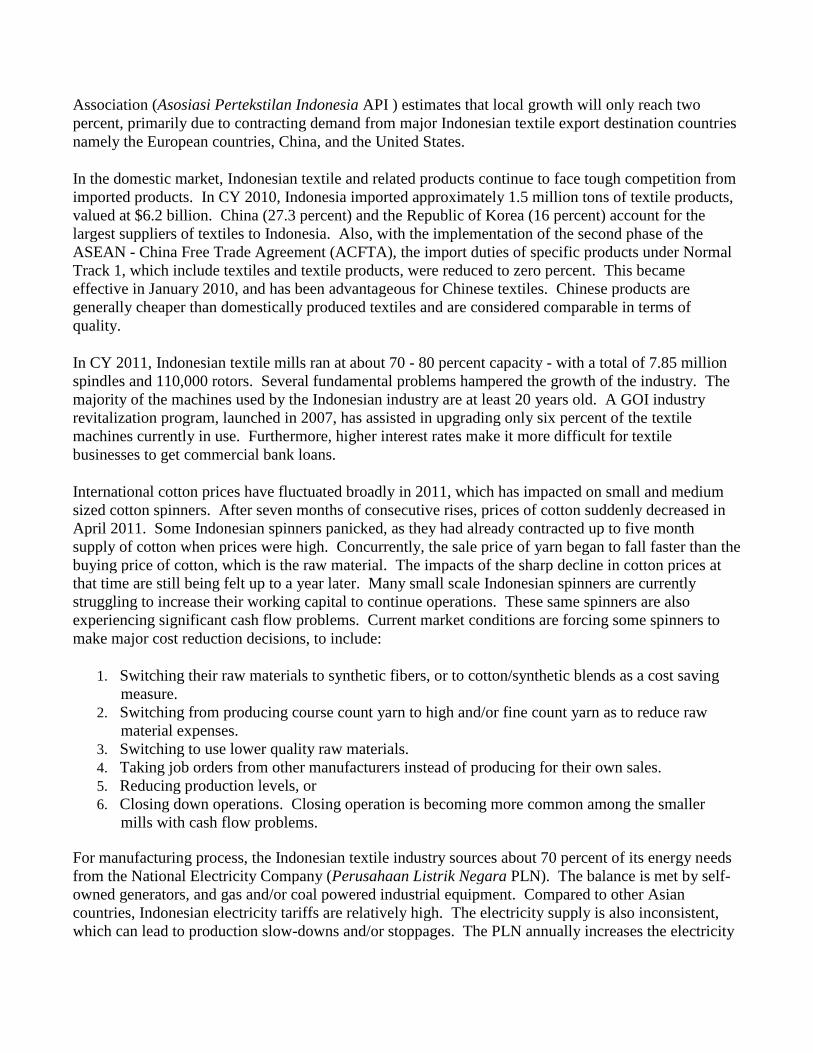
Comparison of Electricity Tariff in Asian Countries
Country U.S. $/kWH
Bangladesh 0.30
Republic Korea 0.60
Pakistan 0.66
Vietnam 0.70
Indonesia 0.80
Source: various, processed by Indonesian Textile Association (API)
The United Nations International Labor Organization (ILO) reported that the productivity of Indonesian
workers ranked number 59 compared to Thailand (ranked 27), Korea (ranked 29), and China (ranked
31). Indonesian textile workers are still largely unskilled. The GOI requires importers to pay a 15
percent import duty on imported textile chemicals, which is considerably higher than other Asian
countries. The Indonesian textile industry must also cope with problems related to the distribution of
textiles and textile products. Indonesian port fees are considerably higher than other Asian countries.
GOI also requires that these fees be paid in U.S. dollars rather than in the local currency.
Terminal Handling Charge (THC) for 20 feet containers in ASEAN countries
Country THC – 20” in US$
Indonesia 95
Malaysia 88
Singapore 120
Thailand 63
Vietnam 70
Source: various, processed by API.
Road conditions for ground transportation to and from Indonesian ports are mostly bad, highly
congested, and subject to traffic timing. This leads to inefficiency and high transportation cost. As a
comparison, API calculates that transportation costs in Indonesia are about $0.34/km/truck. Post
understand through industry sources that transportation costs are significantly lower in other regional
countries. As a result of the aforementioned situation, Post estimates that MY 2011/12 Indonesian
cotton consumption will decrease to 1.86 million bales compared to 2.1 million bales in previous
marketing year of MY 2010/11.
Stocks:
In line with the decreased cotton imports, Post estimates that MY 2011/12 Indonesian ending stocks of
cotton will decrease slightly to 399,000 bales. Post expects that despite the increase of imports in MY
2012/13 stocks will likely to decline further to 322,000 bales. This is due to the estimated slight
increase in consumption and loss in MY 2012/13.
Policy:
The Indonesian industry’s outdated textile machines amount to lower productivity levels, and increased
energy and power usage. In 2007, the Indonesian Ministry of Industry launched a textile industry
revitalization program under Minister of Industry Decree No. 141/M-IND/PER/10/2009 (Please refer to
GAIN Report ID1112). The regulation was amended by the issuance of Ministry of Industry Decree
number 15/M-IND/PER/2/2012. This new regulation, aptly titled “Machines Restructuring Program for
Textile and Textile Products and Leather and Leather Products Small and Medium Enterprises”, reduced
the percentage of reimbursement provided to any textile company that purchased new textile machines
to 10 percent. Additionally, if the new machines are domestically produced, the program provides a
subsidy of up to a 25 percent of the cost of the machines. The reimbursement provided is now increased
to not allowed to exceed Indonesian Rupiah (IDR) 3 billion ($ 326,513) per company annually.
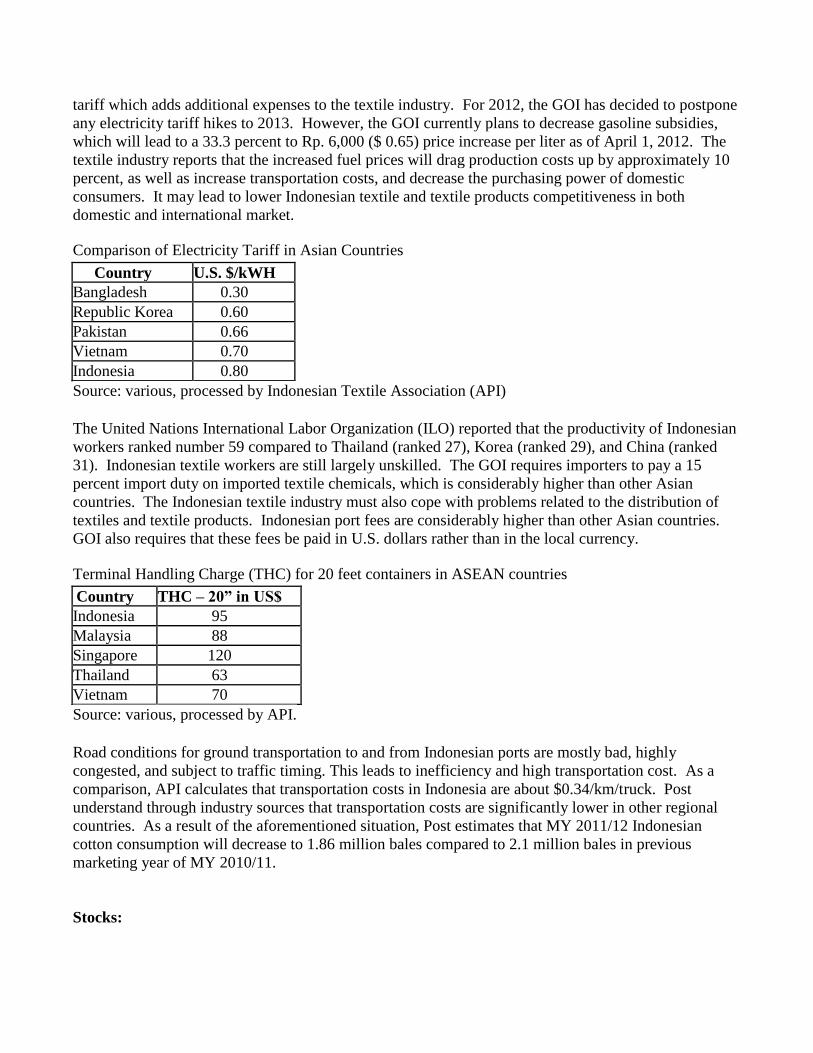
The Realization of Textiles Machines Restructuring Program, 2007 - 2011
Type of Industry Unit Year
2007 2008 2009 2010 2011 Total
Spinning Spinning Machine 372,764 550,380 93,192 185,722 415,104 1,617,212
Weaving Weaving Machine 453 725 1,958 1,481 1,286 5,903
Knitting Knitting Machine 129 271 455 676 213 1,744
Finishing Set 8 12 13 15 5 53
Garment Set 4,848 11,490 17,502 13,667 8,422 55,929
Source: Ministry of Industry 2012.
Marketing:
In CY 2009, the Ministry of Industry reported that 2,853 textile companies broken into subsectors of
consisting of 1. fiber (30 companies), 2. yarn (225 companies), 3. fabric (1,067 companies), 4. garment
(996 companies), and 5. others (535 companies). Textile industry representatives report the following
factors affect the current conditions of Indonesian spinners:
1. Some spinning mills still suffer from the high price contracts in 2011 that led to tight cash flow.
2. The flat trend of textile exports to major destination countries such as the United States, Europe,
and other Asian countries.
3. Tight competition with imported textile products in domestic market.
Given the above-mentioned situation, Post estimates that Indonesian imports of cotton in MY 2011/12
will decrease to 1.8 million bales, compared to 2.1 million bales in MY 2010/11. Post forecasts that
MY 2012/13 cotton import levels to rebound to 1.9 million bales, assuming that some cotton spinners
will recover from the impact of the fluctuating prices of cotton in 2011, an expected increase of 5-10
percent in domestic sales, and improving world economy that may increase demand of Indonesian
textile and textile products in major exporting countries.
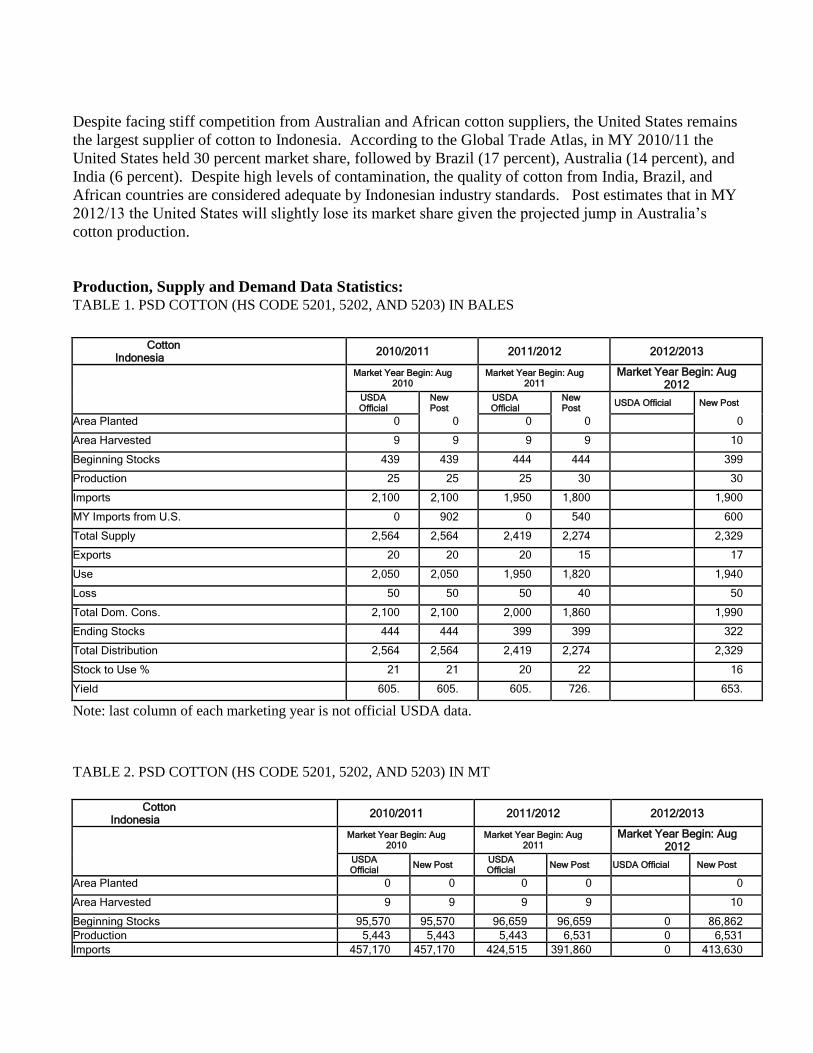
Despite facing stiff competition from Australian and African cotton suppliers, the United States remains
the largest supplier of cotton to Indonesia. According to the Global Trade Atlas, in MY 2010/11 the
United States held 30 percent market share, followed by Brazil (17 percent), Australia (14 percent), and
India (6 percent). Despite high levels of contamination, the quality of cotton from India, Brazil, and
African countries are considered adequate by Indonesian industry standards. Post estimates that in MY
2012/13 the United States will slightly lose its market share given the projected jump in Australia’s
cotton production.
Production, Supply and Demand Data Statistics: TABLE 1. PSD COTTON (HS CODE 5201, 5202, AND 5203) IN BALES
Cotton Indonesia 2010/2011 2011/2012 2012/2013
Market Year Begin: Aug 2010
Market Year Begin: Aug 2011
Market Year Begin: Aug 2012
USDA Official
New Post
USDA Official
New Post USDA Official New Post
Area Planted 0 0 0 0 0
Area Harvested 9 9 9 9 10
Beginning Stocks 439 439 444 444 399
Production 25 25 25 30 30
Imports 2,100 2,100 1,950 1,800 1,900
MY Imports from U.S. 0 902 0 540 600
Total Supply 2,564 2,564 2,419 2,274 2,329
Exports 20 20 20 15 17
Use 2,050 2,050 1,950 1,820 1,940
Loss 50 50 50 40 50
Total Dom. Cons. 2,100 2,100 2,000 1,860 1,990
Ending Stocks 444 444 399 399 322
Total Distribution 2,564 2,564 2,419 2,274 2,329
Stock to Use % 21 21 20 22 16
Yield 605. 605. 605. 726. 653.
Note: last column of each marketing year is not official USDA data.
TABLE 2. PSD COTTON (HS CODE 5201, 5202, AND 5203) IN MT
Cotton
Indonesia 2010/2011 2011/2012 2012/2013
Market Year Begin: Aug 2010
Market Year Begin: Aug 2011
Market Year Begin: Aug 2012
USDA Official New Post USDA
Official New Post USDA Official New Post
Area Planted 0 0 0 0 0
Area Harvested 9 9 9 9 10
Beginning Stocks 95,570 95,570 96,659 96,659 0 86,862 Production 5,443 5,443 5,443 6,531 0 6,531 Imports 457,170 457,170 424,515 391,860 0 413,630
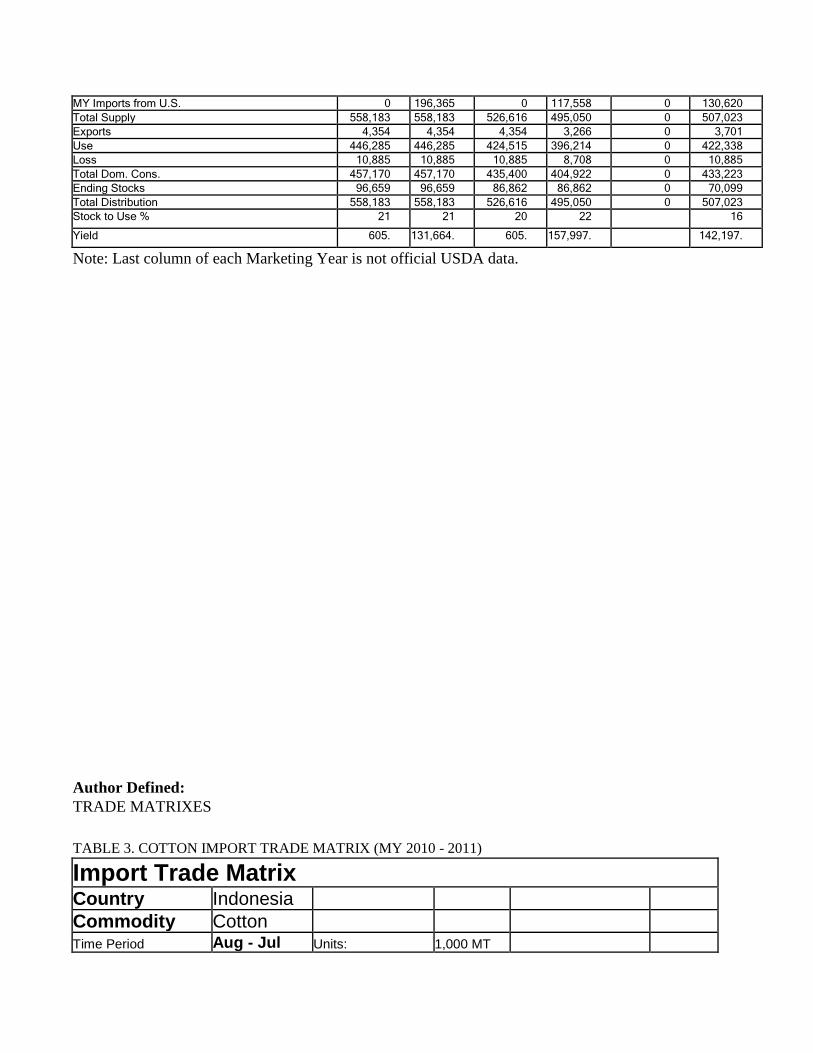
MY Imports from U.S. 0 196,365 0 117,558 0 130,620 Total Supply 558,183 558,183 526,616 495,050 0 507,023 Exports 4,354 4,354 4,354 3,266 0 3,701 Use 446,285 446,285 424,515 396,214 0 422,338 Loss 10,885 10,885 10,885 8,708 0 10,885 Total Dom. Cons. 457,170 457,170 435,400 404,922 0 433,223 Ending Stocks 96,659 96,659 86,862 86,862 0 70,099 Total Distribution 558,183 558,183 526,616 495,050 0 507,023 Stock to Use % 21 21 20 22 16
Yield 605. 131,664. 605. 157,997. 142,197.
Note: Last column of each Marketing Year is not official USDA data.
Author Defined:
TRADE MATRIXES
TABLE 3. COTTON IMPORT TRADE MATRIX (MY 2010 - 2011)
Import Trade Matrix
Country Indonesia
Commodity Cotton
Time Period Aug - Jul Units: 1,000 MT
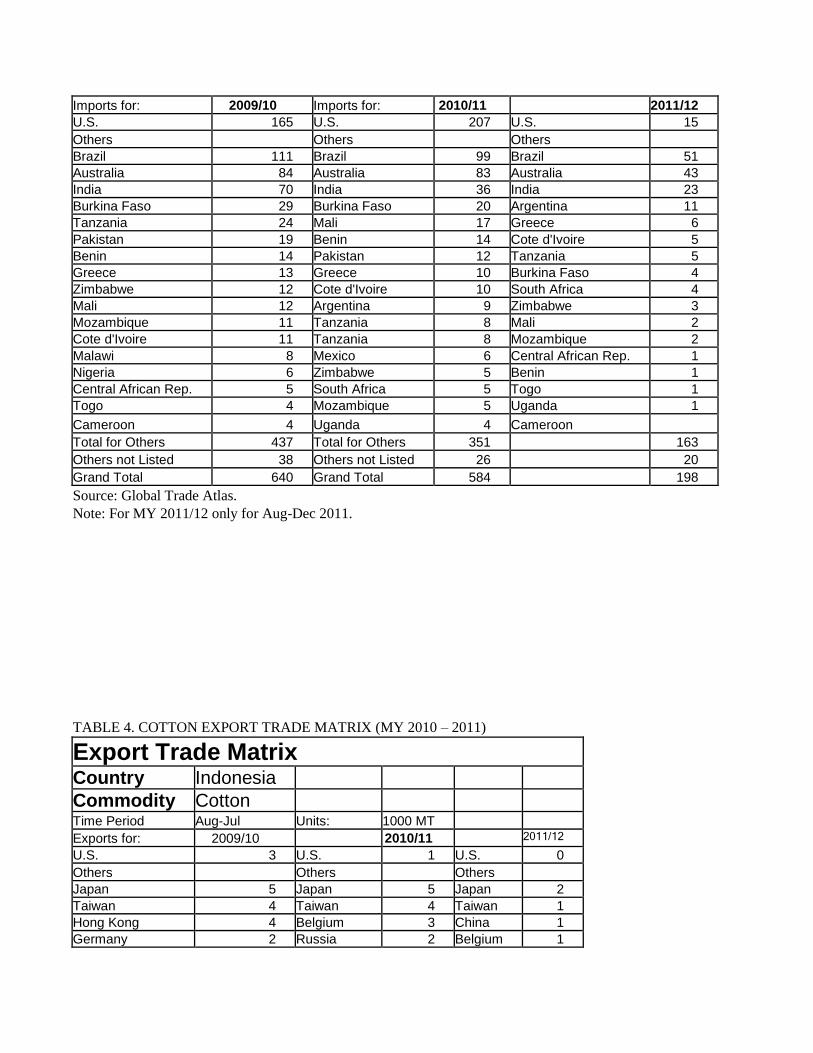
Imports for: 2009/10 Imports for: 2010/11 2011/12 U.S. 165 U.S. 207 U.S. 15 Others Others Others
Brazil 111 Brazil 99 Brazil 51 Australia 84 Australia 83 Australia 43 India 70 India 36 India 23 Burkina Faso 29 Burkina Faso 20 Argentina 11 Tanzania 24 Mali 17 Greece 6 Pakistan 19 Benin 14 Cote d'Ivoire 5 Benin 14 Pakistan 12 Tanzania 5 Greece 13 Greece 10 Burkina Faso 4 Zimbabwe 12 Cote d'Ivoire 10 South Africa 4 Mali 12 Argentina 9 Zimbabwe 3 Mozambique 11 Tanzania 8 Mali 2 Cote d'Ivoire 11 Tanzania 8 Mozambique 2 Malawi 8 Mexico 6 Central African Rep. 1 Nigeria 6 Zimbabwe 5 Benin 1 Central African Rep. 5 South Africa 5 Togo 1 Togo 4 Mozambique 5 Uganda 1
Cameroon 4 Uganda 4 Cameroon Total for Others 437 Total for Others 351 163 Others not Listed 38 Others not Listed 26 20 Grand Total 640 Grand Total 584 198
Source: Global Trade Atlas.
Note: For MY 2011/12 only for Aug-Dec 2011.
TABLE 4. COTTON EXPORT TRADE MATRIX (MY 2010 – 2011)
Export Trade Matrix
Country Indonesia
Commodity Cotton
Time Period Aug-Jul Units: 1000 MT
Exports for: 2009/10 2010/11 2011/12
U.S. 3 U.S. 1 U.S. 0 Others Others Others
Japan 5 Japan 5 Japan 2 Taiwan 4 Taiwan 4 Taiwan 1 Hong Kong 4 Belgium 3 China 1 Germany 2 Russia 2 Belgium 1
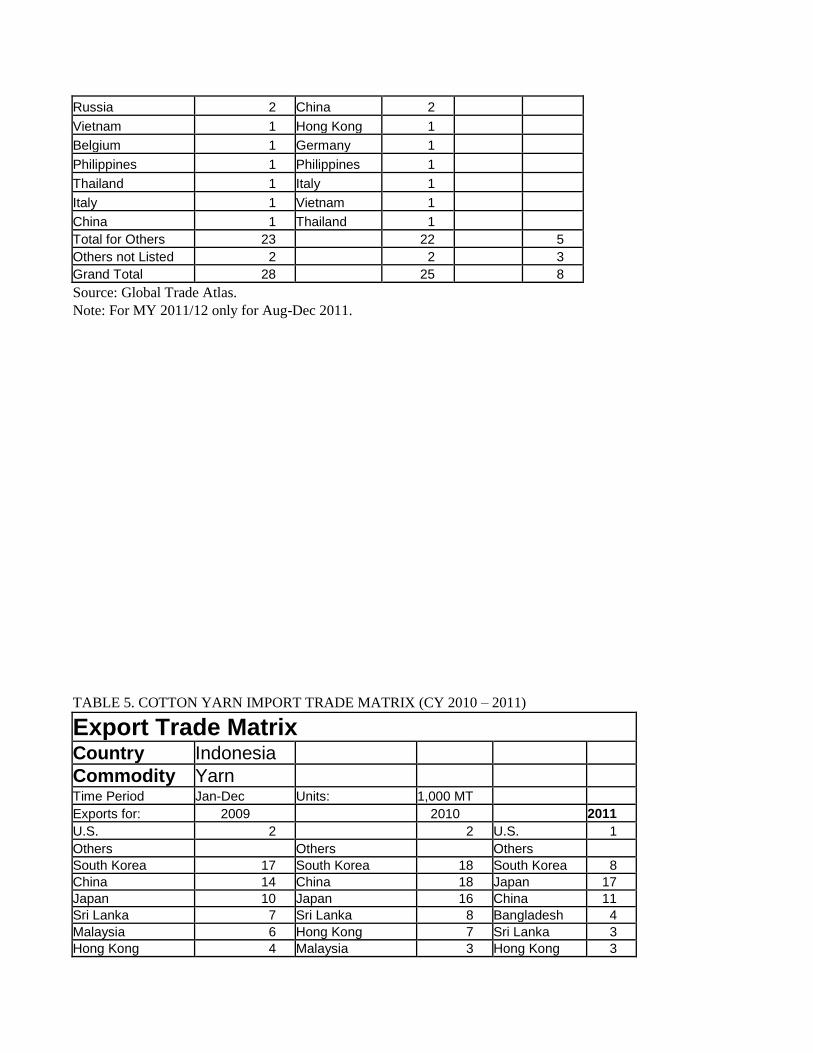
Russia 2 China 2
Vietnam 1 Hong Kong 1
Belgium 1 Germany 1
Philippines 1 Philippines 1
Thailand 1 Italy 1
Italy 1 Vietnam 1
China 1 Thailand 1 Total for Others 23 22 5 Others not Listed 2 2 3 Grand Total 28 25 8
Source: Global Trade Atlas.
Note: For MY 2011/12 only for Aug-Dec 2011.
TABLE 5. COTTON YARN IMPORT TRADE MATRIX (CY 2010 – 2011)
Export Trade Matrix
Country Indonesia
Commodity Yarn
Time Period Jan-Dec Units: 1,000 MT
Exports for: 2009 2010 2011 U.S. 2 2 U.S. 1 Others Others Others
South Korea 17 South Korea 18 South Korea 8 China 14 China 18 Japan 17 Japan 10 Japan 16 China 11 Sri Lanka 7 Sri Lanka 8 Bangladesh 4 Malaysia 6 Hong Kong 7 Sri Lanka 3 Hong Kong 4 Malaysia 3 Hong Kong 3
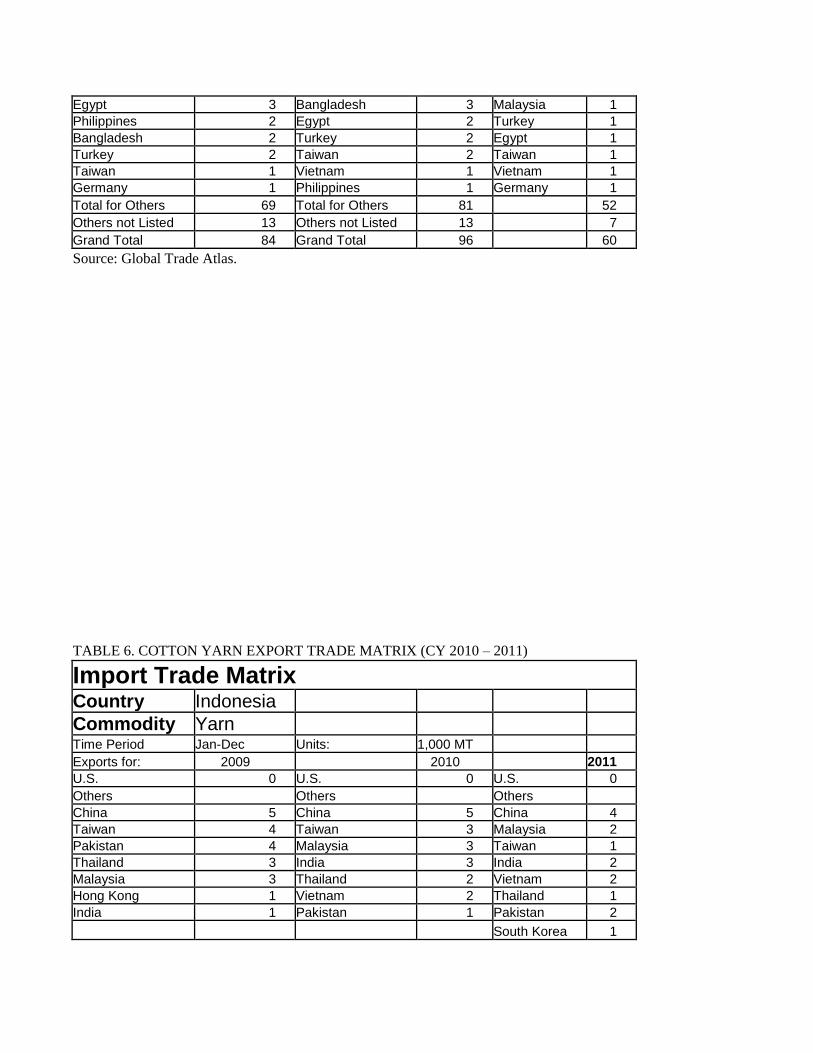
Egypt 3 Bangladesh 3 Malaysia 1 Philippines 2 Egypt 2 Turkey 1 Bangladesh 2 Turkey 2 Egypt 1 Turkey 2 Taiwan 2 Taiwan 1 Taiwan 1 Vietnam 1 Vietnam 1 Germany 1 Philippines 1 Germany 1 Total for Others 69 Total for Others 81 52 Others not Listed 13 Others not Listed 13 7 Grand Total 84 Grand Total 96 60
Source: Global Trade Atlas.
TABLE 6. COTTON YARN EXPORT TRADE MATRIX (CY 2010 – 2011)
Import Trade Matrix
Country Indonesia
Commodity Yarn
Time Period Jan-Dec Units: 1,000 MT
Exports for: 2009 2010 2011 U.S. 0 U.S. 0 U.S. 0 Others Others Others
China 5 China 5 China 4 Taiwan 4 Taiwan 3 Malaysia 2 Pakistan 4 Malaysia 3 Taiwan 1 Thailand 3 India 3 India 2 Malaysia 3 Thailand 2 Vietnam 2 Hong Kong 1 Vietnam 2 Thailand 1 India 1 Pakistan 1 Pakistan 2
South Korea 1
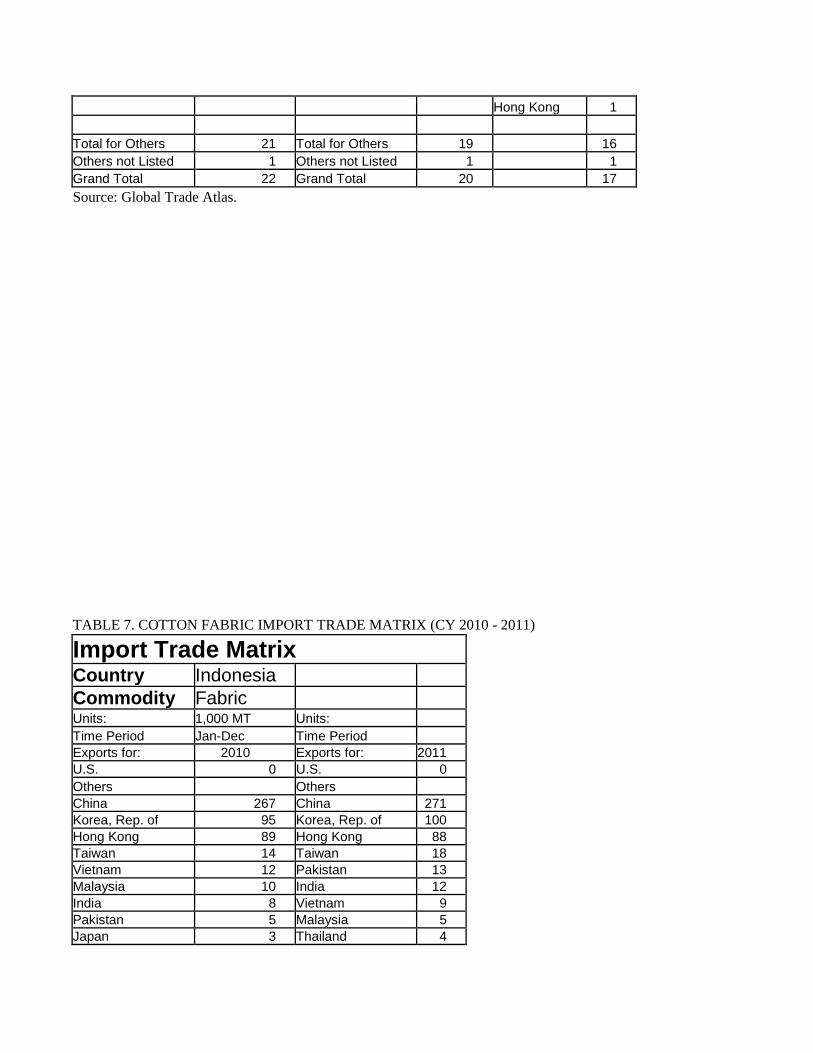
Hong Kong 1
Total for Others 21 Total for Others 19 16 Others not Listed 1 Others not Listed 1 1 Grand Total 22 Grand Total 20 17
Source: Global Trade Atlas.
TABLE 7. COTTON FABRIC IMPORT TRADE MATRIX (CY 2010 - 2011)
Import Trade Matrix
Country Indonesia
Commodity Fabric
Units: 1,000 MT Units:
Time Period Jan-Dec Time Period
Exports for: 2010 Exports for: 2011 U.S. 0 U.S. 0 Others Others
China 267 China 271 Korea, Rep. of 95 Korea, Rep. of 100 Hong Kong 89 Hong Kong 88 Taiwan 14 Taiwan 18 Vietnam 12 Pakistan 13 Malaysia 10 India 12 India 8 Vietnam 9 Pakistan 5 Malaysia 5 Japan 3 Thailand 4
Macau 3 Japan 3
Thailand 2
Singapore 2
Turkey 2
Total for Others 512 Total for Others 523 Others not Listed 1 Others not Listed 3 Grand Total 513 Grand Total 526
Source: Global Trade Atlas.
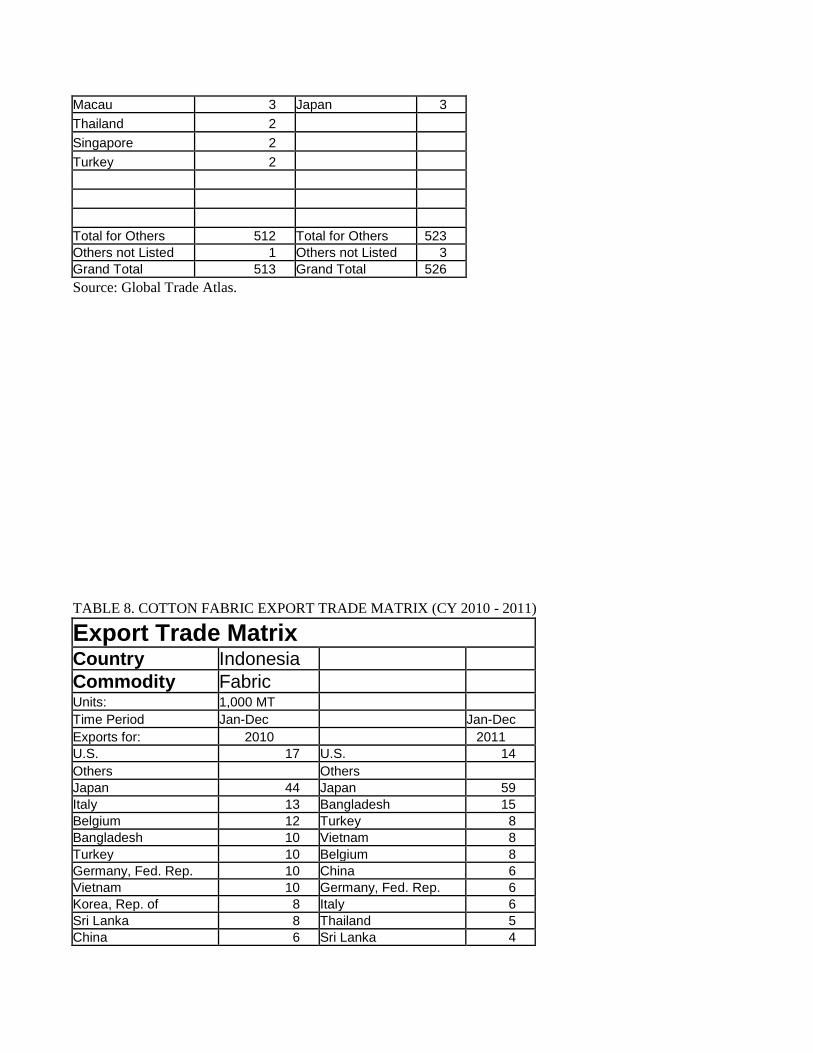
TABLE 8. COTTON FABRIC EXPORT TRADE MATRIX (CY 2010 - 2011)
Export Trade Matrix
Country Indonesia
Commodity Fabric
Units: 1,000 MT
Time Period Jan-Dec Jan-Dec Exports for: 2010 2011 U.S. 17 U.S. 14 Others Others
Japan 44 Japan 59 Italy 13 Bangladesh 15 Belgium 12 Turkey 8 Bangladesh 10 Vietnam 8 Turkey 10 Belgium 8 Germany, Fed. Rep. 10 China 6 Vietnam 10 Germany, Fed. Rep. 6 Korea, Rep. of 8 Italy 6 Sri Lanka 8 Thailand 5 China 6 Sri Lanka 4
Netherlands 6 Netherlands 4 Thailand 6 United Arab Emirates 3 Taiwan 5 Canada 3 Hong Kong 4 Australia 3 Philippines 4 Taiwan 3 Cambodia 4 Brazil 3 United Arab Emirates 4 Egypt 2 Portugal 4 Portugal 2 Brazil 4 South Africa 2 France 2 Hong Kong 1 Singapore 2 Malaysia 1 South Africa 2 Singapore 1
Malaysia 1 Total for Others 179 Total for Others 153 Others not Listed 21 Others not Listed 20 Grand Total 217 Grand Total 187
Source: Global Trade Atlas.
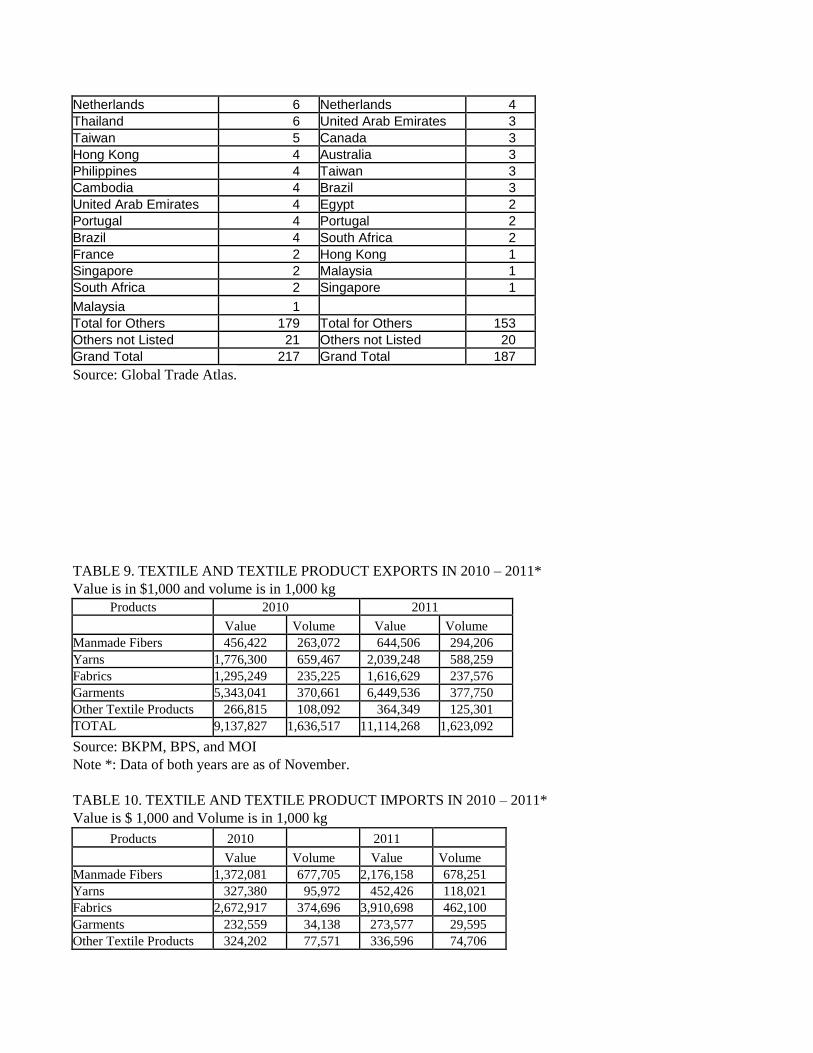
TABLE 9. TEXTILE AND TEXTILE PRODUCT EXPORTS IN 2010 – 2011*
Value is in $1,000 and volume is in 1,000 kg
Products 2010 2011
Value Volume Value Volume Manmade Fibers 456,422 263,072 644,506 294,206 Yarns 1,776,300 659,467 2,039,248 588,259 Fabrics 1,295,249 235,225 1,616,629 237,576 Garments 5,343,041 370,661 6,449,536 377,750 Other Textile Products 266,815 108,092 364,349 125,301 TOTAL 9,137,827 1,636,517 11,114,268 1,623,092
Source: BKPM, BPS, and MOI
Note *: Data of both years are as of November.
TABLE 10. TEXTILE AND TEXTILE PRODUCT IMPORTS IN 2010 – 2011*
Value is $ 1,000 and Volume is in 1,000 kg
Products 2010 2011
Value Volume Value Volume Manmade Fibers 1,372,081 677,705 2,176,158 678,251 Yarns 327,380 95,972 452,426 118,021 Fabrics 2,672,917 374,696 3,910,698 462,100 Garments 232,559 34,138 273,577 29,595 Other Textile Products 324,202 77,571 336,596 74,706

TOTAL 4,929,139 1,260,082 7,149,455 1,362,673
Source: BKPM, BPS, and MOI
Note *: Data of both years are as of November.
Note: Exchange rate is Rp. 9,188/$ 1, as of March 28, 2012.