indonesia advertising dead or alive june2013
Post on 17-Oct-2014
2.557 views
DESCRIPTION
TRANSCRIPT
Indonesia’s Advertising –
Dead or AliveHarris Thajeb
June 2013

Indonesia’s Advertising
Expenditure
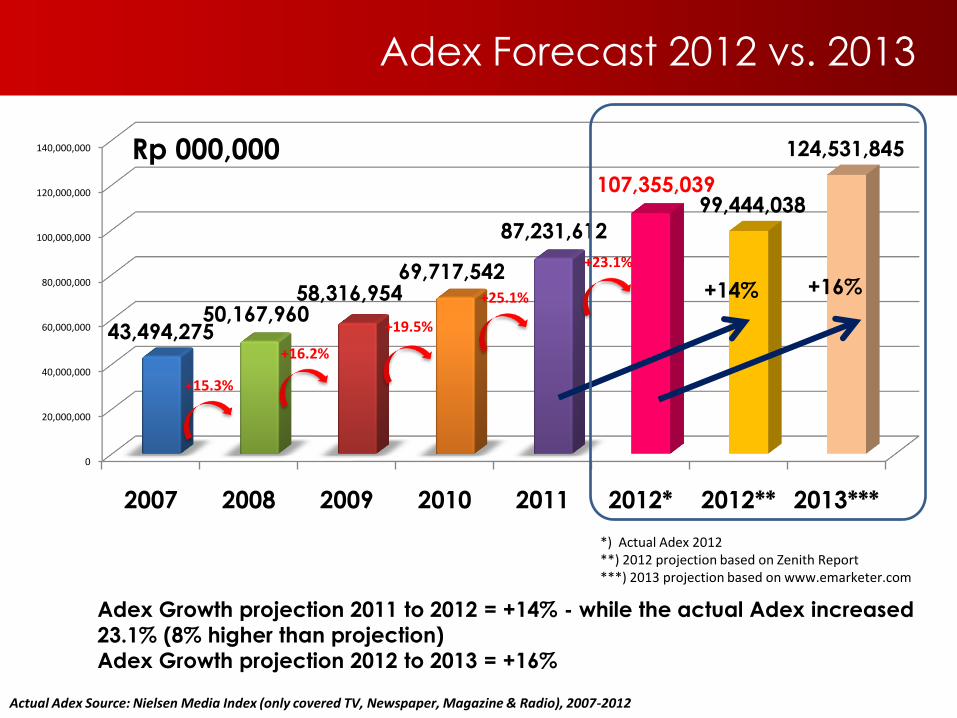
Adex Forecast 2012 vs. 2013
0
20,000,000
40,000,000
60,000,000
80,000,000
100,000,000
120,000,000
140,000,000
2007 2008 2009 2010 2011 2012* 2012** 2013***
43,494,27550,167,960
58,316,95469,717,542
87,231,612
107,355,03999,444,038
124,531,845Rp 000,000
+19.5%
+16.2%
+15.3%
+14%
*) Actual Adex 2012**) 2012 projection based on Zenith Report***) 2013 projection based on www.emarketer.com
+25.1%
Adex Growth projection 2011 to 2012 = +14% - while the actual Adex increased
23.1% (8% higher than projection)
Adex Growth projection 2012 to 2013 = +16%
Actual Adex Source: Nielsen Media Index (only covered TV, Newspaper, Magazine & Radio), 2007-2012
+16%
+23.1%
2007 2008 2009 2010 2011 2012
RADIO 132,176 159,566 119,593 131,023 102,239 75,201
MAGAZINE 1,462,933 1,786,623 1,935,982 2,132,816 2,348,637 2,508,427
NEWSPAPER 11,225,138 14,563,473 17,921,640 21,452,387 26,126,469 30,040,592
TV 30,674,028 33,658,298 38,339,739 46,001,316 58,654,267 74,730,820
0
20,000,000
40,000,000
60,000,000
80,000,000
100,000,000
120,000,000
Rp 000,000
(67.2%)
(30.0%)
( 2.69%)( 0.12%)
(66.0%)
(30.8%)
( 3.1%)( 0.2%)
Adex Trend by Media 2007 - 2012
(69.6%)
(28.0%)
( 2.3%)( 0.07%)
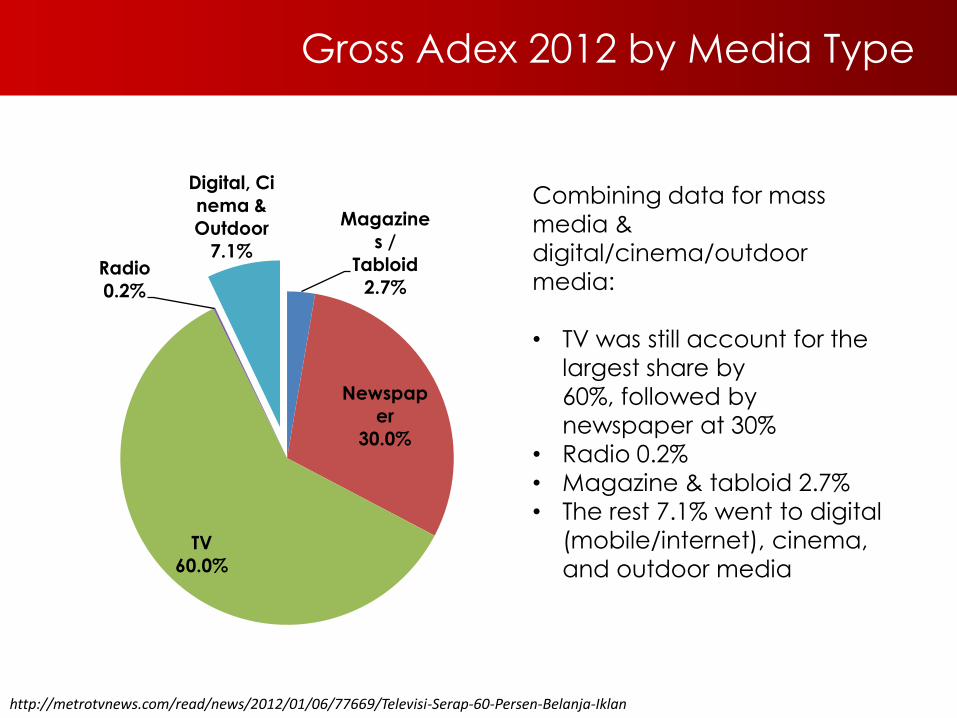
Gross Adex 2012 by Media Type
http://metrotvnews.com/read/news/2012/01/06/77669/Televisi-Serap-60-Persen-Belanja-Iklan
Magazine
s /
Tabloid
2.7%
Newspap
er
30.0%
TV
60.0%
Radio
0.2%
Digital, Ci
nema &
Outdoor
7.1%
Combining data for mass
media &
digital/cinema/outdoor
media:
• TV was still account for the
largest share by
60%, followed by
newspaper at 30%
• Radio 0.2%
• Magazine & tabloid 2.7%
• The rest 7.1% went to digital
(mobile/internet), cinema,
and outdoor media
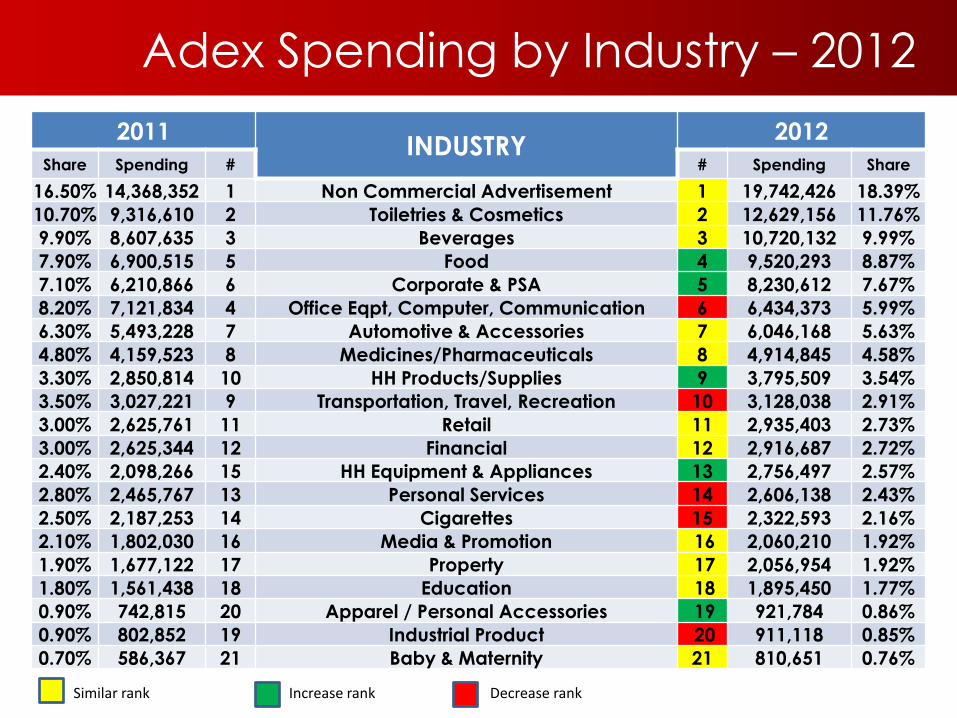
Adex Spending by Industry – 2012
2011INDUSTRY
2012
Share Spending # # Spending Share
16.50% 14,368,352 1 Non Commercial Advertisement 1 19,742,426 18.39%
10.70% 9,316,610 2 Toiletries & Cosmetics 2 12,629,156 11.76%
9.90% 8,607,635 3 Beverages 3 10,720,132 9.99%
7.90% 6,900,515 5 Food 4 9,520,293 8.87%
7.10% 6,210,866 6 Corporate & PSA 5 8,230,612 7.67%
8.20% 7,121,834 4 Office Eqpt, Computer, Communication 6 6,434,373 5.99%
6.30% 5,493,228 7 Automotive & Accessories 7 6,046,168 5.63%
4.80% 4,159,523 8 Medicines/Pharmaceuticals 8 4,914,845 4.58%
3.30% 2,850,814 10 HH Products/Supplies 9 3,795,509 3.54%
3.50% 3,027,221 9 Transportation, Travel, Recreation 10 3,128,038 2.91%
3.00% 2,625,761 11 Retail 11 2,935,403 2.73%
3.00% 2,625,344 12 Financial 12 2,916,687 2.72%
2.40% 2,098,266 15 HH Equipment & Appliances 13 2,756,497 2.57%
2.80% 2,465,767 13 Personal Services 14 2,606,138 2.43%
2.50% 2,187,253 14 Cigarettes 15 2,322,593 2.16%
2.10% 1,802,030 16 Media & Promotion 16 2,060,210 1.92%
1.90% 1,677,122 17 Property 17 2,056,954 1.92%
1.80% 1,561,438 18 Education 18 1,895,450 1.77%
0.90% 742,815 20 Apparel / Personal Accessories 19 921,784 0.86%
0.90% 802,852 19 Industrial Product 20 911,118 0.85%
0.70% 586,367 21 Baby & Maternity 21 810,651 0.76%
Similar rank Increase rank Decrease rank
The Rising Middle Class in Indonesia
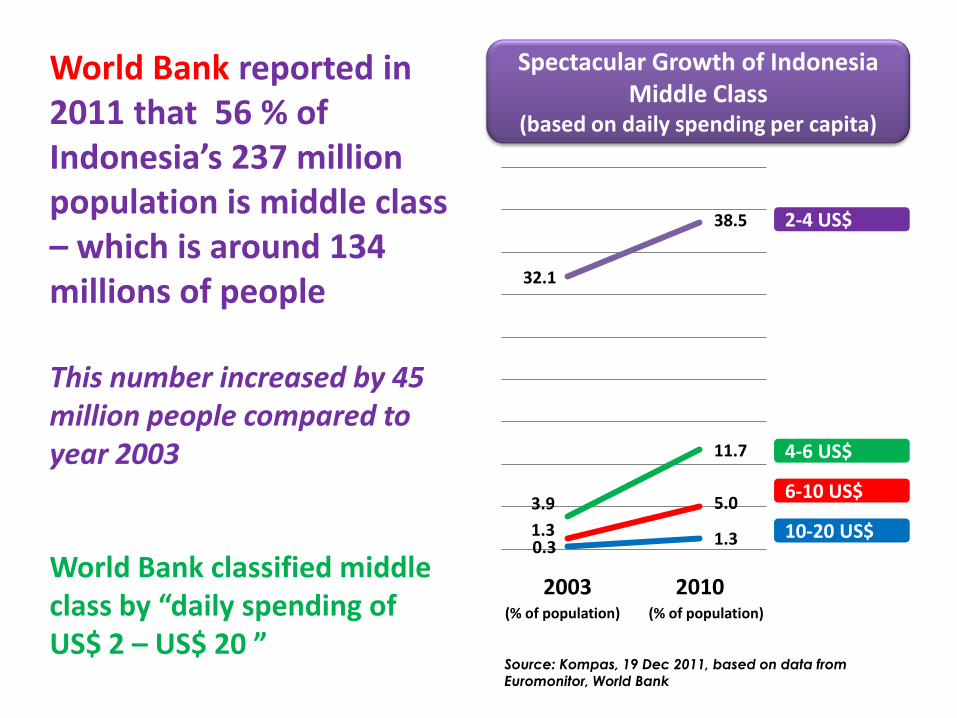
World Bank reported in 2011 that 56 % of Indonesia’s 237 million population is middle class – which is around 134 millions of people
This number increased by 45 million people compared to year 2003
Source: Kompas, 19 Dec 2011, based on data from Euromonitor, World Bank
Spectacular Growth of Indonesia Middle Class
(based on daily spending per capita)
0.3 1.31.3
5.03.9
11.7
32.1
38.5
2003 2010(% of population) (% of population)
10-20 US$
6-10 US$
4-6 US$
2-4 US$
World Bank classified middle class by “daily spending ofUS$ 2 – US$ 20 ”
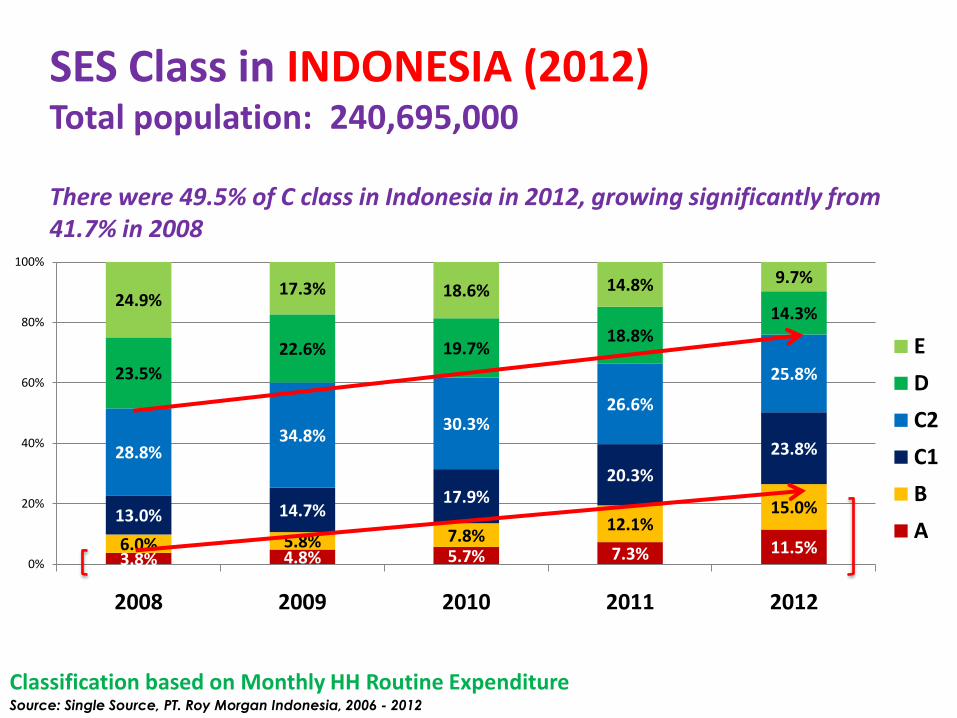
SES Class in INDONESIA (2012)Total population: 240,695,000
Source: Single Source, PT. Roy Morgan Indonesia, 2006 - 2012
3.8% 4.8% 5.7% 7.3% 11.5%6.0% 5.8% 7.8%12.1%
15.0%13.0% 14.7%17.9%
20.3%
23.8%28.8%34.8%
30.3%26.6%
25.8%23.5%
22.6% 19.7%18.8%
14.3%24.9%
17.3% 18.6% 14.8% 9.7%
0%
20%
40%
60%
80%
100%
2008 2009 2010 2011 2012
E
D
C2
C1
B
A
Classification based on Monthly HH Routine Expenditure
There were 49.5% of C class in Indonesia in 2012, growing significantly from 41.7% in 2008
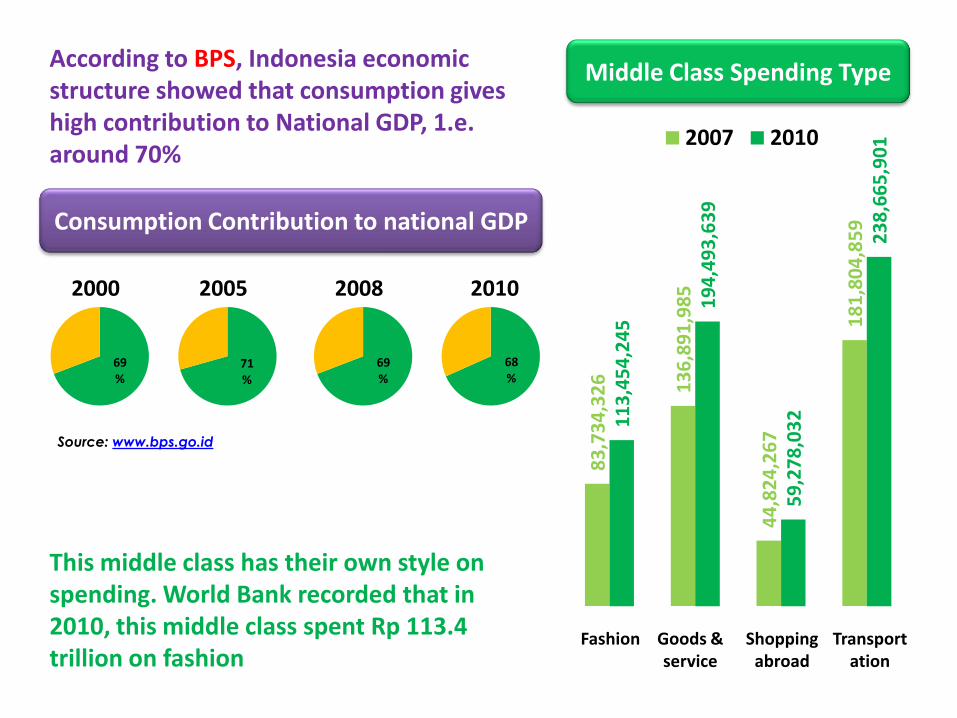
According to BPS, Indonesia economic structure showed that consumption gives high contribution to National GDP, 1.e. around 70%
Source: www.bps.go.id
Consumption Contribution to national GDP
69%
71%
69%
68%
2000 2005 2008 2010
This middle class has their own style on spending. World Bank recorded that in 2010, this middle class spent Rp 113.4 trillion on fashion
Middle Class Spending Type
83
,73
4,3
26
13
6,8
91
,98
5
44
,82
4,2
67
18
1,8
04
,85
9
11
3,4
54
,24
5
19
4,4
93
,63
9
59
,27
8,0
32
23
8,6
65
,90
1 2007 2010
Fashion Goods & service
Shopping abroad
Transportation
Indonesia Segmentation
2012
Segment 2
CONVENTIONAL
FAMILY LIFE
2005 2012
34.7% 24.2%
Average Age 35.5 years
AB 15.6%
C 50.2%
DE 34.2%
SOCIAL CLASS
50% Blue Collars
34% Housewives
5% Small Business
Owners
5% White Collars
OCCUPATION
74.7% 90.0% 6.0% 42.2% 15.0% 4.4% 9.0% 3.4% 44.2%
Visiting Modern Channel in past 4 Weeks
Shopping Mall
Supermarket/
Hypermarket Minimart
17.9% 15.1% 23.9%
• Core of “middle Indonesia” with value centered in
personal and family (and children) life.
• Seek financial security, worry for debt, but dream to
improve standard of living (own home, vehicle, visit
malls)
• Play safe at work and in general life
• Look for good, solid and reliable product for
value for money – mix branded and store brand
they trust most
Internet Penetration
11.7%
More than once a day 29%
Once a day 10%
A few times a week 31%
Once a week 10%
Less often than once a week 19%
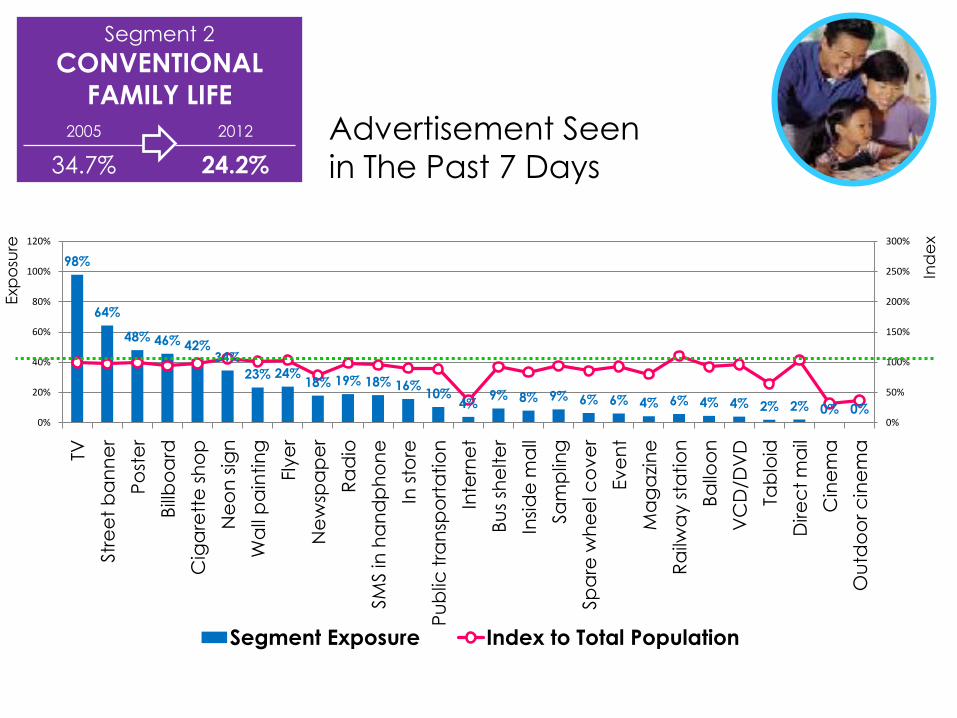
Segment 2
CONVENTIONAL
FAMILY LIFE
2005 2012
34.7% 24.2%
98%
64%
48% 46% 42%34%
23% 24%18% 19% 18% 16%
10%4%
9% 8% 9% 6% 6% 4% 6% 4% 4% 2% 2% 0% 0%0%
50%
100%
150%
200%
250%
300%
0%
20%
40%
60%
80%
100%
120%
TV
Str
ee
t b
an
ne
r
Po
ste
r
Bill
bo
ard
Cig
are
tte
sh
op
Ne
on
sig
n
Wa
ll p
ain
tin
g
Fly
er
Ne
wsp
ap
er
Ra
dio
SM
S in
ha
nd
ph
on
e
In s
tore
Pu
blic
tra
nsp
ort
atio
n
Inte
rne
t
Bu
s sh
elte
r
Insi
de
ma
ll
Sa
mp
ling
Sp
are
wh
ee
l co
ve
r
Ev
en
t
Ma
ga
zin
e
Ra
ilwa
y s
tatio
n
Ba
lloo
n
VC
D/D
VD
Tab
loid
Dire
ct
ma
il
Cin
em
a
Ou
tdo
or
cin
em
a
Segment Exposure Index to Total Population
Advertisement Seen
in The Past 7 Days
Exp
osu
re
Ind
ex
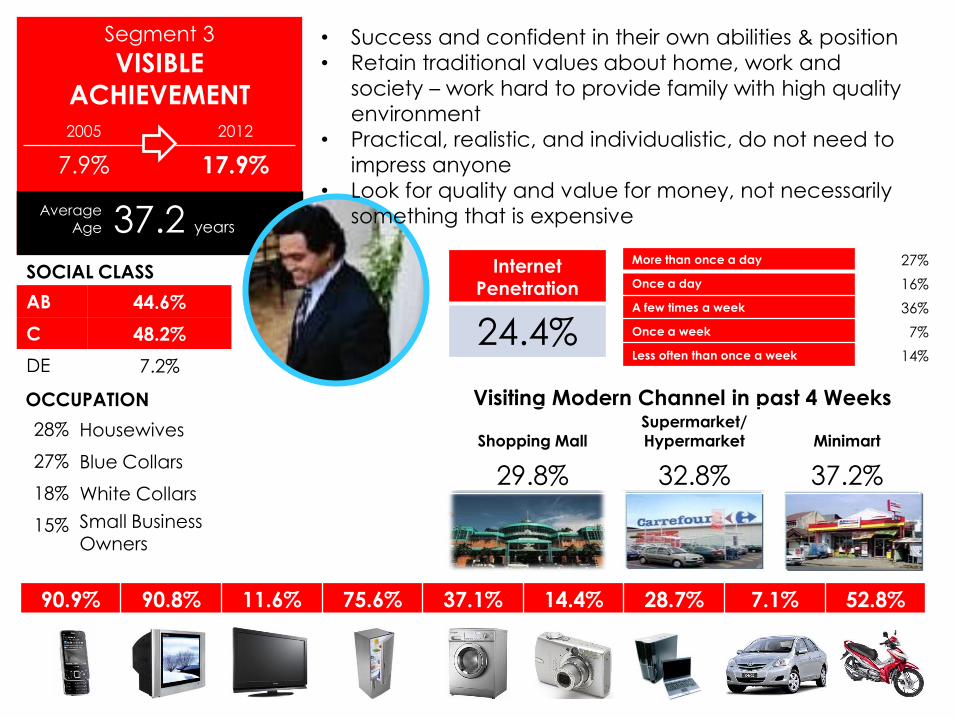
Segment 3
VISIBLE
ACHIEVEMENT
2005 2012
7.9% 17.9%
Average Age 37.2 years
AB 44.6%
C 48.2%
DE 7.2%
SOCIAL CLASS
28% Housewives
27% Blue Collars
18% White Collars
15% Small Business Owners
OCCUPATION
90.9% 90.8% 11.6% 75.6% 37.1% 14.4% 28.7% 7.1% 52.8%
Visiting Modern Channel in past 4 Weeks
Shopping Mall
Supermarket/
Hypermarket Minimart
29.8% 32.8% 37.2%
• Success and confident in their own abilities & position
• Retain traditional values about home, work and
society – work hard to provide family with high quality
environment
• Practical, realistic, and individualistic, do not need to
impress anyone
• Look for quality and value for money, not necessarily
something that is expensive
Internet Penetration
24.4%
More than once a day 27%
Once a day 16%
A few times a week 36%
Once a week 7%
Less often than once a week 14%
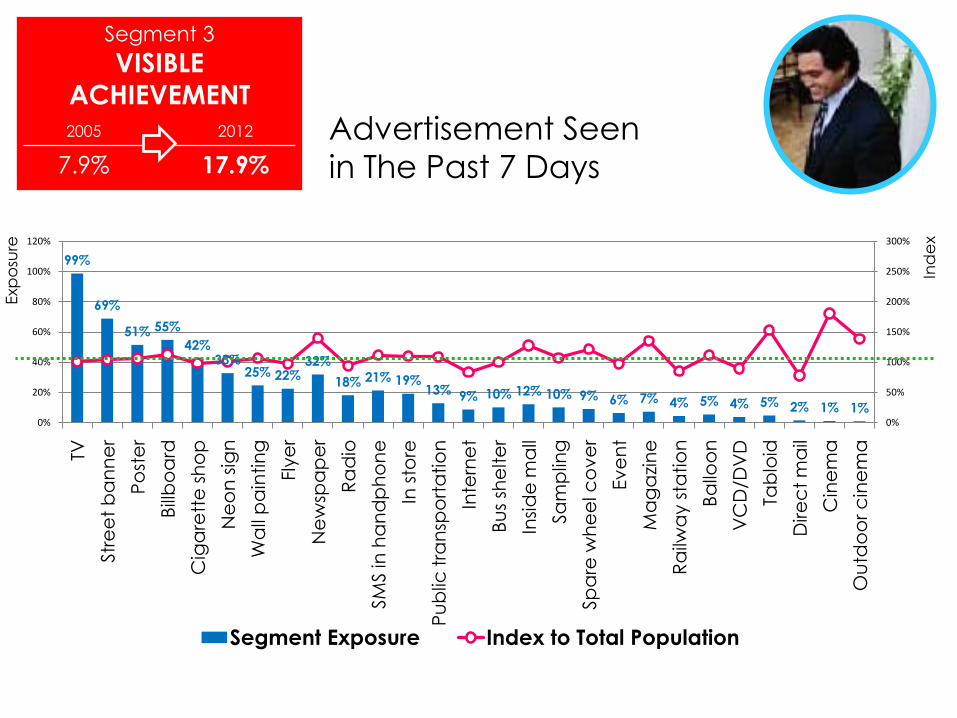
Segment 3
VISIBLE
ACHIEVEMENT
2005 2012
7.9% 17.9%
99%
69%
51% 55%
42%33%
25% 22%32%
18% 21% 19%13% 9% 10% 12% 10% 9% 6% 7% 4% 5% 4% 5% 2% 1% 1%
0%
50%
100%
150%
200%
250%
300%
0%
20%
40%
60%
80%
100%
120%
TV
Str
ee
t b
an
ne
r
Po
ste
r
Bill
bo
ard
Cig
are
tte
sh
op
Ne
on
sig
n
Wa
ll p
ain
tin
g
Fly
er
Ne
wsp
ap
er
Ra
dio
SM
S in
ha
nd
ph
on
e
In s
tore
Pu
blic
tra
nsp
ort
atio
n
Inte
rne
t
Bu
s sh
elte
r
Insi
de
ma
ll
Sa
mp
ling
Sp
are
wh
ee
l co
ve
r
Ev
en
t
Ma
ga
zin
e
Ra
ilwa
y s
tatio
n
Ba
lloo
n
VC
D/D
VD
Tab
loid
Dire
ct
ma
il
Cin
em
a
Ou
tdo
or
cin
em
a
Segment Exposure Index to Total Population
Advertisement Seen
in The Past 7 Days
Exp
osu
re
Ind
ex
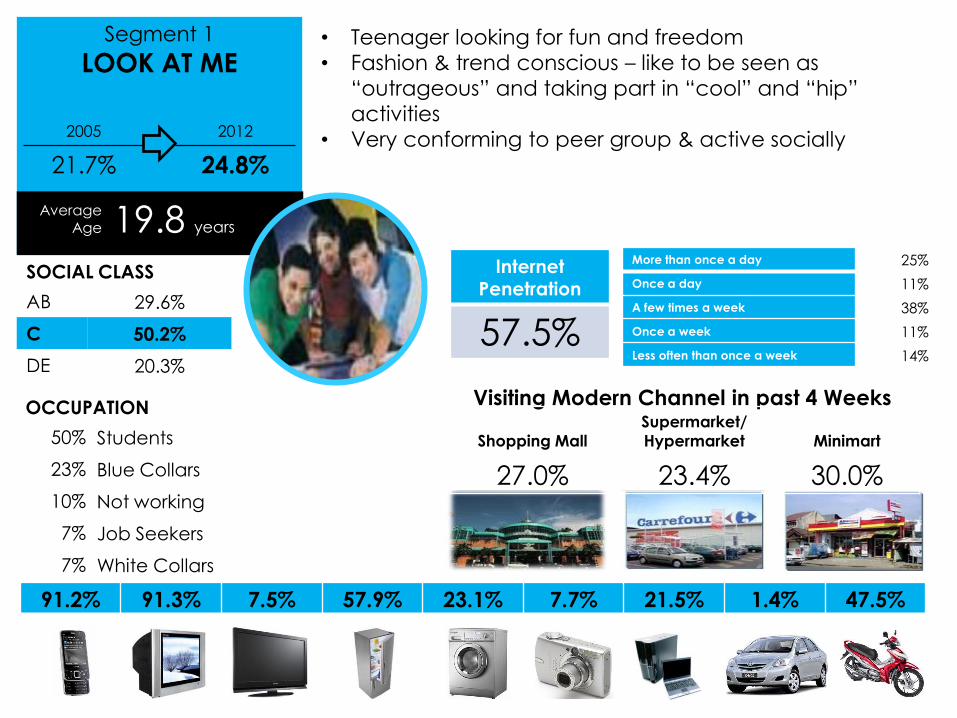
Segment 1
LOOK AT ME
2005 2012
21.7% 24.8%
Average Age 19.8 years
AB 29.6%
C 50.2%
DE 20.3%
SOCIAL CLASS
50% Students
23% Blue Collars
10% Not working
7% Job Seekers
7% White Collars
OCCUPATION
91.2% 91.3% 7.5% 57.9% 23.1% 7.7% 21.5% 1.4% 47.5%
Visiting Modern Channel in past 4 Weeks
Shopping Mall
Supermarket/
Hypermarket Minimart
27.0% 23.4% 30.0%
• Teenager looking for fun and freedom
• Fashion & trend conscious – like to be seen as
“outrageous” and taking part in “cool” and “hip”
activities
• Very conforming to peer group & active socially
Internet Penetration
57.5%
More than once a day 25%
Once a day 11%
A few times a week 38%
Once a week 11%
Less often than once a week 14%
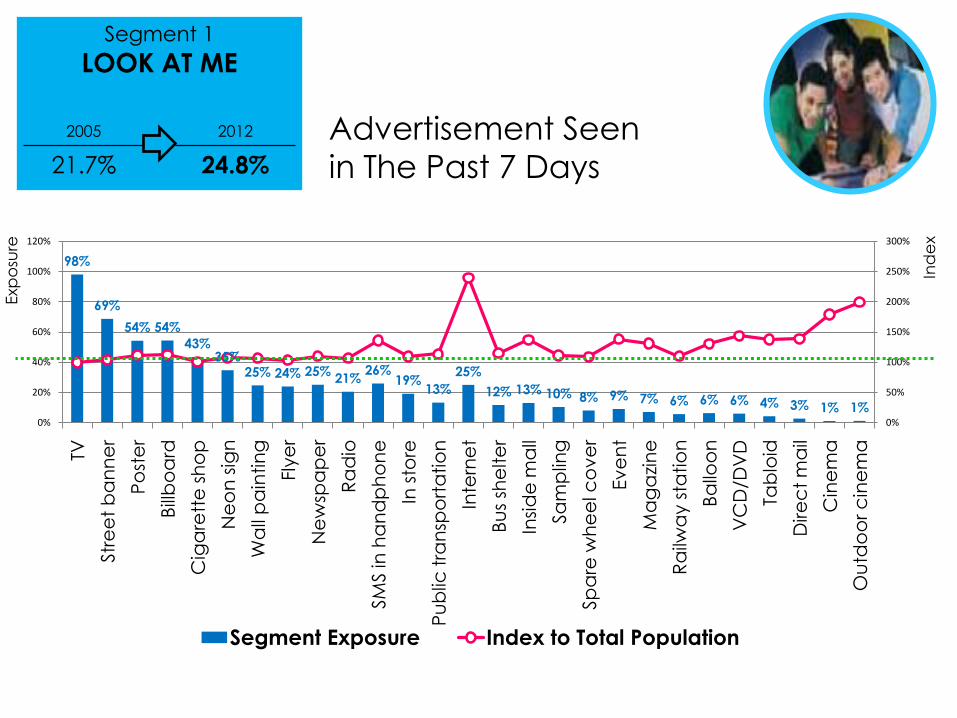
Segment 1
LOOK AT ME
2005 2012
21.7% 24.8%
98%
69%
54% 54%
43%35%
25% 24% 25%21%
26%19%
13%
25%
12% 13% 10% 8% 9% 7% 6% 6% 6% 4% 3% 1% 1%0%
50%
100%
150%
200%
250%
300%
0%
20%
40%
60%
80%
100%
120%
TV
Str
ee
t b
an
ne
r
Po
ste
r
Bill
bo
ard
Cig
are
tte
sh
op
Ne
on
sig
n
Wa
ll p
ain
tin
g
Fly
er
Ne
wsp
ap
er
Ra
dio
SM
S in
ha
nd
ph
on
e
In s
tore
Pu
blic
tra
nsp
ort
atio
n
Inte
rne
t
Bu
s sh
elte
r
Insi
de
ma
ll
Sa
mp
ling
Sp
are
wh
ee
l co
ve
r
Ev
en
t
Ma
ga
zin
e
Ra
ilwa
y s
tatio
n
Ba
lloo
n
VC
D/D
VD
Tab
loid
Dire
ct
ma
il
Cin
em
a
Ou
tdo
or
cin
em
a
Segment Exposure Index to Total Population
Advertisement Seen
in The Past 7 Days
Exp
osu
re
Ind
ex

Indonesia Digital
Landscape
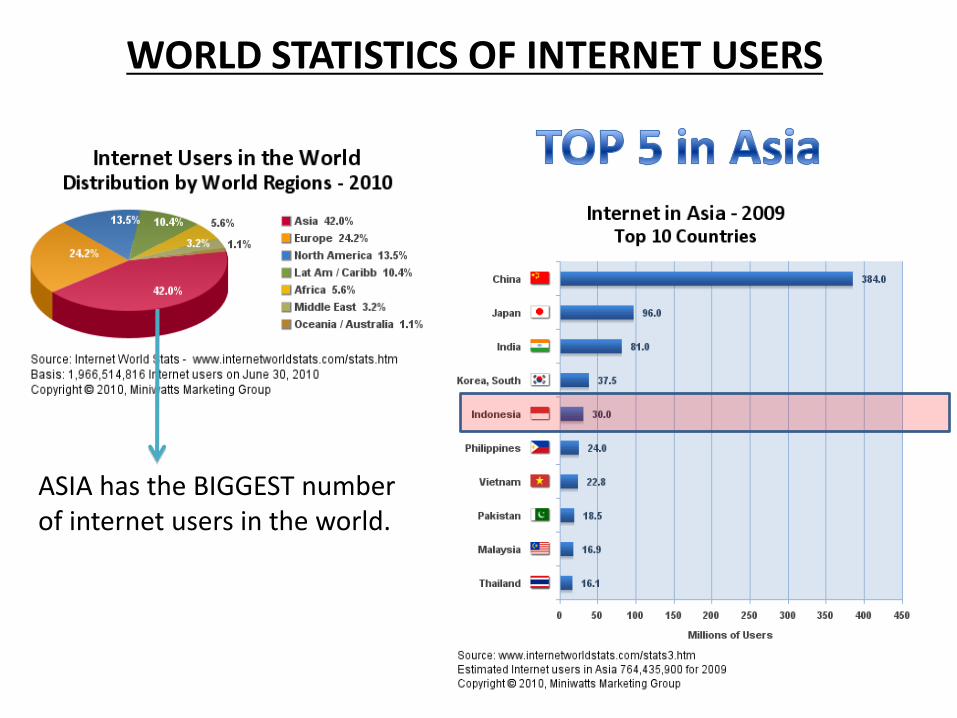
ASIA has the BIGGEST number of internet users in the world.
WORLD STATISTICS OF INTERNET USERS
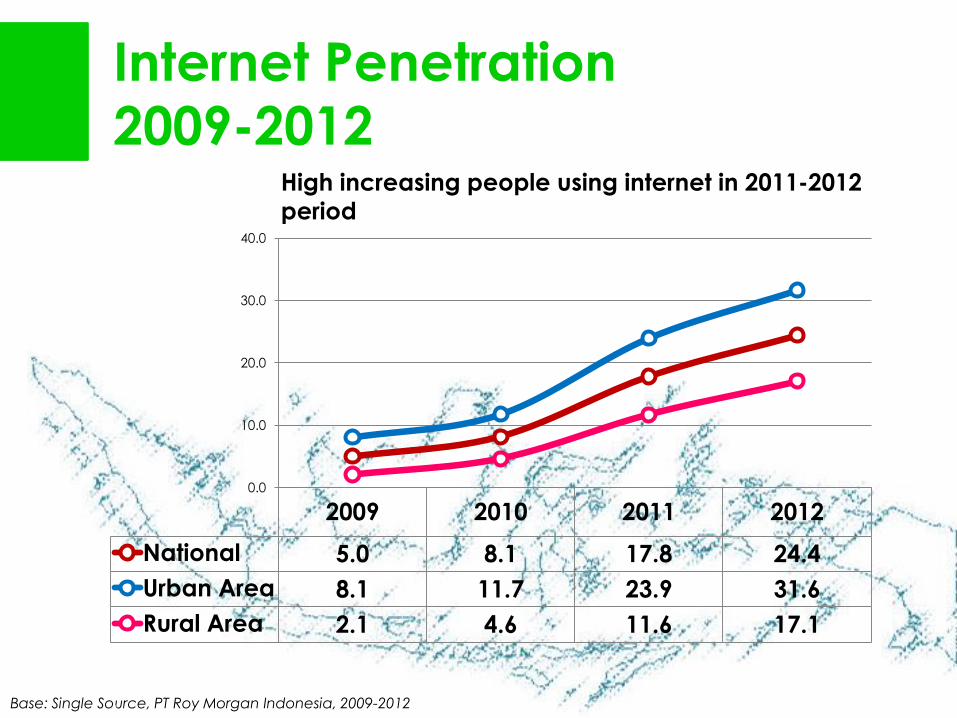
Internet Penetration
2009-2012
Base: Single Source, PT Roy Morgan Indonesia, 2009-2012
2009 2010 2011 2012
National 5.0 8.1 17.8 24.4
Urban Area 8.1 11.7 23.9 31.6
Rural Area 2.1 4.6 11.6 17.1
0.0
10.0
20.0
30.0
40.0
High increasing people using internet in 2011-2012
period
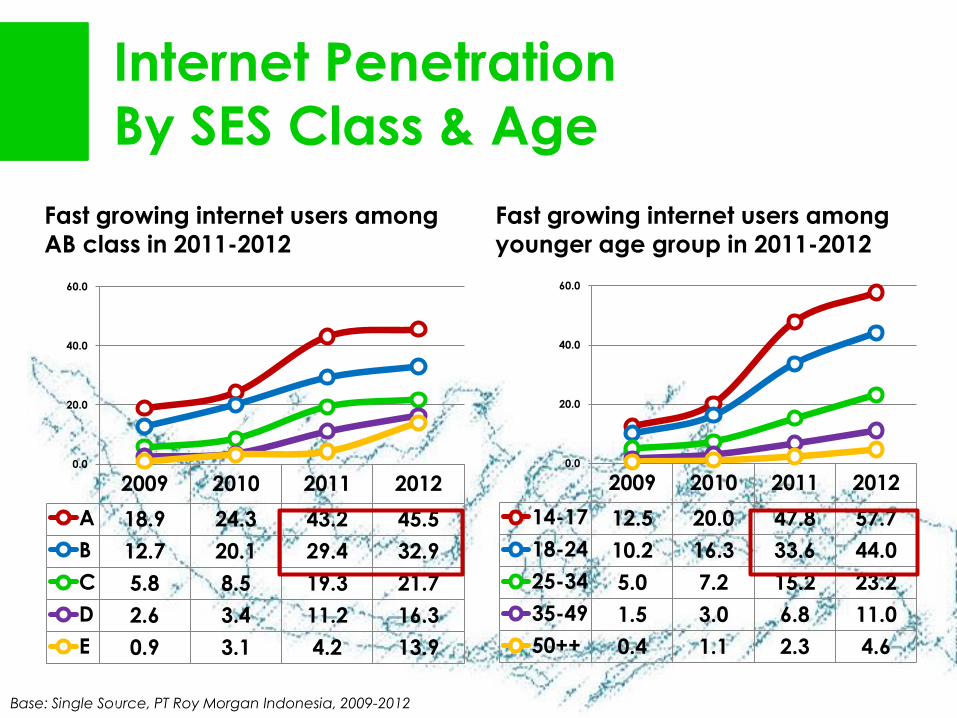
Internet Penetration
By SES Class & Age
Base: Single Source, PT Roy Morgan Indonesia, 2009-2012
2009 2010 2011 2012
A 18.9 24.3 43.2 45.5
B 12.7 20.1 29.4 32.9
C 5.8 8.5 19.3 21.7
D 2.6 3.4 11.2 16.3
E 0.9 3.1 4.2 13.9
0.0
20.0
40.0
60.0
Fast growing internet users among
younger age group in 2011-2012
2009 2010 2011 2012
14-17 12.5 20.0 47.8 57.7
18-24 10.2 16.3 33.6 44.0
25-34 5.0 7.2 15.2 23.2
35-49 1.5 3.0 6.8 11.0
50++ 0.4 1.1 2.3 4.6
0.0
20.0
40.0
60.0
Fast growing internet users among
AB class in 2011-2012
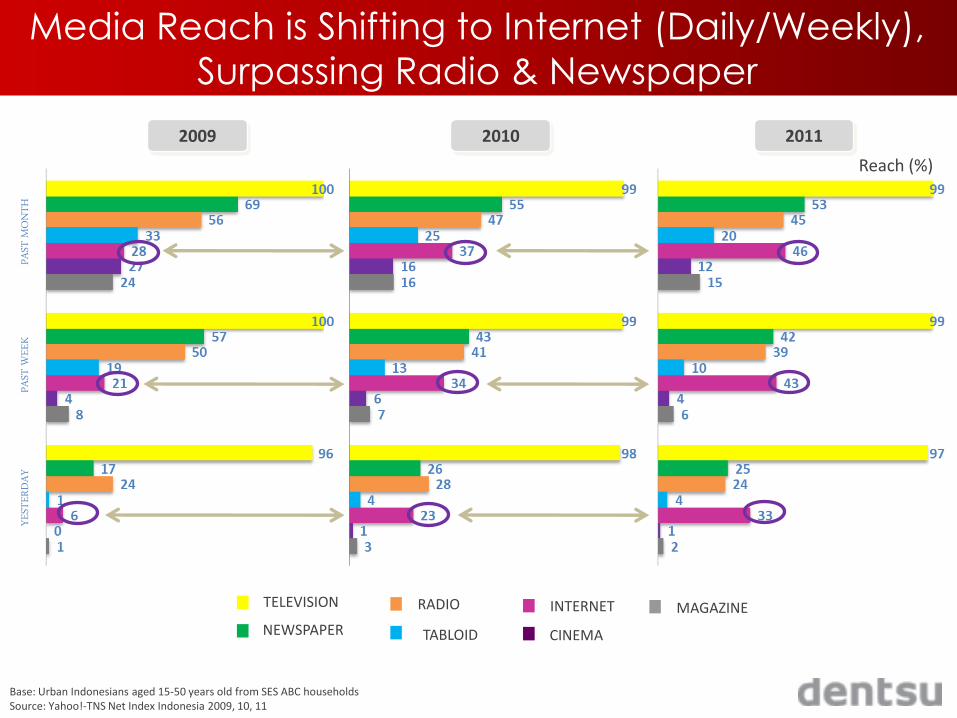
Media Reach is Shifting to Internet (Daily/Weekly),
Surpassing Radio & Newspaper
Base: Urban Indonesians aged 15-50 years old from SES ABC households Source: Yahoo!-TNS Net Index Indonesia 2009, 10, 11
2009 2010
TELEVISION
NEWSPAPER
RADIO
TABLOID
INTERNET
CINEMA
MAGAZINE
Reach (%)
2011
PAST
MON
THPA
ST W
EEK
YEST
ERDA
Y
TOTAL Base: Urban Indonesians aged 15-50 years old from SES ABC households Source: Yahoo!-TNS Net Index Indonesia 2009, 10, 11
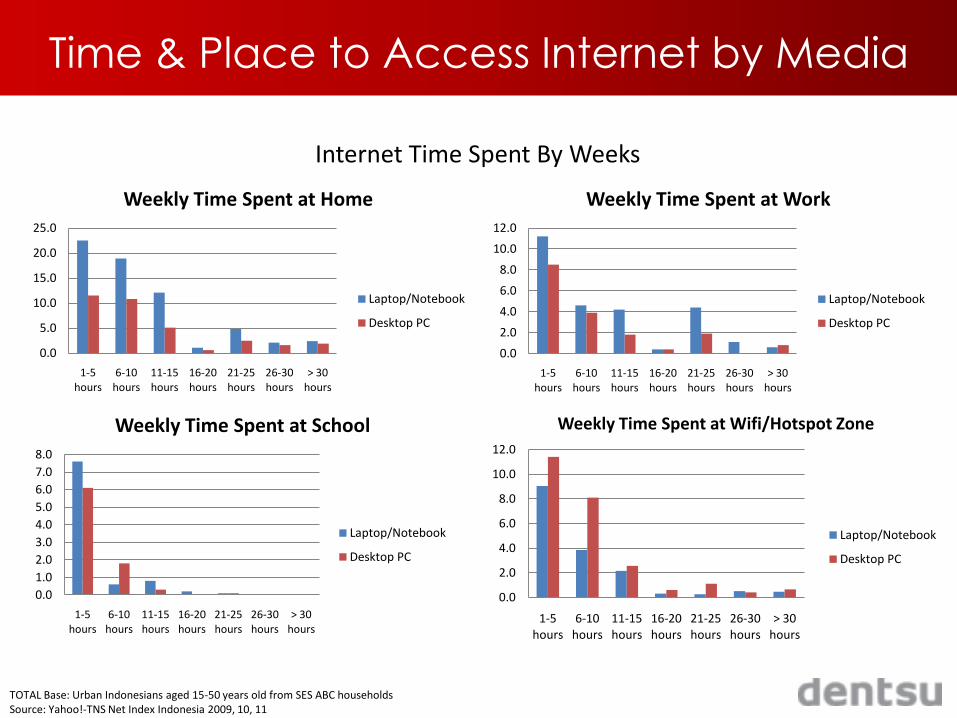
Time & Place to Access Internet by Media
0.0
5.0
10.0
15.0
20.0
25.0
1-5 hours
6-10 hours
11-15 hours
16-20 hours
21-25 hours
26-30 hours
> 30 hours
Weekly Time Spent at Home
Laptop/Notebook
Desktop PC
0.0
1.0
2.0
3.0
4.0
5.0
6.0
7.0
8.0
1-5 hours
6-10 hours
11-15 hours
16-20 hours
21-25 hours
26-30 hours
> 30 hours
Weekly Time Spent at School
Laptop/Notebook
Desktop PC
0.0
2.0
4.0
6.0
8.0
10.0
12.0
1-5 hours
6-10 hours
11-15 hours
16-20 hours
21-25 hours
26-30 hours
> 30 hours
Weekly Time Spent at Work
Laptop/Notebook
Desktop PC
0.0
2.0
4.0
6.0
8.0
10.0
12.0
1-5 hours
6-10 hours
11-15 hours
16-20 hours
21-25 hours
26-30 hours
> 30 hours
Weekly Time Spent at Wifi/Hotspot Zone
Laptop/Notebook
Desktop PC
Internet Time Spent By Weeks
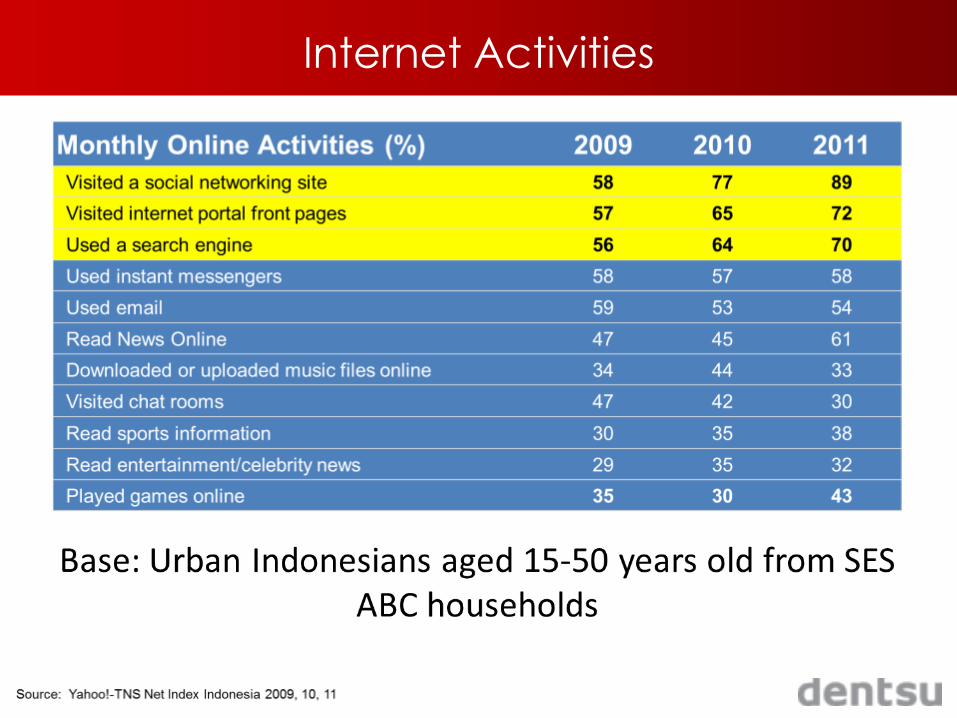
Internet Activities

Most Visited Websites
Kompas, Vivanews and Detik are the most visited News Portal among Indonesia’s most visited sites
*based on Effective Measure, for age 18-35y.o

Total Unique
Visitors
(000)
% Reach
GOOGLE.CO.ID 6,058 86.1
FACEBOOK.COM 5,735 81.5
BLOGGER.COM 4,385 62.3
YAHOO.CO.ID 4,282 60.8
YAHOO.COM 4,153 59.0
GOOGLE.COM 3,823 54.3
YOUTUBE.COM 3,298 46.9
WORDPRESS.COM 3,185 45.3
KASKUS.US 2,185 31.0
4SHARED.COM 2,074 29.5
DETIK.COM 1,637 23.3
WIKIPEDIA.ORG 1,614 22.9
TOKOBAGUS.COM 1,391 19.8
TWITTER.COM 1,381 19.6
KOMPAS.COM 1,152 16.4
VIVANEWS.COM 1,105 15.7
Media
Comscore, MF 25+, March 2012
Top Website in Indonesia
5 best local website:
1. Kaskus.Us
2. Detik.com
3. Tokobagus.com
4. Kompas.com
5. Vivanews.com
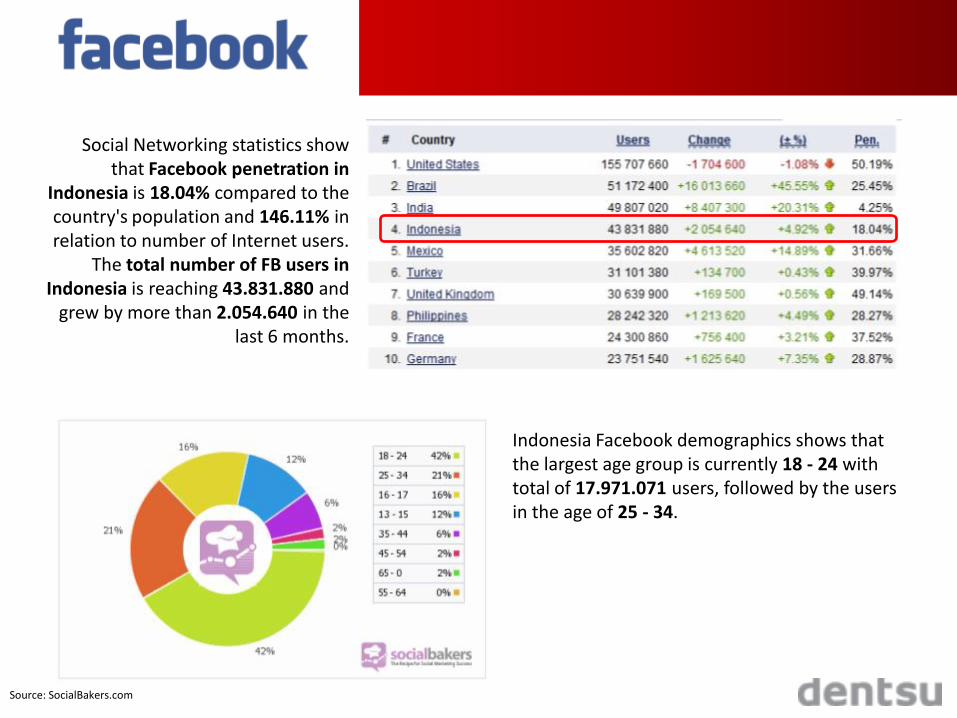
Indonesia Facebook demographics shows that the largest age group is currently 18 - 24 with total of 17.971.071 users, followed by the users in the age of 25 - 34.
Social Networking statistics show that Facebook penetration in
Indonesia is 18.04% compared to the country's population and 146.11% in relation to number of Internet users.
The total number of FB users in Indonesia is reaching 43.831.880 and
grew by more than 2.054.640 in the last 6 months.
Source: SocialBakers.com
Source: facebook.com
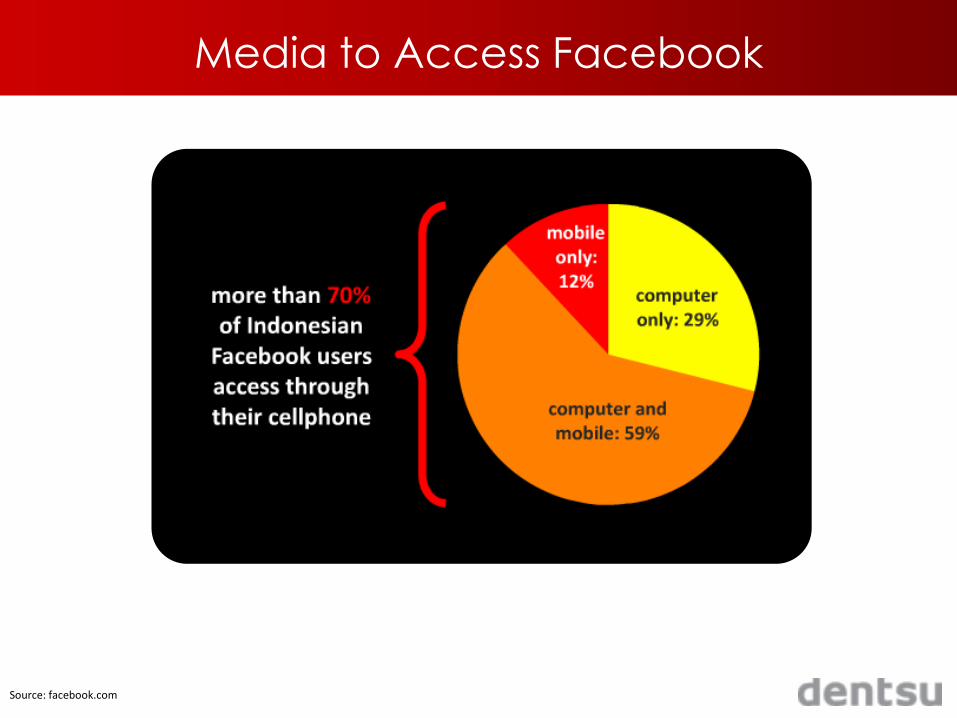
Media to Access Facebook
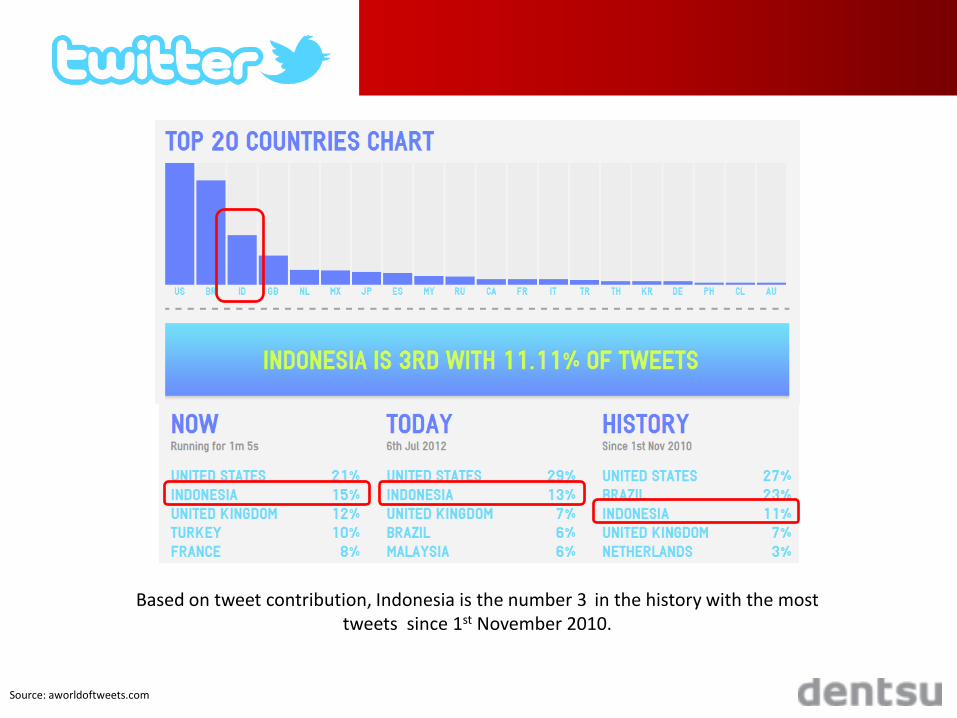
Based on tweet contribution, Indonesia is the number 3 in the history with the most tweets since 1st November 2010.
Source: aworldoftweets.com
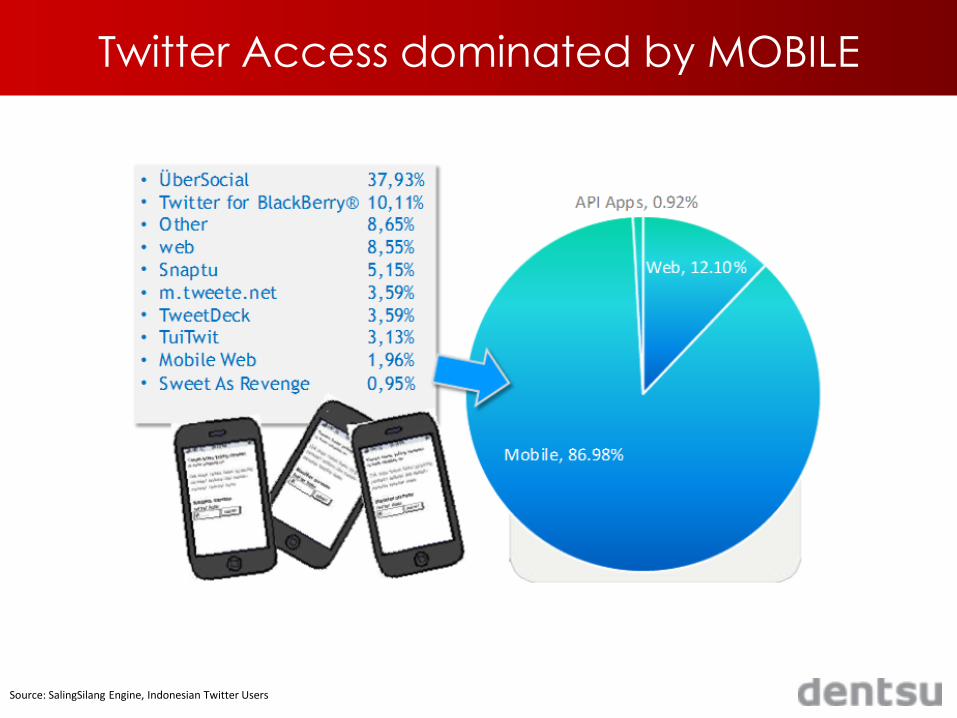
Source: SalingSilang Engine, Indonesian Twitter Users
Twitter Access dominated by MOBILE
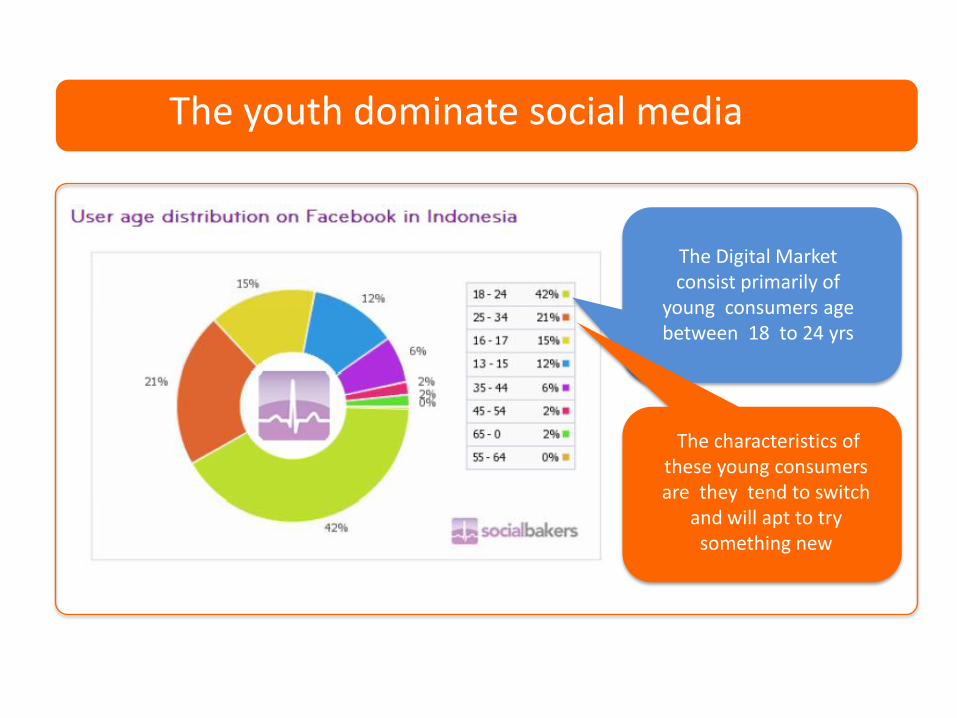
The Digital Market consist primarily of
young consumers age between 18 to 24 yrs
The characteristics of these young consumers are they tend to switch
and will apt to try something new
The youth dominate social media
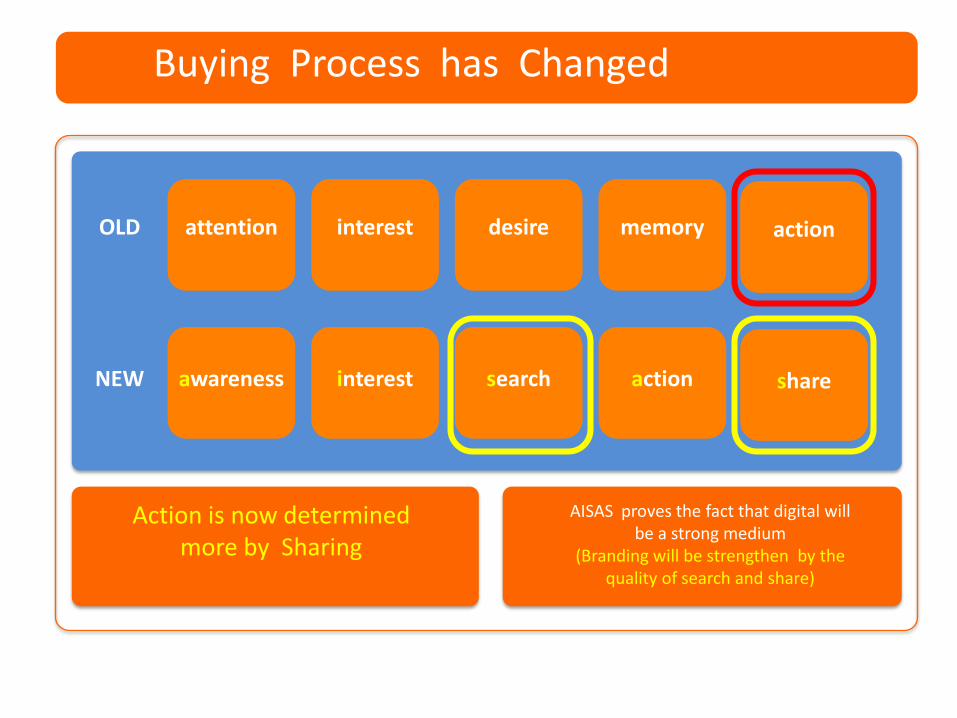
attention interest desire memory action
awareness interest search action share
OLD
NEW
Action is now determined more by Sharing
AISAS proves the fact that digital will be a strong medium
(Branding will be strengthen by the quality of search and share)
Buying Process has Changed
sales
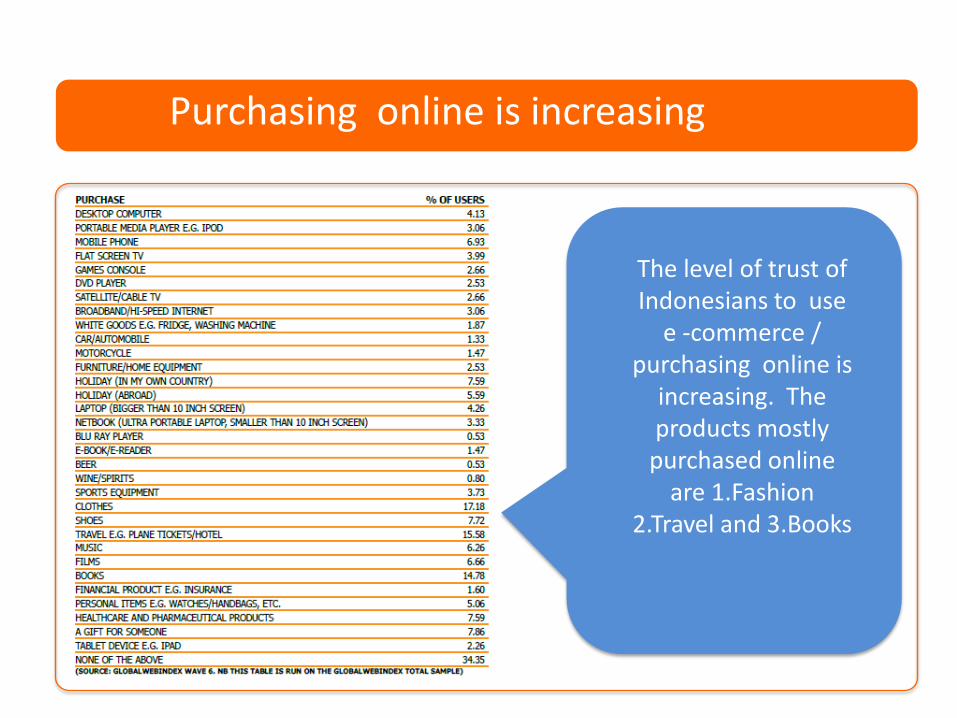
The level of trust of Indonesians to use
e -commerce / purchasing online is
increasing. The products mostly
purchased online are 1.Fashion
2.Travel and 3.Books
Purchasing online is increasing

The Prospect of Mobile
Advertising in Indonesia
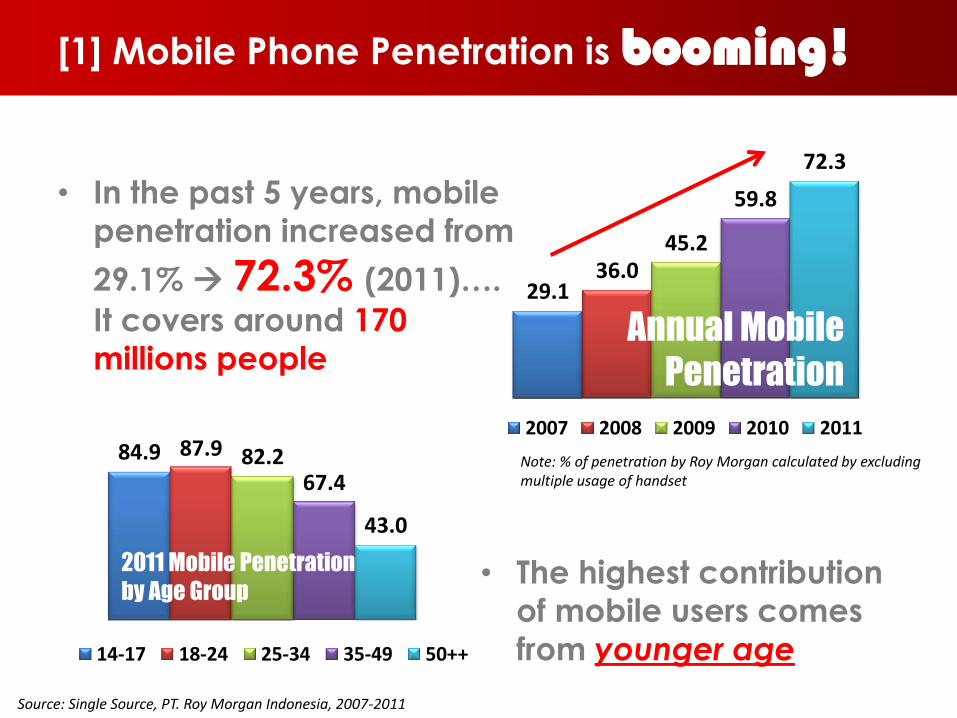
[1] Mobile Phone Penetration is booming!
• In the past 5 years, mobile
penetration increased from
29.1% 72.3% (2011)….
It covers around 170
millions people
Source: Single Source, PT. Roy Morgan Indonesia, 2007-2011
• The highest contribution
of mobile users comes
from younger age
29.136.0
45.2
59.8
72.3
2007 2008 2009 2010 201184.9 87.9 82.2
67.4
43.0
14-17 18-24 25-34 35-49 50++
Annual Mobile
Penetration
2011 Mobile Penetration
by Age Group
Note: % of penetration by Roy Morgan calculated by excluding multiple usage of handset
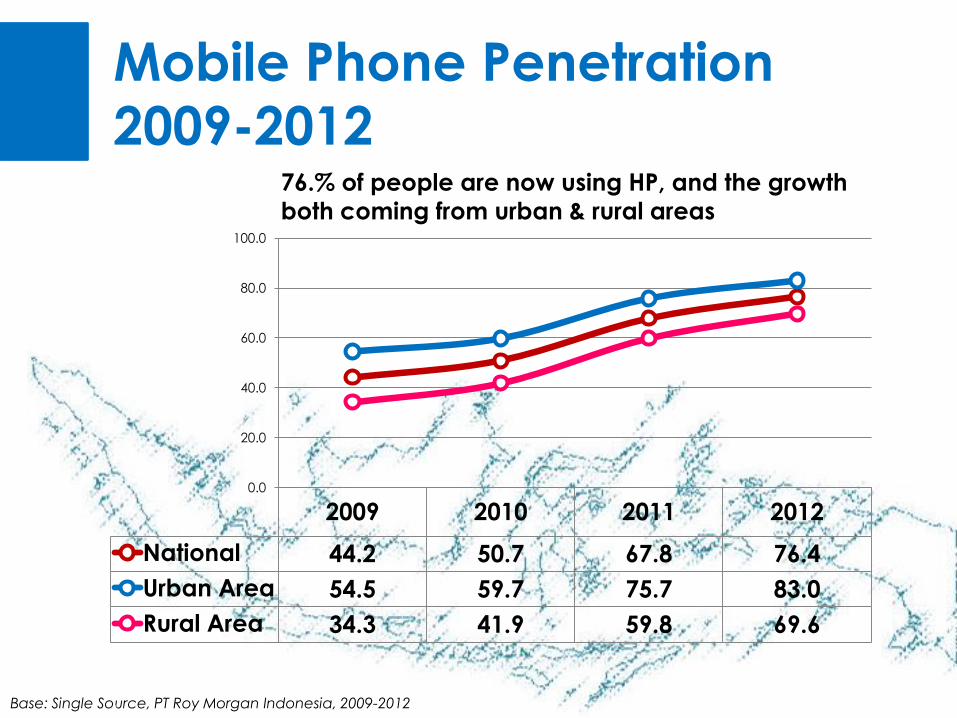
Mobile Phone Penetration
2009-2012
Base: Single Source, PT Roy Morgan Indonesia, 2009-2012
2009 2010 2011 2012
National 44.2 50.7 67.8 76.4
Urban Area 54.5 59.7 75.7 83.0
Rural Area 34.3 41.9 59.8 69.6
0.0
20.0
40.0
60.0
80.0
100.0
76.% of people are now using HP, and the growth
both coming from urban & rural areas
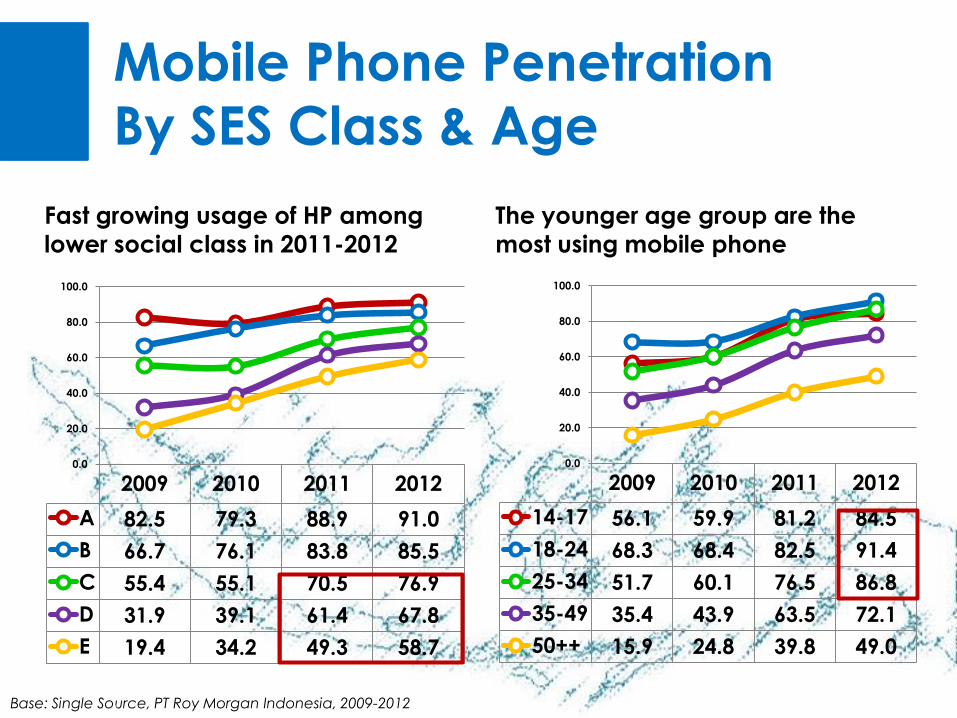
Mobile Phone Penetration
By SES Class & Age
Base: Single Source, PT Roy Morgan Indonesia, 2009-2012
2009 2010 2011 2012
A 82.5 79.3 88.9 91.0
B 66.7 76.1 83.8 85.5
C 55.4 55.1 70.5 76.9
D 31.9 39.1 61.4 67.8
E 19.4 34.2 49.3 58.7
0.0
20.0
40.0
60.0
80.0
100.0
The younger age group are the
most using mobile phone
2009 2010 2011 2012
14-17 56.1 59.9 81.2 84.5
18-24 68.3 68.4 82.5 91.4
25-34 51.7 60.1 76.5 86.8
35-49 35.4 43.9 63.5 72.1
50++ 15.9 24.8 39.8 49.0
0.0
20.0
40.0
60.0
80.0
100.0
Fast growing usage of HP among
lower social class in 2011-2012
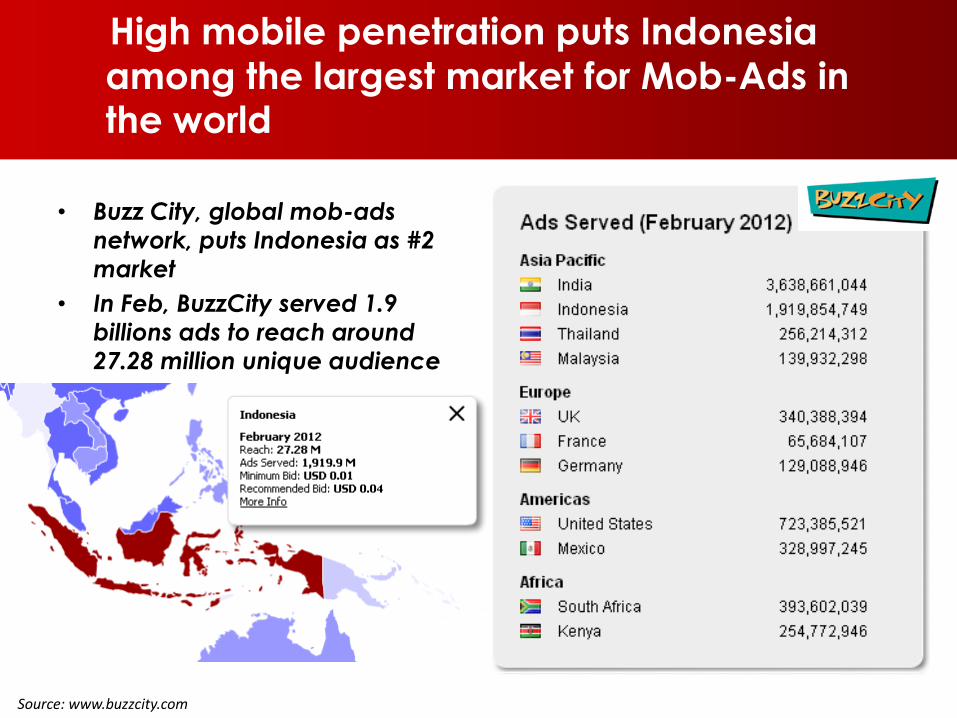
High mobile penetration puts Indonesia
among the largest market for Mob-Ads in the world
Source: www.buzzcity.com
Annual Mobile
Penetration
2011 Mobile
Penetration by Age
• Buzz City, global mob-ads
network, puts Indonesia as #2
market
• In Feb, BuzzCity served 1.9
billions ads to reach around
27.28 million unique audience
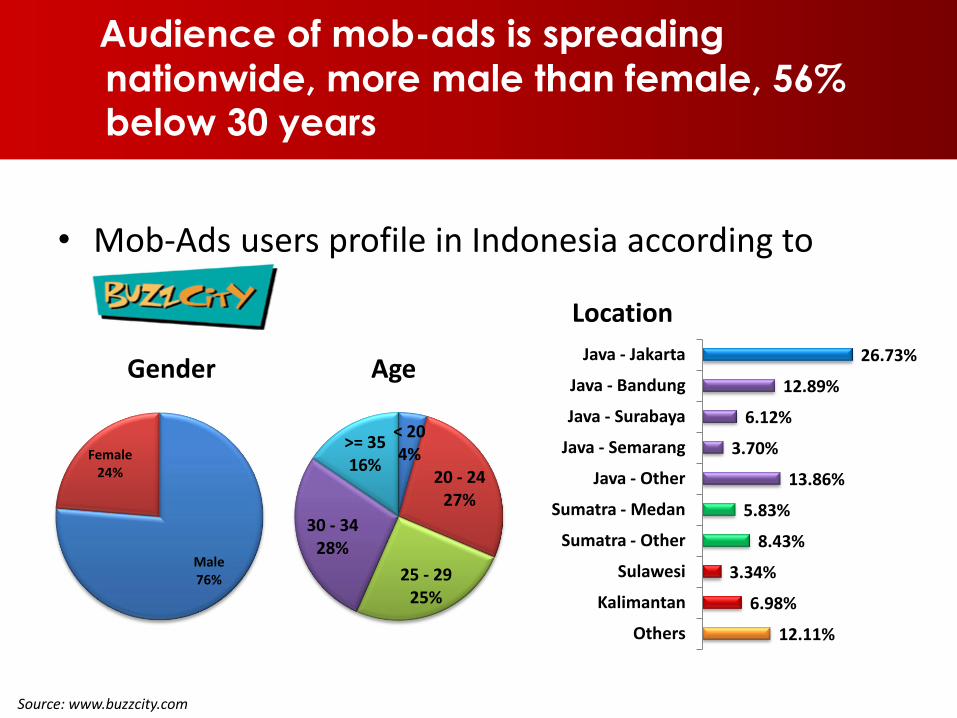
Audience of mob-ads is spreading
nationwide, more male than female, 56% below 30 years
Source: www.buzzcity.com
Annual Mobile
Penetration
2011 Mobile
Penetration by Age
Male76%
Female24%
Gender
• Mob-Ads users profile in Indonesia according to
< 204%
20 - 2427%
25 - 2925%
30 - 3428%
>= 3516%
Age
12.11%
6.98%
3.34%
8.43%
5.83%
13.86%
3.70%
6.12%
12.89%
26.73%
Others
Kalimantan
Sulawesi
Sumatra - Other
Sumatra - Medan
Java - Other
Java - Semarang
Java - Surabaya
Java - Bandung
Java - Jakarta
Location
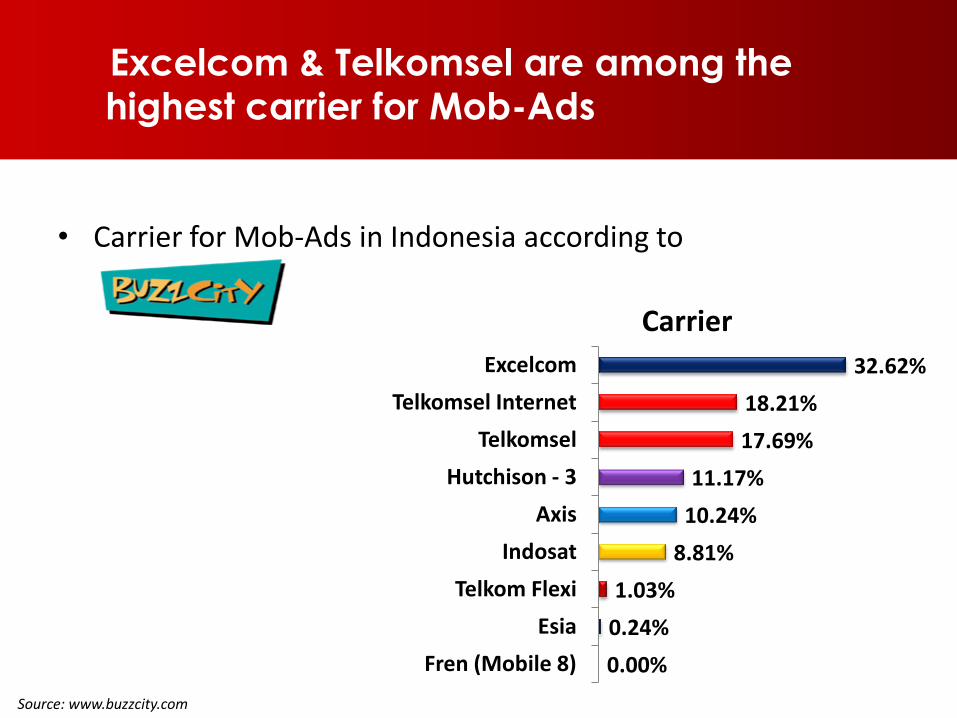
Excelcom & Telkomsel are among the highest carrier for Mob-Ads
Source: www.buzzcity.com
Annual Mobile
Penetration
2011 Mobile
Penetration by Age
• Carrier for Mob-Ads in Indonesia according to
0.00%
0.24%
1.03%
8.81%
10.24%
11.17%
17.69%
18.21%
32.62%
Fren (Mobile 8)
Esia
Telkom Flexi
Indosat
Axis
Hutchison - 3
Telkomsel
Telkomsel Internet
Excelcom
Carrier
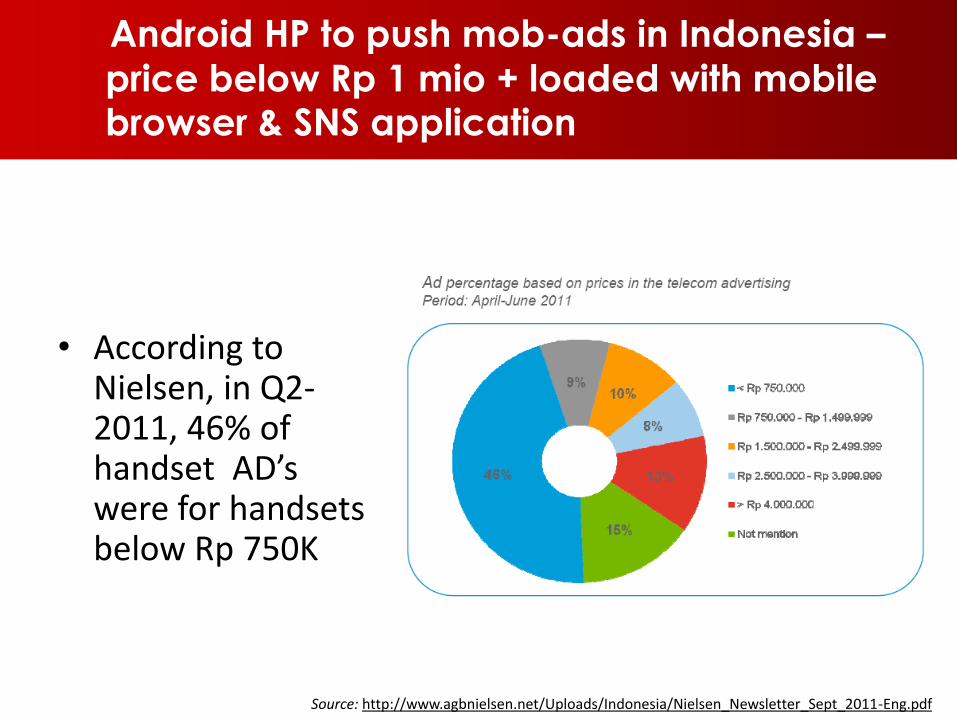
Android HP to push mob-ads in Indonesia –
price below Rp 1 mio + loaded with mobile browser & SNS application
Source: http://www.agbnielsen.net/Uploads/Indonesia/Nielsen_Newsletter_Sept_2011-Eng.pdf
Annual Mobile
Penetration
2011 Mobile
Penetration by Age
• According to Nielsen, in Q2-2011, 46% of handset AD’s were for handsets below Rp 750K

Key Success Factors
Key Success Factors
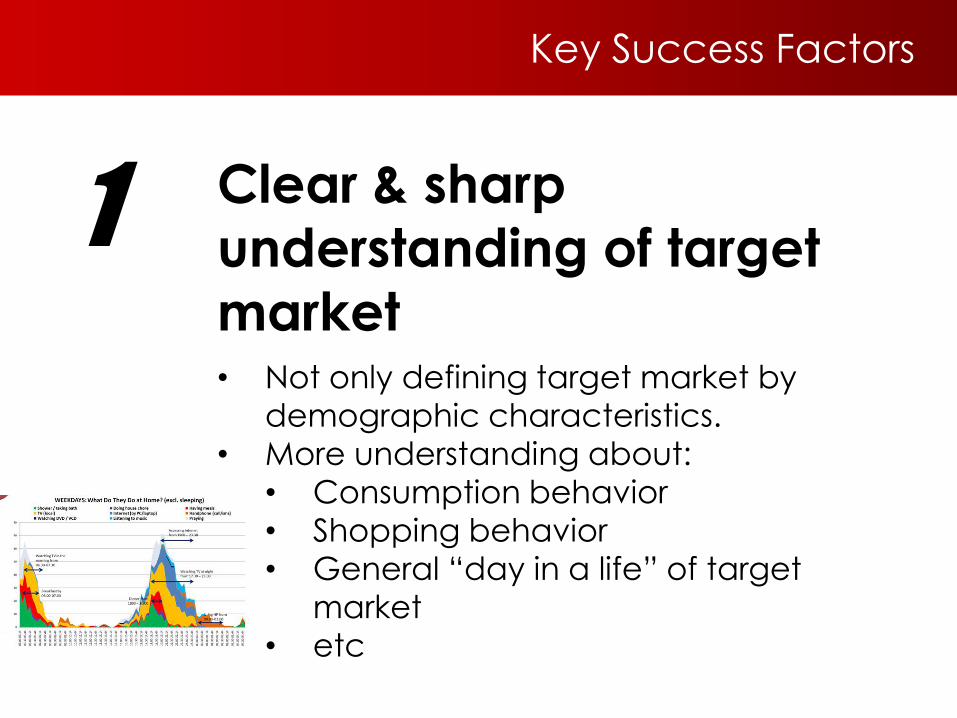
1 Clear & sharp
understanding of target
market• Not only defining target market by
demographic characteristics.
• More understanding about:
• Consumption behavior
• Shopping behavior
• General “day in a life” of target
market
• etc
Key Success Factors
2 Understanding role of
contact points in the
category• Media clutter and the fast growth of
digital/mobile media makes TV not
enough to reach the target market.
• The importance of each media is
different by category.
• Each media has different role to deliver
different messages
Key Success Factors
3 Digital Advertising (internet
& mobile) is becoming
more and more importantUtilizing digital advertising is becoming
future key success factor to reach target
market – especially youth.
• Advertiser must continuously observe the
fast growth, changes and trends in digital
world - INTERACTIVE and ENGAGING
Thank YouHarris Thajeb
June 2013