indigenous knowledge in participatory mapping of …
TRANSCRIPT

INDIGENOUS KNOWLEDGE IN PARTICIPATORY MAPPING OF
ARTISANAL FISHING ZONES:
A CASE STUDY OF ANGOCHE DISTRICT,
NAMPULA PROVINCE IN MOZAMBIQUE
ERNESTO POIOSSE HELE
December 2007

2
INDIGENOUS KNOWLEDGE IN PARTICIPATORY MAPPING OF
ARTISANAL FISHING ZONES:
A CASE STUDY OF ANGOCHE DISTRICT,
NAMPULA PROVINCE IN MOZAMBIQUE
ERNESTO POIOSSE HELE
Submitted in partial fulfilment of the academic requirements for the degree of Master of
Environment and Development (Land Information Management – LIM)
in the
Centre for Environment, Agriculture and Development
Faculty of Science and Agriculture
University of KwaZulu-Natal
Pietermaritzburg
2007
Supervisor: Dr. Denis RUGEGE

ii
ABSTRACT
Indigenous knowledge use in identifying artisanal fishing zones is the core issue in this dissertation. It seeks, on one hand, to show the potentially of this knowledge and to establish the relationships between indigenous and scientific knowledge in fishing zones identification and, on other the hand, it is also a trend for alleviating those fishing zones surrounding beaches, estuaries and bays highly exploited by artisanal fishermen. Pushing artisanal fishermen upward offshore and/or into the open sea, they will fish more quality and high economic value fish contributing to enhance their income. By so doing, artisanal fishermen will uplift their living standard and, at the same time, they will contribute to sustainable artisanal fisheries management. Angoche District in Nampula province, north of Mozambique is the study area. The study was carried out to describe the logical sequence underlying on the process of identifying artisanal fishing zones using indigenous knowledge. The relationship between indigenous and scientific knowledge is treated with particular attention. The nature of the study is descriptive and analytical based on qualitative and quantitative data. The method used for data collection was face-to-face interviews using structured and semi-structured open-ended questions. Data on socio-economic, traditional and cultural practices, technological and climate characteristics were collected, analyzed and discussed. Factors underlying artisanal fishing zones were studied. Spatial and non-spatial information for artisanal fishing zones identification was recorded applying Global Positioning Systems (GPS) and, later, processed and analyzed employing Geographical Information Systems (GIS). Finally, a map showing the localization and distribution of the identified fishing zones in the study area was produced. Results from the research show that identification of fishing zones offshore or open sea can be done simply based on local indigenous knowledge. The GIS technology employment facilitates the inclusion of indigenous knowledge into other knowledge which can be used for local decision-making. Sustainable fisheries management can only be achieved by developing a science based on the priorities of local people, and creating a technological base that includes both traditional and modern approaches to problem-solving.

iii
DECLARATION OF ORIGINALITY
This dissertation results from a research project carried out through a Masters’ Programme in the
Centre for Environment, Agriculture and Development (CEAD), University of Natal, Pietermaritzburg.
Dr Denis Rugege, the Director of the Land Information Management programe (LIM), supervised the
project.
With appropriate acknowledgements in the text where the work of others had to be used, the present
study represents the original work by the author and it has not been submitted in any form for any
degree to any other university.
Signature Date ____________________ _____ / _____ / ____ Ernesto Poiosse Hele Signature Date ______________________ _____ / _____ / _____ Denis Rugege Signature Date _____________________ _____ / ______ / _____ Dorman Chimhamhiwa

iv
ACKNOWLEDGEMENTS
This dissertation could not be completed without the positive involvement of specific people and
institutions both in South Africa and in Mozambique. The author is indebted to all whose who directly
or indirectly contributed to this study.
At the Centre for Environment, Agriculture and Development (Pietermatizburg) the author expresses
much gratitude to his supervisor, Dr Denis Rugege, for the outstanding advice that maintained the
study in line with the research aims and objectives. In their capacity of Director of Land Information
Management department, Dr Denis Rugege and Mr. Dorman Chimhamhiwa, deserve another warm
word of acknowledgement for conducting an innovative programme through which it was possible to
finalize this project in time. To the whole administrative staff, a word of thanks for their remarkable
attention and promptness to ensure a responsive and inclusive working environment.
In Mozambique, the author thanks the NORAD, through the Ministry of Fisheries, for fully sponsoring
his studies, and the National Institute for the Development of Small Scale Fisheries (IDPPE) for
granting permission to be part-time absent from work for such long period. A very special word of
thanks is reserved for all those fishing community members, government officials and research
assistants with whom the author worked in Angoche District. Gratitude is also expressed to the
Nampula IDPPE Delegation in Angoche for all unpredictable logistics offered to the author that made
this research possible.
Last but not least, the author thanks warmly his lovely family, especially, his wife who accepted
staying alone in Maputo with kids, as well as all other relatives and friends who interacted with him
during his stay in Maputo and fieldwork in Angoche district.

v
DEDICATION
This dissertation is dedicated to you my “unknown” father CHIGOHE MANGUEZE HELE who
passed away few months after I was born. To you my mum EMELINA MANDUNDO who was early
forced to leave me in childhood with my grand-mother and later you passed away in 2000. To you
my unforgettable grand-mother NHANCUNDELE for your immeasurable love, from the earliest my
childhood until 1973 when death came also to you. Although late, at least, I have been with you mum
from 1982 to 2000 but, unfortunately, I never knew my father. After my grand-mother passed away in
1973 whose grew me up in rural area, I still remember I was completely exposed to tremendous and
unpredictable suffering. I also remember that to meet conditions to complete my primary and further
studies was extremely hard and tough. I never thought I could achieve the present academic degree.
Extended dedication goes to you my lovely wife MARIA ALBERTO MOAMBA “HELE”, particularly,
for your long extended patience, especially when you had to be alone with the kids.
God, thank you so much for all.

vi
TABLE OF CONTENTS
Abstract …………………………………………………………………………………………..……..…. (ii)
Declaration of originality …………………………………………………………………………….…… (iii)
Acknowledgements …………………………………………..………………………………………….. (iv)
Dedication …………………………………………………………………………………………….…… (v)
Table of contents ………………………………………………………………………..……………….. (vi)
List of figures and plates ………………………………………………………………….………..…… (ix)
List of tables ………………………………………………………………………….…….……………... (x)
Glossary of terms ………………………………………………………………………………………… (xii)
Chapter 1: - Introduction ……………………………………………………………….…………………1
1.1 - Introduction …………………………………………………………….………..……………1
1.2 - The problem statement ……………………………………………………………………...1
1.3 - Contextualization ………………………………………………………………………….... 2
1.4 - The structure ……………………………………………………………………….….……. 3
1.5 – Conclusion ………………………………………………………………………………….. 3
Chapter 2: - Description of the study area …………………………………………….………………5
2.1 – Introduction …………………………………………………………………………………. 5
2.2 - Geographical localization …………………………………………………….………….... 5
2.3 - Demography ……………………………………………………………………..…………. 7
2.4 - Political administration ……………………………………….………….……….………... 7
2.5 - The national economy …………..…………………………………………………….…… 9
2.6 - Angoche district (the study area) ……………………………………………………..…. 10
2.6.1 - Geographical localization …………………………………………………………….... 11
2.6.1.1 - Climate ……………………………………………………………………………….... 12
2.6.1.2 - Topography ………………………………………..………………………………….. 12
2.6.1.3 - Erosion ……………………………………………………….……….……………….. 13
2.6.1.4 - Pollution ……………………………………………………………..………………… 13
2.6.2 - Demography ……………………………………………..……………………………… 14
2.6.3 - Political administration ………………………………………..….……………………. 14
2.6.4: – The economy of the district ……………………………………………….…………. 14
2.6.4.1 - Transport and communications ……….…………………………………...………. 16

vii
2.6.4.2 - Health ……………………………………………………………….……….………... 16
2.6.4.3 - Water supply …………………………………………………….……….….…..……. 17
2.6.4.4 - Education …………………………………………………………………..………..... 18
2.7 – Conclusion …………………………………………………………………………………. 18
Chapter 3: - Fisheries in Mozambique: An overview ……………………………………..………. 21
3.1 - Introduction ……………………………………………………………….……………….. 21
3.2 - Background …………………………………………………………..………..………….. 21
3.3 - Fisheries overview ………………………………………………………………………... 24
3.4 – Conclusion ………………………………………………………………………………… 27
Chapter 4: Research methodology …………………………………..……………………………… 29
4.1 – Introduction ……………………………………………………………………………….. 29
4.2 - Research topic ………………………………………………………………..…………… 29
4.3 - Literature review …………………………………………………………………………… 29
4.4 - Conceptual framework ………………………………………….…………………..…….. 32
4.5 - Justification …………………………………………………………………………...……. 34
4.6 - The purpose of the study ……………………………………………………………….... 35
4.7 - The objectives of the study ………………….…………………….………………..……. 36
4.8 - The research hypotheses …………………………………………………………..…….. 36
4.9 - Research methodology ………………………………………………………………........ 37
4.9.1 - Sampling and procedures ………………………………………………..............……. 37
4.9.2 - The exploratory survey …………………………………….……………………….…… 38
4.9.3 - The pilot study …………….…………………………………………………………..….. 40
4.10 - Data collection ………………………………………………………….…………….……. 41
4.11 - Questionnaires ………………………..…………………………………………..………. 42
4.12 – Conclusion ………………………………………………………………………………… 43
Chapter 5: - Data analysis ………………………………………………….………....…….………….. 45
5.1 – Introduction …………………………………………………………………………………. 45
5.2 - Planning Areas (PA’s) ………………………………………………………….…………...45
5.2.1 - General information …………………………………………………….……..…………. 46
5.2.2 - Language, religious and marriage status ………………….………………………….. 46
5.2.3 - Socio-economic characteristics …………………………………….…...……….…….. 48

viii
5.2.3.1 - Demography …………………………………………………………..…….………..… 49
5.2.3.2 - Education ……………………………………………………………………………...... 50
5.2.3.3 - Economy ……………………………………………………………………………….... 50
5.2.3.4 - Housing ………………………………………………………………………………….. 52
5.2.4 - Traditional and cultural practices …………………………………….…..…………….. 54
5.2.5 - Coast physical characteristics ………………………………………..….………..….…. 58
5.2.6 – Technological characteristics ............................................................................…... 60
5.2.7 - Climate characteristics ………………………………………….………………….….…. 62
5.2.7.1 - Period of occurrence …………………………………………………………….….….. 62
5.2.7.2 - Influence on fishing …………………………………..……….……………….……..… 65
5.2.8 - Management measures ……………………………………….…..………………….….. 72
5.3 - Winds identification …………………………………………….………………………….... 74
5.4 - Artisanal fishing zones identification ............................................................………..... 76
5.4.1 - Spatial and non-spatial data collection ………………….……………….….……….… 80
5.4.2 - Spatial and non-spatial data processing ……………….………….…………….…….. 80
5.5 – Conclusion ………………………………………………………………………………….. 84
Chapter 6: - Discussion and conclusion ……………….…………………………………………….. 85
6.1 - Introduction ………………………………………………………….……………….……… 85
6.2 - Discussion ………………………………………………………………………………….... 85
6.2.1 - Research hypotheses …………………………………………………………………..... 85
6.2.2 - Response to the research questions ...................................................................…...88
6.3 - Remarks ………………………………………………………………………….….…...….. 90
6.4 - Conclusion ……………………………….…………………………………………...….….. 91
6.5 – Recommendation ………………………………………………………………….…..…… 93
References ……………………………………………………………………………..………..….…….. 95
Appendices ………………………………………………………………………………..……..……… (xix)
Appendix 1: Questionnaire for individuals …………………………………………...…..….. (xix)
Appendix 2: Questionnaire for group interview ……………………………………….…… (xxvii)
Appendix 3: Questionnaire for scientists ……………………………………………..……. (xxxiii)
Appendix 4: Questionnaire for identification of fishing zones ……………………..….… (xxxvii)

ix
LIST OF FIGURES AND PLATES
Figure Page
Figure 1 - Geographical location of Mozambique ……..…………………………………………………. 6
Figure 2 - Growth in total population for Mozambique, 1950 – 2007………………………………….... 7
Figure 3 – Structure of political administration in Mozambique ……………………………….…….…. 8
Figure 4 - Expected economic growth in 2007 for some economic sectors……………………..…... 10
Figure 5 - Map of the study area ……………………………………………………………………....…. 11
Figure 6 – Use patterns of potential arable area in Angoche District ……………………….….…….. 15
Figure 7 – Classification of the road network in Angoche District ………………………………...….. 16
Figure 8 – Classification of health units in Angoche District …………………………………….…….. 17
Figure 9 - Number and location of improved water supply points in Angoche District ……….......… 17
Figure 10 - School network in Angoche District ……………………………………………………….... 18
Figure 11 – Total shrimp production from 2002 to 2006 …………………………………..………..…. 25
Figure 12 - National artisanal fisheries census for 2007 ……………………………………..…….….. 26
Figure 13 - Total catches and economic contribution …………………………….……………….....… 27
Figure 14 - Flowchart on sampling procedures ………………………………………………….……… 38
Figure 15 - Flowchart on spatial and non-spatial data ………………………………………..….…..... 82
Figure 16 - Map of identified artisanal fishing zones ……………………………………..…….…..….. 83
Plate Page
Plate 1 - Women participation in artisanal fisheries in Angoche fishing villages……………………… 4
Plate 2 - Community development in artisanal in artisanal fishing villages, Angoche ……….…..…. 20
Plate 3 - Industrial fleet and artisanal fishing boat ……………………………………..…..….…..…… 28
Plate 4 – Selective artisanal fishing gears in fishing zones…………..………………..….…..…..…… 44
Plate 5 – Fishing zones’ indicators and winds identification in fishing villages ……………..…….…. 79
Plate 6 – Artisanal fishing zones identification in Angoche coastal zone ……………….….………… 94

x
LIST OF TABLES
TABLES Page
Table 1: - The fishery sector - licensed boats …………………………………….…………….....…… 24
Table 2: - Industrial fisheries fleets ……………………………………………..…………….………..… 25
Table 3: - Total eligible population in the 32 selected fishing villages in Angoche district ….…...…. 39
Table 4: - Total eligible sample size in the 32 selected fishing villages in Angoche district….…...... 39
Table 5: - Data collection coverage by Planning Area………………………………….………….…… 46
Table 6: - Categories of fishermen by Planning Areas (PA’s)……………………….…………….……46
Table 7: - Language spoken by respondents by Planning Area………………….……………..…..… 47
Table 8: - Religious beliefs of respondents by Planning Area………………….……………….…..… 47
Table 9: - Number of spouses of the respondents by Planning Area …….……………………......... 48
Table 10: - Main occupations of respondents by Planning Area…………………………………....… 49
Table 11: - Gender on respondents by Planning Area……………………………….……………….… 49
Table 12: - Fishing villagers' household per family…………………………………………..…….….… 50
Table 13: - Level of education of respondents’ family by Planning Area .………………..……..….… 50
Table 14: - Best cassava production season within an annual cycle by Planning Area ………….… 51
Table 15: - Best rice production season by Planning Area ………………………………….……..…. 51
Table 16: - Best beans production season by Planning Area ….……………………………………… 52
Table 17: - Best peanuts production season by Planning Area ..………………..…………………… 52
Table 18: - Type of house of respondents by Planning Area……………………………….……….… 53
Table 19: - Main assets owned by respondents as a household by Planning Area …………...……53
Table 20: - Observation of the ‘Cleaning cemeteries practice’ by Planning Area ………….…….… 55
Table 21: - Observation of the ‘Hijabo ceremony practice’ by Planning Area ………………....…… 55
Table 22: - Observation of the ‘Olomba ceremony practice’ by Planning Area …………………..… 56
Table 23: - Observation of the ‘Lihuco ceremony practice’ by Planning Area .………………….…. 57
Table 24: - Observation of the ‘Inkutho ceremony practice’ by Planning Area ………………….......58
Table 25: - Mangrove influence on species characteristics by Planning Area …………………..… 58
Table 26: - River influence on species characteristics by Planning Area ….……………………..… 59
Table 27: - Dense forest influence on species characteristics by Planning Area ……………..…… 59
Table 28: - Undulating terrain influence on species characteristics by Planning Area ………….… 59
Table 29: - Fishing gears types in use by Planning Area …………………………..…….……..…… 60
Table 30: - Opinion on fishing season by Planning Area …………………………………….…..…… 61
xi
Table 31: - Most common species caught by fishing gears ……………………………….………..... 61
Table 32: - Characterization of rainy season by Planning Area …………………….….….……….... 62
Table 33: - Characterization of dry season by Planning Area ……………………………….….….... 63
Table 34: - Characterization of ‘Northerly wind’ season by Planning Area ………………….…….... 63
Table 35: - Characterization of ‘Southerly wind’ season by Planning Area ……..……….….……… 64
Table 36: - Characterization of ‘Rising tides’ season by Planning Area …………….……….……… 64
Table 37: - Characterization of ‘Falling tides’ season by Planning Area …………………….…….… 65
Table 38: - Opinion on ‘Northerly wind’ influence on fishing by Planning Area ……………....…..… 65
Table 39: - Opinion on ‘Southerly wind’ influence on fishing by Planning Area .……………….…… 66
Table 40: - Opinion of ‘Western wind’ influence on fishing by Planning Area …………………….... 66
Table 41: - Opinion on ‘Eastern wind’ influence on fishing by Planning Area .…………………….... 66
Table 42: - Opinion on ‘Southerly East wind’ influence on fishing by Planning Area ………….…… 67
Table 43: - Opinion on ‘Southerly West wind’ influence on fishing by Planning Area ……………… 67
Table 44: - Opinion on influence of ‘Rainy season’ on fishing by Planning Area ………………....… 68
Table 45: - Opinion on influence of ‘Dry season’ on fishing by Planning Area …………………….… 68
Table 46: - Opinion on influence of ‘New moon’ on fishing by Planning Area .…………………….… 69
Table 47: - Opinion on influence of ‘Full moon’ on fishing by Planning Area …………...……..….… 69
Table 48: - Opinion on influence of ‘First quarter moon’ on fishing by Planning Area …………...…. 70
Table 49: - Opinion on influence of ‘Second quarter moon’ on fishing by Planning Area ………..… 70
Table 50: - Opinion on influence of ‘Rising tides’ on fishing by Planning Area ……………………… 71
Table 51: - Opinion on influence of ‘Falling tides’ on fishing by Planning Area ……..……….…...…. 71
Table 52: - Opinion on influence of ‘Dirty water’ on fishing by Planning Area ………………….……. 72
Table 53: - Opinion on influence of ‘Water transparency’ on fishing by Planning Area ……….….… 72
Table 54: - Opinion on ‘Best months’ for fishing by Planning Area ……………………...….……....... 73
Table 55: - Opinion on ‘Worst months’ for fishing by Planning Area ……………..………….…….… 73
Table 56: - Spatial and non-spatial data in the fishing zones ………………………………..……….. 80
Table 57: - Converted spatial data …………………………………………………………………..…... 81
Table 58: - Processed spatial and non-spatial data for the identified fishing zones …..……….…… 81

xii
GLOSSARY OF TERMS
Artisanal Fisheries (AF)
It is defined as local fishing. It may use or not boats up to 10 metres with or without outboard or
inboard marine engines. It may also use or not ice for fish conservation and, normally, it use
traditional fishing gears. As proposed on PESPA, 2006 artisanal fisheries comprise two distinguished
branches: - subsistence; and, - commercial fisheries;
Artisanal Fishing Zone (AFZ)
It is an area in maritime and/or inland waters (inshore and/or offshore) - beach, bay, sandy banks,
open sea, estuarine, river, lagoon, etc. - identified by Artisanal fishermen (women and men) where
they, normally, fish (personal);
Ethnoecology (EE)
It is the study of local or native people’s interaction with the environment in which they live and work,
including their perceptions, use and management, and knowledge. Sub-disciplines of ethnoecology
include ethnobiology, ethnobotany, ethnozoology, and ethnopharmacology. Local people, social
scientists, and natural scientists ideally conduct ethnoecological research together, as a team
(NOAA, 2004);
Fisheries Sustainable Management (FSM)
It is management of fishing activity that meets the needs of the present without compromising the
ability of future generations to meet their own needs;
Fishers’ Ecological Knowledge (FEK)
It is local knowledge concerning interannual, seasonal, lunar, diet and food-related variations in the
behaviour and movements of marine fishes and mammals. Such knowledge is passed from
generation to generation of fishers and influences the nature, timing, and location of their fishing
(NOAA, 2004);

xiii
Fishery Sector (FS)
It is the combination of the industrial sub-sector and the small scale fisheries sub-sector with
institutional apparatus as well as the connected fisheries activities that enable the interaction and the
operation of the fishing process in the country. The small scale fisheries sub-sector, on the other
hand, encompasses semi-industrial and Artisanal fisheries (IDPPE, 2006);
Fishing Unit (FU)
It is a combination of fishing boat and fishing gear or one of these items (boat or gear) alone
employing fishermen or a fisherman (woman and/or man) with or without a fishing boat employing
fishing gear (IDPPE, 2006);
Geographical Information Systems (GIS)
It can be seen as a system of hardware, software and procedures designed to support the capture,
management, manipulation, analysis, modelling and display of spatially-referenced data for solving
complex planning and management problems. In the strictest sense, however, a GIS is a computer
system for capturing, storing, checking, integrating, manipulating, analyzing and displaying data
which are spatially referenced to the earth, i.e. data identified according to their locations on the
earth surface. It comprises a set of processes leading from observation and collection of data
through analysis, to produce information useful in decision-making (LIM, 2006);
Gillnet (GN)
It is fishing gear composed by nets in rectangular form, vertically maintained in water by physical
weights put under the inferior rope and by buoyant in the upper rope to enable fish capture (IDPPE,
2006);
Global Positioning System (GPS)
It is a constellation of orbiting satellites maintained by the United States Government for the purpose
of defining geographic positions on and above the surface of the earth. It consists of three segments:

xiv
-a) user segment; -b) control segment; and, -c) space segment. GPS was developed by US Defence
as a worldwide navigation resource for military and civilian use (LIM, 2006).
Hand Line (HL)
It is a fishing gear encompassing one or more fishing hooks, normally, operationalized by using
fisherman’s hand (IDPPE, 2006);
Indigenous Knowledge (IK)
It can be viewed as having two sources: traditional knowledge and nontraditional knowledge. … 1)
aboriginal people also possess knowledge and experiences not grounded in traditional lifestyles,
spirituality, philosophy, social relations, and cultural values; and 2) indigenous knowledge is the
articulation, and frequently the dialectic, of traditional and nontraditional knowledge (NOAA, 2004);
Local Ecological Knowledge (LEK)
LEK is similar to traditional ecological knowledge (TEK) in that it is tied to place (e.g., specific hunting
or fishing grounds) and is knowledge acquired through experience and observation. It can be
acquired over a single lifetime or over many generations. LEK differs from TEK in that it does not
require an ancient or even a multi-generational accumulation of knowledge, it does not require that
the population be indigenous, and it does not require embedding in a broader shared culture. In
other words, an individual can accumulate LEK over the course of one lifetime interacting with a local
environment (NOAA, 2004);
Local Fisheries Knowledge (LFK)
It is a similar to local ecological knowledge in that it is tied to place, is acquired through experience
and observation, and may be acquired over a single lifetime or passed down over many generations.
Unlike local ecological knowledge, LFK includes non-ecological knowledge related to fisheries,
including but not limited to business aspects of fishing, economics, social dynamics, and local fishing
culture (NOAA,2004);

xv
National Institute for the Development of Small-Scale Fisheries (IDPPE)
It is a national state institution entitled to judicial and administrative autonomy from the Ministry of
Fisheries. Its independent legal status was granted by Council of Ministers Decree nr. 62/98 of 24
November. The Main objective of IDPPE is to promote practices which contribute to the development
of small scale fisheries, to help improve the livelihoods and working conditions of fishing
communities and to increase the level of national production of protein-rich nutrition. The main areas
of intervention are the socio-economic, fishing technology and planning related issues, respectively
(IDPPE, 2006);
Nontraditional Knowledge (NTK)
It is derived from “interactions with non-aboriginal people and institutions; television and other
modern media; formal schooling in numeracy and literacy; the adoption of Western scientific thinking;
and exposure to foreign values, attitudes, and philosophies. In contrast, traditional knowledge
systems are based on the shared experiences, customs, values, traditions, subsistence lifestyles,
social interactions, ideological orientations, and spiritual beliefs unique to aboriginal communities.
Together, these two foundations of knowledge articulate to form a worldview … that provides
meaning and value to the lives of contemporary aboriginal peoples (NOAA, 2004);
Planning Area (PA)
It is a coastal geographical area encompassing a number of fishing villages and fishing centres. It
stretches from coastal base line to the interior at a diameter of about 30 km long. The planning area
is characterized by presenting common socio-economic characteristics and local norms and,
normally, under the same traditional leadership. The coastal width of any PA varies from one to
another based on the frontiers established according traditional principles. The definition of Planning
Area is participatory and assessed by IDPPE but validated by local communities in a general
meeting (IDPPE, 2006);
Scientific Knowledge (SK)
It is knowledge developed in schools, universities, research institutions and industrial firms which is
systematic and originated in the industrialized countries in the Northern hemisphere (Grenier, 1998).

xvi
Stakeholder Participation (SP)
Participation must be centred on the typology forwarded by some authors consisting on seven (7)
main types of participation. Such types are “passive participation”, based on telling people what is
going to happen or what has already happed; “participation in information giving”, simply people
answer questions posed by outsiders using surveys, questionnaires etc.; “participation by
consultation”, people are simply used as sources of information by being consulted by outsiders who
define both problems and solutions; “participation for material incentives”, people mainly used as
labour force in return for food, cash or other incentives; “functional participation”, people are either
volunteer or conformed to form groups to meet objectives determined by outsiders; “interactive
participation”, direct people involvement on participation by being involved in analysis, formulation of
action plans and form new or strengthen existing local institutions; “empowerment”, people taking
over the leadership of the process by taking initiatives independent of outsiders to change their
situation (Breakwell and Petts, 2001, & Jonsson, 2004);
Traditional Ecological Knowledge (TEK)
It is a body of knowledge and beliefs transmitted through oral tradition and first-hand observation. It
includes a system of classification, a set of empirical observations about the local environment and a
system of self-management that governs resource use. Ecological aspects are closely tied to social
and spiritual aspects of the knowledge system. The quantity and quality of TEK varies among
community members, depending upon gender, age, social status, intellectual capability and
profession (hunter, spiritual leader, healer, etc.). With its roots firmly in the past, TEK is both
cumulative and dynamic, building upon the experience of earlier generations and adapting to the
new technological and socioeconomic changes of the present (Inglis, 1993);
TEK is a cumulative body of knowledge and beliefs, handed down through generations by cultural
transmission, about the relationship of living beings (including humans) with one another and with
their environment. Further, TEK is an attribute of societies with historical continuity in resource use
practices; by and large, these are non-industrial or less technologically advanced societies, many of
them indigenous or tribal (NOAA, 2004).

xvii
As the candidate’s Supervisor I have/have not approved this dissertation for submission:
Signed Name Date ________________ Denis Rugege __________________

1
CHAPTER 1
Introduction
1.1– Introduction
The Government of Mozambique’s fisheries sector (FS) embarked on fisheries management
decentralization from early 1990’s. The government’s adoption of decentralised fisheries
management aims to improve social and economic conditions and raise the living standard of fishing
communities, especially at artisanal fisheries (AF) level. This can only be achieved through the
involvement and participation of all different stakeholders (governor’s of institutions, private sector,
civil society and fishing communities). The reason for focusing on artisanal fisheries management
rather than semi-industrial fisheries (SIF) and industrial fisheries (IF) is because government has
played an insignificant role in the past for better and sustainable artisanal fisheries management. It
had also excluded and devalued the fishing communities’ use of indigenous knowledge (IK) in the
process of fisheries management. In the last few decades, there has been noticed also reduction in
fish production, particularly, in the artisanal sub-sector.
Although the programme of decentralising management is in process, government still largely
favours management based on scientific models rather, than combining and/or creating synergies
between scientific and indigenous knowledge. According to Diegues (2002:12) “the lack recognition
of the value of traditional fisheries knowledge is that some government managers and some in the
academic and conservation agencies as well continue to assume that “primitive societies” are unable
to produce “scientific” and valuable knowledge”.
1.2 – The problem statement
Nationally, there is very little information on participatory mapping of artisanal fishing zones in the
offshore zones. The knowledge that exists is more concerned with semi-industrial and industrial
fisheries. Reviewed data also reveals that there is no documented information on the existence of
mapping of artisanal fishing zones where fishing communities had been directly involved or had
contributed to the process using their indigenous knowledge. Thus there is a gap on participatory
mapping of artisanal fishing zones using indigenous knowledge.

2
By ignoring the use of the indigenous knowledge in the process of fisheries management,
particularly, at artisanal fisheries management level, government is experiencing limitations in
making important decisions for artisanal fisheries management on which the wellbeing of fishing
communities and development are dependent. Including IK in arttisanal fisheries management, as
part of the fisheries management decentralisation programme will enable government make
improved decisions for sustainable fisheries management.
1.3 – Contextualization
Mozambique has a coastal line of about 2, 750 km. The fishery sector is experiencing a shortage of
financial, material, human resources as well as a lack of institutional presence in the field to cover
the entire coastal area (maritime and inland waters) for effective interventions. For this reason,
government is not able to apply and implement, effectively and efficiently, fisheries management
measures in artisanal fisheries, especially those based solely on scientific models. Although, there is
clear recognition of these difficulties on government’s side, not much has been done to validate the
use of indigenous knowledge and fully incorporate it into the process of artisanal fisheries
management.
The effects of government limitations as well as the institutional absence in the field lead to weak
responses to problems of fishing communities whether these are socio-economic or
fisheries/ecological related. At the same time, it also leads to minimal application of administrative
measures for fisheries law enforcement. The lack of institutional support for fishing communities and
their organizations leads to the high concentration of fishermen in urban areas where there are
services or in more productive fishing areas such as bays, estuaries, rivers or around some islands.
Concentration of fishing activities in specific areas has led to localised overexploitation of natural
resources in some of these areas. Additionally, such concentrations have led to conflicts in coastal
zones, both among artisanal fishermen and/or semi-industrial and industrial fisheries sectors.
Initiatives to establish new systems of protected areas in coastal habitats are also altering and
having detrimental impacts on the livelihoods of traditional fishermen leading to the increasing
number of conflicts between fisheries and the tourism sector (Diegues, 2002). Furthermore, the
moves for prospecting for oil as well as proposed mining ventures in coastal zones are likely to
exacerbate the ongoing conflicts in coastal zones among the different interest groups and sectors.

3
Worldwide, there has been an increasing trend towards use of IK in fisheries management, specially,
in small-scale, artisanal fisheries and subsistence fisheries. IK has been also acknowledged as
efficient especially when it is applied jointly with scientific knowledge as integrated knowledge for
fisheries management. Based on worldwide experience, the present study argues that the idea of
using indigenous knowledge for artisanal fisheries management, especially in situations where
government has difficulty in applying conventional scientific models for effective and efficient
sustainable fisheries management makes both economic and political sense in order to achieve its
goals. In such contexts IK needs to be officially recognized and validated in order to be an integral
part of knowledge for artisanal fisheries management.
1.4 – The structure
The dissertation is organized into six chapters. Chapter 1 is the introductory chapter giving brief
information on the background, problem formulation and objectives of the study. The importance and
the study’s probable contribution to the body of knowledge are also given in this chapter. Chapter 2
gives background information about Mozambique and the study area, specifically. Chapter 3 gives
an overview on fishery sector of Mozambique. More emphasis is given on the artisanal fisheries sub-
sector. Chapter 4 deals with the research topic as well as of the research methodology used.
Chapter 5 chapter deals with data analysis and chapter 6 deals with the discussion of the results and
conclusions from the study.
1.5 1.5 1.5 1.5 –––– Conclusion Conclusion Conclusion Conclusion
In this chapter emphasis has been given to the need for integrating and/or combining both
indigenous and scientific knowledge for effective and efficient fisheries management. In achieving
such integration and/or combination, fisheries management arrangements are likely to be more
proficient and socioeconomic conditions for fishing communities, particularly for women, as the more
disadvantaged social layer in the fishing communities, as shown in plate 1, can be improved and/or
raised more acceptable living standards.

4
Women in fishing
Commercialization of marine products
Plate 1 – Women participation in artisanal fisheries in Angoche fishing villages

5
CHAPTER 2CHAPTER 2CHAPTER 2CHAPTER 2
Description of the study areaDescription of the study areaDescription of the study areaDescription of the study area
2.2.2.2.1111 –––– Introduction Introduction Introduction Introduction
This chapter gives brief information on geographical localization, demography, political
administration and a summary of national economy of the country as a whole. Emphasis is given to
geographic and administrative description, demographic and/or socio-economic related issues as
well as environmental aspects of Angoche district as the study area.
2.2.2.2.2222 –––– Geographical localization Geographical localization Geographical localization Geographical localization
Mozambique is located on the southeast coast of the African continent. The whole of its eastern
border is fronted by the Indian Ocean. The country lays between parallels 10º 27’ S in the north
(Quionga in Cabo Delgado) and 26º 52’ S in the south (Catuane in Maputo) and, longitudes 40º 51’
E in the east (Matibane in Nampula) and 30º 31’ E in the west (Zumbo in Tete). Mozambique is west
of Madagascar Island, which is separated by the Mozambican channel. The total surface area of the
country is 799.380 km² of which 786.380 km² is land and 13.000 km² comprises inland waters. The
maritime boarders comprise territorial waters which stretch up to 12 nautical miles (about 20km),
jurisdictional waters (the Exclusive Economic Zone), which stretch up to 200 nautical miles (about
370km) from the lowest water mark (IDPPE, 2000).
Mozambique shares borders with Tanzania to the north, Zambia and Malawi to the northwest,
Zimbabwe to the west, and South Africa and Swaziland to the southwest. It has a total coast line of
2,750 km from the Rovuma river mouth (north) to Ponta de Ouro (south). Behind the coastlines a
vast low plateau rising towards mountains in the west and north accounts for nearly half the area of
Mozambique. The landscape of the plateau is savannah - more or less dry and open woodlands with
tracts of short grass steppes. The western and northern highlands are patched with forest. The major
concentrations of population are along the coast and in the fertile and relatively productive river
valleys (Dambiane, 1999). The geographical localization of Mozambique is shown in figure 1.

6
26º
M a l a w
i
T a n z a n i a
Rep. Africa
do Sul
Rep. Africa
do Sul
Suazilandia
32º 34º 36º 38º 40º 42º
0 20 40 60 80 100
Kilometros
CABO DELGADONIASSA
NAMPULATETE
ZAMBEZIA
SOFALA
INHAMBANE
GAZA
MAPUTO
MANICA
Z i m
b a b
w e
12º
18º
24º
22º
20º
16º
14º
AFRICA
Angoche
Figure 1: - Geographical location of Mozambique – (IDPPE, 2007)

7
2.2.2.2.3333 –––– Demography Demography Demography Demography
According to the preliminary results of the third general census of population and housing (INE,
2007), the population of the country is 20, 5 million located on a total area of 799.380 Km², giving a
density of 25.7 people/km². Like other developing countries, Mozambique’s population has been
growing steadily as shown in figure 2. The population consists, mainly, of a number of different
speaking peoples. The most influential are the Tsonga and Shona people. However, the largest
group is the Makua-lomwé in the north of Mozambique. The official language is Portuguese, which is
spoken by only 15% of the population while the rest, especially in rural areas speak other local
languages. With regard to religion, the main religious groupings are Christian (mainly Roman
Catholic), Muslim, Hindu, and many traditional beliefs (Dambiane, 1999).
Figure 2: Growth in total population for Mozambique, 1950–2007 - (INE, 2007)
2.2.2.2.4444 –––– Political Political Political Political aaaadministrationdministrationdministrationdministration
Mozambique is divided into ten (10) administrative provinces as follows: three in the south, namely
Maputo, Gaza and Inhambane; four in the center, namely Sofala, Tete, Manica and Zambézia; and
three in the north, namely Nampula, Cabo Delgado, and Niassa. Seven (7) of ten provinces have
maritime borders. Niassa, Tete and Manica are the only inland provinces. There are a total of 128
districts within these provinces distributed as follows; (30) in South, (49) in Center and (49) in North,
respectively. There are 23 declared cities, 7 in the south, 8 in the center and 8 in the north. There are
a total of 68 villages as follows: 23 in the south, 22 in the center and 23 in the north. All these are
administered by 393 administrative posts (95 in South, 143 in Center and 155 in the North) as shown
in figure 3 (Pililão, 1989)
6.5
7.6
9.4
12.1
16.1
20.5
1950
1860
1970
1980
1997
2007
Population

8
Figure 3: - Structure of political administration in Mozambique - (Pililão, 1989)
13.000 km² of surface is occupied by inland waters. Of these, Lake Niassa, west of Niassa’s
province is the biggest. Lake Niassa is the third biggest lake in Africa, with an area of about 30.800
Km². Tete, another of the three inland provinces, possesses the second biggest mega dam in Africa
(38 Km at its widest), the Cahora Bassa which is used for generating Hydro-electricity. The dam
occupies about 2.700 Km² in area, with an average depth of 26 meters. The capacity of the dam is
of 2000 megawatts (MW) supplying 250 MW to Mozambique, 1.100 MW to Republic of South Africa
and 400 MW to Zimbabwe. Tete province is on the Zambezi River which runs for 250 Km. The
Zambezi River crosses Zimbabwe into Tete and then stretches into the Zambézia province emptying
its waters into the Indian Ocean in Chinde district in the same province. Manica province, with its
great fluvial soils, is considered as the cradle of the fish culture because is the only inland province
with a great number of fish culture activities at household level.
The Tete dam has got multiple benefits like the production and supply of the electricity; fishing and
transportation of the important nutrients for shrimp spawning areas at Sofala Bank; natural irrigation
for farming, although, sometimes, it brings problems for the communities when is flood.
Each of the ten provinces is headed by a Provincial Governor appointed by the central government.
The provinces, in turn, are divided into districts. From the 128 districts, about 91 districts have strong
fishing economies. Of these 91 fishing districts, 48 are maritime and 43 districts are inland water
fishing districts. The districts are headed by District Administrators.
10
128
23
68
393
95
23
7
30
3
143
22
8
49
4
155
23
8
49
3Provinces
Districts
Cities
Villages
Ad. Posts
Total
North
Center
South

9
The districts are further divided into administrative posts (393) which are headed by a chief of
administrative post. By the proclamation and adoption of democracy in the country (1994), all
provinces and some eligible districts have working municipality councils headed by the presidents of
the municipalities. The administrative posts are divided into localities and areas. The localities are
managed by the president of the locality and the areas are ruled by the secretaries of villages. At
Administrative post, locality and area levels, formal and traditional leaders are found and they work
together and in combination or coordination of political and/or traditional local administration (Pililão,
1989 & Dambiane, 1999).
2.2.2.2.5555 –––– The national economy The national economy The national economy The national economy
Mozambique is an agricultural society, where almost 85% of the rural population is directly involved
in agriculture. Most of the rural people are small scale farmers, with production at subsistence level
(Dambiane, 1999). In 2006, the global production attained 8.2% where agriculture rose up to 6.9%
and fisheries rose to 3.3%. For 2007 is expected that the rise of the global and sector production
attains 7.2%. Agriculture is expected to attain 12.2% and fisheries 3.5%. Agriculture, transport and
communication and investments sectors are determinants for the planned economic growth (Govt,
2007). Besides those mentioned there are also other remarkable economic sectors, as shown in
figure 4, contributing for the national economic growth and, amongst them the following are,
particularly, expressive:
• The fishery sector is expected to register a growth of about 3.5%. It is expected that industrial
and semi-industrial fisheries will produce 32,872 tones of diversity fish products; this
corresponds 5.4% including 7.0 tones of inland waters. Artisanal fisheries alone is expected to
produce 54,475 tones, about 8.9%;
• The extractive industrial sector is expected to contribute 11,0% to economic growth. In this
sector, there are about 22 classified and important mineral resources that will account for
economic growth. However, to attain the planned percentage (11,0%), the sector requires to
increase the production of “calcareous” by 58,3% which corresponds to 50% of the sector
increment.
• The electricity and water sector is expected to contribute to the national economic growth by
9.0%. The production of electric energy from Hydro-electric of Cahora Bassa (HCB) and

10
Electricity of Mozambique (EDM) will increase by 10.0%. To meet the needs resulting from rural
and urban population growth, water production is projected to increase by 2.4%;
• The construction sector is expected to increase by 8.0% as a result of the public investment
planned for this purpose. About 297 Km of the main roads are expected to be rehabilitated.
17.200 Km of roads will benefit from the routine maintenance and 1.197 Km, from periodic
maintenance. Additionally, 610 Km of local roads will be rehabilitated;
• The commercial sector is projected to grow by 5.4%. Accounting for this increment, the sector is
expected to increase the importation of goods, excluding those of the mega-projects ongoing in
the country like Mozal (Maputo), Sasol (Inhambane) and Heavy Sands (Nampula) (Govt, 2007).
Figure 4: - Expected economic growth in 2007 for some economic sectors - (Govt, 2007)
In the last few years, the national economic growth has shown the tendency to increase towards two
digits. The reason for this high growth rate is due largely to the peaceful political environment since
the proclamation of the “Roma Peace Accord” signed in 1992 after 16 years of civil war. Since then,
government turned all its attention to reconstruction and development of the economy for the nation
as a whole.
2.2.2.2.6666 –––– Angoche district (the study area) Angoche district (the study area) Angoche district (the study area) Angoche district (the study area)
Angoche, one of the eight coastal districts of Nampula, is the selected area for this study. Nampula
province has 21districts including three cities (Nampula headquarters, Nacala and Mozambique
Island). Eight (8) of the districts are maritime coastal districts and Angoche is one of the three
maritime coastal districts in the south of the province. Angoche is one of the most productive districts
in terms of fishing.
Percentage
3.5
11
9
8
5.4
Fisheries sector
Extractive industry sector
Electricity & water sector
Construction sector
Commercial sector

11
2.2.2.2.6666.1 .1 .1 .1 –––– Geographical localization Geographical localization Geographical localization Geographical localization
The Angoche district is located along the coast South of Nampula Province between the parallels 15º
52,9’ and 16º 21,8’ S and between the meridians 039º 54,2’ and 039º 45,2’ E. Angoche occupies an
area of 3.535 km². It is bordered by the Mogincual district in the north, the Moma district in the south,
the Indian Ocean in the east and the Mogovolas district in the west. Angoche district is part of the
Micro-region South of Nampula Province, in partnership with Moma, Mogincual and Mogovolas
Districts. In this geographical unit, Angoche occupies the fourth position in terms of the territorial
extension, but it is the most important sócio-economic centre (Angoche, 2005). The area cover by
the research study comprises, mainly, the seven (7) Planning Areas distributed into the Namaponda,
Nametória and Aúbe Administrative Posts as shown in figure 5.
Figure 5: Map of the study area - (IDPPE, 2006)

12
2.6.1.1 – Climate
The Angoche climate is typically tropical, characterized by great pluviometric variation annually and
over a period of years. There are mainly two climate seasons along the year: - warm and rainy
season characterized by high temperatures which vary from 27ºC - 33ºC. The rainfall in this season
can be significant and can reach 212 mm/month and the relative air humidity is about 79% through
out the year. The warm and rainy season stretches from November to April and it is during this
period that the North West heavy wind is, generally, observed. The fresh and dry season stretches
from May to October and it is during this period that the South East heavy wind is, normally,
observed. During this period, there is low rainfall and the temperatures vary from 17ºC - 25ºC, with
the relative air humidity about 78% (MDN, 1986). It is in warm and rainy season that catches for
artisanal fishermen are good. The problem though is that it is difficult to preserve the fish, meaning
that the fishers tend to fish less than they should be doing in order to take advantage of the good
catches.
2.6.1.2 – Topography
Angoche is characterized by low altitude which does not exceed 200 metres so it is practically flat,
with exception of a few areas where small elevations exist like, Parapato. Close to the sea, the
savannah is formed by sediments and alluviums which have been formed recently and are inundated
by the sea water. In the sea area of Sangage and the south part of the Angoche urban area the
beaches are constituted by mangrove forest. Part of the mangrove areas is being progressively
destroyed by human action. At present, there is uncontrolled cutting of mangroves in areas located
close to urban areas. Among the most destructive activities affecting the mangroves is cutting of
these for coal production, for firewood and for building houses. The last activity might not be such a
big threat if it can be carefully controlled (IDPPE, 2000).
There are important Indian Ocean estuaries surrounding Angoche (capital of district). The estuaries
are well known for their high productivity and so play an important ecological role in the
transportation of nutrients and organic material for other ecosystems. The estuaries give shelter for
many commercial species and serve as spawning areas for migratory species. In the district there
are also important rivers which run into the Ocean Indian such as the Sangage and Quilua. The
average depth of the artisanal fishing area, including the offshore, is about 20 meters. However,
hand line fishermen can go up to 45 metres deep although this can be dangerous for them because

13
of their poor means of transport (non-motorized boats). The amplitude of tides within the region is
about 2 metres and the maximum is about 4 metres (ibis, 2000).
2.6.1.3 – Erosion
Angoche district presents a critical situation in terms of the actions of erosion processes. A recent
example of the effect of erosion is the appearance of a sand bank close to Kwirikwidge coastal zone
from 2000. In Thamole, the existing dunes are in an advanced stage of degradation. Some of the
estuary areas are also in advanced stages of erosion, with formation of sand banks starting. Other
parts of the coastal region are also suffering erosion, with a lot of casuarinas being destroyed by sea
water and the appearance of sand banks in areas where these did not exist in the past. Due to the
high state of soil degradation, there are some islands that were inhabited before, but are now being
abandoned by the resident population (ibis, 2000).
Generally speaking, the cleaning of the coastal vegetation, particularly the mangrove and the
arboreal cover of the dunes, effect of the high amplitude sea waves during the windy season
influenced by the tidal movement, the rise of the sea level; and, the lack of consistency of the sandy
dunes, account for some of the main reasons for vulnerability of the region to erosion.
2.6.1.4 – Pollution
The marine pollution is changing, sometimes in an irreversible manner, the natural equilibrium that
the humans and other organisms’ life depend on. In Angoche, the main form of the marine pollution
frequently observed is due to the chronic human and animal residuals (IDPPE, 2000).
In the N’guri and other surrounding centers of Angoche, the “bush toilet” on the beaches and
mangrove’s areas is one such form of pollution. These areas are mainly used for landing and
launching of boats and also for fish processing. It is very curious that even some people who have
conventional houses do not have toilets within their residential area. Local information indicates in
such regions and/or places diseases like cholera are very common (ibis, 2000).
However, in some areas like Gelo, Sangage, Kwirikwidge, and Quelelene Island, the water is clean
and shows little indication of pollution. Probably, this is because the majority of the boats used are

14
not motorized and, also due to the low industrialization which results in the absence of the
agricultural and industrial residuals (ibis, 2000).
2.2.2.2.6666.2 .2 .2 .2 –––– Demography Demography Demography Demography
Angoche has a population of 277,412 people in an area of 3.535 Km², giving a population density of
78 inhabitants/Km². Due to the Arabic influence that the coastal area had been subjected from long
years ago, Angoche is predominantly Islamic in terms of religion. “Macua” is, the predominant
spoken language and also in the name of the biggest ethnic group in the entire province of Nampula
(De Melo, 1984). There are some language sub-groups derived from “Macua” like Lomues, Mulais,
Marrovones, Mpamelas, Mugovolas and Niwarronis, and the Amacas which are found in Angoche
headquarters and the “Akoti” in Sangage. The most spoken language in Angoche and surrounding
the islands is “Koti” (Angoche, 2005).
2.2.2.2.6666.3 .3 .3 .3 –––– Political Political Political Political aaaadministrationdministrationdministrationdministration
Administratively, Angoche is composed of four administrative posts, namely, Angoche (the district
capital), Aúbe, Boila/Nametória and Namaponda. The four administrative posts all together are
further divided into seven localities. The local government is assisted by district directorates such as
Districtal Services for Economic Activities covering Agriculture, Fisheries, Industry and others;
Education; Health, Finance, Public Work and Housing, inter alias. The district is also served by the
Police, a District Court, the Maritime Administration and Customs at the port, the Civil Registry and
the Telecommunications Company. The district administrator coordinates activities of the various
departments through regular meetings of the district government. At the local level are traditional
leaders (the chiefs and the village headmen). The traditional leaders have great influence and
administer issues areas of local concern. They cooperate with government officials, especially in
solving conflicts over community and other resources (UNDP, 1997).
2.2.2.2.6666.4 .4 .4 .4 –––– The economy of the district The economy of the district The economy of the district The economy of the district
The Angoche district economy is based on agriculture, practiced, mainly, at household level. The
potential arable area in the district is about 211.548 hectares. The area designed for agriculture
accounts for 61.019 hectares. Of this, 357 hectares is for household farming, 19.550 hectares is

15
designed for livestock, 45.310 hectares is forest area; and 5.312 hectares accounts for other
purposes (see figure 6). Farmers grow both cash and subsistence crops. Cashew nuts and cotton
account for cash crops. Before the civil war, which ended on 1992 and seriously affected the
economy, the cash crops played an important socio-economic role at district level as it employed a
large number of the local population especially women. For many reasons, the cash crops are not
important in the district’s economy. This has resulted in increased unemployment. Cassava, maize,
rice, beans, groundnuts, and suite potatoes are mainly grown for subsistence use. The cashew nuts,
groundnuts, rice and maize are the main cash crops grown by farmers (Angoche, 2005).
Figure 6: - Use patterns of potential arable area in Angoche District - (Angoche, 2005)
Fishing is another important activity in the district economy. The sea is rich in marine resources like
shrimp, lobster, crab and other fish species. Fish constitutes a large part of the household diet not
only at district level but also outside the district. The potential and traditional areas of fishing are
Sangage, Quelelene, Yathá and Kwirikwidge. For fishing, the district mainly depends on artisanal
fishermen, whose fishing activities and production are oriented towards the local market and other
regional markets including the provincial capital of Nampula (Angoche, 2005).
In terms of industrial fishing, the district has Pesca-Norte: - a semi-industrial company doing shrimp
fishing for export; Gel-Mar: - a company which specialises in buying and processing fish and shrimp
for export; Mawipi: - a company producing and selling ice. The company has also got one industrial
boat for line fishing and is planning to go into shrimp fishing. Other small fishing companies are also
emerging. The district has a fishing port which is important infrastructure for fishing.
211.548
61.019
0.357
19.55
45.31
5.312
Arable area
Agriculture
Familiar sector
Livestock
Forest
Other purposes
Hectares

16
Although the economy of Angoche district is slowly recovering after a period of recession, it is
unlikely if it will reach its former levels of economic growth before the civil war.
2.6.4.1 - Transport and Communications
The district is served by a network of national, rural, unclassified and traditional roads totalling about
450 Km. As shown in figure 7, nearly 220 Km of the roads are considered as national (Angoche-
Nametil and Angoche Moma). About 147 km of roads are classified rural; 50 km as unclassified
roads and 33 km designed as traditional roads. In terms of construction and/or rehabilitation, a total
of 370 km were under direct responsibility of the district and 80 km including traditional roads, were
under IDPPE responsibility. About 33 km out of 80 km designed as traditional roads were fully
constructed by direct involvement and/or participation of the local community under IDPPE
mobilization and supervision. Angoche is also served by sea transport. In terms of
telecommunications, there are fixed and mobile telephones, radio and television links. The impact of
the roads has been in facilitating activities in trade, agriculture, health care as well as in bringing
assistance to the rural population of Angoche district.
Figure 7: - Classification of the Road Network – (IDPPE and Angoche, 2007)
2.6.4.2 – Health
In terms of health infrastructure, Angoche possess 21 health units which have got 147 beds all
together. In these 21 health units, 9 units possess conditions for attending to pregnant women; 12
are equipped with minimum conditions for meeting the health needs of the population at large; 18 are
of the hospital are able to administer vaccinations at any required time. One of the 21 health units is
a rural hospital (RH) encompassing with a capacity of 110 beds; 10 are classified as health centers
(CSI-V) varying from I to V categories and they have all together 37 beds; the other 10 health units
are designated as health posts (PSR/PSLR) and they do not have beds at all, as shown in figure 8.
220
147
50
33
National roads
Rural roads
Non-classified roads
Community roads
Km

17
Figure 8: - Classification of Health units in Angoche District – (IDPPE and Angoche, 2007)
Most of these health units were under government responsibility in terms of its construction and/or
rehabilitation. However, IDPPE (2 CS and 1 PS), Missionaries (1 CS) and some NGO’s (2 CS) also
have contributed a lot in the construction and/or rehabilitation of health units. The impact on a good
health care network is part of the conditions of serving the local population, and has contributed
significantly to the reduction deaths in rural areas. This therefore is an important aspect of
government’s development programme for rural areas.
2.6.4.3 - Water supply
In the last ten years there has been a noticeable increase in access to clean water in Angoche
district. A total of 129 water improved water points (wells or boreholes) have been either constructed
and/or rehabilitated. 21 of these water sources have presented seasonal problems and can thus be
considered as non operational, but the remaining 108 were operational at the time of this study.
Government responsibility in clean water supply to the community was in the construction of 82 of
these water sources (51 in Namaponda and 31 in Namitória Administrative Posts). The IDPPE is the
district partner in clean water supply, having contributed to the construction of 47 points water
sources, (36 in Angoche area and 11 in Aube Administrative Posts). The majority of these are
localized in coastal zones for the benefit of fishing communities, as shown in figure 9.
Figure 9: - Number and location of improved water supply points – (IDPPE and Angoche/07)
36
11
51
31
Angoche
Aube
Namaponda
Namitória
Water sources
1
10
10
110
37
0
Rural hospital
Health centers (I-V)
Health posts(PSR/PSLR)
Beds
Qt

18
Although the effort is being made to provide communities with a clean water supply, there are
villages and communities that still depend on river water and shallow wells with all health threats
associated with these. However, the existing and operational clean water sources, statistically, are
able to benefit about 54.000 people.
2.6.4.4 - Education There is one institution for tertiary education and three secondary schools in Angoche district, which
are located at the district capital. There are also upper primary schools (E2) offering sixth and
seventh grades. These schools are at Angoche, Aube, Boila and Namaponda Administrative Posts.
There are a total of seventy (70) schools distributed as follows; Angoche (18), Namaponda (17),
Boila/Namitória (27) and Aube (8) as shown in figure 10. It is estimated that there are a total of 296
teachers. In terms of pupils, boys account for over 70% of the school enrolment.
Figure 10: - School network in Angoche District – (IDPPE and Angoche - 2007)
It has been observed the community participation in the education sector, which takes the form of
construction and maintenance of educational infrastructure. In the process of construction, of
educational infrastructure, IDPPE is one of the leading the government partners for the district.
Uplifting community education it is believed to be one of the ways of guaranteeing sustainability of
local development.
2.7 2.7 2.7 2.7 –––– Conclusion Conclusion Conclusion Conclusion
In this chapter emphasis has been given to the government responsibility to meet social and
economic conditions for fishing communities. Community development in the study area has been
taken in an integrated approach to minimize social constraints. Community health care and improved
13
3
3
6
5
5
14
21
18
8
17
27
Angoche
Aube
Namaponda
Namitória
Total (unities
Non-conventional Conventional

19
water supply are some of the social related issues IDPPE is also promoting in artisanal fishing
villages in Angoche, as shown in plate 2. The overall trend is to meet the fishery sectorial goal: “the
improvement of the social and economic conditions of the fishing communities”.

20
Bicycle ambulance for community health care (IDPPE)
Improved water supply point (IDPPE)
Plate 2 – Community development in artisanal fishing villages in Angoche coastal zone

21
CHAPTER 3CHAPTER 3CHAPTER 3CHAPTER 3
Fisheries in Mozambique: An overviewFisheries in Mozambique: An overviewFisheries in Mozambique: An overviewFisheries in Mozambique: An overview
3.1 3.1 3.1 3.1 –––– Introduction Introduction Introduction Introduction
The fisheries sector is currently under the Ministry of Fisheries (MF) created by decree in 6/2000.
The Ministry of Fisheries is composed of three National Directorates (Fisheries Administration,
Fisheries Economy and Human Resources) and three other autonomous units (Administration and
Finance; International Co-operation and Aquaculture). Five other administratively autonomous
institutions are also part of the Ministry of Fisheries. These are: the Fisheries Development Fund
which is responsible for financial support and small credit to Small-Scale Fisheries, the National
Institute for the Development of Small-Scale Fisheries designated for administration and
management of artisanal fisheries and the socio-economic development of fishing communities, the
National Institute for Fisheries Research responsible for fisheries research, the School of Fisheries
focusing on fisheries training and the National Institute for Fisheries Inspection mandated to deal
with fish quality control.
At the provincial level the Ministry of Fisheries is represented by the Provincial Directorate of
Fisheries and/or Provincial Fisheries Administrative Services which are mandated to monitor and
control fisheries activities. The National Institute for the Development of Small-Scale Fisheries
(IDPPE), the National Institute for Fisheries Research (IIP) and the Fisheries Development Fund
(FFP) have their own representatives at provincial level. The Maritime Administration (ADMAR) is an
old institution under the Ministry of Transport and Communication which was historically delegated to
exercise maritime and in some inland water bodies, control and surveillance activities. This institution
is also represented at provincial level and at district level (Gervásio and Hele, 2002).
3.2 3.2 3.2 3.2 –––– Background Background Background Background
Gonçalves, (2004) points out that Mozambique’s historical fisheries development can be
characterised into two broad periods; before and after independence.
Before independence, the colonial government mainly preferred the import of fish from overseas for
internal consumption. In this regard, fish consumed in Mozambique was mainly sardine and cod from
Portugal (the colonial power), horse fish, tuna and sardine (from Angola) and “pescada” from South
Africa. There was no fisheries policy-making organ in the country. Mozambique Fisheries Mission for
Bioceaonologic Studies (MEBPM) and Maritime Administration (ADMAR) were the only institutions

22
for fisheries arrangements. Beach seine nets and industrial fishing were prohibited. It was only in the
mid 1960’s that Portugal started to promote semi and industrial shrimp fishing in the country, mainly,
for commercial purposes.
The second period, after independence, is characterized by five phases stretching from 1975 (the
year independence was granted) to 2007. The phases are as follows:
The period 1975 to 1980 can be considered as the phase for the “adoption of the tools” for fishery
policies establishment. At independence in 1975, Mozambique had 80 fishing fleets and 3000
peoples working in fisheries. Following the proclamation of independence there was a massive
exodus of Portuguese fishermen from Mozambique leaving behind chaotic a situation. In order to
overcome this situation the independent government created the Ministry of Industry and Commerce.
It was within this ministry that the National Fisheries Directorate (NFD) was then created as the first
fisheries institution in the country’s history to deal with all fisheries related issues. Since then, the
fisheries sector has grown and has facilitated the writing of legislation, international cooperation, and
promotion of entrepreneurs.
The landmark for 1976 was established the Exclusive Economic Zone (EEZ) extending 200 nautical
miles out to sea. Fishing accords between Mozambique and former Union Soviet of Socialistic
Republics (USSR) as well as with Germany Democratic Republic were established;
• In 1977, PESCOM – the National entrepreneur for fisheries product commercialization was
created and EMOPESCA – National entrepreneur for capture fisheries and have delegations in
Angoche (NPL), Quelimane (ZAB), Beira (SOF) and Maputo (MPT). These were created to
organize all semi and industrial fleets abandoned by colonizers. The National Fisheries
Directorate delegations were established in the provinces of Sofala, Zambézia and Maputo. First
marine resource evaluation in Mozambique in the scope of Norwegian Marine Investigation
Institute cooperation took place;
• In 1978, a legal Decree establishing the functions of the Secretariate State of Fisheries under
the Ministry of Industry and Energy was published. The regulation for foreign fleets in the
Mozambican jurisdictional waters was established in this phase. PESCOM INTERNATIONAL,
the national entrepreneur, especially, for marine resources export and import was created. The

23
Fisheries School Center was created in the scope of UNDP/FAO cooperation. Constitution of the
shrimp joint venture between Mozambique and TAIYO Japanese entrepreneur was established;
• In 1979, the first artisanal fisheries census was undertaken. About 44.000 fishermen with 12.000
boats were identified. Of these, only 1% of boats were motorized. SULPESCA, the National
semi-industrial shrimp entrepreneur was constituted.
1980 to 1986 can be considered “the implementation phase of the “adopted tools””. The Secretariate
of Fisheries under the Ministry of Industry and Energy started to materialize the established policies.
The strategy adopted for the implementation of the “adopted tools” was to give particular attention to
investigation and training for the development of artisanal and Industrial fisheries, service provision
and production of fisheries equipment. The Small-Scale Fisheries Directorate (UDPPE) was created
in this phase in order to develop policy for artisanal and Semi-industrial fisheries development. This
was done through the establishment of the “Para state” Artisanal Fisheries Entrepreneurs mostly
known as “Combinados Pesqueirso (CP’s)”. MOSOPESCA – a joint venture entrepreneurship for
shrimp fishing between Mozambique and former USSR (Sovrybflot) and PESCAMAR (Spanish).
The phase 1987 to 1994, it was the “free market phase”. It is during this period that the country,
under international pressure, was compelled to adopt a structural adjustment programme (the “free
market package”) announced in 1986 by government, locally, know as Economic Rehabilitation
Programme (PRE). In response to (PRE) the fisheries sector was subjected to internal adjustments
resulting on the scrapping of all Directorate Units and the establishment of IDPPE (in the process
inheriting UDPPE’s social development functions) and the creation of SFP (Fisheries Development
Association) which assumed management of productive activities of CP’s. In 1992, The Roma Peace
Accord was signed ending the 16 years of civil war the country. In 1994, first democratic elections
were held for consolidation of peace in the country.
1995 to 1999 is considered as the “fishery sector tragedy phase” as this period was characterized by
the abolition of the Secretariat State of Fisheries and incorporation of the fisheries sector into the
new Ministry of Agriculture and Fisheries created by the new democratic government following the
first democratic election in 1994. The experience of merging the fisheries sector into agriculture was
disastrous and led to the degradation of the fisheries sector (Gonçalves, 2004). From the middle
1990’s, IDPPE embarked on an “Integrated Approach” form of intervention to better assist the fishing
communities.

24
The period from the year 2000 onwards is considered “the restoration phase of fishery sector”.
Fishery sector ascended to a high position and is currently housed under the Ministry of Fisheries
created by decree in 6/2000 (Gonçalves, 2004). For this phase has resulted in the creation on the
new National Institution for Fisheries Inspection (INIP). The IDPPE, through a consultancy
undertaken in 2006 adjusted its strategy and, as a result, the Strategic Plan for the Artisanal
Fisheries (PESPA) was produced. Institutionally, the “Integrated Approach” form of intervention in
the fishing communities was then formalized in PESPA.
Thirty two years after independence (1975 - 2007), indications are that economic and political
changes in the fishery sector have taken place towards societal well being as detailed in the
proceeding section. However, there still exist many constraints to overcome.
3.3 3.3 3.3 3.3 –––– Fisheries overview Fisheries overview Fisheries overview Fisheries overview
The fisheries sector in Mozambique is divided into two main sub-sectors: ‘Industrial Fisheries and
‘Small-Scale Fisheries’. The Small-Scale Fisheries sub-sector is further divided into segments,
namely, Semi-industrial and Artisanal Fisheries. Thus the sector as a whole has three main
productive sectors: - industrial; - semi-industrial and artisanal fisheries.
In the entire fisheries there were 8,127 licensed boats in 2006 categorised as follows: 233 industrial
boats (3%), 320 semi-industrial boats (4%) and 7,574 artisanal boats (93%). Of the 8,127 licensed
boats, 1,584 boats (19,5%) were licensed to target shrimp; 35 boats (0,4% ) were for gamba
(prawn) and 6,508 boats (80%) were for fin fish in general.(see table 1)
Table 1 - The fishery sector - licensed boats (NDFA, 2006)
Fisheries Shrimp Prawn Fish Total Percentage (%)
Industrial 65 24 144 233 3%
Semi-industrial 88 0 232 320 4%
Artisanal 1,431 11 6,132 7,574 93%
TOTAL 1,584 35 6,508 8,127 100%
Boats in the Industrial fisheries sub-sector are mainly, privately owned through joint-ventures
between Mozambicans and foreign shrimp companies based in Beira and Quelimane ports, with the
Sofala Bank as the main fishing area for industrial shrimp fleets. As shown in table 2, there were 233
industrial boats in 2006 showing an increase of 3 fleets compared to 2005. Of the 233 industrial fleet
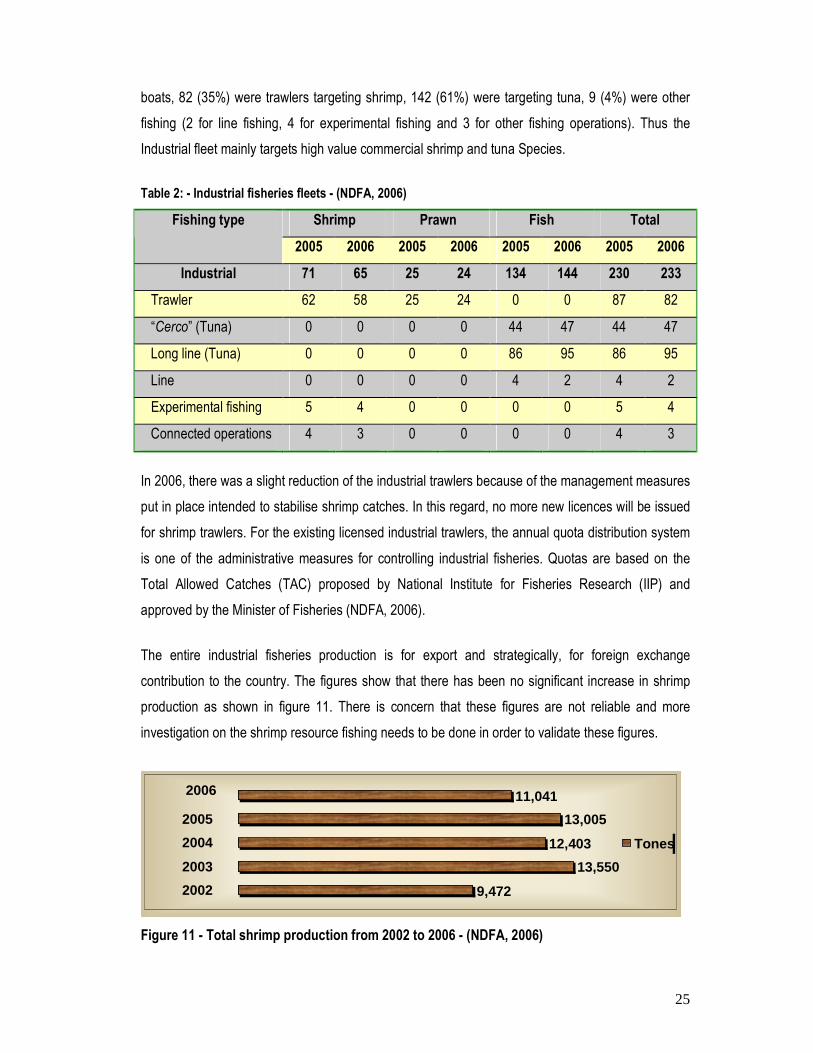
25
boats, 82 (35%) were trawlers targeting shrimp, 142 (61%) were targeting tuna, 9 (4%) were other
fishing (2 for line fishing, 4 for experimental fishing and 3 for other fishing operations). Thus the
Industrial fleet mainly targets high value commercial shrimp and tuna Species.
Table 2: - Industrial fisheries fleets - (NDFA, 2006)
Shrimp Prawn Fish Total Fishing type
2005 2006 2005 2006 2005 2006 2005 2006
Industrial 71 65 25 24 134 144 230 233
Trawler 62 58 25 24 0 0 87 82
“Cerco” (Tuna) 0 0 0 0 44 47 44 47
Long line (Tuna) 0 0 0 0 86 95 86 95
Line 0 0 0 0 4 2 4 2
Experimental fishing 5 4 0 0 0 0 5 4
Connected operations 4 3 0 0 0 0 4 3
In 2006, there was a slight reduction of the industrial trawlers because of the management measures
put in place intended to stabilise shrimp catches. In this regard, no more new licences will be issued
for shrimp trawlers. For the existing licensed industrial trawlers, the annual quota distribution system
is one of the administrative measures for controlling industrial fisheries. Quotas are based on the
Total Allowed Catches (TAC) proposed by National Institute for Fisheries Research (IIP) and
approved by the Minister of Fisheries (NDFA, 2006).
The entire industrial fisheries production is for export and strategically, for foreign exchange
contribution to the country. The figures show that there has been no significant increase in shrimp
production as shown in figure 11. There is concern that these figures are not reliable and more
investigation on the shrimp resource fishing needs to be done in order to validate these figures.
Figure 11 - Total shrimp production from 2002 to 2006 - (NDFA, 2006)
9,472
13,550
12,403
13,005
11,041
2002
2003
2004
2005
2006
Tones

26
The semi-industrial fisheries sub-sector is, mainly, for national fish supply to the urban areas.
According to Gervásio & Hele, 2002:6, the semi-industrial fishing boats are mainly based in the ports
of Beira (26%) and Maputo (40%). There are also fishing ports at Cahora Bassa (16%), Quelimane
(11%), Inhambane (5%), Angoche and Vilanculo (1%). 66% of the semi-industrial fishing boats
practise shrimp trawling, 17% hand line fishing and other 17% are kapenta catching rigs in Cahora
Bassa Dam.
For artisanal fisheries, data from the national census undertaken in June, 2007 indicates that there
are 135,529 fishermen with boats, 144,511 fishermen without boats and 53,980 people in other
fishing activities working in approximately 1,217 fishing centers. As shown in figure 12, there are
39,398 artisanal boats and 42,268 artisanal fishing gears in the 1,217 fishing centers (IDPPE, 2007).
Based on the information in table 1, the 7,574 licensed artisanal boats corresponds to 19% of the
total artisanal boats (39,398) registered in the census. The small percentage on licensed artisanal
boats is per se, a clear indicator of the very low level of government intervention in this sub-sector.
1,217
39,398
42,268
135,529
144,511
53,980
Fishing gears
Artisanal boats
Artisanal fishing gears
Fishers with boats
Fishers without boats
People in other fishingactivities
Figure 12 – National artisanal fisheries census for 2007 - (IDPPE, 2007)
The main types of artisanal boats used are dug canoes. Beach seines, gill nets and hand line are
the main types of fishing gears used in the sector. Apart from these fishing gears, there is a large
group of collectors who use sticks and harpoons as fishing implements. Artisanal diving is also
largely practised almost in all coastal zones.
As shown in figure 13, the fishery sector, produced 91,899 tones of marine and inland water
products valued at 247,1 million American dollars. Of this, the Industrial and semi-industrial fisheries,
landed 27,926 tones (30% of global production) valued at 91,5 million American dollars. The
artisanal fisheries sector in the most important as it landed 63,973 tones (corresponding to 70% of

27
the total catch) valued at 155,6 million of American dollars. Thus the artisanal sector contributes
twice as much as the other two sectors both in terms of landings and more than one and half times in
terms of the value to the national economy.
Figure 13 - Total catches and economic contribution for 2006 - (NDFE, 2006)
Fishery sector also plays important role in national development. Industrial fisheries sub-sector, by
exporting shrimp and fish, contributes about 4% to the GDP; semi-industrial fisheries is responsible
for supplying fish to the urban areas and artisanal fisheries are a very important source of
employment to many unskilled people and also help provide food security by supplying fish to the
most vulnerable social layers of the population in the rural areas. As shown in figure 12, about
334,019 people are directly employed either in Artisanal fishing or in its other fishing connected
activities. Assuming an average of five (5) people per rural household, about 1,670,000 rural people
corresponding 8% of the national population are depend on Artisanal fishing for employment and fish
food security. Based on the above described figures, it is pertinent and urgent that government pays
particular attention to this sub-sector as it is very important for rural development and/or poverty
eradication.
3.3.3.3.4444 –––– ConclusionConclusionConclusionConclusion
This chapter described the fishery sector in Mozambique. The emphasis on fisheries historical
background was to give the picture from colonial era up to now. The three main fisheries sub-sectors
(industrial, semi-industrial and artisanal) are also analysed and their contributions to the national
economy are evaluated. From the description it is evident that the fishery sector in Mozambique is
relatively new. However, government development policies for the sector should be more holistic and
implemented in an inclusive manner, and in such way that they are able to create opportunities and
good a working environment (safety means of production), as shown in plate 3, for fisheries sub-
sectors as well as for other potential stakeholders.
27,926
63,973
91,899
91,5
155,6
247,1
Industrial & Semi-Industrial
Artisanal
Total
Million USD
Tones

28
Industrial fleet
Artisanal fishing boat
Plate 3 – Industrial fleet and artisanal fishing boat – (IDPPE, 2006)

29
CHAPTER 4CHAPTER 4CHAPTER 4CHAPTER 4
Research methodologyResearch methodologyResearch methodologyResearch methodology
4.4.4.4.1111 –––– Introduction Introduction Introduction Introduction
This chapter deals with the research topic as well as the research methodology used in the study.
Emphasis is given to the conceptual framework and the methodology used. A summary of literature
review as well as a justification, the objectives, the research hypotheses and the research questions
are also dealt. The research phases and the organization of the field work of the study are described.
4.4.4.4.2222 –––– Research topic Research topic Research topic Research topic
“Indigenous knowledge in participatory mapping of artisanal fishing zones” is the topic for the study.
The Angoche District in Nampula Province in the northern part of Mozambique is the place where the
study was undertaken.
4.4.4.4.3333 ---- Literature review Literature review Literature review Literature review
The literature on the use of indigenous knowledge widely recognizes that it is potentially useful to
fisheries researchers and managers, especially when used in conjunction with conventional scientific
data. Some authors argue that indigenous knowledge is useful in coastal management far more than
its role in providing the baseline ecological data required for planning purposes. Others go further,
arguing that the failure of development projects, not only in the Pacific but also in other parts of the
world, is probably more commonly the result of the failure to understand local cultural systems than
of inadequacies in ecological, technological or market research (Hamilton and Water, 1999).
With regard to Geographical Information Systems (GIS), database can be used to incorporate socio-
spatial information, such as indigenous knowledge and artisanal fisheries data, along with
biophysical and other relevant information to assist “fisheries management”. The use of GIS
techniques together with social and natural science research promises to deepen our understanding
of important anthropological questions like how diverse ethnic groups culturally construct the spatio-
temporal characteristics of their landscape and how indigenous land and sea tenure systems are
spatially distributed in particular regions and how they change across time (Aswai and Lauer, 2006).

30
Converting peoples’ knowledge and socioecological behaviour into geo-spatial representations
allows researchers to distinctively conceptualize human foraging strategies spatio-temporally. It
illustrates how human cognitive maps of the seascape and marine organisms translate into actual
resource classification, use, and allocation geographically. It also recognizes local ecological
processes, including habitat structure (habitat delineation), species composition and distribution, and
spatio-temporal biological events (spawning aggregation) spatially. Plausibly, it identifies sites that
incorporate the ecological processes that support biodiversity, including the presence of exploitable
species; vulnerable life stages and inter-connectivity among habitats (ibis, 2006).
For participatory mapping, a combination of socio-spatial knowledge is significant because it can
assist in formulating hypotheses regarding human responses to inter- and intra-behaviour variability,
along with other marine ecological processes; and it can also help in the design and implementation
of resource management strategies in a cost-effective and participatory way, bridging the gap
between indigenous and Western cognitions of seascape (Jennings and Lockie, 2002).
In practice though, indigenous knowledge, is usually either ignored or used inadequately by fisheries
researchers and managers. Reasons put forward are that indigenous knowledge exists as an
inseparable part of complex cultural systems, and requires anthropological methods to describe and
interpret this information in a meaningful manner. These skills are usually difficult, time consuming
and well beyond the professional training of most fisheries scientists, resource planners and project
managers. Further, frequently, when scientists have attempted to incorporate indigenous knowledge
into their baseline research, the result has been a naive reporting of interview data or observations
taken out of their cultural and historical context (Hamilton and Water, 1999).
It is difficult to assess the completeness and accuracy of anecdotal data, but this does not detract
from its importance for consideration when assessing a traditional fishery. Integrating traditional
knowledge and anecdotal information with the scientific information derived from literature surveys
and biological surveys has been a positive experience that has lead to better understanding of the
dynamics of the (fisheries resources) and the impacts of (artisanal fishermen) activities (Lessard, et
al.,1999).
Western techno-scientific approaches are (in themselves) an insufficient response to today’s
complex web of social, political, and environmental challenges. IK systems suggest a different
approach to problem solving. Whereas Western science attempts to isolate a problem – to eliminate

31
its interlinkage with various other factors and to reduce a problem to a small number of controllable
parameters - traditional approaches usually examine problems in their entirely, together with their
interlinkage and complexities (ex.: physical, spiritual, sociocultural, psychological, etc.) (Grenier,
1998).
Fishermen, in particular those involved in the fishing, present their gifts to Goddess before their nets
are launched from the shore. According to those fishermen, those who do not praise the goddess of
the sea will have small catches. Traditional practices that limit overexploitation of resources can be
considered to enhance or support biological conservation, in modern, scientific sense. Under these
conditions, those practices mediated by beliefs in mythological beings purposely chosen to avoid
overfishing may play an important role in modern fisheries management (Samudra, 2006).
Traditional ecological knowledge (TEK) contains baseline information on local ecologies including
information on what is present in the local ecosystems, and its temporal and spatial patterning. By
drawing on TEK at the early stage of research, scientists are able to develop testable models, and so
target their research and efficiently budget their time and other resources. TEK and customary
marine tenure (CMT) evolved over generations of direct interaction between human communities
and their environment and are likely to contain information and ideas not currently contained within
scientific models. If properly understood, there is a potential for resource managers to use CMT
systems directly to manage stocks in development projects (Hamilton and Water, 1999).
Indigenous knowledge is unique to given cultures, localities, and societies. Indigenous knowledge is
acquired by local peoples through daily experience. They deal with the experiential reality of the
world. They are forms of knowledge that reflect the capabilities, priorities, and value systems of local
peoples and communities. An important dimension of indigenous knowledge relates to how
traditional forms continue to merge and coexist in diverse situations and settings as part of local
people’s response to colonial and imperial intrusions (Dei, et al., 2002).
Indigenous peoples develop and employ GIS tools; they are able to add their own cultural imprint to
existing applications. Making use of participatory methods involving a number of traditional
organizations and individuals, can establish a number of culturally acceptable methods for recording
and making available information on traditional organizations values in a textual and computerized
form (Harmsworth, 1998).
32
Participation by the local community in development initiatives is critical for achieving sound natural
resource management to utilize the full potential of IK systems. The main premise of (involving local
community) on the approach of integrating indigenous knowledge with Geographic Information
System as a way of promoting participatory natural resource management and giving opportunity to
the local community to participate in development programs and decision-making both as
contributors and as users of knowledge (Tripathi and Bhattarya, 2004).
Local ecological knowledge (LEK) directly linked to the problems users are facing, and ecological
sustainability has better chances of being achieved if allocation issues are being addressed as an
integral part of the process. The backbone of a good adaptive fisheries management system is a
good data collecting system that enables multi-disciplinary analysis and provides the assessment to
support to management institutions. To make an effective contribution, however, such information
can only be revealed as part of comprehensive studies involving ongoing interactions between
fishers, scientists and other stakeholders (Wilson, et al., 2006).
Maps are tools that shape our perception of place. All humanity is challenged to protect, enhance
and create healthy social and natural environments. Community mapping provides an inclusive and
graphic framework for people to affirm and pool their experiences and knowledge about their home
place. Through participatory mapping, local experience and knowledge about issues becomes a
valuable resource base for researchers and managers inside and outside the community (Aswai and
Lauer, 2006).
As conclusion, indigenous knowledge is an enormously valuable resource base but one which is
often treated in a far too casual manner by research scientists and managers.
4.4.4.4.4 4 4 4 ---- Conceptual framework Conceptual framework Conceptual framework Conceptual framework
The study was carried out to describe the logical sequence underlying the process of identifying
artisanal fishing zones using indigenous knowledge. The focus then is the use of indigenous
knowledge for fisheries management. The relationship between indigenous and scientific knowledge
is, in this study, of particular interest. Factors and/or conditions influencing fishing activity are
considered as paramount in understanding the extent to which indigenous and scientific knowledge

33
can be related to the identification of artisanal fishing zones. The theoretical approach developed in
conceptualizing the study framework was based on the following authors:
Grenier (1998) developed a theory of indigenous knowledge as a guide for researchers. According to
him, the development of IK systems, covering all aspects of life, including management of the natural
environment, has been a matter for survival to the peoples who generated these systems.
Comparing scientific and indigenous knowledge approaches, he argues that Western
technoscientific approaches are (in themselves) an insufficient response to today’s complex web of
social, political, and environmental challenges. He goes further arguing that a society is sustainable,
“only”, when the human condition and the condition of the ecosystem are satisfactory or improving.
Hamilton and Water, (1999) did research the relationship between indigenous and scientific
knowledge in the fisheries field. According to their findings, local knowledge combined with
specialized knowledge of the outside researcher is considered by advocates of the PAR
[participatory action-research] to be more potent than either of the two knowledge types alone in
understanding reality. In this regard, traditional ecological knowledge is widely recognized as
potentially useful to fisheries researchers and managers, especially when used in conjunction with
conventional scientific data. The authors argue that unfortunately, indigenous knowledge is usually
either ignored or used inadequately by fisheries researchers.
Dei et al., (2002) dealt with indigenous knowledge in global contexts. Their views show that
globalization has accelerated the flow of cultures across geographical, political, and cultural borders;
it has also transformed knowledge into a commodity to which the most powerful in society usually lay
unjustifiable claim. For indigenous people, the ‘crisis of knowledge’ can be seen in, or has resulted
in, the following: fragmentation of traditional values and beliefs; erosion of spirituality; distortions in
local, regional, and national ecosystem and economies; and tensions related to cultural revitalization
and reclamation.
The nature of this study is, simultaneously, descriptive and analytic and is based on both qualitative
and quantitative data. Using indigenous knowledge, artisanal fishermen identify fishing zones
(inshore and/or offshore) where, traditionally, they fish. Information on factors, conditions and
characteristics taken as the basis for the identification of fishing zones were collected through direct
interviews with fishermen. Coordinates (longitude and latitude) for the identification of artisanal
fishing zones, were recorded applying a GPS. Information related to artisanal fishing zones
34
identification was, later, processed and analyzed employing GIS. Finally, a map showing the
localization and distribution of the identified fishing zones in the study area was produced.
Based on the data analysis, discussion was developed around the findings in order to draw up
conclusions. Recommendations and suggestions are proposed for the validation and integration of
the indigenous knowledge into the process of fisheries management, mainly, for sustainable
artisanal fisheries management.
4.4.4.4.5555 ---- Justification Justification Justification Justification
Knowledge based on indigenous communities in coastal zones for artisanal fisheries management in
Mozambique has been unfairly neglected by managers and researchers. Diegues (2002) argues that
government fisheries development agencies, as well as government environmental agencies, have
been heavily influenced by certain natural scientists that take Western science and research on
biodiversity priorities (in a strict sense) as the world’s only basis for “sound marine management”.
Based on the above argument, government has been more in favour of scientific knowledge models
for its interventions, rather than creating synergies between scientific and indigenous knowledge in
artisanal fisheries management.
The problem with applying only scientific knowledge is because this knowledge leaves out traditional
ecological knowledge (TEK) paying less attention to the dynamics or behaviour of fishers as an
integral part of the system. At the same time, government interventions based only on scientific
knowledge models have failed to address effective sustainable fisheries management, mainly,
because:
• There has been limited capacity to assess and survey the state of the coastal environment;
• Little is known about tropical fish resources in order to assess the impact of artisanal fisheries on
marine and inland water biodiversity;
• There has been a failure to enforce the compliance of fishermen with regulations;
• There has been a failure of the management system, often directed at obtaining the maximum
sustainable yield and not towards the ecological stability of the system;
• Artisanal fishing knowledge has been judged and/or seen as pre-logical or pre-scientific;

35
• Formal fisheries regulations imposed by management agencies have tended to favour
mechanized fishing industries and consolidating their power leading to the formation of a new
class of “sea lords” (Freire and Garcia-Allut, 1999).
Grenier (1998) argues that paying attention to local indigenous knowledge (IK) can:
• Create mutual respect, encourage local participation, and build partnerships for joint problem
resolution;
• Facilitate the design and implementation of culturally appropriate development programs,
avoiding costly mistakes;
• Identify techniques that can be transferred to other regions;
• Help identify practices suitable for investigations, adaptation, and improvement, and
• Help build more sustainable fisheries in the future.
Historically, local fishermen have been, not only successfully but also sustainable, for centuries,
fishing using their indigenous knowledge without any “scientific” support. According to Diegues
(2002), local knowledge can be understood as a system of power, and thus can provide a basis for
the empowerment of communities to undertake community-based resource management. This is
particularly important in tropical, multi-species fisheries and their environments, for which scientific
knowledge is still relatively poor. So, using indigenous knowledge and values within a system that, at
least, integrates indigenous knowledge and scientific forms of knowledge can result in sustainable
fisheries management, particularly, for artisanal fish resources.
This study seeks to contribute to knowledge about the use of indigenous knowledge in fisheries
management by investigating and understanding the artisanal fishermen’s logic underlying
identification of artisanal fishing zones where they usually fish using their indigenous knowledge
taking into account the case of Angoche.
4.4.4.4.6666 –––– The purpose of the study The purpose of the study The purpose of the study The purpose of the study
The aims of the study are:
• To investigate how artisanal fishermen identify fishing zones in artisanal fishing areas using their
indigenous knowledge without any scientific support; and,

36
• Using GPS and GIS techniques, map the identified artisanal fishing zones and see whether
these scientific approaches would come up with the same results (and thus confirm) fishermen’s
positioning of the fishing zones or discredit the positioning of the zones as identified by fishers
using the indigenous knowledge.
4.4.4.4.7777 –––– The objectives of the study The objectives of the study The objectives of the study The objectives of the study
The main objective for the research is:
• To find out the extent to which indigenous knowledge can be scientifically correlated and to what
extent it can be feasibly used for artisanal fisheries management purposes in marine and inland
water bodies in Mozambique.
The specific objectives are:
• To explore how artisanal fishermen identify fishing zones using their indigenous knowledge;
• To ascertain the extent to which indigenous knowledge is scientifically correlated;
• To establish the potential of indigenous knowledge in decision-making for artisanal fisheries
management by government and other development agencies; and,
• To establish the potential of GPS in recording artisanal fishing zones’ coordinates and in
employing GIS as software for collecting, treating, visualizing and outputting the information
results from artisanal fishing zones for management purposes.
4.4.4.4.8888 –––– The research hypotheses The research hypotheses The research hypotheses The research hypotheses
To validate the findings underlying on the research study, the following hypotheses were tested:
H1: Using indigenous knowledge in identifying fishing zones in artisanal fishing villages is not
effective;
H2: There is no relationship between indigenous and scientific knowledge in identifying artisanal
fishing zones;
H3: Integrating indigenous knowledge in artisanal fisheries management does not play any role in
fisheries management.

37
For the purpose of the study, the key research questions were:
• How do artisanal fishermen identify fishing zones using their indigenous knowledge without any
scientific support?
• What are the factors, conditions and characteristics underlying artisanal fishing zones
identification?
• How do artisanal fishermen relate different phenomena such as physical, ecological,
environmental and climatic with the species they catch in the identified fishing zones?
4.4.4.4.9999 –––– Research methodology Research methodology Research methodology Research methodology
This section outlines the sampling procedures, the process of conceiving and testing questionnaires
and the methods used in data collection.
4.9.1 – Sampling procedures
As stated by De Vos, (1998:189) “as the concept of sampling is one of the most important in the total
research endeavour, it is imperative that we understand it clearly before studying certain aspects
thereof”. Based on the above premise, the sample must be representative of the object of research
and the minimum sample size must be proportional to the total number of fishermen in the selected
area of study.
The district of Angoche in Nampula province is the area chosen for the present case study. The unit
of analysis is the Planning Area (PA). There are seven (7) Planning Areas identified in Angoche
district. A Planning Area is an area within the district encompassing a number of fishing villages
bound together by pre-identified common characteristics such as proximity and fishing in the
common fishing centers, sharing the common and/or same local norms and belonging to the same
local headmen. Each fishing village contains a number of fishing centers and from each fishing
center fishermen fish in different fishing zones in the sea, mainly, inshore.
As shown in figure 14, the sampling process was based on the list of the seven identified and
existing Planning Areas in Angoche district. In those seven existing PA’s, a total of fifty (50) fishing
villages were identified.

38
Figure 14: - Flowchart on sampling procedures1
Applying the guidelines for sampling as suggested by De Vos, (1998:192-3) for population equal or
above fifty (50) but less than 100, the percentage suggested for sampling is 64%. In the present
case, 64% of 50 (the total number of the fishing villages found in the seven PA’s in Angoche district)
is equal to 32 fishing villages. The selection of the 32 fishing village from 50 was made by applying
the random sampling technique.
4.9.2 - The exploratory survey
To get the total sample eligible from the population of 1,286 units, an “exploratory survey” was
conducted in the study area from 20th to 28th March, 2007. Field work was then undertaken in the 32
selected fishing villages to list the total eligible number of fishers (men and women) for the survey.
The listing exercise identified 1,286 fishers using different types of fishing gears. The final results
were as shown in table 3.
1 PA – Planning Area; n – number of each PA (ex: 1, 2 .... to 7); and AG – it is a code meaning ANGOCHE. FV – Fishing Village.
Sampling procedure
s
PAn AG PAn AG PAn AG
FV FV FV FV FV FV FV FV FV
General selected sample

39
Table 3: – Total eligible population in the 32 selected fishing villages in Angoche district
PA's B/seine Gillnet H/line Quinia Diving Collecting Cages TOTAL
GELO 132 10 31 32 0 0 0 205
SANGAGE 98 70 61 25 8 0 0 262
KWIRIKWIDGE 72 6 0 0 0 0 0 78
THAMOLE 76 1 60 0 6 9 0 152
INGURI 40 24 5 0 0 0 18 87
QUELELENE 82 63 8 0 0 0 0 153
CATAMOIO 64 98 121 17 0 0 49 349
TOTAL 564 272 286 74 14 9 67 1.286
De Vos’, (1998:193) guidelines for sampling and sampling methods, state that for the population
equal or above 1000 but less than 10,000, a 14% sample size is recommended. Based on the above
principle, from the 1,286 units (fishers), the sample population of 14% is equivalent to 180 units
(fishers) that were to be surveyed. According to De Vos, (1998:195) two possible sampling
procedures can be used: -1) probability and -2) non-probability sampling. The former is based on
random selection while the later one is not based on random selection. The research study used
probability sampling procedure. In the probability sampling procedure, each unit in the eligible
population has the same known probability of being selected.
Once the fishermen, the total eligible population for sampling, have been listed and the sample size
of 14% had been decided upon, there was a need to adopt an interval to be used in selecting the
fishermen to be interviewed using the probability sampling procedures. This interval was determined
by dividing the total eligible population for sampling by the defined sample size (1,286/180 = 7).
Thus, every 7th sample unit (fisherman) was selected until 180 units had been selected to be
interviewed. Applying the probability sampling method, the first sample unit (fisherman) randomly
selected from the list was number three (3) and the rest were selected by applying the interval of
seven (7). At the end of the sampling process, the results achieved were as shown in table 4.
Table 4: – Total eligible sample size in the 32 selected fishing villages in Angoche district
PA's B/seine Gillnet H/line Quinia Diving Collecting Cages TOTAL
GELO 16 2 5 5 0 0 0 28
SANGAGE 12 9 11 4 1 0 0 37
KWIRIKWIDGE 10 1 0 0 0 0 0 11

40
THAMOLE 11 0 9 0 1 1 0 22
INGURI 7 2 1 0 0 0 2 12
QUELELENE 13 8 1 0 0 0 0 22
CATAMOIO 9 14 16 2 0 0 7 48
TOTAL 78 36 43 11 2 1 9 180
To determine how many fishermen were to be randomly selected from each of the selected 32
fishing villages in order to ensure representativeness of the sample size, the mathematical
proportional principle described below was applied and the results achieved were the same as those
shown in table 4.
The adopted formula to ensure representativeness of the sample size was: (D = (C x B)/A) where:
(A) is equal to the total eligible population for sampling (1,286) in all the 32 randomly selected fishing
villages in the study area and (B), is the overall sample size (180) randomly selected from the total
eligible population for sampling and (C), is the total eligible population for sampling for each
randomly selected fishing village and (D), is the (unknown) number of sample size units (fishermen)
to be drawn from each of the 32 fishing villages to make up the total sample size of 180 units.
Only 27 fishing villages in all were surveyed. The remaining 5 out of the original 32 fishing villages no
longer existed. The fishermen from these 5 (five) defunct fishing villages had been forced to move to
other suitable fishing villages due serious threat resulting from accelerated soil erosion. This was
particularly the case for the island fishing villages.
The “exploratory survey” was conducted in each of the randomly selected fishing villages (32) in the
study area. To facilitate the “survey”, a pre-prepared form was used containing information such as
“the name of the fisherman, gender, category, type of the fishing gear used and place where
fishermen normally fish (e.g.: in beaches, open sea, islands, etc.). The “exploratory survey” was
multi-beneficial. It gave the researcher the realities to be taken into account during the real survey in
terms of the required time, budget and the required logistics.
4.9.3 – The pilot study
Having determined the number of fishing villages (27) from which the sample size of 180 units was to
be drawn, questionnaires to be used for gathering data and/or information were developed. The

41
questionnaires were pre-tested before the actual research. In this regard, four (4) distinct
questionnaires, namely, one for group, the second for individual, the third for scientists’ interviews
and the fourth one for geographical and non-geographical data, were all tested in this phase.
Basic and related fishing information later used in the questionnaires, such as the type of traditional
and cultural beliefs and winds’ local names, it had to be familiarized with during the pilot study. After
adjustments of the questionnaires and working out the estimated budget, the field work was then
undertaken in all 27 selected fishing villages covering the pre-defined sample size of 180 units.
4.4.4.4.10101010 –––– Data collection Data collection Data collection Data collection
Based on Roger and Victor, (2006) to collect data and/or information for the research study, three
distinct phases were required:
• The “exploratory survey”, designed to get the list of the entire eligible population for sampling in
the 27 selected fishing villages out of 50. This phase was conducted from 20th to 28th March,
2007. The results were the identification of 1,286 eligible units (fishermen) and from these units,
a sample size of 180 units, was later drawn;
• The data collection was carried out under second phase undertaken between 07 and 28 August
2007. It was under this phase that fishermen and scientist key informants were interviewed. 161
out of the required 180 units were interviewed. The difference, accounting for 19 units (180 –
161 = 19 units) could not be interviewed because this number of respondents were not found in
the respective villages at the time the interviews were conducted;
• The third phase, designated to the identification and recording of coordinates (latitude and
longitude) and other information on the artisanal fishing zones, was undertaken between 15
October and 04 November 2007.
Four types of research instruments (see appendices 1 to 4) were designed, namely:
• Questionnaire designed to gather data and/or information targeting artisanal fishermen’s views
on fishing zones identification and characterization involved in different types of fishing gears;

42
• Questionnaire designed to gather data and/or information targeting elders as key informants with
long experience on fishing at fishing villages;
• Questionnaire designed to gather data and/or information targeting scientists as key informants
on fishing zones identification and characterization;
• A form, specifically, designed for coordinates (latitude and longitude) recording and other
information at sea during the fishing process.
The data and information collection process was through interviewing the identified and selected
individuals and fishing villagers’ key informants. The main method used was direct (“face-to-face”)
interviews based on structured and semi-structured open-ended questions. The coordinates (latitude
and longitude) on fishing zones identification and characterization were recorded by direct
involvement of the artisanal fishermen using their indigenous knowledge interpretation. The main
aspects dealt with during the interviews account for indicators, factors, conditions and main
characteristics influencing artisanal fishing in the fishing zones. Besides “face-to-face” interviews,
direct observation was indispensable for complementing information gathering, especially, the
information uncover by questionnaires.
4.4.4.4.11111111 –––– Questionnaires Questionnaires Questionnaires Questionnaires
Generally, the content of the four questionnaires enabled to explore and gathering, as much as
possible, the expected information from the respondents. The questionnaire targeted individual views
on artisanal fishing zones identification and characterization was the basis for the majority of the data
and/or information collected. Questionnaires for data and/or information collection targeted to group
and scientific views have been taken as complementary to substantiate the individual respondents’
views. The last questionnaire was conceived, especially, for coordinates (latitude and longitude)
recording.
Some problems on the questionnaires were the time consuming process, especially, when
translation into local language was needed for those respondents unable to understand and speak
the Portuguese language. Very little information was collected from the scientist’s key informants,
mainly, because, the existing knowledge on artisanal fishing zones identification using GIS is still on

43
embryonic stage in the National Fisheries Research Institute (IIP). However, IIP is well advanced on
recording, processing and analyzing statistics of artisanal fisheries production as well as reporting
feedback at sector level including artisanal fishermen, civil society and fisheries private sector.
4.4.4.4.12121212 –––– ConclusionConclusionConclusionConclusion
The indigenous knowledge use is the central aspect dealt in this chapter. Emphasis has been given
to the research methodology applied for the study. The literature reviewed shows that, besides
scientific knowledge which is acquired at universities and schools, there is another body of
knowledge from local people’s experiences based on their historical and daily use of the resource
that is also important, but is usually marginalized by scientists and/or managers. This knowledge is
locally used for decision-making for community-based fisheries management purposes. As shown in
plate 4, artisanal fishermen based on their own knowledge are using fishing gears such as gillnet
and hand lines which do not have negative impact on fishing. This is an example of an indicator for
the objectives of this study to establish relationship between scientific and indigenous knowledge
and to see to what extent local people’s indigenous knowledge can be feasibly used for artisanal
fisheries management purposes.

44
Gillnet fishing gear
Hand line fishing gear
Plate 4 – Selective artisanal fishing gears – (IDPPE, 2006)

45
CHAPTER 5CHAPTER 5CHAPTER 5CHAPTER 5
Data analysisData analysisData analysisData analysis
5.5.5.5.1111 –––– Introduction Introduction Introduction Introduction
In this chapter, data and information collected are interpreted and analyzed. The analysis seeks to
show the potential of indigenous knowledge in artisanal fishing communities. The results are, mainly,
shown in tables trying to give the reality found in the fishing villages. Data and information collected
on socio-economic, traditional and cultural practices as well as on technological characteristics
analyzed herein do not have, sometimes, direct applicability on the physical identification of artisanal
fishing zones but they do have strong influence and they are determinant on the process.
Understanding the way fishing communities are socially, economically and culturally organized it
enables to understand the logic underlying on their indigenous knowledge use in the process of
fishing zones identification.
The core issue is about the use of indigenous knowledge in identification of artisanal fishing zones.
The process of identification is, essentially, based on qualitative and quantitative information. In this
regard, qualitative data is not easy to be measured statistically. Winds, lunar and tidal cycles as well
as traditional and cultural practices possess strong fishing influence, so they deserve particular
attention in the analysis because they are determinant in the process of fishing zones identification.
In the data processing, there were found missing values in some variables which led to less than 161
(100%) of respondents in some of the tables here analyzed. The unit of the data analysis is the
“Planning Area”. Some of the collected and analyzed data are, mainly, used as complementary to
substantiate qualitative and/or oral information on the process of artisanal fishing zones
identification. For data analysis, the “Statistic Programme for Social Science” (SPSS), was used.
5.5.5.5.2222 –––– Planning Areas (PA’s) Planning Areas (PA’s) Planning Areas (PA’s) Planning Areas (PA’s)
All seven (7) Planning Areas (PA’s) existing in the study area were considered. In these PA’s there
are fifty (50) fishing villages. Thirty two (32) of 50 fishing villages were randomly selected. In the 32
fishing villages surveyed, only 27 were inhabited and the work was able to be done there. The five
(5) defunct fishing villages no longer existed. In the 27 fishing villages, 1.286 eligible fishermen (men
and women), with different fishing gears, were identified and surveyed. From 1.286 eligible
fishermen, a sample size of 180 fishermen was drawn. As shown in table 5, from the drawn sample
size of 180 units, 161 respondents were directly interviewed.

46
Table 5: - Data collection coverage by Planning Area
Items/PA’s Catamoio Gelo Inguri Kwirikwidge Quelelene Sangage Thamole Total
Sample size 48 28 12 11 21 38 22 180
Achieved 45 28 12 10 16 33 17 161
Difference -3 0 0 -1 -5 -5 -5 -19
5.5.5.5.2.2.2.2.1 1 1 1 –––– General information General information General information General information
In terms of coverage, 89% (161) of the sample size (180) was interviewed as shown in table 5. The
results indicate that 86% (139) of the total respondents were the property owners of the fishing units
(boats and/or fishing gears). Crew members appear as the second social and professional layer of
respondents interviewed. Skipper and others respondents are in third place. Catamoio (41),
Sangage (33), Gelo (29) and Inguri (20), are, relatively, the PA’s having the most fishers engaged in
fishing activities. Kwirikwidge (11) and Thamole (12) are the PA’s with comparatively less fishers and
thus fishing activities as shown in table 6.
Table 6: - Categories of fishermen by Planning Areas
Planning Area Category
Catamoio Gelo Inguri Kwirikwidge Quelelene Sangage Thamole Total
Owner 33 20 18 11 15 30 12 139
Skipper 2 2 1 - - - - 5
Crew 4 7 1 - - 3 - 15
Other 2 - - - - - - 2
TOTAL 41 29 20 11 15 33 12 161
5.5.5.5.2222....2222 –––– Language, religious and marriage status Language, religious and marriage status Language, religious and marriage status Language, religious and marriage status
“Macua” is the predominantly spoken language but also represents the largest ethnic group in the
entire province of Nampula.” As shown in table 7, most respondents 117 (73%) are koti and macua
speaking. Contrary to the south zone of the district which is composed, mostly, by Islands, the north
coastal zone, namely, Kwirikwidge (4), Sangage (9) and Gelo (8), which is, basically, continental,
there are respondents who are only macua speaking. This ensures that “Koti” is spoken, mostly, in
Islands.

47
Table 7: - Language spoken by respondents by Planning Area
Planning Area Language
spoken Catamoio Gelo Inguri Kwirikwidge Quelelene Sangage Thamole Total
Koti (A) - - 1 - 2 1 - 4
Macua (A) - 8 - 4 - 9 - 21
Koti and macua
34 19 16 7 10 21 10 117
(A), (B) &
Portuguese 7 2 3 - 3 2 2 19
TOTAL 41 29 20 11 15 33 12 161
In all PA’s there are artisanal fishermen understanding and speaking Portuguese (Official language)
although in much reduced number. This information is an important indicator for government
development programmes.
Angoche is predominantly Islamic. As shown in table 8, almost, all respondents interviewed 150
(96%) follow Islam. There are other new religious beliefs that are coming up in recent year, which
appear to be negatively influencing the traditional way of living in the fishing communities. This new
phenomenon is a result of in-immigration from the Great Lakes region and Central Africa. Besides
Islamic religious belief, there is a small number of people belonging to catholic (3) and other (3)
religious beliefs (table 8).
Table 8: - Religious beliefs of respondents by Planning Area
Planning Area Religious
beliefs Catamoio Gelo Inguri Kwirikwidge Quelelene Sangage Thamole Total
Islamic 40 24 20 10 13 32 11 150
catholic - 3 - - - - - 3
other 1 2 - - - - - 3
TOTAL 41 29 20 10 13 32 11 156
Islamic religious belief influence is the most dominant among artisanal fishing villages in all of seven
PA’s. As shown in table 9, most of the respondents interviewed 124 (85%) revealed that they have
only one wife and/or husband. Meantime, there were also respondents married to two wives and,
curiously, one respondent has got three wives. Some of the reasons given for marrying more than

48
one wife is that it is a symbol of economic power, looking for more children and having more labour
force for subsistence farming. The influence of religious beliefs deserves careful treatment because
they may be either detrimental or beneficial for local development.
Table 9: - Number of spouses per each respondent by Planning Area
Planning Area Nr. of
Spouses Catamoio Gelo Inguri Kwirikwidge Quelelene Sangage Thamole Total
1.00 30 25 18 8 11 22 10 124
2.00 6 1 - 2 3 8 1 21
3.00 - - - - - 1 - 1
TOTAL 36 26 18 10 14 31 11 146
5.5.5.5.2222....3333 –––– Socio Socio Socio Socio----economic characteristicseconomic characteristicseconomic characteristicseconomic characteristics
Although Angoche is a coastal district, the socio-economic characteristics indicated that the main
economic occupations in the area were fishing, agriculture and commerce. Economically, Angoche is
mainly dependent on agriculture, practiced, mainly, at household level. The potential arable area in
the district is about 211.548 hectares. The area designed for agriculture accounts for 61.019
hectares with 357 hectares for familiar sector (Angoche, 2005). Data collected shows that the
majority of the population in the study area depend on fishing. However, fishing activities are
complemented by other economic activities. As shown in table 10, only 43 respondents (27%) said
that they relied exclusively on fishing. The majority of the respondents 106 (66%) said that they
practiced both fishing and agriculture. 10 respondents (6%) said they were involved in fishing,
agriculture and commerce (most of these processed and marketed their own catch rather than
selling the catch to middlemen). Based on this finding, local development programmes must, as
much as possible, pay attention to both fishing and agricultural related issues.

49
Table 10: - Main occupations of respondents by Planning Area
Planning Area Main
occupations Catamoio Gelo Inguri Kwirikwidge Quelelene Sangage Thamole
Total
Fishing (A) 3 2 13 6 11 1 7 43
Informal commerce
- - 1 - - 1 - 2
(A) & agriculture(B)
33 26 3 5 4 30 5 106
(A), (B) & commerce
5 1 3 - - 1 - 10
TOTAL 41 29 20 11 15 33 12 161
Gender related issues also deserved attention. As shown in table 11, nine women (6%) were
involved in fishing activities while the rest 152 (94%) were men.
Table 11: - Gender on respondents by Planning Area
Planning Area Gender on
fishing Catamoio Gelo Inguri Kwirikwidge Quelelene Sangage Thamole Total
Fishermen 38 25 20 11 15 31 12 152
Fisherwomen 3 4 - - - 2 - 9
TOTAL 41 29 20 11 15 33 12 161
Traditionally, the involvement of women in fisheries has mainly been in fish processing and
marketing. However, recent trends have pointed to the increasing involvement of women in the
ownership of fishing infrastructure (unit owners) other than being only involved in post-harvest
activities.
5.2.3.1 – Demography
Collected data shows that the number of the households varies from one to 20 persons per family in
the fishing villagers. As shown in table 12, most of the families have between 4 and 7 people per
household. 25 families (17%), declared having four (4) people each within their households; 21
(14%), said they had 5; 22 (15%), said that they had 6 people; and 18 (12%) said they had 7 people
in their households. The average number of people per household was 6. The households analyzed
here mainly comprised of parents and their children.

50
Table 12: - Number of people per household
Nr of people/household 1 2 3 4 5 6 7 8 9 10 11 12 13 14 17 20
Frequencies 1 5 13 25 21 22 18 12 9 10 7 2 1 1 1 1
Percentage (%) 1 3 9 17 14 15 12 8 6 6.7 4.7 1 1 1 1 1
5.2.3.2 – Education
As shown in table 13, 56 respondents (39%) were illiterate and had not been to school in the
previous ten years. Only 5 respondents (3,5%) had children studying in secondary schools. A
significant number of respondents 81 (57%) had children studying in primary schools. Catamoio, 20
(14%) and Sangage, 13 (9%) were the PA’s with the most number of illiterate people.
Table 13: - Level of education of the respondents’ family by Planning Area
Planning Area Levels
Catamoio Gelo Inguri Kwirikwidge Quelelene Sangage Thamole Total
Primary 19 19 8 8 4 15 8 81
Secondary - 1 1 1 1 1 5
Other - 1 - - - - - 1
Illiterate 20 4 8 - 9 13 2 56
TOTAL 39 25 17 9 13 29 11 143
The provision of infrastructure, including schools, has been critical in ten years in reducing the rate of
illiteracy especially in coastal areas and in fishing villages specifically. The civil war which lasted 16
years and ended in 1992 was most detrimental as the cause of illiteracy. It was only towards the end
of the 1990s that an integrated development project funded by the Mozambican government and
International Fund for Agriculture and Development (IFAD), coordinated and implemented by IDPPE,
intervened in social and infrastructures re-construction at Angoche and Moma districts. Although the
government is giving especial attention to infrastructural development and rehabilitation, the results
are not satisfactory.
5.2.3.3 – Economy
Cassava, maize, rice, beans, groundnuts, and sweet potatoes account for the main subsistence
crops produced in Angoche district. The cashew nuts, groundnuts, rice and maize are, at the same

51
time, some of the main commercial crops. Data collected in the fishing villages ranked cassava in
first place; rice in second place; beans in third place and groundnuts in fourth place. As shown in
table 14, a total of 114 respondents said that they produced cassava and 99 (87%) of these said that
the period for production of cassava was between July and September. Others, 5 (4%) and 10 (9%)
put April to June and between October and December as the main production periods for cassava.
Table 14: - Best cassava production seasonal within an annual cycle, by Planning Area
Planning Area Productivity
period Catamoio Gelo Inguri Kwirikwidge Quelelene Sangage Thamole Total
Apr-Jun 3 2 - - - - - 5
Jul-Sep 26 19 8 5 6 30 5 99
Oct-Dec 5 3 1 1 - - - 10
TOTAL 34 24 9 6 6 30 5 114
105 respondents said that they produced rice. As shown in table 15, 90 (86%) respondents
mentioned that between April and June was the most productivity period for rice. Only 12
respondents (11%) said that the best rice production period was between July and September.
Catamoio (33), Gelo (18) and Sangage (18) were the PA’s with more fishing respondents whose
families produce rice.
Table 15: - Best rice production season by Planning Area
Planning Area Productivity
period Catamoio Gelo Inguri Kwirikwidge Quelelene Sangage Thamole Total
Jan-Mar - - - - - 1 - 1
Apr-Jun 33 18 8 4 5 18 4 90
Jul-Sep 3 1 2 - 4 1 1 12
Out-Dec 1 - 1 - - - - 2
TOTAL 37 19 11 4 9 20 5 105
Regarding beans, 96 respondents said that they grow beans mainly for consumption. As shown in
table 16, almost half of respondents (45 corresponding to 47%) mentioned between April and June
as the most productive period for beans and 40 respondents (42%) said that the bean production
period is between July and September. Curiously, between the period between April and June, as

52
shown in table 16, was also mentioned as the period when rice was a good crop and, also between
July and September was mentioned as good for cassava, as shown in table 14. According to
Artisanal fishing villagers, cassava and beans productivity periods go together.
Table 16: - Best beans production season by Planning Area
Planning Area Productivity
period Catamoio Gelo Inguri Kwirikwidge Quelelene Sangage Thamole Total
Jan-Mar 1 - - - - 1 - 2
Apr-Jun 10 5 2 4 4 17 3 45
Jul-Sep 13 11 7 - 2 7 - 40
Oct-Dec 9 - - - - - - 9
TOTAL 33 16 9 4 6 25 3 96
Peanuts or groundnuts are in fourth place according to the fishing villagers’ ranking. A total of 83
respondents pointed out to have dealt with this kind of crop. As shown in table17, the period April to
June is the main productivity period for peanuts according to 61 respondents (74%). Catamoio (23)
and Gelo (13) presented the most respondents involved in the peanuts production. Peanuts
productivity period, table 17 coincides with beans productivity period as shown in tables 16.
Table 17: - Best peanuts production season within an annual cycle by Planning Area
Planning Area Productivity
period Catamoio Gelo Inguri Kwirikwidge Quelelene Sangage Thamole Total
Jan-Mar - 2 - - 2 1 1 6
Apr-Jun 23 13 8 2 3 9 3 61
Jul-Sep 3 3 1 1 8 16
TOTAL 26 18 8 3 6 18 4 83
5.2.3.4 – Housing
Housing conditions in the fishing villages is, in general, not so bad. However, houses are, mainly,
made using local material like those from mangrove and palmer trees. In terms of internal and
external structures, these houses are well conceived. They have, normally, between 3 and 4
divisions corresponding, at least, to two rooms, one lounge and kitchen. The critical situation found in
fishing villagers’ houses is the absence of “latrines”. There is strong traditional influence of not using

53
“conventional latrines” and, the “bush toilet” has been the general alternative used in, almost, all
coastal fishing villages, particularly, in the northern part of the country which is mainly Islamic.
Table 18: - Type of house of respondents by Planning Area
Planning Area Class
Catamoio Gelo Inguri Kwirikwidge Quelelene Sangage Thamole Total
Non
conventional 37 27 18 9 13 30 12 146
Conventional - - - 1 1 2 - 4
TOTAL 37 27 18 10 14 32 12 150
As shown in table 18, 146 respondents (97% of the houses) are made from local material and only 4
respondents (3%) had conventional houses. Sangage (2), Kwirikwidge (1) and Quelelene Island (1)
are the fishing villages where these conventional houses were found. The quality of the houses
found as well as the tendency in having improved houses in the fishing villages reflect the positive
impact of the artisanal fishing activity.
Table 19: - Main assets owned by respondents as a household by Planning Area
Planning Area Type of assets in house
Catamoio Gelo Inguri Kwirikwidge Quelelene Sangage Thamole
Total
motorcycle - - - 1 - 1 - 2
Bicycle (b) 1 9 1 1 - 8 1 21
Radio (c) 16 8 7 3 11 10 1 56
furniture 3 1 2 1 1 4 - 12
(b) and (c) 6 4 1 1 - 5 1 18
others - 1 - - - - 1 2
(b), (c), motto, and
furniture - - 2 1 - 1 2 6
TOTAL 26 23 13 8 12 29 6 117
Income from fishing can also be reflected in assets apart for the fishing villagers’ housing conditions.
In this regard, respondents were asked what kind of assets they have manage to buy in the last 5
years. As shown in table 19, radios (48%), bicycle (18%), and a diversity of furniture (10%) were
assets fishing villagers spent their income on. The bicycle is, effectively, the most preferable means
of transport in many of the fishing villages, particularly, in the northern part of the country.

54
Information shows that 5% of the respondents possessed all these assets, namely bicycle, radio,
motorcycle and furniture simultaneously.
5.5.5.5.2222....4444 –––– Traditional and cultural practices Traditional and cultural practices Traditional and cultural practices Traditional and cultural practices
Traditional and cultural practices were studied to understand how they influence the fishing activity
and to what extent they contribute to the fishing zones identification. According to respondents, the
strict observation of certain traditional and cultural beliefs is a determinant for fishing success. The
following practices were identified by respondents: “Cleaning cemeteries”; “Hijabo”; “Olomba”;
“Lihuco” and “Inkutho” ceremonies. However, there was a feeling that these practices are losing their
traditional and cultural power due to the great influence of outsiders’ religious beliefs. It was also
mentioned that, there was less importance given to these practices by local youth due to the heavy
western influence, especially, at this period of the so called “the age of globalization”.
It must be pointed out that in the field, there were no data collected for fish capture from those
respondents “always and sometimes” observing traditional and cultural practices for confirming the
relationship between the volume of fish captures and the observation of these beliefs. Meanwhile,
there is strong belief that those observing these practices were more successful in their fishing
activities relative to those who do not observe the practices. It is suggested that investigations
around this should be done in the future studies to fill the gap in knowledge.
i) - “Cleaning cemeteries”
It is a belief that cleaning the burial places where the fishermen’s ancestors are resting is a way of
giving them adequate respect and high consideration they deserve. By doing so, ancestors respond
in different ways like protecting fishermen from evil spirits and bringing to them luck in their fishing
activities. In this regard, as shown in table 20, 56 respondents (35%) declared that they observed
the ritual of “always” “cleaning cemeteries” and 43 respondents (27%) said they observed this
practice “sometimes”. 61 respondents ( 38%) declared that they “never” observed this practice.

55
Table 20: - Observation of the ‘Cleaning cemeteries practice’ by Planning Area
Planning Area Scale
Catamoio Gelo Inguri Kwirikwidge Quelelene Sangage Thamole Total
Always 14 11 3 4 3 16 5 56
Sometimes 13 10 1 2 4 11 2 43
Never 14 8 16 5 8 6 4 61
TOTAL 41 29 20 11 15 33 11 160
ii) - “Hijabo ceremony”
This practice consists of organizing food and/or drinks and inviting family and/or other closer
relatives and friends to participate in prayer and/or evocation to the ancestors. Local information
says that everyone and according to necessity or need, can organize and do this practice without
observing many detailed pre-requisites. The core aspect underlying this belief is the “remembering”
those who, in real life lived with us. There is a belief that by “remembering” them, they will also
remembering us and they will give us luck we are looking for. For fishermen, observing this practice
makes them believe that they will have luck in their fishing activities.
Table 21: - Observation of the ‘Hijabo ceremony practice’ by Planning Area
Planning Area Scale
Catamoio Gelo Inguri Kwirikwidge Quelelene Sangage Thamole Total
Always 16 10 3 4 2 17 6 58
Sometimes 13 9 1 3 6 8 2 42
Never 12 10 16 4 7 8 3 60
TOTAL 41 29 20 11 15 33 11 160
As shown in table 21, 58 respondents (36%) were “always” observing, while 42 respondents (26%)
were “sometimes” observing “Hijabo ceremony” practices for fishing purposes. The high percentage
(38%) corresponding to 60 respondents declared they “never” observed this practice. Sangage (17),
Catamoio (16) and Gelo (10) had the most respondents believing that observing “Hijabo ceremony”
practice contributes to and influences the level of their fish captures. In contrast, Inguri (16),
Catamoio (12) and Gelo (10) show high number of respondents who declared that they never
observed this practice.

56
iii) - “Olomba ceremony”
This belief is based on “asking a favour” or “appealing” to the ancestors for anything someone or the
community would like to see solved. The ceremony can be done either by a single family or involves
the entire community. When it involves the entire community, it is led by local and/or traditional
leaders. This practice is mainly about appealing for luck, social and economic protection in a very
broad sense. The ceremony takes seven (7) days. The entire community goes to the traditional
leader’s house and for 2 to 3 days, participants dance and do cleaning of all sacred places. After
cleaning all sacred places, the ceremony extends to the beach where (prototypes of boats and other
fishing toys) including traditional food is taken and scattered into the pre-determined places on the
sea bed. To discover where exactly to spill the prepared things, one person in the community,
suddenly, gets attacked by traditional spirits “winhuwa”. It is exactly there where everything has to be
scattered and then the ceremony ends. “Olomba ceremony” practice is carried out every year,
normally, at the end of the year.
Table 22: - Observation of the ‘Olomba ceremony practice’ by Planning Area
Planning Area Scale
Catamoio Gelo Inguri Kwirikwidge Quelelene Sangage Thamole Total
Always 19 9 15 7 8 22 4 84
Sometimes 8 10 1 2 2 6 2 31
Never 14 10 4 2 5 5 5 45
TOTAL 41 29 20 11 15 33 11 160
A total number of 160 fishing villagers were interviewed on this practice. As shown in table 22, 84
respondents (corresponding to 53%) said they “always” observed this ceremony, 31 respondents
(corresponding to 19%), said they observed it “sometimes” and 45 respondents (28%) declared they
“never” observed this practice at all. It must be realized that the high number (84) of those “always”
observing this ceremony was because going to mosque for praying is also considered as practicing
“olomba”.
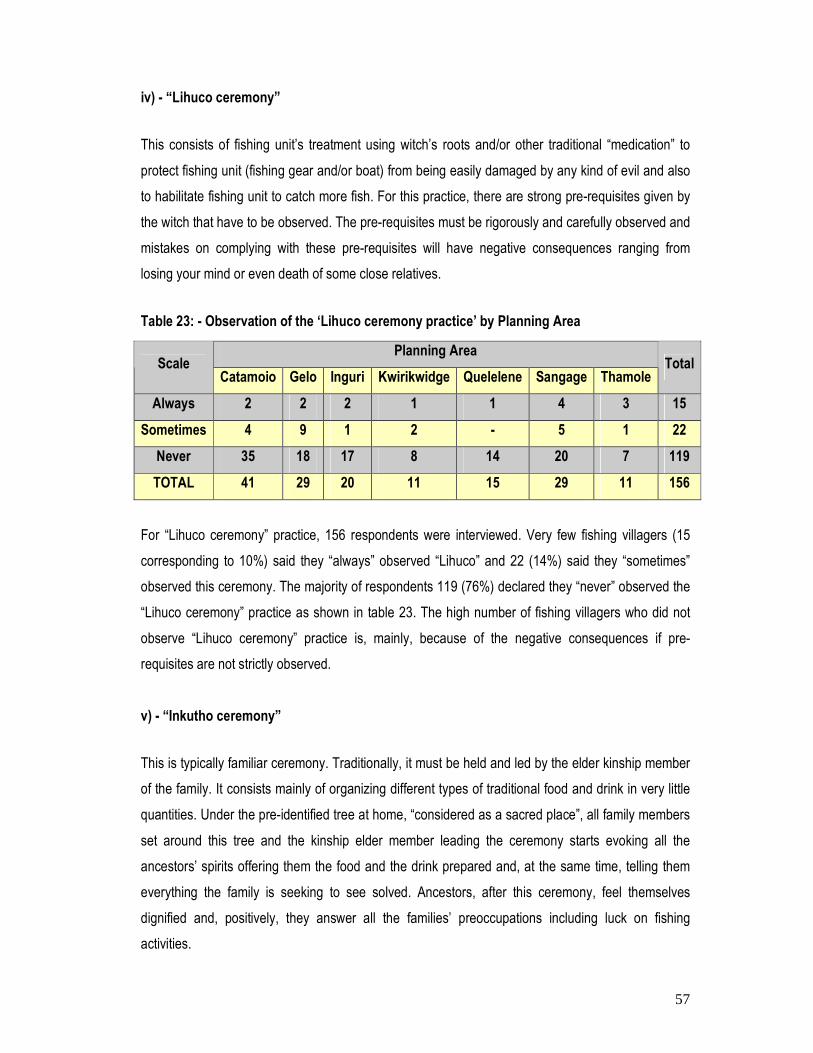
57
iv) - “Lihuco ceremony”
This consists of fishing unit’s treatment using witch’s roots and/or other traditional “medication” to
protect fishing unit (fishing gear and/or boat) from being easily damaged by any kind of evil and also
to habilitate fishing unit to catch more fish. For this practice, there are strong pre-requisites given by
the witch that have to be observed. The pre-requisites must be rigorously and carefully observed and
mistakes on complying with these pre-requisites will have negative consequences ranging from
losing your mind or even death of some close relatives.
Table 23: - Observation of the ‘Lihuco ceremony practice’ by Planning Area
Planning Area Scale
Catamoio Gelo Inguri Kwirikwidge Quelelene Sangage Thamole Total
Always 2 2 2 1 1 4 3 15
Sometimes 4 9 1 2 - 5 1 22
Never 35 18 17 8 14 20 7 119
TOTAL 41 29 20 11 15 29 11 156
For “Lihuco ceremony” practice, 156 respondents were interviewed. Very few fishing villagers (15
corresponding to 10%) said they “always” observed “Lihuco” and 22 (14%) said they “sometimes”
observed this ceremony. The majority of respondents 119 (76%) declared they “never” observed the
“Lihuco ceremony” practice as shown in table 23. The high number of fishing villagers who did not
observe “Lihuco ceremony” practice is, mainly, because of the negative consequences if pre-
requisites are not strictly observed.
v) - “Inkutho ceremony”
This is typically familiar ceremony. Traditionally, it must be held and led by the elder kinship member
of the family. It consists mainly of organizing different types of traditional food and drink in very little
quantities. Under the pre-identified tree at home, “considered as a sacred place”, all family members
set around this tree and the kinship elder member leading the ceremony starts evoking all the
ancestors’ spirits offering them the food and the drink prepared and, at the same time, telling them
everything the family is seeking to see solved. Ancestors, after this ceremony, feel themselves
dignified and, positively, they answer all the families’ preoccupations including luck on fishing
activities.
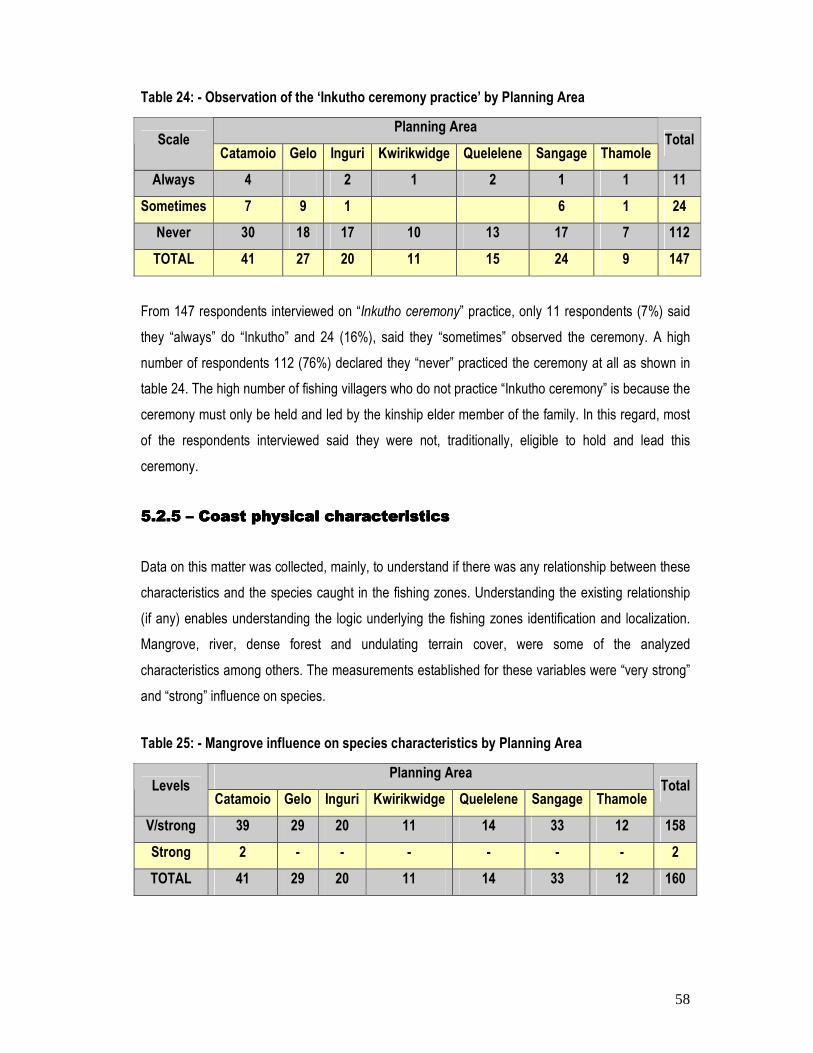
58
Table 24: - Observation of the ‘Inkutho ceremony practice’ by Planning Area
Planning Area Scale
Catamoio Gelo Inguri Kwirikwidge Quelelene Sangage Thamole Total
Always 4 2 1 2 1 1 11
Sometimes 7 9 1 6 1 24
Never 30 18 17 10 13 17 7 112
TOTAL 41 27 20 11 15 24 9 147
From 147 respondents interviewed on “Inkutho ceremony” practice, only 11 respondents (7%) said
they “always” do “Inkutho” and 24 (16%), said they “sometimes” observed the ceremony. A high
number of respondents 112 (76%) declared they “never” practiced the ceremony at all as shown in
table 24. The high number of fishing villagers who do not practice “Inkutho ceremony” is because the
ceremony must only be held and led by the kinship elder member of the family. In this regard, most
of the respondents interviewed said they were not, traditionally, eligible to hold and lead this
ceremony.
5.5.5.5.2222....5555 –––– Coast physical characteristics Coast physical characteristics Coast physical characteristics Coast physical characteristics
Data on this matter was collected, mainly, to understand if there was any relationship between these
characteristics and the species caught in the fishing zones. Understanding the existing relationship
(if any) enables understanding the logic underlying the fishing zones identification and localization.
Mangrove, river, dense forest and undulating terrain cover, were some of the analyzed
characteristics among others. The measurements established for these variables were “very strong”
and “strong” influence on species.
Table 25: - Mangrove influence on species characteristics by Planning Area
Planning Area Levels
Catamoio Gelo Inguri Kwirikwidge Quelelene Sangage Thamole Total
V/strong 39 29 20 11 14 33 12 158
Strong 2 - - - - - - 2
TOTAL 41 29 20 11 14 33 12 160

59
For “mangrove cover”, 160 respondents were interviewed and, as shown in table 25, almost all
respondents 158 (99%), said that the mangrove cover had a “very strong” influence on the species
caught in the fishing zones.
Relative to “river presence”, 159 respondents said that the river presence has a “very strong”
influence on the species caught in the fishing zones, as shown in table 26.
Table 26: - River influence on species characteristics by Planning Area
Planning Area Levels
Catamoio Gelo Inguri Kwirikwidge Quelelene Sangage Thamole Total
V/strong 40 29 20 11 14 33 12 159
Strong 1 - - - - - - 1
TOTAL 41 29 20 11 14 33 12 160
Contrary to mangrove cover and river presence, “dense forest” and “undulating terrain” cover, as
shown in tables 27 and 28, respectively, most of respondents declared that these two coastal
characteristics have “no” influence on the species caught in the fishing zones.
Table 27: - Dense forest influence on species characteristics by Planning Area
Planning Area Levels
Catamoio Gelo Inguri Kwirikwidge Quelelene Sangage Thamole Total
Strong 1 9 - - - 3 - 13
None 40 20 20 11 14 30 12 147
TOTAL 41 29 20 11 14 33 12 160
The results on “dense forest” and “undulating terrain” cover, show similar behaviour either in global
or by Planning Area.
Table 28: - Undulating terrain influence on species characteristics by Planning Area
Planning Area Levels
Catamoio Gelo Inguri Kwirikwidge Quelelene Sangage Thamole Total
Strong 1 8 - - - 3 - 12
None 40 21 20 11 14 30 12 148
TOTAL 41 29 20 11 14 33 12 160

60
5.5.5.5.2222....6666 –––– Technological characteristics Technological characteristics Technological characteristics Technological characteristics
The fishing gears, fish productivity period and fish species are the technological characteristics
analyzed in this section. Respondents interviewed ranked three fishing gears, namely, beach seine,
gillnet and hand line, as the most used in the study area. Others like cage, quinia and diving,
appeared in a second category. Definition of the most used fishing gears is given in the glossary.
As shown in table 29, 85 respondents (53%) were beach seine users; 35 (22%) of the respondents
were using gillnet; 22 (13,7%) of the respondents were linked with hand line; and 9 for cage, 1 for
diving and 9 for quinia (all together, accounting for 19 respondents) corresponding 11,8%, were
using these diverse fishing gears. Catamoio (41respondents), Sangage (33 respondents), Gelo (29
respondents) and Inguri (20 respondents) were the PA’s with the most fishing gears. Sangage (16) is
the leading PA in use of beach seine; Catamoio (14) had the most gillnets and also accounted for the
most hand lines (7) and cages (7).
Table 29: - Fishing gear types in use by Planning Area
Planning Area Gears
Catamoio Gelo Inguri Kwirikwidge Quelelene Sangage Thamole Total
B/seine 11 14 11 11 13 16 9 85
Gillnet 14 4 5 - 1 9 2 35
Hand line 7 6 1 - 1 6 1 22
Cage 7 2 - - - - 9
Diving - - 1 - - - - 1
Quinia 2 5 - - - 2 - 9
TOTAL 41 29 20 11 15 33 12 161
In relation to fish productivity period as shown in table 30, 157 respondents were interviewed and 69
respondents (44%) said that January to June is the period when fish is most abundant and 39
respondents (25%) mentioned the period between January and March as the most productivity
period. In general, fish productivity is best in the first six months of the year.

61
Table 30: - Opinion on best fishing season by Planning Area
Planning Area Productivity
period Catamoio Gelo Inguri Kwirikwidge Quelelene Sangage Thamole Total
Jan-Mar 19 6 4 1 2 7 - 39
Apr-Jun 4 2 1 2 2 2 2 15
Jul-Sep 3 2 4 - - 6 1 16
Oct-Dec 1 3 4 - 1 3 - 12
Jan-Jun 12 13 7 7 9 12 9 69
Jul-Dec 2 2 1 - 1 - 6
TOTAL 41 28 20 11 14 31 12 157
Concerning species, fishing villagers were asked to list the main species they catch according to
fishing gear used. Results show that “Anchoveta” (ocaris) is the leading species caught as it had
been mentioned by 84 respondents. Thirty four species were mentioned and in terms of frequency,
most of the species appeared in the beach seine. It must be noticed that “SPECIES’ NAMES” are in
official language (Portuguese) and not in scientific language. The idea is to show its frequency by
fishing gear.
Table 31: - Most common species caught by fishing gear
Fishing gears Order Species
Beach seine Gillnet Hand line Cage Diving Quinia Total
1 ANCHOVETA 63 11 2 1 0 7 84
2 PESCADINHA 45 22 9 5 0 1 82
3 SARDINHA 48 24 4 3 0 0 79
4 PX. ESPADA 48 18 2 1 0 2 71
5 CARAPAU 45 21 1 2 0 0 69
6 PX. PEDRA 37 7 12 4 0 0 60
7 PX. SERA 39 6 10 1 0 0 56
8 PX.AGULHA 38 12 3 1 0 0 54
9 CAMARAO 35 5 0 6 0 7 53
10 MAGUMBA 31 15 1 3 0 1 51
TOTAL 429 141 44 27 0 18 659

62
As shown in table 31 and for illustration, only, the ten top species are listed. These top ten species
were counted 659 times in the fishing gears over the survey period. Most of the species accessible
to artisanal fishing activity are caught in estuaries, beaches and open sea localized surrounding
Islands situated not far from the continental shelf. The fishing Islands frequented most by artisanal
fishermen are Mafamede, Pupa-puga, Njovo and Caldeira which also serve as safe places if
fishermen are exposed to dangerous sea, mainly, winds.
5.5.5.5.2222....7777 –––– Climate characteristics Climate characteristics Climate characteristics Climate characteristics
Atmospheric and oceanic factors influencing fishing activity account for climate characteristics.
Rainfall, drought, wind occurrence and lunar cycle account for atmospheric factors; and, tidal cycle,
dirty and water transparency account for oceanic factors. Periods of occurrence as well as the
influence on fishing of these factors are analyzed in this section. Knowing periods of occurrence and
influence on fishing of climate characteristics contributes the understanding of the fishing villagers’
logic underlying artisanal fishing zones identification and influence fishermen’s choice and planning
about where and when to fish without fatal consequences. There are also other climatic
characteristics like state of water (temperature, churnings, and deepness) and state of day/night
(cloudy, stormy, hot or cold) that influence such decisions which are not analysed or described in this
section.
5.2.7.1 – Period of occurrence
i) - Atmospheric factors
From table 32 concerning the “rainy” period, 110 respondents were interviewed and 90 of them
(89%), said that from January to March is the rainfall period. 19 respondents (17%) said that rainfall
occurs from October to December. Generally, respondents’ views suggest that the rainy season
normally stretches from October to March.
Table 32: - Characterisation of rainy season by Planning Area
Planning Area Rainy period
Catamoio Inguri Quelelene Sangage Thamole Total
Jan-Mar 41 1 15 33 - 90
Jul-Sep - - - - 1 1
Oct-Dec - 19 - - - 19
TOTAL 41 20 15 33 1 110

63
In relation to the “dry season” as shown in table 33, 106 respondents were interviewed and 43% (46
respondents) said that April to June was the dry season, 27% (29 respondents) said that dry season
was between July and December and 21% (22 respondents) mentioned July to September as the
dry season. From the data, it is generally understood that the dry season normally stretches from
April to September.
Table 33: - Characterisation of dry season by Planning Area
Planning Area Dry period
Catamoio Gelo Inguri Quelelene Thamole Total
Apr-Jun 31 - - 15 - 46
Jul-Sep 3 - 19 - - 22
Oct-Dec 7 1 - 1 9
Jul-Dec - 29 - - - 29
TOTAL 41 29 20 15 1 106
For the “Windy factor”, only, northern and southern wind periods are analyzed and described here for
illustration. Meanwhile, (west, east, north west, north east, and south west, south east) winds have
also got influence on fishing. In this regard, as shown in table 34, 106 respondents were interviewed
and 87 (82%), said that from October to December there is a predominantly northerly wind period
and 19 respondents (18%) thought the period for the northerly winds was July to December.
Table 34: - Characterisation of ‘Northerly wind’ season by Planning Area
Planning Area Windy period
Catamoio Gelo Inguri Quelelene Thamole Total
Oct-Dec 41 29 1 15 1 87
Jul-Dec - - 19 - - 19
TOTAL 41 29 20 15 1 106
Thus according to the experience of artisanal fishermen, July to December is considered as the
period when northerly wind predominates.

64
Table 35: - Characterisation of ‘Southerly wind’ season by Planning Area
Planning Area Windy period
Catamoio Gelo Inguri Quelelene Sangage Thamole Total
Jan-Mar 7 - - 15 - - 22
Apr-Jun 28 29 20 - 33 1 111
Jul-Sep 6 - - - - - 6
TOTAL 41 29 20 15 33 1 139
Data from the table 35 indicates that 139 fishermen were interviewed and of these 111 respondents
(80%) thought April to June was the main period for southerly winds while 22 respondents (16%)
thought January to March was the main period for these winds. Thus the data shows that from
January to June is the period when southerly winds predominate.
ii) – Oceanic factors
Tides have an effect on artisanal fishing activity. The tidal cycle is composed by two main types,
namely, rising and falling tides. Each of these two types occurs twice in a month. There is a very
strong relationship between tidal and lunar cycles. According to artisanal fishermen, lunar cycle
aggregates, normally, thirty days and the second day of the lunar cycle is the first day of the tidal
cycle. In this regard, the tidal cycle accounts for almost 29 days.
Table 36: - Characterisation of ‘Rising tides’ periods in a month by Planning Area
Planning Area Tidal
period Catamoio Gelo Inguri Kwirikwidge Quelelene Sangage Thamole Total
9-15/24-30 41 29 20 11 15 33 12 161
TOTAL 41 29 20 11 15 33 12 161
According to the fishing villagers’ experience, rising tides, on one hand, occur between the 9th and
15th and between the 24th and 30th and, on the other hand, falling tides, occur between the 1st and
8th day and between 16th and 23rd day of a lunar cycle as shown in tables 36 and 37, respectively.

65
Table 37: - Characterisation of ‘Falling tides’ periods in a month by Planning Area
Planning Area Tidal
period Catamoio Gelo Inguri Kwirikwidge Quelelene Sangage Thamole Total
1-8/16-23 41 29 20 11 15 33 12 161
TOTAL 41 29 20 11 15 33 12 161
As shown in tables 36 and 37, artisanal fishing villagers have common perceptions on tidal and lunar
cycles.
5.2.7.2 – Influence on fishing
i) – Atmospheric factors Eight (8) kinds of winds were identified but only six (6) are dealt with here, namely: - North
(Kaskhazi); South (Kussi); West (Manthe); East (Madulai), South East (Phalalazi) and South West
(Olani) winds. According to respondents, these six types of winds have greater fishing influence than
others.
Table 38: - Opinion on ‘Northerly wind’ influence on fishing by Planning Area
Planning Area Scale
Catamoio Gelo Inguri Kwirikwidge Quelelene Sangage Thamole Total
Very good 39 28 15 11 13 25 12 143
Reasonable 1 1 3 - - 3 - 8
Bad 1 - 2 - 2 5 - 10
TOTAL 41 29 20 11 15 33 12 161
A total of 161 respondents were interviewed about both northerly and southerly wind conditions for
fishing. As shown in tables 38 and 39, 89% (143 respondents) were in favour of northerly wind
conditions, while 91% (147 respondents) were against southerly wind conditions for fishing.
Southerly wind is generally characterized by heavy winds with high waves and strong churning water
which do not offer any conditions for any fishing activity. The southerly wind is commonly considered
very dangerous for sea water activity.
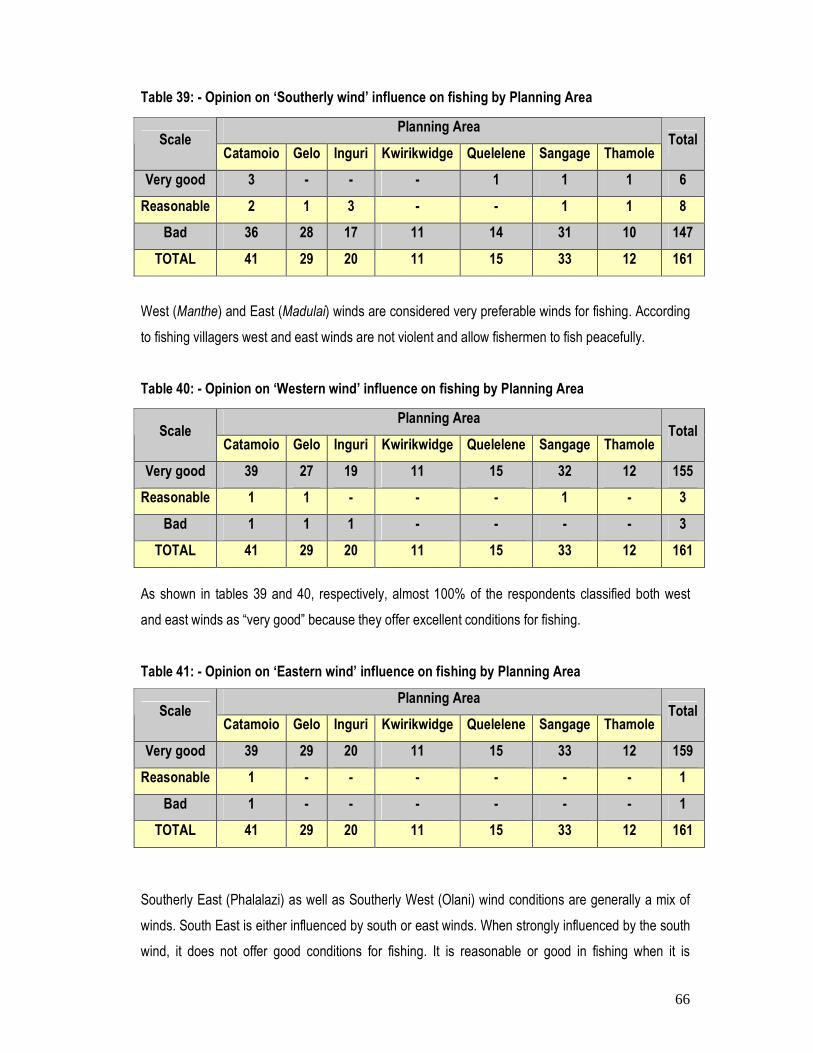
66
Table 39: - Opinion on ‘Southerly wind’ influence on fishing by Planning Area
Planning Area Scale
Catamoio Gelo Inguri Kwirikwidge Quelelene Sangage Thamole Total
Very good 3 - - - 1 1 1 6
Reasonable 2 1 3 - - 1 1 8
Bad 36 28 17 11 14 31 10 147
TOTAL 41 29 20 11 15 33 12 161
West (Manthe) and East (Madulai) winds are considered very preferable winds for fishing. According
to fishing villagers west and east winds are not violent and allow fishermen to fish peacefully.
Table 40: - Opinion on ‘Western wind’ influence on fishing by Planning Area
Planning Area Scale
Catamoio Gelo Inguri Kwirikwidge Quelelene Sangage Thamole Total
Very good 39 27 19 11 15 32 12 155
Reasonable 1 1 - - - 1 - 3
Bad 1 1 1 - - - - 3
TOTAL 41 29 20 11 15 33 12 161
As shown in tables 39 and 40, respectively, almost 100% of the respondents classified both west
and east winds as “very good” because they offer excellent conditions for fishing.
Table 41: - Opinion on ‘Eastern wind’ influence on fishing by Planning Area
Planning Area Scale
Catamoio Gelo Inguri Kwirikwidge Quelelene Sangage Thamole Total
Very good 39 29 20 11 15 33 12 159
Reasonable 1 - - - - - - 1
Bad 1 - - - - - - 1
TOTAL 41 29 20 11 15 33 12 161
Southerly East (Phalalazi) as well as Southerly West (Olani) wind conditions are generally a mix of
winds. South East is either influenced by south or east winds. When strongly influenced by the south
wind, it does not offer good conditions for fishing. It is reasonable or good in fishing when it is

67
influenced by the east wind. The south West wind is also influenced either by south or west wind. If it
is strongly influenced by the south wind, it does not also offer good conditions for fishing. South West
wind offers reasonable or good fishing conditions only when it is influenced by the west wind.
Table 42: - Opinion on ‘South-East wind’ influence on fishing by Planning Area
Planning Area Scale
Catamoio Gelo Inguri Kwirikwidge Quelelene Sangage Thamole Total
Very good 5 3 - - - - 8
Reasonable 2 1 1 - 1 - - 5
Bad 34 28 16 11 14 33 12 148
TOTAL 41 29 20 11 15 33 12 161
According to fishing villagers, the South East wind is very bad when compared with South West
wind. While for South West (Olani) wind fishermen can, sometimes, go for fishing, they never do so
in the South East (Phalalazi) winds. In general, both South East and South West winds are, mainly,
characterized by violent winds.
Table 43: - Opinion on ‘South Westly’ wind influence on fishing by Planning Area
Planning Area Scale
Catamoio Gelo Inguri Kwirikwidge Quelelene Sangage Thamole Total
Very good 2 - 2 - 1 - - 5
Reasonable 35 10 9 4 14 11 5 88
Bad 4 19 9 7 - 22 7 68
TOTAL 41 29 20 11 15 33 12 161
As shown in tables 42 and 43, respectively, 148 respondents (92%) revealed that the South East
wind offer extremely bad fishing conditions and 68 respondents (42%) said that Southerly West wind
conditions are bad for fishing. Meanwhile, 88 respondents (55%) said that Southerly West wind
conditions were reasonable for fishing.
Concerning rainfall and drought factors, respondents expressed their preference for the rainy
season. As shown in table 44, 143 respondents (90%) said rainy that the season offers “very good”
conditions for fishing. Meanwhile, fishing villagers argue that, although fish productivity is very high in

68
the rainy season, they do not fish as much as they can because of harvest losses. Artisanal
fishermen do not have the required capacity to avoid harvest losses in the rainy season.
Table 44: - Opinion on influence of ‘Rainy season’ on fishing by Planning Area
Planning Area Scale
Catamoio Gelo Inguri Kwirikwidge Quelelene Sangage Thamole Total
Very good 40 24 18 9 14 28 10 143
Reasonable 1 2 1 - - 3 - 7
Bad 3 1 2 1 2 9
TOTAL 41 29 20 11 14 32 12 159
In relatively to the dry season, 159 fishing villagers were interviewed. A number of 131 respondents
(82%) said that drought negatively influenced fishing. According to fishermen, although conditions for
fishing are bad in the dry season as shown in table 45, high fishing effort is observed at this period
because artisanal fishermen can make use of the entire fish production they can obtain. They went
further arguing that the dry season is the ideal period for artisanal fish processing for those who do
not have conditions for conventional processing infrastructures.
Table 45: - Opinion on influence of ‘Dry season’ on fishing by Planning Area
Planning Area Scale
Catamoio Gelo Inguri Kwirikwidge Quelelene Sangage Thamole Total
Very good - 2 1 2 - 1 1 7
Reasonable 3 13 - - - 5 - 21
Bad 38 14 19 9 14 26 11 131
TOTAL 41 29 20 11 14 32 12 159
With regard to the moon factor, lunar cycle encompasses four sub-lunar cycles, namely, new moon,
first quarter moon, full moon and second quarter moon phases. Moon and tides are major factors
and heavily determine and influence fishing activity. According to artisanal fishermen, they easily
decide whether or not going for fishing when they know which phase of the sub-lunar and/or sub-tidal
cycle it is within the month. Lunar and tidal cycles have very a strong relationship and greatly
influence fishermen’s’ decision about whether to go out fishing or not.

69
Table 46: - Opinion on influence of ‘New moon’ on fishing by Planning Area
Planning Area Scale
Catamoio Gelo Inguri Kwirikwidge Quelelene Sangage Thamole Total
Very good 14 2 2 1 2 - - 21
Reasonable 3 19 1 - 1 10 34
Bad 24 7 17 9 11 22 12 102
TOTAL 41 28 20 10 14 32 12 157
For the new moon phase as shown in table 46, 157 fishing villagers were interviewed and 102
respondents (65%) said this phase is “bad” for fishing; 34 respondents (22%) said that the new moon
is “reasonable” for fishing and 21 (13%) said new moon phase offers “very good” conditions for
fishing.
Table 47: - Opinion on influence of ‘Full moon’ on fishing by Planning Area
Planning Area Scale
Catamoio Gelo Inguri Kwirikwidge Quelelene Sangage Thamole
Total
Very good 23 3 8 9 9 16 12 80
Reasonable 3 18 1 - 4 13 - 39
Bad 15 7 11 1 1 3 - 38
TOTAL 41 28 20 10 14 32 12 157
In regard to the full moon phase, a total number of 157 fishing villagers were interviewed. 80
respondents (corresponding to 51%) considered the full moon phase as offering “very good”
conditions for fishing; 39 respondents (corresponding to 25%) said that conditions for fishing in full
moon are “reasonable” and 38 interviewees (corresponding to 24%) said that the full moon phase is
“bad” for fishing, as shown in table 47.
Full moon phase offers “very good” conditions for fishing, mainly, for fishermen who also fish at night.
This is so because they argue, at night fishing gear contact with water normally produces light which
makes fish run away. With the full moon, there is light at night and this “phenomenon” does not
happen and this allows “fish to easily get caugh”. Diegues (1999) argues that such phenomenon is
due to the “scintillation produced by shoals of certain pelagic fishes (sardines) during the nights
without moon light”.

70
Table 48: - Opinion on influence of ‘First quarter moon’ on fishing by Planning Area
Planning Area Scale
Catamoio Gelo Inguri Kwirikwidge Quelelene Sangage Thamole
Total
Very good 21 2 1 - 3 2 - 29
Reasonable 14 21 1 - 6 10 - 52
Bad 6 5 18 10 5 20 12 76
TOTAL 41 28 20 10 14 32 12 157
In relation to the first quarter moon phase, 157 artisanal fishermen were interviewed about the fishing
condition offered by this phase. As shown in table 48, 76 interviewees (48%) considered first quarter
moon phase “bad” for fishing; 52 respondents (33%) said that conditions in this phase are
“reasonable” and 29 fishermen (18%) said that fishing at first quarter moon phase is “very good”.
Table 49: - Opinion on influence of ‘Second quarter moon’ on fishing by Planning Area
Planning Area Scale
Catamoio Gelo Inguri Kwirikwidge Quelelene Sangage Thamole Total
Very good 20 2 10 1 - 6 - 39
Reasonable 9 21 4 7 8 15 10 74
Bad 12 5 6 2 6 11 2 44
TOTAL 41 28 20 10 14 32 12 157
Concerning to second quarter moon, 157 fishing villagers were interviewed on this lunar phase. As
shown in table 49, 74 respondents (47%) said that fishing in second quarter moon phase is
“reasonable”; 44 fishermen (28%) said that it was is “bad” fishing in second quarter moon while 39
interviewees (25%) considered second quarter moon as phase as offering “very good” conditions for
fishing.
ii) – Oceanic factors
According to fishermen, one sub-tidal cycle corresponds to one sub-lunar cycle and each of the sub-
tidal cycle stretches for, almost, seven to eight days which, normally, coincides with seven days of
the sub-lunar cycle. Generally, rising tides occur from 9th to 15th day and this period is, normally,

71
coinciding with first quarter moon phase and from 24th to 30th day which corresponds second quarter
moon phase.
Table 50: - Opinion on influence of ‘Rising tides’ on fishing by Planning Area
Planning Area Scale
Catamoio Gelo Inguri Kwirikwidge Quelelene Sangage Thamole Total
Very good 2 1 - - - - - 3
Reasonable - 4 1 - - 2 - 7
Bad 39 24 19 11 14 30 12 149
TOTAL 41 29 20 11 14 32 12 159
From a total of 159 respondents interviewed on rising tides conditions for fishing and as shown in
table 50, 149 (94%) argued that when tides are rising it is not good for fishing. Rising tides are,
normally, characterized by churning water which is not good for fishing for most of the fishing gears.
Table 51: - Opinion on influence of ‘Falling tides’ on fishing by Planning Area
Planning Area Scale
Catamoio Gelo Inguri Kwirikwidge Quelelene Sangage Thamole Total
Very good 40 26 19 11 14 30 12 152
Reasonable - 2 1 - - 2 - 5
Bad 1 1 - - - - 2
TOTAL 41 29 20 11 14 32 12 159
Falling tides occur from the 1st to 8th day which is new moon phase and from 16th to 23rd day
coinciding with full moon phase. As shown in table 51, from a total of 159 fishermen interviewed on
falling tides condition for fishing, 152 respondents (96%) said that falling tides offer “very good”
conditions for fishing. Generally, falling tides are considered peaceful allowing fishing practices for
most of the fishing gears.
In terms of dirty water influence of fishing and as shown in table 52, 159 fishing villagers were
interviewed. A number of 143 respondents (90%) said fishing in conditions where water is dirty offers
“very good” fishing conditions; 12 fishermen (7,5%) said that dirty water offers “bad” conditions for
fishing and a small number of informants 4 (2,5%) said that dirty water offered “reasonable”
conditions for fishing.

72
Table 52: - Opinion on influence of ‘Dirty water’ on fishing by Planning Area
Planning Area Scale
Catamoio Gelo Inguri Kwirikwidge Quelelene Sangage Thamole Total
Very good 40 27 18 9 14 24 11 143
Reasonable 1 1 - - 2 - 4
Bad - 1 2 2 - 6 1 12
TOTAL 41 29 20 11 14 32 12 159
Of 159 interviewees asked about water transparency influence on fishing, 141 informants (89%) said
that catches are “bad” when fishing in places where water is transparent; 11 interviewees (7%) said
that fishing in transparent water results in “very good” catches while 7 fishermen (4%) said there are
“reasonable” catches when fishing in transparent water as shown in table 53.
Table 53: - Opinion on influence of ‘Water transparency’ on fishing by Planning Area
Planning Area Scale
Catamoio Gelo Inguri Kwirikwidge Quelelene Sangage Thamole Total
Very good - 1 2 2 - 5 1 11
Reasonable 1 2 - - - 4 - 7
Bad 40 26 18 9 14 23 11 141
TOTAL 41 29 20 11 14 32 12 159
Arguments put forward by respondents were that in dirty water, fish is not able to see the fishing gear
and can therefore be easily captured. However, in conditions where water is transparent, fish can
easily see the fishing gear and quickly swimming away.
5.5.5.5.2222....8888 –––– Management measures Management measures Management measures Management measures
General indicators for artisanal fisheries management were also collected. In this regard,
respondents were interviewed about the best and worst months for fishing and also on the best
areas or zones for fishing activities and limits according to type of fisheries such as artisanal, Semi-
industrial and Industrial fisheries. Information on areas or zones of activities as well as respective
limits is not given here. Only information on best and worst months is described in this section.
As shown in table 54, a total number of 156 informants were interviewed. From a total number of
informants 89 informants (57%) said that January to June were the best months for fishing; 27

73
fishermen (17%) said that the period from January to March gives best fishing results; 14
respondents (10%) said that the best months for fishing were from April to June; 10 artisanal
fishermen (6%) indicated October to December as best months for fishing; 9 respondents (6%) saw
July to September as best months for fishing while 7 people (4%) said they catch more fish during
the last six months (July to December) of the year.
Table 54: - Opinion on ‘Best season’ for fishing by Planning Area
Planning Area Period
Catamoio Gelo Inguri Kwirikwidge Quelelene Sangage Thamole Total
Jan-Mar 14 7 1 1 1 3 - 27
Apr-Jun 4 1 1 2 2 2 2 14
Jul-Sep 1 1 4 - - 2 1 9
Oct-Dec 1 2 4 - 1 2 - 10
Jan-Jun 17 16 10 7 10 20 9 89
Jul-Dec 4 1 - 1 - 1 - 7
TOTAL 41 28 20 11 14 30 12 156
Generally, 130 fishing villagers (83%) indicated the first six months of the year as best period for
fishing while 26 respondents (17%) said that July to December were the best months. Comparing
table 30 (fishing period by PA) and table 54 (best months for fishing), there is similarity in the
responses given by the respondents.
Table 55: - Opinion on ‘Worst months’ for fishing by Planning Area
Planning Area Period
Catamoio Gelo Inguri Kwirikwidge Quelelene Sangage Thamole Total
Jan-Mar - 1 1 1 1 1 1 6
Apr-Jul - 1 - - - - - 1
Jul-Sep 8 - - - - 2 6 16
Oct-Dec 3 3 2 2 - 4 1 15
Jan-Jun 5 2 7 - 1 3 - 18
Jul-Dec 24 21 10 8 12 20 4 99
Total 40 28 20 11 14 30 12 155

74
Concerning the worst fishing months as shown in table 55, 155 fishing villagers were interviewed.
Most of them 130 (84%) indicated the second six months as the worst period for fishing. As shown in
table 55, those 130 fishing villagers are distributed as follows: - 99 informants (64%) for July to
December; - 16 fishermen (10%) for July to September and -15 interviewees (10%) for October to
December, respectively.
5.5.5.5.3333 –––– Winds identification Winds identification Winds identification Winds identification
The identification of winds is an important step in the process of fishing zones identification. Wind is
an important determining factor for fishing. Type of clouds, their disposition in the sky; stars,
direction and the speed in movement of the clouds and the sea birds species are basis for
identification of winds. Clouds, stars, sea birds and human body temperature are indicators identified
by local fishermen for winds identification. In this regard, local indigenous knowledge in the study
area identified eight (8) types of winds although only six types of winds are described in this section
because of their particularities:
i) – South wind (Kussi)
It is the wind which blows from south to north. It has been always taken as reference for the
identification and characterization of other winds. Normally, south wind is characterized by very
heavy winds with big waves which do not offer conditions for any fishing activity. According to local
knowledge, April to June is the period the south wind, normally, occurs.
For south wind identification, fishermen observe the sky, very early in the morning (2 to 4 o’clock
am). If there are cloud formation in the south part of sky line this is taken as a strong indication that
south winds will occur, depending also on the type, tonality and movement of these clouds. Dark
cloud formation moving quickly northward results, frequently, in a sudden occurrence of the south
wind. Bright cloud formation and stacking at the sky-line normally means that the south wind will
occur later on. South wind also occurs when a “known star” is observed at night or early morning
rising from south and quickly moving, as an arrow, to the north part of the sky and then suddenly
disappears. The stars’ strong scintillation at night observed in the sky is also a potential indicator for
occurrence of the south wind.
Sea birds are another strong indicator for the occurrence of the south wind. “Gaivotas” (maruerue),
are the sea birds species known as good indicators of the winds occurrence, specially, for those very

75
heavy and dangerous winds, particularly, south or south east winds. As soon as “maruerue” (local
name), leave the islands to the continent in large numbers, fishermen or other people in the sea
must quickly giving up everything they are doing and go for very quickly to safe places for their
protection because the heavy wind will, suddenly start to blow. Also, sea waves’ noise heard from
any direction is also a strong indicator for wind occurrence.
In this regard and according to local indigenous knowledge, if fishermen are fishing, they have to
take precautionary measures as soon as they observe the formation and/or appearance in the sky of
the very dark clouds in the southern part of the sky-line and very quickly the clouds start moving
towards the northerly direction. When this happens, fishermen are, immediately obliged to give up
fishing and look for some safe places because the south wind is likely to suddenly start blowing.
ii) – North wind (Kashkazi)
This is the wind blowing from north to south. Generally, it is considered as a good wind for fishing,
except when it is very strong. The main indicator for identification of the north wind is the formation of
the clouds in the north sky-line. The explanation given in “south wind” on clouds is also valid here.
North wind appears also as the response of the south wind. According to the fishermen, as soon as
the south wind blows, the north wind is expected to blow afterwards. The North wind, normally,
occurs from October to December.
iii) – West wind (Mmathe) and East wind (Madulai)
The west wind blows from west to east upward and the east wind blows in the opposite direction.
According to local knowledge, west and east winds are the most preferable for fishing, mainly,
because they are peaceful, especially, when they do not suffer influence from the south wind. When
these are influenced by the south wind then they are not usually good for fishing. For their
identification and explanation, cloud cover and direction are also used as previously elaborated.
iv) - South East wind (Phalalazi) and South West (Olani)
The South East wind is as a result of the confrontation between South and East winds. According to
fishermen, this confrontation always results in very dangerous winds for fishing. The South East wind
is therefore considered the worst and is similar to the south wind because of its violent character

76
especially if it is influenced by south wind. Fishing villagers argue that the South East wind is
responsible for many of the sea disasters mainly because it is difficult to identify it in time to escape.
Similarly, the South West wind is also as a result of the confrontation between the South and West
winds. Contrary to the South East wind though, the South West may offer sometimes, good
conditions for fishing, especially when it is less influenced by south wind. Cloud cover and its
direction are also used to identify them.
Besides the winds described, there are other types of winds identified like North the West
(confrontation between north and west winds) and North East (confrontation between north and east
winds). Generally these are considered reasonably good winds. As argued by local fishermen, North
West and North East winds are reasonable good winds for fishing mainly because they enjoy the
influence of north, west and east winds which are normally peaceful winds. For their identifications,
cloud formation is also used.
v) – Human body
The “Human body” has also been used as a potential indicator, particularly for the change of
weather. At night, if the human body temperature rises or if those people suffering from “asthma”
face serious problems of breathing or men suffering from “hernia” diseases observe abnormal
changes in their bodies, these are indicators that, in near future, bad weather will occur. According to
artisanal fishermen, for fishing, these human symptoms are indicators for bad wind occurrence.
5.5.5.5.4444 –––– Artisanal fishing zones identification Artisanal fishing zones identification Artisanal fishing zones identification Artisanal fishing zones identification
This section examines how fishermen identify fishing zones where they usually fish using their
indigenous knowledge. In this regard, darkness of the sea water, sound of the rocks, tonality of the
sea waves, birds signal, visibility and self-experiment are the main characteristics or indicators as
well as pre-requisites for identifying artisanal fishing zones.
i) – The “darkness of the sea water”
This is the most common and dependent indicator frequently used in the artisanal fishing zones
identification. In the process of looking for better and productivity fishing zones, fishermen, while
navigating with their traditional boats (dug canoes and/or wooden boats), they concentrate on

77
observing sea water characteristics or appearance. When they observe dark sea water in a specific
area, they stop and keep fishing. Cumulative results from their experience on such areas, have
demonstrated that places characterized by sea water darkness at the surface are potentially good
fishing zones. The explanation underlying this indicator is that the sea water darkness at the surface
results from the existence of fish on the sea bed. Once the fish is there, in the process of feeding
themselves and moving around, they shake physical components lying in the sea bed and, as result,
darkness is always observed on the sea water surface.
ii) – The “sound of the rocks”
This is also another potential indicator, especially, for fishing zones identification where the sea bed
is characterized by rocks. According to fishermen, when someone goes for fishing, normally one
does not, at the first glance, know exactly where the fish are. While searching for fishing zones,
fishermen are, carefully, concerned of any situation giving them probability of discovering fish
presence. Their experiences have demonstrated that navigating on top where the sea bed is a rock,
a special sound is transmitted by the rocks to the fisherman’s boat or canoe. As soon as the sound is
heard on board the fisherman stops and start fishing there. Fishermen know the species caught on
the rock areas. Another aspect confirming they are fishing on top of rocks is that fishing hook used,
sometimes, it is stacking on rocks making it impossible to get it back. Sometimes, when is good
weather, rocks can, easily, being seen.
iii) – The “tonality of the sea waves”
This is a complementary indicator to rock sea bed fishing zones identification. At the sea water
surface where there is a rocky sea bed, the sea wave’s formation or performance change their
tonality and become more bright/light than those in other places where there is no rock sea bed. As
soon as this signal is observed, normally at a distance, fishermen go straight there for fishing.
Fishermen argue that their cumulative experiences show that such places yield very good catches.
iv) – The “birds signal”
Fishermen said that certain bird species are extremely good indicators for fishing zone identification.
“Gaivotas”, sea birds known as “maruerue” in local language, if observed flying, frequently at certain
places on the sea water, are an excellent indicator that there are plenty of fish in that area.
78
Fishermen said that these birds feed themselves by fishing so that there are no doubt that the places
where they frequently fly are abundant with fish. Fishing in those areas, fishermen have had
excellent results.
v) – The “visibility”
For fishermen, “visibility” is another indicator on which they base fishing zones identification. In the
process of fishing it is possible to see either fish or rocks when sea water is transparent, especially,
when there is good weather. Looking into the water, fishermen may observe that this place has a
rocky sea bed or they can see the fish exists in water.
vi) – The “self-experiment”
In most of the cases and without any background knowledge on how to identify fishing zones,
fishermen simply keep experimenting fishing in various places. The results from the experiments are
taken into further consideration for localization of the already discovered fishing zones.
Fishing zones identification is not by itself the end of the process. Identified fishing zones have to be
localized for further fishing use. In this regard, for localization of the identified fishing zones,
remarkable physical features on the continent are taken as bases. Most of the features taken for
fishing zones localization are the highest points situated in the land like mountains, very high and big
trees, the beacons, where they exist, dunes and the mouths of the rivers. As soon as the fishing
zones are identified in the sea, fishermen carefully look for physical features for localization of the
area using natural coordinates on land. The localization of the identified fishing zones is then “very
crucial” step because once mistakes are done in this process, the identified fishing zones can be,
easily, lost. So, fishing zones identification is, jointly, done with its occupying localization through the
physical features situated on land. As shown in plate 5, particular emphasis was given to the
indicators used for artisanal fishing zones identification into the open sea or offshore.

79
“Gaivotas” (maruerue) as indicators for fishing zones identification
Interviewing an old fisherman
Plate 5 – Fishing zones’ indicators and winds identification in fishing villages
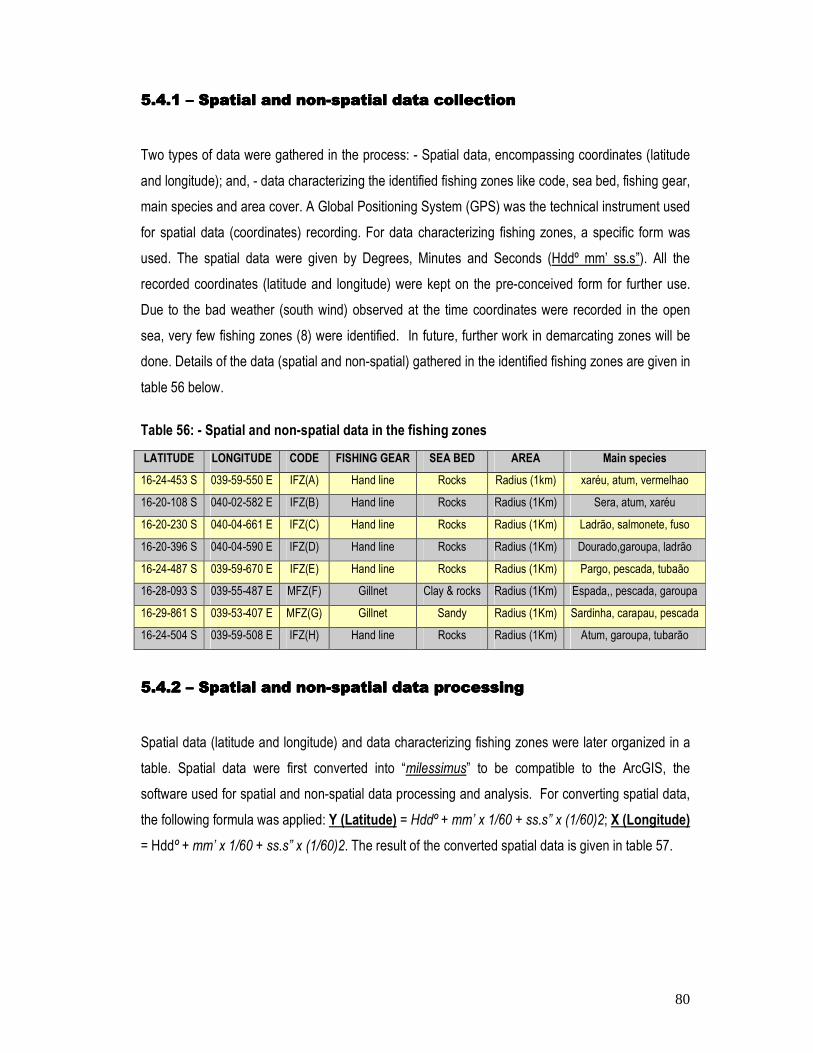
80
5.5.5.5.4444.1 .1 .1 .1 –––– Spatial and non Spatial and non Spatial and non Spatial and non----spatial data collectionspatial data collectionspatial data collectionspatial data collection
Two types of data were gathered in the process: - Spatial data, encompassing coordinates (latitude
and longitude); and, - data characterizing the identified fishing zones like code, sea bed, fishing gear,
main species and area cover. A Global Positioning System (GPS) was the technical instrument used
for spatial data (coordinates) recording. For data characterizing fishing zones, a specific form was
used. The spatial data were given by Degrees, Minutes and Seconds (Hddº mm’ ss.s”). All the
recorded coordinates (latitude and longitude) were kept on the pre-conceived form for further use.
Due to the bad weather (south wind) observed at the time coordinates were recorded in the open
sea, very few fishing zones (8) were identified. In future, further work in demarcating zones will be
done. Details of the data (spatial and non-spatial) gathered in the identified fishing zones are given in
table 56 below.
Table 56: - Spatial and non-spatial data in the fishing zones
LATITUDE LONGITUDE CODE FISHING GEAR SEA BED AREA Main species
16-24-453 S 039-59-550 E IFZ(A) Hand line Rocks Radius (1km) xaréu, atum, vermelhao
16-20-108 S 040-02-582 E IFZ(B) Hand line Rocks Radius (1Km) Sera, atum, xaréu
16-20-230 S 040-04-661 E IFZ(C) Hand line Rocks Radius (1Km) Ladrão, salmonete, fuso
16-20-396 S 040-04-590 E IFZ(D) Hand line Rocks Radius (1Km) Dourado,garoupa, ladrão
16-24-487 S 039-59-670 E IFZ(E) Hand line Rocks Radius (1Km) Pargo, pescada, tubaão
16-28-093 S 039-55-487 E MFZ(F) Gillnet Clay & rocks Radius (1Km) Espada,, pescada, garoupa
16-29-861 S 039-53-407 E MFZ(G) Gillnet Sandy Radius (1Km) Sardinha, carapau, pescada
16-24-504 S 039-59-508 E IFZ(H) Hand line Rocks Radius (1Km) Atum, garoupa, tubarão
5.5.5.5.4444.2 .2 .2 .2 –––– Spatial and non Spatial and non Spatial and non Spatial and non----spatial data processing spatial data processing spatial data processing spatial data processing
Spatial data (latitude and longitude) and data characterizing fishing zones were later organized in a
table. Spatial data were first converted into “milessimus” to be compatible to the ArcGIS, the
software used for spatial and non-spatial data processing and analysis. For converting spatial data,
the following formula was applied: Y (Latitude) = Hddº + mm’ x 1/60 + ss.s” x (1/60)2; X (Longitude)
= Hddº + mm’ x 1/60 + ss.s” x (1/60)2. The result of the converted spatial data is given in table 57.

81
Table 57: - Converted spatial data
Y (Latitude) X (Longitude) Code Y (Latitude) X (Longitude)
16o 24’ 33” 39o 59’ 10” IFZ(A) -16.4091667 39.9861111
16o 20’ 48” 40o 2’ 42” IFZ(B) -16.3466667 40.0450000
16o 20’ 50” 40o 4’ 1” IFZ(C) -16.3472222 40.0669444
16o 20’ 36” 40o 4’ 50” IFZ(D) -16.3433333 40.0805556
16o 24’ 7” 39o 59’ 10” IFZ(E) -16.4019444 39.9861111
16o 28’ 33” 39o 55’ 7” MFZ(F) -16.4758333 39.9186111
16o 29’ 21” 39o 53’ 47” MFZ(G) -16.4891667 39.8963889
16o 24’ 24” 39o 59’ 28” IFZ(H) -16.4066667 39.9911111
Due to the geographical position that Mozambique lies on in the world globe (South East (SE)
quadrant), the latitude or the value of Y (Latitude) must be “negative”. The converted spatial data as
shown in table 57 were later saved in the DBASE IV compatible and/or readable in the ArcGIS
software for further use.
Spatial and non-spatial data were further put together in table 58, later saved in the DBASE IV
and/or Accel programme. The ArcGIS was the software used for spatial and non spatial data
processing and analysis. As shown in figure 15, the following GIS stapes were then applied for
putting data into a map: - open ArcMap; - open the existing map (Angoche coastal map) in “Layer”; -
localization of the file (table of spatial and non-spatial data) in C drive; - open the menu “Tools” – go
to Add XY data; - open sub-menu “Choose a table from map and browse it; - launch data into map
by clicking “OK”.
Table 58: - Processed spatial and non-spatial data for the identified fishing zones
Code Y (Lat) X (Long) Fishin’ gear Sea bed Distance Main species
FZ1 -16.409167 39.986111 Hand line Rocks 8Km xaréu, atum, vermelhao
FZ2 -16.346667 40.045000 Hand line Rocks 12Km Sera, atum, xaréu
FZ3 -16.347222 40.066944 Hand line Rocks 14Km Ladrão, salmonete, fuso
FZ4 -16.343333 40.080556 Hand line Rocks 15Km Dourado,garoupa, ladrão
FZ5 -16.401944 39.986111 Hand line Rocks 8Km Pargo, pescada, tubaão
FZ6 -16.475833 39.918611 Gillnet Clay & rock 8Km Espada,, pescada, garoupa
FZ7 -16.489167 39.896389 Gillnet Sandy 8Km Sardinha, carapau, pescada
FZ8 -16.406667 39.991111 Hand line Rocks 8,5Km Atum, garoupa, tubarão

82
Verification and adjustment of the map containing spatial and non-spatial data resulting from the
ArcGIS application was, lastly, done in the data application process. A basic map in figure 16 below
showing the identified artisanal fishing zones in Angoche coastal zone was, finally, produced.
Figure 15 - Flowchart on spatial and non-spatial data
Spatial and non-spatial data
GPS (Spatial data) Form (Non-spatial data)
Fishing Zones FGear
Open existing Map
Open ArcMap
Islands
Go to menu Tools
Sea bed Code Species
Coord Code Sea bed FGear Species
Y
X
Coordinates converted into UTM and/or
(Milessimus)
Process of data
launching into the M
ap (GIS) Go to Add XY
data
Go to Choose a table
Map of fishing zones
(Final results)
Click OK to launch data

83
Figure 16 – Map of identified artisanal fishing zones

84
5.5.5.5.5555 –––– ConConConConclusionclusionclusionclusion
The information analyzed in this chapter shows the potential of the indigenous knowledge used in
the fishing communities. Emphasis has been given to atmospheric and oceanic factors and how
these influence fishing decisions. Particular emphasis was given to the indicators used for artisanal
fishing zones identification in the open sea or offshore;
In the whole seven (7) planning areas cover by the study there is a strong influence of fishing
activities. In addition, there are also other economic activities such as agriculture and the informal
sector. The fishing activity is, by nature, a seasonal activity. In this regard and taking into account the
challenge to fisheries management arrangements, the practice of other economic alternatives is an
indicator which can, positively, contribute for the sustainable fisheries management in the study area.
For example, fishermen can practice alternative economic activities for their survival while they are
observing certain sustainable fisheries management measures;
In almost all seven planning areas, fishing villagers can communicate using Portuguese (official
language spoken in the country). In those planning areas, there are strong religious influence and/or
beliefs which contribute to tie people to live together in an organized manner. Gender related issues
are ongoing in those planning areas. In this regard, language, community organization and gender
issues are determinant indicators which can be taken into consideration for government development
programmes for the fishing communities;
The fishing villagers in the study area strongly observe and practice traditional and cultural beliefs,
particularly for fishing purposes. The knowledge they have regarding fishing like that in atmospheric
factors (rainfall, drought, wind and lunar cycle) as well as in oceanic factors (tidal cycle and sea
water characteristics) is a result of cumulative knowledge through generations and they have used it
for centuries for their survival. This knowledge is embedded in the whole community. Integrating
and/or combining this knowledge with scientific knowledge and validating it can, feasibly, contribute
for better fisheries management in the fishery sector.

85
CHAPTER 6CHAPTER 6CHAPTER 6CHAPTER 6
Discussion and conclusionDiscussion and conclusionDiscussion and conclusionDiscussion and conclusion
6.1 6.1 6.1 6.1 –––– Intr Intr Intr Introductionoductionoductionoduction
This chapter discusses the main findings resulting from the data analysis and draws various
conclusions. The role of indigenous knowledge use in Artisanal fishing zones identification is
emphasized. Research hypotheses and research questions are the basis for the discussion. In the
conclusion, research objectives are taken into consideration. Data on socio-economic, technological
and climate characteristics that have been analyzed was meant to give a picture on the
administrative organization and the socio-economic characteristic of the fishing communities in the
study area. The detailed information on what knowledge fishers use and the process they go through
in selecting fishing zones, when to fish what methods to use etc have been identified in order to
understanding factors underlying local artisanal fishing zones identification.
6.2 6.2 6.2 6.2 –––– Discussion Discussion Discussion Discussion
The discussion in this a section is centred on research hypotheses and questions. Based on the
analyzed data from the previous chapter 5, the discussion establishes the relationship between the
indigenous and scientific knowledge in the process of identifying artisanal fishing zones. Emphasis is
given to the hypotheses testing and the response to the research questions. Conclusions are then
drawn based on the research objectives.
6.2.1 6.2.1 6.2.1 6.2.1 –––– Research hypotheses Research hypotheses Research hypotheses Research hypotheses
i) – Effectiveness absence of indigenous knowledge use in identifying Artisanal fishing zones
The analyzed data shows that indigenous knowledge use in artisanal fishing zones identification is
based on indicators. Some of these indicators are physical like “darkness”, “rocks sea bed”, “sea
birds signals” and visibility. These physical indicators can also be monitored scientifically for their
effectiveness and can be incorporated into the scientific (anthropological) research models where
possible. In this regard, indigenous knowledge use in identifying artisanal fishing zones would
appear to be effective. By so doing, this would disprove “hypothesis 1” as being untrue.
Supporting arguments on the above finding have been put forward by a number of authors. NOOA,
(2004) for example, argues that traditional ecological knowledge (TEK) is a body of knowledge and

86
beliefs transmitted through oral tradition and first-hand observation. TEK includes a system of
classification, a set of empirical observations about the local environment and a system of self-
management that governs resource use. It varies among community members, depending upon
gender, age, social status, intellectual capability and profession. It is both cumulative and dynamic,
building upon the experience of earlier generations and adapting to the new technological and
socioeconomic changes of the present.
ii) – Absence of the relationship between indigenous and scientific knowledge in identifying
artisanal fishing zones
The process of identifying artisanal fishing zones, indigenous knowledge is concern the use of
physical indicators (darkness, birds, rocks and water transparency) as well as direct observation.
Atmospheric factors (rainfall and drought, winds and moon) and oceanic factors (tides, dirtiness and
water transparency), are also used. All these are directly or indirectly connected to fishing zone in
terms of the way they influence fishing discussions.
Authors supporting the use of indigenous knowledge in artisanal fishing zones identification also
argue that traditional ecological knowledge is based on observation of recurrent natural phenomena,
which allows fishermen to make decisions about the timing of fishing activities, selection of
favourable fishing locations and the use of appropriate techniques for specific species. Without this
fine-tuned knowledge, it would be impossible for fishermen to earn a livelihood within an ever-
changing and frequently dangerous maritime environment (Samudra, 2006).
Scientifically, very little information has been validated in this regard. The National Institute for
Fisheries Resource (IIP) is now starting with an artisanal fisheries mapping programme, but this is
still in an embryonic stage. However, the little information that has been collected in this regard
indicates that, scientifically, fishing zones identification is based on sea bed physical characteristics
(sub-strata) and the species caught living in those sub-strata. Logically, factors influencing fishing
are, scientifically, also taken into account.
Comparing the basis used either by indigenous or by scientific knowledge in the artisanal fishing
zones identification shows the existence of a relationship between these two types of knowledge.
The existing relationship between the two knowledge leads one to argue that “hypothesis 2” is also
untrue.

87
iii) – No role played in integrating indigenous knowledge for Artisanal fisheries management
The approach on indigenous knowledge use for artisanal fishing zones identification is all about
fishing zones into the open sea or offshore. Pushing artisanal fishermen offshore or into the open
sea, is a trend for alleviating the use of those fishing zones surrounding beaches, estuaries, bays
that have been heavily exploited by artisanal fishermen. In this regard, alleviating fishing activities in
inshore areas by pushing fishermen to fish offshore or into the open sea is meant to contribute to the
sustainability of artisanal fisheries. It is also meant to enable artisanal fishermen to fish on higher
quality and higher economic value fish contributing to enhancement their income in order to uplift
their living standards. Furthermore, the main fishing gears used offshore or in the open sea are hand
line, gillnet and diving which are considered selective fishing gears compared to those used inshore
which are mainly beach seine and quinia which are unselective and destructive fishing gears.
Data and information on indigenous knowledge described in this dissertation shows the potentiality
of use of this type of knowledge in fisheries management. For example, indigenous knowledge
identifies southerly wind (Kussi), southerly east wind (Phalalazi) and rising tides as the worst and
dangerous conditions for fishing. Rainy season and dirty water are identified as good conditions for
fishing. Scientifically, rainfall and dirtiness are related with providing nutrients for fish breeding. It is
also pointed out that from March to September, southerly, southerly east and southerly west winds
occur with 85% of intensity which means they are very heavy and dangerous for fishing (MDN,
1986). The information herein shows the potentiality of indigenous knowledge which can be
integrated into science for sustainable artisanal fisheries management. Furthermore, indigenous
knowledge fishing uses relatively simple technology which limits impact on environment leading to
sustainable artisanal fisheries management.
Arguments put forward by some authors substantiate that local knowledge as a system of power can
provide a basis for the empowerment of communities to undertake community-based resource
management, particularly, in tropical, multi-species fisheries and their environments, for which the
scientific knowledge is still relatively poor (Diegues, 2002). As mentioned elsewhere in this
dissertation, government interventions based only on scientific knowledge models have been
ineffective for sustainable fisheries management. In this regard, it is clear that indigenous knowledge
alone plays an important role in artisanal fisheries management. Its integration into scientific
knowledge for artisanal fisheries management could play an important role in sustainable artisanal
fisheries management. This indicates that “hypothesis 3” is also untrue.

88
6.2.2 6.2.2 6.2.2 6.2.2 ---- Response to the research questions Response to the research questions Response to the research questions Response to the research questions
i) – Artisanal fishing zones identification using only indigenous knowledge
Artisanal fishermen, using their indigenous knowledge, identify different types of winds and how
winds manifest themselves as well as their occurrence to explain the way these influence fishing.
They identified tidal and lunar cycles and established the relationship between tides and moon in
fishing. Traditional and cultural practices were identified, explained and their relationship to fishing
was established. Physical indicators (darkness of the sea water, rocky sea bed, tonality of the sea
waves, birds signal, and visibility) as well as their relationship with artisanal fishing zones
identification were identified, explained and established. Using Geographical Information Systems,
the physical indicators identified by local fishermen using their indigenous knowledge were later
processed and a map with output of the information given produced showing the localization and
distribution of the artisanal identified fishing zones.
The beliefs such as “cleaning cemeteries”, “Hijabo, Olomba, Lihuco ceremonies” and others, play an
important role on fishing activities and in the daily life of the fishermen. The observation of these
traditional and cultural beliefs gives to the fishing communities’ confidence and courage in their
fishing activities. As argued, indigenous knowledge, as a body of knowledge, is stored in peoples’
memories and activities and is expressed in stories, songs, folklore, proverbs, dances, myths,
cultural values, beliefs, rituals, community laws, local language, agricultural practices, plant species,
and animal breeds. Indigenous knowledge is shared and communicated orally, by specific example,
and through culture. Indigenous forms of communication and organization are then vital to local-level
decision-making process and to the preservation, development, and spread of indigenous knowledge
(Grenier, 1989). Relying on those traditional and cultural practices, artisanal fishermen, normally,
present their gifts to the ancestors before their fishing units are launched from the shore. They do so
because they believe that, those who do not praise their ancestors and goddess of the sea will have
small catches.
Traditional and cultural practices could not be logically linked to scientific explanation. Time limitation
did not allow collecting catch data for empirical analysis, as fishermen do not keep records. Catch
data could show the extent to which traditional and cultural practices are related to scientific
knowledge, mainly, by comparing catches between to those who observe these practices before
going for fishing and those who do not.

89
ii) – Factors underlying artisanal fishing zones identification
Indigenous knowledge identified atmospheric and oceanic factors as the main factors underlying the
identification of artisanal fishing zones. Atmospheric factors include rain, drought, wind and moon
and oceanic factors are tides, water dirtiness and water transparency. Other factors such as
mangrove cover, river presence, dense forest and undulating terrain, were also identified as useful.
iii) – Relationship amongst physical and climate characteristics and species in fishing zones
Local indigenous knowledge considers that physical coast characteristics consisting of mangrove
cover and rivers they have a very strong influence in fishing zones as shown in tables 25 and 26,
respectively. Contrary to the previous, dense forest (table 27) as well as undulating terrain (table 28)
they do not have fishing influence at all.
Climate characteristics consisting of atmospheric factors such as rain, drought, wind and moon and
oceanic factors encompassing tides, water dirtiness and water transparency, have either very strong
or bad fishing influence. Relatively to winds, north, west and east winds have very strong influence in
fishing as shown in tables 38, 40 and 41, respectively. South and south east winds, tables 39 and
42, have bad fishing influence and south west winds have reasonable fishing influence. Concerning
to rainy as shown in table 44 this has very strong influence while dry season, table 45, has bad
fishing influence.
In regard to the lunar cycle, new moon, table 46 and first quarter moon, table 48, have a bad
influence on fishing; full moon, table 47, has a very good fishing influence and second quarter moon
in table 49, has a reasonable influence on fishing. Tidal cycle consisting of rising tides as shown in
table 50 has bad influence and falling tides, table 51 has very good influence on fishing. Water
dirtiness, in table 52, has very strong influence and water transparency, in table 53, has bad fishing
influence, respectively.
Normally, new moon phase (table 46) and full moon phase (table 47) should both have “very strong”
influence on fishing, simply, because they coincide with falling tides (table 51) which have “very
strong” influence on fishing. In this regard, only full moon phase offers “very good” conditions but
new moon phase does not do so. First and second quarters moon phases (tables 48 and 49) should
both have “bad” influence in fishing because they also coincide with rising tides (table 50) which

90
have “bad” influence on fishing. In this case, second quarter moon does not exactly show this
relationship. The slight incongruence on lunar and tidal cycles’ relationship, in terms of conditions on
fishing, may be due to other complementary factors influencing fishing such as weather conditions.
6.3 6.3 6.3 6.3 –––– Remarks Remarks Remarks Remarks
For indigenous knowledge, the appropriation of the sea and its resources is expressed in the
principle and practice of “knowing-how” marine territory is constructed and ritualized by means of
tradition, apprenticeship, experience and intuition. This know-how is only attainable by those with
experience and intuitiveness, which comes from understanding what tradition is in specific cultural
and work/ production contexts of fishing apprenticeships (Samudra, s/d). In this regard, traditional
practices that limit overexploitation of resources can be considered to enhance or support biological
conservation, in a modern, scientific sense. Under these conditions, those practices mediated by
beliefs in mythological beings purposely chosen to avoid over fishing may play an important role in
modern fisheries management.
Wilson, et all., (2006) argues that local ecological knowledge (LEK) directly linked to the problems
users are facing, and ecological sustainability has better chances of being achieved if allocation
issues are being addressed as an integral part of the process. The backbone of a good adaptive
fisheries management system is a good data collecting system that enables multi-disciplinary
analysis and provides the assessment to support to management institutions. To make an effective
contribution, however, such information can only be revealed as part of comprehensive studies
involving ongoing interactions between fishers, scientists and other stakeholders.
Geographical Information Systems are tools that combine ordinary statistics with geographic location
to create meaningful, clear and attractive maps that can be applied to development needs. Due to
the spatial nature of Indigenous Knowledge System (IKS), Geographic Information System
technologies can facilitate the inclusion of IKS in local decision-making process. However, up until
now the possible application of GIS in IK management has been inadequately explored (Tripathi and
Bhattarya, 2004).

91
6.4 6.4 6.4 6.4 –––– Conclusion Conclusion Conclusion Conclusion
In this section, conclusions are drawn based on overall description and analysis in the preceding six
(6) chapters of the dissertation. They are also meant to give response to the objectives of the study
as follows.
i) - Understanding how artisanal fishermen identify fishing zones using their indigenous
knowledge
Results from this dissertation show that identification of fishing zones offshore or in the open sea can
be done simply and based, only, on local indigenous knowledge without scientific knowledge
support. Based on the analyzed data, there is a clear understanding that artisanal fishermen have
fished for long time and continue to fish in the fishing zones identified by them into the open sea
using their own accumulated knowledge.
ii) - The extend to which indigenous knowledge can be scientifically correlated
Water darkness, sea birds, water tonality and rock sea bed, are indicators indigenous knowledge use
for fishing zones identification. These indicators can be scientifically correlated and they are neither
superstitious nor ineffective. Scientifically, fishing zones identification is based on sea bed, sub-strata
and species caught on those environments. The existing relationship between indigenous and
scientific knowledge in fishing zones identification does not show any contradiction and the indicators
used either in indigenous or in scientific knowledge do match each other. In this regard, indigenous
and scientific knowledge can be effectively and significantly correlated.
iii) - Potential for the use of indigenous knowledge in decision-making for artisanal fisheries
management by government and other development agencies
Identification of fishing zones offshore or into the open sea is a trend for reducing pressure in inshore
areas, those fishing zones surrounding beaches, estuaries, bays that are already heavily exploited.
In this context, fishing offshore or into the open sea is supposed to contribute to sustainable artisanal
fisheries management. It also enables fishermen catch better quality and higher economic value fish
contributing to enhancement of their income and the uplifting of their living standards. The fishing
gears used offshore or into the open sea are, mainly, hand line, gillnet and diving which are
considered selective, compared to those used inshore like beach seine and quinia which are

92
considered destructive fishing gears. Thus indigenous fishing practices use relatively simple
technology that limits impact on environment leading to sustainable artisanal fishing practices.
Evidence obtained in this study from fishermen in relation to atmospheric and oceanic factors shows
the potential of the indigenous knowledge for use in fisheries management, even though at local
level this is used to make decision about when it is safe to fish and where fish in order to meet
fishing communities’ needs for their daily survival. Based on the produced and analyzed knowledge
in this dissertation, artisanal fishermen as well as government and other development agencies can
take important decisions for effective and efficient artisanal fisheries management. The information
herein described and analyzed is conceived, constructed and updated within the fishing
communities’ indigenous knowledge systems on a daily basis using their experiences on the fishing
grounds.
iv) - Potential for use of GPS and GIS in artisanal fisheries management purposes
Global Positioning System (GPS) is a constellation of orbiting satellites maintained for the purpose of
defining geographic positions on and above the surface of the earth. Due to its capacity for recording
and storing spatial information which can be used for many other purposes, GPS has been used in
this study to collect spatial data (latitude and longitude) of the artisanal fishing zones identified by
fishermen. Geographical Information Systems (GIS) are tools that combine ordinary statistics with
geographic location to create meaningful, clear and attractive maps that can be applied to
development needs. GIS was used in this study to process, visualize and produce spatial and non-
spatial data given by indigenous knowledge in fishing zones identification. In this regard, GPS and
GIS technology facilitated the inclusion of indigenous knowledge into other knowledge which can be
used for local decision-making processes.
Summing up, documenting and mapping indigenous knowledge intends to preserve and honor
knowledge held by local indigenous people, people whose ancestors have long inhabited a region, or
people who are new to a region and bring their own traditions to a new community. Indigenous
Knowledge is not in itself capable of addressing all the issues related to sustainable fisheries
management. Sustainable fisheries management may well be better served by a system that
incorporates both indigenous and scientific knowledge systems. Sustainable fisheries management
can only be achieved by developing a science based on the priorities of local people, and creating a
technological base that includes both traditional and modern approaches to problem-solving.

93
Addressing and including indigenous knowledge is, mainly, to bring it into the present as a
contemporary means of constructing valid knowledge about local communities. Local communities
are not simply the source of raw data for academics, but they must be seen as key players in the
construction of knowledge about their societies. As argued by many authors, indigenous knowledge
is an enormously valuable resource base but one which is often treated in a far too casual manner
by scientists.
6.5 6.5 6.5 6.5 ---- Recommendation Recommendation Recommendation Recommendation
This research was undertaken for academic purposes in a much reduced time scale, which neither
enabled going into deeper aspects nor to cover large coastal areas. Fishing offshore or into the open
sea is a challenge government has to overcome to reduce pressure in inshore zones. Results from
this research show that identification of fishing zones offshore or into the open sea can be done
simply and based on local indigenous knowledge as shown in plate 6. In this regard, it is
recommended that Ministry of Fisheries in Mozambique through IDPPE designs a national
programme for artisanal fishing zones identification into the open sea using indigenous knowledge
covering the more critical coastal zones where inshore resources are depleted and need to be
replenished. This can then be combined with scientific knowledge and other techniques such as GIS
and GPS in order to produce an integrated knowledge framework for sustainable fisheries
management.

94
Spatial and non-spatial data recording
Artisanal fishermen fishing offshore
Plate 6 – Artisanal fishing zones identification in Angoche coastal zone

95
REFERENCE LIST
Aswani, S. and Lauer, M. (2006). Incorporating fishermen’s local knowledge and behaviour into
geographical information systems (GIS) for designing marine protected areas in Oceania. Human
Organization, vol. 65, nr 1, 2006, online
http://www.anth.ucsb.edu/faculty/aswani/articles/Aswani_Lauer_HO_2006
Breakwell, M.G. and Petts, J. (2001). Stakeholder participation methods. Birmingham: Centre for
Environmental Research and Training. University of Birmingham.
Dambiane, S.J.R. (1999). An Investigation of Land Adjudication Procedures to Increase Tenure
Security by Incorporating Local Customary Land Rights. Durban, University of Natal.
De Melo, M. A.J. (1984). Amongst macuas of Angoche: Historing Mozambique. Lisbon, Portugal.
De Vos, A.S. (Ed), (1998). Research at grass roots: A primer for the caring professions. Cape Town,
South Africa.
Dei, G.J.S, Sefa, H., Budd, L., and Rosenberg, D. G., (Eds) (2002). Indigenous knowledge in
global contexts: Multiple readings of our world. University of Toronto, Press Incorporated.
Diegues, A.C, (2002). Traditional fisheries knowledge and social appropriation of marine resources
in Brazil. Paper presented at Marine Conference: People and the sea, Amsterdam. University of São
Paulo, Brazil.
Freire, J. and Garcia-Allut, A. (1999). Integration of fishers’ ecological knowledge in fisheries biology and management. A proposal for the case of the artisanal coastal fisheries of Galicia (NW Spain). Galicia, Spain.
Gervásio, H. and Hele, E.P. (2002). A qualitative analysis on co-management experience in
Mozambique: The case study of Inhassoro and Angoche/Moma. IDPPE, Maputo, Mozambique.
Grenier, L. (1998). Working with indigenous knowledge: A guide for researchers. International
Development Research Centre, Canada

96
Hamilton, R and Water, R, (1999). Indigenous ecological knowledge and its role in fisheries
research design: A case study from Roviana Lagoon, Western Province, Solomon Islands. University
of Otago, New Zealand.
Harmsworth, G., (1998). Indigenous values and GIS: A method and a framework. In: Indigenous
knowledge and development monitor. Online
http://www.apad.org/publications/ppgis/indigenous_values_and_GIS_a_method_and_a_framework.p
df.
Inglis, J.T (Ed), (1993). Traditional Ecological Knowledge: Concepts and Cases. International
Development Research Centre, Ottawa.
Jennings, S. and Lockie, S. (2002). Application of Stakeholder analysis and Social Mapping for
Coastal Zone Management in Australia. Rockhampton Qld 4702, Australia.
Jonsson, B.L. (2004). Stakeholder participation as a tool for sustainable development in the Em
River. In: International journal of water resources development. Vol. 20 nr. 3, (345-352).
Kumar, R. (1996). Research methodology: A step-by-step guide for beginners. London, Thousand
Oaks.
Lessard, J. et al., (1999). Applying local and scientific knowledge to the establishment of a
sustainable fishery: The west coast Vancouver Island goose barnacle fishery experience.
Department of fisheries and oceans Canada, Pacific Biological Station. Canada, British Columbia.
LIM [Land Information Management], (2006). Geomatics for land reform management notes.
Pietermaritzburg, University of KwaZulu-Natal.
NOAA [National Oceanic & Atmospheric Administration], (2004). US Department of commerce.
Pililão, F. (1989). Toponimic evolution and territorial division 1974-1987. Popular Republic of
Mozambique. Maputo, Mozambique.

97
Roger, S and Victor, J (Eds) (2006). Data collection and analysis. Sage publication. London,
thousand Oaks.
Wilson, D.C, Raakjaer, J. and Degnbol, P. (2006). Local ecological knowledge and practical
fisheries management in the tropics: A policy brief. Marine policy. Elsevier
Samudra Monograph, (2006). Fisheries in Brazil, online
http://www.icsf.net/icsf2006/uploads/publications/monograph/pdf/english/issue_40/chapter186pdf.
Tripathi, N. and Bhattarya, S. (2004). Integrating indigenous knowledge and GIS for participatory
natural resource management: State-of-the-practice. Online
http://www.ejisdc.org/ojs2/index.Pap/ejisdc/article/view/105/105)
Government Government Government Government and other and other and other and other publications publications publications publications
Angoche, (2005). Districtal development plan. Angoche district, Nampula, Mozambique.
Gonçalves, M.L. (2004). Fishery sector in Mozambique: Phases and background. In: Power point
presentation. Maputo, Mozambique.
Govt [Government], (2007). Social economic plan and budget of the state. Republic of
Mozambique. Maputo, Mozambique
IDPPE [National Institute for the Development of Small Scale Fisheries], (2007). National
artisanal fisheries census. Ministry of fisheries. Maputo, Mozambique.
IDPPE [National Institute for the Development of Small Scale Fisheries], (2006). Strategic plan
for the artisanal fisheries. Ministry of fisheries. Maputo, Mozambique.
IDPPE [National Institute for the Development of Small Scale Fisheries], (2000).
Magrodiagnostic study in Nampula province. Ministry of fisheries. Maputo, Mozambique.
INE [National Institute for Statistics], (2007). Third general census of population and housing: Preliminary results. Maputo, Mozambique

98
MDN [Ministério da Defesa Nacional], (1986). Roteiro da costa da Republica Popular de
Moçambique. Direcção Principal de Navegação e Oceanografia do Ministério da Defesa
da URSS.
NDFA [National Directorate for Fisheries Administration], (2006): The VII national and annual fisheries meeting. Ministry of fisheries. Maputo, Mozambique.
UNDP [United Nations Development Programme], (1997). District development profiles. Angoche
District, Nampula. Mozambique.

xix
APPENDIX 1APPENDIX 1APPENDIX 1APPENDIX 1
QUESTIONNAIRE FOR INDIVIDUALSQUESTIONNAIRE FOR INDIVIDUALSQUESTIONNAIRE FOR INDIVIDUALSQUESTIONNAIRE FOR INDIVIDUALS
1 1 1 1 ---- General information General information General information General information
1.1 - Date: / /2007 1.2 - Form nr: ______________ 1.3 - Interviewer: __________________________________________________________
2 2 2 2 –––– Interviewee’s details: Interviewee’s details: Interviewee’s details: Interviewee’s details:
2.1 - � Fisherman 2.2 - � Fisherwoman
2.3 - Category: 2.3.1 - � Owner 2.3.3 - � Crew member 2.3.2 – � Skipper 2.3.4 - � other (specify: ___________________)
2.4 – Fishing gear: 2.4.1 - � Beach seine 2.4.4 – � Cage 2.4.7 – � Collectors 2.4.2 – � Gillnet 2.4.5 – � Diving 2.4.8 – � Other: ____) 2.4.3 – � Hand line 2.4.6 – � Quinia
2.5 - How old are you? ……years.
2.6 - How long you have been living in this fishing village? ……years. 2.7 - Where did you live before? _____________________________________________ 2.8 - Why did you decide to live in this fishing village? ____________________________
2.9 – What is your LANGUAGE and RELIGIOUS belief?
Language and religious (1st) (2nd) (3rd)
2.8.1 - Language 2.8.1.1 - Koti � � � 2.8.1.2 – Macua � � � 2.8.1.3 – Marrovone � � � 2.8.1.4 - Other (specify: _______________) � � � 2.8.2 – Religious belief 2.8.2.1 – Islam � � � 2.8.2.2 – Catholic � � � 2.8.2.3 - Protestant (specify: ____________) � � � 2.8.2.4 - Other (specify: _______________) � � �

xx
3 3 3 3 ---- Socio Socio Socio Socio----economic characteristics economic characteristics economic characteristics economic characteristics
3.1 3.1 3.1 3.1 –––– Demography Demography Demography Demography 3.1.1 - Number of your household: ______; 3.1.2 – Nr of spouses you have: _____________; 3.1.3 - Nr of children you have: ________; (3.1.3.1-Boys:_____ 3.1.3.2-Girls: _________) 3.1.4 - Who are OTHER PERSONS you live with?
3.1.4.1 - � Parents: ______; 3.1.4.2 – � Brothers: ________
3.1.4.3 - � Sisters: _______; 3.1.4.4 – � Others (specify:_____________________)
3.2 3.2 3.2 3.2 –––– Education Education Education Education 3.2.1 - Boys studying: _____________; 3.2.2 - Girls studying: ___________________;
3.2.1.1 - At EP1 (grade: _________); 3.2.2.1 – At EP1 (grade: _________________);
3.2.1.2 – At EP2 (grade: _________); 3.2.2.2 – At EP2 (grade: ________________);
3.2.1.3 – At ESG (grade: ________); 3.2.2.3 – At ESG (grade: ________________);
3.2.1.4 – At Other institutions (specify: _______________________________________);
3.2.2.4 – Other institutions (specify: _________________________________________); 3.2.3 – Interviewee’s level of EDUCATION:
3.2.3.1 – � Primary school (grade made: ____________________________________);
3.2.3.2 – � Secondary school (grade made: _________________________________);
3.2.3.3 – � Any professional course made (specify: ____________________________); 3.3 3.3 3.3 3.3 –––– Economy Economy Economy Economy 3.3.1 - What are the MAIN ACTIVITIES the family is depending on (rank by importance)?
3.3.1.1 – � Fishing 3.3.1.3 - � Formal Business (specify: _____________; 3.3.1.2 – � Agriculture 3.3.1.4 - � Informal business (specify: ___________________; 3.3.1.5 – � Others (specify: _______________________________________________);

xxi
3.3.2 - List in the table below the PERIOD OF MORE PRODUCTIVITY for each of the following activities Activity Jan Feb Mar Apr May Jun Jul Aug Sep Oct Nov Dec
FISHING
AGRICULTURE
1 – Rice
2 – Beans
3 - Cassava
4 – Peanut
BUSINESS
3.3.3 – Based on your own experience, in which CONDITIONS you think ARTISANAL FISHING IS VERY GOOD?
Main conditions Very good Reasonable Completely bad
3.3.3.1 - North wind (kashcazi)? � � � 3.3.3.2 - South wind (Kussi)? � � � 3.3.3.3 – East wind (Madulai)? � � � 3.3.3.4 – South + east (Phalalazi)? � � � 3.3.3.5 – South + west (Olani)? � � � 3.3.3.6 - West wind (Mmathe)? � � � 3.3.3.7 - Rising tides? � � � 3.3.3.8 - Falling tides? � � � 3.3.3.9 - New moon? � � � 3.3.3.10 - First quarter moon? � � � 3.3.3.11 - Full moon? � � � 3.3.3.12 - Second quarter moon? � � � 3.3.3.13 – Rainy season? � � � 3.3.3.14 – Dry season? � � � 3.3.3.15 - Cloudy? � � � 3.3.3.16 - Stormy? � � � 3.3.3.17 – Water transparence? � � � 3.3.3.18 – Not transparent water? � � � 3.3.3.19 – Churning water � � � 3.3.3.20 – High water salinity? � � � 3.3.3.21 – Cold water? � � � 3.3.3.22 – Warm water? � � � 3.3.3.23 - During the day � � � 3.3.3.24 – During the night � � � 3.3.3.25 – Deepness (Mts: ______) � � �
3.3.4 - If any “Very good” answer on above, please give, for each “answer”, reasons “WHY”? ______________________________________________________________________ _____________________________________________________________________________ (Please, turn the page for more answer)
3.4 3.4 3.4 3.4 –––– Housing Housing Housing Housing
3.4.1 – What is your HOUSE MADE OF? 3.4.1.1 - � Non-conventional material; when did you construct it? _______________________ ;

xxii
3.4.1.1.1 - Nr of divisions: ___________; 3.4.1.1.2 – Cover material: ________________;
3.4.1.2 - � Conventional material; when did you construct it? __________________________ ;
3.4.1.2.1 - Nr of divisions: _________; 3.4.1.2.2 – Cover material: ________________;
3.4.2 - What KIND OF ASSETS you have?
3.4.2.1 - � Motorcycle; when did you buy it? _________________________________; 3.4.2.2 - � Bicycle; when did you buy it? ____________________________________;
3.4.2.3 - � Radio; when did you buy it? _____________________________________;
3.4.2.4 - � Furniture; when did you buy it? __________________________________;
3.4.2.5 - � TV; when did you buy it? ________________________________________ ;
3.4.2.6 - � Other (specify: ________________________________________________); 3.5 3.5 3.5 3.5 –––– Traditional and cultural pr Traditional and cultural pr Traditional and cultural pr Traditional and cultural practicesacticesacticesactices 3.5.1 – What of the following TRADITIONAL AND CULTURAL PRACTICES you OBSERVE as fisherman?
Cultural aspects Always Sometimes Not at all
3.5.1.1 – Cleaning cemeteries � � � 3.5.1.2 – Hijabo � � � 3.5.1.3 – Olomba � � � 3.5.1.4 – Lihuco � � � 3.5.1.5 – Watalela Phahari � � � 3.5.1.6 - Inkhuto � � � Others (specify): 3.5.1.7 - � � � 3.5.1.8 - � � �
3.5.2 - If any “Always” answer on above, please give, for each “answer”, reasons “WHY”? ______________________________________________________________________________
(Please, turn the page for more answer)

xxiii
4 4 4 4 ---- Coas Coas Coas Coastal characteristics tal characteristics tal characteristics tal characteristics 4.1 – Coastal characteristics have INFLUENCE ON THE SPECIES CAUGHT in the fishing zones when:
Coastal characteristics Very strong Strong No at all
4.1.1 - Coast is covered by mangrove? � � � 4.1.2 – Coast is a river mouth � � � 4.1.3 - Coast is covered by dense forest? � � � 4.1.4 - Coast is covered by wetland? � � � 4.1.5 - Coast is covered by grass � � � 4.1.6 – Coast is undulating terrain? � � �
4.1.7 – Coast is flat terrain? � � �
4.2 – If any “Strong” answer on above, how did you acquire this knowledge? ___________ _____________________________________________________________________________
5 5 5 5 –––– Fishing characteristics Fishing characteristics Fishing characteristics Fishing characteristics 5.1 – WHERE do you use to fish?
Fishing zones Yes; always Yes; sometimes No; not at all
5.1.1 - Inshore 5.1.1.1 - Beach � � � 5.1.1.2 - Estuarine � � � 5.1.1.3 – Mangrove � � � 5.1.1.4 - Other (specify: _________) � � � 5.1.2 - Offshore 5.1.2.1 - Close to Islands � � � 5.1.2.2 - Bank of sand. � � � 5.1.2.3 - Rocks � � �
5.1.2.4 - Other (specify: ___________) � � �
5.1.3 – If any “YES; ALWAYS” on above, why do you fish in this area?__________________
_____________________________________________________________________________
5.1.3.1 - How did you get this KNOWLEDGE? _______________________________________
_____________________________________________________________________________ 5.1.4 – For each of the above “YES”, how far from the cost? __________________________ _____________________________________________________________________________ (Please, turn the page for more answer) 5.2 - What FISHING UNIT do you usually use?

xxiv
Fishing unit Yes; always Yes; sometimes No; not at all
5.2.1 – Fishing gear 5.2.1.1 - Beach seine. � � � 5.2.1.2 -Gillnet. � � � 5.2.1.3 - Hand line. � � � 5.2.1.4 –Cage. � � � 5.2.1.5 – Diving � � � 5.2.1.6 – Quinia � � � 5.2.1.6 – Collection � � � 5.2.2 – Kind of boat 5.2.2.1 - Motorized boat � � � 5.2.2.2 – Non-motorized boat � � � 5.2.2.3 – Without boat � � �
5.3 - From your fishing center, how many HOURS you usually take to reach the fishing zone you normally use to fish in? ________ hours:
5.4 - List in the table below the MAIN SPECIES you usually fish in the fishing zones characterized by: Fishing zones characteristics
Main species caught
Seaweed cover
Rock cover
Reef cover
Mangrove cover
Estuarine
Bank of sand
5.4.1 – If ANY ANSWER on above, how did you get this knowledge:____________________ _____________________________________________________________________________

xxv
6 6 6 6 –––– Climate characteristics Climate characteristics Climate characteristics Climate characteristics 6.1 - If you have your FISHING UNIT IN GOOD CONDITIONS, do you go fishing when is? ______________________________________________________________________________ Climate characteristics Yes; always Yes; sometimes No; not at all
6.1.1 - North wind (kashcazi)? � � � 6.1.2 - South wind (Kussi)? � � � 6.1.3 – East wind (Madulai)? � � � 6.1.4 - South + east (Phalalazi)? � � � 6.1.5 - South + west (Olani)? � � � 6.1.6 - West wind (Mmathe)? � � � 6.1.7 - Rising tides? � � � 6.1.8 - Falling tides? � � � 6.1.9 – New moon? � � � 6.1.10 – First quarter moon? � � � 6.1.11 – Full moon? � � � 6.1.12 – Second quarter moon? � � � 6.1.13 - Rainy? � � � 61.14 - Cloudy? � � � 6.1.15 - Stormy? � � � 6.1.16 – During the day? � � � 6.1.17 – At night? � � � 6.1.18 – Transparent water? � � � 6.1.19 – Not transparent water? � � � 6.1.20 – In deep water? � � � 6.1.21 – In churning water? � � � 6.1.22 – In cold water? � � � 6.1.23 – In warm water? � � �
6.2 - If ANY ANSWER on “No; not at all”, please give, for each NO, reasons “WHY”? _____ _____________________________________________________________________________ _____________________________________________________________________________ 6.3 - How do you usually IDENTIFY FISHING ZONES where you use to fish in? __________ _____________________________________________________________________________ _____________________________________________________________________________ 6.3.1 - How did you get this KNOWLEDGE? ________________________________________ _____________________________________________________________________________

xxvi
7 7 7 7 –––– Management measures Management measures Management measures Management measures 7.1 – List on the table below what MONTHS are: -a) the BEST, and –b) WORST, for fishing? Jan Feb Mar Apr May Jun Jul Aug Sep Oct Nov Dec
Best
Worst
7.1.1 - THE BEST months for fishing are so because of: _____________________________________________________________________________ Climate characteristics Yes; always Yes; sometimes No; not at all
7.1.1 – The best months for fishing 7.1.1.1 – Rainy season? � � � 7.1.1.2 – Dry season? � � � 7.1.1.3 – Windy season? � � � 7.1.1.4 – Lunar cycle? � � � 7.1.1.5 – Tidal cycle? � � � 7.1.1.6 – Observation of tradition? � � � 7.1.1.7 – Having good fishing unit? � � � 7.1.1.8 – Daily atmospheric conditions? � � �
7.1.1.9 – Other (specify: ____________)? � � �
7.2 - What do you do when you see that CATCHES are GOIND DOWN? _________________
_____________________________________________________________________________
_____________________________________________________________________________

xxvii
APPENDIX 2:
QUESTIONNAIRE FOR GROUP INTERVIEW QUESTIONNAIRE FOR GROUP INTERVIEW QUESTIONNAIRE FOR GROUP INTERVIEW QUESTIONNAIRE FOR GROUP INTERVIEW
Interviewed: Interviewed: Interviewed: Interviewed:
1 – � Village’s secretary; 2 – � Community leader; 3 – � Elder fisherman; 4 – � Fishing unit owner Date: / /2007 5 – � Skipper; 6 – � Experienced crew member; 7 – � Other (specify: ________________________ ;)
1 1 1 1 ---- General information General information General information General information
1 - Administrative Post: ________________; 4 – Fishing village: ______________________; 2 - Locality: _________________________; 5 – Fishing centre: ______________________; 3 - Planning Area: ____________________; 6 – Fishing zones: _______________________ _____________________________________________________________________________ 7 – Distance (village to fishing centre): ____; 8 - Distance (fishing centre to fishing zones): _________________________________________________________________;
1.1 - How do you ACCESS fishing zones?
1 - � By motorized boat (specify boat and engine: ___________________________);
2 - � Non-motorized boat (specify type of boat: ______________________________);
3 - � walking.
2 2 2 2 –––– Economy Economy Economy Economy
2.1 - What are the MAIN ACTIVITIES in this fishing village?
1 – � Fishing 3 - � Formal Business (specify: ________________________; 2 – � Agriculture 4 - � Informal business (specify: ________________________; 5 – � Others (specify: ___________________________________________________);

xxviii
2.2 - List in the table below the PERIOD OF MORE PRODUCTIVITY for each of the following activities Activity Jan Feb Mar Apr May Jun Jul Aug Sep Oct Nov Dec
FISHING
AGRICULTURE
1 – Rice
2 – Beans
3 - Cassava
4 – Peanut
BUSINESS
2.3 – In the fishing zones we usually fish in, CATCHES ARE VERY GOOD when is:
Main characteristics Very good Reasonable Completely bad
1 - North wind (kashcazi)? � � � 2 - South wind (Kussi)? � � � 3 – East wind (Madulai)? � � � 4 - South + east (Phalalazi)? � � � 5 – South + west (Olani)? � � � 6 - West wind (Mmathe)? � � � 7 - Rising tides? � � � 8 - Falling tides? � � � 9 – New moon? � � � 10 – First quarter moon? � � � 11 – Full moon? � � � 12 – Second quarter moon? � � � 13 – Rainy season? � � � 14 – Dry season? � � � 15 - Cloudy? � � � 16 - Stormy? � � � 17 – Water transparence? � � � 18 – Not transparence of water? � � � 19 – Churning water? � � � 20 – High water salinity? � � � 21 – Cold water? � � � 22 – Warm water? � � � 23 – During the day? � � � 24 – During the night? � � �
25 – Deepness (Mts: ____)? � � �
2.4 - For each “Completely bad” answer you got above; please give reasons “WHY”: _____________________________________________________________________________ (Turn page for more answer)
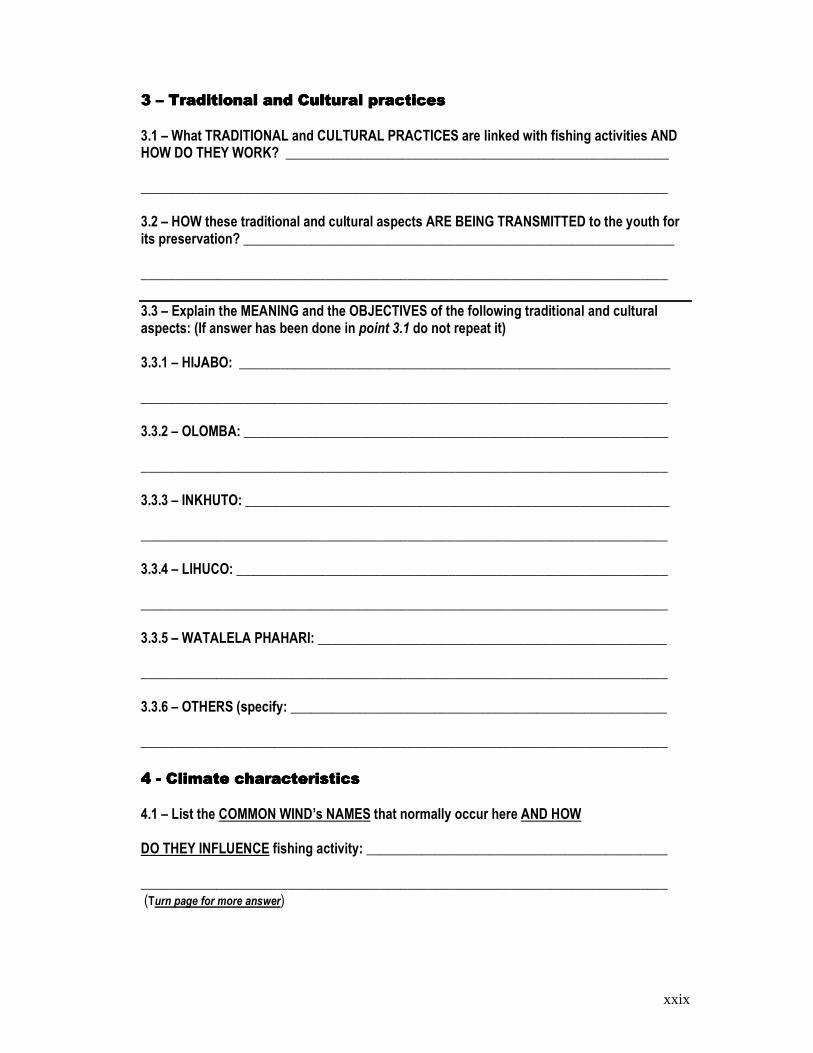
xxix
3 3 3 3 –––– Traditional and Traditional and Traditional and Traditional and Cultural practices Cultural practices Cultural practices Cultural practices
3.1 – What TRADITIONAL and CULTURAL PRACTICES are linked with fishing activities AND HOW DO THEY WORK? ________________________________________________________ _____________________________________________________________________________ 3.2 – HOW these traditional and cultural aspects ARE BEING TRANSMITTED to the youth for its preservation? _______________________________________________________________ _____________________________________________________________________________
3.3 – Explain the MEANING and the OBJECTIVES of the following traditional and cultural aspects: (If answer has been done in point 3.1 do not repeat it) 3.3.1 – HIJABO: _______________________________________________________________ _____________________________________________________________________________ 3.3.2 – OLOMBA: ______________________________________________________________ _____________________________________________________________________________ 3.3.3 – INKHUTO: ______________________________________________________________ _____________________________________________________________________________ 3.3.4 – LIHUCO: _______________________________________________________________ _____________________________________________________________________________ 3.3.5 – WATALELA PHAHARI: ___________________________________________________ _____________________________________________________________________________ 3.3.6 – OTHERS (specify: _______________________________________________________ _____________________________________________________________________________
4 4 4 4 ---- Climate characteristics Climate characteristics Climate characteristics Climate characteristics
4.1 – List the COMMON WIND’s NAMES that normally occur here AND HOW DO THEY INFLUENCE fishing activity: ____________________________________________ _____________________________________________________________________________ (Turn page for more answer)

xxx
4.2 - What of the following CLIMATE CHARACTERISTICS GUIDE FISHERS not going to fish?
Main characteristics Yes; always Yes; sometimes No; not at all
1 - North wind (kashcazi)? � � � 2 - South wind (Kussi)? � � � 3 – East wind (Madulai)? � � � 4 - South + east (Phalalazi)? � � � 5 - South + west (Olani)? � � � 6 - West wind (Mmathe)? � � � 7 - Rising tides? � � � 8 - Falling tides? � � � 9 – New moon? � � � 10 – First quarter moon? � � � 11 – Full moon? � � � 12 – Second quarter moon? � � � 13 – Rainy season? � � � 14 – Dry season? � � � 15 - Cloudy? � � � 16 - Stormy? � � � 17 – Water transparence? � � � 18 – Not transparent water? � � � 19 – Cold weather? � � � 20 – Warm weather? � � � 21 – Churning water? � � � 22 - During the day? � � � 23 – At night? � � �
4.3 - If any “YES” on above, give, for each “YES”, reasons “WHY”? ____________________ _____________________________________________________________________________ 4.4 - Explain HOW YOU KNOW that is going to: 4.4.1 – WINDY? _______________________________________________________________
_____________________________________________________________________________
4.4.2 – RAINY? ________________________________________________________________
_____________________________________________________________________________
4.4.3 – WARM? ________________________________________________________________
_____________________________________________________________________________ 4.4.4 – CLOUDY? ______________________________________________________________
_____________________________________________________________________________
4.4.5 – STORMY? ______________________________________________________________
_____________________________________________________________________________

xxxi
4.4.6 – Have RISING TIDES? _____________________________________________________ _____________________________________________________________________________
4.4.7 – Have FALLING TIDES? ___________________________________________________ _____________________________________________________________________________ 4.5 – How did you get this KNOWLEDGE? _________________________________________ _____________________________________________________________________________
4.6 – Please fill in the following tables according to YOUR KNOWLEDGE.
TABLE 1 – Climatic (meteorology) calendar Legend Jan Feb Mar Apr May Jun Jul Aug Sep Oct Nov Dec
Rainy season
Dry season
Windy season
South wind
North wind
TABLE 2 – Lunar and tidal cycles (days) LUNAR CYCLE
New moon
First quarter
Full moon
Secondquarter
TIDAL CYCLE
Rising tides
Falling tides

xxxii
4.7 – List in the table below the MAIN SPECIES CAUGHT by the following fishing gears. Fishing gear Main species caught
Beach seine
Gillnet
Hand line
Diving
Cages
Collection
Quinia
4.8 – How do you usually IDENTIFY FISHING ZONES where you use to fish in? _____________________________________________________________________________
5 5 5 5 –––– Management measures Management measures Management measures Management measures
5.1 – What months do you think FISH MUST NOT BE FISHED?
Jan Feb Mar Apr May Jun Jul Aug Sep Oct Nov Dec
Why? ________________________________________________________________________ 5.2 – There are THREE TYPES OF FISHERIES. Which of them you know?
Type of fisheries I know it very well More or less No idea at all
5.2.1 – Artisanal fisheries � � � 5.2.2 – Semi-industrial fisheries � � � 5.2.3 – Industrial fisheries � � �
5.3 - If “ANY TYPE” known of the above fisheries, please give explanation of HOW YOU CHARACTERIZE IT and GIVE ITS SPECIFIC LIMITS. 5.3.1 – Artisanal Fisheries: ______________________________________________________ _____________________________________________________________________________ 5.3.2 – Semi-industrial Fisheries: _________________________________________________ _____________________________________________________________________________ 5.3.3 – Industrial fisheries: ______________________________________________________ _____________________________________________________________________________ 5.3.4 - How did you get this KNOWLEDGE? ________________________________________ _____________________________________________________________________________

xxxiii
APPENDIX 3
QUESTIONNAIRE FOR SCIENTISTS QUESTIONNAIRE FOR SCIENTISTS QUESTIONNAIRE FOR SCIENTISTS QUESTIONNAIRE FOR SCIENTISTS
0 0 0 0 –––– General information General information General information General information
Date: / / 2007; Form nr: ____; Institution: ______; Interviewer: ________________________ Position of the interviewee: _______________ Profession: ______________________________ How long you have been working? ___ years; Name (facultative): _________________________
1 - How, scientifically, are identified Artisanal fishing zones? _________________________ _____________________________________________________________________________ 2 – In identifying Artisanal fishing zones, scientifically, what are the main indicators taken into account? _________________________________________________________________ _____________________________________________________________________________ 3 - What are the common characteristics found in Artisanal fishing zones where the following fishing gears are used? 3.1 – Beach seine: ______________________________________________________________ _____________________________________________________________________________ 3.2 – Gillnet: ___________________________________________________________________ _____________________________________________________________________________ 3.3 – Hand line: ________________________________________________________________ _____________________________________________________________________________ 3.4 – Diving: ___________________________________________________________________ 3.5 – Cages: __________________________________________________________________ _____________________________________________________________________________ 3.6 – Collection: ________________________________________________________________

xxxiv
4 - What are the common species caught in the Artisanal fishing zones where the following fishing gears are used? 4.1 – Beach seine: ______________________________________________________________ _____________________________________________________________________________ 4.2 – Gillnet: ___________________________________________________________________ _____________________________________________________________________________ 4.3 – Hand line: ________________________________________________________________ _____________________________________________________________________________ 4.4 – Diving: ___________________________________________________________________ 4.5 – Cages: __________________________________________________________________ _____________________________________________________________________________ 4.6 – Collection: ________________________________________________________________ _____________________________________________________________________________ 5 – List on the table below what months do you think are: -a) the best and –b) the worst for Artisanal fishing? Jan Feb Mar Apr May Jun Jul Aug Sep Oct Nov Dec
Best
Worst
5.1 - Why do you think so? ______________________________________________________ 6 – What months do you think fish must not be fished?
Jan Feb Mar Apr May Jun Jul Aug Sep Oct Nov Dec
6.1 – Why so? _________________________________________________________________ 7 – Please fill in the following tables (1 and 2) according to your own knowledge.

xxxv
TABLE 1 – Climatic (meteorology) calendar
Legend Jan Feb Mar Apr May Jun Jul Aug Sep Oct Nov Dec
Rainy season
Dry season
Windy season
South wind
North wind
7.1 - Do you thing is there any relationship between METEOROLOGICAL CALENDAR and SPECIES CAUGHT in Artisanal fishing zones? If yes, which ones? (Please consider one by one
based on the legend): _____________________________________________________________ _____________________________________________________________________________ TABLE 2 – Lunar and tidal cycle
LUNAR
CYCLE
New moon
First quarter
Full moon
Secondquarter
TIDAL
CYCLE
Rising tides
Falling tides
7.2 - Do you think is there any relationship between LUNAR and TIDAL CYCLES? If yes, which one? ___________________________________________________________________ _____________________________________________________________________________ 7.3 – Do you think is there any relationship between LUNAR CYCLE and the SPECIES CAUGHT in Artisanal fishing zones? If yes, which ones? (Please consider each item of the lunar cycle): _______________________________________________________________________ _____________________________________________________________________________

xxxvi
7.4 – Do you think is there any relationship between TIDAL CYCLE and SPECIES CAGHT in Artisanal fishing zones? If yes, which ones? (Please consider each item of the tidal cycle) _____________________________________________________________________________ _____________________________________________________________________________ 8 – How indigenous knowledge can be used in identifying artisanal fishing zones? _____________________________________________________________________________ _____________________________________________________________________________ 8.1 – Why? ___________________________________________________________________ _____________________________________________________________________________ 9 – What role (if any) do you think indigenous knowledge can play in Artisanal fisheries management? _________________________________________________________________ _____________________________________________________________________________ 9.1 - Why do you think so? _____________________________________________________ _____________________________________________________________________________ 10 – How Geographical Information System (GIS) technique can be employed for Artisanal fisheries management? _________________________________________________________ _____________________________________________________________________________ 11 - How Global Positioning System (GPS) technique can be employed for Artisanal fisheries management? _________________________________________________________ _____________________________________________________________________________

xxxvii
APPENDIX 4
IDENTIFICATION OF FISHING ZONES IDENTIFICATION OF FISHING ZONES IDENTIFICATION OF FISHING ZONES IDENTIFICATION OF FISHING ZONES
Fishing zone:Fishing zone:Fishing zone:Fishing zone:
Fishing center (base): _____________________________________________________
Fishing zone (code): ______________________________________________________
Fishing gear used: ______________________________________________________
Type of sea bed of fishing zone: _____________________________________________
Main species caught in the fishing zone: ______________________________________
_______________________________________________________________________
Estimated fishing zone area: _______________________________________________
Distance from the coast to the fishing zone: ____________________________________
Main characteristics of the fishing zone: _______________________________________
_______________________________________________________________________
Main signals for fishing zone localization from the coast: __________________________
_______________________________________________________________________
Other pertinent information about fishing zone: _________________________________
_______________________________________________________________________
Observations: ___________________________________________________________
GPS:GPS:GPS:GPS:
Latitude: _______________________________________________________________ Longitude: ______________________________________________________________ Height: ________________________________________________________________ Precision: ______________________________________________________________ Local time: _____________________________________________________________