india’s growth: past performance and future … 2007 india’s growth: past performance and future...
TRANSCRIPT
January, 2007
INDIA’s GROWTH : PAST PERFORMANCE
AND FUTURE PROSPECTS
by
Shankar Acharya*
* Honorary Professor and Member Board of Governors, Indian Council for
Research on International Economic Relations (ICRIER)
Paper for presentation at Tokyo Club Macro Economy Conference on “India and China Rising”, December 6-7, 2006, Tokyo.
0

January, 2007
India’s Growth: Past Performance and Future Prospects
By
Shankar Acharya1
This paper is divided into four sections. Section I briefly reviews India’s growth
performance since 1950 and indicates a few salient features and turning points. Section II
discusses some of the major drivers of India’s current growth momentum (which has
averaged 8 percent in the last 3 years) and raised widespread expectations (at least, in
India) that 8 percent plus growth has become the new norm for the Indian economy.
Section III points to some of the risks and vulnerabilities that could stall the current
dynamism if corrective action is not taken. The final section assesses medium term
growth prospects.
I Review of Growth Performance, (1950-2006) Table 1 summarizes India’s growth experience since the middle of the twentieth
century. For the first thirty years, economic growth averaged a modest 3.6 percent, with
per capita growth of a meager 1.4 percent per year. Those were the heydays of state-led,
import-substituting industrialization, especially after the 1957 foreign exchange crisis and
the heavy industrialization bias of the Second Five Year Plan (1956-61). While the
strategy achieved some success in raising the level of resource mobilization and
investment in the economy, it turned out to be hugely costly in terms of economic
efficiency. The inefficiencies stemmed not just from the adoption of a statist, inward-
looking policy stance (at a time when world trade was expanding rapidly) but also from
1 The author is Member Board of Governors and Honorary Professor at Indian Council for Research on International Economic Relations (ICRIER). He was Chief Economic Adviser to Government of India (1993-2000).
1

the extremely detailed, dysfunctional and corruption-breeding controls that were imposed
on industry and trade (see, for example, the classic study by Bhagwati and Desai (1970)).
Table 1: Growth of GDP and Major Sectors (% per year)
Year 1951/52-
1980/81 1981/82-1990/91
1992/93-1996/97
1997/98-2001/02
2002/03-2005/06
1992/93-2005/06
1981/82-2005/06
Agriculture and Allied
2.5 3.5 4.7 2.0 1.9 3.0 3.0
Industry 5.3 7.1 7.6 4.4 8.0 6.6 6.5
Services 4.5 6.7 7.6 8.2 8.9 8.2 7.4
GDP 3.6 5.6 6.7 5.5 7.0 6.4 5.9
GDP per capita
1.4 3.4 4.6 3.6 5.3 4.4 3.8
Source: CSO . Note: Industry includes Construction.
At the same time, one should not forget that the GDP growth rate of 3.6 percent
was four times greater than the 0.9 percent growth estimated for the previous half century
of British colonial rule (Table 2). Moreover the growth was reasonably sustained, with no
extended periods of decline. Nor were there inflationary bouts of the kind which racked
many countries in Latin America. However, growth was far below potential and much
less than the 7-8 percent rates being achieved in some countries of East Asia and Latin
America. Worst of all, the proportion of the Indian population below a (minimalist)
poverty line actually increased from 45 to 51 percent (Table 3).
Table 2: Economic Growth: Pre-independence (% per year)
Year 1900-46 1900-29 1930-46
GDP 0.9 0.9 0.8
Population 0.8 0.5 1.3
Per Capita GDP 0.1 0.4 -0.5
Source: Sivasubramonian (2000)
2
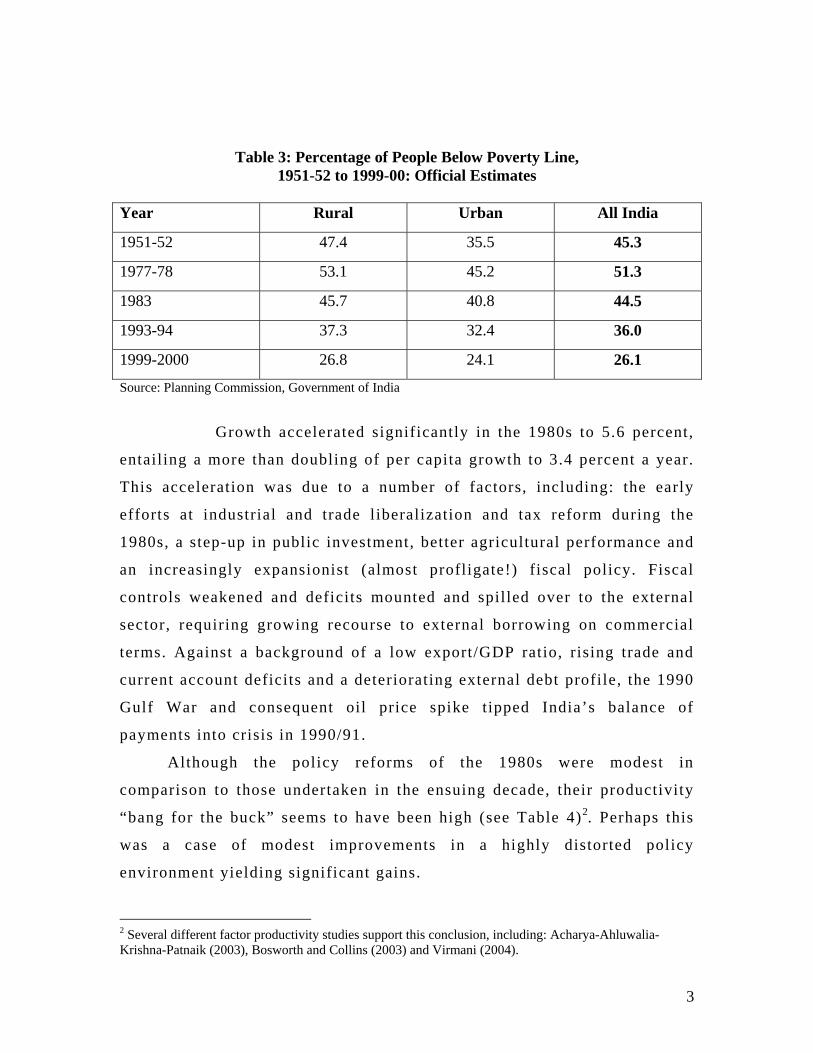
Table 3: Percentage of People Below Poverty Line,
1951-52 to 1999-00: Official Estimates
Year Rural Urban All India
1951-52 47.4 35.5 45.3
1977-78 53.1 45.2 51.3
1983 45.7 40.8 44.5
1993-94 37.3 32.4 36.0
1999-2000 26.8 24.1 26.1
Source: Planning Commission, Government of India
Growth accelerated significantly in the 1980s to 5.6 percent,
entailing a more than doubling of per capita growth to 3.4 percent a year.
This acceleration was due to a number of factors, including: the early
efforts at industrial and trade liberalization and tax reform during the
1980s, a step-up in public investment, better agricultural performance and
an increasingly expansionist (almost profligate!) fiscal policy. Fiscal
controls weakened and deficits mounted and spilled over to the external
sector, requiring growing recourse to external borrowing on commercial
terms. Against a background of a low export/GDP ratio, rising trade and
current account deficits and a deteriorating external debt profile, the 1990
Gulf War and consequent oil price spike tipped India’s balance of
payments into crisis in 1990/91.
Although the policy reforms of the 1980s were modest in
comparison to those undertaken in the ensuing decade, their productivity
“bang for the buck” seems to have been high (see Table 4)2. Perhaps this
was a case of modest improvements in a highly distorted policy
environment yielding significant gains.
2 Several different factor productivity studies support this conclusion, including: Acharya-Ahluwalia-Krishna-Patnaik (2003), Bosworth and Collins (2003) and Virmani (2004).
3
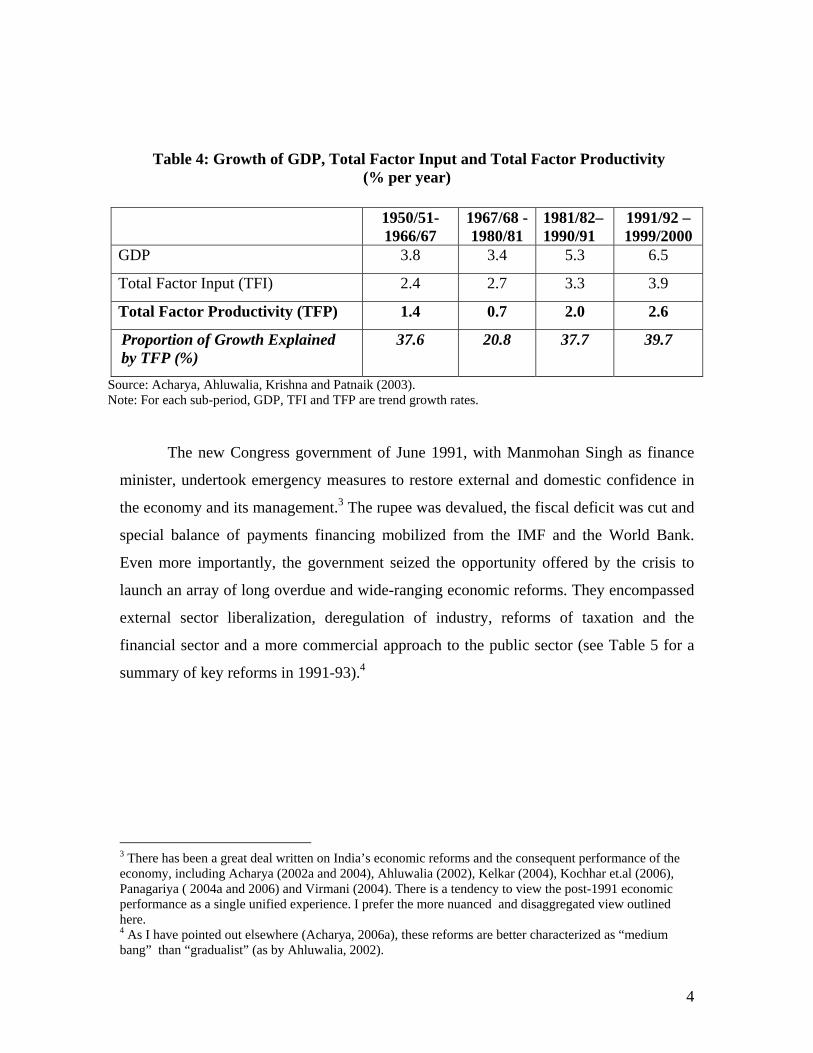
Table 4: Growth of GDP, Total Factor Input and Total Factor Productivity
(% per year) 1950/51-
1966/67 1967/68 - 1980/81
1981/82– 1990/91
1991/92 – 1999/2000
GDP 3.8 3.4 5.3 6.5
Total Factor Input (TFI) 2.4 2.7 3.3 3.9
Total Factor Productivity (TFP) 1.4 0.7 2.0 2.6
Proportion of Growth Explained by TFP (%)
37.6 20.8 37.7 39.7
Source: Acharya, Ahluwalia, Krishna and Patnaik (2003). Note: For each sub-period, GDP, TFI and TFP are trend growth rates.
The new Congress government of June 1991, with Manmohan Singh as finance
minister, undertook emergency measures to restore external and domestic confidence in
the economy and its management.3 The rupee was devalued, the fiscal deficit was cut and
special balance of payments financing mobilized from the IMF and the World Bank.
Even more importantly, the government seized the opportunity offered by the crisis to
launch an array of long overdue and wide-ranging economic reforms. They encompassed
external sector liberalization, deregulation of industry, reforms of taxation and the
financial sector and a more commercial approach to the public sector (see Table 5 for a
summary of key reforms in 1991-93).4
3 There has been a great deal written on India’s economic reforms and the consequent performance of the economy, including Acharya (2002a and 2004), Ahluwalia (2002), Kelkar (2004), Kochhar et.al (2006), Panagariya ( 2004a and 2006) and Virmani (2004). There is a tendency to view the post-1991 economic performance as a single unified experience. I prefer the more nuanced and disaggregated view outlined here. 4 As I have pointed out elsewhere (Acharya, 2006a), these reforms are better characterized as “medium bang” than “gradualist” (as by Ahluwalia, 2002).
4
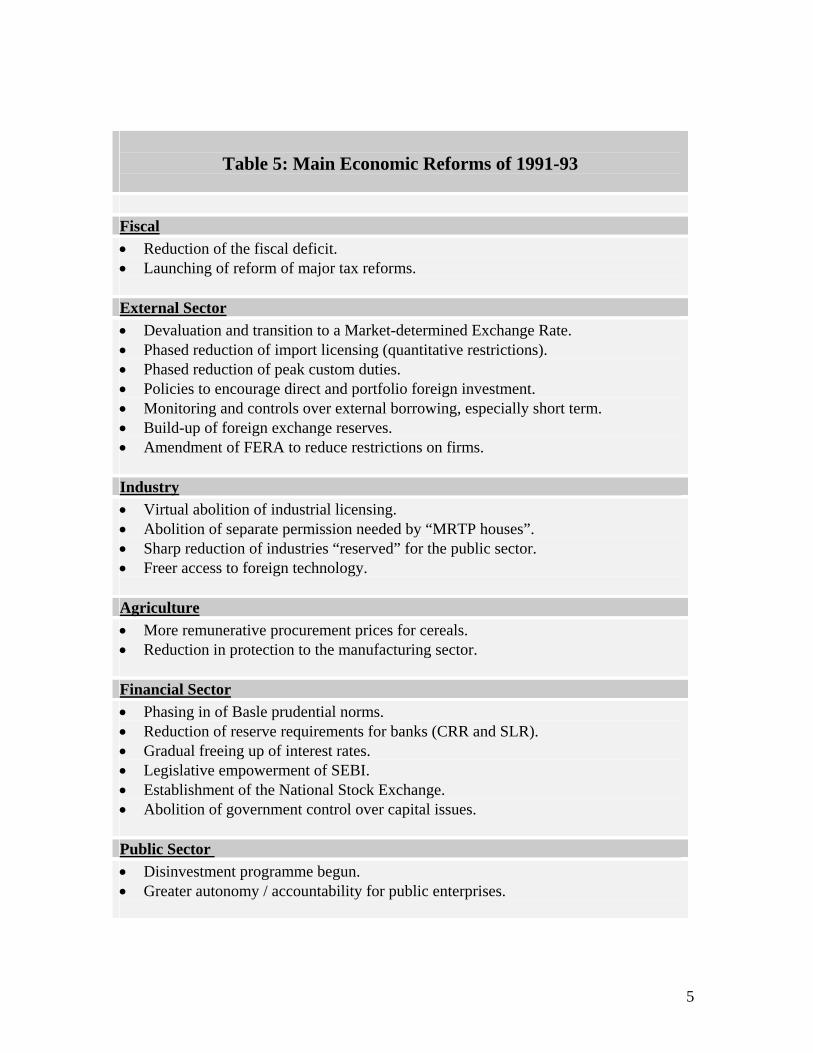
Table 5: Main Economic Reforms of 1991-93
Fiscal• Reduction of the fiscal deficit. • Launching of reform of major tax reforms. External Sector• Devaluation and transition to a Market-determined Exchange Rate. • Phased reduction of import licensing (quantitative restrictions). • Phased reduction of peak custom duties. • Policies to encourage direct and portfolio foreign investment. • Monitoring and controls over external borrowing, especially short term. • Build-up of foreign exchange reserves. • Amendment of FERA to reduce restrictions on firms. Industry• Virtual abolition of industrial licensing. • Abolition of separate permission needed by “MRTP houses”. • Sharp reduction of industries “reserved” for the public sector. • Freer access to foreign technology. Agriculture• More remunerative procurement prices for cereals. • Reduction in protection to the manufacturing sector. Financial Sector• Phasing in of Basle prudential norms. • Reduction of reserve requirements for banks (CRR and SLR). • Gradual freeing up of interest rates. • Legislative empowerment of SEBI. • Establishment of the National Stock Exchange. • Abolition of government control over capital issues. Public Sector • Disinvestment programme begun. • Greater autonomy / accountability for public enterprises.
5

The economy responded swiftly and positively to these reforms. After virtual stagnation
in 1991/92, GDP growth surged in the next five years to clock a record 5-year average of
6.7 percent. It is noteworthy that in this high growth Eighth Plan period all major sectors
(agriculture, industry, services) grew noticeably faster than in the pre-crisis decade. The
acceleration in the growth of agricultural value added is particularly interesting in the
light of oft-repeated criticism that the economic reforms of the early nineties neglected
the agricultural sector.
The factors which explain this remarkable and broad-based growth surge in the
period 1992-97 appear to include:
• Productivity gains resulting from the deregulation of trade, industry and finance, especially in the sectors of industry and some services;
• The surge in export growth at about 20 percent per year (in dollar terms) for three successive years beginning 1993-94, attributable to the substantial devaluation in real effective terms in the early nineties and a freer policy regime for industry, foreign trade and payments;
• The investment boom of 1993-96 which exerted expansionary effects on both supply and demand, especially in industry. The investment boom itself was probably driven by a combination of factors including the unleashing of ‘animal spirits’ by economic reforms, the swift loosening of the foreign exchange bottleneck, confidence in broadly consistent governmental policy signals and easier availability of investible funds (both through borrowing and new equity issues);
• The partial success in fiscal consolidation, which kept a check on government borrowings and facilitated expansion of aggregate savings and investments;
• Improvement in the terms of trade for agriculture resulting from a combination of higher procurement prices for important crops and reduction in trade protection for manufactures;
• Availability of capacity in key infrastructure sectors, notably power; • A buoyant world economy which supported expansion of foreign trade and private
capital inflows.
The momentum of growth slowed noticeably in the Ninth Plan period, 1997-2002, to
an average of 5.5 percent, compared to the 6.7 percent achieved in the previous five years.
Among the factors which contributed to this deceleration were: the significant worsening of
the fiscal deficits (mainly due to large public pay increases following the Fifth Pay
Commission) and the associated decline in public savings, the slackening of economic
reforms after 1995 as coalition governance became the norm, a significant slowdown in
6
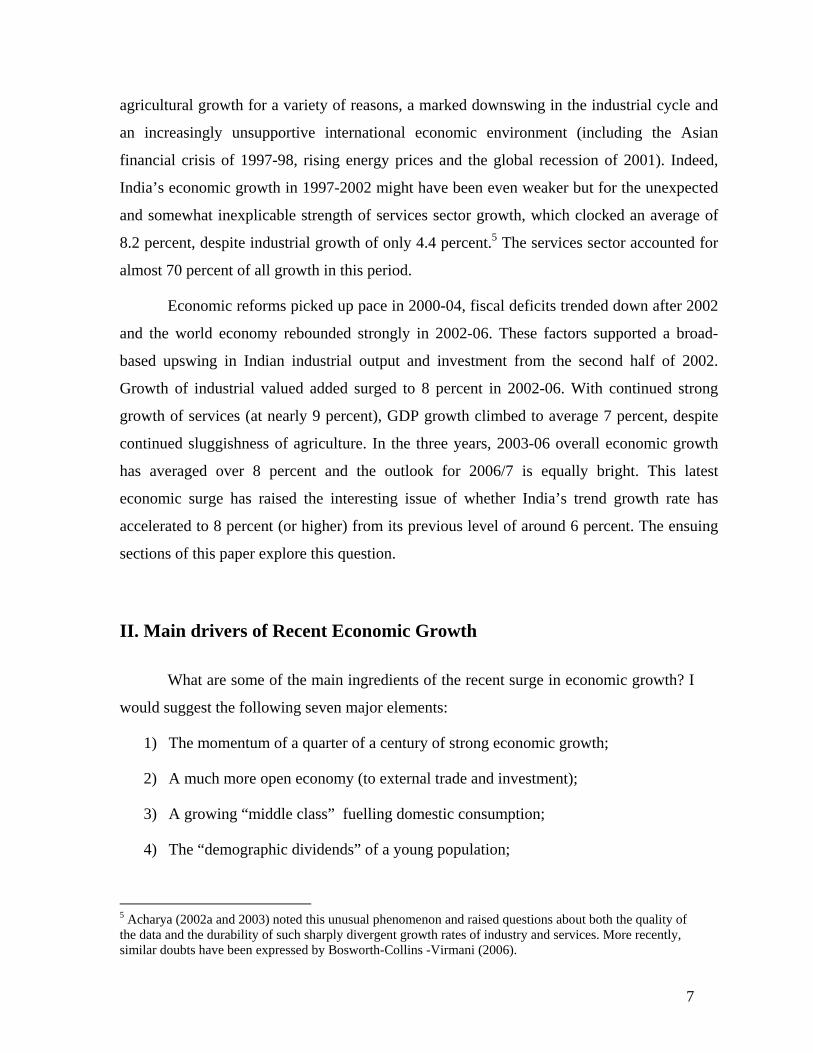
agricultural growth for a variety of reasons, a marked downswing in the industrial cycle and
an increasingly unsupportive international economic environment (including the Asian
financial crisis of 1997-98, rising energy prices and the global recession of 2001). Indeed,
India’s economic growth in 1997-2002 might have been even weaker but for the unexpected
and somewhat inexplicable strength of services sector growth, which clocked an average of
8.2 percent, despite industrial growth of only 4.4 percent.5 The services sector accounted for
almost 70 percent of all growth in this period.
Economic reforms picked up pace in 2000-04, fiscal deficits trended down after 2002
and the world economy rebounded strongly in 2002-06. These factors supported a broad-
based upswing in Indian industrial output and investment from the second half of 2002.
Growth of industrial valued added surged to 8 percent in 2002-06. With continued strong
growth of services (at nearly 9 percent), GDP growth climbed to average 7 percent, despite
continued sluggishness of agriculture. In the three years, 2003-06 overall economic growth
has averaged over 8 percent and the outlook for 2006/7 is equally bright. This latest
economic surge has raised the interesting issue of whether India’s trend growth rate has
accelerated to 8 percent (or higher) from its previous level of around 6 percent. The ensuing
sections of this paper explore this question.
II. Main drivers of Recent Economic Growth
What are some of the main ingredients of the recent surge in economic growth? I
would suggest the following seven major elements:
1) The momentum of a quarter of a century of strong economic growth;
2) A much more open economy (to external trade and investment);
3) A growing “middle class” fuelling domestic consumption;
4) The “demographic dividends” of a young population;
5 Acharya (2002a and 2003) noted this unusual phenomenon and raised questions about both the quality of the data and the durability of such sharply divergent growth rates of industry and services. More recently, similar doubts have been expressed by Bosworth-Collins -Virmani (2006).
7

5) Strong companies in a modernized capital market;
6) Some recent economic reforms.
7) A supportive international economic environment.
Let me elaborate briefly on each of these factors.
The Momentum of Growth
The last thirty years’ experience suggests that very few developing countries have
sustained decent per capita growth for two decades or more (Acharya, 2006b).
Specifically, out of 117 developing countries with population over half a million, only 12
countries achieved per capita growth of more than 3 percent per year in 1980-2002, with
at least 2 percent growth in each decade of the eighties and nineties. These twelve
countries were: China (8.2), Vietnam (4.6), South Korea (6.1), Chile (3.3), Mauritius
(4.4), Malaysia (3.4), India (3.6), Thailand (4.6), Bhutan (4.3), Sri Lanka (3.1), Botswana
(4.7) and Indonesia (3.5). (The number falls to 9 if we specify a minimum population of 3
million). Nine of these 12 countries are in Asia and, fortunately, they include the three
most populous: China, India and Indonesia. (See Table 6). If we take the full 25 years
(1981-2006), India’s per capita growth has averaged 3.8 percent or almost 4 percent per
year.
8
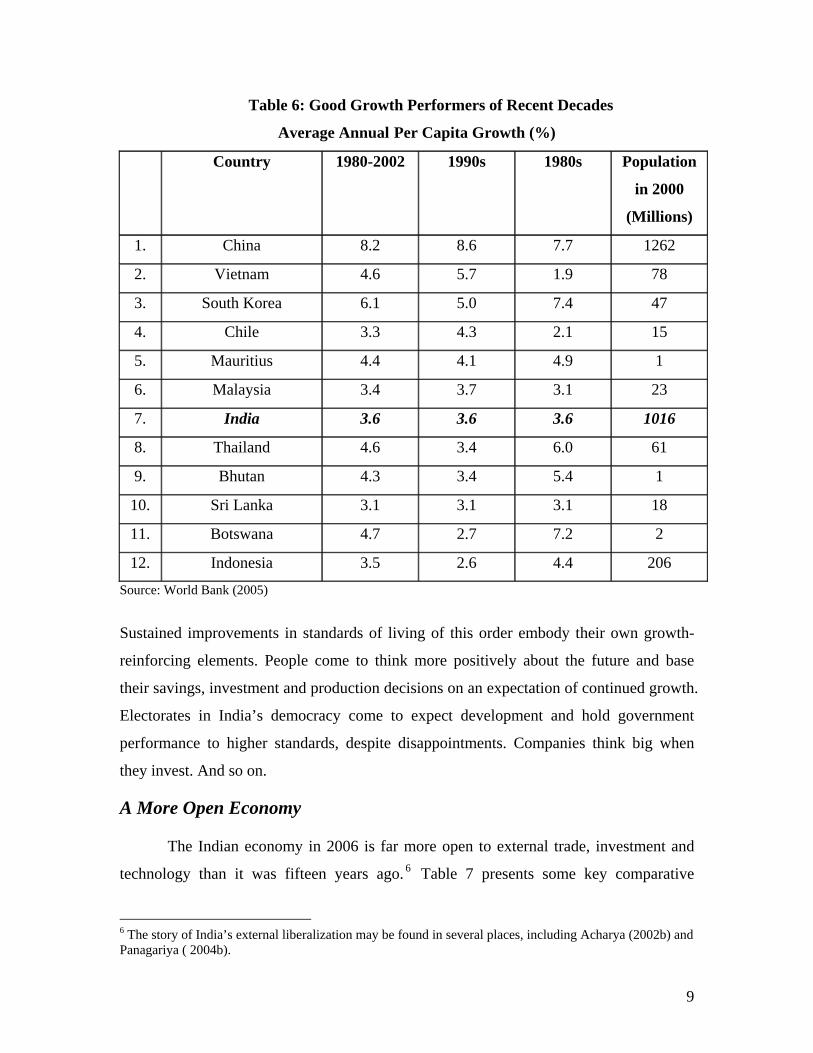
Table 6: Good Growth Performers of Recent Decades
Average Annual Per Capita Growth (%)
Country 1980-2002 1990s 1980s Population
in 2000
(Millions)
1. China 8.2 8.6 7.7 1262
2. Vietnam 4.6 5.7 1.9 78
3. South Korea 6.1 5.0 7.4 47
4. Chile 3.3 4.3 2.1 15
5. Mauritius 4.4 4.1 4.9 1
6. Malaysia 3.4 3.7 3.1 23
7. India 3.6 3.6 3.6 1016
8. Thailand 4.6 3.4 6.0 61
9. Bhutan 4.3 3.4 5.4 1
10. Sri Lanka 3.1 3.1 3.1 18
11. Botswana 4.7 2.7 7.2 2
12. Indonesia 3.5 2.6 4.4 206
Source: World Bank (2005)
Sustained improvements in standards of living of this order embody their own growth-
reinforcing elements. People come to think more positively about the future and base
their savings, investment and production decisions on an expectation of continued growth.
Electorates in India’s democracy come to expect development and hold government
performance to higher standards, despite disappointments. Companies think big when
they invest. And so on.
A More Open Economy
The Indian economy in 2006 is far more open to external trade, investment and
technology than it was fifteen years ago. 6 Table 7 presents some key comparative
6 The story of India’s external liberalization may be found in several places, including Acharya (2002b) and Panagariya ( 2004b).
9

indicators. Peak import duties on manufactures have come down from over 200% to
12.5%, a remarkable reduction by any standards. The regime of tight, detailed and
discretionary import controls has been almost completely dismantled. The exchange rate
was devalued and made market-responsive (1991-3). The policies towards foreign
portfolio and direct investment have been greatly liberalized. As a result, the ratio of
traded goods to GDP has more than doubled from less than 15 percent to nearly 33
percent. Because of the sustained boom in software exports and worker remittances, the
ratio of current receipts (goods exports plus gross invisibles) has more than tripled from 8
percent to over 24 percent of GDP. Foreign investment has risen from negligible levels to
US $ 20 billion in 2005/6.
Table 7: Towards A More Open Economy
1990/91 2005/06
Peak Import Duties (manufacturers)
200% plus 12.5%
Import Controls Tight, detailed
Almost gone
Trade (goods) / GDP Ratio (%) 14.6
32.7
Current Receipts / GDP (%)
8.0 24.5
Software Exports ($ billion)
Nil 23.6
Worker Remittances ($ billion)
2.1 24.6
Foreign Investment ($ billion)
Negligible
20.2
Foreign Currency Reserves ($ billion, March 31)
2.2 145.1
Debt Service Ratio (%)
35.3 10.2
Source: RBI, Annual Report, 2005 /06, except for first two rows.
After initial periods of sometimes painful adjustment in the 1990s, Indian industry
has thrived in the more open and competitive environment. The explosion in software IT-
enabled service exports is well-known, having risen from nil in 1991 to $ 24 billion in
2005/6. Anecdotal evidence suggests that small-scale units have benefited greatly from
10

the much freer access to traded raw materials, components and designs. Perhaps most
important, the old mindset of “foreign exchange scarcity” (and the welter of bad
economic policies it spawned) has been effectively banished. Interestingly, the “opening
up” has also strengthened the prudential yardsticks of foreign exchange reserves and debt
service ratios.
Rise of strong companies in a modernized capital market
The 1990s ushered in far-reaching reforms in India’s capital markets. The
Securities and Exchange Board of India was statutorily empowered in 1992 and quickly
moved to improve standards of disclosure and transparency. The new electronic-trade-
based National Stock Exchange was established in 1993 and set high technical and
governance standards, which soon had to be emulated by the much older (and, sometimes
scam-hit) Bombay Stock Exchange. Depositories legislation was enacted and soon
paperless trading became the norm. Brokers were encouraged to corporatize. Futures
markets were nurtured. These and other reforms transformed Indian capital markets into
one of the best in the developing world.
The combination of a modernizing capital market, an increasingly liberal and
competitive environment for investment, trade and production, a wealth of
entrepreneurial talent and sustained economic growth has helped the rise of strong new
companies and supported the expansion of the more agile and aggressive among the
established firms. By way of example, Airtel, the leading private telecom, went from
nothing to a multi-billion dollar company in a decade. The same was true for the leading
domestic airline, Jet and the IT icons like Infosys, Wipro, TCSand HCL. Old pharma
companies, like Ranbaxy, transformed themselves. New media companies like Zee and
NDTV bloomed. Established corporates houses restructured and flourished (such as some
Tata companies, Reliance, Bajaj, Mahindra and Hero Honda) or saw their market shares
decline. In recent years quite a few Indian companies have expanded through overseas
investments and acquisitions, facilitated by direct investments abroad averaging $1.5 to
$ 2 billion in the past five years. The recent bid for Corus by Tata Steel is a well-
publicized example.
11

Aggregate financial data also point to the strength and expansion of India’s
corporate sector in recent. The market capitalization of companies listed on the Bombay
Stock Exchange rose nearly 14-fold from $ 50 billion in 1990/91 to $ 680 billion in
2005/6 (Table 8). In the last five years, the growth of profits has outpaced the growth of
sales of private corporates, indicating rising profit margins. With falling interest rates and
growing recourse to internal funding, the share of interest outgo in gross profits dropped
sharply from above 50 percent in the late 1990s to 15 percent in 2005/6 (Reserve Bank,
2006, Box 1.7). Unsurprisingly, data for the top 1000 listed companies showed net profits
as percent of net sales rising from 4.5 % in 2001/2 to 8.9 % in 2004/5 (Business Standard,
2006).
Table 8: Rising Middle Class
1990/91 2005/06
People in households with income (Rs.2,00,000 – 10,00,000 OR PPP $20,000- $1,00,000 approximately)a
15 million 100 million
Bombay Stock Exchange Market Capitalisation* $50 billion $680 billion
Cars + UVs sold # 205 thousand 1319 thousand
Two Wheelers sold # 1800 thousand 7570 thousand
Telephone Connections@ (million) 5 125$
a Based on data from NCAER (2005) * RBI, Handbook of Statistics on the Indian Economy, 2005-06 # Business Beacon, CMIE and Monthly Review of the Indian Economy, CMIE, October 2006 @ Business Beacon CMIE and Economic Survey, 2005-06 $ December 2005
A Growing Middle Class
In the mid-1990s, shortly after the major economic reforms of 1991-4, there was
premature exuberance about India’s rising middle class and their acquisitive aspirations.
Today there is a much firmer basis for emphasizing the importance of the growing middle
class in transforming consumption, production and investment in the Indian economy.
Table 8 provides a few indicators. Based on surveys by the NCAER, about 100 million
people now live in households with annual incomes between Rs. 200,000 and Rs 1
12
million (approximately PPP$ 20,000 to 100,000), compared to about 15 million in
1990/91. With a lower defining threshold, the size of the middle class would be greater.
For example, if the middle class cut-off is defined as the “non-poor” by standards of
developed economies, then Bhalla (2007) estimates that 34 percent of India’s population
was “middle class” in 2005 compared to about 10 percent in 1990.
Purchases of iconic middle class consumption items have certainly soared in the
last 15 years (Table 8). Annual sales of cars (including multi-utility vehicles) have risen
more than six times to 1.3 million in 2005/6. Two wheeler sales have increased more than
four times to 7.6 million in 2005/6. In 1990/91 India had just 5 million telephone
connections (all fixed). By the end of 2005 the number was 125 million (about two-thirds
were mobile connections). Indeed, in October 2006 the new mobile connections were
close to 7 million, more than the total of phone connections fifteen years ago!
The Demographic Dividend
It has become commonplace to emphasize the growth potential of India’s young
population and declining dependency ratio. According to most population projections the
share of working age population in total population will continue to rise for the next 30
years or so, long after the decline has set in other major countries like China, USA,
Western Europe and Japan (Table 9). These demographics point to a large potential for
higher growth through augmented supply of labour and savings. Indeed, these trends have
already been at work over the 15 years or so, helping to raise India’s household savings
from around 15-16 percent of GDP in the late 1980s to 22-24 percent in recent years.7
7 This could be an important part of the explanation to the puzzle: How does India sustain high growth despite aggregate fiscal deficits above 7 percent of GDP over the last twenty years?
13

Table 9: Share of Working Population (15-59 yrs) Country 1950 1975 2000 2025 2050
India 55.5 54.0 58.9 64.3 59.7
China 59.0 53.6 65.0 62.1 53.8
Japan 56.9 64.0 62.1 52.8 45.2
US 60.5 60.0 62.1 56.6 54.6
Western Europe 61.7 58.1 61.3 54.8 50.4
Source: http://www.un.org/esa/population/publications/worldageing19502050/countriesorareas.htm
Some Recent Policies
As noted above economic reforms slowed after 1995 and then revived to some
extent in the period 2000-04. Also, real interest rates declined worldwide and in India too.
In India this may have been helped by renewed efforts to reduce burgeoning fiscal
deficits, including through enactment of the Fiscal Responsibility and Budget
Management Act (2003) at the central level. The fiscal position of the States also
improved from the dire straits plumbed following the Fifth Pay Commission. The states
too adopted fiscal responsibility laws following the recommendations (and conditional
debt write-offs) of the Twelfth Finance Commission (Government of India, 2004).
Furthermore, tax revenues at both levels of government were buoyed by resurgent
economic (especially industrial) growth after 2002/3.
The net result was a decline in the gross fiscal deficit from almost 10 percent of
GDP in 2001/2 to 7.5 percent in 2004/5 and an even larger decline in the revenue
(current) deficit from 7 to 3.7 percent of GDP (Table 10). This was the single most
important factor explaining the increase in aggregate savings from around 24 percent of
GDP in 2001/2 to 29 percent in 2004/5, which, in turn, helped finance the current
investment boom.
14

Table 10: Deficits, Savings and Investment (as % of GDP)
Year
1995-96 2001-02 2004-05
Gross Fiscal Deficit (Centre and States)
6.5 9.9 7.5
Revenue Deficit (Centre and States)
3.2 7.0 3.7
Gross Domestic Savings (of which Government)
25.1 (-2.0)
23.6 (-6.0)
29.1 (-2.7)
Gross Domestic Investment
26.9 23.0 30.1
Source: RBI, Handbook of Statistics on the Indian Economy, 2005-06 and CSO website • (http://mospi.nic.in/mospi_cso_rept_pubn.htm ) • (http://mospi.nic.in/mospi_press_releases.htm )
International Economic Environment
Despite the war in Iraq and the high oil prices of recent years the world economy
has grown at almost 5 percent over the last four years, propelled by strong growth in US
and China and some recovery in Japan and Europe. World trade in goods and services has
expanded rapidly. This favorable environment has helped rapid growth of exports (of
goods and services) from India, which, in turn, has been a significant driver of economic
growth in this recent period.8
III Risks to Future Strong Growth
There are some well-known risks or constraints to the sustenance of the 8 percent
growth enjoyed by India since 2003. These include:
1) Renewed fiscal stress from populist policies;
8 Panagariya (2006) emphasizes this point.
15
2) Infrastructure bottlenecks;
3) Labour market rigidities;
4) Weak performance of agriculture;
5) Pace of economic reforms;
6) Weaknesses in human resource development programmes;
7) The international economic environment.
Each of these merit brief elaboration.
Populism and Renewed Fiscal Stress
The recent progress in fiscal consolidation, noted above, is real but modest. The
overall fiscal deficit remains high at 7.5 percent of GDP in 2005/6, as does the
government debt to GDP ratio at 80 percent (compared to about 60 percent in 1995/6).
While the fiscal responsibility laws enacted by central and state governments (22 out of
28 states have passed such laws so far) are promising, they are not immune to populist
pressures. Especially since the advent of the UPA government in 2004, populist
expenditure programmes, such as the National Rural Employment Guarantee scheme,
have gained fresh momentum. The Sixth Pay Commission has been constituted and is
expected to submit its report by mid-2008, with governmental action likely before the
next general election. The possibility of significant public pay increases is obviously high.
On the revenue side, the state level VATs have contributed to revenue buoyancy. But the
recent scheme for Special Economic Zones is fraught with unduly generous tax
concessions. So the prospects for fiscal consolidation are mixed, at best.
Infrastructure Bottlenecks
India’s infrastructure problems are legendary and also reflect failures in public
sector performance and governance. A recent appraisal (World Bank, 2006) points out
that “the average manufacturer loses 8.4 percent in sales annually on account of power
16
outages”, over 60 percent of Indian manufacturing firms own generator sets (compared to
27 percent in China and 17 percent in Brazil) and India’s combined real cost of power is
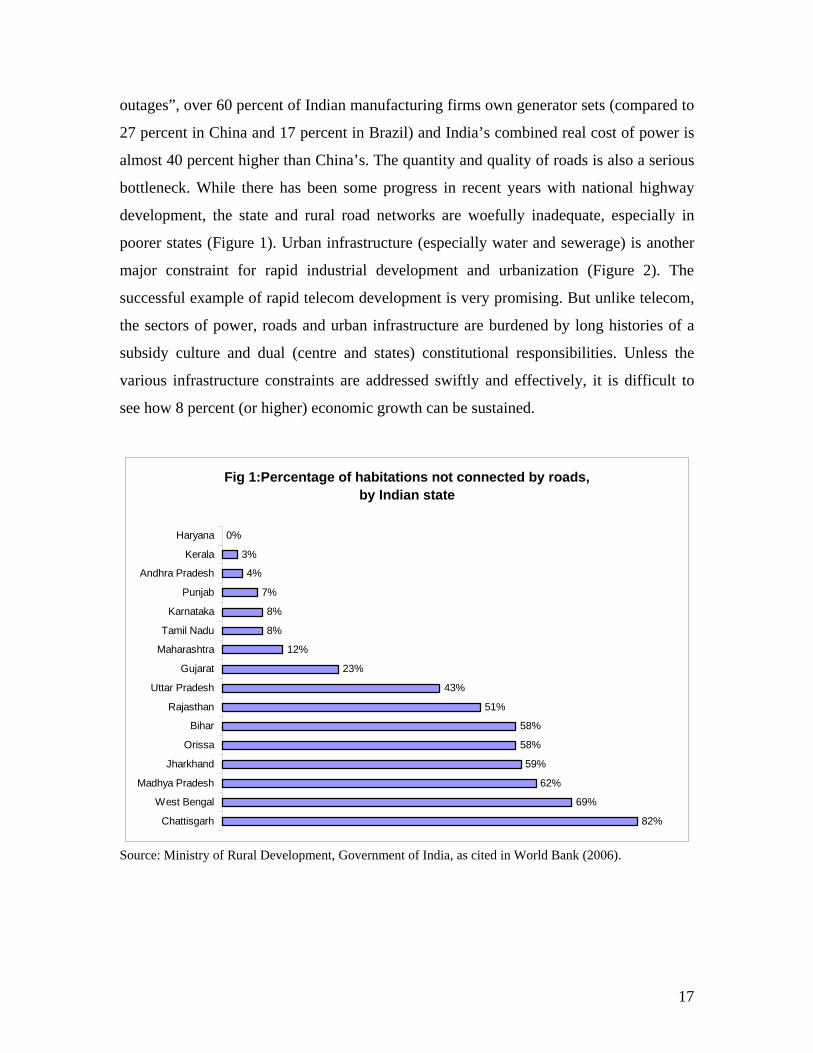
almost 40 percent higher than China’s. The quantity and quality of roads is also a serious
bottleneck. While there has been some progress in recent years with national highway
development, the state and rural road networks are woefully inadequate, especially in
poorer states (Figure 1). Urban infrastructure (especially water and sewerage) is another
major constraint for rapid industrial development and urbanization (Figure 2). The
successful example of rapid telecom development is very promising. But unlike telecom,
the sectors of power, roads and urban infrastructure are burdened by long histories of a
subsidy culture and dual (centre and states) constitutional responsibilities. Unless the
various infrastructure constraints are addressed swiftly and effectively, it is difficult to
see how 8 percent (or higher) economic growth can be sustained.
Fig 1:Percentage of habitations not connected by roads, by Indian state
82%
69%
62%
59%
58%
58%
51%
43%
23%
12%
8%
8%
7%
4%
3%
0%
Chattisgarh
West Bengal
Madhya Pradesh
Jharkhand
Orissa
Bihar
Rajasthan
Uttar Pradesh
Gujarat
Maharashtra
Tamil Nadu
Karnataka
Punjab
Andhra Pradesh
Kerala
Haryana
Source: Ministry of Rural Development, Government of India, as cited in World Bank (2006).
17

Fig 2: Percentage of the population with access to sewerage facilities, by Indian state
63
49
37
37
33
29
17
15
10
10
9
8
0 10 20 30 40 50 60 70
Gujarat
Maharashtra
Uttaranchal
Uttar Pradesh
Karnataka
Tamil Nadu
West Bengal
Andhra Pradesh
Madhya Pradesh
Chattisgarh
Orissa
Rajasthan
Source: Central Public Health and Environmental Engineering Organization, 2000, as cited in World Bank (2006).
Labour Market Rigidities
According to official data, India’s non-agricultural employment in the private
organized (units employing more than 10 workers) sector has stagnated below 9 million
for over 20 years, although the labour force has grown to exceed 400 million! A major
cause has been India’s complex and rigid labour laws, which hugely discourage fresh
employment while protecting those with organized sector jobs. 9 Investment climate
surveys by the World Bank indicate that India has some of the most restrictive labour
laws in the world, which, in effect convert labour (in organized units) into a fixed factor
of production (lay-offs are extremely difficult) and thereby discourage fresh employment
in the organized sector while promoting more “casualization” and insecurity among the 9 The skill and capital-intensive pattern of development of India’s modern industrial and services sectors (despite the endowment of abundant unskilled labour) has been noted by many analysts, including Kochhar et.al. (2006), Panagariya (2006) and World Bank (2006). All of them point to restrictive labour laws as a major culprit.
18

93 percent of workers in the unorganized sector. The laws are not just rigid but also
numerous (“a typical firm in Maharashtra has to deal with 28 different acts pertaining to
labor”, World Bank, 2006).
Without significant reform of existing labour laws, India’s cheap labour
advantages remain hugely underutilized. Looking to the future, the challenge will
increase as the “demographic dividend” brings further large increases in the labour force.
In fact, as I have pointed out elsewhere (Acharya, 2004), the economic and political
challenge is far greater than normally appreciated because the bulk of the demographic
bulge will occur (in the next few decades) in the poor, slow-growing and populous states
of central and eastern India (notably, Uttar Pradesh, Bihar, Orissa and Madhya Pradesh).
Weak Agricultural Performance
Since 1996/97 the growth of agriculture has dropped to barely 2 percent,
compared to earlier trend rate ranging between 2.5- 3.0 percent. The reasons are many
and include declining public investment by cash-strapped states, grossly inadequate
maintenance of irrigation assets, falling water tables, inadequate rural road networks,
unresponsive research and extension services, soil damage from excessive urea use
(encouraged by high subsidies), weak credit delivery and a distorted incentive structure
which impedes diversification away from food grains. Tackling these problems and
revitalising agriculture will take time, money, understanding and political will. It will
also require much greater investments in (and maintenance of) rural infrastructure of
irrigation, roads, soil conservation, etc. and reinvigoration of the present systems of
agricultural research and extension. While the central government can play a significant
role in revamping systems, the main responsibility for strengthening rural infrastructure
lies with the states. However, their financial and administrative capabilities have
weakened over time.
The share of agriculture in GDP has declined to hardly 20 percent. But agriculture
is still the principal occupation of nearly 60 percent of the labour force. Thus better
performance of this sector is essential for poverty alleviation and containment of rising
regional and income inequalities.
19

Pace of Economic Reforms There is little doubt that economic reforms have slowed since the UPA
government assumed office in May 200410. The privatization programme has been halted,
although Government remains the dominant owner in banking, energy and transport and
the usual ills of public ownership afflict the performance of many enterprises in these key
sectors. The legislative proposals of the previous government to reduce government
ownership in public sector banks to 33 percent have lapsed and not been renewed. There
has been some revival of interest rate controls and directed credit. Follow-up action on
the reformist new Electricity Act (2003) passed by the NDA government has been slow.
The pricing of petroleum products has become more politically administered than before.
Education policy has focused on introducing caste-based reservations in institutions of
higher education. Introduction of such reservations in private sector employment are also
being considered. Reform of labour laws remains stalled. There has been little forward
progress in reform of agriculture policies.
Indeed, the wonder is that the economy’s growth momentum has remained so
strong despite the stalling of economic reforms. If the growth dividends of economic
reforms occur with a lag, then the paucity of reforms in the period 2004-06 may take their
toll in the years ahead.
Weak Human Resource Policies The long-run performance of the Indian economy must surely depend on
successful policies and programmes for education, skill-development and health service
provision. Yet the government-led programmes in these sectors suffer from very serious
weaknesses and lack of reform impetus. For example, World Bank (2006) cites a number
of surveys which show that less than half of government teachers and health workers are
actually to be found in schools and clinics they are serving (the situation is typically
worse in poorer states) . Even though school enrolment rates have climbed over time, the
actual cognitive skill acquired in schools (even simple reading and arithmetic) is still very
10 For a recent review see Acharya (2006c).
20
low (Pratham, 2006). In health, a survey shows that medics in primary health clinics in
Delhi had a greater than 50 percent chance of prescribing a harmful therapy for specified,
common ailments (Das and Hammer, 2004a and 2004b). The competence of these medics
was found to be less than comparably situated counterparts in Tanzania and substantially
worse than counterparts in Indonesia. Even in higher education, an area of supposed
competence, studies point to enormous problems of quality, quantity and relevance (see,
for example, Aggarwal, 2006).
Quite clearly, the current portfolio of policies and programmes in these critical
sectors need urgent improvement if India is to retain her competitive edge in an
increasingly globalized, knowledge-based, world economy.
International Economic Environment The latter half of 2006 has witnessed a distinct slowing in the growth of the US
economy, still the single most potent locomotive of global growth. The Doha Round of
multilateral trade liberalization remains mired in limbo. Oil prices, though off their peaks,
remain high with little prospect of falling below $50 a barrel. The chances of some
slackening in the growth of world output and trade are clearly rising. Just as the Indian
economy has benefited from strong global expansion in the last four years, so it may
expect to bear some downside risks from slower world growth in the years ahead.
IV Medium Term Growth Prospects Since 2003/4 there have been quite a few studies projecting sustained, high
growth of the Indian economy in the long-run, including the Goldman Sachs “BRICs”
report (Wilson-Purushothaman, 2003), Rodrik-Subramanian (2004) and Kelkar (2004).
Their specific projections and time-periods differ: Goldman Sachs foresaw near 6 percent
growth for 50 years; Rodrik-Subramanian projected a minimum of 7 percent for the next
20 years and Kelkar was even more optimistic with his growth expectation of 10
percent.11 More recently, with a three-year 8 percent average already achieved and the
11 See Acharya (2004) for a critical assessment of these bullish growth expectations.
21

current year likely to register a similar rate, the Government’s Planning Commission
(2006) has outlined GDP growth projections for 2007/8-2011/12 of 8 to 9 percent.
Bhalla (2007, forthcoming) goes further and foresees 10 percent growth as almost
inevitable. Most probably, the majority of serious economists in India would today expect
economic growth in the medium term (say, 2007-12) to average at least 8 percent.
Such optimism is not wholly misplaced. It is based on the continuing strength of
the positive factors outlined in section II above, especially globalization and “catch-up”,
the demographic dividends, the rising middle class, a vibrant entrepreneurial culture,
positive expectations of future economic reforms and a generally benign international
economic environment. The optimists are not blind to the risks and threats outlined in
section III. They simply expect the growth-enhancing tendencies to prevail or, more
subtly, for the dynamics of growth to generate solutions to constraints such as
infrastructure and education. Figure 3 provides encouragement to the bullish outlook.
22
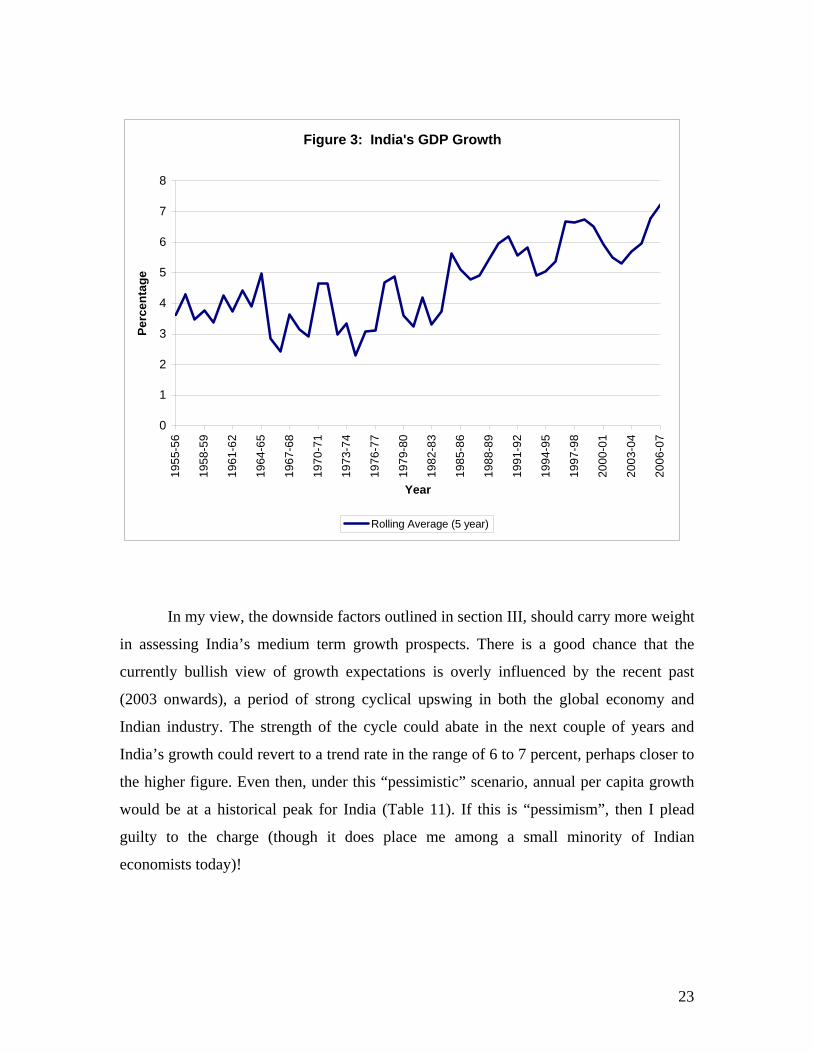
Figure 3: India's GDP Growth
0
1
2
3
4
5
6
7
819
55-5
6
1958
-59
1961
-62
1964
-65
1967
-68
1970
-71
1973
-74
1976
-77
1979
-80
1982
-83
1985
-86
1988
-89
1991
-92
1994
-95
1997
-98
2000
-01
2003
-04
2006
-07
Year
Perc
enta
ge
Rolling Average (5 year)
In my view, the downside factors outlined in section III, should carry more weight
in assessing India’s medium term growth prospects. There is a good chance that the
currently bullish view of growth expectations is overly influenced by the recent past
(2003 onwards), a period of strong cyclical upswing in both the global economy and
Indian industry. The strength of the cycle could abate in the next couple of years and
India’s growth could revert to a trend rate in the range of 6 to 7 percent, perhaps closer to
the higher figure. Even then, under this “pessimistic” scenario, annual per capita growth
would be at a historical peak for India (Table 11). If this is “pessimism”, then I plead
guilty to the charge (though it does place me among a small minority of Indian
economists today)!
23

Table 11: Medium Term Growth Expectations 1992/3 –2005/6 2002/3 -2006/7 2007/8 - 2011 /12
“Optimist” “Pessimist”
GDP %
6.4
7.2 *
8 – 10
6.5 – 7.0
GDP per capita (%)
4.4
5.5
6.5 – 8.5
5 – 5.5
* Assuming Reserve Bank projection of 8.0 percent GDP growth for 2006/7
Perhaps the most noteworthy point is that medium-term growth expectations for
India are so buoyant that the range between optimists and pessimists is placed so high,
within a fairly narrow band of about 7 to 9 percent. Only time will tell who is closer to
being right.
24

REFERENCES Acharya Shankar (2002a): “Macroeconomic Management in the Nineties,” Economic and
Political Weekly, April 20; reprinted in Acharya (2006a). _____(2002b): “Managing India’s External Economic Challenges in the 1990s”, in M. S.
Ahluwalia, Y.V. Reddy and S. S. Tarapore (eds) Macroeconomics and Monetary Policy, Oxford University Press, New Delhi.
_____(2003): India’s Economy: Some Issues and Answers, Academic Foundation, New Delhi. _____(2004): “India’s Growth Prospects, Revisited”, Economic and Political Weekly, October 9;
reprinted in Acharya (2006a) _____(2006a): Essays on Macro Economic Policy and Growth in India, Oxford University Press,
New Delhi. _____(2006b): “Economic Growth: Some Reflections”, Economic and Political Weekly,
November 4. _____(2006c): “Economic Policy: Mid-Term Report”, Business Standard, August 22, New Delhi. Acharya, Shankar, Isher Ahluwalia, K. L. Krishna and Ila Patnaik (2003): “India: Economic Growth, 1950-2000”, mimeo, Indian Council for Research on
International Economic Relations; abridged version in Parikh (2006). Aggarwal, Pawan (2006): “Higher Education in India: The Need for Change”, ICRIER Working
Paper No. 180, June. Ahluwalia, Montek S. (2002): “Economic Reforms in India since 1991: Has Gradualism
Worked?” Journal of Economic Perspectives 16 (3). Bhagwati, J. and P. Desai (1970): India: Planning for Industrialization, Oxford University Press,
New Delhi. Bhalla, Surjit (2007): Second Among Equals: The Middle Class Kingdoms of India and China
(forthcoming), Institute of International Economics, Washington D.C. Bosworth, B. and S. Collins (2003): “The Empirics of Growth: An Update”, Brookings Papers on
Economic Activity 2:2003, Brookings Institution Press, Washington DC. Bosworth, Barry, Susan Collins and Arvind Virmani (2007): “Sources of Growth in the Indian
Economy”, India Policy Forum 2006 (forthcoming). Business Standard (2006): BS 1000, January, New Delhi. Das, J. and J. Hammer (2004a) : “Strained Mercy: Quality of Medical Care in Delhi”, Economic
and Political Weekly February 28. _____(2004b): “Money for Nothing; The Dire Straits of Medical Practice in India”, Policy
Research Working Paper No. 3269, World Bank, Washington DC. Government of India, Planning Commission (2006): Towards Faster and More Inclusive Growth:
An Approach to the 11th Five Year Plan, New Delhi. Kelkar, Vijay (2004): “India: On the Growth Turnpike”, 2004 Narayanan Oration, Australian
National University, April, available at <http://rspas.anu.edu.au/papers/narayanan /2004oration.pdf>
Kochhar, Kalpana, Raghuram Rajan, Arvind Subramanian and Ioannis Tokatlidis (2006): “India’s Pattern of Development: What happened, What Follows,” NBER Working Paper No. 12023, Cambridge, Massachusetts.
Panagariya, Arvind (2004a): “India in the 1980s and 1990s: A Triumph of Reforms”, Economic and Political Weekly, June 19.
____(2004b) “India’s Trade Reform” in S. Bery, B. Bosworth and A. Panagariya (eds) Indian Policy Forum 2004, NCAER (New Delhi) and Brookings (Washington, DC).
____ (2006) “Transforming India”, mimeo, paper presented at Columbia University Conference “India: An Emerging Giant”, October.
Parikh Kirit (ed.), (2006): Explaining Growth in South Asia, Oxford University Press, New Delhi.
25
NCAER (2005): The Great Indian Middle Class, National Council of Applied Economic
Research, New Delhi. Pratham (2006): Annual Status of Education Report, Pratham Resource Centre, Mumbai. Reserve Bank of India (2006): Annual Report, 2005-06, Mumbai. Rodrik, Dani and Arvind Subramanian (2004): “Why India Can Grow at 7 percent a Year or
More”, Economic and Political Weekly, April 17. Sivasubramonian, S (2000): The National Income of India in the Twentieth Century, Oxford
University Press, New Delhi. Virmani, Arvind (2004): “Sources of India’s Economic Growth: Trends in Total Factor
Productivity,” ICRIER Working Paper No. 131, New Delhi. Wilson, Dominic and Roopa Purushothaman (2003): “Dreaming with BRICs: The Path to 2050,”
Goldman Sachs Global Economic Paper No. 99, at www.gs.com, October. World Bank (2005): Economic Growth in the 1990s: Learning from a Decade of Reform, World
Bank, Washington DC. ____(2006): Inclusive Growth and Service Delivery: Building on India’s Success, MacMillan
India, New Delhi.
26