indiana final project report - draft final report provides a description of the monitoring sites,...
TRANSCRIPT
5729 Lakeview Drive NE, Suite 100, Kirkland, Washington 98033 Phone: (425) 822-9008 Fax: (425) 822-9022
www.globalenergyconcepts.com
Indiana Energy Group
Tall Towers Wind Study
Final Project Report
October 2005
Prepared for:
Indiana Energy Group One North Capital, Suite 600
Indianapolis, IN 46204
Indiana Tall Towers Wind Study Final Report
Global Energy Concepts, LLC i October 2005
Table of Contents
BACKGROUND ........................................................................................................................... 1
MONITORING SITES................................................................................................................. 1 Haubstadt – Site 9001 ................................................................................................................. 1 Carthage – Site 9002................................................................................................................... 3 Goodland – Site 9003.................................................................................................................. 4 Geetinsville – Site 9004.............................................................................................................. 5 La Grange – Site 9005 ................................................................................................................ 6
ANNUAL DATA SUMMARY..................................................................................................... 7 Wind Speed Data Recovery ........................................................................................................ 7 Data Replacement ....................................................................................................................... 8 Monthly Wind Speeds................................................................................................................. 8 Diurnal Trend Analysis............................................................................................................... 9 Wind Direction.......................................................................................................................... 11 Wind Shear................................................................................................................................ 17 Turbulence Intensity ................................................................................................................. 18 Long-Term Wind Speed ........................................................................................................... 22 Wind Speed Frequency Distributions ....................................................................................... 22 Temperature .............................................................................................................................. 24 Air Density................................................................................................................................ 24
WIND MAP VALIDATION ...................................................................................................... 24
STUDY EXPERIENCE AND RECOMMENDATIONS ........................................................ 26 Tower Leasing .......................................................................................................................... 27 Equipment Operation and Maintenance.................................................................................... 27 Data Collection and Validation................................................................................................. 28 Suitability of Sites for Development......................................................................................... 28 Recommendations..................................................................................................................... 28
APPENDIX A: 50-M AND 100-M WIND SPEED AND WIND POWER MAPS
Indiana Tall Towers Wind Study Final Report
Global Energy Concepts, LLC ii October 2005
List of Figures Figure 1. Location of Monitoring Sites........................................................................................... 2 Figure 2. Haubstadt Tower – Site 9001 .......................................................................................... 3 Figure 3. Carthage Tower – Site 9002 ............................................................................................ 4 Figure 4. Goodland – Site 9003 ...................................................................................................... 5 Figure 5. Geetinsville – Site 9004................................................................................................... 6 Figure 6. La Grange – Site 9005..................................................................................................... 7 Figure 7. Upper-Level Monthly Wind Speed ................................................................................. 9 Figure 8. Diurnal Wind Speed Trend............................................................................................ 10 Figure 9. Annual Wind Rose – Site 9001 – Haubstadt ................................................................. 12 Figure 10. Annual Wind Rose – Site 9002 – Carthage................................................................. 13 Figure 11. Annual Wind Rose – Site 9003 – Goodland ............................................................... 14 Figure 12. Annual Wind Rose – Site 9004 – Geetinsville............................................................ 15 Figure 13. Annual Wind Rose – Site 9005 – La Grange .............................................................. 16 Figure 14. Upper-Level Turbulence Intensity .............................................................................. 20 Figure 15. Comparison of Diurnal Wind Characteristics ............................................................. 21
List of Tables Table 1. Data Recovery of Valid Data............................................................................................ 8 Table 2. Monthly Average Wind Speeds........................................................................................ 9 Table 3. Diurnal Upper-Level Wind Speeds (m/s) ....................................................................... 10 Table 4. Directional Data Recovery.............................................................................................. 11 Table 5. Monthly Average Wind Shear ........................................................................................ 17 Table 6. Diurnal Wind Shear ........................................................................................................ 18 Table 7. Turbulence Intensity (TI)................................................................................................ 19 Table 8. Long-Term Reference Stations....................................................................................... 22 Table 9. Wind Speed Frequency Distributions ............................................................................. 23 Table 10. Temperature Summary (°F) .......................................................................................... 24 Table 11. Air Density (kg/m3) ...................................................................................................... 24 Table 12. TrueWind’s Wind Speed Validation at 50 m................................................................ 25 Table 13. Comparison of 100-m Wind Speeds............................................................................. 25
Indiana Tall Towers Wind Study Final Report
Global Energy Concepts, LLC 2 October 2005
Acknowledgements The Indiana Energy Group extends their sincere appreciation to the owners of two of the towers that were included in the Tall Towers Wind Study. Trunkline Gas Company of Houston, Texas, the owner of the Goodland tower, allowed the State to use their tower free of charge for this study. The Indiana State Police also made arrangements for the use of their tower near Geetinsville. The Indiana Energy Group also acknowledges the contribution of TrueWind Solutions of Albany, New York. TrueWind has worked under contract with the State in preparing and validating state-of-the-art wind resource assessment maps that will facilitate wind energy development in Indiana. The final wind resource maps are included in this final project report.
Indiana Tall Towers Wind Study Final Report
Global Energy Concepts, LLC 1 October 2005
Background The Indiana Energy Group contracted with Global Energy Concepts, LLC (GEC) to conduct a Tall Towers Wind Study and to incorporate the results into wind maps for the State of Indiana. In July 2003, a site evaluation was completed and several candidate sites were selected. Leasing arrangements were made with the owners of five towers located in different areas of the state. In December 2003, wind measurement equipment was installed on the first three towers. Leasing arrangements on the last two towers were not finalized until spring 2004 and the equipment was installed in early April 2004. All of the towers were decommissioned in early April 2005 and the equipment was returned to the Indiana Energy Group for storage. This final report provides a description of the monitoring sites, presents the results of data collection and wind map validation, and presents the final Indiana wind maps.
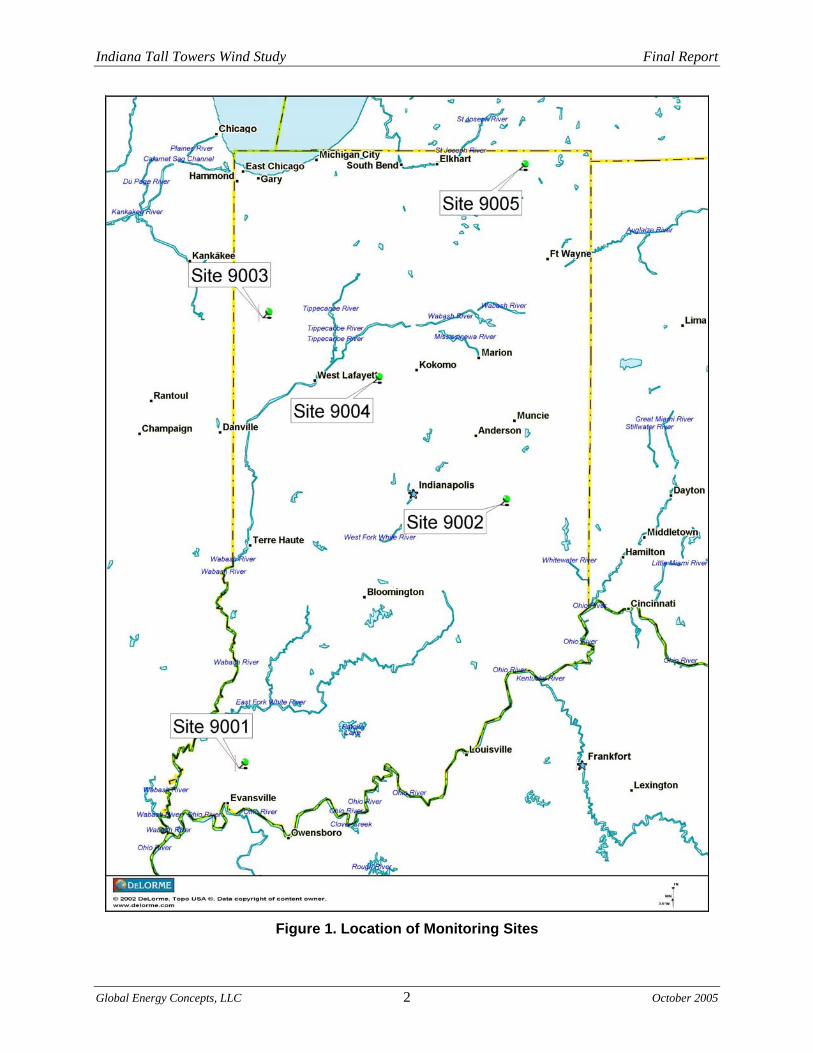
Monitoring Sites The intention of the wind study was to collect wind data at 100 m from five representative locations including at least one tower each in the southern and central portions of the state and two towers in the northern third of the state. Four of the five towers (Sites 9001, 9002, 9004, and 9005) included in the wind study are 100 m or taller. The tower (Site 9003) located in the northwest region of the state is a 90-m tower. A taller tower in that region that was appropriately exposed to the prevailing winds with a willing owner could not be identified. Sites 9001, 9002, and 9003 were installed in December 2003. Sites 9004 and 9005 were installed in early April 2004. A description of the five sites chosen for the Tall Towers Wind Study follows. Figure 1 shows the location of the five monitoring sites.
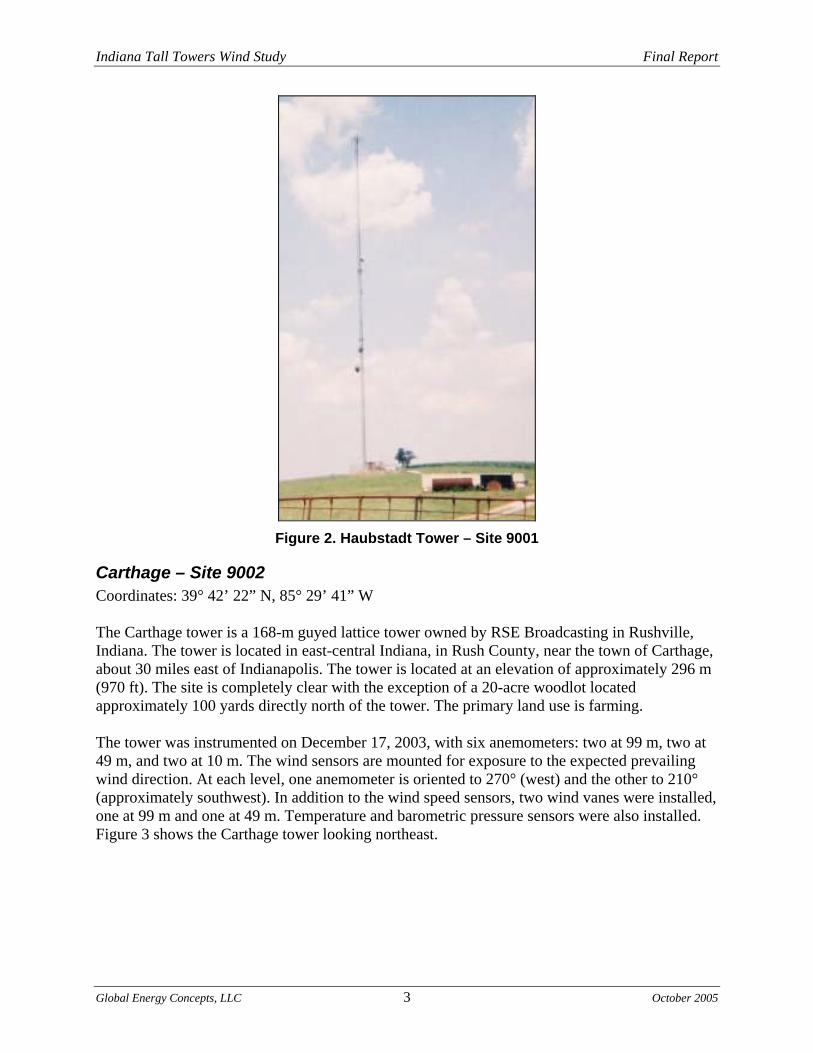
Haubstadt – Site 9001 Coordinates: 38° 10’ 45” N, 87° 29’ 13” W The Haubstadt tower is a 152-m guyed lattice tower owned by Music Ministries in Evansville, Indiana. The tower is located in southwest Indiana, in Gibson County, near the town of Haubstadt, about 15 miles north of Evansville. The tower is located at an elevation of approximately 165 m (540 ft). The site is relatively clear and currently used for farming. The tower was instrumented on December 20, 2003, with six anemometers: two at 99 m, two at 49 m, and two at 10 m. The wind sensors are mounted for exposure to the expected prevailing wind direction. At each level, one anemometer is oriented to 330° (approximately northwest) and the other to 210° (approximately southwest). In addition to the wind speed sensors, two wind vanes were installed, one at 99 m and one at 49 m. Temperature and barometric pressure sensors were also installed. Figure 2 shows the Haubstadt tower looking north.
Indiana Tall Towers Wind Study Final Report
Global Energy Concepts, LLC 2 October 2005
Figure 1. Location of Monitoring Sites
Indiana Tall Towers Wind Study Final Report
Global Energy Concepts, LLC 3 October 2005
Figure 2. Haubstadt Tower – Site 9001
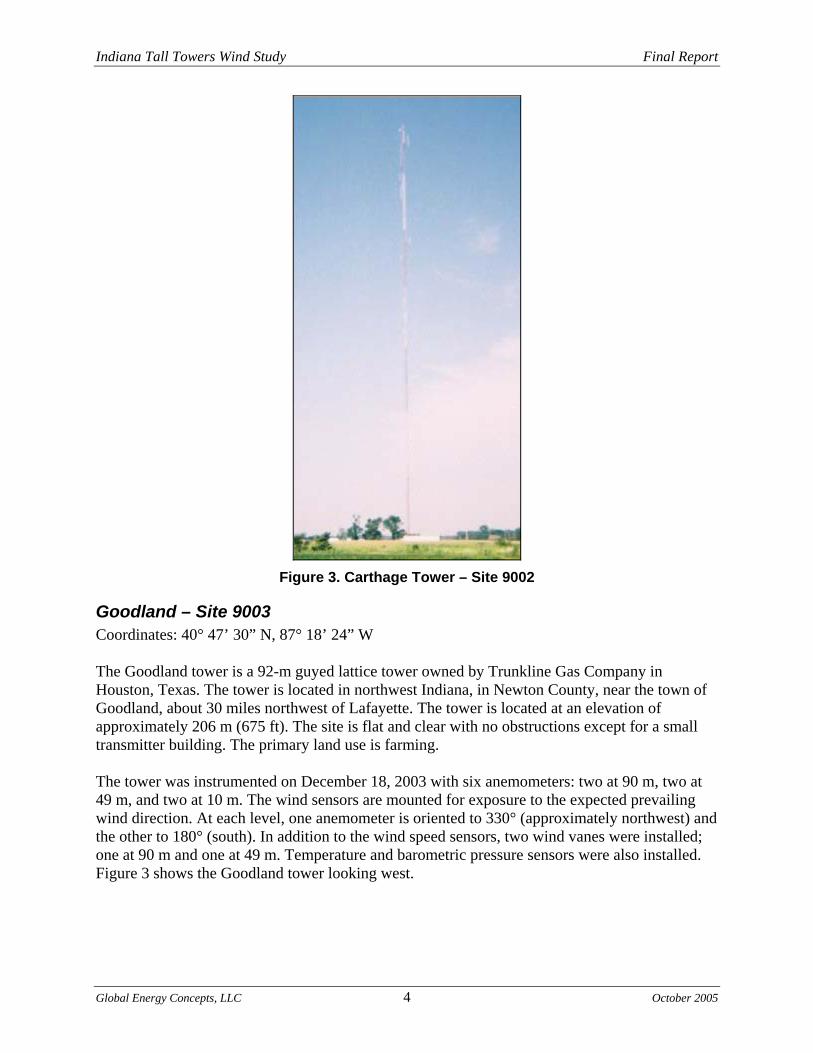
Carthage – Site 9002 Coordinates: 39° 42’ 22” N, 85° 29’ 41” W The Carthage tower is a 168-m guyed lattice tower owned by RSE Broadcasting in Rushville, Indiana. The tower is located in east-central Indiana, in Rush County, near the town of Carthage, about 30 miles east of Indianapolis. The tower is located at an elevation of approximately 296 m (970 ft). The site is completely clear with the exception of a 20-acre woodlot located approximately 100 yards directly north of the tower. The primary land use is farming. The tower was instrumented on December 17, 2003, with six anemometers: two at 99 m, two at 49 m, and two at 10 m. The wind sensors are mounted for exposure to the expected prevailing wind direction. At each level, one anemometer is oriented to 270° (west) and the other to 210° (approximately southwest). In addition to the wind speed sensors, two wind vanes were installed, one at 99 m and one at 49 m. Temperature and barometric pressure sensors were also installed. Figure 3 shows the Carthage tower looking northeast.
Indiana Tall Towers Wind Study Final Report
Global Energy Concepts, LLC 4 October 2005
Figure 3. Carthage Tower – Site 9002
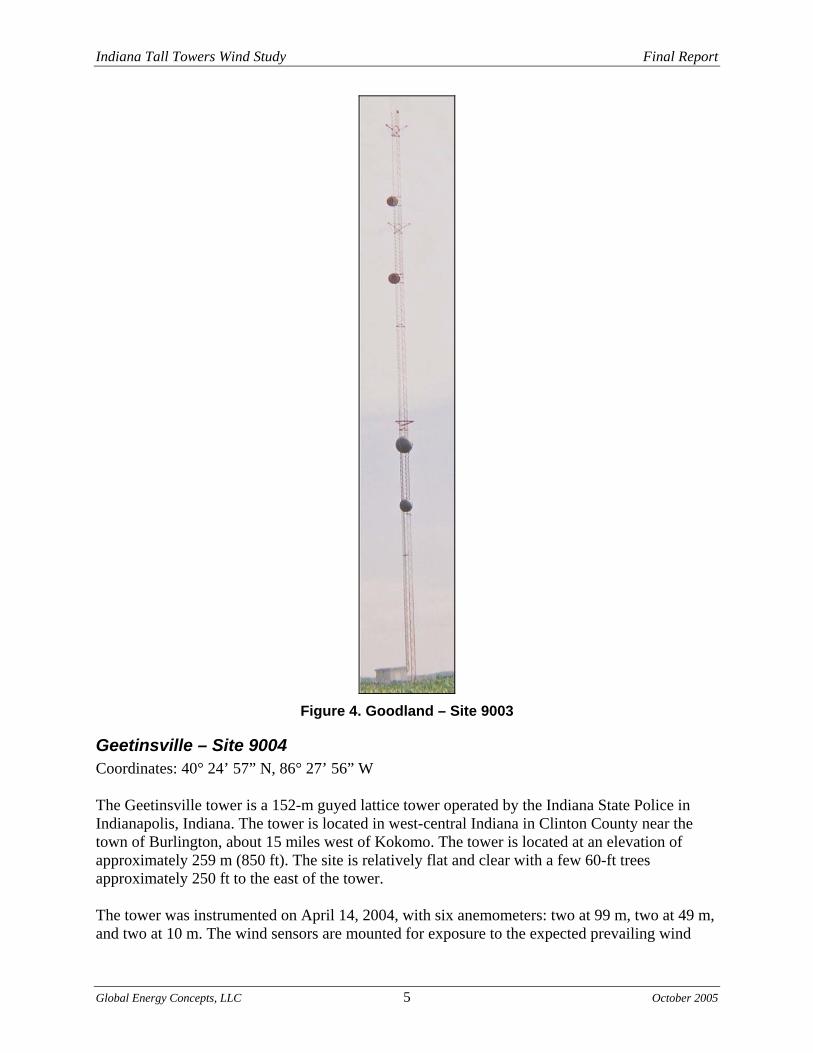
Goodland – Site 9003 Coordinates: 40° 47’ 30” N, 87° 18’ 24” W The Goodland tower is a 92-m guyed lattice tower owned by Trunkline Gas Company in Houston, Texas. The tower is located in northwest Indiana, in Newton County, near the town of Goodland, about 30 miles northwest of Lafayette. The tower is located at an elevation of approximately 206 m (675 ft). The site is flat and clear with no obstructions except for a small transmitter building. The primary land use is farming. The tower was instrumented on December 18, 2003 with six anemometers: two at 90 m, two at 49 m, and two at 10 m. The wind sensors are mounted for exposure to the expected prevailing wind direction. At each level, one anemometer is oriented to 330° (approximately northwest) and the other to 180° (south). In addition to the wind speed sensors, two wind vanes were installed; one at 90 m and one at 49 m. Temperature and barometric pressure sensors were also installed. Figure 3 shows the Goodland tower looking west.
Indiana Tall Towers Wind Study Final Report
Global Energy Concepts, LLC 5 October 2005
Figure 4. Goodland – Site 9003
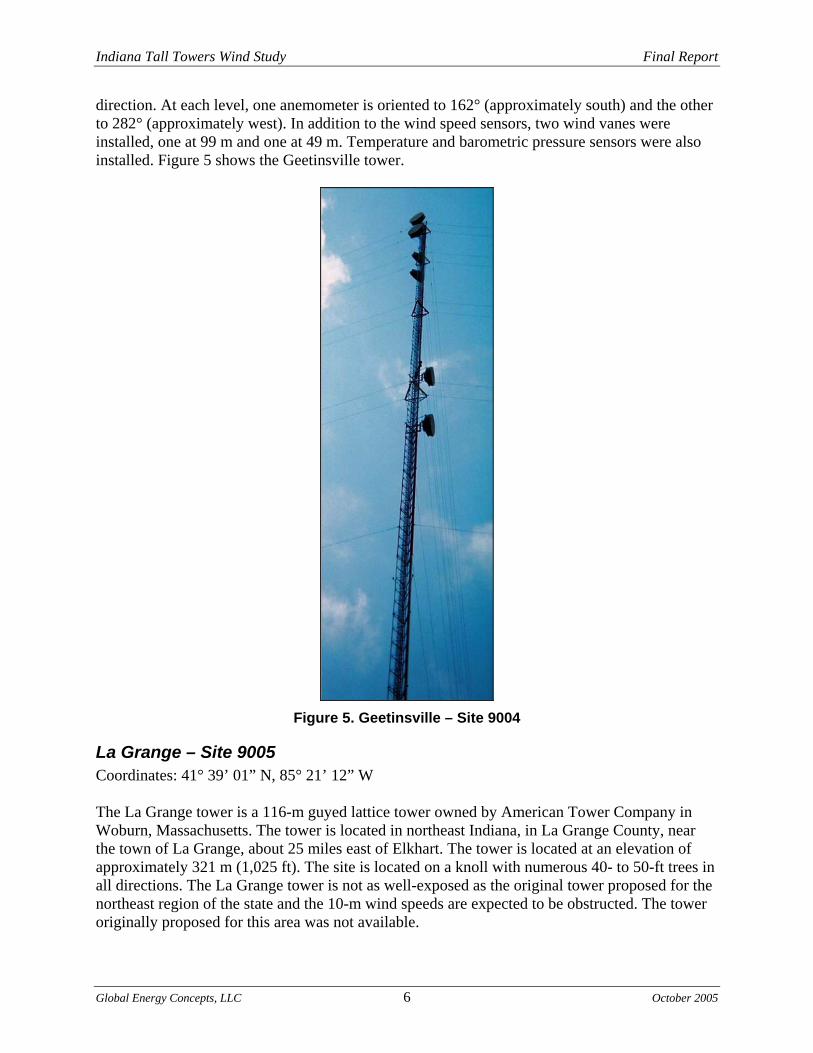
Geetinsville – Site 9004 Coordinates: 40° 24’ 57” N, 86° 27’ 56” W The Geetinsville tower is a 152-m guyed lattice tower operated by the Indiana State Police in Indianapolis, Indiana. The tower is located in west-central Indiana in Clinton County near the town of Burlington, about 15 miles west of Kokomo. The tower is located at an elevation of approximately 259 m (850 ft). The site is relatively flat and clear with a few 60-ft trees approximately 250 ft to the east of the tower. The tower was instrumented on April 14, 2004, with six anemometers: two at 99 m, two at 49 m, and two at 10 m. The wind sensors are mounted for exposure to the expected prevailing wind
Indiana Tall Towers Wind Study Final Report
Global Energy Concepts, LLC 6 October 2005
direction. At each level, one anemometer is oriented to 162° (approximately south) and the other to 282° (approximately west). In addition to the wind speed sensors, two wind vanes were installed, one at 99 m and one at 49 m. Temperature and barometric pressure sensors were also installed. Figure 5 shows the Geetinsville tower.
Figure 5. Geetinsville – Site 9004
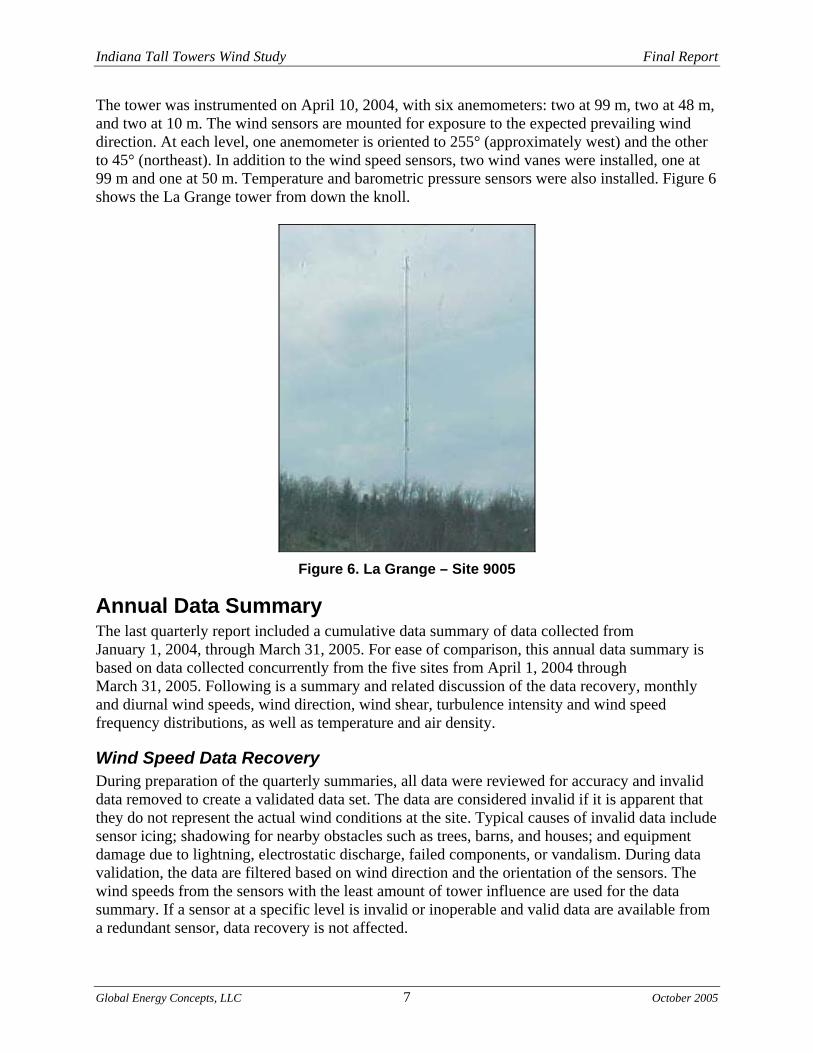
La Grange – Site 9005 Coordinates: 41° 39’ 01” N, 85° 21’ 12” W The La Grange tower is a 116-m guyed lattice tower owned by American Tower Company in Woburn, Massachusetts. The tower is located in northeast Indiana, in La Grange County, near the town of La Grange, about 25 miles east of Elkhart. The tower is located at an elevation of approximately 321 m (1,025 ft). The site is located on a knoll with numerous 40- to 50-ft trees in all directions. The La Grange tower is not as well-exposed as the original tower proposed for the northeast region of the state and the 10-m wind speeds are expected to be obstructed. The tower originally proposed for this area was not available.
Indiana Tall Towers Wind Study Final Report
Global Energy Concepts, LLC 7 October 2005
The tower was instrumented on April 10, 2004, with six anemometers: two at 99 m, two at 48 m, and two at 10 m. The wind sensors are mounted for exposure to the expected prevailing wind direction. At each level, one anemometer is oriented to 255° (approximately west) and the other to 45° (northeast). In addition to the wind speed sensors, two wind vanes were installed, one at 99 m and one at 50 m. Temperature and barometric pressure sensors were also installed. Figure 6 shows the La Grange tower from down the knoll.
Figure 6. La Grange – Site 9005
Annual Data Summary The last quarterly report included a cumulative data summary of data collected from January 1, 2004, through March 31, 2005. For ease of comparison, this annual data summary is based on data collected concurrently from the five sites from April 1, 2004 through March 31, 2005. Following is a summary and related discussion of the data recovery, monthly and diurnal wind speeds, wind direction, wind shear, turbulence intensity and wind speed frequency distributions, as well as temperature and air density.
Wind Speed Data Recovery During preparation of the quarterly summaries, all data were reviewed for accuracy and invalid data removed to create a validated data set. The data are considered invalid if it is apparent that they do not represent the actual wind conditions at the site. Typical causes of invalid data include sensor icing; shadowing for nearby obstacles such as trees, barns, and houses; and equipment damage due to lightning, electrostatic discharge, failed components, or vandalism. During data validation, the data are filtered based on wind direction and the orientation of the sensors. The wind speeds from the sensors with the least amount of tower influence are used for the data summary. If a sensor at a specific level is invalid or inoperable and valid data are available from a redundant sensor, data recovery is not affected.
Indiana Tall Towers Wind Study Final Report
Global Energy Concepts, LLC 8 October 2005
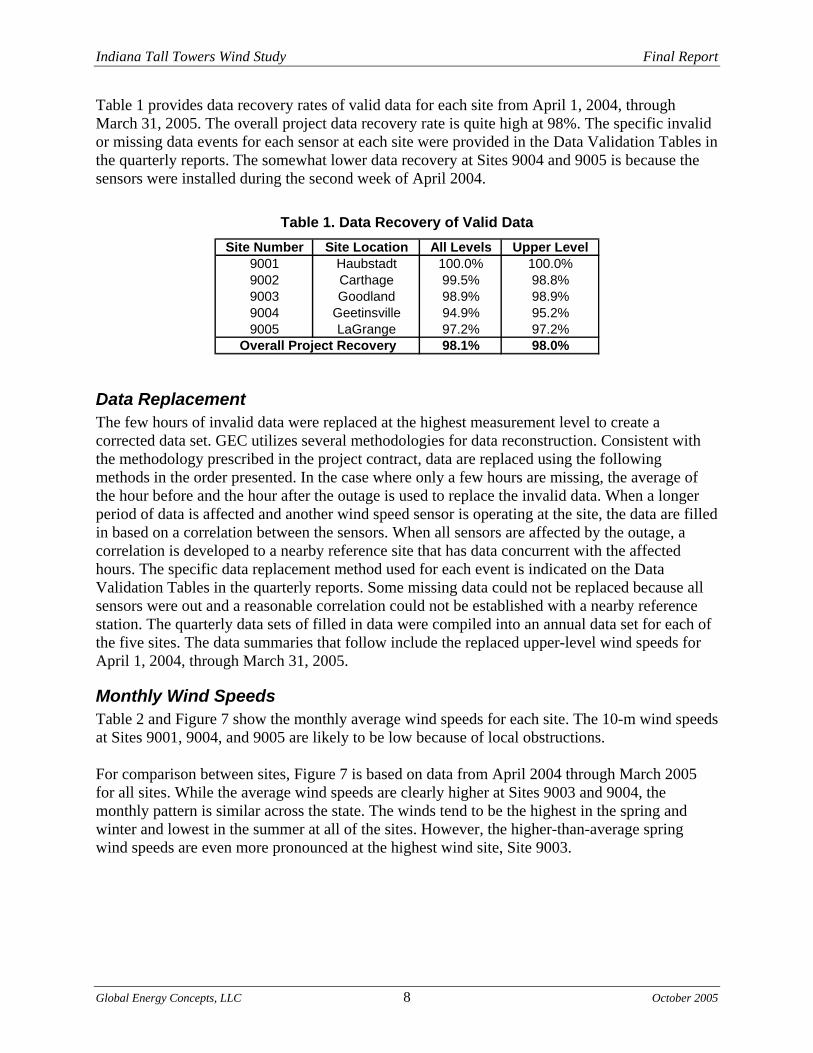
Table 1 provides data recovery rates of valid data for each site from April 1, 2004, through March 31, 2005. The overall project data recovery rate is quite high at 98%. The specific invalid or missing data events for each sensor at each site were provided in the Data Validation Tables in the quarterly reports. The somewhat lower data recovery at Sites 9004 and 9005 is because the sensors were installed during the second week of April 2004.
Table 1. Data Recovery of Valid Data Site Number Site Location All Levels Upper Level
9001 Haubstadt 100.0% 100.0%9002 Carthage 99.5% 98.8%9003 Goodland 98.9% 98.9%9004 Geetinsville 94.9% 95.2%9005 LaGrange 97.2% 97.2%
98.1% 98.0%Overall Project Recovery
Data Replacement The few hours of invalid data were replaced at the highest measurement level to create a corrected data set. GEC utilizes several methodologies for data reconstruction. Consistent with the methodology prescribed in the project contract, data are replaced using the following methods in the order presented. In the case where only a few hours are missing, the average of the hour before and the hour after the outage is used to replace the invalid data. When a longer period of data is affected and another wind speed sensor is operating at the site, the data are filled in based on a correlation between the sensors. When all sensors are affected by the outage, a correlation is developed to a nearby reference site that has data concurrent with the affected hours. The specific data replacement method used for each event is indicated on the Data Validation Tables in the quarterly reports. Some missing data could not be replaced because all sensors were out and a reasonable correlation could not be established with a nearby reference station. The quarterly data sets of filled in data were compiled into an annual data set for each of the five sites. The data summaries that follow include the replaced upper-level wind speeds for April 1, 2004, through March 31, 2005.
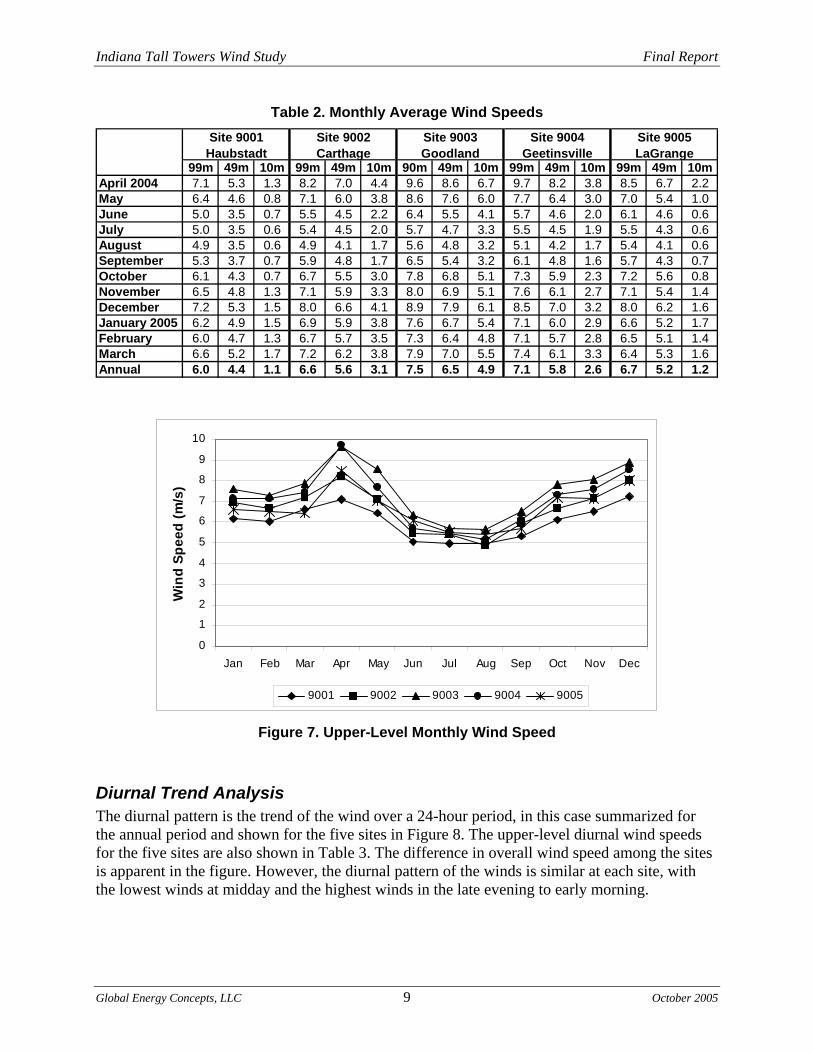
Monthly Wind Speeds Table 2 and Figure 7 show the monthly average wind speeds for each site. The 10-m wind speeds at Sites 9001, 9004, and 9005 are likely to be low because of local obstructions. For comparison between sites, Figure 7 is based on data from April 2004 through March 2005 for all sites. While the average wind speeds are clearly higher at Sites 9003 and 9004, the monthly pattern is similar across the state. The winds tend to be the highest in the spring and winter and lowest in the summer at all of the sites. However, the higher-than-average spring wind speeds are even more pronounced at the highest wind site, Site 9003.
Indiana Tall Towers Wind Study Final Report
Global Energy Concepts, LLC 9 October 2005
Table 2. Monthly Average Wind Speeds
99m 49m 10m 99m 49m 10m 90m 49m 10m 99m 49m 10m 99m 49m 10mApril 2004 7.1 5.3 1.3 8.2 7.0 4.4 9.6 8.6 6.7 9.7 8.2 3.8 8.5 6.7 2.2May 6.4 4.6 0.8 7.1 6.0 3.8 8.6 7.6 6.0 7.7 6.4 3.0 7.0 5.4 1.0June 5.0 3.5 0.7 5.5 4.5 2.2 6.4 5.5 4.1 5.7 4.6 2.0 6.1 4.6 0.6July 5.0 3.5 0.6 5.4 4.5 2.0 5.7 4.7 3.3 5.5 4.5 1.9 5.5 4.3 0.6August 4.9 3.5 0.6 4.9 4.1 1.7 5.6 4.8 3.2 5.1 4.2 1.7 5.4 4.1 0.6September 5.3 3.7 0.7 5.9 4.8 1.7 6.5 5.4 3.2 6.1 4.8 1.6 5.7 4.3 0.7October 6.1 4.3 0.7 6.7 5.5 3.0 7.8 6.8 5.1 7.3 5.9 2.3 7.2 5.6 0.8November 6.5 4.8 1.3 7.1 5.9 3.3 8.0 6.9 5.1 7.6 6.1 2.7 7.1 5.4 1.4December 7.2 5.3 1.5 8.0 6.6 4.1 8.9 7.9 6.1 8.5 7.0 3.2 8.0 6.2 1.6January 2005 6.2 4.9 1.5 6.9 5.9 3.8 7.6 6.7 5.4 7.1 6.0 2.9 6.6 5.2 1.7February 6.0 4.7 1.3 6.7 5.7 3.5 7.3 6.4 4.8 7.1 5.7 2.8 6.5 5.1 1.4March 6.6 5.2 1.7 7.2 6.2 3.8 7.9 7.0 5.5 7.4 6.1 3.3 6.4 5.3 1.6Annual 6.0 4.4 1.1 6.6 5.6 3.1 7.5 6.5 4.9 7.1 5.8 2.6 6.7 5.2 1.2
Site 9003 Goodland
Site 9001 Haubstadt
Site 9005 LaGrange
Site 9004 Geetinsville
Site 9002 Carthage
0
1
2
3
4
5
6
7
8
9
10
Jan Feb Mar Apr May Jun Jul Aug Sep Oct Nov Dec
Win
d Sp
eed
(m/s
)
9001 9002 9003 9004 9005
Figure 7. Upper-Level Monthly Wind Speed
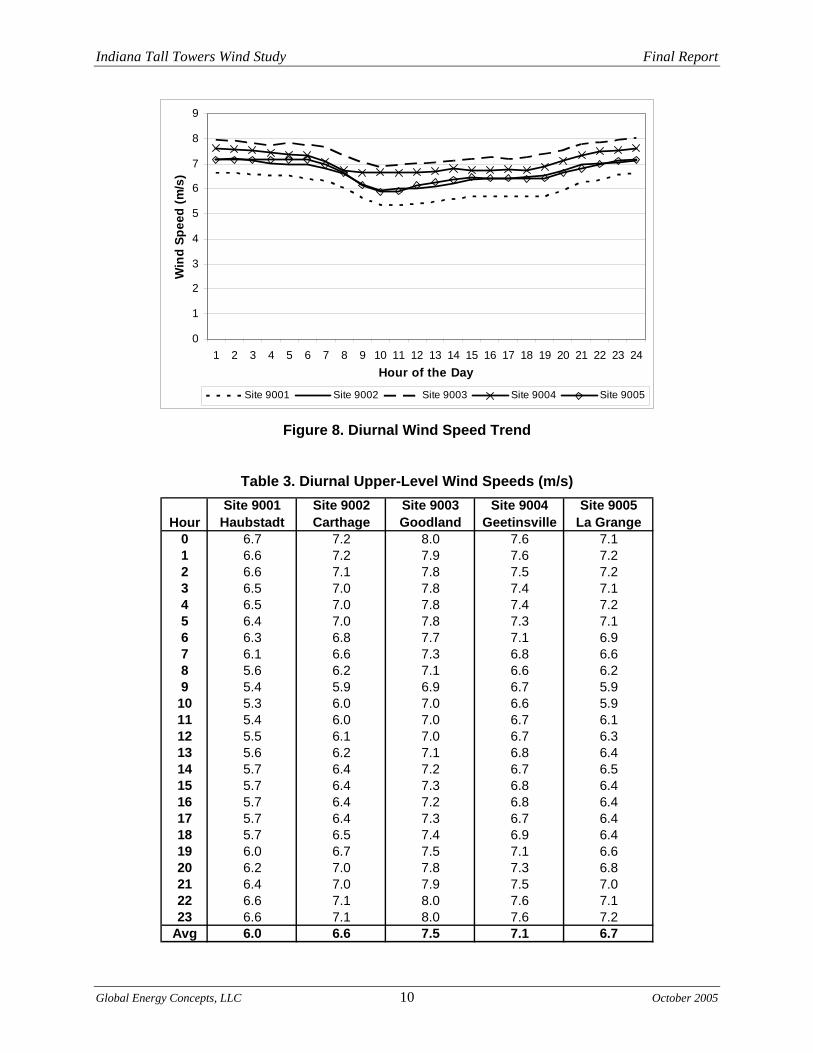
Diurnal Trend Analysis The diurnal pattern is the trend of the wind over a 24-hour period, in this case summarized for the annual period and shown for the five sites in Figure 8. The upper-level diurnal wind speeds for the five sites are also shown in Table 3. The difference in overall wind speed among the sites is apparent in the figure. However, the diurnal pattern of the winds is similar at each site, with the lowest winds at midday and the highest winds in the late evening to early morning.
Indiana Tall Towers Wind Study Final Report
Global Energy Concepts, LLC 10 October 2005
0
1
2
3
4
5
6
7
8
9
1 2 3 4 5 6 7 8 9 10 11 12 13 14 15 16 17 18 19 20 21 22 23 24Hour of the Day
Win
d Sp
eed
(m/s
)
Site 9001 Site 9002 Site 9003 Site 9004 Site 9005
Figure 8. Diurnal Wind Speed Trend
Table 3. Diurnal Upper-Level Wind Speeds (m/s)
HourSite 9001
HaubstadtSite 9002 Carthage
Site 9003 Goodland
Site 9004 Geetinsville
Site 9005 La Grange
0 6.7 7.2 8.0 7.6 7.11 6.6 7.2 7.9 7.6 7.22 6.6 7.1 7.8 7.5 7.23 6.5 7.0 7.8 7.4 7.14 6.5 7.0 7.8 7.4 7.25 6.4 7.0 7.8 7.3 7.16 6.3 6.8 7.7 7.1 6.97 6.1 6.6 7.3 6.8 6.68 5.6 6.2 7.1 6.6 6.29 5.4 5.9 6.9 6.7 5.910 5.3 6.0 7.0 6.6 5.911 5.4 6.0 7.0 6.7 6.112 5.5 6.1 7.0 6.7 6.313 5.6 6.2 7.1 6.8 6.414 5.7 6.4 7.2 6.7 6.515 5.7 6.4 7.3 6.8 6.416 5.7 6.4 7.2 6.8 6.417 5.7 6.4 7.3 6.7 6.418 5.7 6.5 7.4 6.9 6.419 6.0 6.7 7.5 7.1 6.620 6.2 7.0 7.8 7.3 6.821 6.4 7.0 7.9 7.5 7.022 6.6 7.1 8.0 7.6 7.123 6.6 7.1 8.0 7.6 7.2
Avg 6.0 6.6 7.5 7.1 6.7

Indiana Tall Towers Wind Study Final Report
Global Energy Concepts, LLC 11 October 2005
Wind Direction Monthly wind rose graphs were provided in the quarterly reports for each of the five sites. In addition to wind speed data, wind direction data are required to generate a wind rose. The wind direction vanes generally freeze before the anemometers do and direction data are not replaced. Although erroneous direction data are not replaced, data can be used from either of the two vanes. Table 4 summarizes the monthly directional data recovery.
Table 4. Directional Data Recovery Site 9001 Site 9002 Site 9003 Site 9004 Site 9005
April 2004 100.0% 100.0% 100.0% 53.3% 66.7%May 100.0% 100.0% 100.0% 100.0% 100.0%June 100.0% 99.9% 100.0% 100.0% 99.7%July 100.0% 100.0% 100.0% 100.0% 100.0%August 81.2% 100.0% 100.0% 100.0% 100.0%September 65.0% 100.0% 100.0% 100.0% 100.0%October 100.0% 100.0% 100.0% 100.0% 100.0%November 100.0% 100.0% 100.0% 100.0% 100.0%December 100.0% 100.0% 100.0% 100.0% 100.0%January 2005 97.6% 90.3% 87.0% 75.8% 94.4%February 97.8% 98.7% 98.4% 96.3% 90.0%March 100.0% 99.1% 100.0% 100.0% 99.3%Annual 95.5% 96.7% 98.3% 93.8% 95.9%
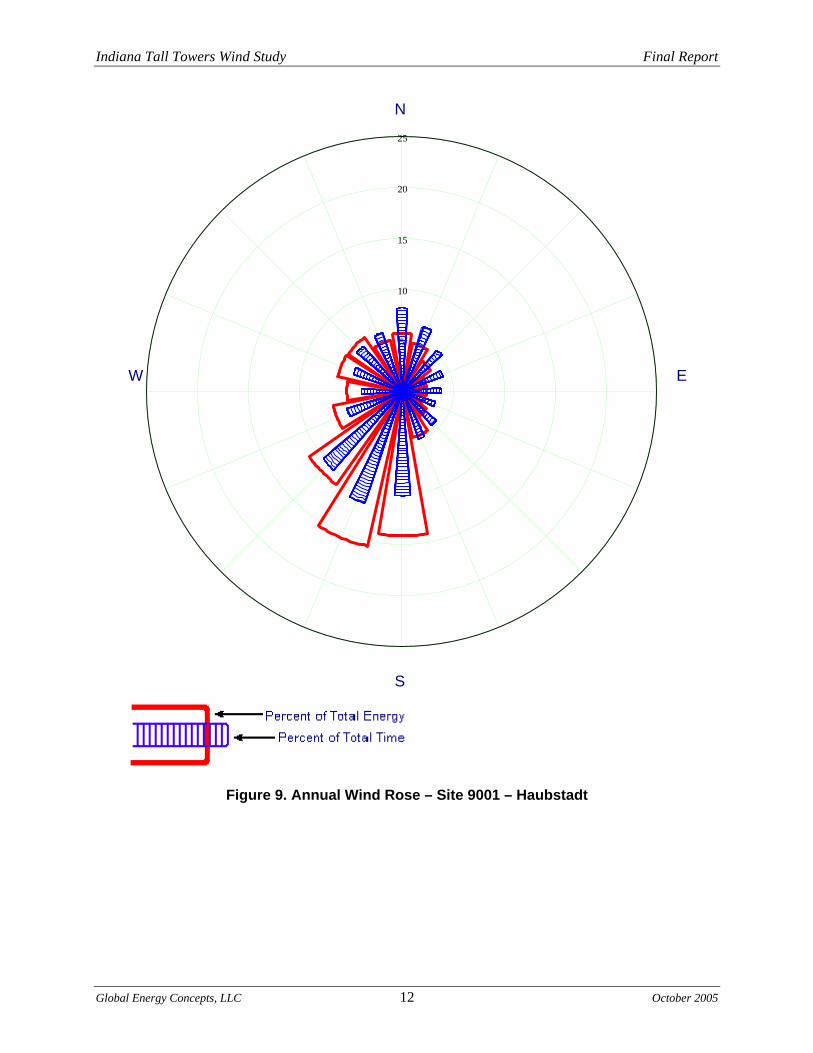
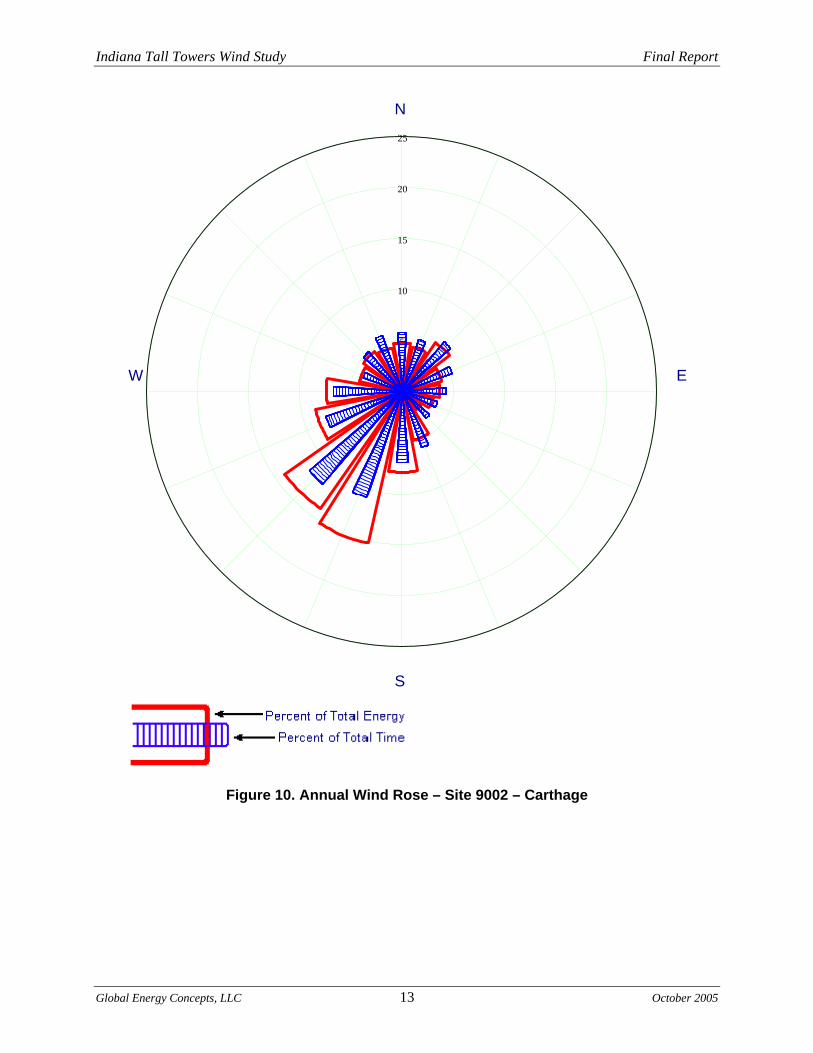
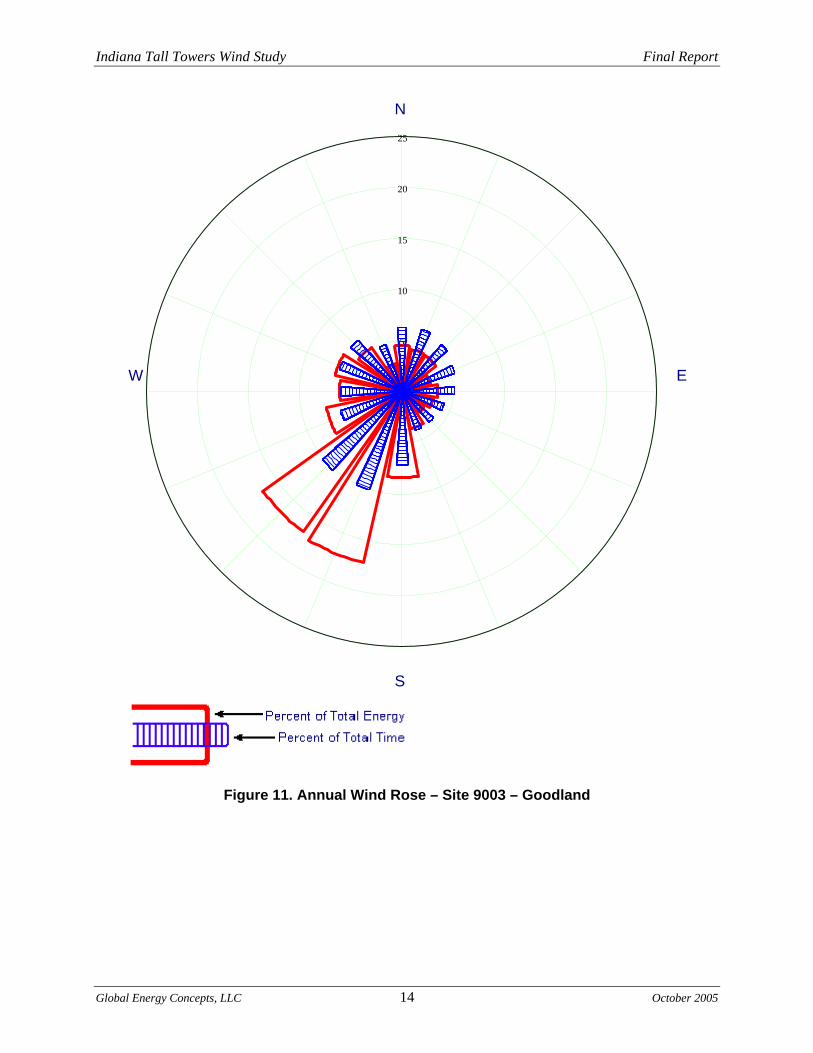
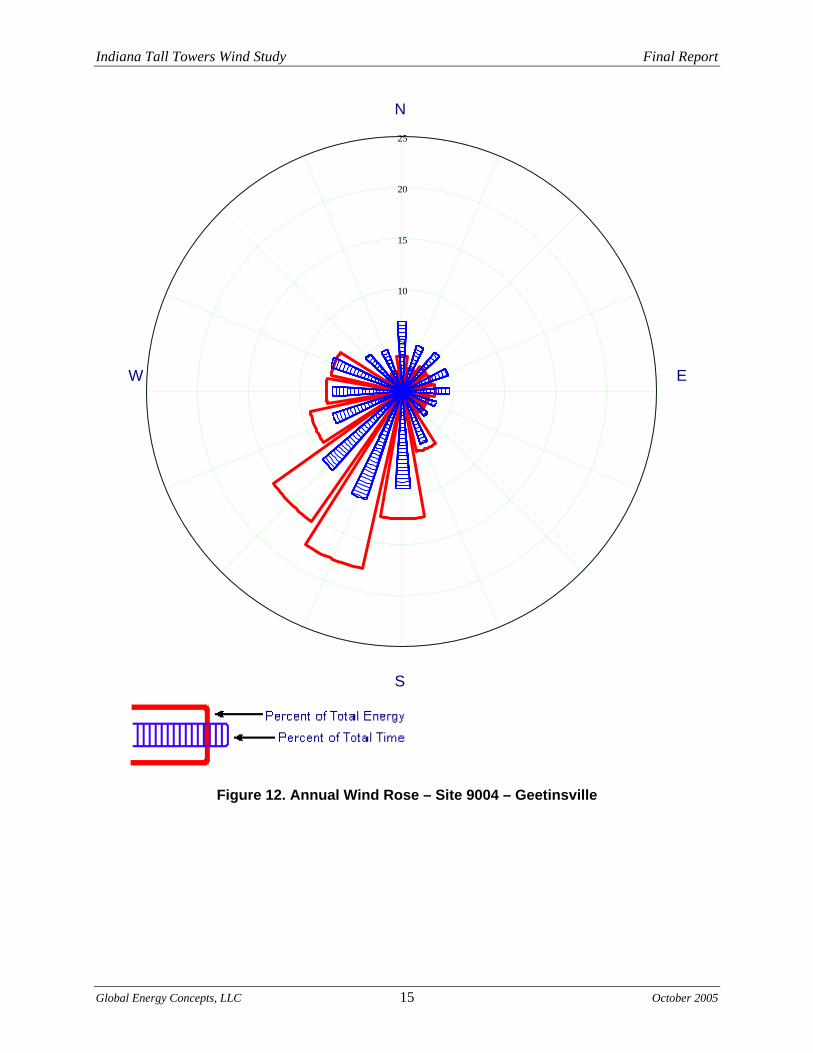
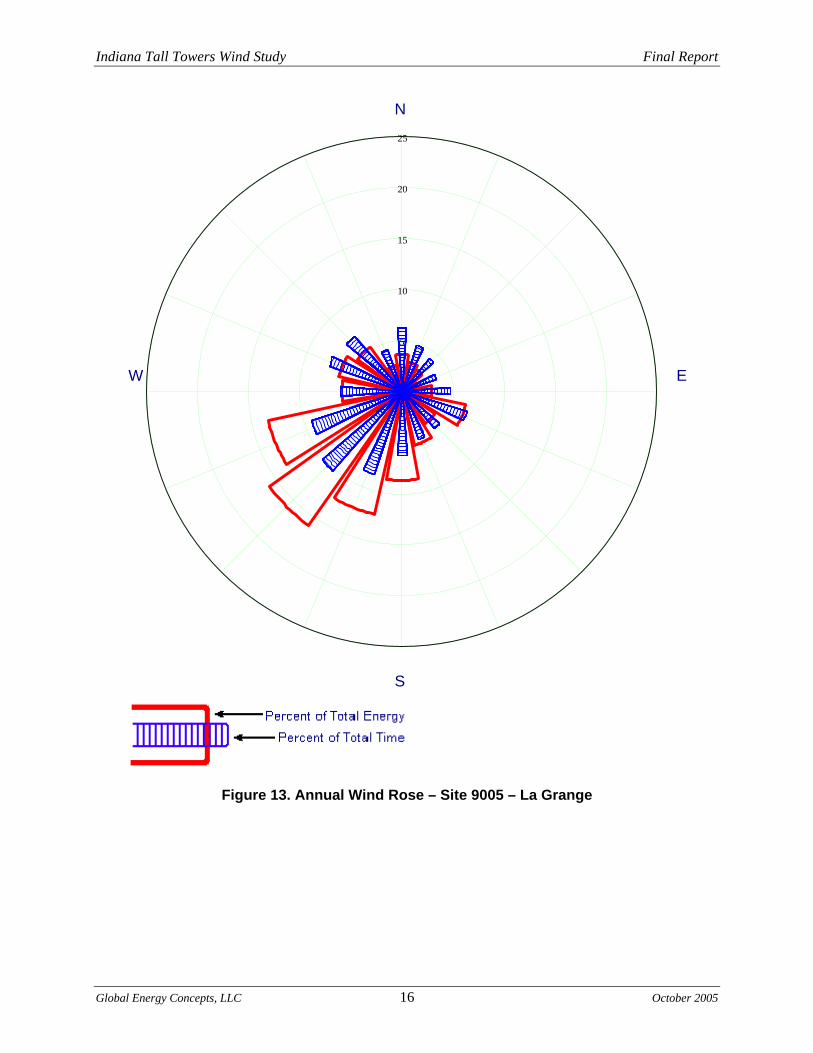
The validated hourly wind directions and validated wind speeds were used to generate annual wind roses for each site and are included as Figures 9 through 13. A review of the monthly wind roses indicates that there are some light variable winds during several months of the year. However, as shown in the annual wind roses, the predominate energy-producing winds are from the south to southwest at all of the sites.
Indiana Tall Towers Wind Study Final Report
Global Energy Concepts, LLC 12 October 2005
N
25
20
15
10
5
0W E
S
Figure 9. Annual Wind Rose – Site 9001 – Haubstadt
Indiana Tall Towers Wind Study Final Report
Global Energy Concepts, LLC 13 October 2005
N
25
20
15
10
5
0W E
S
Figure 10. Annual Wind Rose – Site 9002 – Carthage
Indiana Tall Towers Wind Study Final Report
Global Energy Concepts, LLC 14 October 2005
N
25
20
15
10
5
0W E
S
Figure 11. Annual Wind Rose – Site 9003 – Goodland
Indiana Tall Towers Wind Study Final Report
Global Energy Concepts, LLC 15 October 2005
N
25
20
15
10
5
0W E
S
Figure 12. Annual Wind Rose – Site 9004 – Geetinsville
Indiana Tall Towers Wind Study Final Report
Global Energy Concepts, LLC 16 October 2005
N
25
20
15
10
5
0W E
S
Figure 13. Annual Wind Rose – Site 9005 – La Grange
Indiana Tall Towers Wind Study Final Report
Global Energy Concepts, LLC 17 October 2005
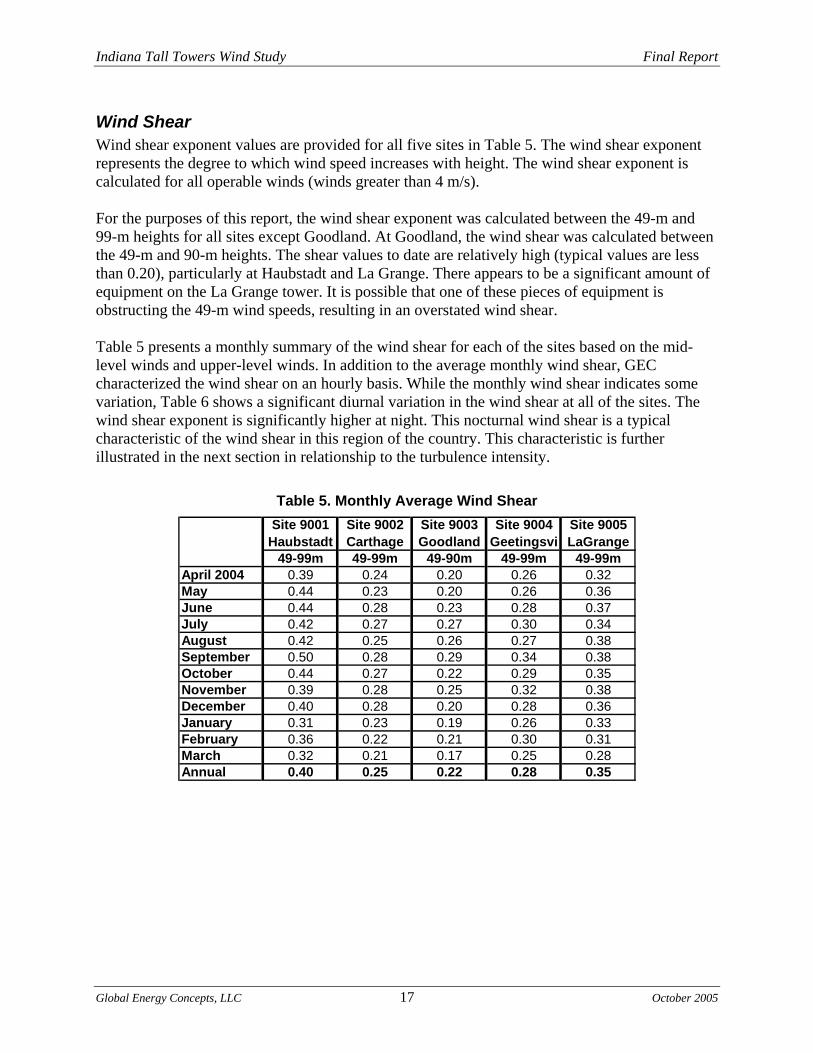
Wind Shear Wind shear exponent values are provided for all five sites in Table 5. The wind shear exponent represents the degree to which wind speed increases with height. The wind shear exponent is calculated for all operable winds (winds greater than 4 m/s). For the purposes of this report, the wind shear exponent was calculated between the 49-m and 99-m heights for all sites except Goodland. At Goodland, the wind shear was calculated between the 49-m and 90-m heights. The shear values to date are relatively high (typical values are less than 0.20), particularly at Haubstadt and La Grange. There appears to be a significant amount of equipment on the La Grange tower. It is possible that one of these pieces of equipment is obstructing the 49-m wind speeds, resulting in an overstated wind shear. Table 5 presents a monthly summary of the wind shear for each of the sites based on the mid-level winds and upper-level winds. In addition to the average monthly wind shear, GEC characterized the wind shear on an hourly basis. While the monthly wind shear indicates some variation, Table 6 shows a significant diurnal variation in the wind shear at all of the sites. The wind shear exponent is significantly higher at night. This nocturnal wind shear is a typical characteristic of the wind shear in this region of the country. This characteristic is further illustrated in the next section in relationship to the turbulence intensity.
Table 5. Monthly Average Wind Shear Site 9001
HaubstadtSite 9002 Carthage
Site 9003 Goodland
Site 9004 Geetingsvi
Site 9005 LaGrange
49-99m 49-99m 49-90m 49-99m 49-99mApril 2004 0.39 0.24 0.20 0.26 0.32May 0.44 0.23 0.20 0.26 0.36June 0.44 0.28 0.23 0.28 0.37July 0.42 0.27 0.27 0.30 0.34August 0.42 0.25 0.26 0.27 0.38September 0.50 0.28 0.29 0.34 0.38October 0.44 0.27 0.22 0.29 0.35November 0.39 0.28 0.25 0.32 0.38December 0.40 0.28 0.20 0.28 0.36January 0.31 0.23 0.19 0.26 0.33February 0.36 0.22 0.21 0.30 0.31March 0.32 0.21 0.17 0.25 0.28Annual 0.40 0.25 0.22 0.28 0.35
Indiana Tall Towers Wind Study Final Report
Global Energy Concepts, LLC 18 October 2005
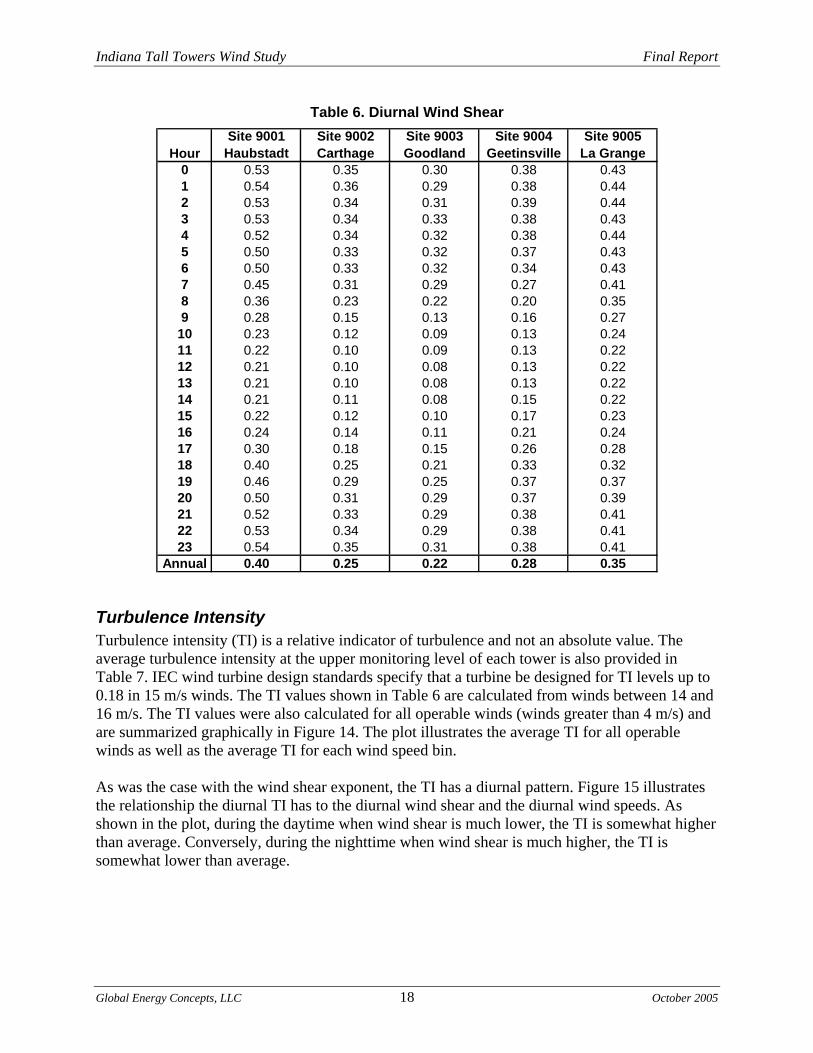
Table 6. Diurnal Wind Shear
HourSite 9001
HaubstadtSite 9002 Carthage
Site 9003 Goodland
Site 9004 Geetinsville
Site 9005 La Grange
0 0.53 0.35 0.30 0.38 0.431 0.54 0.36 0.29 0.38 0.442 0.53 0.34 0.31 0.39 0.443 0.53 0.34 0.33 0.38 0.434 0.52 0.34 0.32 0.38 0.445 0.50 0.33 0.32 0.37 0.436 0.50 0.33 0.32 0.34 0.437 0.45 0.31 0.29 0.27 0.418 0.36 0.23 0.22 0.20 0.359 0.28 0.15 0.13 0.16 0.2710 0.23 0.12 0.09 0.13 0.2411 0.22 0.10 0.09 0.13 0.2212 0.21 0.10 0.08 0.13 0.2213 0.21 0.10 0.08 0.13 0.2214 0.21 0.11 0.08 0.15 0.2215 0.22 0.12 0.10 0.17 0.2316 0.24 0.14 0.11 0.21 0.2417 0.30 0.18 0.15 0.26 0.2818 0.40 0.25 0.21 0.33 0.3219 0.46 0.29 0.25 0.37 0.3720 0.50 0.31 0.29 0.37 0.3921 0.52 0.33 0.29 0.38 0.4122 0.53 0.34 0.29 0.38 0.4123 0.54 0.35 0.31 0.38 0.41
Annual 0.40 0.25 0.22 0.28 0.35
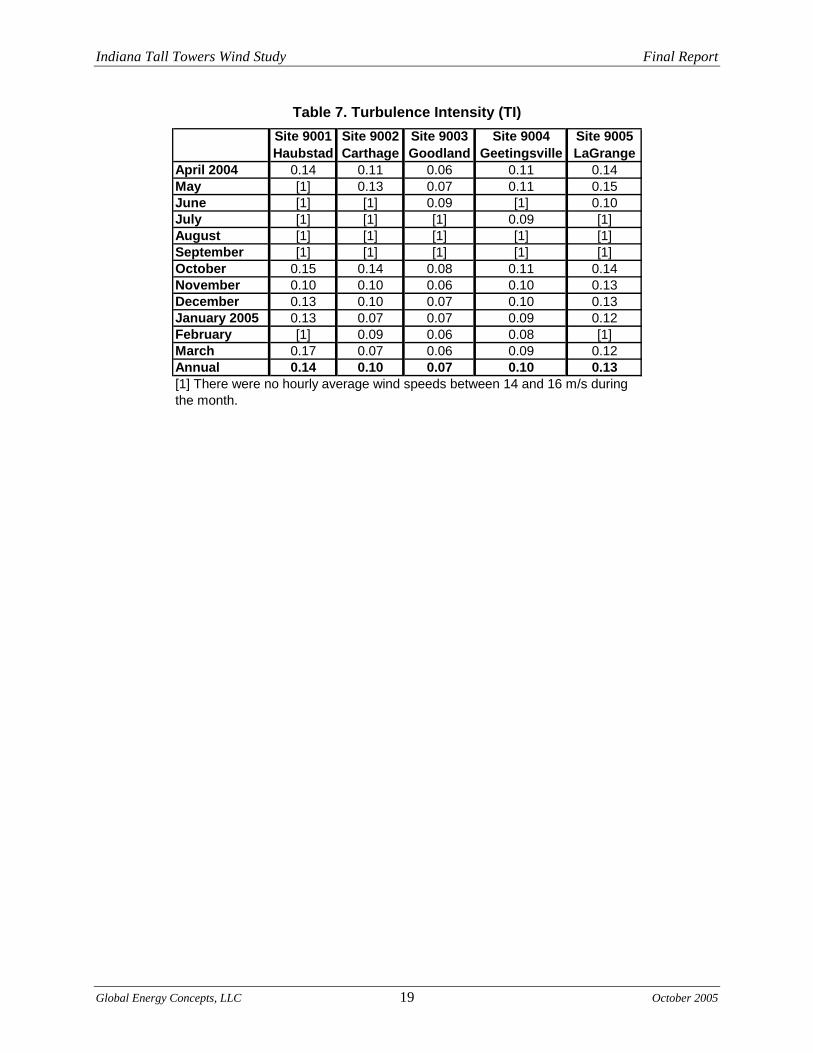
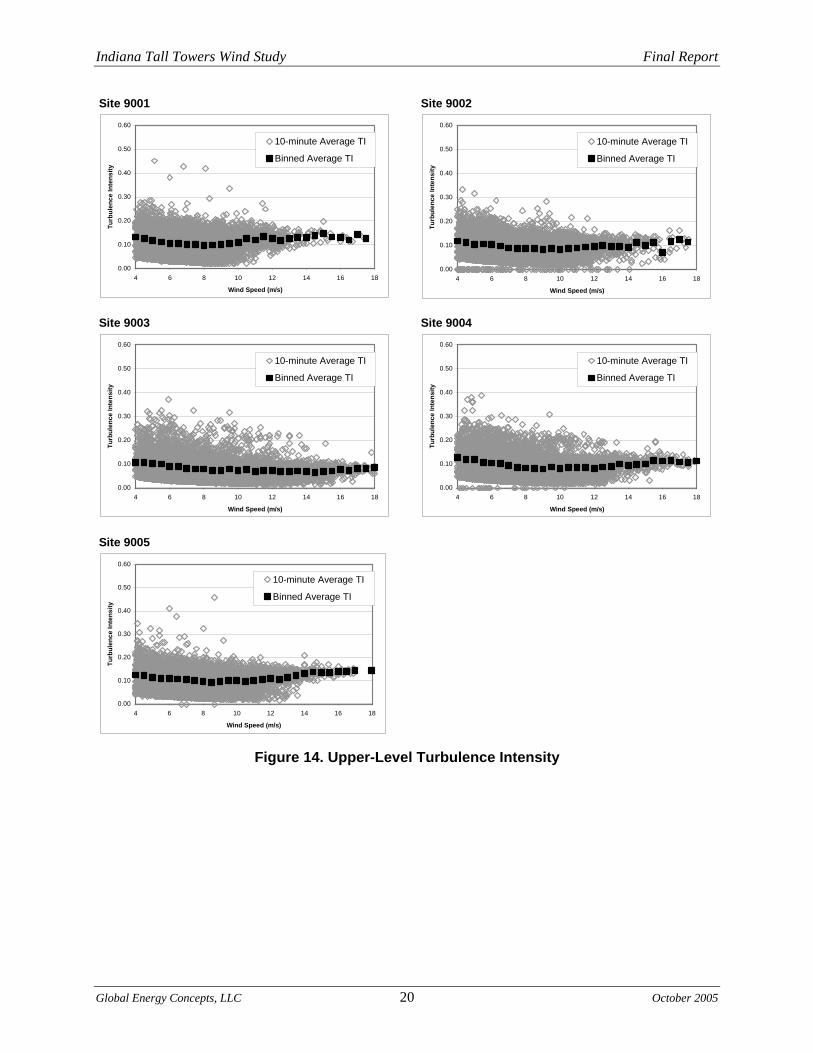
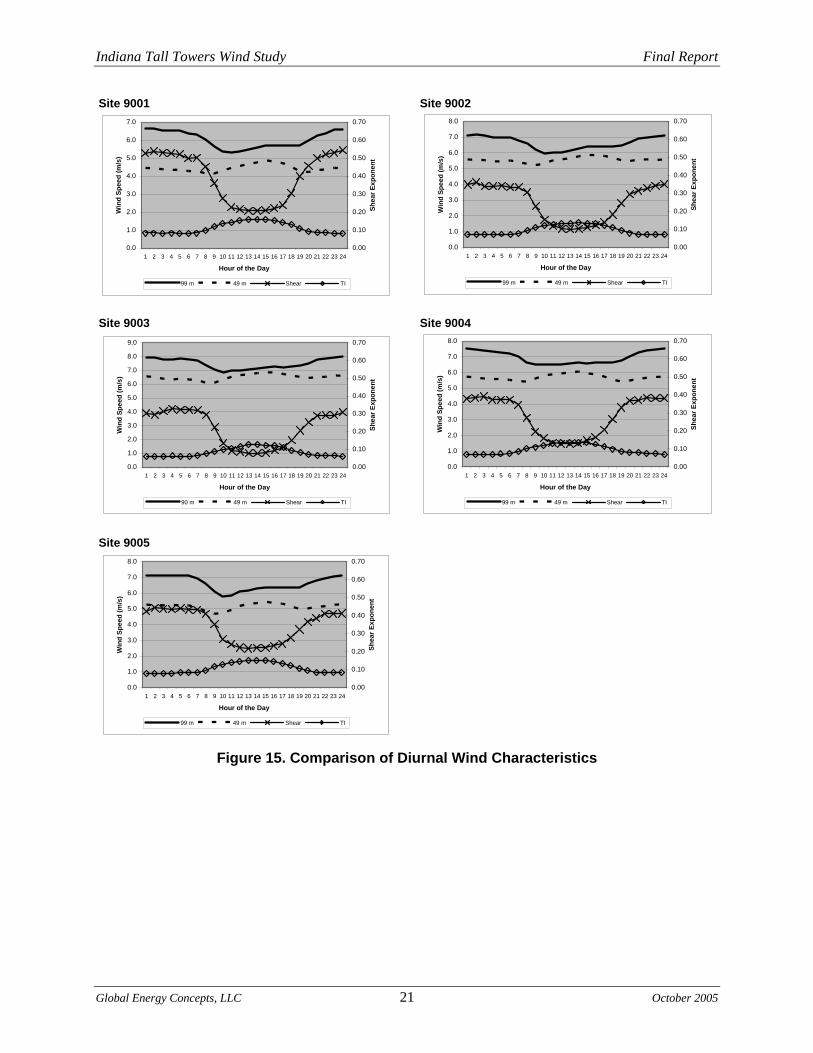
Turbulence Intensity Turbulence intensity (TI) is a relative indicator of turbulence and not an absolute value. The average turbulence intensity at the upper monitoring level of each tower is also provided in Table 7. IEC wind turbine design standards specify that a turbine be designed for TI levels up to 0.18 in 15 m/s winds. The TI values shown in Table 6 are calculated from winds between 14 and 16 m/s. The TI values were also calculated for all operable winds (winds greater than 4 m/s) and are summarized graphically in Figure 14. The plot illustrates the average TI for all operable winds as well as the average TI for each wind speed bin. As was the case with the wind shear exponent, the TI has a diurnal pattern. Figure 15 illustrates the relationship the diurnal TI has to the diurnal wind shear and the diurnal wind speeds. As shown in the plot, during the daytime when wind shear is much lower, the TI is somewhat higher than average. Conversely, during the nighttime when wind shear is much higher, the TI is somewhat lower than average.
Indiana Tall Towers Wind Study Final Report
Global Energy Concepts, LLC 19 October 2005
Table 7. Turbulence Intensity (TI) Site 9001 Haubstad
Site 9002 Carthage
Site 9003 Goodland
Site 9004 Geetingsville
Site 9005 LaGrange
April 2004 0.14 0.11 0.06 0.11 0.14May [1] 0.13 0.07 0.11 0.15June [1] [1] 0.09 [1] 0.10July [1] [1] [1] 0.09 [1]August [1] [1] [1] [1] [1]September [1] [1] [1] [1] [1]October 0.15 0.14 0.08 0.11 0.14November 0.10 0.10 0.06 0.10 0.13December 0.13 0.10 0.07 0.10 0.13January 2005 0.13 0.07 0.07 0.09 0.12February [1] 0.09 0.06 0.08 [1]March 0.17 0.07 0.06 0.09 0.12Annual 0.14 0.10 0.07 0.10 0.13[1] There were no hourly average wind speeds between 14 and 16 m/s during the month.
Indiana Tall Towers Wind Study Final Report
Global Energy Concepts, LLC 20 October 2005
Site 9001 Site 9002
Site 9003 Site 9004
Site 9005
0.00
0.10
0.20
0.30
0.40
0.50
0.60
4 6 8 10 12 14 16 18
Wind Speed (m/s)
Turb
ulen
ce In
tens
ity
10-minute Average TI
Binned Average TI
0.00
0.10
0.20
0.30
0.40
0.50
0.60
4 6 8 10 12 14 16 18
Wind Speed (m/s)
Turb
ulen
ce In
tens
ity
10-minute Average TI
Binned Average TI
0.00
0.10
0.20
0.30
0.40
0.50
0.60
4 6 8 10 12 14 16 18
Wind Speed (m/s)
Turb
ulen
ce In
tens
ity
10-minute Average TI
Binned Average TI
0.00
0.10
0.20
0.30
0.40
0.50
0.60
4 6 8 10 12 14 16 18
Wind Speed (m/s)
Turb
ulen
ce In
tens
ity
10-minute Average TI
Binned Average TI
0.00
0.10
0.20
0.30
0.40
0.50
0.60
4 6 8 10 12 14 16 18
Wind Speed (m/s)
Turb
ulen
ce In
tens
ity
10-minute Average TI
Binned Average TI
Figure 14. Upper-Level Turbulence Intensity
Indiana Tall Towers Wind Study Final Report
Global Energy Concepts, LLC 21 October 2005
Site 9001 Site 9002
Site 9003 Site 9004
Site 9005
0.0
1.0
2.0
3.0
4.0
5.0
6.0
7.0
1 2 3 4 5 6 7 8 9 10 11 12 13 14 15 16 17 18 19 20 21 22 23 24
Hour of the Day
Win
d Sp
eed
(m/s
)
0.00
0.10
0.20
0.30
0.40
0.50
0.60
0.70
Shea
r Exp
onen
t
99 m 49 m Shear TI
0.0
1.0
2.0
3.0
4.0
5.0
6.0
7.0
8.0
1 2 3 4 5 6 7 8 9 10 11 12 13 14 15 16 17 18 19 20 21 22 23 24
Hour of the Day
Win
d Sp
eed
(m/s
)
0.00
0.10
0.20
0.30
0.40
0.50
0.60
0.70
Shea
r Exp
onen
t
99 m 49 m Shear TI
0.0
1.0
2.0
3.0
4.0
5.0
6.0
7.0
8.0
9.0
1 2 3 4 5 6 7 8 9 10 11 12 13 14 15 16 17 18 19 20 21 22 23 24
Hour of the Day
Win
d Sp
eed
(m/s
)
0.00
0.10
0.20
0.30
0.40
0.50
0.60
0.70
Shea
r Exp
onen
t
90 m 49 m Shear TI
0.0
1.0
2.0
3.0
4.0
5.0
6.0
7.0
8.0
1 2 3 4 5 6 7 8 9 10 11 12 13 14 15 16 17 18 19 20 21 22 23 24
Hour of the Day
Win
d Sp
eed
(m/s
)
0.00
0.10
0.20
0.30
0.40
0.50
0.60
0.70
Shea
r Exp
onen
t
99 m 49 m Shear TI
0.0
1.0
2.0
3.0
4.0
5.0
6.0
7.0
8.0
1 2 3 4 5 6 7 8 9 10 11 12 13 14 15 16 17 18 19 20 21 22 23 24
Hour of the Day
Win
d Sp
eed
(m/s
)
0.00
0.10
0.20
0.30
0.40
0.50
0.60
0.70
Shea
r Exp
onen
t
99 m 49 m Shear TI
Figure 15. Comparison of Diurnal Wind Characteristics
Indiana Tall Towers Wind Study Final Report
Global Energy Concepts, LLC 22 October 2005
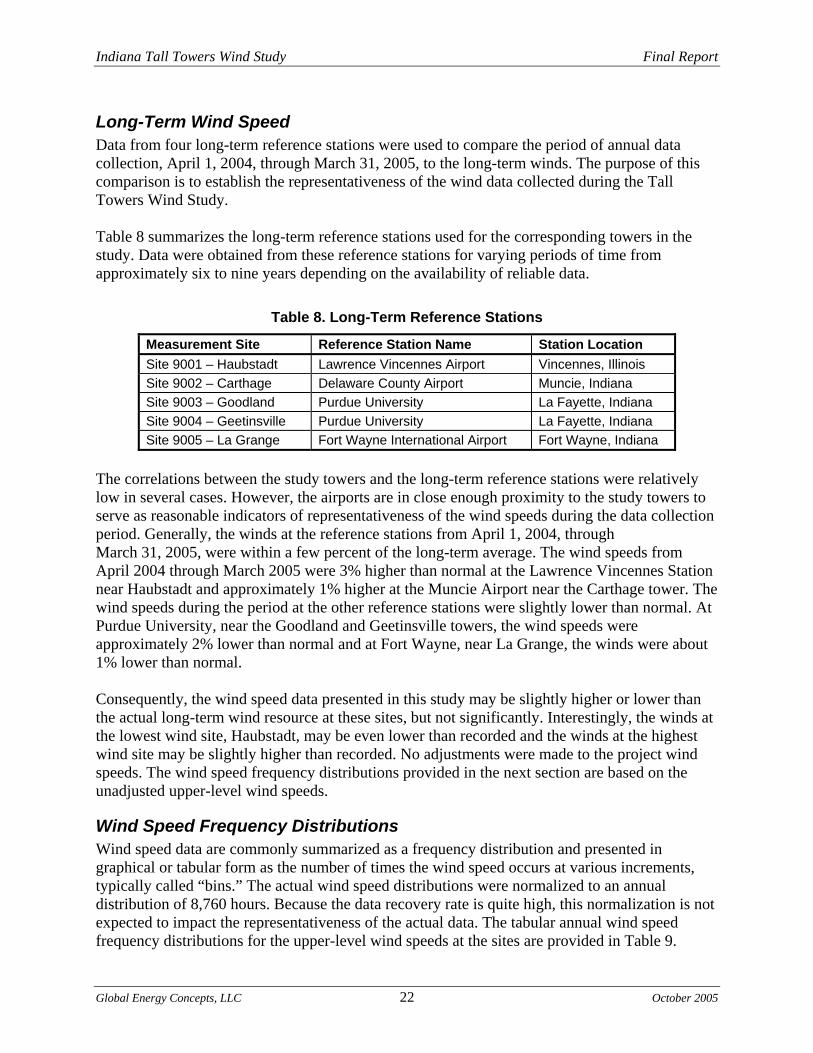
Long-Term Wind Speed Data from four long-term reference stations were used to compare the period of annual data collection, April 1, 2004, through March 31, 2005, to the long-term winds. The purpose of this comparison is to establish the representativeness of the wind data collected during the Tall Towers Wind Study. Table 8 summarizes the long-term reference stations used for the corresponding towers in the study. Data were obtained from these reference stations for varying periods of time from approximately six to nine years depending on the availability of reliable data.
Table 8. Long-Term Reference Stations
Measurement Site Reference Station Name Station Location Site 9001 – Haubstadt Lawrence Vincennes Airport Vincennes, Illinois Site 9002 – Carthage Delaware County Airport Muncie, Indiana Site 9003 – Goodland Purdue University La Fayette, Indiana Site 9004 – Geetinsville Purdue University La Fayette, Indiana Site 9005 – La Grange Fort Wayne International Airport Fort Wayne, Indiana
The correlations between the study towers and the long-term reference stations were relatively low in several cases. However, the airports are in close enough proximity to the study towers to serve as reasonable indicators of representativeness of the wind speeds during the data collection period. Generally, the winds at the reference stations from April 1, 2004, through March 31, 2005, were within a few percent of the long-term average. The wind speeds from April 2004 through March 2005 were 3% higher than normal at the Lawrence Vincennes Station near Haubstadt and approximately 1% higher at the Muncie Airport near the Carthage tower. The wind speeds during the period at the other reference stations were slightly lower than normal. At Purdue University, near the Goodland and Geetinsville towers, the wind speeds were approximately 2% lower than normal and at Fort Wayne, near La Grange, the winds were about 1% lower than normal. Consequently, the wind speed data presented in this study may be slightly higher or lower than the actual long-term wind resource at these sites, but not significantly. Interestingly, the winds at the lowest wind site, Haubstadt, may be even lower than recorded and the winds at the highest wind site may be slightly higher than recorded. No adjustments were made to the project wind speeds. The wind speed frequency distributions provided in the next section are based on the unadjusted upper-level wind speeds.
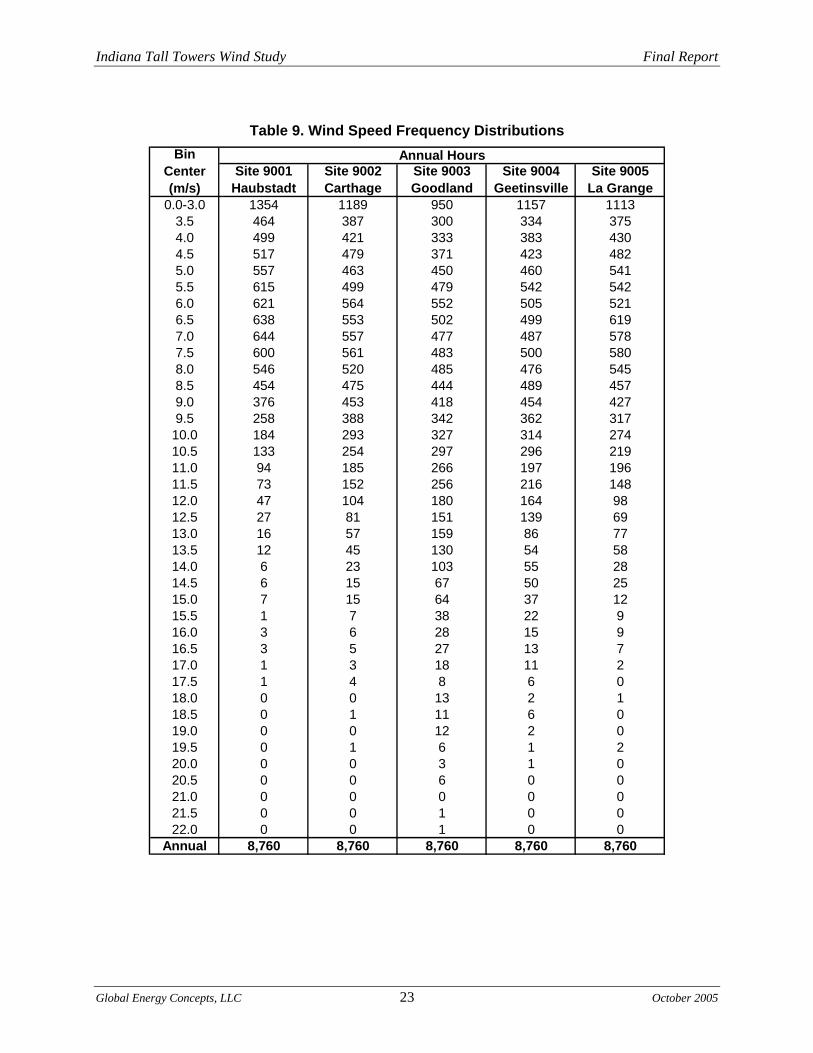
Wind Speed Frequency Distributions Wind speed data are commonly summarized as a frequency distribution and presented in graphical or tabular form as the number of times the wind speed occurs at various increments, typically called “bins.” The actual wind speed distributions were normalized to an annual distribution of 8,760 hours. Because the data recovery rate is quite high, this normalization is not expected to impact the representativeness of the actual data. The tabular annual wind speed frequency distributions for the upper-level wind speeds at the sites are provided in Table 9.
Indiana Tall Towers Wind Study Final Report
Global Energy Concepts, LLC 23 October 2005
Table 9. Wind Speed Frequency Distributions
Site 9001 Haubstadt
Site 9002 Carthage
Site 9003 Goodland
Site 9004 Geetinsville
Site 9005 La Grange
0.0-3.0 1354 1189 950 1157 11133.5 464 387 300 334 3754.0 499 421 333 383 4304.5 517 479 371 423 4825.0 557 463 450 460 5415.5 615 499 479 542 5426.0 621 564 552 505 5216.5 638 553 502 499 6197.0 644 557 477 487 5787.5 600 561 483 500 5808.0 546 520 485 476 5458.5 454 475 444 489 4579.0 376 453 418 454 4279.5 258 388 342 362 31710.0 184 293 327 314 27410.5 133 254 297 296 21911.0 94 185 266 197 19611.5 73 152 256 216 14812.0 47 104 180 164 9812.5 27 81 151 139 6913.0 16 57 159 86 7713.5 12 45 130 54 5814.0 6 23 103 55 2814.5 6 15 67 50 2515.0 7 15 64 37 1215.5 1 7 38 22 916.0 3 6 28 15 916.5 3 5 27 13 717.0 1 3 18 11 217.5 1 4 8 6 018.0 0 0 13 2 118.5 0 1 11 6 019.0 0 0 12 2 019.5 0 1 6 1 220.0 0 0 3 1 020.5 0 0 6 0 021.0 0 0 0 0 021.5 0 0 1 0 022.0 0 0 1 0 0
Annual 8,760 8,760 8,760 8,760 8,760
Bin Center (m/s)
Annual Hours
Indiana Tall Towers Wind Study Final Report
Global Energy Concepts, LLC 24 October 2005
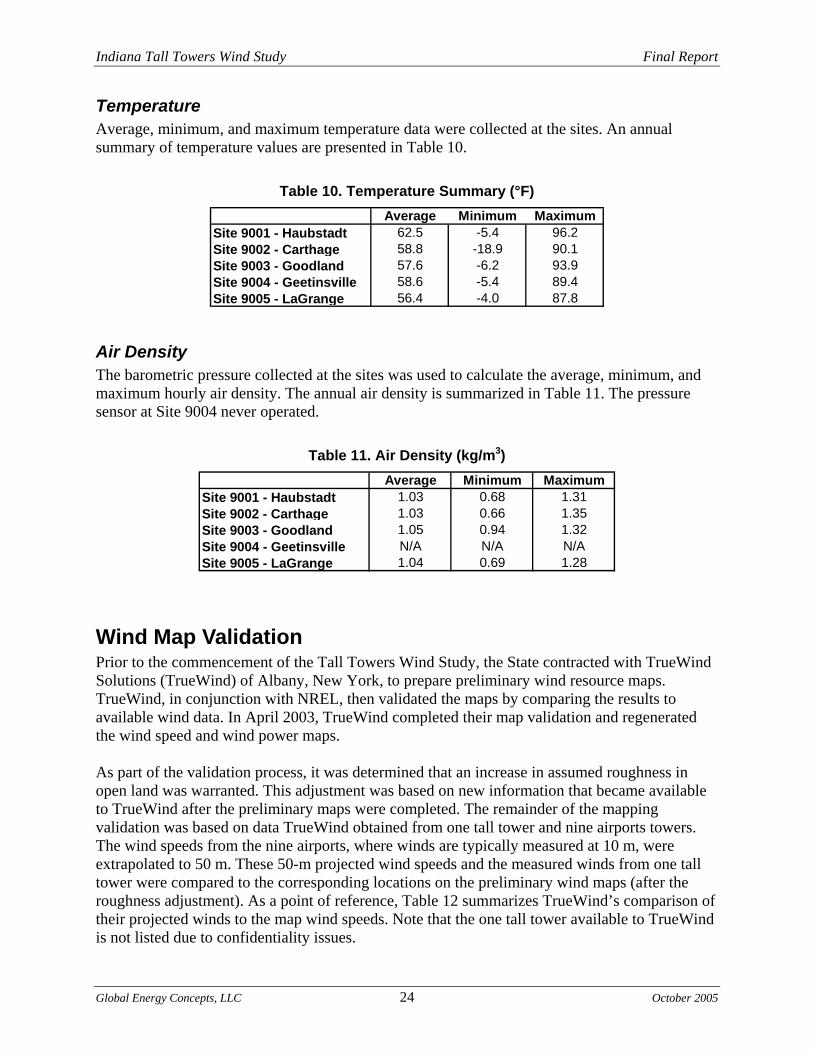
Temperature Average, minimum, and maximum temperature data were collected at the sites. An annual summary of temperature values are presented in Table 10.
Table 10. Temperature Summary (°F) Average Minimum Maximum
Site 9001 - Haubstadt 62.5 -5.4 96.2Site 9002 - Carthage 58.8 -18.9 90.1Site 9003 - Goodland 57.6 -6.2 93.9Site 9004 - Geetinsville 58.6 -5.4 89.4Site 9005 - LaGrange 56.4 -4.0 87.8
Air Density The barometric pressure collected at the sites was used to calculate the average, minimum, and maximum hourly air density. The annual air density is summarized in Table 11. The pressure sensor at Site 9004 never operated.
Table 11. Air Density (kg/m3) Average Minimum Maximum
Site 9001 - Haubstadt 1.03 0.68 1.31Site 9002 - Carthage 1.03 0.66 1.35Site 9003 - Goodland 1.05 0.94 1.32Site 9004 - Geetinsville N/A N/A N/ASite 9005 - LaGrange 1.04 0.69 1.28
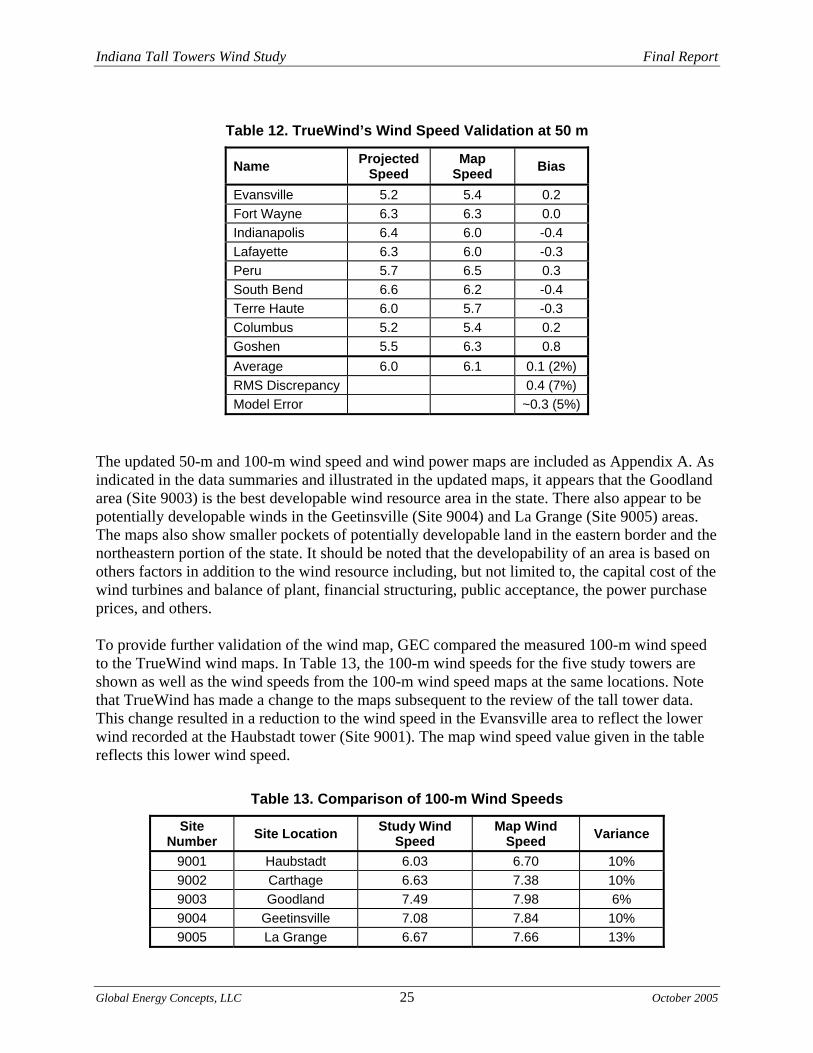
Wind Map Validation Prior to the commencement of the Tall Towers Wind Study, the State contracted with TrueWind Solutions (TrueWind) of Albany, New York, to prepare preliminary wind resource maps. TrueWind, in conjunction with NREL, then validated the maps by comparing the results to available wind data. In April 2003, TrueWind completed their map validation and regenerated the wind speed and wind power maps. As part of the validation process, it was determined that an increase in assumed roughness in open land was warranted. This adjustment was based on new information that became available to TrueWind after the preliminary maps were completed. The remainder of the mapping validation was based on data TrueWind obtained from one tall tower and nine airports towers. The wind speeds from the nine airports, where winds are typically measured at 10 m, were extrapolated to 50 m. These 50-m projected wind speeds and the measured winds from one tall tower were compared to the corresponding locations on the preliminary wind maps (after the roughness adjustment). As a point of reference, Table 12 summarizes TrueWind’s comparison of their projected winds to the map wind speeds. Note that the one tall tower available to TrueWind is not listed due to confidentiality issues.
Indiana Tall Towers Wind Study Final Report
Global Energy Concepts, LLC 25 October 2005
Table 12. TrueWind’s Wind Speed Validation at 50 m
Name Projected Speed
Map Speed Bias
Evansville 5.2 5.4 0.2 Fort Wayne 6.3 6.3 0.0 Indianapolis 6.4 6.0 -0.4 Lafayette 6.3 6.0 -0.3 Peru 5.7 6.5 0.3 South Bend 6.6 6.2 -0.4 Terre Haute 6.0 5.7 -0.3 Columbus 5.2 5.4 0.2 Goshen 5.5 6.3 0.8 Average 6.0 6.1 0.1 (2%) RMS Discrepancy 0.4 (7%) Model Error ~0.3 (5%)
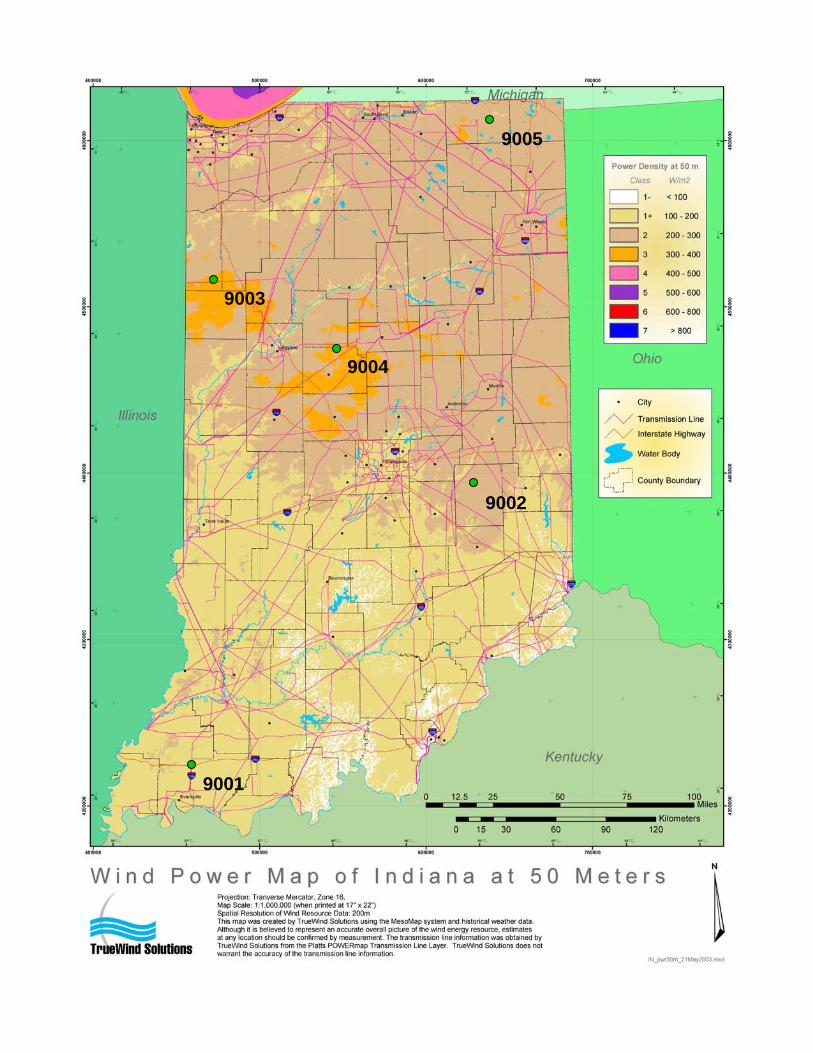
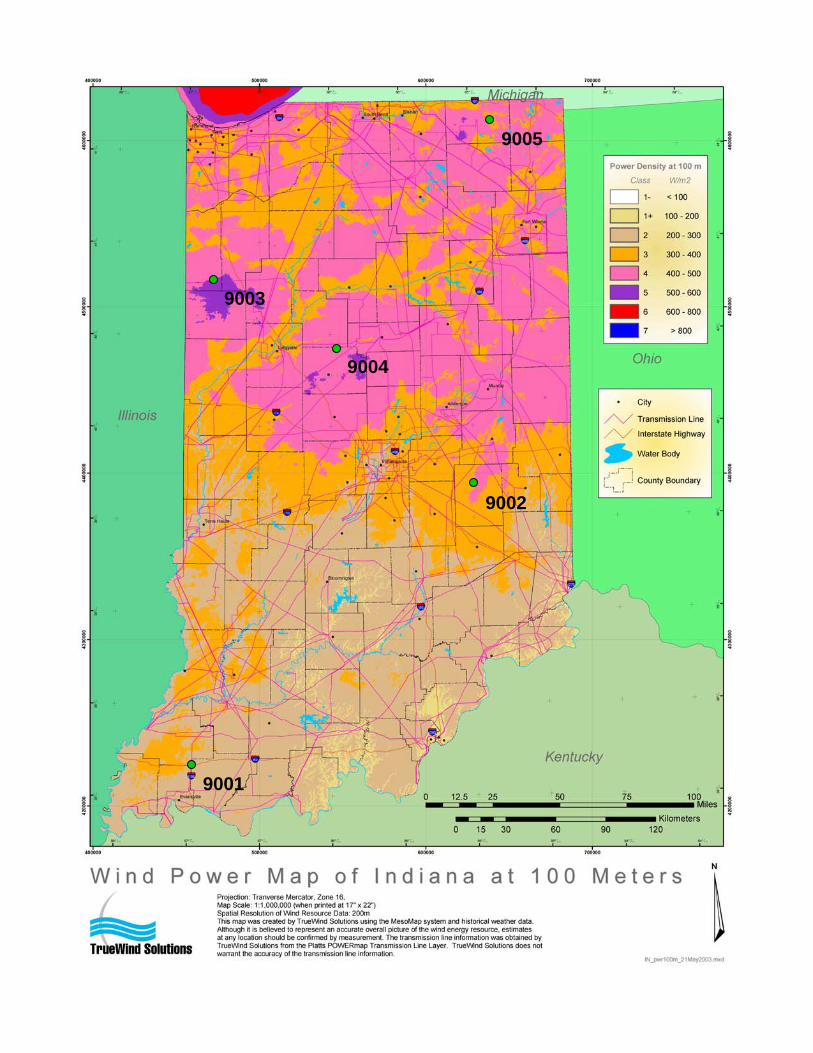
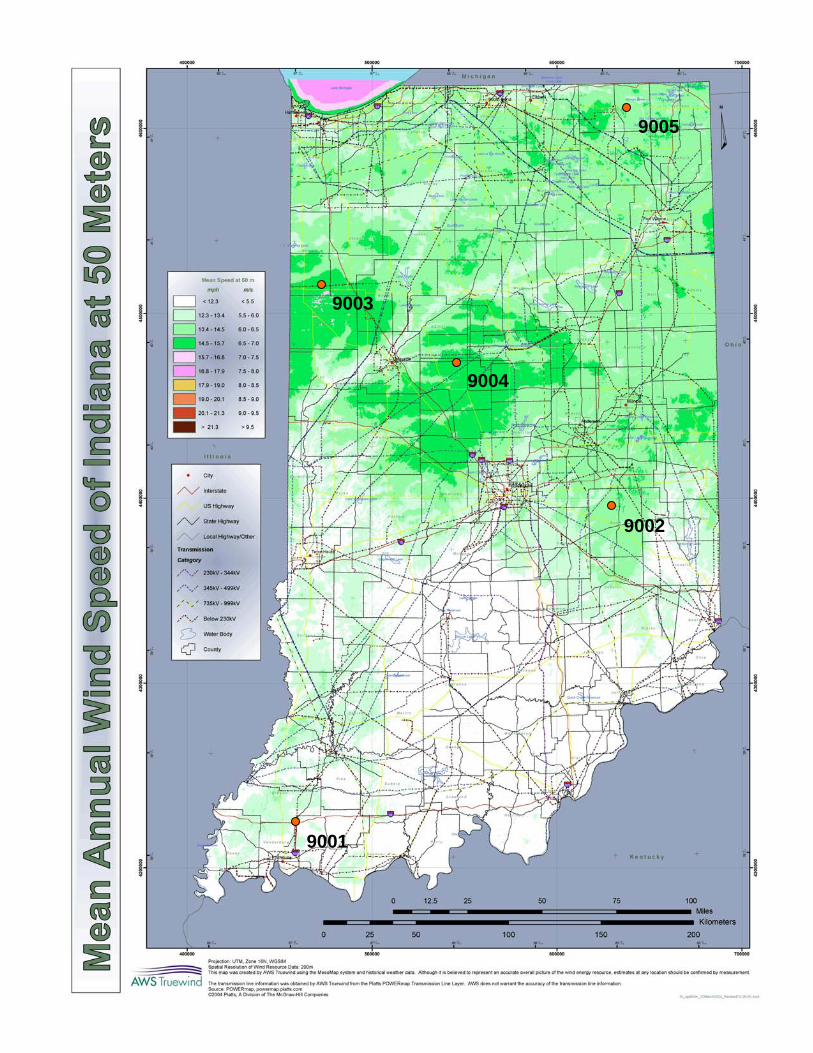
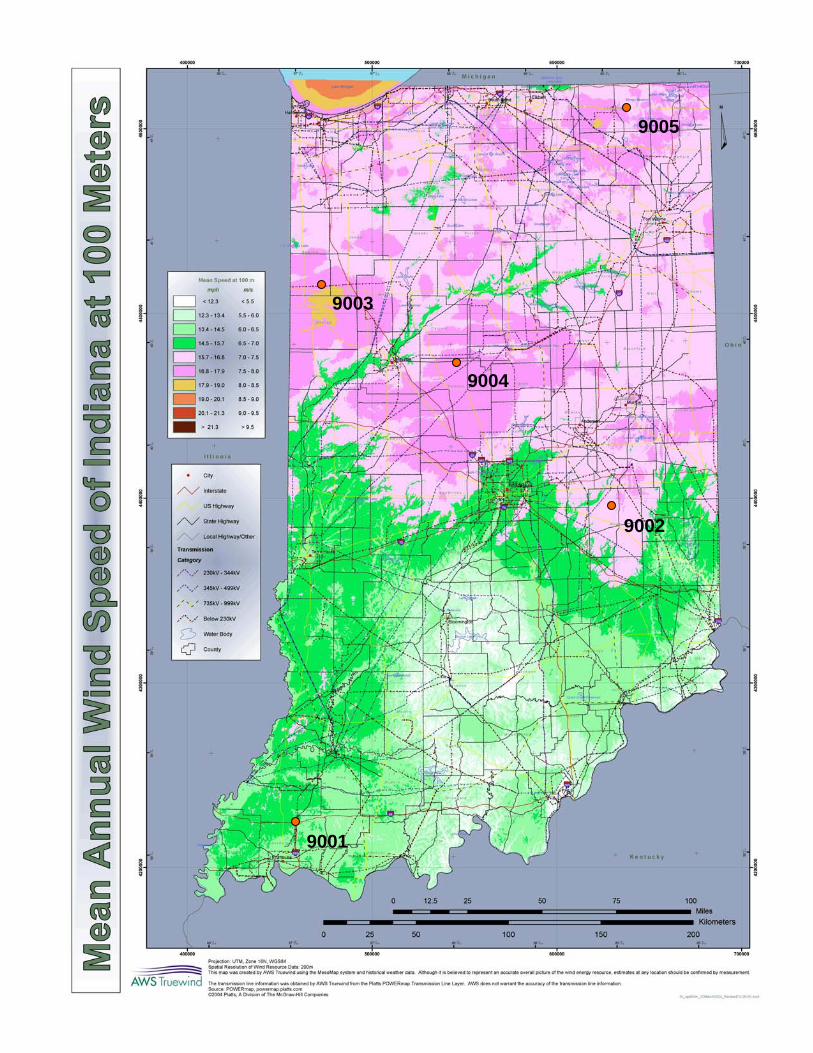
The updated 50-m and 100-m wind speed and wind power maps are included as Appendix A. As indicated in the data summaries and illustrated in the updated maps, it appears that the Goodland area (Site 9003) is the best developable wind resource area in the state. There also appear to be potentially developable winds in the Geetinsville (Site 9004) and La Grange (Site 9005) areas. The maps also show smaller pockets of potentially developable land in the eastern border and the northeastern portion of the state. It should be noted that the developability of an area is based on others factors in addition to the wind resource including, but not limited to, the capital cost of the wind turbines and balance of plant, financial structuring, public acceptance, the power purchase prices, and others. To provide further validation of the wind map, GEC compared the measured 100-m wind speed to the TrueWind wind maps. In Table 13, the 100-m wind speeds for the five study towers are shown as well as the wind speeds from the 100-m wind speed maps at the same locations. Note that TrueWind has made a change to the maps subsequent to the review of the tall tower data. This change resulted in a reduction to the wind speed in the Evansville area to reflect the lower wind recorded at the Haubstadt tower (Site 9001). The map wind speed value given in the table reflects this lower wind speed.
Table 13. Comparison of 100-m Wind Speeds
Site Number Site Location Study Wind
Speed Map Wind
Speed Variance
9001 Haubstadt 6.03 6.70 10% 9002 Carthage 6.63 7.38 10% 9003 Goodland 7.49 7.98 6% 9004 Geetinsville 7.08 7.84 10% 9005 La Grange 6.67 7.66 13%
Indiana Tall Towers Wind Study Final Report
Global Energy Concepts, LLC 26 October 2005
As shown in the table, in all cases, the map wind speeds are higher than the wind speeds measured in the Tall Towers Wind Study. There are several potential reasons for this discrepancy. First, the increase in surface roughness assumed for the maps may not have been enough of an increase. In other words, if the assumed surface roughness was greater, the wind map would project lower wind speeds and the variance between the measured and map values would be smaller. Another explanation for the discrepancies may be that the measured values are lower than actual due to sensor icing and tower interference from either the tower itself or other equipment mounted on the tower. These other factors are discussed in more detail later in the report. There are also potential site-specific explanations for the discrepancies. The greatest variance in wind speed estimates between the study wind speeds and the map wind speeds is for La Grange at 13%. TrueWind acknowledge that the original source data for the Goshen data point, near La Grange, was probably high. A lower wind speed in this area would significantly reduce the variance between the study wind speed and the map wind speed at the La Grange tower. Another potential cause of the discrepancies is that the measured data were not adjusted to reflect the long-term average. As previously mentioned, the winds during the data collection period at the nearby airports appear to be reasonably close to the long-term averages. Consequently, no adjustments were made for long-term representativeness. However, the long-term annual wind speeds at Goodland, Geetinsville, and La Grange may be slightly higher than the wind speeds recorded during the study period, which would result in a somewhat lower variance. If this long-term adjustment were applied, the variances at Goodland, Geetinsville, and La Grange would be 4%, 8%, and 12%, respectively. GEC discussed several other issues with TrueWind and NREL including the unreasonable 50-m to 100-m wind shear at Haubstadt and La Grange (Sites 9001 and 9005). If lower-than-actual 50-m wind speeds were recorded, this may have been caused by an instrumentation problem. If the 50-m anemometer booms were not mounted level or the sensor end of the boom dropped after mounting, the recorded wind speeds may have been lower than the actual winds. While the photographs of the towers do not depict any equipment that would seem to interfere with the mid-level measurements, this is still a possibility. In NREL’s opinion, the wind maps correctly show the highest wind resource in the northwestern part of the state with some smaller areas of potentially developable winds in the east and the northeastern corner of the state. In spite of some discrepancies at specific locations, it is agreed that the maps are a reasonable large-scale portrayal of the wind resource distribution in the state.
Study Experience and Recommendations Following is a discussion of the experience gained in the Tall Towers Wind Study including tower leasing issues, specification and installation of monitoring equipment, as well as operation of maintenance of the equipment. This section also includes a discussion of the suitability of each of the monitoring sites for wind energy development and recommendations for implementation of wind energy systems in Indiana.
Indiana Tall Towers Wind Study Final Report
Global Energy Concepts, LLC 27 October 2005
Tower Leasing GEC’s past experience with leasing tall towers in the Midwest for wind resource monitoring was quite different from our experience in this project. In the past, tall towers were available for lease with reasonable contracting effort and at a minimal annual cost. GEC signed several three-page contracts for tower leasing at an annual cost of $300-$800. The project budget assumed an annual lease rate of $750 per tower, a total of $3,750 for the project. The tower leasing for the Indiana study required an extensive amount of time in negotiating contracts with significantly higher annual costs. The owners of several of the potential study towers required structural analysis at a cost of approximately $3,000 before they would consider leasing space on the tower for the wind monitoring equipment. Ultimately, two of the towers were provided to the State at no cost. However, a third tower was leased for $1,200 and the other two towers were leased for $3,600. The amount of labor hours for negotiating leases was also significantly higher than anticipated. In addition to these challenges, one of the tower owners would not allow other crews to climb their towers. Consequently, GEC had to subcontract the sensor installation to the tower owner but still needed to have a crew on-site to supervise the installation, mount the sensors on the booms, and program the logger. This requirement resulted in additional costs to the project. Due to the difficulty in obtaining tower leases, the equipment installations were delayed. As previously discussed, the first three towers, Haubstadt, Carthage, and Goodland were installed in December 2003. The towers near Geetinsville and La Grange were installed in April 2004. The need to conduct the installations in two separate trips was also an added cost to the project.
Equipment Operation and Maintenance To some degree, all five of the sites experienced data transmittal problems due to unreliable cellular service. The problems were most significant at Haubstadt and Carthage (Sites 9001 and 9002). When crews were traveling through the area, sites were visited to attempt to trouble shoot the problem. Additional antennas were added on two of the towers. Eventually, we contacted the owners of these towers and they agreed to go to the towers periodically and manually collect and transmit the data. Little or no data were lost due to transmittal problems but additional labor hours and maintenance costs were incurred. To account for the Y2K issue, NRG issued firmware upgrades for all of their Symphonie loggers. These upgraded loggers appeared to address the Y2K issue without any problems. However, on February 29, 2004, a “leap-year glitch” became apparent. After February 28, the logger timestamps went to March 1 rather than February 29. All subsequent timestamps were off by one day which created a significant data processing problem. NRG immediately provided a software solution that corrected the problem during data processing. In addition, NRG offered to provide upgraded loggers at no cost. The loggers at Haubstadt and Goodland were replaced in March 2004. An upgrade logger was used for the installation at Geetinsville in April 2004. The Carthage and La Grange loggers were upgraded in June 2004.
Indiana Tall Towers Wind Study Final Report
Global Energy Concepts, LLC 28 October 2005
The logger at Haubstadt failed and was replaced in September 2004. There were no other significant equipment issues during the study period. The internationally accepted standard for mounting anemometers specifies a distance from the tower of seven times the face width. Due to State contracting requirements, the monitoring equipment for the project was purchased prior to the final tower selections. The sensor booms that were purchased were NRG’s longest booms, designed for use on 18” faced lattice towers. A couple of the towers have a face wider than 18”. Additionally, recent research at GEC has shown that anemometers are influenced by the tower to a greater degree than originally expected. This tower influence results in some uncertainty, particularly at the 50-m level.
Data Collection and Validation In spite of the data transmittal difficulty, the lowest data recovery at any of the five sites was a respectable 95%. This is largely due to the fact that while the sites were not always transmitting data, the loggers were still logging data and the memory cards were retrieved from the loggers when a maintenance crew visited the site. While a certain amount of sensor icing can be expected at sites throughout the Midwest, some sites experience significantly more than others. Fortunately, there was a limited amount of apparent icing experienced at the Indiana tall towers during the data collection period. However, anemometers may experience some degree of “dragging” that is not apparent. Consequently, the wind speeds during the winter months could be slightly underestimated. The use of heated sensors could reduce this type of wind resource uncertainty.
Suitability of Sites for Development It is clear from the data presented in this report and from the wind resource maps generated by TrueWind that the area around Goodland appears to be a commercially developable area. The Geetinsville area, approximately 60 miles southeast of Goodland, may also have developable potential. While there may be some site-specific locations in the northeast corner of the state with developable wind, there appears to be generally less wind in this area. It is unlikely that there are any commercially developable wind sites in the southern portion of the state. The winds also appear to be quite low east of Indianapolis in the area around Carthage.
Recommendations GEC recommends that the State focus on encouraging development in the Goodland and Geetinsville areas. It may be valuable to conduct further wind resource assessment in these and other areas indicated by the maps as having development potential. If additional monitoring activities are pursued, a combination of tilt-up towers and tall towers could be used to better characterize the wind resource. Additional data collection on tall towers should focus on obtaining information to better define the wind shear at heights between 50 m and 100 m. The use of tilt-up towers would provide better information on the geographical distribution of developable wind resources at a lower cost and availability than tall towers. Additional data collection activities should include further validation of the wind map results.
Indiana Tall Towers Wind Study Final Report
Global Energy Concepts, LLC October 2005
Appendix A
50-m and 100-m Wind Speed and Wind Power Maps
9001
9004
9003
9005
9002
9001
9004
9003
9005
9002
9001
9004
9003
9005
9002
9001
9004
9003
9005
9002