india: economic overview p.v. viswanath fin 680v/ fin 360
Post on 22-Dec-2015
218 views
TRANSCRIPT

India: Economic Overview
P.V. Viswanath
FIN 680V/ FIN 360
Economic History: 1950-1990
Post-independence India had a mixed economy, i.e. including both private and public sectors. The reasons for a strong public sector were:– Greate inequality in income distribution – doubts as
to the viability of free markets– Free trade would probably have led to exploitation by
stronger foreign countries• Exports were seen as a drain of resources from the
country.
Post-independence economy
Foreign Investment was seen as foreign domination.The quickest path to economic development was seen to be rapid industrialization, which would probably not happen without government intervention– Capital goods and heavy industry were seen as particularly
needed.– Planning was needed to ensure industrial growth and the
concomitant agricultural and service growth, as well as employment growth
Objectives
The broad objectives were:– Rapid growth in production with a view to achieving a
higher level of national and per-capita income.– Full employment– Reduction of inequalities in income and wealth– Socialistic pattern of society with a democratic
framework, based on equality and justice and absence of exploitation.
Policy Measures for Industrial Development
Trade and Regulatory Regimes designed to shield industrial producers from competition– High tariffs– Industrial licensing of production and investment– Monopoly and Restrictive Trade Practices (MRTP)
Act– Foreign Exchange Regulation Act (FERA)– Export Restrictions
Industrial Policy
Directed allocation of subsidized credit through the commercial and developmental banking systemAdministered interest rates and financial institutions required to lend for specific purposes at the administered rates.Fixed, overvalued exchange rates; this ensured cheap imports for the government.
Industrial & Agricultural Policy
Price control for many productsRigid labor laws that made it difficult to lay off workers.Direct public investment in industrial activities.Management of the agricultural sector to ensure reasonable supplies of food grains, edible oils, sugar and cotton to the domestic market.
Agricultural Policy
Procurement prices were fixed, which , in times of surplus, worked as a minimum support price.At times of deficit, the government mandatorily procured a part of the grain at the procurement price and distributed it to poorer people through ration shops.Fertilizer, irrigation, power and credit were subsidised for the agricultural sector.
Agricultural and Fiscal Policy
The need to mop up excess production led to trade restrictions. – Quantitative restrictions on exports and imports,
through licensing– Canalization – the use of a single parastatal for
imports and exports; the use of minimum export prices.
– High income tax rates
Social Policies
Higher education was emphasized (IITs and IIMs)Growth-oriented strategy as a means of mitigating poverty and unemployment.However, structural inequalities in land ownership, availability of water, access to credit etc. led to growth without income and employment growth for poorer people.
Social Policies
Land reform; however, it required the cooperation of the states, which was not always forthcoming for political reasons.Alleviation of poverty through special programs and policies, such as asset creation programs, employment generation programs, minimum needs programs.Intervention programs to solve the problems of malnutrition and hunger.
Did the policies work? Industry
Industry grew 6% p.a. between 1951 and 1989There was little competition; hence there was little R&D.The capital-input ratio went up considerably; total factor productivity dropped. Capacity utilization fell.Deeply entrenched interest groups.
Agricultural Progress
Between 1950 and 1980, food grain production increased by 2.8% p.a., due primarily to productivity gains and multiple cropping.But, investment growth slowed.R&D suffered, development of irrigation lagged behind plan targets.There was a substantial rise in subsidies for food and fertilizer and for credit, water and electricity.India became more or less self-reliant, but at great cost.
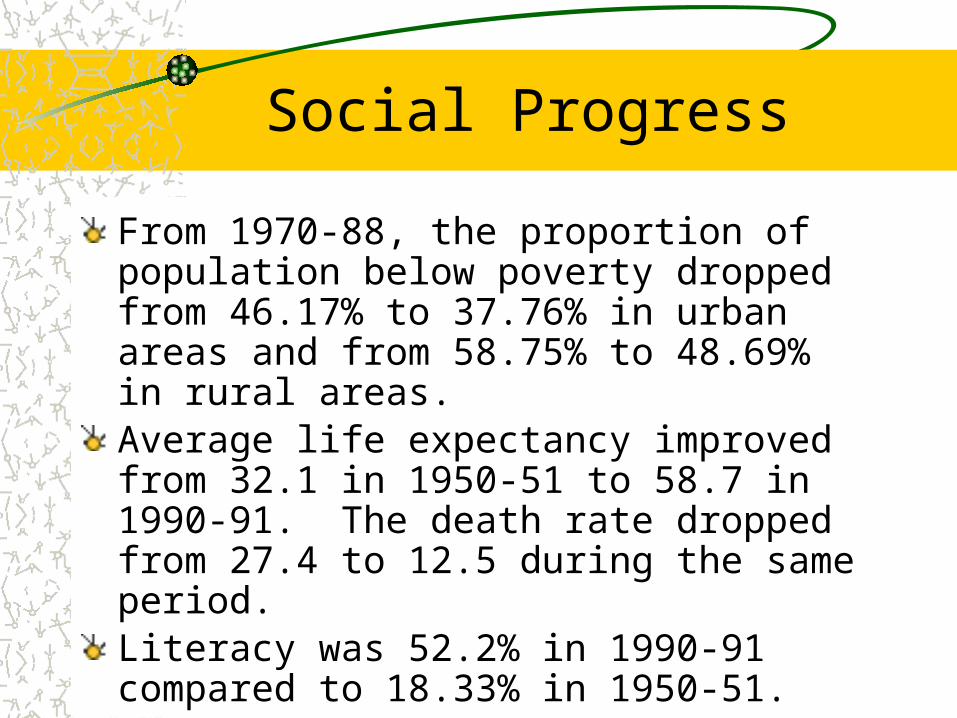
Social Progress
From 1970-88, the proportion of population below poverty dropped from 46.17% to 37.76% in urban areas and from 58.75% to 48.69% in rural areas.Average life expectancy improved from 32.1 in 1950-51 to 58.7 in 1990-91. The death rate dropped from 27.4 to 12.5 during the same period.Literacy was 52.2% in 1990-91 compared to 18.33% in 1950-51.But compared to other developing countries, this was not good.
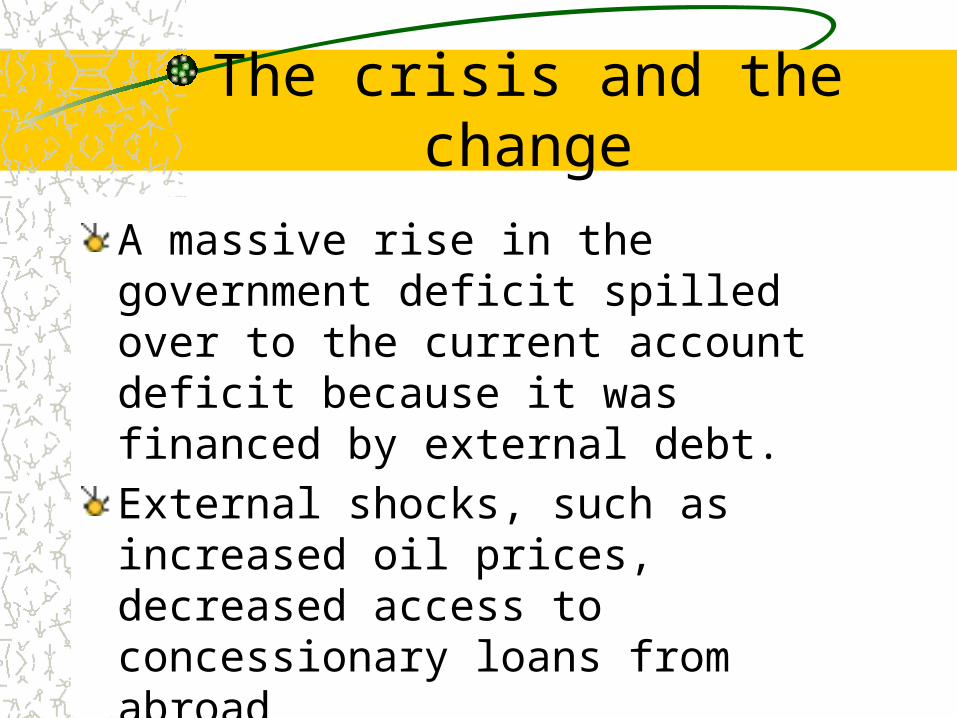
The crisis and the change
A massive rise in the government deficit spilled over to the current account deficit because it was financed by external debt.External shocks, such as increased oil prices, decreased access to concessionary loans from abroadStructural rigidities in the Indian economy made Indian products non-competitive, globally.
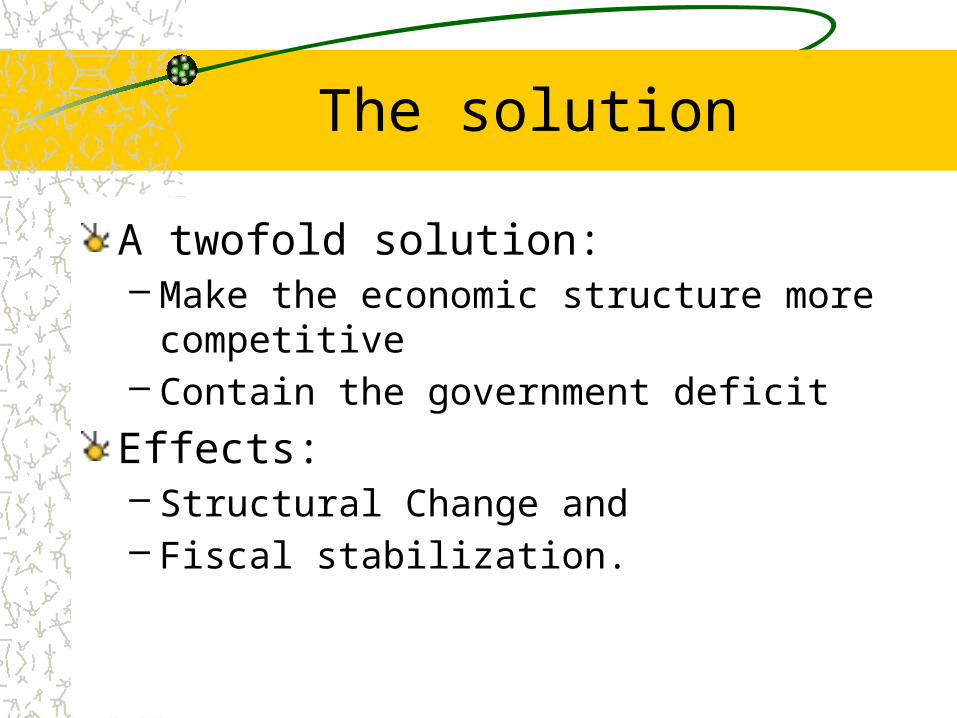
The solution
A twofold solution:– Make the economic structure more competitive– Contain the government deficit
Effects:– Structural Change and – Fiscal stabilization.
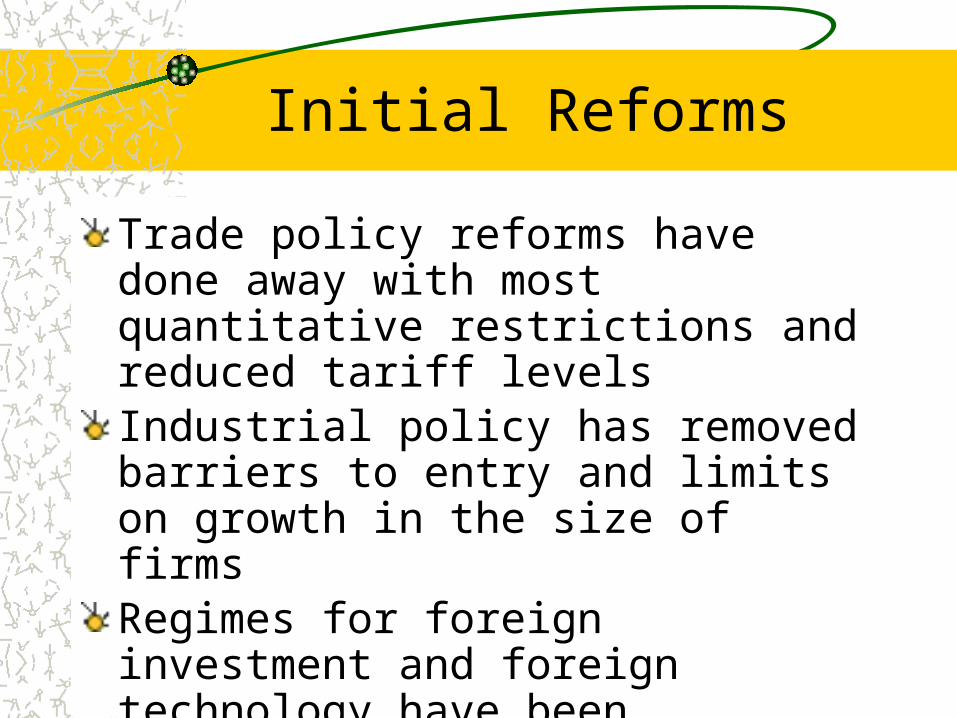
Initial Reforms
Trade policy reforms have done away with most quantitative restrictions and reduced tariff levelsIndustrial policy has removed barriers to entry and limits on growth in the size of firmsRegimes for foreign investment and foreign technology have been liberalized considerablyDomestic tax structure has been rationalized.The financial sector is being deregulated.
Second-generation reforms
Privatization of public sector undertakings– Very slow, but steady. BHEL
Exit policy for laborReforms of the agricultural sectorReforms of the state government
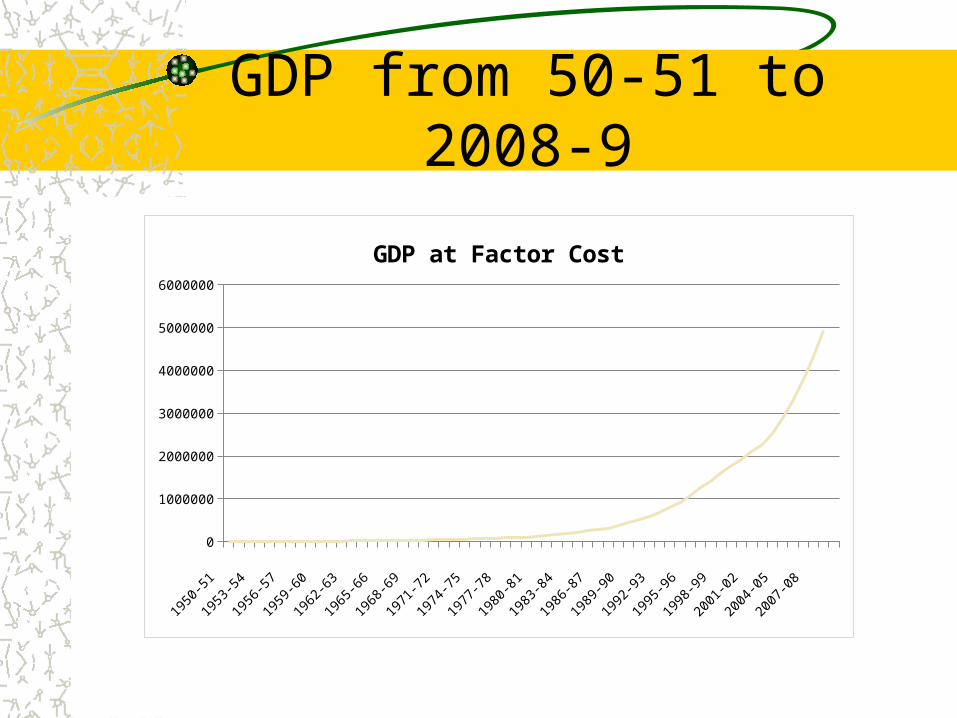
GDP from 50-51 to 2008-9
1950
-51
1952
-53
1954
-55
1956
-57
1958
-59
1960
-61
1962
-63
1964
-65
1966
-67
1968
-69
1970
-71
1972
-73
1974
-75
1976
-77
1978
-79
1980
-81
1982
-83
1984
-85
1986
-87
1988
-89
1990
-91
1992
-93
1994
-95
1996
-97
1998
-99
2000
-01
2002
-03
2004
-05
2006
-07
2008
-09
0
1000000
2000000
3000000
4000000
5000000
6000000
GDP at Factor Cost
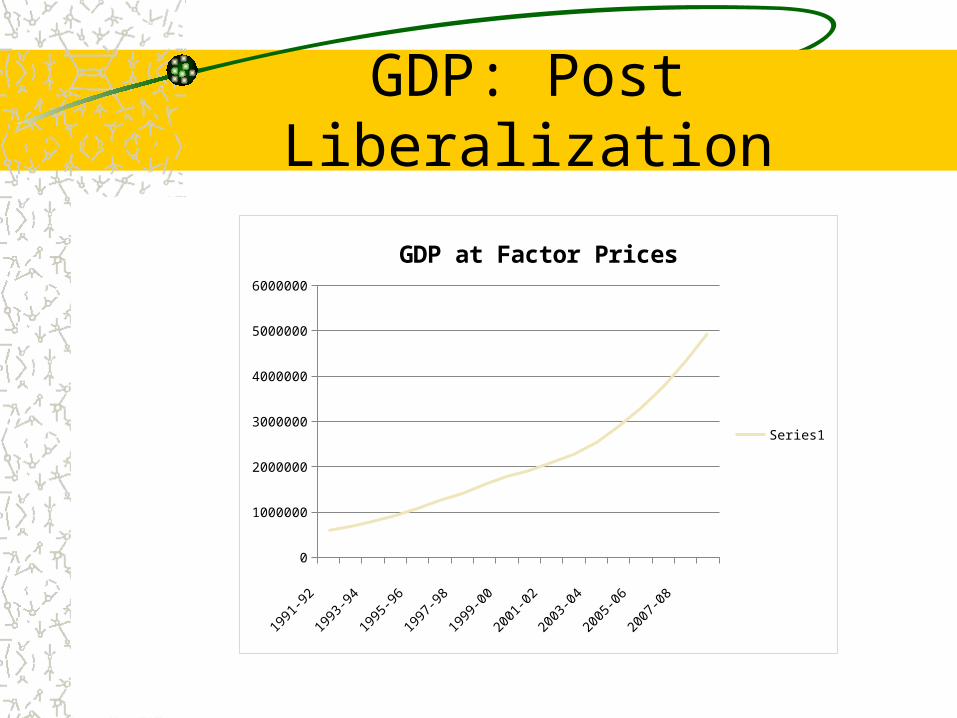
GDP: Post Liberalization
1991
-92
1992
-93
1993
-94
1994
-95
1995
-96
1996
-97
1997
-98
1998
-99
1999
-00
2000
-01
2001
-02
2002
-03
2003
-04
2004
-05
2005
-06
2006
-07
2007
-08
2008
-09
0
1000000
2000000
3000000
4000000
5000000
6000000
GDP at Factor Prices
Series1
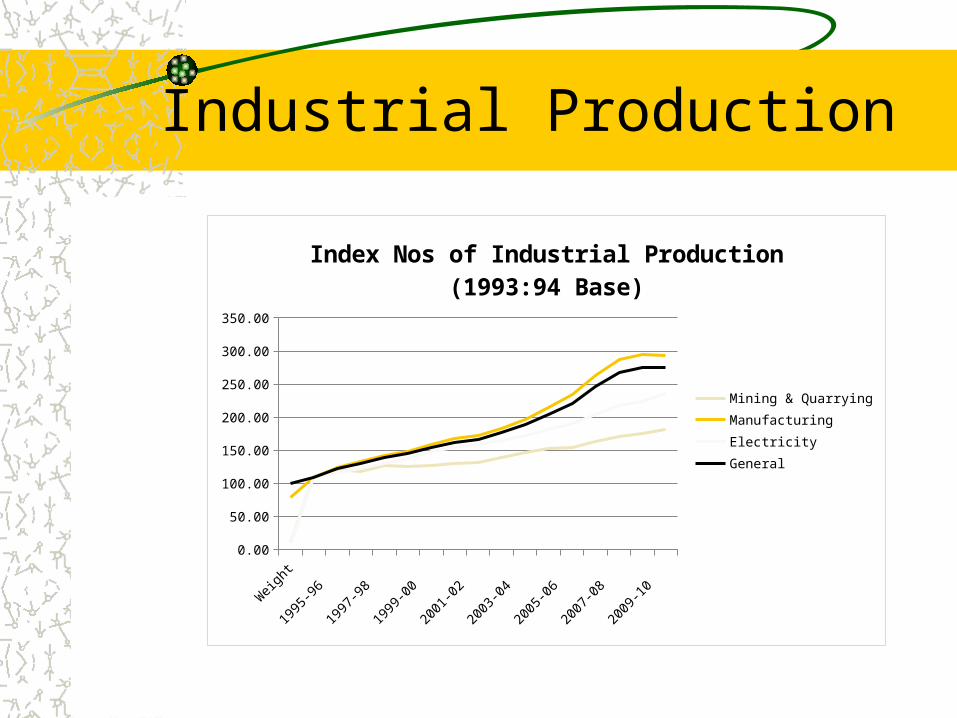
Industrial Production
Weight
1994-95
1995-96
1996-97
1997-98
1998-99
1999-00
2000-01
2001-02
2002-03
2003-04
2004-05
2005-06
2006-07
2007-08
2008-09
2009-10
0.00
50.00
100.00
150.00
200.00
250.00
300.00
350.00
Index Nos of Industrial Production (1993:94 Base)
Mining & QuarryingManufacturingElectricityGeneral
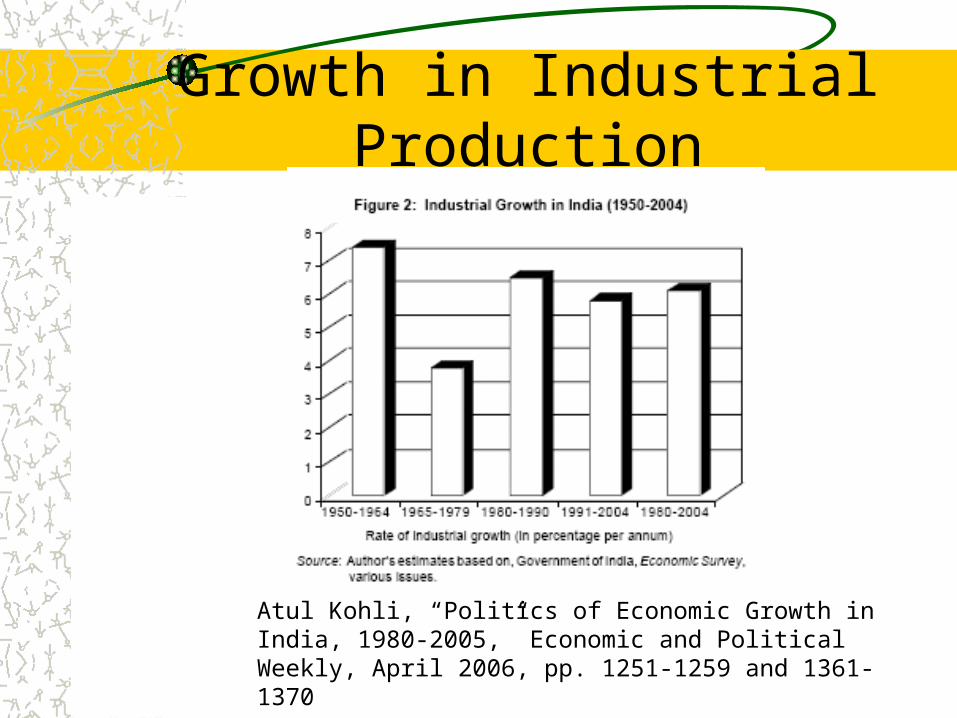
Growth in Industrial Production
Atul Kohli, “Politics of Economic Growth in India, 1980-2005,” Economic and Political Weekly, April 2006, pp. 1251-1259 and 1361-1370
Changes post-1991
Disparity in growth across statesMove towards service sectorLack of industrial growthIncome inequalitiesHigh poverty in the rural sector – farmer suicidesContinued casteism, gender inequality, communal unrest
Economic Discrimination
Two theories of employee discrimination:– Statistical Discrimination – desired characteristics
are more prevalent in the sought-after group. Hence employees belonging to this group are preferred.
– A recent study concluded that SC/ST graduates of the 2006 IIM-Ahmedabad batch got jobs with lower pay offers.
– The study found that after adjusting for weaker academic performance, there was no discrimination.

Economic Discrimination
Preference-Based Discrimination (Becker)If employers prefer to associate with employees of a certain background, then that characteristic will be priced – employees of the favored group will be preferred even if there is no difference on efficiency grounds.This may be changed by advertising, marketing and misconceived associations between group affiliation and economic performance.
Benefits of Capital Account Convertibility
to stimulate economic growth through higher investment by minimizing the cost of both equity and debt capital; to improve the efficiency of the financial sector through greater competition, thereby minimizing intermediation costs and to provide opportunities for diversification of investments by residents.
Capital Account Convertibility
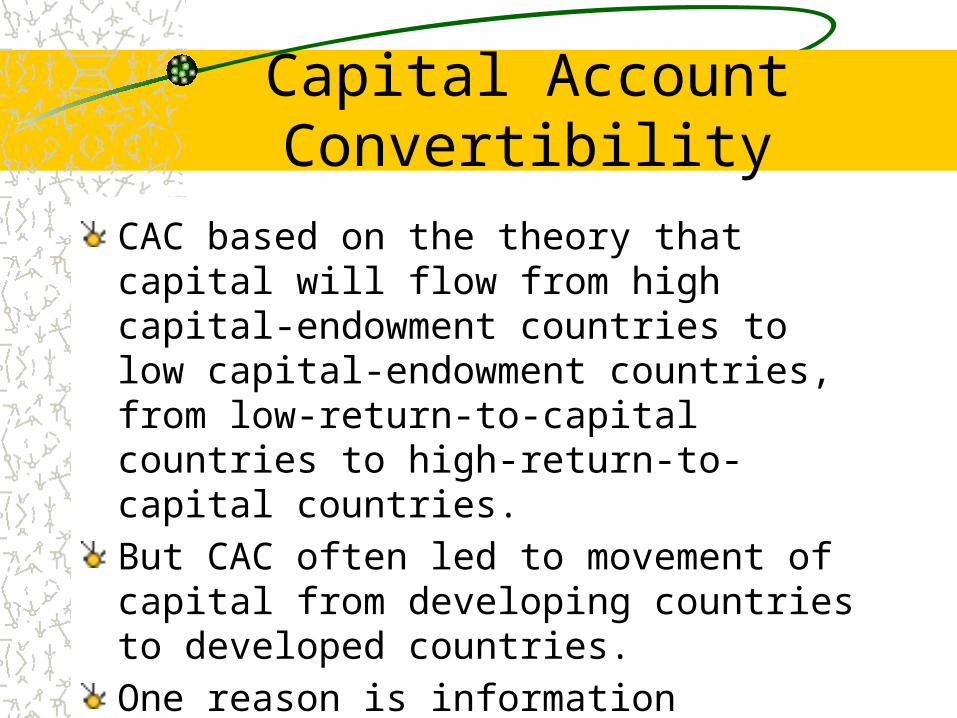
CAC based on the theory that capital will flow from high capital-endowment countries to low capital-endowment countries, from low-return-to-capital countries to high-return-to-capital countries.But CAC often led to movement of capital from developing countries to developed countries.One reason is information asymmetry problems in developing countries combined with contract enforcement difficulties.Capital flows can be volatile.
Capital Account Convertibility
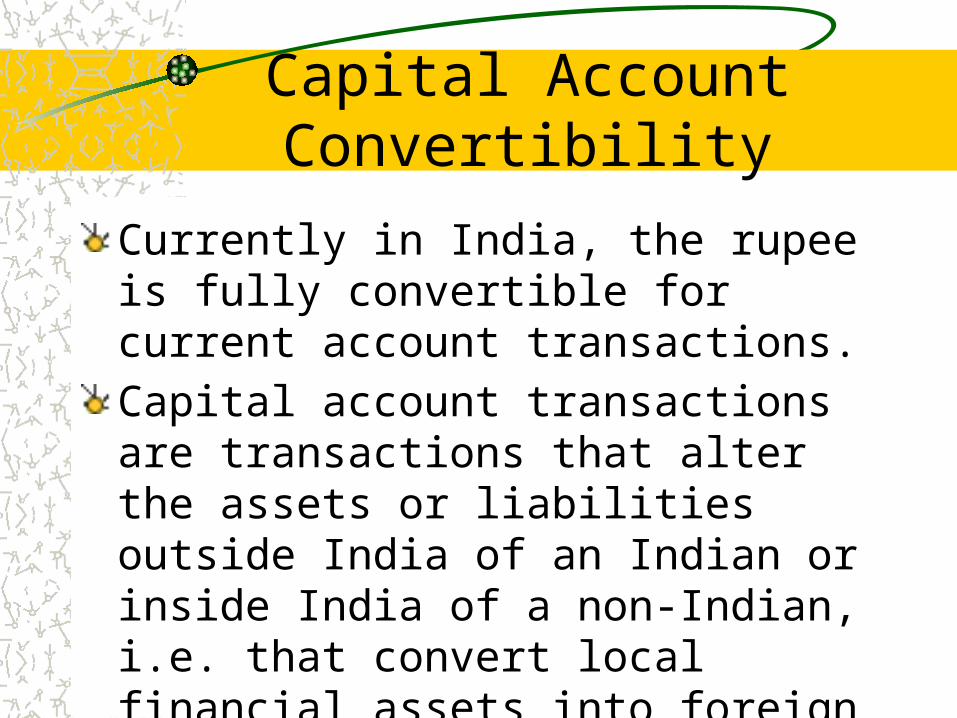
Currently in India, the rupee is fully convertible for current account transactions.Capital account transactions are transactions that alter the assets or liabilities outside India of an Indian or inside India of a non-Indian, i.e. that convert local financial assets into foreign financial assets – for such transactions, convertibility is limited.

Capital Account Convertibility
State governments are not allowed to directly access any form of external borrowingBanks are not allowed to borrow abroad; however, Indian companies are allowed ECBs (external company borrowings).Foreigners are allowed to invest in India only in certain sectors and subject to certain limits.
Capital Account Convertibility: Examples
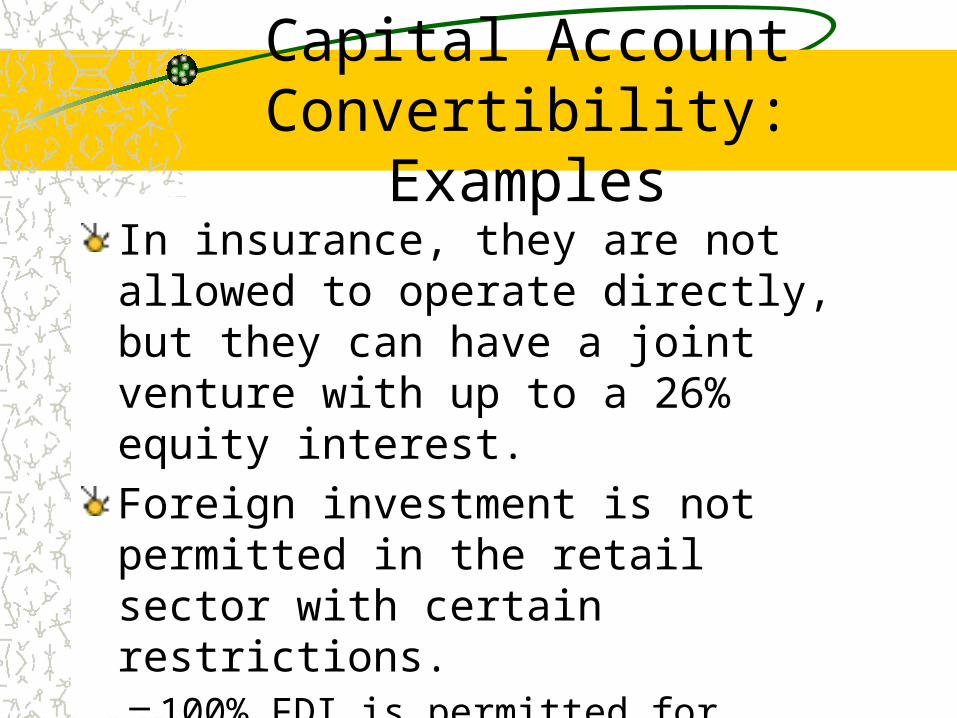
In insurance, they are not allowed to operate directly, but they can have a joint venture with up to a 26% equity interest.Foreign investment is not permitted in the retail sector with certain restrictions.– 100% FDI is permitted for wholesale cash and carry
trading and trading for exports– 51% FDI permitted for Single Brand product retailing
BSE Sensex Prices
7/3/20
00
11/6/
2000
3/12/2
001
7/16/2
001
11/19
/2001
3/25/2
002
7/29/2
002
12/2/
2002
4/7/20
03
8/11/2
003
12/15
/2003
4/19/2
004
8/23/2
004
12/27
/2004
5/2/20
05
9/5/20
05
1/9/20
06
5/15/2
006
9/18/2
006
1/22/2
007
5/28/2
007
10/1/
2007
2/4/20
08
6/9/20
08
10/13
/2008
2/16/2
009
6/22/2
009
0
10000
20000
30000
40000
50000
60000
70000
BSE Sensex Index
VolumeClose
BSE Sensex Prices
1/2/20
09
1/12/2
009
1/22/2
009
2/1/20
09
2/11/2
009
2/21/2
009
3/3/20
09
3/13/2
009
3/23/2
009
4/2/20
09
4/12/2
009
4/22/2
009
5/2/20
09
5/12/2
009
5/22/2
009
6/1/20
09
6/11/2
009
6/21/2
009
7/1/20
09
7/11/2
009
7/21/2
009
7/31/2
009
8/10/2
009
8/20/2
009
8/30/2
009
9/9/20
090
5000
10000
15000
20000
25000
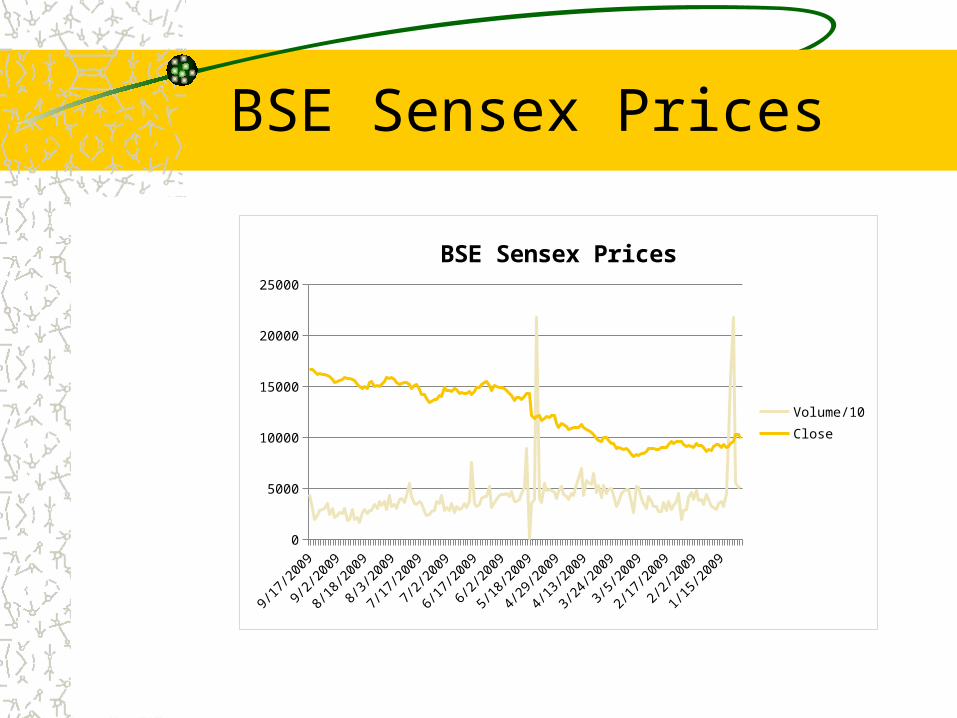
BSE Sensex Prices
Volume/10Close
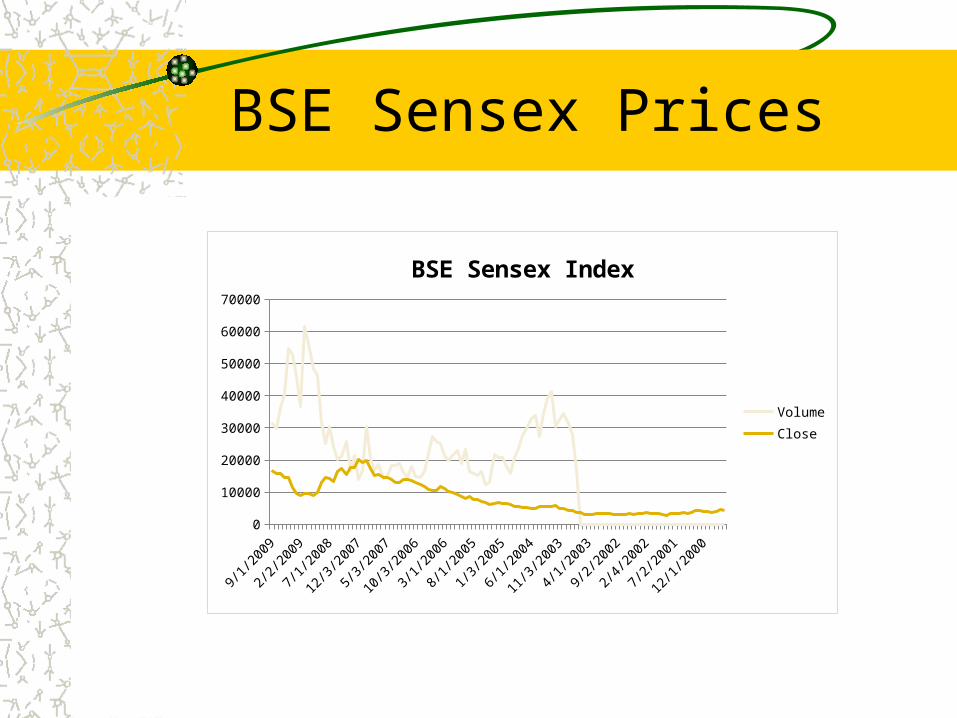
Stock Market Efficiency
Stock prices are trending up.There is tremendous volumeHowever, in order for the stock market to work as an efficient mechanism for channeling resources, prices have to reflect true value.One requirement for this to happen is that the market should not be manipulable by a few parties.Shareholder dispersion is an important factor for this to be true.