index of development of basic education - oecd.org. luiz costa_june_2013 - ideb ocde.pdf ·...
TRANSCRIPT
Index of Development
of Basic Education
Paris – June - 2013
IDEB is an indicator of the quality of education that combines information
from the performance of students in national assessments at the end of
school levels of basic education (4/5th, 8/9th and 11/12th grades) with flow
rates.
This indicator allows to monitor the country’s education systems. The
importance of IDEB as a tool for diagnosis and guidance to policies aiming
at the improvement of education lies on:
• identifying schools or education systems whose students show a poor
performance and low proficiency levels;
• observing the evolution of these students’ performance in a time span.
Index of Development of Basic Education- IDEB
To establish the levels of IDEB, Inep first established a harmonization
of the performance levels in PISA 2003 and the scales of the National
Assessment of Basic Education (SAEB) 2003.
Such a harmonization consisted on identifying which scores on the
SAEB scale corresponded to a given performance in PISA and vice
versa. In fact, the idea was to make of PISA a reference to establish
the goals of IDEB.
This allowed us to compare PISA and SAEB proficiency levels thus
establishing what level of performance we wanted to set as a goal for
IDEB.
Index of Development of Basic Education - IDEB
Index of Development of Basic Education - IDEB
In order to harmonize the calculation of IDEB to PISA performance scales
we chose to consider the performance of Brazilian students in PISA and
that of 8th graders in SAEB (which was the closest we had to the PISA
target population).
We first took the average performance of OECD countries in PISA 2003
and observed what percentage of Brazilian students presented a
performance higher or equal to the OECD countries average.
Then, we took the scores of SAEB for the 8th grade and observed which
level corresponded to the percentage identified in the previous step. This
was established as the goal to be reached in IDEB.
To find the corresponding scores of the other grades assessed by SAEB,
we added the hypothesis that the same relation observed for the 8th grade
could be kept for those grades.
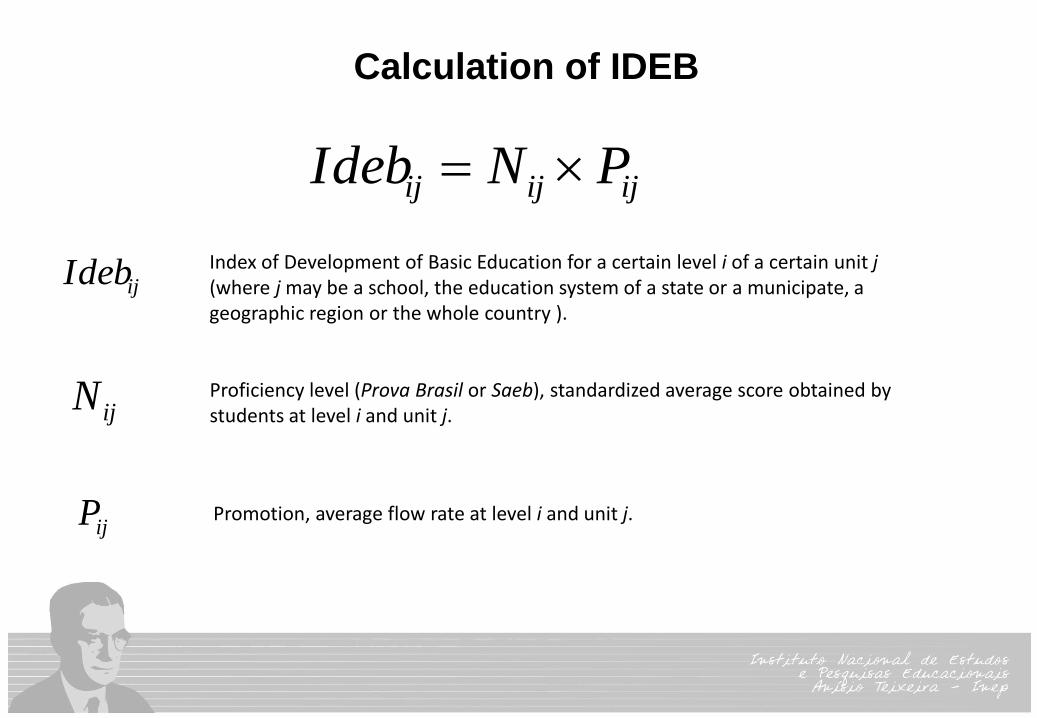
Calculation of IDEB
ijijij PNIdeb
ijN
ijP
Index of Development of Basic Education for a certain level i of a certain unit j (where j may be a school, the education system of a state or a municipate, a geographic region or the whole country ).
ijIdeb
Proficiency level (Prova Brasil or Saeb), standardized average score obtained by students at level i and unit j.
Promotion, average flow rate at level i and unit j.
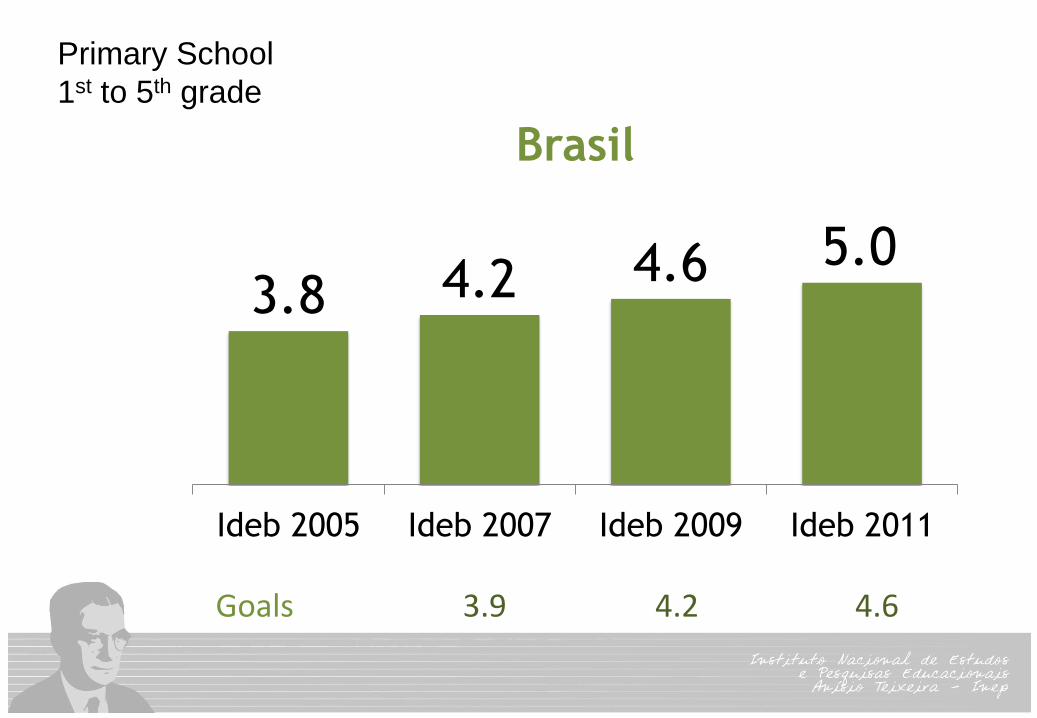
Primary School
1st to 5th grade
3.8 4.2 4.6 5.0
Ideb 2005 Ideb 2007 Ideb 2009 Ideb 2011
Brasil
Goals 3.9 4.2 4.6
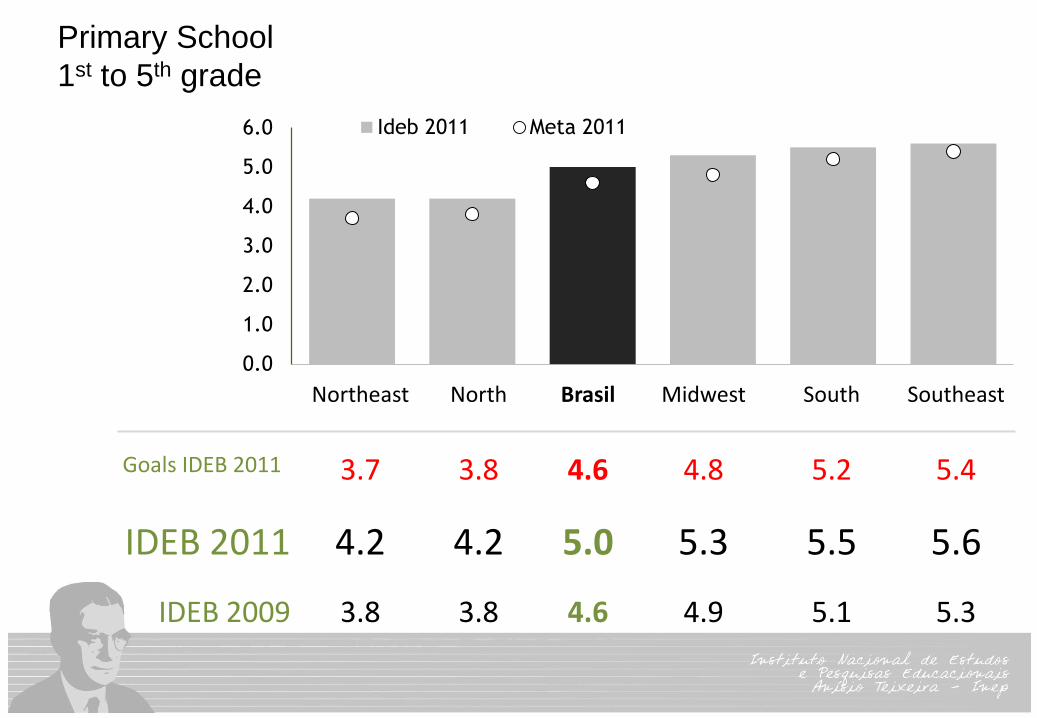
Primary School
1st to 5th grade
0.0
1.0
2.0
3.0
4.0
5.0
6.0 Ideb 2011 Meta 2011
Northeast North Brasil Midwest South Southeast
Goals IDEB 2011 3.7 3.8 4.6 4.8 5.2 5.4
IDEB 2011 4.2 4.2 5.0 5.3 5.5 5.6
IDEB 2009 3.8 3.8 4.6 4.9 5.1 5.3
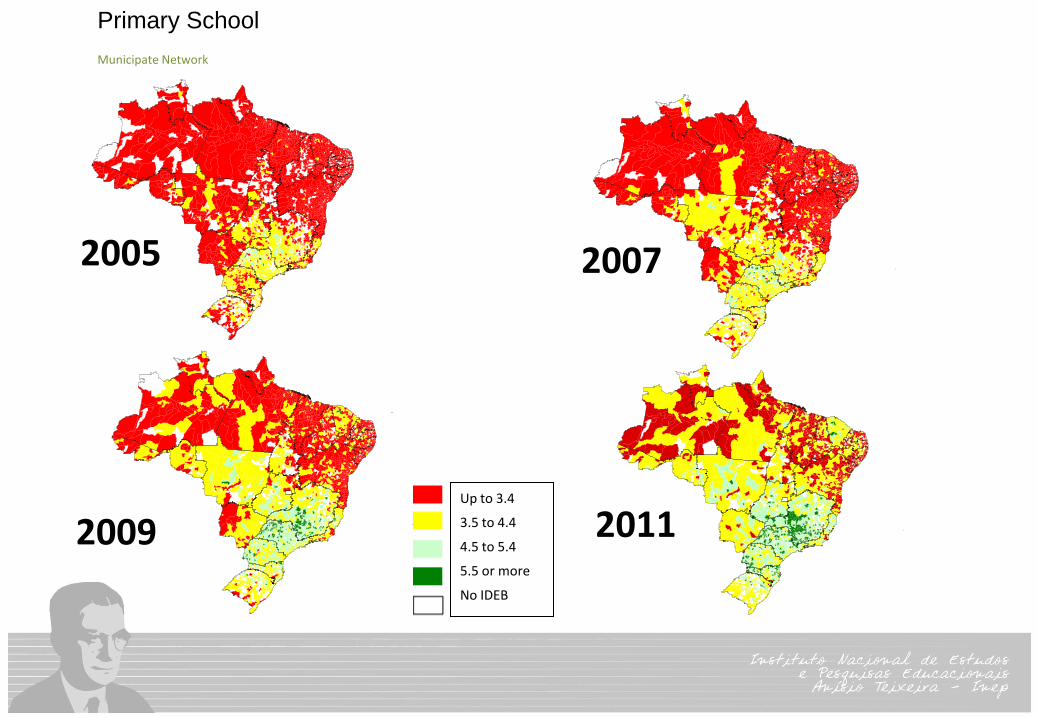
Primary School Municipate Network
2005 2007
2009 2011 Up to 3.4
3.5 to 4.4
4.5 to 5.4
5.5 or more
No IDEB
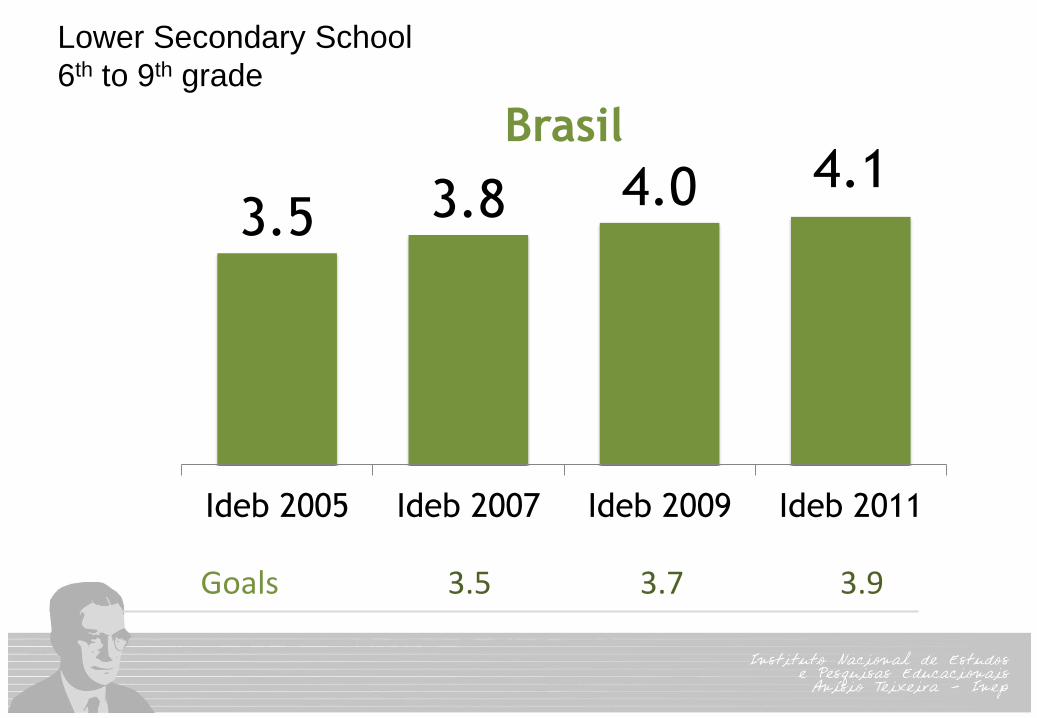
Lower Secondary School
6th to 9th grade
3.5 3.8 4.0 4.1
Ideb 2005 Ideb 2007 Ideb 2009 Ideb 2011
Brasil
Goals 3.5 3.7 3.9
0.0
1.0
2.0
3.0
4.0
5.0
6.0
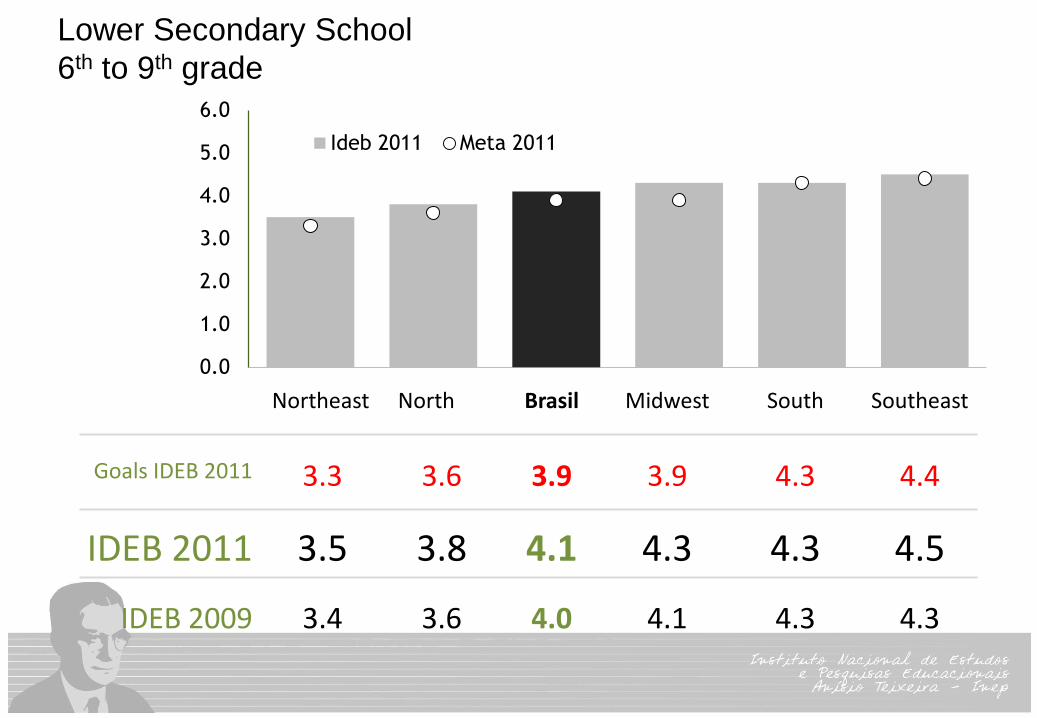
Ideb 2011 Meta 2011
Northeast North Brasil Midwest South Southeast
Goals IDEB 2011 3.3 3.6 3.9 3.9 4.3 4.4
IDEB 2011 3.5 3.8 4.1 4.3 4.3 4.5
IDEB 2009 3.4 3.6 4.0 4.1 4.3 4.3
Lower Secondary School
6th to 9th grade
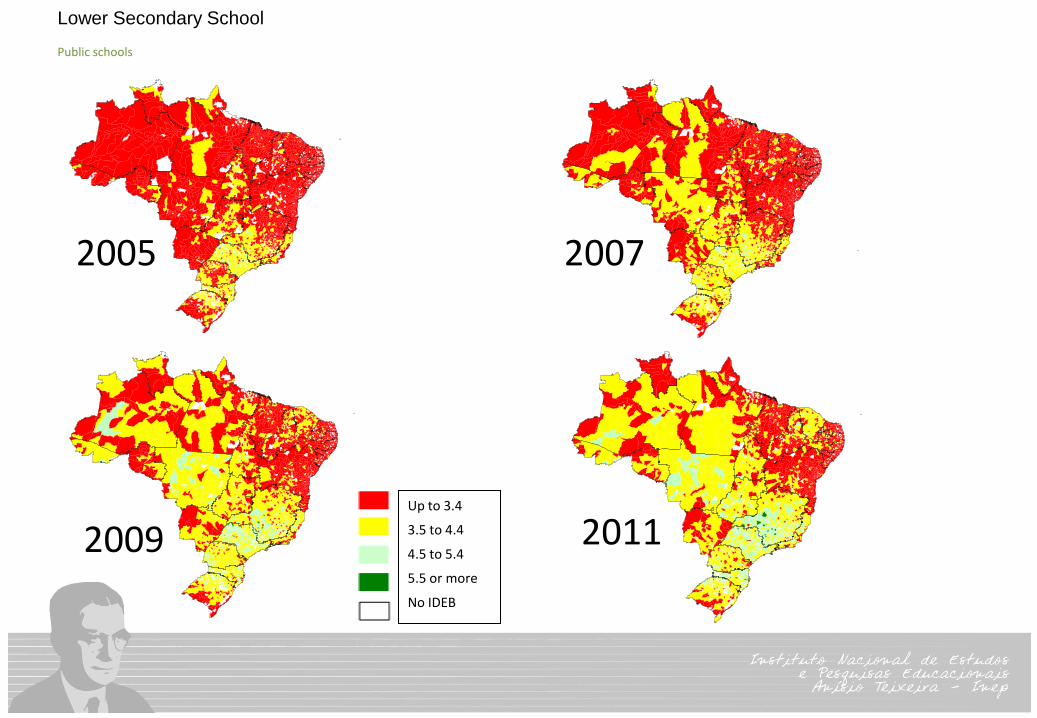
Lower Secondary School Public schools
2005 2007
2009 2011 Up to 3.4
3.5 to 4.4
4.5 to 5.4
5.5 or more
No IDEB
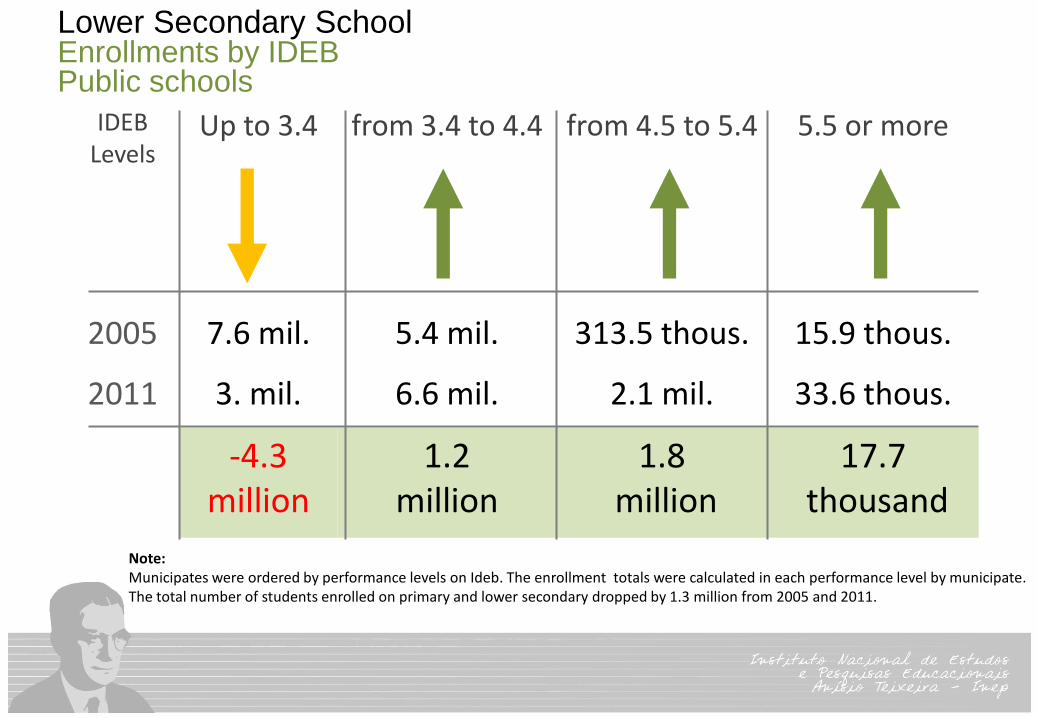
Lower Secondary School Enrollments by IDEB Public schools
Note: Municipates were ordered by performance levels on Ideb. The enrollment totals were calculated in each performance level by municipate. The total number of students enrolled on primary and lower secondary dropped by 1.3 million from 2005 and 2011.
IDEB Levels
Up to 3.4 from 3.4 to 4.4 from 4.5 to 5.4 5.5 or more
2005 7.6 mil. 5.4 mil. 313.5 thous. 15.9 thous.
2011 3. mil. 6.6 mil. 2.1 mil. 33.6 thous.
-4.3 million
1.2 million
1.8 million
17.7 thousand
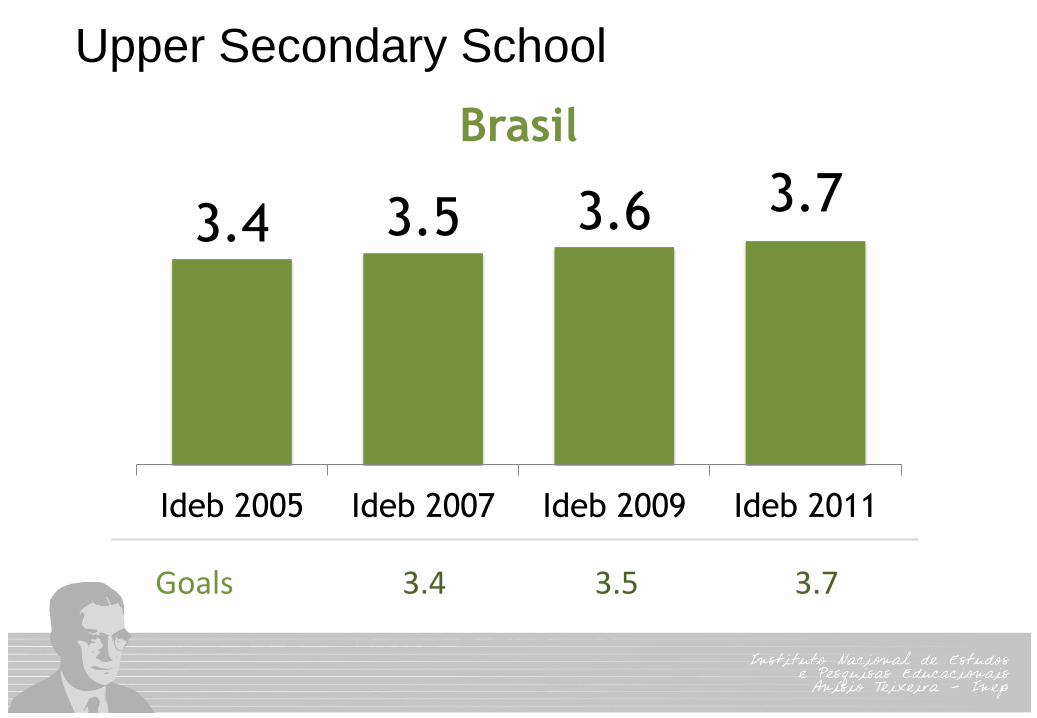
Upper Secondary School
3.4 3.5 3.6 3.7
Ideb 2005 Ideb 2007 Ideb 2009 Ideb 2011
Brasil
Goals 3.4 3.5 3.7
0.0
1.0
2.0
3.0
4.0
5.0
6.0 Ideb 2011 Meta 2011
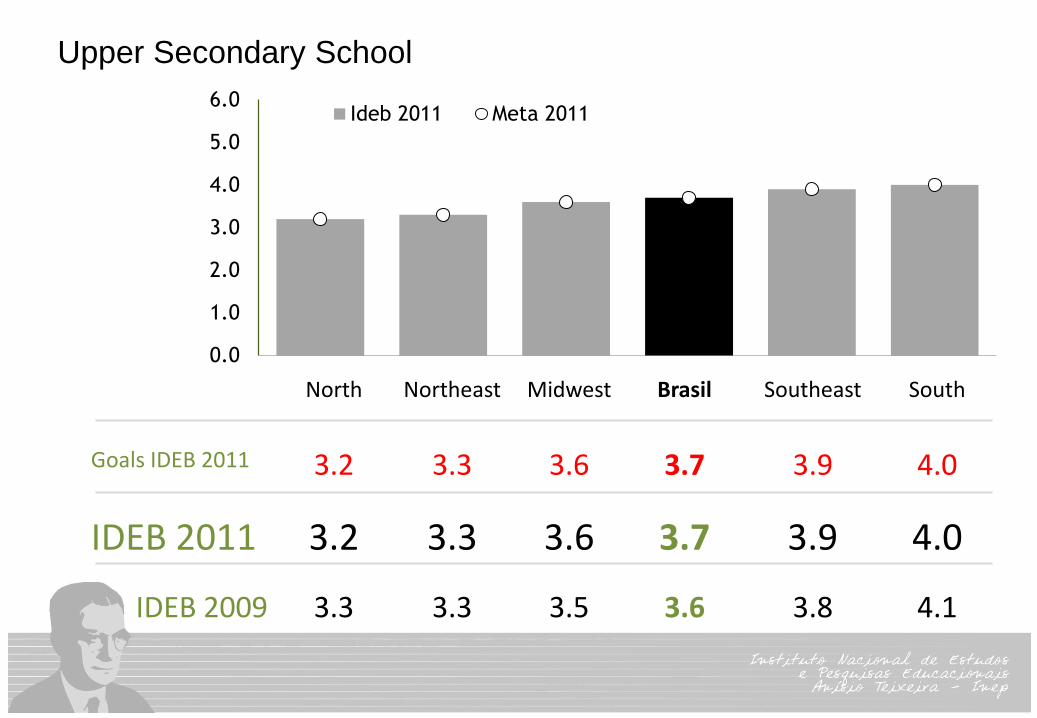
Upper Secondary School
North Northeast Midwest Brasil Southeast South
Goals IDEB 2011 3.2 3.3 3.6 3.7 3.9 4.0
IDEB 2011 3.2 3.3 3.6 3.7 3.9 4.0
IDEB 2009 3.3 3.3 3.5 3.6 3.8 4.1
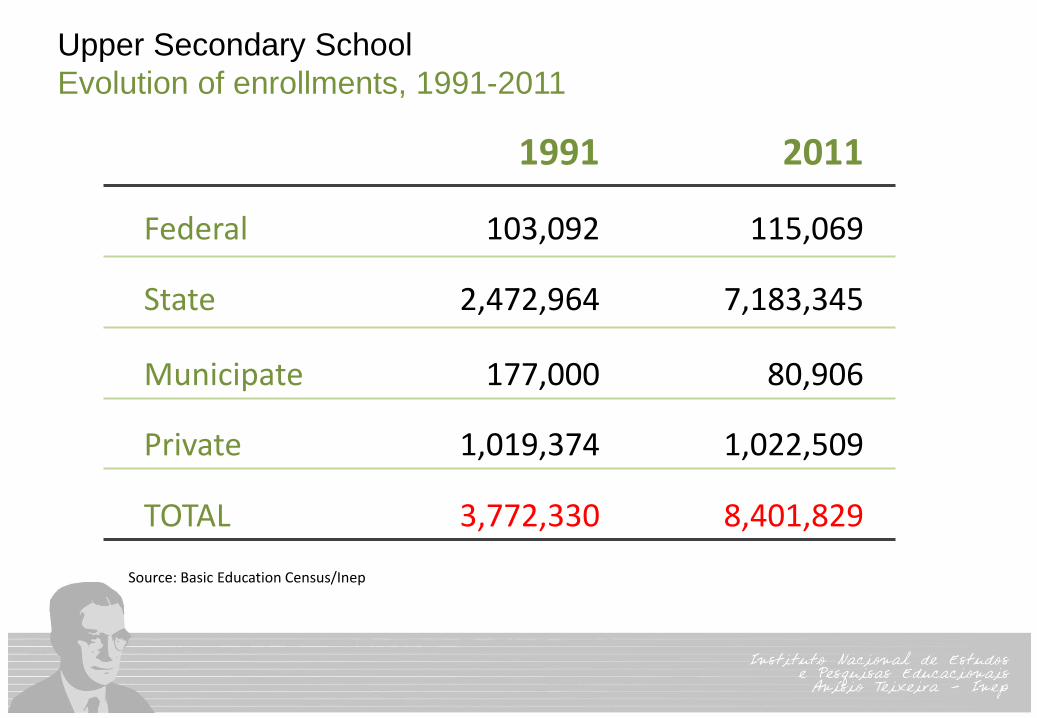
Upper Secondary School
Evolution of enrollments, 1991-2011
1991 2011
Federal 103,092 115,069
State 2,472,964 7,183,345
Municipate 177,000 80,906
Private 1,019,374 1,022,509
TOTAL 3,772,330 8,401,829
Source: Basic Education Census/Inep
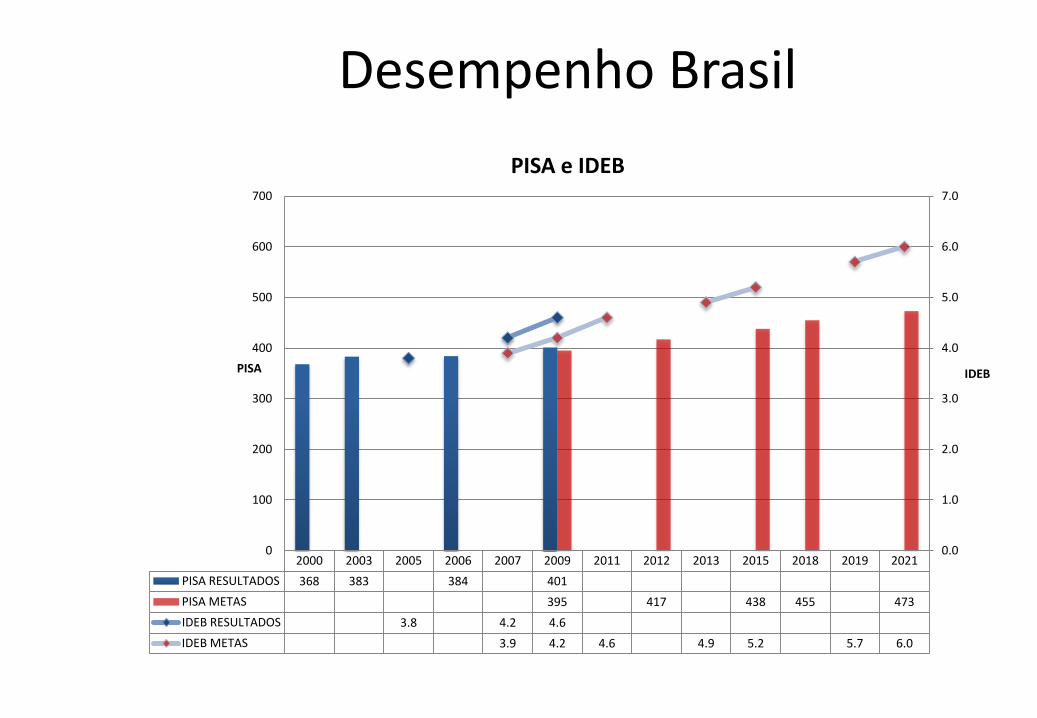
Desempenho Brasil
2000 2003 2005 2006 2007 2009 2011 2012 2013 2015 2018 2019 2021
PISA RESULTADOS 368 383 384 401
PISA METAS 395 417 438 455 473
IDEB RESULTADOS 3.8 4.2 4.6
IDEB METAS 3.9 4.2 4.6 4.9 5.2 5.7 6.0
0.0
1.0
2.0
3.0
4.0
5.0
6.0
7.0
0
100
200
300
400
500
600
700
IDEB PISA
PISA e IDEB