incentive pay practices survey: non-profit/ government organizations ... · survey: non-profit/...
TRANSCRIPT
WorldatWork andVivient Consulting
February 2014
Incentive Pay Practices Survey: Non-Profit/
Government Organizations
rese
arch
©2014 WorldatWork Any laws, regulations or other legal requirements noted in this publication are, to the best of the publisher’s knowledge, accurate and current
as of this report’s publishing date. WorldatWork is providing this information with the understanding that WorldatWork is not engaged, directly or by implication, in
rendering legal, accounting or other related professional services. You are urged to consult with an attorney, accountant or other qualified professional concerning
your own specific situation and any questions that you may have related to that.
No portion of this publication may be reproduced in any form without express written permission from WorldatWork.
Contact:
WorldatWork Customer Relations
14040 N. Northsight Blvd.
Scottsdale, Arizona USA
85260-3601
Toll free: 877-951-9191
Fax: 480-483-8352
www.worldatwork.org
About Vivient Consulting Since 2002, Vivient Consulting has provided independent compensation expertise to board compensation committees, chief executive officers and human resource professionals. Vivient works with public and private companies, and non-profit organizations. Clients represent many different industries, sizes and stages of growth. The firm’s partners deliver high-quality solutions in the areas of compensation strategy, executive pay, incentive-compensation plan design and employment contract negotiations. For more information about this study, email Bonnie Schindler at [email protected] or call (310) 426-2340.
Table of Contents Methodology…………………………………………………………………………………………………………………… 1
Overview…………….……………………….………………………………………………….………………………………2
Short-Term Incentives……………………………………………….……………………………………..………………3
Annual Incentives………………………………...…………………….……………………….……………….……… 4
Long-Term Incentives……………………………………………...…………………………………………………..….. 7
Summary……………………………………………………………………………………………………………………. 7
Detailed Survey Results………………….………………………………………………..………………………………… 8
Short-Term Incentives……………………………………………….…………………………….……...………..………8
Annual Incentives………………………………………………….……………………………………...……………10
Long-Term Incentives……………………………………………...………………………………..……………..…..…..15
Performance Awards………………………………………………………….………………………………...…….. 16
General……………………………………………………………...………………………………………….…...…..….. 17
Demographics……………………………………………………...………………………………………….………..….. 17
Participating Organizations……………………………………………………………………….…………………………19

WorldatWork and Vivient ConsultingIncentive Pay Practices Survey: Non-Profit/Government Organizations
1
METHODOLOGY In October 2013, Vivient and WorldatWork invited a sample of WorldatWork members working in non-publicly-traded organizations to answer an online survey about their companies’ incentive-pay practices. More than 175 participants from non-profit and government organizations responded to the survey, as did 190 participants from private, for-profit companies. Because of the large response from the sectors surveyed, 2 separate reports have been published: this report, “Incentive Pay Practices Survey: Non-Profit/Government Organizations,” and “Incentive Pay Practices Survey: Privately Held Companies.” A similar survey also was conducted by Deloitte Consulting and WorldatWork to examine the incentive pay practices at publicly-traded companies, resulting in a third report, “Incentive Pay Practices Survey: Publicly Traded Companies.” All 3 reports are available on the WorldatWork website. This report provides a high-level summary of the survey results. For detailed results, including the sample size by question, please see the Detailed Survey Results section beginning on page 8.

WorldatWork and Vivient ConsultingIncentive Pay Practices Survey: Non-Profit/Government Organizations
2
OVERVIEW U.S. non-profit and government organizations continue to use short-term cash incentives to motivate and reward employees, and to compete for talent, according to the 2013 Vivient Consulting and WorldatWork survey, “Incentive Pay Practices Survey: Privately Held Companies.” The survey of private companies was conducted previously in 2007 and then again in 2011. In 2013, the number of non-profit and government organization responses to the survey grew tremendously over time. In 2013, more than 175, up from more than 80 in 2011. This indicates interest among non-profit and government organizations are keenly interested in incentive-compensation practices and competitive data. As a result of the 2013 response size from non-profit and government organizations, a special report was created for these organizations. In 2013, 78% of non-profit and government organizations reported using short-term incentives (STIs), while 16% reported using long-term incentives (LTIs). (See questions 1 on page 8 and 24 on page 15).
Non-profits are more likely to use STIs than government organizations, but the practice is prevalent across both organizational types. LTIs are used sparingly at non-profits and were reported by only one government respondent.
(See questions 1a on page 8 and 24a on page 15).
Of the non-profit and government respondents, 76% are non-profits, such as charitable and education organizations. The remaining 24% of respondents are public-sector organizations, such as state, local and federal government entities. The most common industries represented in the survey are health care and social assistance (46%); educational services (14%); and public administration (10%). (See question 36 on page 18.) The size of non-profit and government organizations responding to the survey tends to be large. Of the respondents, 88% have more than 1,000 full-time equivalent (FTE) employees. Organizational budgets range from more than $5 billion to less than $100 million. More than 60% of the respondents report budgets of more than $1 billion. (See question 38 on page 19.) For the first time this year, private-company, non-profit and government incentive-pay practices can be compared directly to public-company counterparts. WorldatWork and Deloitte Consulting launched an incentive-pay practices survey for publicly traded companies at the same time as the private/non-profit/government survey. Vivient and Deloitte used several identical questions so that results can be compared across organizational types.
78%
16%
0%
25%
50%
75%
100%
Short-term Long-term
2013 Short- and Long-Term Incentive Prevalence
82%
19%
67%
3%0%
25%
50%
75%
100%
Short-term Long-term
2013 Short- and Long-Term Incentives by Organization Type
Non-profit Govt.

WorldatWork and Vivient ConsultingIncentive Pay Practices Survey: Non-Profit/Government Organizations
3
SHORT-TERM INCENTIVES Non-profit and government organizations favor simplicity by operating a limited number of STI plans. Of the respondents, 68% report having three or fewer STI plans in place. While simplicity is favored, 32% of respondents operate four or more plans, with some organizations reporting 16 or more STI plans. (See question 2 on page 8.)
For 2013, participants were asked whether they had any of the following eight types of STI plans: Annual Incentive Plan: A pay plan that is designed to reward the accomplishment of specific results. Rewards usually are tied to expected results identified at the beginning of the performance cycle. In contrast to bonuses, they are not primarily discretionary but may have a discretionary component. Discretionary Bonus Plan: A plan in which management determines the size of the bonus pool and the amounts to be allocated to specific individuals after a performance period. These have no predetermined formula or promises, and are not guaranteed.
Spot Awards: Spot awards recognize special contributions as they occur for a specific project or task. The project or task generally is accomplished in a short time period. Profit-Sharing Plan: A plan providing for employee participation in the profits of an organization. The plan normally includes a predetermined and defined formula for allocating profit shares among participants, and for distributing funds accumulated under the plan. However, some plans are discretionary. Gain-Sharing Plans: Any one of a number of incentive programs designed to share the results of productivity gains with employees as a group. Team/Small-Group Incentives: Any incentive program that focuses on the performance of a small group, usually a work team. These incentive programs often are used when measurable output is the result of group effort and individual contributions are difficult to separate from group effort. Retention Bonus: A payment or reward outside of an employee's regular salary that is offered as an incentive to keep a key employee on the job during a particularly crucial business cycle. Project Bonus: A form of additional compensation paid to an employee or department as a reward for successfully completing a specific project within a certain timeframe.
25%
24%
19%
5%
11%
10%
1%
5%
0% 20% 40% 60%
1
2
3
4
5
6-10
11-15
16+
Nu
mb
er o
f S
TI P
lan
s
Number of STI Plans at Organizations with an STI Plan

WorldatWork and Vivient ConsultingIncentive Pay Practices Survey: Non-Profit/Government Organizations
4
By far, the most common type of STI plan at non-profit and government organizations is an annual incentive plan (AIP). (See question 3 on page 8.)
More than one-third of respondents indicated that their organizations are planning to add or modify a short-term incentive plan in 2013. The most common reasons for an added or modified STI plan are to support a change in strategy (45%) and to align programs with market practices (35%). One in four respondents selected “other” as the reason for the STI addition or modification. “Other” responses provided include the political climate, need to improve employee engagement, a key technology project, organization impact of new health-care law, competition for talent, expansion of a current STI program, and to drive a metrics-based approach to rewards. Respondents provided their organizations’ approximate budgets for STIs as a percentage of operating budget for 2012 and projected budgets as a percentage of operating budget for 2013. Non-profits and government organizations report modest STI budgets. (See question 5 on page 9.)
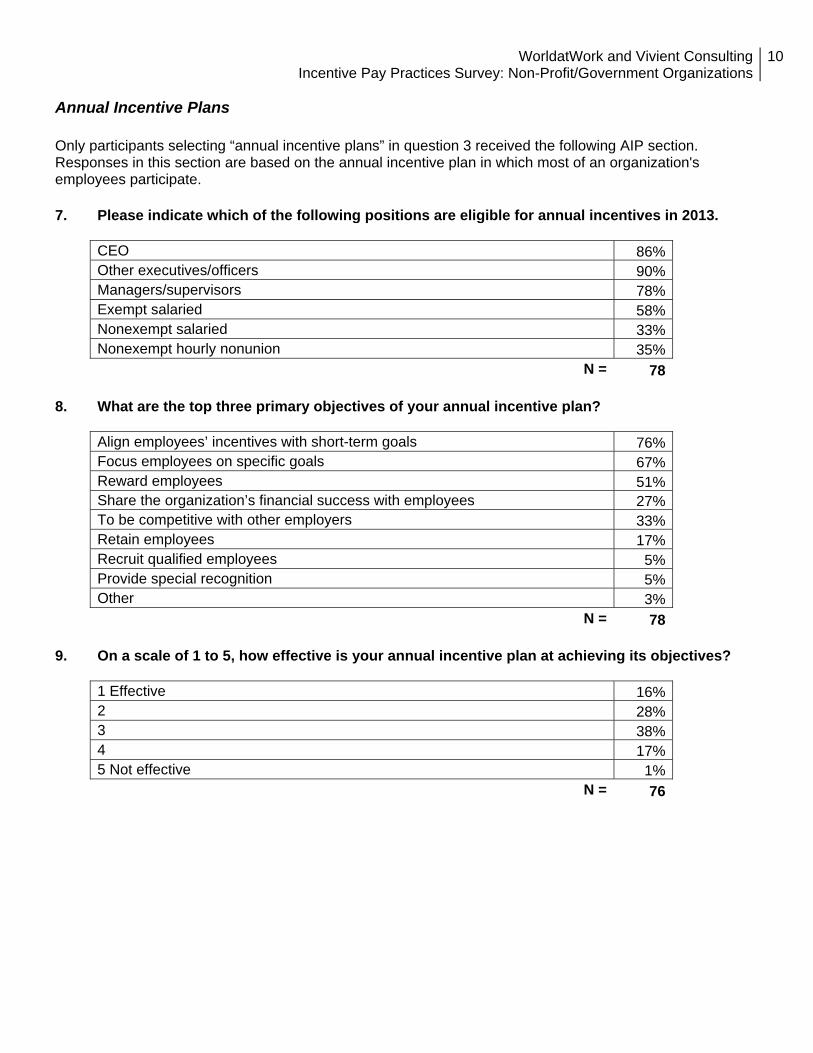
Annual Incentive Plans The most prevalent STI plan at non-profit and government organizations, AIPs generally are available to employees at the exempt salaried level and above. (See question 7 on page 10.)
The respondents with AIPs in place report on the primary objectives of their plans. The most common objectives among respondents at organizations with AIPs in place are to:
1. Align employees’ incentives with short-term goals (76% of respondents)
2. Focus employees on specific goals (67%)
3. Reward employees (51%)
2%
7%
21%
23%
38%
40%
42%
76%
0% 50% 100%
Profit-share
Gain-share
Project bonus
Team/group
Retention
Discretionary
Spot awards
AIP
2013 STI Prevalenceat Organizations with an STI Plan 5%
1%0%
4%
1%0%
0%
5%
10%
75th percentile Median 25 percentile
STI Budget/Spend as a Percent of Operating Budget 2012 vs. 2013
Projected
2012 2013 Proj.
35%
33%
58%
78%
90%
86%
0% 50% 100%
NonexemptHourly
NonexemptSalaried
ExemptSalaried
Managers/Supervisors
OtherExecutives
CEO
2013 AIP Eligibilityfor Organizations with AIPs in Place
WorldatWork and Vivient ConsultingIncentive Pay Practices Survey: Non-Profit/Government Organizations
5
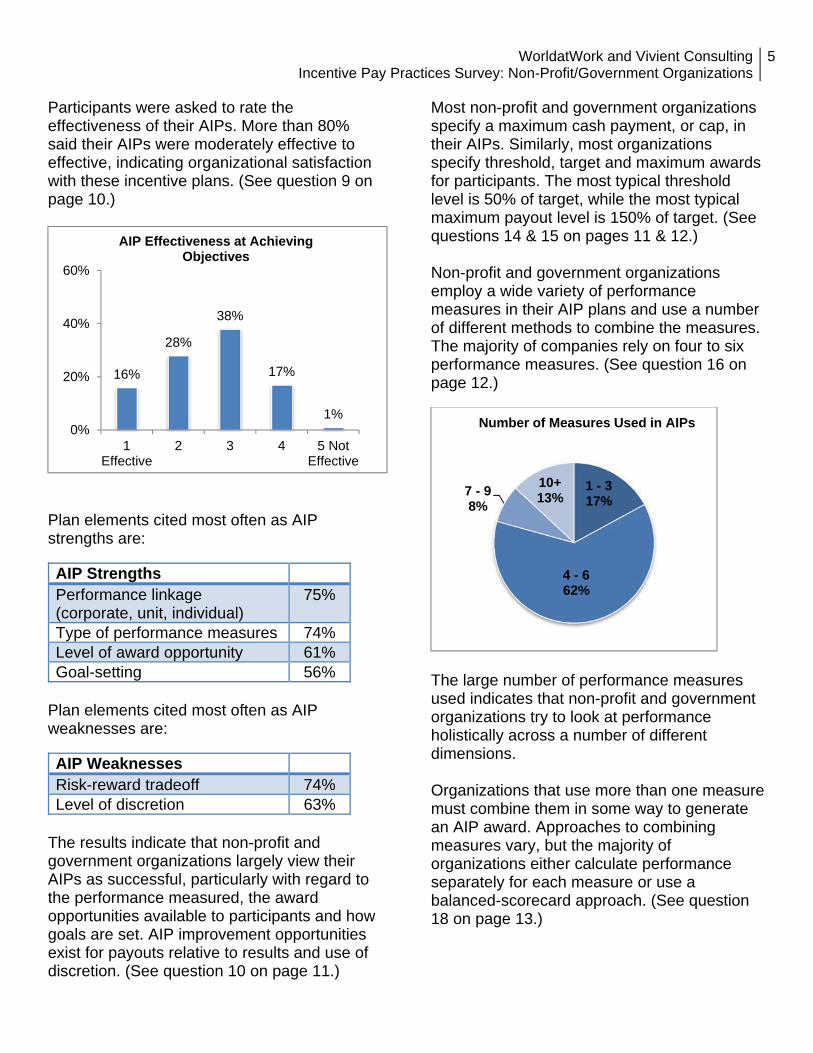
Participants were asked to rate the effectiveness of their AIPs. More than 80% said their AIPs were moderately effective to effective, indicating organizational satisfaction with these incentive plans. (See question 9 on page 10.)
Plan elements cited most often as AIP strengths are:
AIP Strengths Performance linkage (corporate, unit, individual)
75%
Type of performance measures 74% Level of award opportunity 61% Goal-setting 56%
Plan elements cited most often as AIP weaknesses are:
AIP Weaknesses Risk-reward tradeoff 74% Level of discretion 63%
The results indicate that non-profit and government organizations largely view their AIPs as successful, particularly with regard to the performance measured, the award opportunities available to participants and how goals are set. AIP improvement opportunities exist for payouts relative to results and use of discretion. (See question 10 on page 11.)
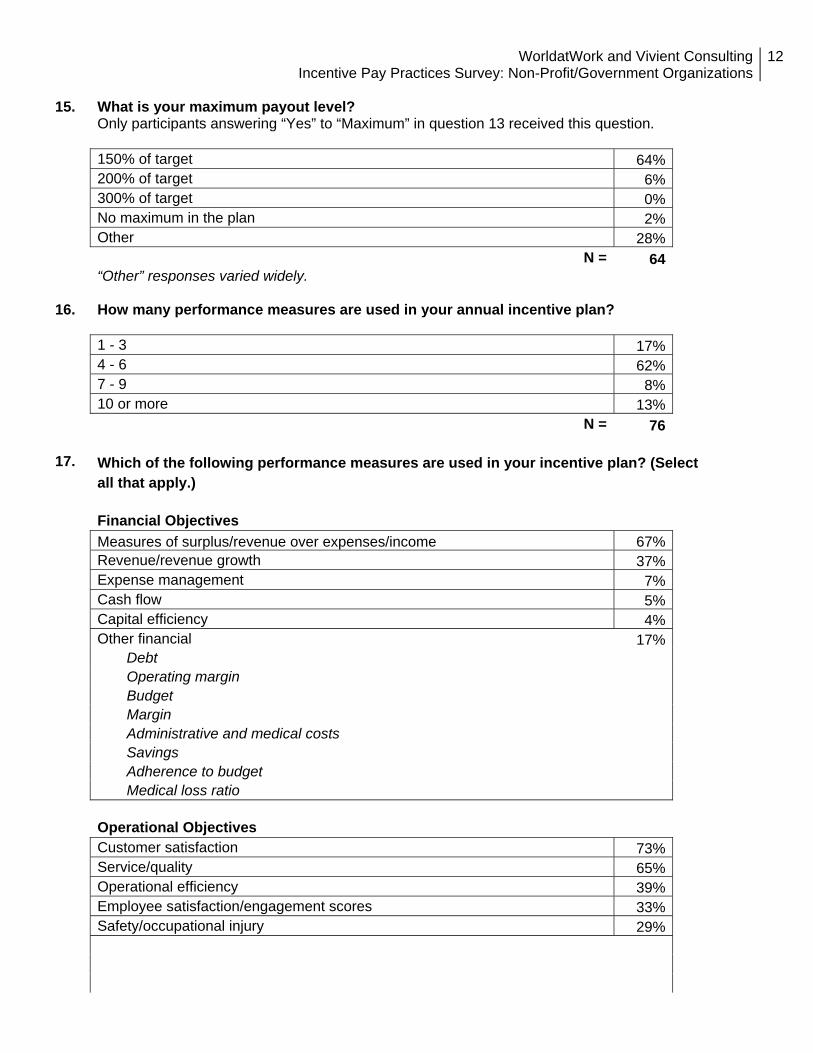
Most non-profit and government organizations specify a maximum cash payment, or cap, in their AIPs. Similarly, most organizations specify threshold, target and maximum awards for participants. The most typical threshold level is 50% of target, while the most typical maximum payout level is 150% of target. (See questions 14 & 15 on pages 11 & 12.) Non-profit and government organizations employ a wide variety of performance measures in their AIP plans and use a number of different methods to combine the measures. The majority of companies rely on four to six performance measures. (See question 16 on page 12.)
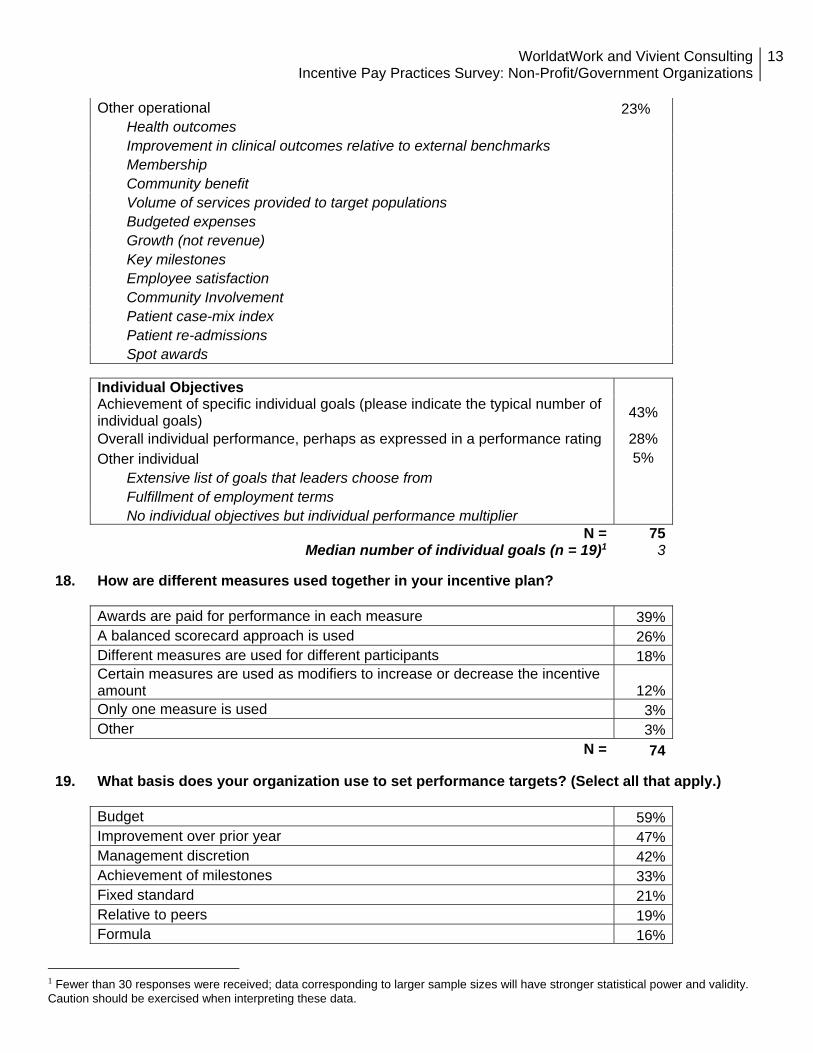
The large number of performance measures used indicates that non-profit and government organizations try to look at performance holistically across a number of different dimensions. Organizations that use more than one measure must combine them in some way to generate an AIP award. Approaches to combining measures vary, but the majority of organizations either calculate performance separately for each measure or use a balanced-scorecard approach. (See question 18 on page 13.)
16%
28%
38%
17%
1%0%
20%
40%
60%
1Effective
2 3 4 5 NotEffective
AIP Effectiveness at Achieving Objectives
1 - 317%
4 - 662%
7 - 98%
10+13%
Number of Measures Used in AIPs

WorldatWork and Vivient ConsultingIncentive Pay Practices Survey: Non-Profit/Government Organizations
6
Combining Measures to Calculate AIP
Awards Method Description
Additive Performance is calculated separately for each measure
39%
Balanced Scorecard
Balances financial and operational measures
26%
Multiplicative Certain measures are used as modifiers to increase or decrease the award
12%
One Measure Only one measure is used in AIP
3%
Other Includes using different measures for different participants
21%
Survey participants were asked which AIP performance measures they use in three different categories: financial, operational and individual. The results show that non-profit and government organizations favor operational measures over financial measures. Among operational measures, customer satisfaction is the most widely used measure, with service/quality a close second.
For financial measures, measures of surplus/revenue over expenses are the most widely used measures. (For-profit companies call such measures profit or income, while non-profits and government organizations use terms such as surplus, revenue over expenses, and profit.) In addition, revenue and revenue growth are used by more than a third of respondents. (See question 17 on page 12.)
Financial Measures Measures of surplus, revenue over expenses, or income
67%
Revenue/revenue growth 37% Expense management 7% Cash flow 5% Capital efficiency 4% Other financial 17%
Individual objectives are used but to a lesser degree, with more than 40% of respondents using achievement of specific goals and 28% using performance ratings as the basis for AIP awards. AIP performance targets at non-profit and government organizations typically are based on budgets, improvement over prior year, management discretion and achievement of milestones. In 2013, about two-thirds of non-profit and government organizations report that their plans use some level of subjectivity in AIP award decisions. Approximately two-thirds of the respondents with AIPs fund their plans using a pool that is established at the organization level based on financial and/or strategic goals. (See question 22 on page 14.)
Financial formula at org. level
67%
Sum of each individual’s
target17%
Financial formula at
division, unit or group level
8%
Discretion4% Other
4%
Method of Funding AIP Pool
Operational Measures Customer satisfaction 73% Service/quality 65% Operational efficiency 39% Employee satisfaction/ engagement scores
33%
Safety/occupational injury 29% Other operational objectives 23%

WorldatWork and Vivient ConsultingIncentive Pay Practices Survey: Non-Profit/Government Organizations
7
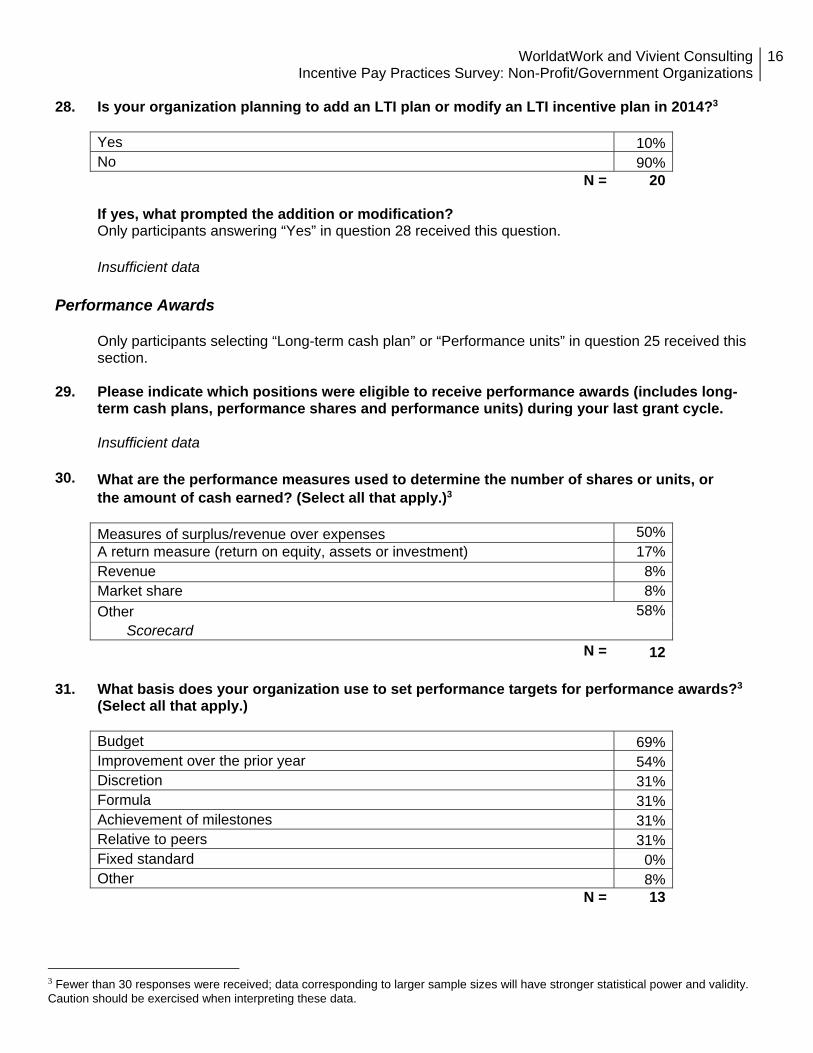
LONG-TERM INCENTIVES LTI plans are scarce at non-profit and government organizations, with only 16% of organizations reporting an LTI plan. The only types of LTI plans reported were performance awards, which include long-term cash and performance units: Long-Term Cash Plan: Cash awards in which payment is contingent on performance as measured against predetermined financial or strategic objectives over a multi-year period of time (typically three years). Performance Units: Grants of dollar-dominated units with value that is contingent on performance against predetermined objectives over a multi-year period of time. Because the LTI section of the survey had fewer than 30 responses, insufficient data were available to summarize here. The detailed results are reported at the end of this document. However, data corresponding to larger sample sizes will have stronger statistical power and validity. Caution should be exercised when interpreting these data.
SUMMARY A final question in the survey asked participants to select the top three tools that organizations have found effective in retaining top talent. Interestingly, the most prevalent responses are job advancement and promotion, additional base pay, short-term incentives and flexible work arrangements. (See question 34 on page 18.)
These responses indicate that cash compensation is important, but advancement opportunities and flexible work arrangements are even more important in retaining employees at non-profit and government organizations.
4%
6%
15%
17%
48%
48%
55%
74%
0% 50% 100%
Additional perqs
Long-termincentives/equity
Additional benefits
Specialized training
Flexible workarrangements
Short-term incentives
Additional base pay
Advancement
Retention Tools for Top Talent

WorldatWork and Vivient ConsultingIncentive Pay Practices Survey: Non-Profit/Government Organizations
8
DETAILED SURVEY RESULTS (Data effective as of October 2013)
SHORT-TERM INCENTIVES 1. Does your organization have a short-term incentive program?
Yes 78% No 22% N = 176 1a. Prevalence of short-term incentive programs by organization type: Yes No N Non-profit/not-for-profit 82% 18% 134 Public sector/government 67% 33% 42 Only participants answering “Yes” in question 1 received the following short-term incentive programs questions. 2. How many short-term incentive programs does your organization have?
1 25% 2 24% 3 19% 4 5% 5 11% 6 to 10 10% 11 to 15 1% 16 or more 5% N = 136 3. What types of short-term incentive plans does your organization use? (Select all that apply.)
Annual incentive plan (AIP) 76% Spot awards 42% Discretionary bonus plan 40% Retention bonus 38% Team/small-group incentives 23% Project bonus 21% Gain-sharing plans 7% Profit-sharing plan 2% N = 136 4. Is your organization planning to add a short-term incentive plan or modify a short-term
incentive plan for 2014? No 65% Yes 35% N = 136

WorldatWork and Vivient ConsultingIncentive Pay Practices Survey: Non-Profit/Government Organizations
9
4a. If yes, what prompted the addition or modification? (Select all that apply.)
Only participants answering “Yes” in question 4 received this question.
Change in strategy 45% Align programs with market practices 35% New management team 16% Reorganization 16% Company growth 6% New ownership 4% Other 24.5% Political climate Need to improve employee engagement Large technology projects Organization impact of new health-care law Competition for talent New measures Expansion of current program Drive metrics-based approach to rewards N = 49 5. What is your organization’s approximate total annual budget/spending for short-term
incentives (STIs), expressed as a percentage of operating income or budget?
STI budget/spending as a % of operating income/budget for:
2012 75th percentile 5% Median 1% 25 percentile 0% N = 58 2013 (Expected) 75th percentile 4% Median 1% 25 percentile 0% N = 58 6. If your organization uses retention bonuses, what are the circumstances under which they are
used? (Select all that apply.) Only participants selecting “Retention bonus” in question 3 received this question.
For difficult-to-recruit positions 74% To ensure business continuity for a critical project 64% To counter a competing offer 41% In preparation for or following a mergers-and-acquisitions transaction 15% Other 8% Retain critical talent in a turnaround Retain employees during leadership change Retain staff for new required services/offerings N = 39
WorldatWork and Vivient ConsultingIncentive Pay Practices Survey: Non-Profit/Government Organizations
10
Annual Incentive Plans Only participants selecting “annual incentive plans” in question 3 received the following AIP section. Responses in this section are based on the annual incentive plan in which most of an organization's employees participate. 7. Please indicate which of the following positions are eligible for annual incentives in 2013.
CEO 86% Other executives/officers 90% Managers/supervisors 78% Exempt salaried 58% Nonexempt salaried 33% Nonexempt hourly nonunion 35% N = 78 8. What are the top three primary objectives of your annual incentive plan?
Align employees’ incentives with short-term goals 76% Focus employees on specific goals 67% Reward employees 51% Share the organization’s financial success with employees 27% To be competitive with other employers 33% Retain employees 17% Recruit qualified employees 5% Provide special recognition 5% Other 3% N = 78 9. On a scale of 1 to 5, how effective is your annual incentive plan at achieving its objectives?
1 Effective 16% 2 28% 3 38% 4 17% 5 Not effective 1% N = 76

WorldatWork and Vivient ConsultingIncentive Pay Practices Survey: Non-Profit/Government Organizations
11
10. Please click and drag the following incentive-plan elements to the appropriate “Strength” or
“Weakness” box, with the strongest strength or weakness program showing at the top of the list.
Strength Weakness N Performance linkage (corporate, unit, individual) 75% 25% 73 Type of performance measures 74% 26% 70 Level of award opportunity 61% 39% 69 Goal setting 56% 44% 71 Level of discretion 37% 63% 63 Risk-reward tradeoff 26% 74% 53 11. How often are incentives paid during the year?
Annually 94% Twice a year 3% Quarterly 0% Other 4% N = 77 12. Does your incentive plan specify a maximum cash payment (i.e., a cap) for individuals in the
plan?
Yes 83% No 17% N = 76 13. Does your organization’s incentive program specify threshold, target and/or maximum awards
for participants?
Threshold (N =76) Yes 72% No 28% Target (N =77) Yes 88% No 12% Maximum (N =75) Yes 87% No 13% 14. What is your threshold payout level?
Only participants answering “Yes” to “Threshold” in question 13 received this question.
25% of target 11% 50% of target 52% 75% of target 11% No threshold in the plan 7% Other 19% N = 54 “Other” responses varied widely.
WorldatWork and Vivient ConsultingIncentive Pay Practices Survey: Non-Profit/Government Organizations
12
15. What is your maximum payout level?
Only participants answering “Yes” to “Maximum” in question 13 received this question.
150% of target 64% 200% of target 6% 300% of target 0% No maximum in the plan 2% Other 28% N = 64 “Other” responses varied widely.
16. How many performance measures are used in your annual incentive plan?
1 - 3 17% 4 - 6 62% 7 - 9 8% 10 or more 13% N = 76 17. Which of the following performance measures are used in your incentive plan? (Select all that apply.) Financial Objectives Measures of surplus/revenue over expenses/income 67% Revenue/revenue growth 37% Expense management 7% Cash flow 5% Capital efficiency 4% Other financial 17% Debt Operating margin Budget Margin Administrative and medical costs Savings Adherence to budget Medical loss ratio Operational Objectives Customer satisfaction 73% Service/quality 65% Operational efficiency 39% Employee satisfaction/engagement scores 33% Safety/occupational injury 29%
WorldatWork and Vivient ConsultingIncentive Pay Practices Survey: Non-Profit/Government Organizations
13
Other operational 23% Health outcomes Improvement in clinical outcomes relative to external benchmarks Membership Community benefit Volume of services provided to target populations Budgeted expenses Growth (not revenue) Key milestones Employee satisfaction Community Involvement Patient case-mix index Patient re-admissions Spot awards
Individual Objectives Achievement of specific individual goals (please indicate the typical number of
individual goals) 43%
Overall individual performance, perhaps as expressed in a performance rating 28% Other individual 5% Extensive list of goals that leaders choose from Fulfillment of employment terms No individual objectives but individual performance multiplier N = 75 Median number of individual goals (n = 19)1 3 18. How are different measures used together in your incentive plan?
Awards are paid for performance in each measure 39% A balanced scorecard approach is used 26% Different measures are used for different participants 18% Certain measures are used as modifiers to increase or decrease the incentive
amount 12% Only one measure is used 3% Other 3% N = 74 19. What basis does your organization use to set performance targets? (Select all that apply.)
Budget 59% Improvement over prior year 47% Management discretion 42% Achievement of milestones 33% Fixed standard 21% Relative to peers 19% Formula 16%
1 Fewer than 30 responses were received; data corresponding to larger sample sizes will have stronger statistical power and validity. Caution should be exercised when interpreting these data.

WorldatWork and Vivient ConsultingIncentive Pay Practices Survey: Non-Profit/Government Organizations
14
Other 10% System goals plus personal goals Achievement of industry standards Combination of methods Unknown N = 73 20. What is the linkage for your annual incentive program by position? Incentives for individuals
in the employee category are based on:
Corporate Division/
Unit Individual
CEO (n =65) 100% 17% 32% Other executives/officers (n = 67) 85% 54% 52% Managers/supervisors (n = 57) 68% 54% 70% Exempt salaried (n = 42) 71% 36% 55% Nonexempt salaried (n = 27) 78% 22% 44% Nonexempt hourly nonunion (n = 27) 70% 41% 33% 21. How much does supervisor discretion or subjectivity play a role in your incentive program?
Significantly 11% Somewhat 36% To a lesser degree 20% Not at all 32% N = 74 22. How is your incentive plan funded?
Financially based formula at the corporate level 67% Sum of each individual’s target 17% Financially based formula at the division, unit or group level 8% Discretionary 4% Other 4% N = 72 23. What methods do you use to communicate your incentive plan? (Select all that apply.)
Company provides annual communication of performance targets and links to
strategy 71%
Participant receives written plan document 43% Verbal description by human resources or supervisor 43% Not communicated 6% Other 7% Group meetings and video presentations Intranet N = 72

WorldatWork and Vivient ConsultingIncentive Pay Practices Survey: Non-Profit/Government Organizations
15
LONG-TERM INCENTIVES 24. Does your organization have an LTI plan?
No 84% Yes 16% N = 141 Only participants answering “Yes” in question 24 received the following long-term
incentive section.
24a. Prevalence of LTI programs by organization type:
Yes No N Non-profit/not-for-profit 19% 81% 109 Public sector/government 3% 97% 32 25. What type(s) of long-term incentive programs does your organization offer?2 (Select all that
apply.)
Long-term cash plan 90% Performance units 10% N = 20 No participants selected restricted stock, options, performance shares, phantom stock or stock
appreciation rights
26. What are the primary objectives of your LTI plan(s)? (Select up to three.)2
Retain employees 62% Align employees’ incentives with long-term goals 62% Focus employees on specific long-term goals 62% Reward employees 33% To be competitive with other employers 24% Recruit qualified employees 24% Promote employee ownership 5% Provide participants with a wealth-accumulation opportunity 5% Share the organization’s financial success with employees 0% Other 0% N = 21 27. How many LTI programs do you have? 2
1 95% 2 5% N = 20 No participants selected 3 or more plans.
2 Fewer than 30 responses were received; data corresponding to larger sample sizes will have stronger statistical power and validity. Caution should be exercised when interpreting these data.
WorldatWork and Vivient ConsultingIncentive Pay Practices Survey: Non-Profit/Government Organizations
16
28. Is your organization planning to add an LTI plan or modify an LTI incentive plan in 2014?3
Yes 10% No 90% N = 20 If yes, what prompted the addition or modification?
Only participants answering “Yes” in question 28 received this question. Insufficient data Performance Awards
Only participants selecting “Long-term cash plan” or “Performance units” in question 25 received this section.
29. Please indicate which positions were eligible to receive performance awards (includes long-
term cash plans, performance shares and performance units) during your last grant cycle.
Insufficient data 30. What are the performance measures used to determine the number of shares or units, or the amount of cash earned? (Select all that apply.)3
Measures of surplus/revenue over expenses 50% A return measure (return on equity, assets or investment) 17% Revenue 8% Market share 8% Other 58% Scorecard N = 12 31. What basis does your organization use to set performance targets for performance awards?3
(Select all that apply.)
Budget 69% Improvement over the prior year 54% Discretion 31% Formula 31% Achievement of milestones 31% Relative to peers 31% Fixed standard 0% Other 8% N = 13
3 Fewer than 30 responses were received; data corresponding to larger sample sizes will have stronger statistical power and validity. Caution should be exercised when interpreting these data.

WorldatWork and Vivient ConsultingIncentive Pay Practices Survey: Non-Profit/Government Organizations
17
32. What is the linkage for long-term performance awards by position?4
Long-term performance awards for individuals in the employee category are based on:
Org. Div./Team Individual CEO (n = 13) 100% 15% 8% Other executives/officers (n = 13) 100% 15% 8% Insufficient data below the executive level 33. What is the performance period for your organization’s performance awards?4
2 years 15% 3 years 85% N = 13 No respondents selected 1 year, 4 years or 5 or more years.
General 34. Please select the top three reward tools that your organization has found effective in retaining
top talent:
Job advancement/promotion 74% Additional base compensation 55% Short-term incentives or bonuses 48% Flexible work arrangements 48% Specialized training 17% Additional benefits 15% Long-term incentive/equity awards 6% Additional perquisites 4% Other 8% Organization's mission Retention bonuses On-the-spot awards Culture Anniversary awards Certification reimbursement Time off Retirement benefits Project bonuses N = 123 DEMOGRAPHICS
35. What is your organization type?
Non-profit/Not-for-profit (education organizations, charitable organizations, etc.) 76%
Public sector (local, state, federal government) 24% N= 176
4 Fewer than 30 responses were received; data corresponding to larger sample sizes will have stronger statistical power and validity. Caution should be exercised when interpreting these data.

WorldatWork and Vivient ConsultingIncentive Pay Practices Survey: Non-Profit/Government Organizations
18
36. Please select the industry that best describes your firm’s primary business.
Health care and social assistance 46% Educational services 14% Public administration 10% Finance and insurance 6% Utilities, oil and gas 6% Consulting, professional, scientific and technical services 2% Transportation 2% Other services (except public administration) 2% Arts, entertainment and recreation 2% Manufacturing 1% Retail trade 1% Information (includes publishing, IT technologies, etc.) 1% Management of companies and enterprises 1% Accommodations and food services 0% Agriculture, forestry, fishing and hunting 0% Computer and electronics 0% Mining 0% Real estate, and rental and leasing 0% Construction 0% Pharmaceuticals 0% Wholesale trade 0% Warehousing and storage 0% Other 7% Renewable energy research and development Membership association Regulatory organization Research and development Sports N = 124 37. How many full-time equivalent (FTE) employees does your organization have?
More than 5,000 50% 2,500 to 4,999 23% 1,000 to 2,499 15% 500 to 999 6% 100 to 499 4% Less than 100 2%
N = 125
WorldatWork and Vivient ConsultingIncentive Pay Practices Survey: Non-Profit/Government Organizations
19
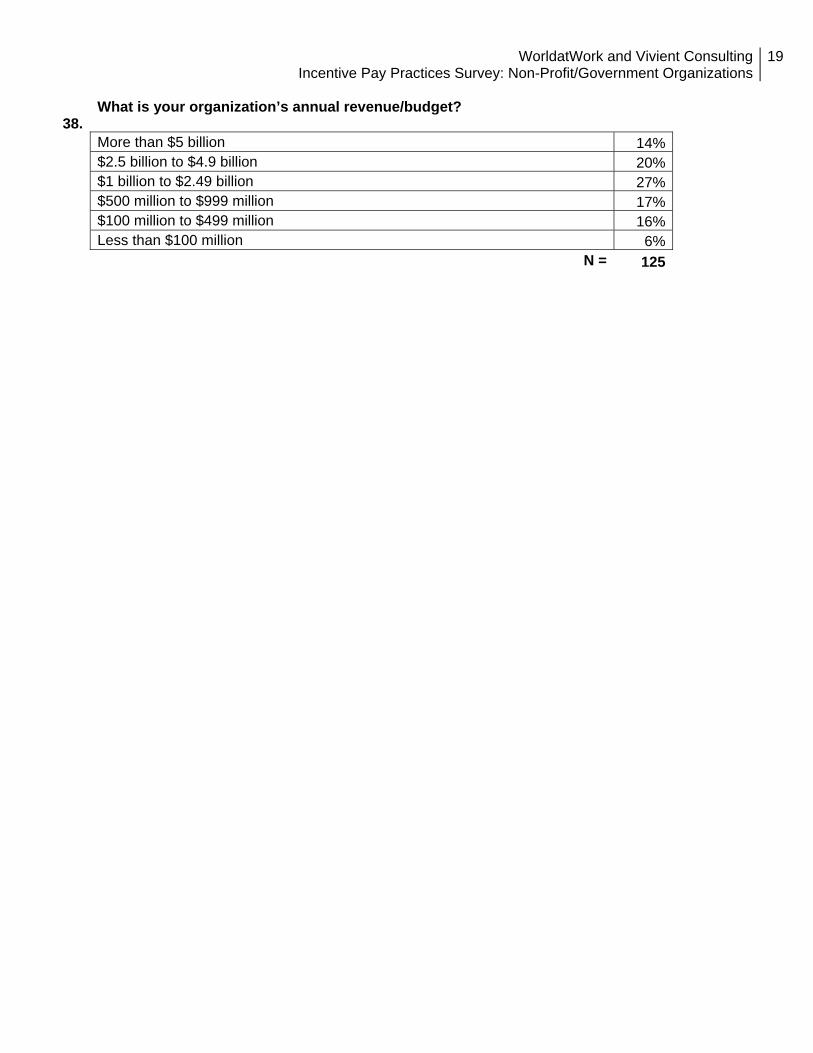
38. What is your organization’s annual revenue/budget?
More than $5 billion 14% $2.5 billion to $4.9 billion 20% $1 billion to $2.49 billion 27% $500 million to $999 million 17% $100 million to $499 million 16% Less than $100 million 6%
N = 125

WorldatWork and Vivient ConsultingIncentive Pay Practices Survey: Non-Profit/Government Organizations
20
Participating Organizations AAA Southern New England Advocate Health Care Akron General Health System Allina Health American Chemical Society Headquarters Aspirus, Inc. Babson College Banner Health Baptist Health South Florida Baystate Health Bexar County Boston medical center Botsford Health Care Broward Health CBIA Centura Health Charter Oak Health Center City of Portland, Oregon Cleveland Clinic Colorado Springs Utilities County of Chester Dakota County Dartmouth College District of Columbia Eastern Illinois University EmblemHealth Excellus BCBS Fallon Community Health Plan FDIC Federal Reserve Bank of Kansas City Federal Reserve Board FINRA Ga Chapter - Alzheimer's Assn Great River Energy Hackensack University Medical Center Hennepin Health System Independence Blue Cross Indiana State University Indiana University Health Inova Health Systems Institute for Defense Analyses Kaiser Foundation Health Plan, Inc. Kaiser Permanente Legacy Health Lifespan Corporation Lower Colorado River Authority Mayo Clinic McLaren Health Care Corp Medical College of Wisconsin Memorial Hermann Health System Metropolitan Washington Airports Authority Miami Dade College
Mission Health System, Inc Moffitt Cancer Center Montefiore Medical Center Mount Sinai Medical Center Navy Exchange Service Command (NEXCOM) Northwestern University Oakwood Healthcare, Inc. OCTA Orange County Government Owensboro Health Palmetto Health Parkland Health & Hospital System PCAOB Piedmont Healthcare Port Authority of NY&NJ Public Utility District #1 of Chelan County Purdue University Riverside Health System Roswell Park Cancer Institute Saint Francis Hospital & Medical Center Salt River Project Seattle Children's Hospital SLAC National Accelerator Laboratory Spectrum Health State of Oklahoma State of Wisconsin Susan G. Komen Sutter Health Sacramento Sierra Region Texas Christian University The Nebraska Medical Center The Queen's Medical Center UC Berkeley UCLA Health UMass Memorial Health Care United States Olympic Committee Unity Health Care University of New Mexico Hospitals University of Notre Dame UT Health Science Center San Antonio Villanova University Wake County NC Government Weill Cornell Medical College