in the uk alink t - parkinson's uk · parkinson’s in the uk (sections 4.1 and 5.1) using...
TRANSCRIPT

The incidence and prevalence of Parkinson’s in the UKResults from the Clinical Practice Research Datalink
Reference Report
The prevalence and incidence of Parkinson’s in the UK
December 2017
Contents
1. Introduction ..................................................................................................................................... 1
2 Methods ....................................................................................................................................... 2
2.1 Data source ............................................................................................................................ 2
2.2 Representativeness of CPRD data ......................................................................................... 3
2.3 Comparisons with other studies ............................................................................................ 3
3 The prevalence of Parkinson’s in the UK ..................................................................................... 6
3.1 Prevalence rates .................................................................................................................... 6
3.2 Numbers of people living with Parkinson’s ........................................................................... 9
4 The incidence of Parkinson’s in the UK ...................................................................................... 11
4.1 Incidence rates ..................................................................................................................... 11
4.2 Numbers of new diagnoses ................................................................................................. 14
4.3 Lifetime risk of Parkinson’s .................................................................................................. 16
5 Predicting future numbers ......................................................................................................... 17
5.1 Short-term projections ........................................................................................................ 17
5.2 Long-term predictions ......................................................................................................... 18
6 Appendix: supplementary information ...................................................................................... 20
6.1 Read codes (version 2) for diagnosis of Parkinson’s ........................................................... 20
6.2 Data sources for population data ........................................................................................ 20
1
1 Introduction
Parkinson's is a progressive neurological condition that causes a variety of motor symptoms (such as tremor, rigidity, and slowness of movement) and non-motor symptoms (such as cognitive and mood disorders, pain, and sleep disturbances). The cause is unknown but believed to involve both genetic and environmental factors. Parkinson's more commonly occurs in people over the age of 60 and men are more often affected than women1. The prevalence of Parkinson’s is the total number of people diagnosed and living with the condition in the population. The incidence of Parkinson’s is the number of new diagnoses that arise in a year. Therefore, prevalence indicates how widespread Parkinson’s is and incidence provides information about the risk of developing Parkinson’s. Clearly, these two epidemiological concepts are distinct but related to each other. For a long-term progressive condition such as Parkinson’s, prevalence will be higher than incidence. Understanding both prevalence and incidence is important in terms of supporting people living with Parkinson’s. Furthermore, as Parkinson’s is more common in older people and as the UK population is increasingly ageing (as life expectancy increases) we might expect to see the prevalence and incidence of Parkinson’s increasing over time. This increase could impact on associated health and social care services for people with Parkinson’s. This research report estimates age and gender-specific prevalence and incidence rates for Parkinson’s in the UK (Sections 4.1 and 5.1) using data from the Clinical Practice Research Datalink. These rates are applied to the whole population to provide estimates of the number of people living with Parkinson’s in the UK (Section 4.2) and the number of new diagnoses in a year (Section 5.2) in 2015. The incidence rates are then used to calculate the lifetime risk of being diagnosed with Parkinson’s (Section 5.3). Predictions for the future are also made by applying these rates to projected UK populations (Section 6).
1 Kalia LV, Lang AE. Parkinson's disease. Lancet. 2015 Aug 29;386(9996):896-912. Epub 2015 Apr 19.
2
2 Methods
2.1 Data source Information for this study was obtained from the Clinical Practice Research Datalink (CPRD) using the primary care database (GOLD). GOLD comprises the anonymised, longitudinal medical records of patients registered with contributing GP practices across the UK. The database currently includes over 22 million patients from 1987 onwards, of which information is currently being collected on over 5 million active patients. These patients are considered representative of the general UK population with respect to age, sex and ethnicity2. Data for this study was taken from the May 2016 static version of CPRD GOLD. The study population consisted of patients aged 20 or over with a record for Parkinson’s in their clinical or referral file during the period 1 January 1988 to 31 December 2015. Parkinson’s patients were identified by the presence of a definite Read code3 for Parkinson’s within their clinical or referral records (the Read codes are listed in Section 7). Patients aged under 20 were excluded because the likely prevalence and incidence of Parkinson’s in those aged under 20 are too small to calculate from this data source. Patients with less than 6 months of up-to-standard follow-up in the CPRD were also excluded as a case. Up-to-standard follow-up is the period of patient follow-up that had occurred on or after the date when a practice was regarded as having high quality data recorded. Prevalence was defined as a medical diagnosis of Parkinson’s (new or pre-existing) documented in the patient’s clinical or referral record. The numerator consists of the total number of Parkinson’s patients who had their Parkinson’s diagnosis documented on or before the 31 December of the calendar year of interest and who were alive and registered in a CPRD practice in that year. Denominator data consisted of the count of all acceptable patients who were alive and registered at a CPRD contributing practice at the mid-point (1 July) of each calendar year of interest. The start of observation was defined as the maximum of the patient first registration date, the practice up-to-standard date, or the 1 July of the calendar year of interest. The end of observation was defined as the minimum of the practice last collection date, the patient transfer out date, CPRD derived death date or 1 July of the calendar year of interest. Incidence was defined as the first ever medical diagnosis of Parkinson’s that the GP recorded in the patient clinical or referral record. A Parkinson’s diagnosis was counted only once during the study period. The numerator consisted of the total number of patients receiving a first diagnosis of Parkinson’s during each calendar year of interest. Patients had at least 1 day of follow-up during the calendar year of interest. The denominator consisted of the sum of the person years of follow-up of patients who were alive and registered at a CPRD contributing practice at any time during each calendar year of interest. The start of observation was defined as the maximum of the patient first registration date, the practice up-to-standard date, or the 1 January of the calendar 2 Herrett E, Gallagher AM, Bhaskaran K, Forbes H, Mathur R, van Staa T, Smeeth L. Data resource profile: Clinical Practice Research Datalink (CPRD). Int J Epidemiol 2015;44:827–36. 3 Read codes are a coded thesaurus of clinical terms used in the NHS since 1985. They form the standard vocabulary by which clinicians record patient findings and procedures in health and social care IT systems in primary care. For further details see https://data.gov.uk/dataset/uk-read-code/resource/2c472e86-25ed-4c36-bfc9-cca21a6d4caf.
3
year of interest. The end of observation was defined as the minimum of the practice last collection date, the patient transfer out date, CPRD derived death date or 31 December of the calendar year of interest. In this report, prevalence and incidence rates are expressed as the number per 100,000 person-years and 95% confidence intervals for these rates have been calculated using a Poisson distribution. CPRD supplied the data as a series of large tables with counts of the population and the number identified with Parkinson’s split by year, age (in 5-year bands), gender, and country. Table cells comprising 0-4 people with Parkinson’s were recorded as “<5” in line with CPRD small cell policy and in these instances the population counts were recorded as “Not reported”. This means that at times, it is not possible to calculate prevalence and incidence rates for every gender and age-group in each country of the UK because of the small number of cases identified in the CPRD data. 2.2 Representativeness of CPRD data The age and gender distribution of the CPRD data was compared to that of the UK population to assess the representativeness of the CPRD data. The UK population data is the Office of National Statistics population estimates for the UK for mid-20154. Overall, the CPRD population in 2015 comprises 5.1% of the UK population aged 20 or above. The CPRD population is slightly older than the UK population as a whole which may suggest that young people are somewhat less likely than older people to register with a GP practice. There is also a very small difference with regard to gender as there are slightly more males in the CPRD population than in the UK population as a whole. The differences are small and there is no evidence that the CPRD population is markedly different from the UK population as a whole in terms of age and gender. However, to get the most accurate population estimates, it is necessary to use age and gender-specific prevalence rates rather than overall rates based on the CPRD population. As the incidence and prevalence of Parkinson’s is more common in men and increases markedly by age, applying overall rates based on the CPRD population would over-estimate UK population numbers. 2.3 Comparisons with other studies The prevalence and incidence rates calculated in this study depend both on Parkinson’s being accurately diagnosed in a patient and then that diagnosis being recorded electronically by a primary care practice. In terms of accurate recording, CPRD undertakes a number of data quality checks to identify problems and a number of published studies have sought to validate CPRD data. In terms of accurate diagnosis, some research5 has found evidence of varying incidence rates across different studies particularly in the most elderly which could suggest that Parkinson’s is underdiagnosed in the older age-groups perhaps because of symptoms being attributed to ageing or because of multiple health conditions that make it more difficult to isolate Parkinson’s as the cause of particular symptoms. There are also concerns that Parkinson’s may be more difficult to diagnose in the early stages of the condition and that this may disproportionately affect younger people.
4 See appendix for further details of data source. 5 For example: Hirsch L, Jette N, Frolkis A, Steeves T, Pringsheim T. The incidence of Parkinson's disease: a systematic review and meta-analysis. Neuroepidemiology. 2016;46(4):292-300. Epub 2016 Apr 23

4
Therefore, it is important to compare the prevalence and incidence rates estimated in this study to those of other published studies in order to assess the reliability of the results discussed here. This has been done previously with CPRD data in relation to Parkinson’s where the authors6 assessed their incidence rates against other published studies and found them comparable. There are numerous studies estimating the prevalence and incidence of Parkinson’s but not all show age and gender-specific rates. While overall population incidence and prevalence rates can be compared, these will be affected by differences in the age and gender distribution of the study populations. Hence, the more precise comparisons are of the age and gender-specific rates. However, these age and gender-specific rates may still be affected by changes over time as an increase in life expectancy is likely to increase the incidence and prevalence of Parkinson’s over time, particularly in the older age-groups. It is valuable to consider community-based studies as these involve the clinical checking of the diagnosis and may even include a follow-up some time later to confirm the initial diagnosis. These studies are expensive and time-consuming to undertake though and so they tend to be based only in specific geographical areas. While they are likely to be very reliable in terms of accurate diagnosis, these studies may not be fully generalisable to the wider UK population because of differences between the study population and the UK population as a whole. Furthermore, given that Parkinson’s is a relatively rare condition, some studies do not have a large enough study population to make accurate estimates. For example, the numbers of people identified with Parkinson’s in community-based studies can be very small (for example, fewer than 5 people in a specific gender and age-group) and so there will be more uncertainty about estimates based on very small numbers. Another type of study is a meta-analysis where the data from many studies are combined to provide a new set of estimates that are a form of weighted average across the studies. This is done to reduce some of the uncertainty associated with small studies. Age and gender-specific prevalence rates from this study were compared with those of 4 community-based studies and a global meta-analysis of 47 studies7. The age and gender-specific incidence estimates in this study were compared to 3 community-based studies, another routine data source (the Health Improvement Network (THIN) database which is based on anonymised GP
6 Hernan MA, Logroscino G, Rodriguez LA. A prospective study of alcoholism and the risk of Parkinson’s disease. J Neurol 2004; 251 Suppl. 7: vII14–7 7 Wickremaratchi MM, Perera D, O'Loghlen C, Sastry D, Morgan E, Jones A, Edwards P, Robertson NP, Butler C, Morris HR, Ben-Shlomo Y. Prevalence and age of onset of Parkinson's disease in Cardiff: a community based cross sectional study and meta-analysis J Neurol Neurosurg Psychiatry. 2009 Jul;80(7):805-7. Schrag A, Ben-Shlomo Y, Quinn NP. Cross sectional prevalence survey of idiopathic Parkinson's disease and Parkinsonism in London. BMJ. 2000 Jul 1;321(7252):21-2. Porter B, Macfarlane R, Unwin N, Walker R. The prevalence of Parkinson's disease in an area of North Tyneside in the North-East of England. Neuroepidemiology. 2006;26(3):156-61. Epub 2006 Feb 21. Mutch WJ, Dingwall-Fordyce I, Downie AW, Paterson JG, Roy SK. Parkinson's disease in a Scottish city. Br Med J (Clin Res Ed). 1986 Feb 22;292(6519):534-6. Pringsheim T, Jette N, Frolkis A, Steeves TD. The prevalence of Parkinson's disease: a systematic review and meta-analysis. Mov Disord. 2014 Nov;29(13):1583-90. Epub 2014 Jun 28. Review.

5
data), and a recent meta-analysis of 27 studies8. Bearing in mind the differences in time periods and definitions used in the studies, these comparisons indicate that the prevalence and incidence estimates from this study are broadly comparable to the other studies considered. For the vast majority of age and gender-specific rates, there were no statistically significant differences between the estimates in this study and those in the other published studies. Where significant differences exist, these can be explained by differences in the time periods of the studies or in the definitions of Parkinson’s used. For example, prevalence estimates for the older age-groups tend to be somewhat higher in this study than in some earlier studies but this is likely to be the effect of an ageing population increasing the prevalence of Parkinson’s over time. Overall, these comparisons are reassuring as they suggest that the prevalence and incidence estimates from this study are in line with those found in other studies, including community-based studies where the diagnosis is checked.
8 Horsfall L, Petersen I, Walters K, Schrag A. Time trends in incidence of Parkinson's disease diagnosis in UK primary care. J Neurol. 2013 May;260(5):1351-7. Epub 2012 Dec 23. Caslake R, Taylor K, Scott N, Gordon J, Harris C, Wilde K, Murray A, Counsell C. Age-, gender-, and socioeconomic status-specific incidence of Parkinson's disease and parkinsonism in northeast Scotland: the PINE study. Parkinsonism Relat Disord. 2013 May;19(5):515-21. Epub 2013 Feb 23. Duncan GW, Khoo TK, Coleman SY, Brayne C, Yarnall AJ, O'Brien JT, Barker RA, Burn DJ. The incidence of Parkinson's disease in the North-East of England. Age & Ageing. 2014 Mar;43(2):257-63. Epub 2013 Jul 23. Foltynie T, Brayne CE, Robbins TW, Barker RA. The cognitive ability of an incident cohort of Parkinson's patients in the UK. The CamPaIGN study. Brain. 2004 Mar;127(Pt 3):550-60. Epub 2003 Dec 22. Hirsch L, Jette N, Frolkis A, Steeves T, Pringsheim T. The incidence of Parkinson's disease: a systematic review and meta-analysis. Neuroepidemiology. 2016;46(4):292-300. Epub 2016 Apr 23.
6
3 The prevalence of Parkinson’s in the UK
3.1 Prevalence rates As Parkinson’s is known to be more common in men and in older people, it is important to calculate age and gender-specific prevalence rates. Calculating rates, as opposed to numbers, enables the data to be standardised so different gender and age-groups can be compared. Another benefit of calculating rates is that these rates can then be applied to any population (where there is an age and gender breakdown of the population available) to estimate the numbers of people living with Parkinson’s in a particular geographical area or by gender and age-group. Age and gender-specific prevalence rates for the UK in 20159 are shown in Table 1. This analysis demonstrates that the prevalence of Parkinson’s increases with age and is also higher in men than in women. Parkinson’s is rare in those aged under 40 as the prevalence rate is just 1 or 2 people in every 100,000 aged 20-29 and 4 or 5 people in every 100,000 aged 30-39. Prevalence increases sharply with age with the prevalence for those aged 80-84 being 1,696 per 100,000 people which is equivalent to around 1.7% of this age-group. From age 85 onwards prevalence rates seem to level off and even fall but this may be related to other factors such as a higher mortality rate in very old people and the difficulty in diagnosing Parkinson’s in very elderly people where symptoms such as stiffness and slowness in movement may be attributed to ageing or other health concerns. Interestingly, prevalence rates almost double every 5-year interval between 50 and 69 years for both men and women. Table 1 shows prevalence rates split by gender (where numbers allow) which indicates significantly lower prevalence rates in women. Prevalence rates for men aged 50-89 were more than 1.5 times higher (1.58-2.06) than rates for women in the same 5-year age band. Figure 1 summarises these differences by age and gender.
9 Prevalence rates for each of the 5 years between 2011 and 2015 were compared to check that there was nothing unusual about the 2015 prevalence rates. Generally, these prevalence rates were found to be stable with only minor variations from year to year and none of the differences were statistically significant. This is unsurprising as many of the same people will appear in the data each year because Parkinson’s is a long-term progressive condition. The prevalence data will change each year only to the extent that newly diagnosed people with be added, people who have died will no longer appear in the data, and some people will move address in or out of CPRD GP practices areas.

7
Table 1 UK 2015 prevalence rates of Parkinson’s by age and gender Gender Age CPRD population Number with
Parkinson’s Prevalence rate
per 100,000 95% confidence
interval All 20-29 398,753 7 1.8 0.7 3.6 All 30-39 424,020 19 4.5 2.7 7.0 All 40-49 471,034 67 14.2 11.0 18.1 All 50-54 244,505 160 65.4 55.7 76.4 All 55-59 212,478 272 128.0 113.3 144.2 All 60-64 183,136 464 253.4 230.8 277.5 All 65-69 189,128 912 482.2 451.4 514.6 All 70-74 144,192 1,243 862.0 814.8 911.3 All 75-79 112,428 1,442 1,282.6 1,217.2 1,350.5 All 80-84 85,144 1,444 1,696.0 1,609.6 1,785.7 All 85-89 53,730 874 1,626.7 1,520.6 1,738.2 All 90+ 32,922 405 1,230.2 1,113.3 1,356.0 Female 50-54 81,937 40 48.8 34.9 66.5 Female 55-59 105,418 101 95.8 78.0 116.4 Female 60-64 92,268 164 177.7 151.6 207.1 Female 65-69 96,793 308 318.2 283.7 355.8 Female 70-74 75,414 510 676.3 618.8 737.6 Female 75-79 60,822 563 925.7 850.8 1,005.4 Female 80-84 48,544 638 1,314.3 1,214.3 1,420.3 Female 85-89 33,203 418 1,258.9 1,141.1 1,385.6 Male 50-54 84,670 75 88.6 69.7 111.0 Male 55-59 107,060 171 159.7 136.7 185.5 Male 60-64 90,868 300 330.1 293.8 369.7 Male 65-69 92,335 604 654.1 603.0 708.5 Male 70-74 68,778 733 1,065.7 990.0 1,145.8 Male 75-79 51,606 879 1,703.3 1,592.5 1,819.7 Male 80-84 36,600 806 2,202.2 2,052.8 2,359.6 Male 85-89 20,527 456 2,221.5 2,022.2 2,435.0 Table note: the number of people with Parkinson’s is too small to be split by gender for those aged 20-49. The number of people aged 90+ is too small to reliably calculate prevalence rates by gender. Rates for age 50-54 split by gender are based on England rather than UK. 95% confidence intervals for rates are calculated using a Poisson distribution.

8
Figure 1 Prevalence rates (per 100,000) of Parkinson’s in UK by age and gender (2015)
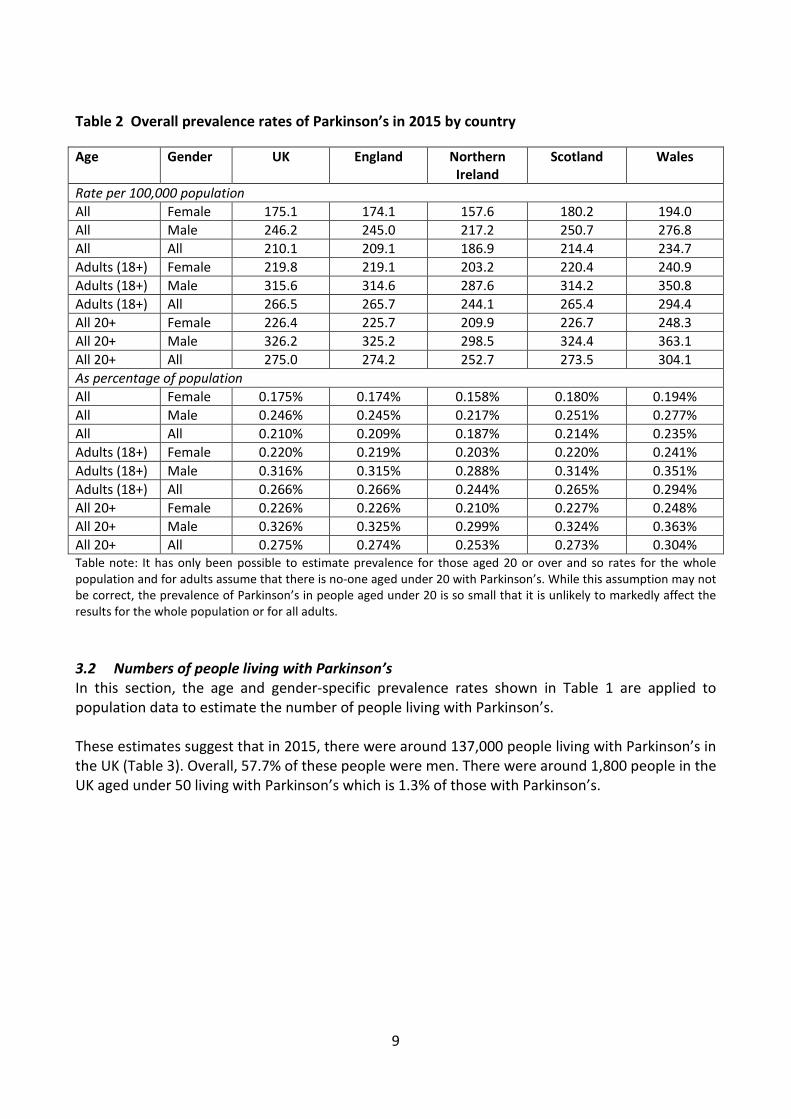
To calculate the percentage of the UK population as a whole living with Parkinson’s it is necessary to adjust for the slight difference between the CPRD population and the UK population as a whole. Therefore, Table 2 summarises the estimated overall prevalence rates for each country and for each gender both as a rate per 100,000 of the population and as a percentage of the UK population in 2015. The differences between the countries of the UK shown in Table 2 reflect differences in the age and gender distribution of people within each country. For example, Wales generally has an older population than England and Northern Ireland has a younger population than England. These overall figures are similar to the 1 in 500 figures that Parkinson’s UK has previously quoted as a broad measure of prevalence. For example, for the UK as a whole (all ages) in 2015 we can say that around 2 in 1,000 people live with Parkinson’s. More specifically, this equates to 18 in every 10,000 females and 25 in every 10,000 males in the UK. As a percentage of the adult population, around 3 in every 1,000 people live with Parkinson’s. More specifically, 22 in every 10,000 women and 32 in every 10,000 men have been diagnosed with Parkinson’s.
9
Table 2 Overall prevalence rates of Parkinson’s in 2015 by country Age Gender UK England Northern
Ireland Scotland Wales
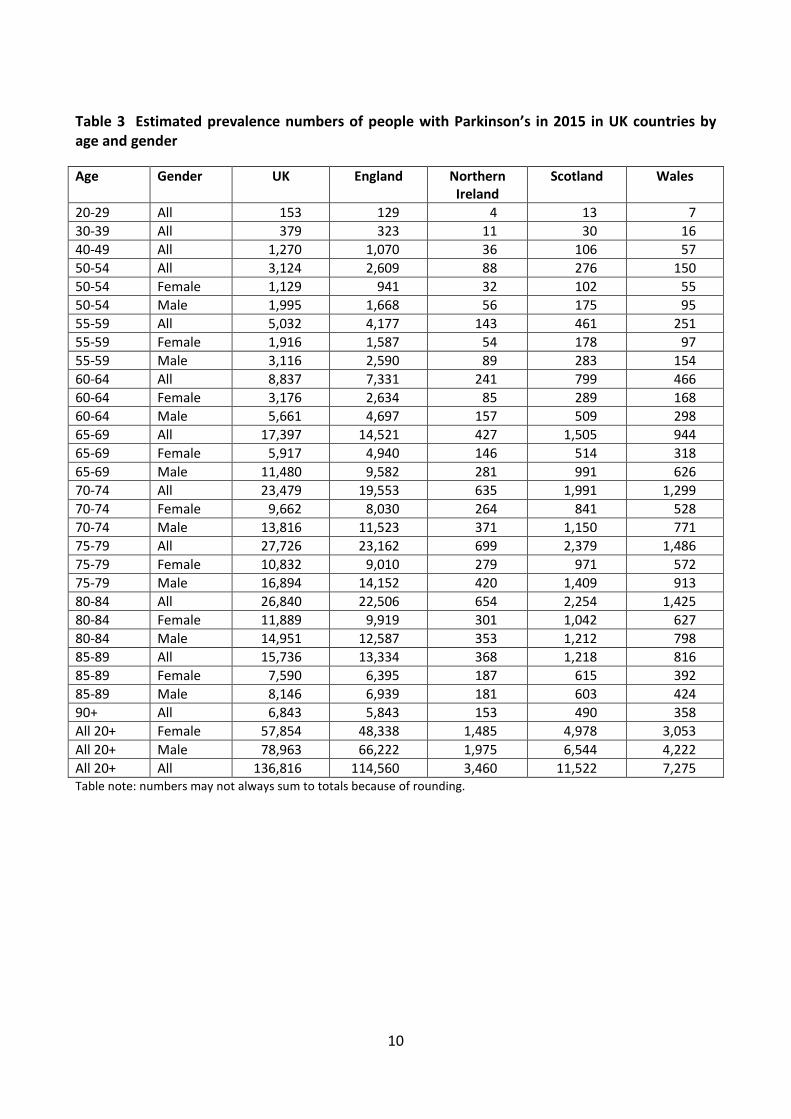
Rate per 100,000 population All Female 175.1 174.1 157.6 180.2 194.0 All Male 246.2 245.0 217.2 250.7 276.8 All All 210.1 209.1 186.9 214.4 234.7 Adults (18+) Female 219.8 219.1 203.2 220.4 240.9 Adults (18+) Male 315.6 314.6 287.6 314.2 350.8 Adults (18+) All 266.5 265.7 244.1 265.4 294.4 All 20+ Female 226.4 225.7 209.9 226.7 248.3 All 20+ Male 326.2 325.2 298.5 324.4 363.1 All 20+ All 275.0 274.2 252.7 273.5 304.1 As percentage of population All Female 0.175% 0.174% 0.158% 0.180% 0.194% All Male 0.246% 0.245% 0.217% 0.251% 0.277% All All 0.210% 0.209% 0.187% 0.214% 0.235% Adults (18+) Female 0.220% 0.219% 0.203% 0.220% 0.241% Adults (18+) Male 0.316% 0.315% 0.288% 0.314% 0.351% Adults (18+) All 0.266% 0.266% 0.244% 0.265% 0.294% All 20+ Female 0.226% 0.226% 0.210% 0.227% 0.248% All 20+ Male 0.326% 0.325% 0.299% 0.324% 0.363% All 20+ All 0.275% 0.274% 0.253% 0.273% 0.304% Table note: It has only been possible to estimate prevalence for those aged 20 or over and so rates for the whole population and for adults assume that there is no-one aged under 20 with Parkinson’s. While this assumption may not be correct, the prevalence of Parkinson’s in people aged under 20 is so small that it is unlikely to markedly affect the results for the whole population or for all adults. 3.2 Numbers of people living with Parkinson’s In this section, the age and gender-specific prevalence rates shown in Table 1 are applied to population data to estimate the number of people living with Parkinson’s. These estimates suggest that in 2015, there were around 137,000 people living with Parkinson’s in the UK (Table 3). Overall, 57.7% of these people were men. There were around 1,800 people in the UK aged under 50 living with Parkinson’s which is 1.3% of those with Parkinson’s.
10
Table 3 Estimated prevalence numbers of people with Parkinson’s in 2015 in UK countries by age and gender Age Gender UK England Northern
Ireland Scotland Wales
20-29 All 153 129 4 13 7 30-39 All 379 323 11 30 16 40-49 All 1,270 1,070 36 106 57 50-54 All 3,124 2,609 88 276 150 50-54 Female 1,129 941 32 102 55 50-54 Male 1,995 1,668 56 175 95 55-59 All 5,032 4,177 143 461 251 55-59 Female 1,916 1,587 54 178 97 55-59 Male 3,116 2,590 89 283 154 60-64 All 8,837 7,331 241 799 466 60-64 Female 3,176 2,634 85 289 168 60-64 Male 5,661 4,697 157 509 298 65-69 All 17,397 14,521 427 1,505 944 65-69 Female 5,917 4,940 146 514 318 65-69 Male 11,480 9,582 281 991 626 70-74 All 23,479 19,553 635 1,991 1,299 70-74 Female 9,662 8,030 264 841 528 70-74 Male 13,816 11,523 371 1,150 771 75-79 All 27,726 23,162 699 2,379 1,486 75-79 Female 10,832 9,010 279 971 572 75-79 Male 16,894 14,152 420 1,409 913 80-84 All 26,840 22,506 654 2,254 1,425 80-84 Female 11,889 9,919 301 1,042 627 80-84 Male 14,951 12,587 353 1,212 798 85-89 All 15,736 13,334 368 1,218 816 85-89 Female 7,590 6,395 187 615 392 85-89 Male 8,146 6,939 181 603 424 90+ All 6,843 5,843 153 490 358 All 20+ Female 57,854 48,338 1,485 4,978 3,053 All 20+ Male 78,963 66,222 1,975 6,544 4,222 All 20+ All 136,816 114,560 3,460 11,522 7,275 Table note: numbers may not always sum to totals because of rounding.
11
4 The incidence of Parkinson’s in the UK
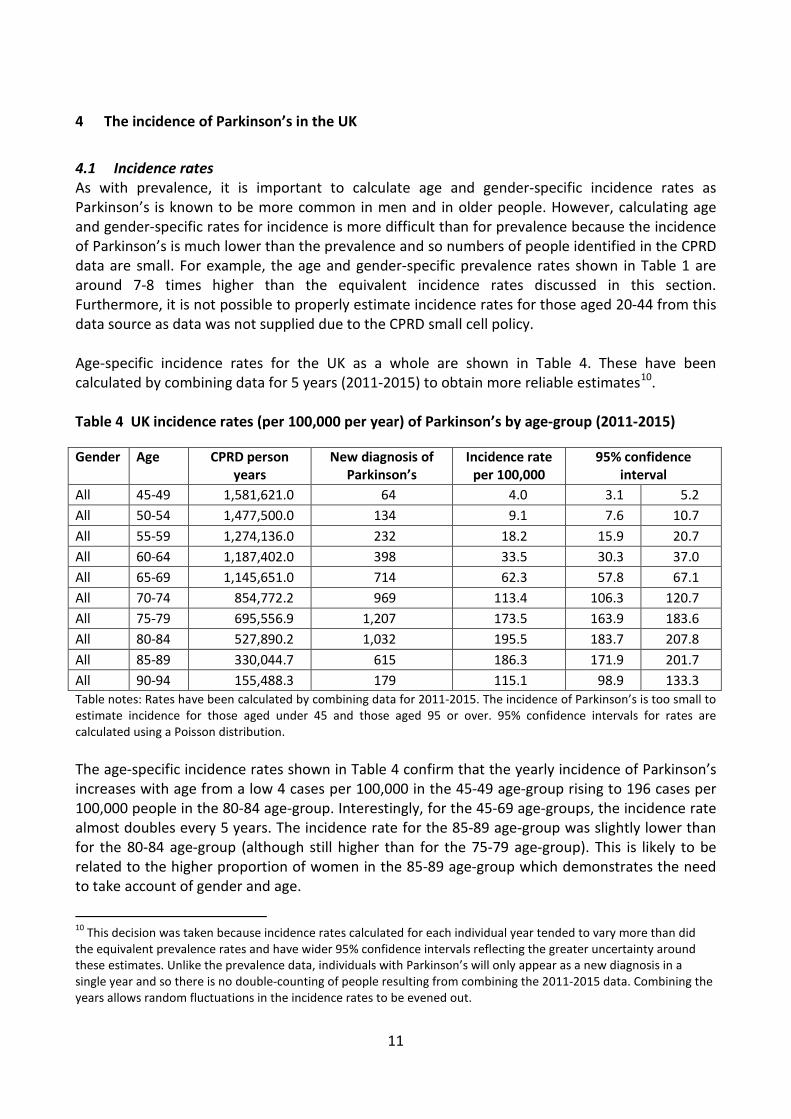
4.1 Incidence rates As with prevalence, it is important to calculate age and gender-specific incidence rates as Parkinson’s is known to be more common in men and in older people. However, calculating age and gender-specific rates for incidence is more difficult than for prevalence because the incidence of Parkinson’s is much lower than the prevalence and so numbers of people identified in the CPRD data are small. For example, the age and gender-specific prevalence rates shown in Table 1 are around 7-8 times higher than the equivalent incidence rates discussed in this section. Furthermore, it is not possible to properly estimate incidence rates for those aged 20-44 from this data source as data was not supplied due to the CPRD small cell policy. Age-specific incidence rates for the UK as a whole are shown in Table 4. These have been calculated by combining data for 5 years (2011-2015) to obtain more reliable estimates10. Table 4 UK incidence rates (per 100,000 per year) of Parkinson’s by age-group (2011-2015) Gender Age CPRD person
years New diagnosis of
Parkinson’s Incidence rate
per 100,000 95% confidence
interval All 45-49 1,581,621.0 64 4.0 3.1 5.2 All 50-54 1,477,500.0 134 9.1 7.6 10.7 All 55-59 1,274,136.0 232 18.2 15.9 20.7 All 60-64 1,187,402.0 398 33.5 30.3 37.0 All 65-69 1,145,651.0 714 62.3 57.8 67.1 All 70-74 854,772.2 969 113.4 106.3 120.7 All 75-79 695,556.9 1,207 173.5 163.9 183.6 All 80-84 527,890.2 1,032 195.5 183.7 207.8 All 85-89 330,044.7 615 186.3 171.9 201.7 All 90-94 155,488.3 179 115.1 98.9 133.3 Table notes: Rates have been calculated by combining data for 2011-2015. The incidence of Parkinson’s is too small to estimate incidence for those aged under 45 and those aged 95 or over. 95% confidence intervals for rates are calculated using a Poisson distribution. The age-specific incidence rates shown in Table 4 confirm that the yearly incidence of Parkinson’s increases with age from a low 4 cases per 100,000 in the 45-49 age-group rising to 196 cases per 100,000 people in the 80-84 age-group. Interestingly, for the 45-69 age-groups, the incidence rate almost doubles every 5 years. The incidence rate for the 85-89 age-group was slightly lower than for the 80-84 age-group (although still higher than for the 75-79 age-group). This is likely to be related to the higher proportion of women in the 85-89 age-group which demonstrates the need to take account of gender and age.
10 This decision was taken because incidence rates calculated for each individual year tended to vary more than did the equivalent prevalence rates and have wider 95% confidence intervals reflecting the greater uncertainty around these estimates. Unlike the prevalence data, individuals with Parkinson’s will only appear as a new diagnosis in a single year and so there is no double-counting of people resulting from combining the 2011-2015 data. Combining the years allows random fluctuations in the incidence rates to be evened out.

12
Age and gender-specific incidence rates for those aged 50-94 in England11 are shown in Table 5 using combined data for 2011-2015 to obtain more reliable estimates. As seen with prevalence, the incidence of Parkinson’s was higher in men than in women. Incidence rates for men aged 50-94 were between 1.3 and 2.4 times higher for men than for women in the same age-group. The incidence rate for the 85-89 age-group continued to rise in men but this trend was not seen in women. The incidence rate for the 90-94 age-group was lower in both men and women than for the 75-89 age range. It is possible that factors such as a higher mortality rate in very old people and the difficulty diagnosing Parkinson’s in very elderly people where symptoms such as stiffness and slowness in movement can be attributed to ageing or other health concerns. The trends are summarised graphically in Figure 2. Table 5 Incidence rates (per 100,000 per year) of Parkinson’s by age and gender for England (2011-2015) Gender Age CPRD person years New diagnosis of
Parkinson’s Incidence rate per
100,000 95% confidence
interval Female 50-54 414,373.7 35 8.4 5.9 11.7 Female 55-59 459,654.1 59 12.8 9.8 16.6 Female 60-64 434,755.5 97 22.3 18.1 27.2 Female 65-69 427,677.2 177 41.4 35.5 48.0 Female 70-74 323,872.9 270 83.4 73.7 93.9 Female 75-79 276,986.8 350 126.4 113.5 140.3 Female 80-84 227,260.6 317 139.5 124.6 155.7 Female 85-89 156,006.3 191 122.4 105.7 141.1 Female 90-94 83,114.5 76 91.4 72.0 114.5 Male 50-54 552,265.7 58 10.5 8.0 13.6 Male 55-59 467,625.6 108 23.1 18.9 27.9 Male 60-64 428,323.1 185 43.2 37.2 49.9 Male 65-69 410,300.1 327 79.7 71.3 88.8 Male 70-74 295,228.0 434 147.0 133.5 161.5 Male 75-79 233,910.2 563 240.7 221.2 261.4 Male 80-84 166,440.4 471 283.0 258.0 309.7 Male 85-89 92,428.0 275 297.5 263.4 334.9 Male 90-94 36,456.1 77 211.2 166.7 264.0 Table notes: Rates have been calculated by combining data for 2011-2015 except for female aged 50-54 where data was not available for 2012 and so only 4 years of data have been used. The incidence of Parkinson’s is too small to estimate incidence by gender for those aged under 50 and those aged 95 or over. 95% confidence intervals for rates are calculated using a Poisson distribution.
11 Data for other countries is not available due to the small cell policy. Age-specific rates for England were compared with those for the UK as a whole. The 2 sets of rates were very similar which suggests that the age and gender-specific rates for England are reasonable to apply to the UK as a whole.
13
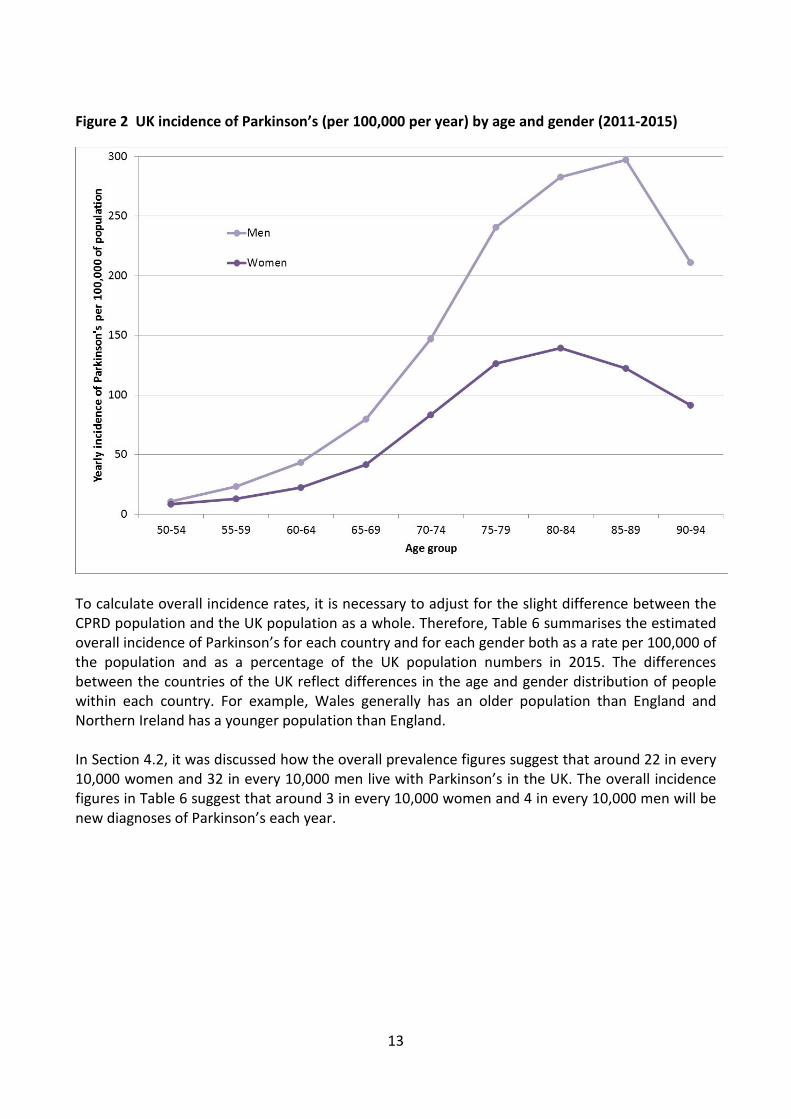
Figure 2 UK incidence of Parkinson’s (per 100,000 per year) by age and gender (2011-2015)
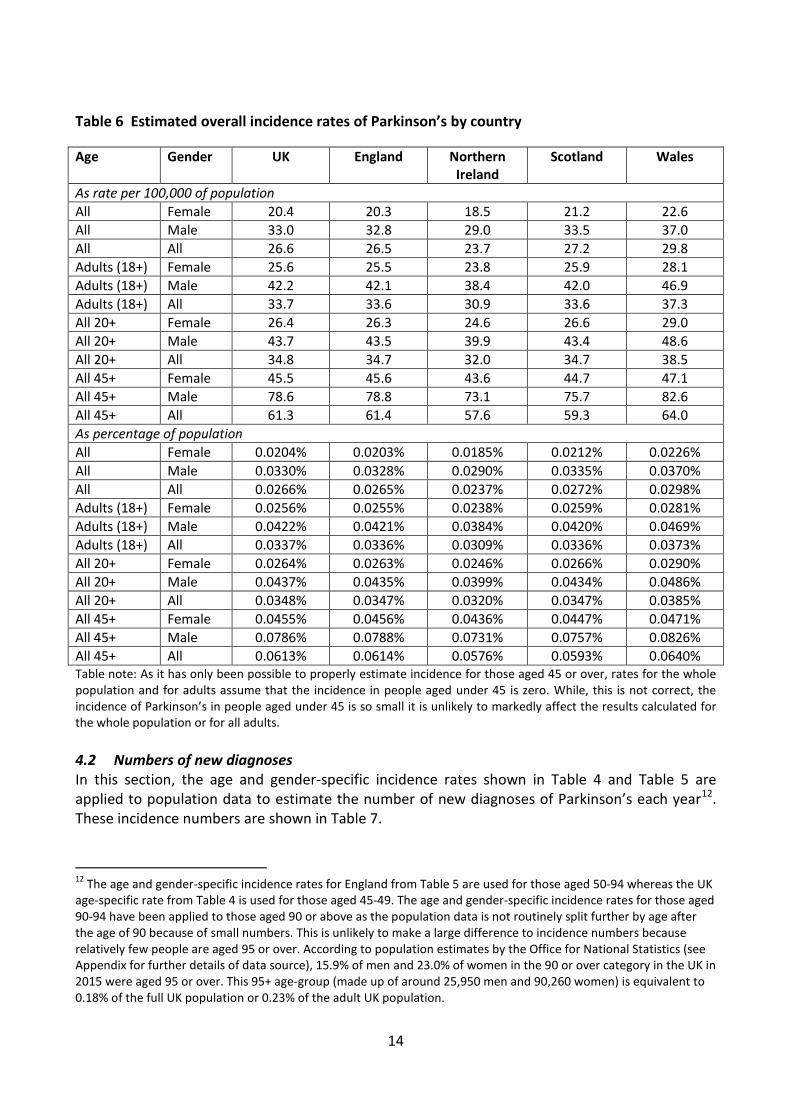
To calculate overall incidence rates, it is necessary to adjust for the slight difference between the CPRD population and the UK population as a whole. Therefore, Table 6 summarises the estimated overall incidence of Parkinson’s for each country and for each gender both as a rate per 100,000 of the population and as a percentage of the UK population numbers in 2015. The differences between the countries of the UK reflect differences in the age and gender distribution of people within each country. For example, Wales generally has an older population than England and Northern Ireland has a younger population than England. In Section 4.2, it was discussed how the overall prevalence figures suggest that around 22 in every 10,000 women and 32 in every 10,000 men live with Parkinson’s in the UK. The overall incidence figures in Table 6 suggest that around 3 in every 10,000 women and 4 in every 10,000 men will be new diagnoses of Parkinson’s each year.
14
Table 6 Estimated overall incidence rates of Parkinson’s by country Age Gender UK England Northern
Ireland Scotland Wales
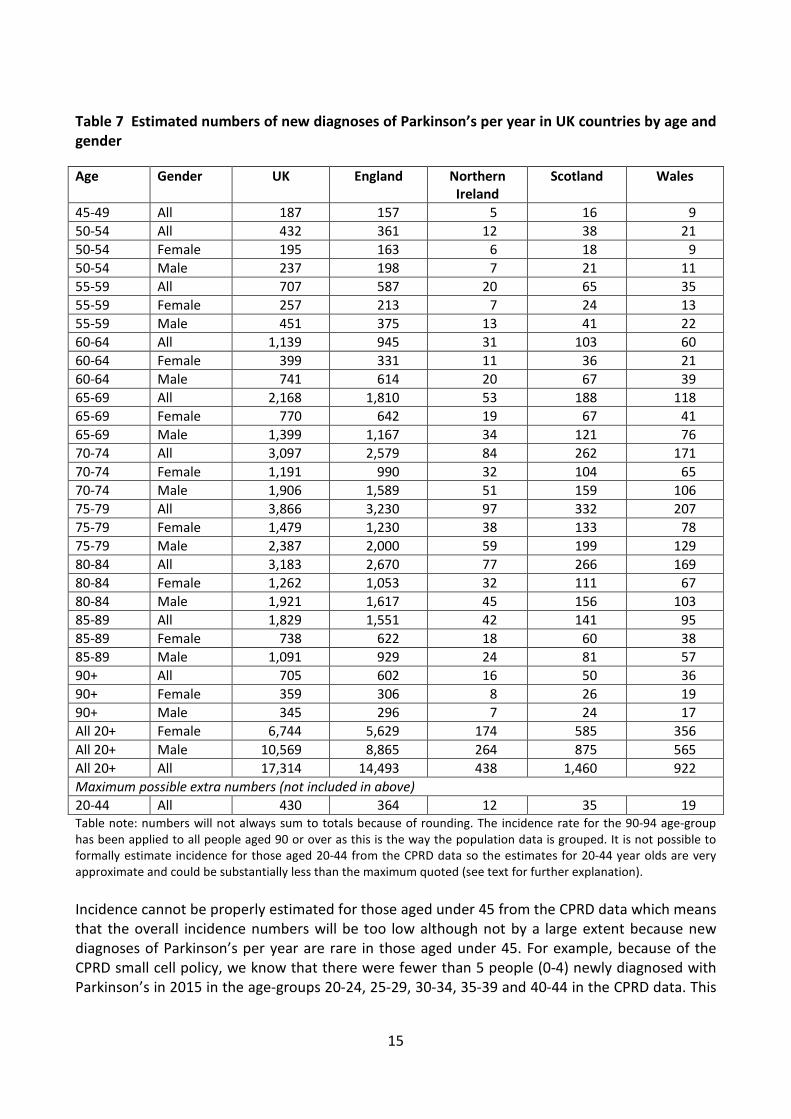
As rate per 100,000 of population All Female 20.4 20.3 18.5 21.2 22.6 All Male 33.0 32.8 29.0 33.5 37.0 All All 26.6 26.5 23.7 27.2 29.8 Adults (18+) Female 25.6 25.5 23.8 25.9 28.1 Adults (18+) Male 42.2 42.1 38.4 42.0 46.9 Adults (18+) All 33.7 33.6 30.9 33.6 37.3 All 20+ Female 26.4 26.3 24.6 26.6 29.0 All 20+ Male 43.7 43.5 39.9 43.4 48.6 All 20+ All 34.8 34.7 32.0 34.7 38.5 All 45+ Female 45.5 45.6 43.6 44.7 47.1 All 45+ Male 78.6 78.8 73.1 75.7 82.6 All 45+ All 61.3 61.4 57.6 59.3 64.0 As percentage of population All Female 0.0204% 0.0203% 0.0185% 0.0212% 0.0226% All Male 0.0330% 0.0328% 0.0290% 0.0335% 0.0370% All All 0.0266% 0.0265% 0.0237% 0.0272% 0.0298% Adults (18+) Female 0.0256% 0.0255% 0.0238% 0.0259% 0.0281% Adults (18+) Male 0.0422% 0.0421% 0.0384% 0.0420% 0.0469% Adults (18+) All 0.0337% 0.0336% 0.0309% 0.0336% 0.0373% All 20+ Female 0.0264% 0.0263% 0.0246% 0.0266% 0.0290% All 20+ Male 0.0437% 0.0435% 0.0399% 0.0434% 0.0486% All 20+ All 0.0348% 0.0347% 0.0320% 0.0347% 0.0385% All 45+ Female 0.0455% 0.0456% 0.0436% 0.0447% 0.0471% All 45+ Male 0.0786% 0.0788% 0.0731% 0.0757% 0.0826% All 45+ All 0.0613% 0.0614% 0.0576% 0.0593% 0.0640% Table note: As it has only been possible to properly estimate incidence for those aged 45 or over, rates for the whole population and for adults assume that the incidence in people aged under 45 is zero. While, this is not correct, the incidence of Parkinson’s in people aged under 45 is so small it is unlikely to markedly affect the results calculated for the whole population or for all adults. 4.2 Numbers of new diagnoses In this section, the age and gender-specific incidence rates shown in Table 4 and Table 5 are applied to population data to estimate the number of new diagnoses of Parkinson’s each year12. These incidence numbers are shown in Table 7.
12 The age and gender-specific incidence rates for England from Table 5 are used for those aged 50-94 whereas the UK age-specific rate from Table 4 is used for those aged 45-49. The age and gender-specific incidence rates for those aged 90-94 have been applied to those aged 90 or above as the population data is not routinely split further by age after the age of 90 because of small numbers. This is unlikely to make a large difference to incidence numbers because relatively few people are aged 95 or over. According to population estimates by the Office for National Statistics (see Appendix for further details of data source), 15.9% of men and 23.0% of women in the 90 or over category in the UK in 2015 were aged 95 or over. This 95+ age-group (made up of around 25,950 men and 90,260 women) is equivalent to 0.18% of the full UK population or 0.23% of the adult UK population.
15
Table 7 Estimated numbers of new diagnoses of Parkinson’s per year in UK countries by age and gender Age Gender UK England Northern
Ireland Scotland Wales
45-49 All 187 157 5 16 9 50-54 All 432 361 12 38 21 50-54 Female 195 163 6 18 9 50-54 Male 237 198 7 21 11 55-59 All 707 587 20 65 35 55-59 Female 257 213 7 24 13 55-59 Male 451 375 13 41 22 60-64 All 1,139 945 31 103 60 60-64 Female 399 331 11 36 21 60-64 Male 741 614 20 67 39 65-69 All 2,168 1,810 53 188 118 65-69 Female 770 642 19 67 41 65-69 Male 1,399 1,167 34 121 76 70-74 All 3,097 2,579 84 262 171 70-74 Female 1,191 990 32 104 65 70-74 Male 1,906 1,589 51 159 106 75-79 All 3,866 3,230 97 332 207 75-79 Female 1,479 1,230 38 133 78 75-79 Male 2,387 2,000 59 199 129 80-84 All 3,183 2,670 77 266 169 80-84 Female 1,262 1,053 32 111 67 80-84 Male 1,921 1,617 45 156 103 85-89 All 1,829 1,551 42 141 95 85-89 Female 738 622 18 60 38 85-89 Male 1,091 929 24 81 57 90+ All 705 602 16 50 36 90+ Female 359 306 8 26 19 90+ Male 345 296 7 24 17 All 20+ Female 6,744 5,629 174 585 356 All 20+ Male 10,569 8,865 264 875 565 All 20+ All 17,314 14,493 438 1,460 922 Maximum possible extra numbers (not included in above) 20-44 All 430 364 12 35 19 Table note: numbers will not always sum to totals because of rounding. The incidence rate for the 90-94 age-group has been applied to all people aged 90 or over as this is the way the population data is grouped. It is not possible to formally estimate incidence for those aged 20-44 from the CPRD data so the estimates for 20-44 year olds are very approximate and could be substantially less than the maximum quoted (see text for further explanation). Incidence cannot be properly estimated for those aged under 45 from the CPRD data which means that the overall incidence numbers will be too low although not by a large extent because new diagnoses of Parkinson’s per year are rare in those aged under 45. For example, because of the CPRD small cell policy, we know that there were fewer than 5 people (0-4) newly diagnosed with Parkinson’s in 2015 in the age-groups 20-24, 25-29, 30-34, 35-39 and 40-44 in the CPRD data. This
16
was the same in 2013 and 2014 too. It is possible to calculate a very crude estimation from this data: if there were 4 people (the maximum possible) in each of these 5 age-groups with a new diagnosis of Parkinson’s, this would translate into around 2 new diagnoses of Parkinson’s in 2015 for every 100,000 people aged 20-44. Of course, the true incidence rate would be less than 2 people per 100,000 if the numbers were 0-3 in each age-group instead of 4 so this very crude rate of 2 people per 100,000 is a likely maximum of the extent to which the current incidence numbers may underestimate the true incidence in the UK population as a whole. It is probably more realistic to think that the true incidence rate is around half of these estimates. These possible maximum numbers are shown at the bottom of Table 7 to give a very rough indication of the maximum incidence numbers of people under aged 45 but are not included in the overall incidence numbers because of how uncertain these estimates are. In summary, the incidence numbers suggest that each year, there are around 17,300 new diagnoses of Parkinson’s in the UK for people aged 45 or over (Table 7). Overall, 61.0% of these people were men. 4.3 Lifetime risk of Parkinson’s These incidence rates can be used to calculate the lifetime risk of Parkinson’s13. The current probability method has been used for this calculation which takes account of the competing risk of death and so provides the best estimate of lifetime risk for a condition where a person will only be diagnosed once in their life14. For the UK population in 2015, the lifetime risk of being diagnosed with Parkinson’s was 2.7%. This is equivalent to 1 in every 37 people being diagnosed with Parkinson’s at some point in their life. The lifetime risk was 3.4% for males and 2.1% for females which is equivalent to 1 in every 29 males and 1 in every 48 females being diagnosed with Parkinson’s at some point in their life. This lifetime risk applies to the UK population as a whole (in terms of age, gender and life expectancy) in 2015. This means that changes to the UK population over time would change the lifetime risk. It also means that the lifetime risk would be different for different populations and so it is not straightforward to compare different countries. This lifetime risk should not be interpreted as an individual probability as the lifetime risk of being diagnosed with Parkinson’s for an individual person will depend on their age, gender and time of death and so could be higher or lower than 2.7%. For example, if a person died at 30 their lifetime risk of Parkinson’s would be negligible whereas for a person who lives to 100 it would be considerably higher. Therefore, while is appropriate to refer to this lifetime risk as equivalent to 1 in 37 people being diagnosed with Parkinson’s at some point in their life, it would not be appropriate to say that an individual person has a 2.7% chance of being diagnosed with Parkinson’s in their lifetime.
13 This calculation is based on the age and gender-specific incidence rates, the age and gender distribution of the UK population in 2015, and UK age and gender-specific mortality rates for 2013-2015 (see appendix for further details of population and mortality data). 14 Sasieni PD, Shelton J, Ormiston-Smith N, Thomson CS, Silcocks PB. What is the lifetime risk of developing cancer?: the effect of adjusting for multiple primaries. Br J Cancer. 2011 Jul 26;105(3):460-5. Epub 2011 Jul 19.
17
5 Predicting future numbers
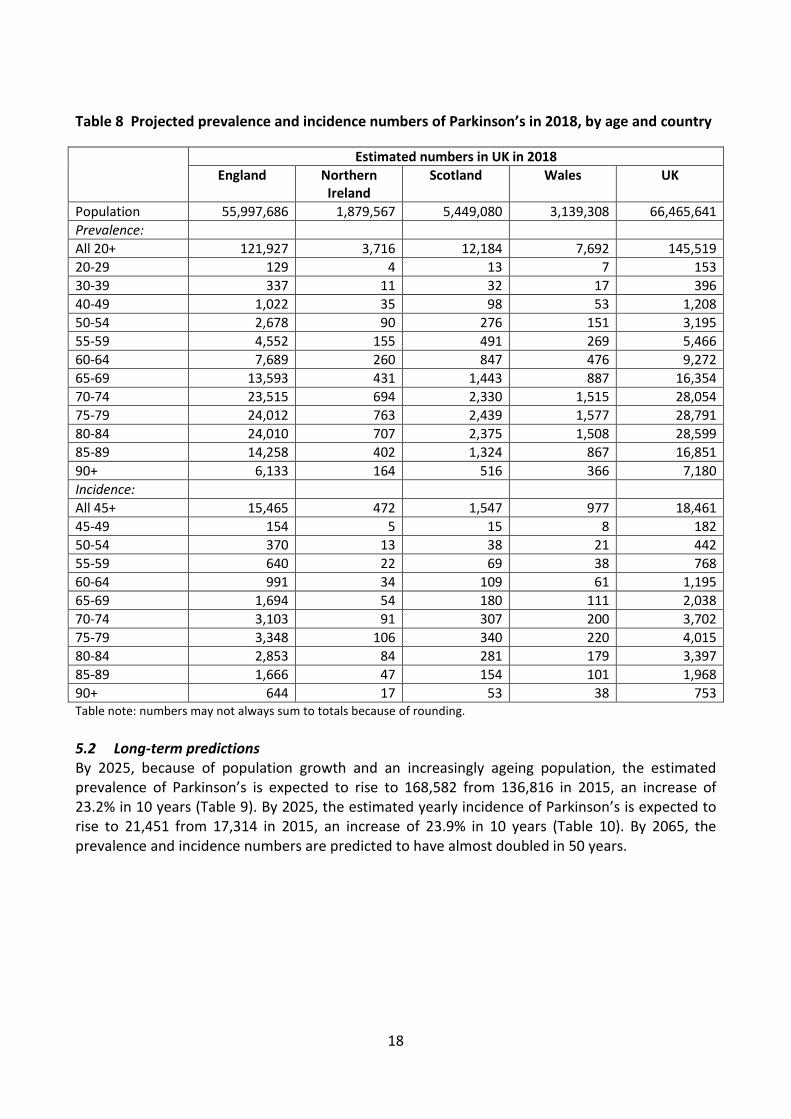
Even if prevalence and incidence rates stay stable, the prevalence and incidence numbers will vary over time because of changes in the UK population. In particular, as Parkinson’s is more common in older people and as the UK population is increasingly ageing (as life expectancy increases), the incidence and prevalence of Parkinson’s is likely to increase over time. This increase could impact on associated health and social care services for people with Parkinson’s. Research published in 200715 sought to predict the future prevalence of Parkinson’s and concluded that the number of people living with Parkinson’s in the world’s most populous nations would more than double between 2005 and 2030 with the largest increases predicted in countries such as China and India. For the UK, the prediction was that the number of people living with Parkinson’s would increase by 44.4% in the 25 years between 2005 and 2030. Research published in 201116 predicted that the prevalence of Parkinson’s would increase in Europe by 40.7% between 2010 and 2030 and by 82.6% between 2010 and 2050. Research published in 201717 sought to predict the future prevalence of Parkinson’s in the USA taking account of both an ageing population and a decrease in smoking. This predicted a 56.0% increase in the number of people living with Parkinson’s in the USA in the 35 years between 2005 and 2040. This section predicts future incidence and prevalence numbers for the UK by applying the age and gender-specific prevalence and incidence rates calculated here to projected population numbers calculated by the Office for National Statistics18. These projected population numbers are based on complex assumptions about future fertility rates, mortality rates, and migration rates. It is assumed here that the prevalence and incidence rates stay the same over time but the UK population changes. It is of course possible that prevalence and incidence rates will change over time too. For example, changes in life expectancy will change prevalence and incidence rates to some degree. Similarly, changes in the ways in which Parkinson’s is diagnosed (for example, changes in the diagnostic methods used or diagnosing Parkinson’s at an earlier stage) will affect both incidence and prevalence rates. There is then some uncertainty about these projections, particularly into the long term. However, they are included here because they illustrate the effect of an ageing population on the incidence and prevalence of Parkinson’s. 5.1 Short-term predictions Table 8 shows a shorter-term projection of the prevalence and incidence of Parkinson’s in the UK by country and age-group for 2018. The predicted prevalence of Parkinson’s in the UK in 2018 is 145,519 (up 6.4% from 136,816 in 2015) and the predicted incidence is 18,461 (up 6.6% from 17,314 in 2015).
15 Dorsey ER, Constantinescu R, Thompson JP, Biglan KM, Holloway RG, Kieburtz K, Marshall FJ, Ravina BM, Schifitto G, Siderowf A, Tanner CM. Projected number of people with Parkinson disease in the most populous nations, 2005 through 2030. Neurology. 2007 Jan 30;68(5):384-6. Epub 2006 Nov 2. 16 Bach JP, Ziegler U, Deuschl G, Dodel R, Doblhammer-Reiter G. Projected numbers of people with movement disorders in the years 2030 and 2050. Mov Disord. 2011 Oct;26(12):2286-90. 17 Rossi A, Berger K, Chen H, Leslie D, Mailman RB, Huang X. Projection of the prevalence of Parkinson's disease in the coming decades: Revisited. Mov Disord. 2017 Jun 7. 18 See appendix for further details of data source.
18
Table 8 Projected prevalence and incidence numbers of Parkinson’s in 2018, by age and country Estimated numbers in UK in 2018
England Northern Ireland
Scotland Wales UK
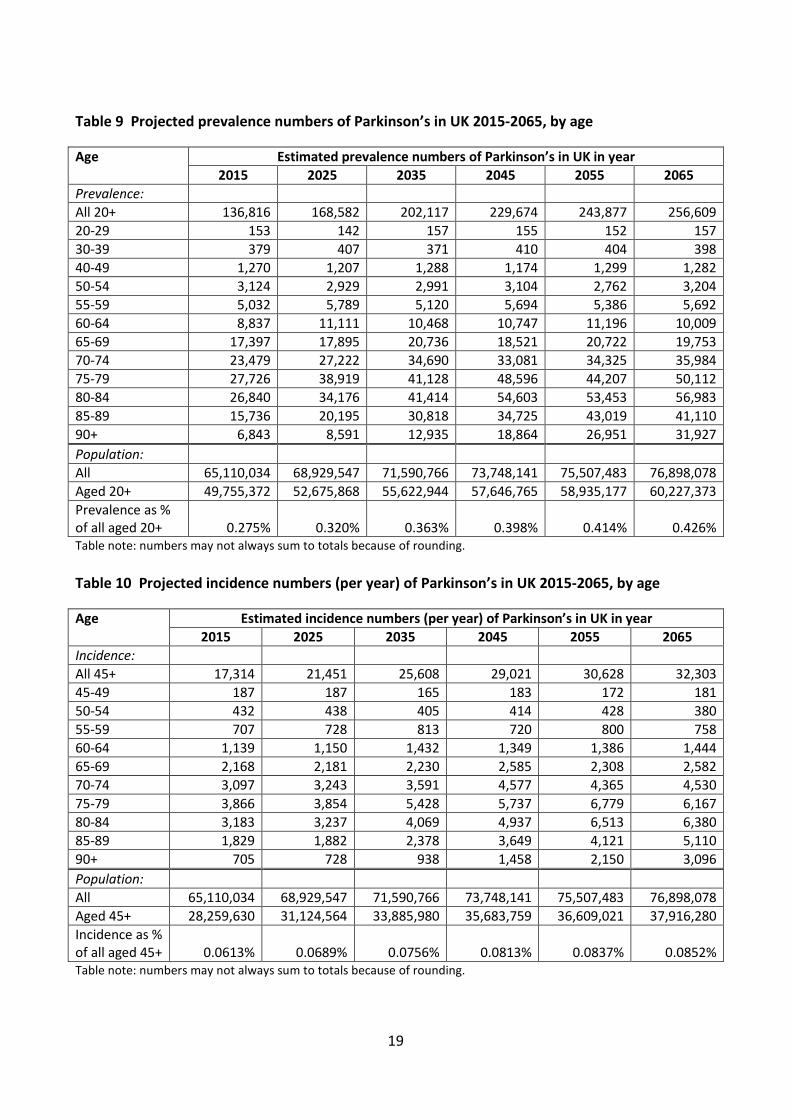
Population 55,997,686 1,879,567 5,449,080 3,139,308 66,465,641 Prevalence: All 20+ 121,927 3,716 12,184 7,692 145,519 20-29 129 4 13 7 153 30-39 337 11 32 17 396 40-49 1,022 35 98 53 1,208 50-54 2,678 90 276 151 3,195 55-59 4,552 155 491 269 5,466 60-64 7,689 260 847 476 9,272 65-69 13,593 431 1,443 887 16,354 70-74 23,515 694 2,330 1,515 28,054 75-79 24,012 763 2,439 1,577 28,791 80-84 24,010 707 2,375 1,508 28,599 85-89 14,258 402 1,324 867 16,851 90+ 6,133 164 516 366 7,180 Incidence: All 45+ 15,465 472 1,547 977 18,461 45-49 154 5 15 8 182 50-54 370 13 38 21 442 55-59 640 22 69 38 768 60-64 991 34 109 61 1,195 65-69 1,694 54 180 111 2,038 70-74 3,103 91 307 200 3,702 75-79 3,348 106 340 220 4,015 80-84 2,853 84 281 179 3,397 85-89 1,666 47 154 101 1,968 90+ 644 17 53 38 753 Table note: numbers may not always sum to totals because of rounding. 5.2 Long-term predictions By 2025, because of population growth and an increasingly ageing population, the estimated prevalence of Parkinson’s is expected to rise to 168,582 from 136,816 in 2015, an increase of 23.2% in 10 years (Table 9). By 2025, the estimated yearly incidence of Parkinson’s is expected to rise to 21,451 from 17,314 in 2015, an increase of 23.9% in 10 years (Table 10). By 2065, the prevalence and incidence numbers are predicted to have almost doubled in 50 years.
19
Table 9 Projected prevalence numbers of Parkinson’s in UK 2015-2065, by age Age Estimated prevalence numbers of Parkinson’s in UK in year
2015 2025 2035 2045 2055 2065 Prevalence: All 20+ 136,816 168,582 202,117 229,674 243,877 256,609 20-29 153 142 157 155 152 157 30-39 379 407 371 410 404 398 40-49 1,270 1,207 1,288 1,174 1,299 1,282 50-54 3,124 2,929 2,991 3,104 2,762 3,204 55-59 5,032 5,789 5,120 5,694 5,386 5,692 60-64 8,837 11,111 10,468 10,747 11,196 10,009 65-69 17,397 17,895 20,736 18,521 20,722 19,753 70-74 23,479 27,222 34,690 33,081 34,325 35,984 75-79 27,726 38,919 41,128 48,596 44,207 50,112 80-84 26,840 34,176 41,414 54,603 53,453 56,983 85-89 15,736 20,195 30,818 34,725 43,019 41,110 90+ 6,843 8,591 12,935 18,864 26,951 31,927 Population: All 65,110,034 68,929,547 71,590,766 73,748,141 75,507,483 76,898,078 Aged 20+ 49,755,372 52,675,868 55,622,944 57,646,765 58,935,177 60,227,373 Prevalence as % of all aged 20+ 0.275% 0.320% 0.363% 0.398% 0.414% 0.426% Table note: numbers may not always sum to totals because of rounding. Table 10 Projected incidence numbers (per year) of Parkinson’s in UK 2015-2065, by age Age Estimated incidence numbers (per year) of Parkinson’s in UK in year
2015 2025 2035 2045 2055 2065 Incidence: All 45+ 17,314 21,451 25,608 29,021 30,628 32,303 45-49 187 187 165 183 172 181 50-54 432 438 405 414 428 380 55-59 707 728 813 720 800 758 60-64 1,139 1,150 1,432 1,349 1,386 1,444 65-69 2,168 2,181 2,230 2,585 2,308 2,582 70-74 3,097 3,243 3,591 4,577 4,365 4,530 75-79 3,866 3,854 5,428 5,737 6,779 6,167 80-84 3,183 3,237 4,069 4,937 6,513 6,380 85-89 1,829 1,882 2,378 3,649 4,121 5,110 90+ 705 728 938 1,458 2,150 3,096 Population: All 65,110,034 68,929,547 71,590,766 73,748,141 75,507,483 76,898,078 Aged 45+ 28,259,630 31,124,564 33,885,980 35,683,759 36,609,021 37,916,280 Incidence as % of all aged 45+ 0.0613% 0.0689% 0.0756% 0.0813% 0.0837% 0.0852% Table note: numbers may not always sum to totals because of rounding.
20
6 Appendix: supplementary information
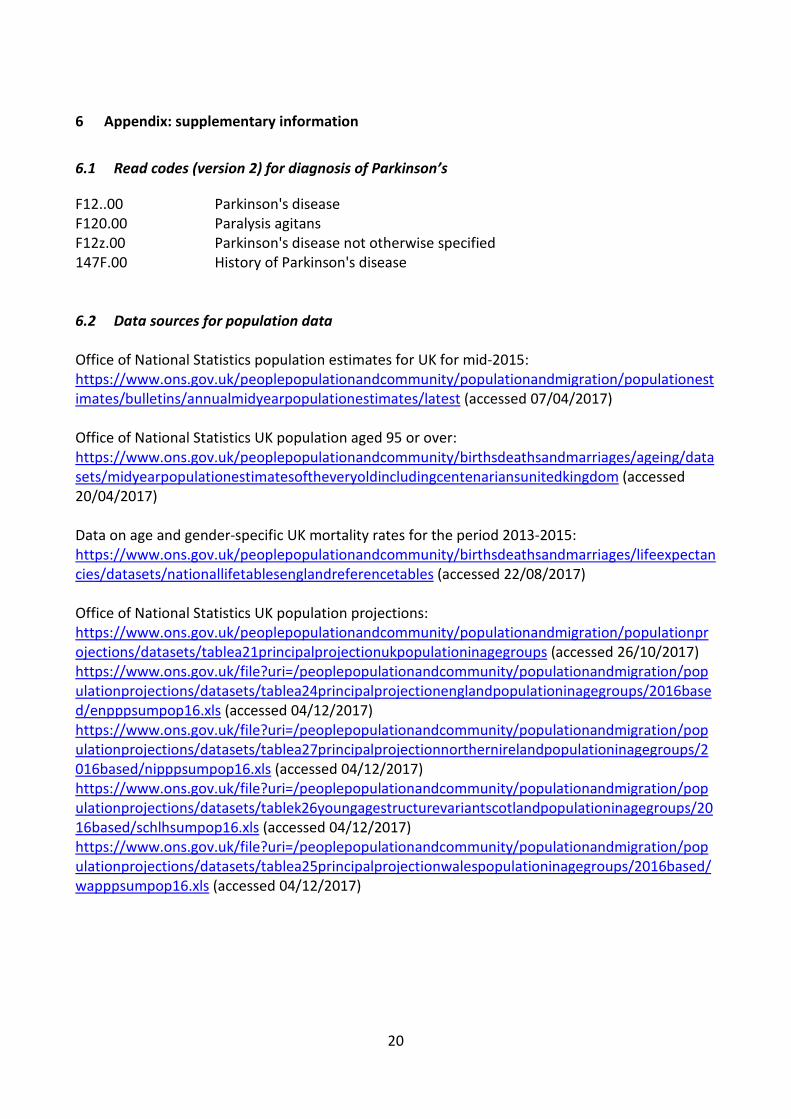
6.1 Read codes (version 2) for diagnosis of Parkinson’s F12..00 Parkinson's disease F120.00 Paralysis agitans F12z.00 Parkinson's disease not otherwise specified 147F.00 History of Parkinson's disease 6.2 Data sources for population data Office of National Statistics population estimates for UK for mid-2015: https://www.ons.gov.uk/peoplepopulationandcommunity/populationandmigration/populationestimates/bulletins/annualmidyearpopulationestimates/latest (accessed 07/04/2017) Office of National Statistics UK population aged 95 or over: https://www.ons.gov.uk/peoplepopulationandcommunity/birthsdeathsandmarriages/ageing/datasets/midyearpopulationestimatesoftheveryoldincludingcentenariansunitedkingdom (accessed 20/04/2017) Data on age and gender-specific UK mortality rates for the period 2013-2015: https://www.ons.gov.uk/peoplepopulationandcommunity/birthsdeathsandmarriages/lifeexpectancies/datasets/nationallifetablesenglandreferencetables (accessed 22/08/2017) Office of National Statistics UK population projections: https://www.ons.gov.uk/peoplepopulationandcommunity/populationandmigration/populationprojections/datasets/tablea21principalprojectionukpopulationinagegroups (accessed 26/10/2017) https://www.ons.gov.uk/file?uri=/peoplepopulationandcommunity/populationandmigration/populationprojections/datasets/tablea24principalprojectionenglandpopulationinagegroups/2016based/enpppsumpop16.xls (accessed 04/12/2017) https://www.ons.gov.uk/file?uri=/peoplepopulationandcommunity/populationandmigration/populationprojections/datasets/tablea27principalprojectionnorthernirelandpopulationinagegroups/2016based/nipppsumpop16.xls (accessed 04/12/2017) https://www.ons.gov.uk/file?uri=/peoplepopulationandcommunity/populationandmigration/populationprojections/datasets/tablek26youngagestructurevariantscotlandpopulationinagegroups/2016based/schlhsumpop16.xls (accessed 04/12/2017) https://www.ons.gov.uk/file?uri=/peoplepopulationandcommunity/populationandmigration/populationprojections/datasets/tablea25principalprojectionwalespopulationinagegroups/2016based/wapppsumpop16.xls (accessed 04/12/2017)

Parkinson’s UK is the operating name of the Parkinson’s Disease Society of the United Kingdom. A charity registered in England and Wales (258197) and in Scotland (SC037554). © Parkinson’s UK 1/18 (CS2960)
Imagine not being able to move, sleep, or smile. Feeling anxious or depressed and struggling to think or remember. Your body not feeling like your own. This is what Parkinson’s can feel like.
Every hour, someone in the UK is told they have Parkinson’s – a brain condition that turns lives upside down, leaving a future full of uncertainty.
Parkinson’s UK is here to make sure people have whatever they need to take back control – from information to inspiration.
We want everyone to get the best health and social care. So we bring professionals together to drive improvements that enable people to live life to the full.
Ultimately, we want to end Parkinson’s. That’s why we inspire and support the international research community to develop life-changing treatments, faster. And we won’t stop until we find a cure.
Together we can bring forward the day when no one fears Parkinson’s.
Parkinson’s UK215 Vauxhall Bridge Road London SW1V 1EJ
Free confidential helpline 0808 800 0303 (Monday to Friday 9am–7pm, Saturday 10am–2pm). Interpreting available. Text Relay 18001 0808 800 0303 (for textphone users only)