in the industrial pellet sector: the for power plant ... - wpac 2014 - strauss - the... · growth...
TRANSCRIPT

Growth in the Industrial Pellet Sector:
The potential for power plant conversions in North America
Growth in the Industrial Pellet Sector:
The potential for power plant conversions in North America
William Strauss, PhD
President, FutureMetricsDirector, Maine Energy Systems
Chief Economist, Biomass Thermal Energy Council

FutureMetrics
Globally Respected and Award Winning Consultants in the Wood Pellet Sector
8 Airport RoadBethel, ME 04217, USAwww.FutureMetrics.com

Expert advice, analysis, and strategic guidance for the wood pellet sector.
Selection of Clients
Selection of Clients
Holson Forest Products
FutureMetrics ‐ Globally Respected Consultants in the Wood Pellet Sector

Pellet manufacturing project developmentOperations optimization
Expert advice / Due diligenceM&A / Valuation / Investor representation
Early‐stage feasibility studiesFinancial modeling
Risk and decision analysisEconomic impact analysis
FutureMetrics LLC

Dr. William Strauss, President, FutureMetrics
Recipient of the 2012 International Excellence in Bioenergy Award
John Swaan, Senior Associate, FutureMetrics
Recipient of the 2014 International Founders Award
Award Winning Team Members
FutureMetrics ‐ Globally Respected Consultants in the Wood Pellet Sector

North America
Capacity to produce over 12 million metric tonnes per year for export
Modest growth in the domestic heating markets
FutureMetrics ‐ Globally Respected Consultants in the Wood Pellet Sector

FutureMetrics ‐ Globally Respected Consultants in the Wood Pellet Sector
How does that compare to actual exports?
Source: “World Trade in Wood Pellets”, Alberto Goetzl, US International Trade Commission, March, 2014
GTIS = Global Trade Information Services
Canada and US adds up to about 5.1 million metric tonnes in 2013
(adjusted for 11 months in the data)

US
FutureMetrics ‐ Globally Respected Consultants in the Wood Pellet Sector

Canada
FutureMetrics ‐ Globally Respected Consultants in the Wood Pellet Sector

Almost 30 million tonnes!
Source: RISI, “Global Pellet Demand,” 2014
What is the Future of the Pellet Markets?
North America may be too low as this presentation will showNorth America may be too low as this presentation will show

Downside risk is due to lower heating oil prices. That scenario is very possible. See chart on the next slide…

Mind the Gap!

Where will demand for domestic
heating pellets go in 2015?

Uncertainty in the export markets for future growth and potential excess capacity!
Fluctuations in demand for heating pellets…
There is an untapped market for industrial wood pellets (white and
black) right in our backyard!FutureMetrics ‐ Globally Respected Consultants in the Wood Pellet Sector

The potential for significant growth in the industrial pellet market is in the conversion of North American pulverized coal power plants.
There are three large “proof of concept” operations:
• Drax in the UK (650 MWs per unit)
• Ontario Power Generations' 240 MW Atikokan and Thunder Bay plants in Ontario
There are hundreds of others that can be converted economically and can produce low cost, dispatchable, and
job creating electricity.

27 US states do have renewable portfolio standards (RPS). 11 other states have variants on RPS.
Source: US Partnership for Renewable Energy Finance. “Ramping up Renewables – Leveraging State RPS Programs
amid Uncertain Federal Support,” June 2012.

Source: US Partnership for Renewable Energy Finance. “Ramping up Renewables –Leveraging State RPS Programs amid Uncertain Federal Support,” June 2012.

• July 2, 2014 U.S. EPA released the Clean Power Plan proposal, to cut carbon emission from the power sector by 30 percent below 2005 levels.
• Program to be implemented at State level based on Federal EPA Regulation Guidelines
• States developing Section 111D plans over next year, to be approved by EPA, and implemented starting in 2016
New U.S. EPA ruling (111D)

FutureMetrics ‐ Globally Respected Consultants in the Wood Pellet Sector
The pathway to that lowest cost renewable power for RPS and EPA compliance that also has the benefits of being available on demand (dispatchable) or continuously (baseload) is
via the conversion of older pulverized coal power plants to use advanced solid biofuels.

FutureMetrics ‐ Globally Respected Consultants in the Wood Pellet Sector
Every MW of wind or solar power needs a MW of thermal generation (or hydro where available) to keep the grid balanced
when the wind is not blowing and the sun is not shining.
MW’s of power from plants running on pelletized refined biofuel are cheaper than wind or solar.
And those plants also solve the intermittency problem with renewable power (rather than relying on coal peaking plants).

How is coal burned in a power plant boiler?
The coal is ground in to dust, pneumatically transferred to a burner in the sidewall of the boiler, and the dust blown into the burner. Combustion takes place rapidly.
Replacing coal with pellets is very straight forward with minor modifications.
FutureMetrics ‐ Globally Respected Consultants in the Wood Pellet Sector

Pulverized Pellet Burner in the Atikokan Power Plant

OPG’s Atikokan Plant Running on 100% Pellets
The $170 million conversion works out to about $700 per kW of capacity.
About $350/kW of that was for new dry storage and handling.
New wind is about $2000/kW. New solar PV is about $4000/kW. Neither wind or solar is dispatchable!

The economics of the cost of power generation
There are four broad components that add up to the total cost per MWhe of generation:
• The capital cost to build the plant,
• The fixed and variable operations and maintenance (O&M) costs,
• The fuel cost,
• Capacity factor.

Capacity factor matters. Capacity factor is the ratio of actual power production to the
theoretical maximum if the plant were to run at 100% of its nameplate 365 days a year.
Wind and solar PV have low capacity factors sothe amortized capital cost burden on each MWh
produced is much higher.
FutureMetrics ‐ Globally Respected Consultants in the Wood Pellet Sector

The fuel cost is not the only component of the total cost of generation.
If it were, then wind and solar with free fuel would provide free electricity.
A significant component of the total cost of generation is the amortized capital costs of building the generating facility (especially for low capacity factor generators such as wind and solar).
FutureMetrics ‐ Globally Respected Consultants in the Wood Pellet Sector

FutureMetrics ‐ Globally Respected Consultants in the Wood Pellet Sector
Why are Older Pulverized Coal Power Stations a Pathway to Lowest Cost RPS Compliance?

There are 428 operating pulverized coal plants in the US (greater than 50 MW). The median age is 48 years. 77.3% of the plants are older than 35 years.
Data is from the EPA Emissions & Generation Resource Integrated Database (eGRID), February, 2014. Distribution modeling is done with Palisade @RISK software.

There are about 20 coal fired power plants in Canada
Plant Name State/ProvincePlant
Generation Capacity (MW)
SO2 (t) Hg (kg) CO2 (t)CO2 Emission
Rate (kg/MWh)
EPCOR GENERATION ‐ Genesee Alberta 1,315 16,680 194 8,873,134 954 TransAlta Utilities Corporation ‐ Keephills Alberta 800 12,627 110 6,041,060 1,048 Alberta Power (2000) Ltd. ‐ Sheerness Alberta 750 39,187 95 5,927,674 1,006 Alberta Power (2000) Ltd. ‐ Battle River Alberta 679 22,961 105 5,285,838 1,041 TransAlta Utilities Corporation ‐ Wabamun Alberta 300 6,137 49 2,174,857 1,176 Milner Power Inc. ‐ H.R.Milner Generating Alberta 150 2,202 6 914,098 1,094 TransAlta Utilities Corporation ‐ Sundance Alberta 2,158 30,532 318 15,790,482 1,045 NEW BRUNSWICK POWER GENERATION CORPORATION ‐ Belledune New Brunswick 480 5,166 12 3,188,245 883 NEW BRUNSWICK POWER GENERATION CORPORATION ‐ Grand New Brunswick 61 23,236 88 250,000 912 NOVA SCOTIA POWER ‐ Lingan Nova Scotia 620 40,805 55 4,417,130 949 NOVA SCOTIA POWER ‐ Trenton Nova Scotia 321 37,809 35 2,028,040 968 NOVA SCOTIA POWER ‐ Point Tupper Nova Scotia 156 6,998 13 1,008,099 927 ONTARIO POWER GENERATION ‐ Nanticoke Ontario 3,640 67,947 156 17,585,856 989 ONTARIO POWER GENERATION ‐ Lambton Ontario 1,920 29,343 67 8,694,815 912 ONTARIO POWER GENERATION ‐ Thunder Bay Ontario 310 4,215 37 1,150,029 1,150 ONTARIO POWER GENERATION ‐ Atikokan Ontario 215 4,774 40 1,105,064 1,130 ONTARIO POWER GENERATION ‐ LAKEVIEW Ontario 2,400 4,861 19 719,348 1,003 SaskPower ‐ Boundary Dam Power Station Saskatchewan 875 49,296 281 6,697,605 1,104 SaskPower ‐ Poplar River Power Station Saskatchewan 610 39,347 281 4,083,816 1,104 SaskPower ‐ Shand Power Station Saskatchewan 305 9,350 86 1,837,718 1,104
TOTALS ==> 18,065 453,473 2,047 97,772,909
TOTALS Minus ONTARIO ==> 9,580 342,333 1,727 68,517,797

Assume that any conversion from coal to wood pellet fuel will be plants that are older
than 35 years.
In that case, the primary new major capital cost for a conversion from pulverized coal to wood pellet fuel would be the fuel storage
and handling systems.FutureMetrics ‐ Globally Respected Consultants in the Wood
Pellet Sector

Green shading for renewable solutionsFixed Capital Cost per MWhe
Fixed and Variable O&M per MWhe
Fuel Cost per MWhe
Total Cost per MWhe (at the power station
bus bar)
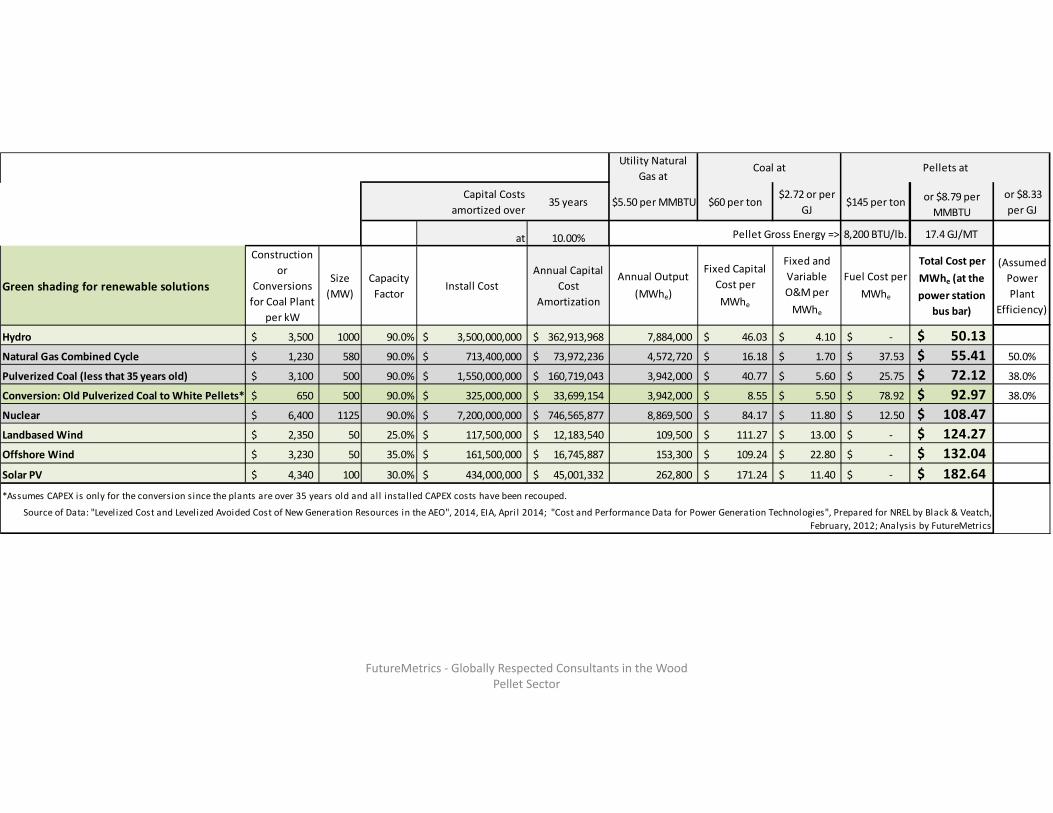
Hydro 46.03$ 4.10$ ‐$ 50.13$ Natural Gas Combined Cycle 16.18$ 1.70$ 37.53$ 55.41$ Pulverized Coal (less that 35 years old) 40.77$ 5.60$ 25.75$ 72.12$ Conversion: Old Pulverized Coal to White Pellets* 8.55$ 5.50$ 78.92$ 92.97$ Nuclear 84.17$ 11.80$ 12.50$ 108.47$ Landbased Wind 111.27$ 13.00$ ‐$ 124.27$ Offshore Wind 109.24$ 22.80$ ‐$ 132.04$ Solar PV 171.24$ 11.40$ ‐$ 182.64$
Converted plants older than 35 years have zeroed out originalcapital cost. Conversion cost is capitalized.
*Assumes CAPEX is only for the conversion since the plants are over 35 years old and all installed CAPEX costs have been recouped. Fixed Capital Cost per MWhe is greater than
any fuel costs for thermal generation!
$0.02/kWh difference


Job creating!
FutureMetrics ‐ Globally Respected Consultants in the Wood Pellet Sector
Utility Natural Gas at
Capital Costs amortized over
35 years $5.50 per MMBTU $60 per ton$2.72 or per
GJ$145 per ton or $8.79 per
MMBTU or $8.33 per GJ
at 10.00% Pellet Gross Energy => 8,200 BTU/lb. 17.4 GJ/MT
Green shading for renewable solutions
Construction or
Conversions for Coal Plant
per kW
Size (MW)
Capacity Factor
Install CostAnnual Capital
Cost Amortization
Annual Output (MWhe)
Fixed Capital Cost per MWhe
Fixed and Variable O&M per MWhe
Fuel Cost per MWhe
Total Cost per MWhe (at the power station
bus bar)
(Assumed Power Plant
Efficiency)
Hydro 3,500$ 1000 90.0% 3,500,000,000$ 362,913,968$ 7,884,000 46.03$ 4.10$ ‐$ 50.13$ Natural Gas Combined Cycle 1,230$ 580 90.0% 713,400,000$ 73,972,236$ 4,572,720 16.18$ 1.70$ 37.53$ 55.41$ 50.0%
Pulverized Coal (less that 35 years old) 3,100$ 500 90.0% 1,550,000,000$ 160,719,043$ 3,942,000 40.77$ 5.60$ 25.75$ 72.12$ 38.0%
Conversion: Old Pulverized Coal to White Pellets* 650$ 500 90.0% 325,000,000$ 33,699,154$ 3,942,000 8.55$ 5.50$ 78.92$ 92.97$ 38.0%
Nuclear 6,400$ 1125 90.0% 7,200,000,000$ 746,565,877$ 8,869,500 84.17$ 11.80$ 12.50$ 108.47$ Landbased Wind 2,350$ 50 25.0% 117,500,000$ 12,183,540$ 109,500 111.27$ 13.00$ ‐$ 124.27$ Offshore Wind 3,230$ 50 35.0% 161,500,000$ 16,745,887$ 153,300 109.24$ 22.80$ ‐$ 132.04$ Solar PV 4,340$ 100 30.0% 434,000,000$ 45,001,332$ 262,800 171.24$ 11.40$ ‐$ 182.64$ *Assumes CAPEX is only for the conversion since the plants are over 35 years old and all installed CAPEX costs have been recouped.
Source of Data: "Levelized Cost and Levelized Avoided Cost of New Generation Resources in the AEO", 2014, EIA, April 2014; "Cost and Performance Data for Power Generation Technologies", Prepared for NREL by Black & Veatch, February, 2012; Analysis by FutureMetrics
Coal at Pellets at

Hydro is Green and Baseload but US Hydro is fully exploited. No new large hydro opportunities are left. Peak was in 1973

27 States have Renewable Portfolio Standards. This is a solution that provides a pathway to
compliance with HUGE benefits.

Although the potential US market is much larger and Canada should supply fuel, Canada has conversion opportunities also.
Policies based on carbon reduction.
Each kWh of electricity from coal has a by‐product of about 2.15 pounds of CO2
That is about 1.1 short tons of CO2 per MWh
The incremental reduction in CO2 from using sustainable wood pellets is about 70% to 85% depending on supply chain factors
A 200 MW pulverized coal plant that converts to pulverized wood pellets will reduce CO2 emissions by more than 1,200,000 tons per year
FutureMetrics ‐ Globally Respected Consultants in the Wood Pellet Sector

We have not talked about co‐firing
Example: Korea Southeast Power (KOSEP) is co‐firing 3% wood pellets with coal with no modification to the power plant and no dry storage
solution at the power plant. Pellets are simply metered into the coal before the pulverizers.
The power station consumes about 9.7 million tonnes per year of coal. Co‐firing a “modest” amount of pellets in terms of
percentage is still 300,000 tonnes per year of pellets.

Inbicon Demonstration Plant in Circle
Dong Energy’s Inbicon Kalundborg Demonstration Plant Steam, Power, and pellet fuel Integration with Asnæs Power Station:
The 780 MW station is co‐firing black lignin pellets.
Leifmark, LLC is an independent U.S. company founded in 2011 to market Dong’s Inbicon Biomass Refinery technology in North America. www.leifmark.com

Biomass Receiving FermentationLiquefactionPre-treatment Distillation
Dong’s Inbicon Biomass Refinery
Lignin Outlet Ethanol OutletSteam and Power Lines from Powerplant

Lignin Pellet Properties• High energy value, clean combustion,
low sulfur content – 21 GJ/mt• Low in corrosive elements, by design• High resistance to moisture• Easy to handle, excellent durability for
transportation and storage• Competitive capital and operating cost to
implement (all in cost per GJ similar to wood pellets)
• DONG Energy has proven Inbicon lignin use in coal power plants

A significant proportion of domestic power plants can convert to dispatchable pellet fuel and
provide low‐cost grid‐balancing renewable power.
The constraint on wood pellet volumes is the quantity of sustainable wood.
But that limit is many times current Canadian and US production levels.
FutureMetrics ‐ Globally Respected Consultants in the Wood Pellet Sector

FutureMetrics ‐ Globally Respected Consultants in the Wood Pellet Sector
If we consider lignin pellets:
For example, there is enough corn stover (currently a waste or low value fuel for purpose built power plants) from the 24 corn ethanol producers in Nebraska to produce 3.1
million mtons per year of lignin pellets.
That would replace 20% of the coal consumed in Nebraska.

The forest products
industry needs wood pellet
manufacturers.
The world is changing.
(can you believe that PPI is telling its readers to move
away from print!)
The forest products
industry needs wood pellet
manufacturers.
The world is changing.
(can you believe that PPI is telling its readers to move
away from print!)

“Verso mill in Bucksport to close by year’s end, 570 employees to lose jobs”
[Bangor, Maine Daily News, October 2, 2014]

We need to engage with our policymakers and regulators at the provincial/state and federal levels
to educate them on the significant positive characteristics of this strategy:
A dedicated, consistent, and unified voice is needed.
We need to engage with our policymakers and regulators at the provincial/state and federal levels
to educate them on the significant positive characteristics of this strategy:
A dedicated, consistent, and unified voice is needed.

• The lowest cost renewable power generation solution;
• Dispatchable and baseload power that is available when needed;
• More jobs per megawatt‐hour of energy than any other generation technology;
• Very low carbon footprint;

Thank you
William Strauss
FutureMetrics
Globally Respected Consultants in the Wood Pellet Sector