in the district of columbia - a nationwide comparison 2001 · in the district of columbia - a...
TRANSCRIPT

Government of theDistrict of Columbia
Natwar M. GandhiChief Financial Officer
Tax Rates and Tax BurdensIn The District of Columbia -
A Nationwide Comparison
2001Issued August 2002
i
Tax Rates And Tax Burdens In The District of Columbia:A Nationwide Comparison
Table Of ContentsListing of Major Tables..........................................................................................................iii
Executive Summary.................................................................................................................v
Acknowledgment....................................................................................................................vii
Part I: Tax Burdens In Washington, D.C., Compared WithThose In The Largest City In Each State, 2001
Overview................................................................................... 1
Chapter I How Tax Burdens are Computed forthe Largest City in Each State...................................................... 2
Individual Income Tax................................................................. 3
Real Property Tax....................................................................... 5
Sales and Use Tax...................................................................... 6
Automobile Taxes....................................................................... 6
Chapter II Overall Tax Burdens for theLargest City in Each State ........................................................... 7
Progressivity............................................................................... 7
Chapter III Comparing Specific Tax Burdensfor a Family of Four in theLargest City in Each State .......................................................... 19
Individual Income Tax................................................................ 19
Real Property Tax...................................................................... 21
Sales and Use Tax..................................................................... 27
Automobile Taxes...................................................................... 29
ii
Tax Rates And Tax Burdens In The District of Columbia:A Nationwide Comparison
Table Of Contents
Chapter IV How Do Tax Burdens in Washington,D.C., Compare With Those in theLargest City in Each State?......................................................... 33
Individual Income Tax................................................................ 33
Real Property Tax...................................................................... 34
Sales Tax................................................................................... 35
Automobile Taxes...................................................................... 35
Summary................................................................................... 36
Chapter V Why Do Tax Burdens Differ fromOne City to Another?................................................................. 38
Part II: A Comparison of Selected Tax Rates In The District of ColumbiaWith Those In The 50 States As of January 1, 2002
Overview................................................................................................................ 42
Office Locations And Telephone Numbers .............................................................. 67

iii
Listing of Major Tables
Part I: Tax Burdens In Washington, D.C., Compared WithThose In The Largest City In Each State, 2001
Table 1 Estimated Burden of Major Taxes for a Family of Four, 2001................................... 8
Table 2 Index of Progressivity for the Tax System ofthe Largest City in Each State.................................................................................. 18
Table 3 Income Tax Burden as Percent of Income in the Largest Citiesby Type of Income Tax for a Family of Four, 2001.................................................. 22
Table 4 Residential Property Tax Rates in the LargestCity in Each State, 2001.......................................................................................... 24
Table 5 Factors Used in Housing Value Assumptions, 2001 ................................................. 25
Table 6 Cities Which Allow Exemptions or Reduced Rates in theCalculation of Real Estate Taxes for Homeowners, 2001 ......................................... 26
Table 7 State and Local General Sales Tax Rates in Eachof the 51 Cities as of December 31, 2001................................................................ 28
Table 8 Gasoline Tax Rates in the 51 Cities as of December 31, 2001.................................. 30
Table 9 Summary of Types of Automobile Registration Taxes, 2001..................................... 31
Table 10 Automobile Tax Assumptions, 2001........................................................................ 31
Table 11 Tax Burdens in Washington, D.C. Compared with the Averagefor the Largest City in Each State by Income Class, 2001 ........................................ 36
Table 12 The Largest City in Each State ................................................................................ 40

iv
Listing of Major Tables
Part II: A Comparison of Selected Tax Rates In The District ofColumbia With Those In The 50 States: As of January 1, 2002
Table 13 Comparison of Selected State Tax Rates ................................................................. 42
Table 14 Individual Income Tax: Washington Metropolitan Area............................................ 43
Table 15 Individual Income Tax: 43 States and District ofColumbia as of January 1, 2002 .............................................................................. 44
Table 16 Characteristics of State Individual Income Taxes...................................................... 52
Table 17 State Corporation Income Tax Rates....................................................................... 54
Table 18 State Gross Premiums Tax Rates on Foreign Life Insurers........................................ 55
Table 19 State General Sales and Use Tax Rates ................................................................... 56
Table 20 State Beer Tax Rates .............................................................................................. 57
Table 21 State Light Wine Tax Rates..................................................................................... 59
Table 22 State Distilled Spirits Tax Rates............................................................................... 60
Table 23 State Cigarette Tax Rates........................................................................................ 61
Table 24 Motor Fuel Tax Rates ............................................................................................. 62
Table 25 Motor Vehicle Sales and Excise Taxes .................................................................... 63
Table 26 State Motor Vehicle Registration Fees..................................................................... 64
Table 27 State Real Estate Deed Recordation and Transfer Tax Rates.................................... 65
Table 28 Types of State Inheritance and Estate Taxes ............................................................ 66

v
EXECUTIVE SUMMARY
State and local tax systems in the United States are widely diverse. The 50 states and the Districtof Columbia employ a broad range of taxes and fees to fund state and local government operations. The combination of taxes and fees utilized by a particular jurisdiction is dependent upon many factors,including revenue needs, the tax base of the local government, the fiscal relationship between the stateand local governments, and the level of local government services demanded by residents.
The District's tax structure includes taxes typically imposed by local governments, such as real andpersonal property taxes, deed taxes, and others. At the same time, the District's tax structure alsoincludes taxes usually associated with the state level of government, such as the individual and corporateincome taxes, sales and use taxes, excise taxes and motor vehicle-related taxes. Sixty-seven percent ofthe District's locally generated revenues come from taxes usually administered by a state.
Although the District has both these state and local fiscal features, the actual tax structure is notcomplemented by the typical state or local economic base. There are many examples, such as:
• Manufacturing, an important industry in the economic and tax bases of many majorcities, is largely lacking in the District.
• Unlike every state in the nation that has an income tax, Washington, D.C., does nothave the authority to tax nonresident income earned within its borders. Nonresidents earn about 2/3 of all income in the District of Columbia.
• About 42 percent of all property value in the District is exempt from propertytaxation due to the federal and diplomatic presence (29 percent) as well as othertax-exempt properties (12 percent).
• About 17 percent of sales are not subject to sales and use tax in the District due tomilitary and diplomatic exemptions.
• The District has a relatively high percentage of low-income taxpayers, which furtherlimits the District's revenue-raising capacity.
Despite these limitations in the tax base, the District of Columbia funds most of the functions usuallyprovided by state and local levels of government. The non-municipal functions include responsibility forwelfare programs, physical and mental health care and maintenance of the public education system --including a "state" university.
To provide an adequate level of funding for these state and local responsibilities given the limitedtax base, the District's tax rates often are higher than those in the states. Data from the U.S. Bureau ofthe Census indicate that in 1991, the District's overall per capita tax collections were higher than thoseof 49 states. For some tax types, however, the District's taxes are lower than most states.

vi
The state and local tax rates for different types of taxes vary among jurisdictions. For example, all51 cities in this study levy a tax on real property located within the city, yet effective tax rates range froma high of $4.55 per $100 of assessed value in Bridgeport, Connecticut to $0.37 per $100 of assessedvalue in Honolulu, Hawaii. In addition, several jurisdictions allow tax exemptions and credits in thecalculation of the real property tax. The District of Columbia has a $30,000 homestead deduction forowner-occupied residences as well as other credits.
Residents in 46 of the 51 cities studied are subject to some form of sales and use tax. The highestsales tax rates are found in New Orleans and Seattle. Residents of Honolulu, Hawaii, and VirginiaBeach, Virginia pay the lowest sales tax rates.
All 51 cities in this study levy some type of automobile registration fee or tax -- usually either a flatrate per vehicle or a sales tax based upon the value of the vehicle. In addition, personal property taxesare levied in 14 of the cities.
Residents of 44 of the 51 cities in this study are subject to some type of individual income tax at thestate and/or local levels. There are several types of individual income tax systems, including graduatedstate and local rates, graduated state and flat local rates, flat state and local rates, state tax rates as apercent of federal income tax liability, graduated state tax rates and flat state rates with exemptions.
No single pattern of taxation characterizes a high tax burden or a low tax burden city. Detailsconcerning the various taxes levied and why the tax burdens differ from one jurisdiction to another arepresented in this publication. Part I of this publication compares tax burdens in the District of Columbiawith those of the largest city in each state. Part II of this publication contains a compendium of tableswhich illustrate the tax rates in the District of Columbia and the 50 states for 13 different types of taxes.

vii
ACKNOWLEDGMENT
Each year the Government of the District of Columbia, Office of the Chief Financial Officer, Officeof Research and Analysis publishes several reports, which provide information to the citizens andtaxpayers of the District of Columbia. The reports contain information about the rates and burdens ofmajor taxes in the District of Columbia compared with states and other large cities in the United States.
This publication contains two reports: (I) Tax burdens in Washington, D.C., Compared withThose in the Largest City in Each State, 2001 and (II) A Comparison of Selected Tax Rates in theDistrict of Columbia with Those in the 50 States: A Compendium of Tables. This information isrequested annually by committees of the U.S. Congress and the District of Columbia Council and isprovided pursuant to Public Law 93-407.
Questions and comments concerning these publications should be addressed to: Edward W.Wyatt, Tax Research Specialist, Revenue Estimation and Tax Research Administration, Office ofResearch and Analysis, 441 4th Street, NW, Suite 400 South, Washington, D.C. 20001, telephone(202) 727-7775.
Our appreciation is extended to the many state and local officials who reviewed draft reports. Theircooperation in providing information and their helpful suggestions make this publication possible.
Julia Friedman, Ph. D.Deputy Chief Financial OfficerOffice of the Chief Financial OfficerOffice of Research and AnalysisAugust 2002

Part I
Tax Burdens In Washington, D.C.,Compared With Those In
The Largest City In Each State
2001

Tax Rates and Tax Burdens in the District of Columbia: A Nationwide Comparison
Page 1
OVERVIEW
State and local tax systems in the United States are diverse. The 50 states and the District ofColumbia employ a broad range of taxes and fees to fund state and local government operations. Thecombination of taxes and fees utilized by a particular jurisdiction is dependent upon many factors,including revenue needs, the tax base of the local government, the fiscal relationships between state andlocal government, constitutional and legal limitations on the powers of taxation, taxpayer demand forgovernment services, and other factors.
A "tax burden" is a measure of the tax paid by a taxpayer under a specified set of conditions. Thisstudy defines a specified set of conditions and computes corresponding tax burdens in 51 differentjurisdictions. These tax burdens are then compared. Useful information and insights can be gleanedfrom such a comparison. In evaluating or interpreting these comparisons, however, considerationshould be given to circumstances specific to each jurisdiction, which may affect tax burdens. Suchcircumstances can include greater local demand for services, greater local costs of producing services,and the use of revenue sources other than taxes to finance certain services.
This study compares tax burdens in 51 different locations for a hypothetical family of four. Themajor state and local tax burdens for the family in the District of Columbia are compared with those inthe largest city in each state. It must be emphasized that these burden comparisons reflect theassumptions used in their computation. For this reason it is important to study the methodology used inthe report before drawing conclusions about the relative levels of taxation in each of the cities.
This is an ongoing study, published annually and readers are advised not to compare thehypothetical tax burdens across years; any number of small changes in state and/or local tax policy or inthe assumptions of the study can result in misleading information under such comparisons. The purposeof the study remains to compare tax burdens on a hypothetical household in different jurisdictions in aspecific year, and not over time.

Chapter I: How Tax Burdens Are Computed For The Largest City In Each State
Tax Rates and Tax Burdens in the District of Columbia: A Nationwide Comparison
Page 2
CHAPTER IHow Tax Burdens Are ComputedFor The Largest City In Each State
The majority of taxpayers in the United States are aware that the amount of state and local taxliability of an individual taxpayer varies from one jurisdiction to another. The extent of these differencesin state and local tax burdens across the country, however, may not be fully recognized.
States and local jurisdictions differ in many aspects of their taxing systems. The relationship ofstate taxes to federal tax law is one of several factors causing differences in tax burdens from one stateto another. Other differences reflect decisions by state and local governments on what should andshould not be subject to tax. For example, several states do not levy an individual income tax, althoughfor many others it represents a major source of state funding. Tax burdens also differ because somestates can shift a larger portion of governmental costs to business and may be able to "export" some oftheir tax burden. This was once true for energy producing states, several of which have been forced tobroaden the bases of their taxes because of the long-term decline in real energy prices.
This report compares the state and local tax burdens of hypothetical households in Washington,D.C., with the burden for the largest city in each of the 50 states for 2001. The four major taxes used inthe comparison are the individual income tax, real property tax on residential property, general sales anduse tax, and automobile taxes, including gasoline tax, registration fees, excise tax and personal propertytax. This study does not incorporate the effects of differing local tax burdens on the federal individualincome tax burden. Income and property taxes are deductible in computing federal income taxes andthe effect of federal deductibility is to reduce the overall difference in tax burdens between jurisdictions.
All tax burdens reflect state and local tax rates. Tax burdens are compared for a hypotheticalfamily that consists of two wage-earning spouses and two school-age children. The gross family incomelevels used are $25,000, $50,000, $75,000, $100,000 and $150,000. The wage and salary split isassumed to be 70-30 between the two spouses. All other income is assumed to be split evenly. Thefamily at each income level is assumed to own a single family home and to reside within the confines ofthe city. All wage and salary income is further assumed to have been earned in the city. The particularassumptions used in the calculation of each major tax type are indicated on the following pages.

Chapter I: How Tax Burdens Are Computed For The Largest City In Each State
Tax Rates and Tax Burdens in the District of Columbia: A Nationwide Comparison
Page 3
Individual Income Tax
The five income levels used in this study are divided between wage and salary income and othertypes of income as follows:
Long-Term 1999Gross Wages And Capital FederalIncome Salaries Interest Gains 1/ AGI
$ 25,000 Spouse 1 $17,200 $ 200 0 $ 25,000Spouse 2 7,400 200 0
$ 50,000 Spouse 1 $34,000 $ 500 0 $ 50,000Spouse 2 15,000 500 0
$ 75,000 Spouse 1 $49,000 $1,000 $1,500 $ 75,000Spouse 2 21,000 $1,000 1,500
$100,000 Spouse 1 $65,000 $1,500 $2,000 $100,000Spouse 2 28,000 1,500 2,000
$150,000 Spouse 1 $97,500 $2,500 $2,750 $150,000Spouse 2 42,000 2,500 2,750
1/ Assumes a three-year holding period
Because several states allow the deduction of all or part of an individual's federal income taxliability in computing the state income tax, it is necessary to compute the 2001 federal individual incometax at each income level using the above assumptions. Interest and long-term capital gains were fully orpartially taxable at the federal level at the time period used for this report.
Many states in 2001 allowed taxpayers to begin their state income tax computations with federaladjusted gross income (A.G.I.) or federal taxable income. Other states do not use either of these twomeasures of federal income as a starting point.
.

Chapter I: How Tax Burdens Are Computed For The Largest City In Each State
Tax Rates and Tax Burdens in the District of Columbia: A Nationwide Comparison
Page 4
Total itemized deductions, which were also used in the federal tax computation, were assumed to beequal to the following:
Gross Income LevelDeduction $ 25,000 $ 50,000 $ 75,000 $100,000 $150,000
Medical (Gross) 1,000 1,800 2,500 3,500 5,000Nondeductible Medical -1,875 -3,750 -5,625 -7,500 -11,200Net Medical Deduction 1/ 0 0 0 0 0
Deductible Taxes 2/ 2/ 2/ 2/ 2/
Mortgage Interest 3/ 2,000 4,100 5,600 7,000 10,800
Contribution Deduction 700 1,500 2,200 3,000 4,600
Gross Miscellaneous 500 800 1,200 1,500 2,000Nondeductible 4/ -500 -1,000 -1,500 -2,000 -3,000Net Miscellaneous Deduction 0 0 0 0 0
Total Deductions-without taxes 2,700 5,600 7,800 10,000 15,400
1/ Nondeductible medical equals 7.5 percent of federal A.G.I. All or part of medical deductions may be allowed in somestates.
2/ Tax deduction based on real and personal property taxes computed in 2001 study and individual income taxescomputed in 2000 study.
3/ Non-mortgage interest is not deductible on federal returns. 4/ Nondeductible miscellaneous equals 2 percent of A.G.I.
The itemized deductions noted above are used in the calculation of the 2001 tax burdens. The2001 deductible real and personal property taxes computed in the current year's 51-city burden studyare used for the 2001 property tax deduction. For the 2001 state and local individual income taxdeduction, 2000 data were used as a proxy. These figures were used in computing the 2001 federalincome tax burden for residents of each city as well as for the state and local tax burdens whereappropriate. For those states not allowing their own state income tax as a deduction, it is not includedin itemized deductions.
The use of a hypothetically computed tax burden for itemized deductions for the individualincome tax and the real property tax, even if from a previous year, should provide a more realisticincome tax burden than the use of a single flat percentage amount for the itemized income tax deductionsfor all jurisdictions.

Chapter I: How Tax Burdens Are Computed For The Largest City In Each State
Tax Rates and Tax Burdens in the District of Columbia: A Nationwide Comparison
Page 5
Real Property Tax
Real property tax burdens in the 51 cities are a function of residential real estate values, the ratioof assessed value to market value and the tax rate. Some jurisdictions allow certain deductions from thevalue of residential property before the tax is calculated while others allow credits against the calculatedreal estate tax. These deductions and/or credits are normally limited to owner-occupied properties.
The property tax rates for each of the 51 cities, presented in Table 4, page 19, indicate a widerange in these rates. This information is based upon data received from local assessors. In addition totax rate differences presented in Table 5 (page 20), data indicate that the assumed market value of aresidence for purposes of this study varies widely from one city to another at all income levels. Forexample, the assumed value of a residence at the $75,000 income level ranges from a high of $515,041in Honolulu, Hawaii to a low of $120,160 in Wichita, Kansas. The housing values for each income levelfor each city in Table 5 are derived using the following methodology:
1) The 2000 median single family housing value for each city obtained from the 2000 Censusof Housing is compared to the city median family income for homeowners from the2000 Census of Population. The resulting ratio of median housing value to median familyincome is the housing/income ratio shown in Table 5. For Washington, D.C., forexample, the ratio is 3.40.
2) The housing values for the two middle income levels, $50,000 and $75,000, are derivedby multiplying the housing/income ratio shown in Table 5 by the income level. Thus, forWashington, D.C., the housing values at the $50,000 and $75,000 incomes arecomputed as follows:
$50,000 x 3.40 = $169,825$75,000 x 3.40 = $254,737
The housing values in Table 5 on page 20 are calculated on the basis of an unroundedhousing to income ratio, which makes the result slightly different from that shown in theexamples.
3) For the lowest income level, $25,000, the cost of housing is assumed to be a greaterproportion of income than the housing/income ratio derived above. For this income level,the housing/income ratio is increased by 5 percent, based on data from the United StatesCensus Bureau. For Washington, D.C., the appropriate calculation at the $25,000 levelusing the rounded ratio is:
$25,000 x 3.40 x 1.05 = $89,158

Chapter I: How Tax Burdens Are Computed For The Largest City In Each State
Tax Rates and Tax Burdens in the District of Columbia: A Nationwide Comparison
Page 6
4) For the $100,000 income level, housing costs as a percentage of income are assumed tobe less than the derived ratio. The housing to income ratio is reduced by 5 percent. Theappropriate calculation for Washington, D.C. is:
$100,000 x 3.40 x .95 = $322,667
5) For the highest income level, housing costs as a percentage of income are also assumedto be less than the derived ratio. The housing to income ratio is reduced by 10 percent atthe highest income level, again based on data from the United States Census Bureau. Theappropriate calculation for Washington, D.C. is:
$150,000 x 3.40 x .90 = $458,527
The above methodology is an attempt to reflect the different values of housing in different partsof the country and at different income levels. Census data from 2000 are used because they are theonly data comparable for all the jurisdictions in this study. It is important to note that these arehypothetical values based on income level and do not represent average values for a particularjurisdiction.
In computing property tax burdens, it is also necessary to consider the various exemptions andcredits noted in Table 6 (page 21). The variety of real property tax exemptions, most of which applyonly to residential real property, is very broad. Table 6 does not include the many senior citizenexemptions and credits available in a large number of states. Table 4 (page 19), which comparesresidential real estate tax rates for each city, does not reflect the various exemptions and credits noted inTable 6. The many senior citizen exemptions and credits available are also not reflected in Table 4,because seniors are not included in the hypothetical households of this study. However, the propertytax burdens computed and shown in Table 1 of this study reflect the applicable provisions.
Sales and Use Tax
The sales tax burdens included in this study are based on information from the 2000 Bureau ofLabor Statistics consumer expenditure survey (CES) and from information provided by the states in asales tax survey. The state and local general sales tax rates in each city are reported in Table 7, page23.
Automobile Taxes
Automobile taxes included in this study are gasoline taxes, motor vehicle registration fees, excisetaxes, and personal property taxes levied on automobiles. Table 10 (page 26) summarizes automobileownership assumptions for each income level, including types of vehicles, weight, value and annualgasoline consumption.

Chapter II: Overall Tax Burdens For The Largest City In Each State
Tax Rates and Tax Burdens in the District of Columbia: A Nationwide Comparison
Page 7
CHAPTER IIOverall Tax Burdens For The
Largest City In Each State
The major state and local tax burdens by tax type for the five different income levels used in thisstudy are presented in Table 1 (pages 8-12). As reflected by data in Table 1, tax burdens across the51 cities vary widely at all income levels. At the $25,000 income level, the $4,359 burden forBridgeport, Connecticut is more than four times greater than the $962 burden for Cheyenne, Wyoming. Similarly, at the $150,000 income level, the Bridgeport, Connecticut burden of $28,859 is more thanfive times the Cheyenne, Wyoming, burden of $5,321. The differences in the composition of state andlocal tax structures cause a wide variation in tax burdens at all income levels.
The highest overall tax burden occurs in Bridgeport, Connecticut followed by Newark, NewJersey; Providence, Rhode Island; and Des Moines, Iowa.
The lowest tax burdens for the 51 cities occur in Cheyenne, Wyoming followed by Anchorage,Alaska; Jacksonville, Florida; and Las Vegas, Nevada.
No single pattern characterizes a city with either a high or a low tax burden. Generally,however, high tax burden cities have a graduated individual income tax rate and/or high real estate taxrates and moderate to high housing values. Low tax burden cities generally have a low individualincome tax (if they have one at all) and average or below average real property tax rates. The regionalpattern cannot be overlooked, as the three highest tax cities are located in the Northeast and the threelowest tax cities are located in the South and West.
Progressivity
The average 51-city total tax burden is 7.4 percent at the $25,000 income level, 8.6 percent atthe $50,000 income level, 9.3 percent at the $75,000 income level, 9.5 percent at the $100,000income level, and 9.7 percent at the $150,000 income level.

Chapter II: Overall Tax Burdens For The Largest City In Each State
Tax Rates and Tax Burdens in the District of Columbia: A Nationwide Comparison
Page 8
TABLE 1ESTIMATED BURDEN OF MAJOR TAXES FOR A FAMILY OF FOUR, 2001
$25,000TAXES BURDEN
RANK CITY ST INCOME PROPERTY SALES AUTO AMOUNT PERCENT1 Bridgeport CT 0 3,547 376 437 4,359 17.4%2 Newark NJ 179 3,161 309 139 3,789 15.2%3 Philadelphia PA 1,120 1,119 328 199 2,765 11.1%4 Providence RI 72 1,942 351 274 2,638 10.6%5 Des Moines IA 452 1,611 373 176 2,612 10.4%6 Detroit MI 983 1,099 335 185 2,602 10.4%7 Portland OR 900 1,210 0 165 2,275 9.1%8 Louisville KY 1,331 375 320 210 2,236 8.9%9 Birmingham AL 1,162 328 517 179 2,186 8.7%
10 Chicago IL 378 1,134 505 167 2,183 8.7%11 Manchester NH 0 1,840 159 148 2,146 8.6%12 Los Angeles CA 0 1,483 393 251 2,127 8.5%13 Minneapolis MN 0 1,565 341 219 2,125 8.5%14 Portland ME 46 1,566 298 189 2,099 8.4%15 Columbus OH 799 779 319 179 2,076 8.3%16 Atlanta GA 415 939 460 168 1,982 7.9%17 Kansas City MO 669 546 442 247 1,904 7.6%18 Milwaukee WI 0 1,319 367 210 1,896 7.6%19 Seattle WA 0 1,167 529 174 1,869 7.5%20 Indianapolis IN 764 641 318 106 1,828 7.3%21 Oklahoma City OK 637 448 553 186 1,824 7.3%22 Charlotte NC 468 718 405 229 1,820 7.3%23 Little Rock AR 474 682 439 220 1,814 7.3%24 Omaha NE 192 931 408 265 1,795 7.2%25 New York City NY 563 796 367 67 1,793 7.2%26 Charleston WV 582 506 405 287 1,779 7.1%27 Burlington VT 0 1,295 315 162 1,772 7.1%28 Salt Lake City UT 367 708 461 228 1,764 7.1%29 WASHINGTON DC 690 481 378 213 1,761 7.0%30 Honolulu HI 777 512 303 167 1,759 7.0%31 Virginia Beach VA 580 683 262 213 1,737 6.9%32 Fargo ND 122 1,068 341 200 1,731 6.9%33 Baltimore MD 0 1,192 339 182 1,713 6.9%34 Memphis TN 0 888 575 198 1,661 6.6%35 Phoenix AZ 172 804 558 122 1,656 6.6%36 Boston MA 251 1,006 176 188 1,621 6.5%37 Albuquerque NM 94 892 472 135 1,592 6.4%38 Houston TX 0 849 503 185 1,537 6.1%39 Wilmington DE 568 759 0 164 1,491 6.0%40 Jackson MS 162 494 474 361 1,490 6.0%41 Columbia SC 121 730 323 277 1,450 5.8%42 Sioux Falls SD 0 762 469 161 1,393 5.6%43 Las Vegas NV 0 757 342 232 1,332 5.3%44 Billings MT 414 610 0 218 1,242 5.0%45 Anchorage AK 0 1,083 0 122 1,205 4.8%46 Wichita KS 202 236 407 322 1,167 4.7%47 Boise City ID 44 502 328 227 1,102 4.4%48 Denver CO 0 469 404 210 1,083 4.3%49 New Orleans LA 385 0 507 190 1,082 4.3%50 Jacksonville FL 0 469 372 129 970 3.9%51 Cheyenne WY 0 400 434 128 962 3.8%

Chapter II: Overall Tax Burdens For The Largest City In Each State
Tax Rates and Tax Burdens in the District of Columbia: A Nationwide Comparison
Page 9
AVERAGE 1/ $389
$963 $399 $200 $1,859 7.4%
MEDIAN $192
$796 $372 $189 $1,779 7.1%
1/ Based on cities actually levying tax.

Chapter II: Overall Tax Burdens For The Largest City In Each State
Tax Rates and Tax Burdens in the District of Columbia: A Nationwide Comparison
Page 10
TABLE 1ESTIMATED BURDEN OF MAJOR TAXES FOR A FAMILY OF FOUR, 2001
$50,000TAXES BURDEN
RANK CITY ST INCOME PROPERTY SALES AUTO AMOUNT PERCENT1 Bridgeport CT 316 6,755 752 636 8,459 16.9%2 Newark NJ 598 6,022 618 142 7,380 14.8%3 Philadelphia PA 3,630 2,131 656 206 6,623 13.2%4 Providence RI 1,470 3,698 701 606 6,476 13.0%5 Des Moines IA 1,780 3,263 747 215 6,004 12.0%6 Detroit MI 2,649 2,093 671 207 5,619 11.2%7 Minneapolis MN 1,648 2,982 681 253 5,564 11.1%8 Baltimore MD 2,412 2,270 679 188 5,549 11.1%9 Portland ME 2,595 2,304 0 172 5,071 10.1%
10 Milwaukee WI 1,657 2,580 734 217 5,188 10.4%11 New York City NY 2,634 1,727 733 75 5,170 10.3%12 Louisville KY 3,188 998 639 293 5,118 10.2%13 Portland OR 2,595 2,304 0 172 5,071 10.1%14 Atlanta GA 1,507 2,373 920 249 5,049 10.1%15 WASHINGTON DC 2,784 1,176 754 218 4,933 9.9%16 Chicago IL 1,135 2,500 1,009 172 4,816 9.6%17 Columbus OH 2,287 1,484 638 185 4,594 9.2%18 Salt Lake City UT 2,046 1,349 922 264 4,581 9.2%19 Charlotte NC 1,972 1,368 809 299 4,449 8.9%20 Burlington VT 1,049 2,523 630 167 4,369 8.7%21 Kansas City MO 2,068 1,041 884 342 4,334 8.7%22 Boston MA 1,830 1,917 382 199 4,328 8.7%23 Columbia SC 1,707 1,487 645 410 4,250 8.5%24 Los Angeles CA 220 2,893 787 340 4,240 8.5%25 Omaha NE 1,252 1,773 816 349 4,190 8.4%26 Birmingham AL 2,273 650 1,035 228 4,185 8.4%27 Oklahoma City OK 1,874 944 1,106 191 4,115 8.2%28 Honolulu HI 2,223 1,107 606 171 4,107 8.2%29 Little Rock AR 1,618 1,299 877 292 4,085 8.2%30 Manchester NH 0 3,504 318 177 3,999 8.0%31 Albuquerque NM 1,107 1,698 943 153 3,901 7.8%32 Virginia Beach VA 1,795 1,300 524 259 3,879 7.8%33 Charleston WV 1,697 964 810 370 3,841 7.7%34 Phoenix AZ 864 1,705 1,116 151 3,837 7.7%35 Indianapolis IN 1,838 1,243 635 110 3,826 7.7%36 Jackson MS 1,089 1,212 947 548 3,797 7.6%37 Boise City ID 1,736 1,089 656 234 3,715 7.4%38 Fargo ND 633 2,034 681 206 3,554 7.1%39 New Orleans LA 1,235 1,020 1,015 210 3,480 7.0%40 Seattle WA 0 2,222 1,058 180 3,460 6.9%41 Wilmington DE 1,837 1,446 0 170 3,453 6.9%42 Wichita KS 1,330 642 814 437 3,224 6.4%43 Billings MT 1,736 1,163 0 272 3,170 6.3%44 Memphis TN 0 1,691 1,149 203 3,044 6.1%45 Houston TX 0 1,823 1,006 190 3,020 6.0%46 Denver CO 850 894 808 241 2,793 5.6%47 Sioux Falls SD 0 1,452 938 167 2,557 5.1%48 Las Vegas NV 0 1,443 684 277 2,404 4.8%49 Jacksonville FL 0 1,338 745 134 2,216 4.4%50 Anchorage AK 0 2,063 0 124 2,187 4.4%51 Cheyenne WY 0 762 868 152 1,782 3.6%

Chapter II: Overall Tax Burdens For The Largest City In Each State
Tax Rates and Tax Burdens in the District of Columbia: A Nationwide Comparison
Page 11
AVERAGE 1/ $1,628 $1,929 $799 $244 $4,299 8.6%
MEDIAN $1,618 $1,691 $745 $210 $4,185 8.4%1/ Based on cities actually levying tax.

Chapter II: Overall Tax Burdens For The Largest City In Each State
Tax Rates and Tax Burdens in the District of Columbia: A Nationwide Comparison
Page 12
TABLE 1ESTIMATED BURDEN OF MAJOR TAXES FOR A FAMILY OF FOUR, 2001
$75,000TAXES BURDEN
RANK CITY ST INCOME PROPERTY SALES AUTO AMOUNT PERCENT1 Bridgeport CT 2,267 10,133 1,128 995 14,523 19.4%2 Newark NJ 1,049 9,033 928 263 11,272 15.0%3 Providence RI 2,734 5,547 1,052 774 10,107 13.5%4 Philadelphia PA 5,286 3,197 984 359 9,826 13.1%5 Des Moines IA 3,266 5,002 1,120 339 9,726 13.0%6 New York City NY 5,118 2,707 1,100 133 9,058 12.1%7 Portland ME 3,234 4,474 888 435 9,031 12.0%8 Minneapolis MN 3,047 4,473 975 462 8,957 11.9%9 Detroit MI 4,346 3,139 1,006 375 8,866 11.8%
10 Baltimore MD 3,906 3,404 1,018 329 8,658 11.5%11 Milwaukee WI 3,132 3,907 1,100 381 8,520 11.4%12 Atlanta GA 2,707 3,882 1,380 390 8,359 11.1%13 Portland OR 4,547 3,457 0 294 8,298 11.1%14 WASHINGTON DC 4,774 1,908 1,131 363 8,177 10.9%15 Louisville KY 4,977 1,654 959 462 8,052 10.7%16 Los Angeles CA 1,634 4,377 1,180 544 7,736 10.3%17 Chicago IL 1,813 3,938 1,514 305 7,570 10.1%18 Columbus OH 3,954 2,226 957 325 7,462 9.9%19 Salt Lake City UT 3,468 2,023 1,383 479 7,354 9.8%20 Charlotte NC 3,516 2,052 1,214 476 7,258 9.7%21 Columbia SC 3,198 2,431 968 636 7,233 9.6%22 Burlington VT 1,869 4,013 945 295 7,122 9.5%23 Omaha NE 2,646 2,659 1,224 510 7,039 9.4%24 Boston MA 3,023 2,875 591 368 6,857 9.1%25 Boise City ID 3,388 2,046 984 417 6,836 9.1%26 Honolulu HI 3,814 1,734 909 310 6,767 9.0%27 Oklahoma City OK 3,283 1,466 1,659 357 6,766 9.0%28 Little Rock AR 2,978 1,948 1,316 465 6,707 8.9%29 Kansas City MO 3,270 1,561 1,325 518 6,674 8.9%30 Albuquerque NM 2,392 2,547 1,415 258 6,613 8.8%31 Charleston WV 3,232 1,446 1,215 599 6,491 8.7%32 Jackson MS 2,181 1,969 1,421 845 6,416 8.6%33 Birmingham AL 3,413 988 1,552 371 6,324 8.4%34 Virginia Beach VA 3,043 1,950 787 433 6,213 8.3%35 Manchester NH 0 5,256 476 323 6,056 8.1%36 New Orleans LA 2,005 2,167 1,552 336 6,030 8.0%37 Indianapolis IN 2,909 1,877 953 189 5,928 7.9%38 Phoenix AZ 1,530 2,230 1,674 341 5,775 7.7%39 Billings MT 3,509 1,744 0 503 5,756 7.7%40 Wilmington DE 3,277 2,169 0 293 5,739 7.7%41 Wichita KS 2,719 1,070 1,221 698 5,708 7.6%42 Fargo ND 1,154 3,051 1,022 329 5,556 7.4%43 Seattle WA 0 3,333 1,587 313 5,233 7.0%44 Denver CO 1,746 1,341 1,212 406 4,705 6.3%45 Houston TX 0 2,849 1,509 340 4,698 6.3%46 Memphis TN 0 2,537 1,724 366 4,627 6.2%47 Sioux Falls SD 0 2,178 1,406 291 3,876 5.2%48 Las Vegas NV 0 2,164 1,026 426 3,616 4.8%49 Jacksonville FL 0 2,253 1,117 236 3,606 4.8%50 Anchorage AK 0 3,094 0 232 3,326 4.4%51 Cheyenne WY 0 1,143 1,301 347 2,792 3.7%

Chapter II: Overall Tax Burdens For The Largest City In Each State
Tax Rates and Tax Burdens in the District of Columbia: A Nationwide Comparison
Page 13
AVERAGE 1/ $2,940 $2,953 $1,197 $409 $6,978 9.3%
MEDIAN $2,978 $2,431 $1,117 $366 $6,767 9.0%1/ Based on cities actually levying tax.

Chapter II: Overall Tax Burdens For The Largest City In Each State
Tax Rates and Tax Burdens in the District of Columbia: A Nationwide Comparison
Page 14
TABLE 1ESTIMATED BURDEN OF MAJOR TAXES FOR A FAMILY OF FOUR, 2001
$100,000TAXES BURDEN
RANK CITY ST INCOME PROPERTY SALES AUTO AMOUNT PERCENT1 Bridgeport CT 3,616 12,835 1,504 1,496 19,450 19.5%2 Newark NJ 1,838 11,441 1,237 271 14,787 14.8%3 Providence RI 4,101 7,027 1,403 1,607 14,137 14.1%4 Des Moines IA 4,935 6,393 1,493 426 13,247 13.2%5 Philadelphia PA 7,032 4,050 1,312 380 12,773 12.8%6 New York City NY 7,634 3,491 1,467 142 12,734 12.7%7 Portland ME 5,061 5,667 1,184 544 12,456 12.5%8 Minneapolis MN 4,513 5,665 1,363 617 12,158 12.2%9 Detroit MI 6,330 3,976 1,341 431 12,078 12.1%
10 Baltimore MD 5,508 4,312 1,357 348 11,526 11.5%11 Milwaukee WI 4,643 4,968 1,467 403 11,481 11.5%12 Atlanta GA 3,913 5,089 1,840 593 11,436 11.4%13 Los Angeles CA 3,456 5,565 1,574 770 11,364 11.4%14 WASHINGTON DC 6,838 2,494 1,509 380 11,220 11.2%15 Portland OR 6,516 4,378 0 314 11,209 11.2%16 Louisville KY 6,813 2,179 1,278 672 10,942 10.9%17 Columbus OH 5,900 2,820 1,276 344 10,339 10.3%18 Charlotte NC 5,323 2,600 1,618 654 10,195 10.2%19 Burlington VT 3,193 5,412 1,260 311 10,176 10.2%20 Columbia SC 4,668 3,186 1,290 971 10,116 10.1%21 Chicago IL 2,506 5,088 2,018 321 9,934 9.9%22 Salt Lake City UT 4,824 2,563 1,844 559 9,791 9.8%23 Omaha NE 4,118 3,368 1,632 577 9,694 9.7%24 Boise City ID 5,042 2,812 1,312 438 9,604 9.6%25 Albuquerque NM 3,894 3,227 1,887 285 9,293 9.3%26 Little Rock AR 4,432 2,467 1,755 635 9,289 9.3%27 Honolulu HI 5,476 2,235 1,212 323 9,246 9.2%28 Boston MA 4,322 3,642 803 408 9,175 9.2%29 Charleston WV 4,857 1,831 1,620 812 9,119 9.1%30 Kansas City MO 4,581 1,977 1,767 754 9,079 9.1%31 Jackson MS 3,268 2,574 1,895 1,316 9,052 9.1%32 Oklahoma City OK 4,719 1,566 2,212 371 8,868 8.9%33 Phoenix AZ 2,256 3,690 2,232 512 8,690 8.7%34 Billings MT 5,569 2,209 0 664 8,442 8.4%35 Virginia Beach VA 4,318 2,470 1,049 552 8,389 8.4%36 Birmingham AL 4,548 1,259 2,069 494 8,371 8.4%37 New Orleans LA 2,705 3,085 2,029 356 8,175 8.2%38 Wichita KS 4,143 1,413 1,628 990 8,174 8.2%39 Wilmington DE 4,795 2,747 0 312 7,854 7.9%40 Indianapolis IN 3,987 2,385 1,270 202 7,844 7.8%41 Manchester NH 0 6,658 635 403 7,695 7.7%42 Fargo ND 1,973 3,865 1,362 367 7,567 7.6%43 Denver CO 3,165 1,698 1,616 487 6,967 7.0%44 Seattle WA 0 4,222 2,116 332 6,670 6.7%45 Houston TX 0 3,669 2,012 356 6,038 6.0%46 Memphis TN 30 3,214 2,298 383 5,925 5.9%47 Sioux Falls SD 0 2,759 1,875 309 4,943 4.9%48 Jacksonville FL 0 2,986 1,489 249 4,723 4.7%49 Las Vegas NV 0 2,741 1,368 509 4,619 4.6%50 Anchorage AK 0 3,919 0 239 4,158 4.2%51 Cheyenne WY 0 1,448 1,735 480 3,663 3.7%

Chapter II: Overall Tax Burdens For The Largest City In Each State
Tax Rates and Tax Burdens in the District of Columbia: A Nationwide Comparison
Page 15
AVERAGE 1/ $4,349 $3,791 $1,598 $523 $9,507 9.5%
MEDIAN $4,318 $3,214 $1,489 $426 $9,289 9.3%1/ Based on cities actually levying tax.

Chapter II: Overall Tax Burdens For The Largest City In Each State
Tax Rates and Tax Burdens in the District of Columbia: A Nationwide Comparison
Page 16
TABLE 1ESTIMATED BURDEN OF MAJOR TAXES FOR A FAMILY OF FOUR, 2001
$150,000TAXES BURDEN
RANK CITY ST INCOME PROPERTY SALES AUTO AMOUNT PERCENT1 Bridgeport CT 6,150 18,239 2,256 2,214 28,859 19.2%2 Newark NJ 4,573 16,259 1,855 267 22,954 15.3%3 Providence RI 6,878 9,985 2,104 2,825 21,792 14.5%4 Des Moines IA 8,468 9,175 2,240 565 20,448 13.6%5 New York City NY 12,937 5,059 2,200 139 20,335 13.6%6 Portland ME 8,671 8,053 1,776 702 19,202 12.8%7 Los Angeles CA 7,357 7,939 2,361 1,083 18,740 12.5%8 Philadelphia PA 10,549 5,755 1,968 370 18,642 12.4%9 Minneapolis MN 7,684 8,051 2,044 826 18,605 12.4%
10 Detroit MI 9,805 5,650 2,012 383 17,850 11.9%11 Atlanta GA 6,312 7,504 2,760 890 17,466 11.6%12 Milwaukee WI 7,562 7,092 2,201 393 17,247 11.5%13 WASHINGTON DC 10,908 3,665 2,263 380 17,215 11.5%14 Baltimore MD 8,662 6,128 2,036 339 17,166 11.4%15 Portland OR 10,396 6,222 0 305 16,923 11.3%16 Louisville KY 10,496 3,229 1,918 965 16,608 11.1%17 Columbus OH 10,066 4,007 1,913 335 16,322 10.9%18 Burlington VT 5,974 7,691 1,890 304 15,859 10.6%19 Columbia SC 7,662 4,696 1,936 1,454 15,748 10.5%20 Charlotte NC 8,549 3,694 2,427 886 15,557 10.4%21 Omaha NE 7,323 4,786 2,447 921 15,477 10.3%22 Boise City ID 8,335 4,343 1,969 429 15,075 10.1%23 Albuquerque NM 7,109 4,585 2,830 279 14,803 9.9%24 Chicago IL 3,891 7,389 3,027 314 14,621 9.7%25 Little Rock AR 7,443 3,506 2,632 848 14,430 9.6%26 Honolulu HI 8,966 3,238 1,817 317 14,338 9.6%27 Salt Lake City UT 7,462 3,642 2,679 520 14,303 9.5%28 Charleston WV 8,105 2,602 2,429 1,093 14,229 9.5%29 Jackson MS 5,423 3,783 2,842 2,000 14,049 9.4%30 Billings MT 9,978 3,139 0 820 13,937 9.3%31 Kansas City MO 7,409 2,810 2,651 1,068 13,937 9.3%32 Oklahoma City OK 7,497 2,720 3,318 365 13,900 9.3%33 Boston MA 6,950 5,175 1,231 442 13,798 9.2%34 Phoenix AZ 3,823 5,954 3,349 632 13,757 9.2%35 Wichita KS 6,972 2,098 2,442 1,404 12,916 8.6%36 New Orleans LA 4,352 4,921 3,044 546 12,862 8.6%37 Virginia Beach VA 6,835 3,510 1,573 702 12,620 8.4%38 Birmingham AL 6,726 1,829 3,104 655 12,314 8.2%39 Wilmington DE 7,901 3,903 0 304 12,108 8.1%40 Indianapolis IN 6,182 3,400 1,905 196 11,683 7.8%41 Fargo ND 3,610 5,492 2,044 359 11,505 7.7%42 Manchester NH 10 9,461 953 488 10,912 7.3%43 Denver CO 5,047 2,414 2,424 574 10,459 7.0%44 Seattle WA 0 6,000 3,173 324 9,497 6.3%45 Houston TX 0 5,310 2,909 349 8,568 5.7%46 Memphis TN 150 4,567 3,448 375 8,540 5.7%47 Sioux Falls SD 0 3,921 2,813 301 7,035 4.7%48 Jacksonville FL 0 4,450 2,234 243 6,927 4.6%49 Las Vegas NV 0 3,895 2,052 634 6,582 4.4%50 Anchorage AK 0 5,570 0 236 5,805 3.9%51 Cheyenne WY 0 2,058 2,603 660 5,321 3.5%

Chapter II: Overall Tax Burdens For The Largest City In Each State
Tax Rates and Tax Burdens in the District of Columbia: A Nationwide Comparison
Page 17
AVERAGE 1/ $7,208 $5,462 $2,394 $667 $14,507 9.7%
MEDIAN $7,109 $4,696 $2,234 $488 $14,338 9.6%1/ Based on cities actually levying tax .
The average tax burden for the 51 cities is progressive since the percentage tax burden at$150,000 income (9.7 percent of income) is greater than the percentage tax burden at $25,000 (7.4percent). Any tax system in which the percentage of tax paid rises with the income level is said to beprogressive. A tax system in which the percentage of taxes paid decreases as income rises isregressive.
Table 2 (page 14) indicates the relative progressivity or regressivity for the tax systems of each ofthe 51 cities. The progressivity index is measured by dividing the percentage tax burden at the $25,000income level by the percentage tax burden at the $150,000 income level. Index coefficients of less than1.000 indicates a progressive tax system, while an index greater than 1.000 indicates a regressive taxsystem. A proportional tax system is indicated by a coefficient of 1.000. The average index of .799indicates that, overall, the average state and local tax system of the 51 cities is slightly progressive. Themost progressive tax systems are found in Boise, Idaho; New Orleans, Louisiana; and New York City,New York. A graduated individual income tax and some type of low-income exemption or credit onthe real property tax characterize the tax system in each of these cities.
The three cities with the least progressive state and local tax systems are Anchorage, Alaska; LasVegas, Nevada; and Sioux Falls, South Dakota. None of these cities levies an Individual Income tax. In Sioux Falls, the sales and use tax burden is substantially above the 51-city average.
Several factors contribute to the progressivity of a tax system. A graduated individual income taxrate system, as well as exemptions and credits to lessen the regressivity of the property tax, will increasethe progressivity of a tax system. Progressivity can be lessened by reliance on regressive taxes such asthe sales tax and certain automobile taxes. The assumptions used in the calculation of housing values forthe property tax (Chapter I) presuppose a certain regressivity in the property tax because the higherincome family is assumed to spend a lower portion of income on housing than the lower income family. Similarly, the assumptions with regard to the composition of income at the five income levels also affectthe progressivity of the individual income tax. The upper and lower income levels chosen forcomparison also affect progressivity as measured in this study.

Chapter II: Overall Tax Burdens For The Largest City In Each State
Tax Rates and Tax Burdens in the District of Columbia: A Nationwide Comparison
Page 18
TABLE 2INDEX OF PROGRESSIVITY FOR THE TAX SYSTEM
OF THE LARGEST CITY IN EACH STATE2001
MAJOR STATE AND LOCAL
MAJOR STATE AND LOCAL
MAJOR STATEAND LOCAL
TAXES AS A TAXES AS A TAX BURDENPERCENT OFINCOME FOR
PERCENT OFINCOME FOR PROGRESSIVITY
RANK AT$75,000
CITY ST $25,000 FAMILY $150,000 FAMILY INDEX INCOME LEVELBoise ID 4.4% 10.1% 0.439 25New Orleans LA 4.3% 8.6% 0.505 36New York City NY 7.2% 13.6% 0.529 6Billings MT 5.0% 9.3% 0.535 39Wichita KS 4.7% 8.6% 0.542 41Columbia SC 5.8% 10.5% 0.553 21Baltimore MD 6.9% 11.4% 0.589 10WASHINGTON DC 7.0% 11.5% 0.614 14Denver CO 4.3% 7.0% 0.621 44Jackson MS 6.0% 9.4% 0.637 32Albuquerque NM 6.4% 9.9% 0.645 30Portland ME 8.4% 12.8% 0.656 7Milwaukee WI 7.6% 11.5% 0.660 11Burlington VT 7.1% 10.6% 0.670 22Atlanta GA 7.9% 11.6% 0.681 12Los Angeles CA 8.5% 12.5% 0.681 16Minneapolis MN 8.5% 12.4% 0.685 8Omaha NE 7.2% 10.3% 0.696 23Charlotte NC 7.3% 10.4% 0.702 20Boston MA 6.5% 9.2% 0.705 24Phoenix AZ 6.6% 9.2% 0.722 38Providence RI 10.6% 14.5% 0.726 3Honolulu HI 7.0% 9.6% 0.736 26Wilmington DE 6.0% 8.1% 0.739 40Salt Lake City UT 7.1% 9.5% 0.740 19Charleston WV 7.1% 9.4% 0.750 31Little Rock AR 7.3% 9.6% 0.754 28Columbus OH 8.3% 10.9% 0.763 18Des Moines IA 10.4% 13.6% 0.767 5Oklahoma City OK 7.3% 9.3% 0.787 27Portland OR 9.1% 11.3% 0.807 13Louisville KY 8.9% 11.1% 0.808 15Kansas City MO 7.6% 9.3% 0.820 29Virginia Beach VA 6.9% 8.4% 0.826 34Jacksonville FL 3.9% 4.6% 0.840 49Detroit MI 10.4% 11.9% 0.875 9Philadelphia PA 11.1% 12.4% 0.890 4Chicago IL 8.7% 9.7% 0.896 17Fargo ND 6.9% 7.7% 0.903 42Bridgeport CT 17.4% 19.2% 0.906 1Indianapolis IN 7.3% 7.8% 0.939 37Newark NJ 15.2% 15.3% 0.990 2Birmingham AL 8.7% 8.2% 1.065 33Houston TX 6.1% 5.7% 1.076 45Cheyenne WY 3.8% 3.5% 1.085 51Memphis TN 6.6% 5.7% 1.167 46Manchester NH 8.6% 7.3% 1.180 35Seattle WA 7.5% 6.3% 1.181 43Sioux Falls SD 5.6% 4.7% 1.188 47Las Vegas NV 5.3% 4.4% 1.214 48Anchorage AK 4.8% 3.9% 1.245 50
AVERAGE 7.4% 9.7% 0.799MEDIAN 0.750

Chapter III: Comparing Specific Tax Burdens For A Family Of Four In The Largest City In Each State
Tax Rates and Tax Burdens in the District of Columbia: A Nationwide Comparison
Page 19
CHAPTER IIIComparing Specific Tax Burdens
For A Family Of Four In TheLargest City In Each State
Individual Income Tax
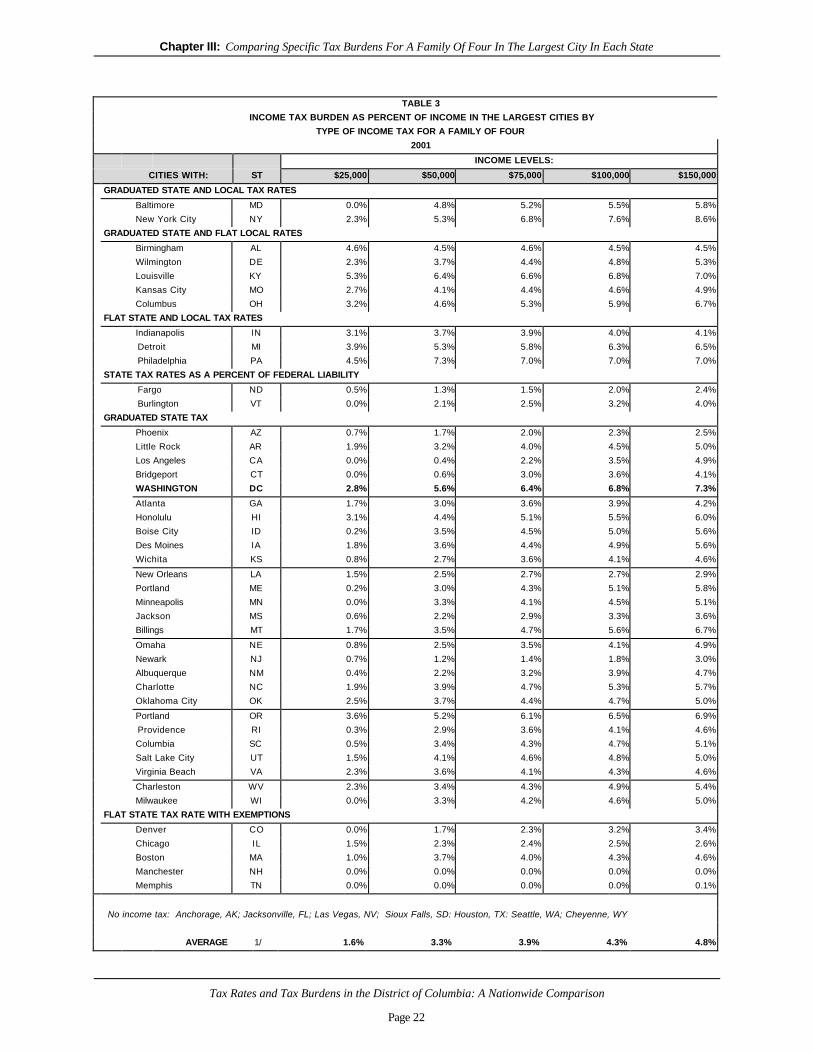
Residents of 44 of the 51 cities in the study are subject to some type of individual income tax atthe state and/or local levels. Individual income tax burdens vary widely due to factors such asdifferences in tax base, tax rates, exemptions, deductions and treatment of federal taxes. Thesevariations are reflected in the individual income tax burdens shown in Table 3 (page 18).
The percentage of income used for payment of the individual income tax burden amongresidents of the largest city in states having an income tax at the income level of $25,000 ranges from alow of zero percent in nine of the cities in the study to a high of 5.3 percent in Louisville, Kentucky. Atthe $150,000 income level, the burden ranges from zero percent of income in Manchester, NewHampshire to 8.6 percent in New York City. It should be noted that the Tennessee and NewHampshire income taxes are applicable only to interest and dividend income and the exemptions arehigh enough to eliminate individual income taxes at most income levels used in the study. New YorkCity has broad-based income taxes at both the state and local levels, each of which has graduated rates.
The average individual income tax rate for the 44 cities levying the tax ranges from 1.6 percentat $25,000 income to 4.8 percent at $150,000 income. Overall, the individual income tax is quiteprogressive.
As Table 3 indicates, there are several types of individual income tax systems includinggraduated state and local rates, graduated state and flat local rates, flat state and local rates, state taxrates as a percent of federal income tax liability, graduated state tax rates and flat state rates withexemptions. The most common system is the graduated state tax rate, which applies to taxpayers in 27of the cities. Taxpayers of six cities are subject to a flat state tax rate with exemptions. Two cities arelocated in states that levy state taxes based on a percentage of federal tax liability. Income tax systemsthat utilize a percentage of the federal tax tend to be progressive because they are linked to the federaltax rate system, which is graduated within the income ranges used in the study.
Three of the larger cities in the study, Indianapolis, Indiana; Detroit, Michigan; and Philadelphia,Pennsylvania are subject to flat state and local tax rates. Five other cities levy local income taxes withflat rates to complement graduated rate income tax systems. Until tax year 1998, Baltimore,

Chapter III: Comparing Specific Tax Burdens For A Family Of Four In The Largest City In Each State
Tax Rates and Tax Burdens in the District of Columbia: A Nationwide Comparison
Page 20
Maryland’s local tax (piggyback) was a share of the state tax. However, starting in tax year 1999,Baltimore tax at a rate based on a net taxable income. New York City residents are subject to separatestate and local income taxes, both of which are characterized by graduated rate schedules.
Several of the state individual income tax systems are indexed. Indexing takes several formsand is used to keep individuals from being taxed at higher rates if their income rises less than the rate ofinflation. Thus, only the "real" income gain above the inflation rate is subject to higher tax rates. Thetable below summarizes the various indexing methods used by states:
States That Index Some Part ofTheir Individual Income Tax
State Indexed Portion Status
California Tax brackets, exemptions Active (credit), standard deduction
Idaho Tax brackets Active
Iowa Tax brackets, standard Active
deduction
Maine Tax brackets, exemptions Active standard deduction
Michigan Personal exemptions Active
Minnesota Tax brackets, exemptions Active and standard deduction
Montana Tax brackets, exemptions, Active standard deduction
North Dakota Tax brackets, exemptions, Active standard deduction
Oregon Tax brackets, exemptions Active Standard deduction
South Carolina Tax brackets Active
Utah Standard deduction, Active personal exemption
Wisconsin Tax Brackets, Standard Deduction Active

Chapter III: Comparing Specific Tax Burdens For A Family Of Four In The Largest City In Each State
Tax Rates and Tax Burdens in the District of Columbia: A Nationwide Comparison
Page 21
States that tax a percentage of federal net taxable income or a percentage of the federal liabilityimplicitly accept the federal indexing of tax brackets, exemptions and the standard deduction.
Table 1 indicates that the hypothetical families pay more in individual income taxes than anyother tax at the two top income levels. At $25,000, the individual income tax is the third, and at$50,000 and $75,000, the second most burdensome tax.
Real Property Tax
All 51 cities in the study levy a property tax on residential property located within the city. Thereal property tax is a function of housing values, real estate tax rates, assessment levels, homeownerexemptions and credits. Nominal rates used in table 4 (page 19), represent the "announced" rateslevied by the jurisdiction, while effective rates consider the various assessment levels in the cities. As thedata indicate, effective rates range from a high of $4.55 per $100 of assessed value in Bridgeport,Connecticut to 37 cents per $100 of assessed value in Honolulu, Hawaii. Assessment levels varydramatically from 4.0 percent of assessed value in Columbia, South Carolina to 100.0 percent at tendifferent cities. Local assessors and state tax officials provided the assessment level and nominal rateused in the cities.
The assumed housing values in the 51 cities at each of the five income levels are presented inTable 5, page 20. Housing values at the same income level vary a great deal. In addition, severaljurisdictions allow tax exemptions and credits in the calculations of the property tax. These exemptionsand credits are noted in Table 6 (page 21). The data in Table 5 are based on the 2000 U.S. Census ofPopulation.
The hypothetical family pays more in real property taxes than any other tax in the study at theincome levels $25,000, $50,000 and $75,000. It is the second highest tax paid at the $100,000 and$150,000 income levels. In Table 1, Bridgeport, Newark and Providence have the highest property taxburdens. This is due primarily to the high real estate tax rates in each of these cities.
Birmingham, Alabama has the lowest real estate tax burden at all income levels. This very lowreal estate tax burden results from a combination of a low effective real estate tax rate ($.70 per $100value), below average housing values and an exemption program.
Chapter III: Comparing Specific Tax Burdens For A Family Of Four In The Largest City In Each State
Tax Rates and Tax Burdens in the District of Columbia: A Nationwide Comparison
Page 22
TABLE 3
INCOME TAX BURDEN AS PERCENT OF INCOME IN THE LARGEST CITIES BY
TYPE OF INCOME TAX FOR A FAMILY OF FOUR
2001
INCOME LEVELS:
CITIES WITH: ST $25,000 $50,000 $75,000 $100,000 $150,000
GRADUATED STATE AND LOCAL TAX RATES
Baltimore MD 0.0% 4.8% 5.2% 5.5% 5.8%
New York City NY 2.3% 5.3% 6.8% 7.6% 8.6%
GRADUATED STATE AND FLAT LOCAL RATES
Birmingham AL 4.6% 4.5% 4.6% 4.5% 4.5%
Wilmington DE 2.3% 3.7% 4.4% 4.8% 5.3%
Louisville KY 5.3% 6.4% 6.6% 6.8% 7.0%
Kansas City MO 2.7% 4.1% 4.4% 4.6% 4.9%
Columbus OH 3.2% 4.6% 5.3% 5.9% 6.7%
FLAT STATE AND LOCAL TAX RATES
Indianapolis IN 3.1% 3.7% 3.9% 4.0% 4.1%
Detroit MI 3.9% 5.3% 5.8% 6.3% 6.5%
Philadelphia PA 4.5% 7.3% 7.0% 7.0% 7.0%
STATE TAX RATES AS A PERCENT OF FEDERAL LIABILITY
Fargo ND 0.5% 1.3% 1.5% 2.0% 2.4%
Burlington VT 0.0% 2.1% 2.5% 3.2% 4.0%
GRADUATED STATE TAX
Phoenix AZ 0.7% 1.7% 2.0% 2.3% 2.5%
Little Rock AR 1.9% 3.2% 4.0% 4.5% 5.0%
Los Angeles CA 0.0% 0.4% 2.2% 3.5% 4.9%
Bridgeport CT 0.0% 0.6% 3.0% 3.6% 4.1%
WASHINGTON DC 2.8% 5.6% 6.4% 6.8% 7.3%
Atlanta GA 1.7% 3.0% 3.6% 3.9% 4.2%
Honolulu HI 3.1% 4.4% 5.1% 5.5% 6.0%
Boise City ID 0.2% 3.5% 4.5% 5.0% 5.6%
Des Moines IA 1.8% 3.6% 4.4% 4.9% 5.6%
Wichita KS 0.8% 2.7% 3.6% 4.1% 4.6%
New Orleans LA 1.5% 2.5% 2.7% 2.7% 2.9%
Portland ME 0.2% 3.0% 4.3% 5.1% 5.8%
Minneapolis MN 0.0% 3.3% 4.1% 4.5% 5.1%
Jackson MS 0.6% 2.2% 2.9% 3.3% 3.6%
Billings MT 1.7% 3.5% 4.7% 5.6% 6.7%
Omaha NE 0.8% 2.5% 3.5% 4.1% 4.9%
Newark NJ 0.7% 1.2% 1.4% 1.8% 3.0%
Albuquerque NM 0.4% 2.2% 3.2% 3.9% 4.7%
Charlotte NC 1.9% 3.9% 4.7% 5.3% 5.7%
Oklahoma City OK 2.5% 3.7% 4.4% 4.7% 5.0%
Portland OR 3.6% 5.2% 6.1% 6.5% 6.9%
Providence RI 0.3% 2.9% 3.6% 4.1% 4.6%
Columbia SC 0.5% 3.4% 4.3% 4.7% 5.1%
Salt Lake City UT 1.5% 4.1% 4.6% 4.8% 5.0%
Virginia Beach VA 2.3% 3.6% 4.1% 4.3% 4.6%
Charleston WV 2.3% 3.4% 4.3% 4.9% 5.4%
Milwaukee WI 0.0% 3.3% 4.2% 4.6% 5.0%
FLAT STATE TAX RATE WITH EXEMPTIONS
Denver CO 0.0% 1.7% 2.3% 3.2% 3.4%
Chicago IL 1.5% 2.3% 2.4% 2.5% 2.6%
Boston MA 1.0% 3.7% 4.0% 4.3% 4.6%
Manchester NH 0.0% 0.0% 0.0% 0.0% 0.0%
Memphis TN 0.0% 0.0% 0.0% 0.0% 0.1%
No income tax: Anchorage, AK; Jacksonville, FL; Las Vegas, NV; Sioux Falls, SD: Houston, TX: Seattle, WA; Cheyenne, WY
AVERAGE 1/ 1.6% 3.3% 3.9% 4.3% 4.8%

Chapter III: Comparing Specific Tax Burdens For A Family Of Four In The Largest City In Each State
Tax Rates and Tax Burdens in the District of Columbia: A Nationwide Comparison
Page 23
1/ Based on cities actually levying tax.

Chapter III: Comparing Specific Tax Burdens For A Family Of Four In The Largest City In Each State
Tax Rates and Tax Burdens in the District of Columbia: A Nationwide Comparison
Page 24
TABLE 4RESIDENTIAL PROPERTY TAX RATES IN THE LARGEST CITY IN EACH STATE
2001NOMINAL EFFECTIVERATE 1/ ASSESSMENT RATE
RANK CITY ST PER $100 LEVEL 2/ PER $1001. Bridgeport, CT 6.50 70.0% 4.552. Des Moines, IA 4.44 90.0% 4.003. Providence, RI 3.59 100.0% 3.594. Newark, NJ 26.40 11.8% 3.125. Manchester, NH 3.07 100.0% 3.076. Milwaukee, WI 2.84 93.4% 2.657. Philadelphia, PA 8.26 32.0% 2.648. Houston, TX 2.62 100.0% 2.629. Portland, ME 2.40 100.0% 2.4010. Baltimore, MD 2.33 100.0% 2.3311. Detroit, MI 6.46 34.5% 2.2312. Fargo, ND 49.14 4.2% 2.0613. Burlington, VT 2.41 82.9% 2.0014. Jacksonville, FL 1.97 100.0% 1.9715. Omaha, NE 2.01 95.0% 1.9116. Chicago, IL 8.35 22.2% 1.8617. Phoenix, AZ 18.20 10.0% 1.8218. Memphis, TN 7.02 25.0% 1.7619. Atlanta, GA 4.30 40.0% 1.7220. New Orleans, LA 17.00 10.0% 1.7021. Jackson, MS 16.91 10.0% 1.6922. Boise City, ID 1.73 95.6% 1.6523. Anchorage, AK 1.80 90.8% 1.6324. Columbus, OH 5.19 30.6% 1.5925. Columbia, SC 37.93 4.0% 1.5226. Indianapolis, IN 10.00 15.0% 1.5027. Portland, OR 2.07 72.1% 1.5028. Sioux Falls, SD 1.73 85.0% 1.4729. Billings, MT 1.83 79.0% 1.4530. Salt Lake City, UT 1.46 99.0% 1.4431. Little Rock, AR 6.90 20.0% 1.3832. Wilmington, DE 2.38 54.8% 1.3133. Albuquerque, NM 3.76 33.3% 1.2534. Minneapolis, MN 1.37 86.4% 1.1835. Louisville, KY 1.17 100.0% 1.1736. Charlotte, NC 1.31 88.1% 1.1537. Kansas City, MO 6.00 19.0% 1.1438. Virginia Beach, VA 1.22 92.1% 1.1239. Oklahoma City, OK 10.10 11.0% 1.1140. Boston, MA 1.11 100.0% 1.1141. Los Angeles, CA 1.07 100.0% 1.0742. Wichita, KS 1.17 91.7% 1.0743. Seattle, WA 1.19 89.4% 1.0644. Las Vegas, NV 3.03 35.0% 1.0645. Charleston, WV 1.52 60.0% 0.9146. WASHINGTON, DC 0.96 89.8% 0.8647. New York City, NY 11.18 6.9% 0.7748. Cheyenne, WY 7.33 9.5% 0.7049. Birmingham, AL 6.95 10.0% 0.7050. Denver, CO 5.68 9.2% 0.5251. Honolulu, HI 0.37 100.0% 0.37
UNWEIGHTED AVERAGE $6.58 59.0% $1.69MEDIAN $1.50
NOTE: All rates and percentages in this table are rounded.1/ SOURCE: City Assessor.2/ SOURCE: City Assessor or State Board of Equalization.3/ Census Bureau estimated assessment level used.

Chapter III: Comparing Specific Tax Burdens For A Family Of Four In The Largest City In Each State
Tax Rates and Tax Burdens in the District of Columbia: A Nationwide Comparison
Page 25
TABLE 5FACTORS USED IN HOUSING VALUE ASSUMPTIONS
2001
MEDIAN HOUSING VALUE ASSUMPTIONS AT INDICATED INCOME LEVELS:
CITY ST
SINGLEFAMILY
HOUSINGVALUE 1/
MEDIANFAMILY
INCOME 2/
HOUSINGTO INCOME
RATIO 3/ $25,000 $50,000 $75,000 $100,000 $150,000
Honolulu, HI $386,700 $56,311 6.87 $180,265 $343,361 $515.041 $652,386 $927,075Los Angeles, CA 221,600 39,942 5.55 145,636 277,402 416,103 527,064 748,986New York City, NY 211,900 41,887 5.06 132,795 252,942 379,414 480,591 682,945Boston, MA 190,600 44,151 4.32 113,321 215,850 323,775 410,115 582,795Seattle, WA 259,600 62,195 4.17 109,567 208,698 313,048 396,527 563,486
Newark, NJ 119,000 30,781 3.87 101,483 193,301 289,952 367,272 521,913Atlanta, GA 130,600 37,231 3.51 92,081 175,391 263,087 333,244 473,557Denver, CO 165,800 48,195 3.44 90,305 172,010 258,014 326,818 464,426WASHINGTON, DC 157,200 46,283 3.40 89,158 169,825 254,737 322,667 458,527Salt Lake City, UT 153,300 45,140 3.40 89,148 169,805 254,708 322,630 458,474
Providence, RI 101,500 32,058 3.17 83,111 158,307 237,460 300,783 427,428Chicago, IL 132,400 42,724 3.10 81,348 154,948 232,422 294,401 418,360Portland, OR 154,900 50,271 3.08 80,884 154,065 231,097 292,723 415,975Bridgeport CT 117,500 39,571 2.97 77,945 148,467 222,701 282,088 400,862Burlington, VT 131,200 46,012 2.85 74,850 142,572 213,857 270,886 384,943
Albuquerque, NM 127,600 46,979 2.72 71,298 135,805 203,708 258,030 366,674Las Vegas, NV 137,300 50,465 2.72 71,418 136,035 204,052 258,466 367,294New Orleans, LA 87,300 32,338 2.70 70,865 134,981 202,471 256,463 364,447Anchorage, AK 160,700 63,682 2.52 66,241 126,174 189,261 239,730 340,669Portland, ME 121,200 48,763 2.49 65,244 124,275 186,412 236,122 335,541
Columbia, SC 98,500 39,589 2.49 65,312 124,403 186,605 236,366 335,889Phoenix, AZ 112,600 46,467 2.42 63,610 121,161 181,742 230,206 327,135Charlotte, NC 134,300 56,517 2.38 62,377 118,814 178,221 225,746 320,797Minneapolis, MN 113,500 48,602 2.34 61,301 116,765 175,147 221,853 315,265Boise City, ID 120,700 52,014 2.32 60,914 116,026 174,040 220,450 313,271
Virginia Beach, VA 123,200 53,242 2.31 60,742 115,698 173,547 219,826 312,385Manchester, NH 114,300 50,039 2.28 59,961 114,211 171,316 217,001 308,369Louisville, KY 82,300 36,696 2.24 58,872 112,138 168,206 213,061 302,771Billings, MT 99,900 45,032 2.22 58,234 110,921 166,382 210,750 299,487Wilmington, DE 89,100 40,241 2.21 58,122 110,708 166,062 210,345 298,912
Cheyenne, WY 102,400 46,771 2.19 57,472 109,470 164,204 207,992 295,568Columbus, OH 101,400 47,391 2.14 56,166 106,982 160,474 203,266 288,852Milwaukee, WI 80,400 37,879 2.12 55,717 106,127 159,191 201,642 286,544Charleston, WV 101,400 47,975 2.11 55,482 105,680 158,520 200,792 285,336Indianapolis, IN 98,500 48,979 2.01 52,790 100,553 150,830 191,051 271,494
Sioux Falls, SD 101,700 51,516 1.97 51,821 98,707 148,061 187,544 266,509Houston, TX 79,300 40,443 1.96 51,471 98,039 147,059 186,275 264,706Birmingham, AL 62,100 31,851 1.95 51,180 97,485 146,228 185,222 263,210Baltimore, MD 69,100 35,438 1.95 51,184 97,494 146,241 185,239 263,234Fargo, ND 98,700 50,486 1.95 51,319 97,750 146,625 185,725 263,925
Memphis, TN 72,800 37,767 1.93 50,600 96,380 144,571 183,123 260,227Little Rock, AR 89,300 47,446 1.88 49,406 94,107 141,160 178,803 254,089Detroit, MI 63,600 33,853 1.88 49,316 93,936 140,903 178,478 253,626Oklahoma City, OK 80,300 42,689 1.88 49,377 94,052 141,078 178,699 253,941Jacksonville, FL 87,800 47,243 1.86 48,785 92,924 139,386 176,555 250,894Omaha, NE 94,200 50,821 1.85 48,656 92,678 139,017 176,089 250,231
Kansas City, MO 84,000 46,012 1.83 47,922 91,281 136,921 173,433 246,457Jackson, MS 64,400 36,003 1.79 46,954 89,437 134,155 169,930 241,480Des Moines, IA 81,100 46,590 1.74 45,694 87,036 130,554 165,368 234,997Philadelphia, PA 59,700 37,036 1.61 42,314 80,597 120,896 153,135 217,613Wichita, KS 78,900 49,247 1.60 42,056 80,106 120,160 152,202 216,287
AVERAGE $119,753 $44,840 2.65 $69,649 $132,664 $198,997 $252,062 $358,194MEDIAN $101,700 $46,283 2.31 $60,742 $115,698 $173,547 $219,826 $312,385
1/ General Housing Characteristics, U.S. Summary, Bureau of the Census.2/ U.S. Census Bureau, Census 2000, Table DP-3, Profile of Selected Economic Characteristics: 2000.3/ Figures are rounded

Chapter III: Comparing Specific Tax Burdens For A Family Of Four In The Largest City In Each State
Tax Rates and Tax Burdens in the District of Columbia: A Nationwide Comparison
Page 26
TABLE 6CITIES WHICH ALLOW EXEMPTIONS OR REDUCED RATES
IN THE CALCULATION OF REAL ESTATE TAXES FOR HOMEOWNERS2001
CITY STATEEXEMPTION OR TAX
REDUCTION AMOUNTBASIS OF TAX REDUCTION
OR EXEMPTIONBirmingham, AL $4,000 Assessed Value-Homestead
Phoenix, AZ 35% Exemption on School Tax Rates up to $500
Assessed Value
Los Angeles, CA $7,000 Exemption Assessed Value
WASHINGTON, DC $30,000 Exemption Assessed Value-Homestead
Jacksonville, FL $25,000 Exemption Assessed Value 1/
Atlanta, GA $15,000 Exemption Assessed Value
Honolulu, HI $40,000 Exemption (below age 55)
Assessed Value
Boise City, ID 50% up to $50,000 Exemption Assessed Value-Improvements
Chicago, IL $4,500 Exemption Equalized Assessed Value
Indianapolis, IN 15% Credit and $2,000 Exemption
Assessed Value-Homestead
Wichita, KS $20,000 School Levy Exemption Assessed Value
Louisville, KY $26,800 Homestead Exemption Assessed Value
Des Moines, IA $4,850 Exemption Credit on 1 st $4,800 Taxable value
Assessed Value-Homestead
New Orleans, LA $7,500 Exemption Assessed Value
Boston, MA 20% Residential Exemption Assessed Value
Detroit, MI Homestead property exempt from Basic local school operating mileage
Taxable Value
Jackson, MS $300 Exemption Assessed Value
Billings, MT 27.5% Homestead exemption Market Value
Albuquerque, NM $2,000 Household Head Exemption, $2,000 Veteran exemption
Taxable Value
New York City, NY $30,000 Full Value-Residential School Property Taxes
Columbus, OH 12.5% Tax Rollback Assessed Value
Oklahoma City, OK $1,000 Exemption Assessed Value-Homestead
Providence, RI 35% Assessed Value
Columbia, SC 11.0% School district credit Property tax relief fund
Houston, TX 20% Exemption on Value
Plus $15,000 Exemption
20% Exemption
Assessed Value
-School District Only
-City and County Tax OnlySalt Lake City, UT 45% Residential Taxable Value
ExemptionMilwaukee, WI School Levy Credit:
$0.151 per $100 Market Value
Lottery Credit: School Tax on 1 st $7,600 Market Value
Tax Credit
Equalized Assessed Value
1/ Just value increases limited too lesser of change in CPI or 3%.

Chapter III: Comparing Specific Tax Burdens For A Family Of Four In The Largest City In Each State
Tax Rates and Tax Burdens in the District of Columbia: A Nationwide Comparison
Page 27
Given the assumptions used in this study, the real property tax burden is slightly regressive withan average percentage burden of 3.9 percent at $25,000 income and 3.6 percent at $150,000 income. Because of high exemptions or credits, the property tax in some cities is actually progressive despite theregressivity assumed in deriving housing values (see Chapter I). For example, in Washington, D.C., thepercentage property tax burden is 1.5 percent at $25,000 and 1.7 percent at the $150,000 incomelevel.
As mentioned earlier, housing value assumptions combined with flat rates make the property taxregressive overall, while flat amount exemptions and credits can, and in some cities do, alleviate theregressivity of the property tax.
Sales and Use Tax
Residents of 46 of the 51 cities in this study are subject to some form of a sales and use tax. The combined sales tax rates range from 9 percent in New Orleans to 4 percent in Honolulu asindicated in Table 7, page 23. The highest state sales tax rate is 7 percent in Rhode Island andMississippi, while the lowest state rate of 2 percent is found in Nevada. Sales taxes are levied by 20 ofthe 51 cities in addition to state sales taxes with the highest city rate at 4 percent in New York City. Ofthe twenty counties levying a sales tax, the highest rate (3.0 percent) is in Clark County (Las Vegas). Three school districts and 11 transit districts also levy sales taxes, with rates ranging from 0.25 percentto 2.25 percent.
The average sales tax burden is the second highest of the four major tax types at the $25,000income level, according to Table 1. It is third highest tax paid at the four other income levels. However, the sales tax burden is far below the levels of property and income taxes at the four highestincome levels. For cities subject to a sales tax, the highest burdens occur in Memphis, Tennessee;Phoenix, Arizona; and Oklahoma City, Oklahoma. The cities with a sales tax having the lowest burdensinclude Boston, Massachusetts; Virginia Beach, Virginia; and Portland, Maine.
Table 1 shows that the sales tax is proportional; the $25,000 income family pays an average 1.6percent for sales taxes, while the $150,000 family pays 1.6 percent.

Chapter III: Comparing Specific Tax Burdens For A Family Of Four In The Largest City In Each State
Tax Rates and Tax Burdens in the District of Columbia: A Nationwide Comparison
Page 28
TABLE 7STATE AND LOCAL GENERAL SALES TAX
RATES IN EACH OF THE 51 CITIESAS OF DECEMBER 31, 2001
CITY STTOTALRATE STATE CITY COUNTY SCHOOL TRANSIT
New Orleans, LA 9.0 4.0 3.5 1.5Seattle, WA 8.8 6.5 0.85 0.25 1.2Chicago, IL 8.75 6.25 1.0 0.75 0.75Oklahoma City, OK 8.375 4.5 3.875Los Angeles, CA 8.25 6.0 1.0 0.25 1.0
New York City, NY 8.25 4.0 4.0 0.25Memphis, TN 8.25 6.0 2.25Houston, TX 8.25 6.25 1.0 1.0Birmingham, AL 8.0 4.0 3.0 1.0Phoenix, AZ 8.0 5.6 1.8 0.7
Las Vegas, NV 7.5 2.0 3.0 2.25Denver, CO 7.2 2.9 3.5 0.8Kansas City, MO 7.1 4.225 1.5 0.875 0.5Jacksonville, FL 7.0 6.0 0.5 0.5Atlanta, GA 7.0 4.0 1.0 1.0 1.0
Minneapolis, MN 7.0 6.5 0.5Jackson, MS 7.0 7.0Charlotte, NC 7.0 4.5 2.5Philadelphia, PA 7.0 6.0 1.0Providence, RI 7.0 7.0
Fargo, ND 6.5 5.0 1.0 0.5Omaha, NE 6.5 5.0 1.5Salt Lake City, UT 6.45 4.75 1.0 0.45 0.25Little Rock, AR 6.125 4.625 0.5 1.0Bridgeport, CT 6.0 6.0
Louisville, KY 6.0 6.0Detroit, MI 6.0 6.0Newark, NJ 6.0 6.0Sioux Falls, SD 6.0 4.0 2.0Charleston, WV 6.0 6.0
Cheyenne, WY 6.0 4.0 2.0Wichita, KS 5.9 4.9 1.0Albuquerque, 1/ NM 5.8125 4.5 1.0625 0.25WASHINGTON, DC 5.75 5.75Columbus, OH 5.75 5.0 0.5 0.25
Milwaukee, WI 5.6 5.0 0.6 2/
Des Moines, IA 5.0 5.0Boise, ID 5.0 5.0Indianapolis, IN 5.0 5.0Boston, MA 5.0 5.0
Baltimore, MD 5.0 5.0Portland, ME 5.0 5.0Columbia, SC 5.0 5.0Burlington, VT 5.0 5.0Virginia Beach, VA 4.5 3.5 1.0Honolulu, HI 4.0 4.0
UNWEIGHTED AVERAGE 6.52MEDIAN 6.45Cities with no state general sales tax: Anchorage, AK; Billings, MT; Manchester, NH; Portland, OR; and Wilmington, DE.NOTE: Unweighted average and median include only those cities with a sales tax.1/ State rate = 5.0%. but 0.5% credit within municipal boundaries.2/ 0.5% for county tax and 0.1% for the Southeast Wisconsin Baseball Park District (new baseball stadium).

Chapter III: Comparing Specific Tax Burdens For A Family Of Four In The Largest City In Each State
Tax Rates and Tax Burdens in the District of Columbia: A Nationwide Comparison
Page 29
Automobile Taxes
Residents of all 51 cities in this study are subject to gasoline taxes and some type of automobileregistration fee or tax. The automobile taxes included in this study are gasoline taxes, motor vehicleregistration fees, excise taxes and personal property taxes. Fourteen of the cities levy a personalproperty tax based on the value of motor vehicles owned by a taxpayer. Gasoline tax rates in each ofthe 51 cities as of December 31, 2001 are compared in Table 8, page 25. The gasoline tax rates varyfrom as high as 33 cents per gallon in Las Vegas, Nevada to a low of 7.5 cents per gallon in Atlanta,Georgia and 8 cents per gallon in Anchorage, Alaska, and New York City, New York.
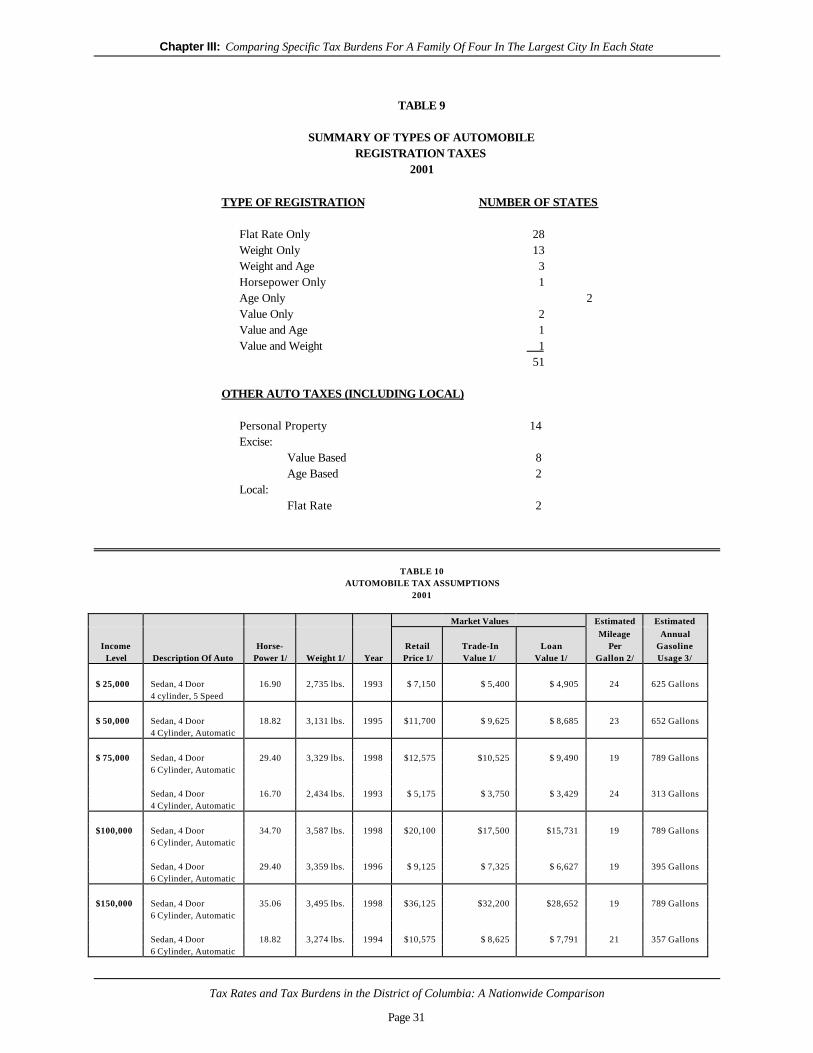
As noted before, citizens in all 51 cities are subject to some type of automobile registration fee. They are usually either flat per-vehicle rates or excise taxes based on value. The types of registrationand other automobile taxes to which residents of the 51 cities are subject are summarized in Table 9,page 26.
Fourteen cities levy personal property taxes on automobiles using various methods. Some citiesuse a combination of assessment levels and tax rates, which may or may not be the same as is used forother personal property or for real property. Others use the same assessment system and property taxrate for automobiles as they do for personal residences.
The assumptions used for calculating automobile personal property taxes, excise taxes, thegasoline tax and registration fees are presented in Table 10, page 26.
The lowest tax burdens at all income levels in this study are the automobile tax burdens.Providence, Rhode Island; Bridgeport, Connecticut; and Jackson, Mississippi are among the cities withhigh automobile tax burdens. These cities levy either a personal property tax or a very high excise tax.New York City, New York; Indianapolis, Indiana; and Anchorage, Alaska have consistently lowautomobile tax burdens. All of these cities have flat registration rates or registration by weight,moderate gasoline tax rates and no personal property or excise tax.
Automobile tax burdens in the 51 cities are regressive on the average as shown in Table 1. The$25,000 family pays 0.8 percent of income for automobile related taxes, while the $150,000 incomefamily pays an average of 0.4 percent. Since gasoline consumption does not necessarily increase at thesame rate as income, a flat tax rate on gasoline will not be progressive. Similarly, in a society whereownership of at least one automobile by a family is almost a necessity, any tax (excise or personalproperty) based on the value of vehicle ownership tends to be regressive.

Chapter III: Comparing Specific Tax Burdens For A Family Of Four In The Largest City In Each State
Tax Rates and Tax Burdens in the District of Columbia: A Nationwide Comparison
Page 30
TABLE 8GASOLINE TAX RATES IN THE 51 CITIES AS OF DECEMBER 31, 2001
(STATE AND LOCAL RATES)CITY ST TOTAL RATE STATE RATE LOCAL RATE
Las Vegas, NV 33.0 24.0 09.0Honolulu, HI 32.5 16.0 16.5Providence, RI 28.0 28.0 00.0Milwaukee, WI 27.3 27.3 00.0Billings, MT 27.0 27.0 00.0
Portland, OR 27.0 24.0 03.0Jacksonville, FL 26.6 15.5 11.1Philadelphia, PA 26.0 26.0 00.0Bridgeport, CT 25.0 25.0 00.0Boise, ID 25.0 25.0 00.0
Omaha, NE 24.5 24.5 00.0Salt Lake City, UT 24.5 24.5 00.0Charlotte, NC 24.1 24.1 00.0Chicago, IL 24.0 19.0 05.0Baltimore, MD 23.5 23.5 00.0
Wilmington, DE 23.0 23.0 00.0Seattle, WA 23.0 23.0 00.0Denver, CO 22.0 22.0 00.0Portland, ME 22.0 22.0 00.0Columbus, OH 22.0 22.0 00.0
Sioux Falls, SD 22.0 22.0 00.0Boston, MA 21.0 21.0 00.0Fargo, ND 21.0 21.0 00.0Little Rock, AR 20.5 20.5 00.0Charleston, WV 20.5 20.5 00.0
WASHINGTON, DC 20.0 20.0 00.0Des Moines, IA 20.0 20.0 00.0New Orleans, LA 20.0 20.0 00.0Minneapolis, MN 20.0 20.0 00.0Memphis, TN 20.0 20.0 00.0
Houston, TX 20.0 20.0 00.0Detroit, MI 19.0 19.0 00.0Burlington, VT 19.0 19.0 00.0Phoenix, AZ 18.0 18.0 00.0Los Angeles, CA 18.0 18.0 00.0
Wichita, KS 18.0 18.0 00.0Manchester, NH 18.0 18.0 00.0Jackson, MS 18.0 18.0 00.0Virginia Beach, VA 17.5 17.5 00.0Birmingham, AL 17.0 16.0 01.0
Kansas City, MO 17.0 17.0 00.0Albuquerque, NM 17.0 17.0 00.0Oklahoma City, OK 17.0 17.0 00.0Columbia, SC 16.0 16.0 00.0Indianapolis, IN 15.0 15.0 00.0
Louisville, KY 15.0 15.0 00.0Cheyenne, WY 11.0 11.0 00.0Newark, NJ 10.5 10.5 00.0New York City, NY 08.0 08.0 00.0Anchorage, AK 08.0 08.0 00.0Atlanta, GA 07.5 07.5 00.0
UNWEIGHTED AVERAGE 20.4MEDIAN 20.0
Chapter III: Comparing Specific Tax Burdens For A Family Of Four In The Largest City In Each State
Tax Rates and Tax Burdens in the District of Columbia: A Nationwide Comparison
Page 31
TABLE 9
SUMMARY OF TYPES OF AUTOMOBILEREGISTRATION TAXES
2001
TYPE OF REGISTRATION NUMBER OF STATES
Flat Rate Only 28Weight Only 13Weight and Age 3Horsepower Only 1Age Only 2Value Only 2Value and Age 1Value and Weight 1
51
OTHER AUTO TAXES (INCLUDING LOCAL)
Personal Property 14Excise:
Value Based 8Age Based 2
Local:Flat Rate 2
TABLE 10AUTOMOBILE TAX ASSUMPTIONS
2001
Market Values Estimated EstimatedMileage Annual
Income Horse- Retail Trade-In Loan Per GasolineLevel Description Of Auto Power 1/ Weight 1/ Year Price 1/ Value 1/ Value 1/ Gallon 2/ Usage 3/
$ 25,000 Sedan, 4 Door 16.90 2,735 lbs. 1993 $ 7,150 $ 5,400 $ 4,905 24 625 Gallons4 cylinder, 5 Speed
$ 50,000 Sedan, 4 Door 18.82 3,131 lbs. 1995 $11,700 $ 9,625 $ 8,685 23 652 Gallons4 Cylinder, Automatic
$ 75,000 Sedan, 4 Door 29.40 3,329 lbs. 1998 $12,575 $10,525 $ 9,490 19 789 Gallons6 Cylinder, Automatic
Sedan, 4 Door 16.70 2,434 lbs. 1993 $ 5,175 $ 3,750 $ 3,429 24 313 Gallons4 Cylinder, Automatic
$100,000 Sedan, 4 Door 34.70 3,587 lbs. 1998 $20,100 $17,500 $15,731 19 789 Gallons6 Cylinder, Automatic
Sedan, 4 Door 29.40 3,359 lbs. 1996 $ 9,125 $ 7,325 $ 6,627 19 395 Gallons6 Cylinder, Automatic
$150,000 Sedan, 4 Door 35.06 3,495 lbs. 1998 $36,125 $32,200 $28,652 19 789 Gallons6 Cylinder, Automatic
Sedan, 4 Door 18.82 3,274 lbs. 1994 $10,575 $ 8,625 $ 7,791 21 357 Gallons6 Cylinder, Automatic

Chapter III: Comparing Specific Tax Burdens For A Family Of Four In The Largest City In Each State
Tax Rates and Tax Burdens in the District of Columbia: A Nationwide Comparison
Page 32
1/ National Automobile Dealers Association Used Car Guide.2/ Gas Mileage Guide, EPA fuel economy estimates for city driving, U.S. Department of Energy.3/ Assumes 15,000 miles driven for all vehicles, except second cars, which are assumed to be driven 7,500 miles.driven 7,500 miles.

Chapter IV: How Do Tax Burdens In Washington, D.C., Compare With Those In The Largest City In Each State?
Tax Rates and Tax Burdens in the District of Columbia: A Nationwide Comparison
Page 33
CHAPTER IVHow Do Tax Burdens In
Washington, D.C., Compare WithThose In The Largest City In
Each State?
The nation's capital, Washington, D.C., is unique in many respects. It has a special status in whichthe day-to-day activities and functions of state, county, city and special districts are combined in onegovernmental unit. The Mayor and the 13-member District of Columbia Council combine the functionsof a state legislature, a county board of commissioners and a city council. Due to this combination ofresponsibilities, the District has the taxing powers of a state, a county and a municipality, although thesepowers are limited by actions of the federal government. The graduated income tax, the general salesand use tax and the per gallon gasoline tax are all comparable in form to those levied by most states. The property tax based on assessed value is similar to the type levied in cities and counties. As a result,the tax burden of District residents should be compared to that borne by residents of other large cities.
The burden of each of the four major taxes for Washington, D.C. is compared with the 51-cityaverage at all income levels in Table 11, page 30. The difference between the Washington, D.C., taxburden and the 51-city average increases, on a percentage basis, as the income level rises. This isbecause the District has a slightly more progressive tax system than the average of the 51 cities in thestudy. The District of Columbia ranks twenty-first at the $25,000 income level; Fifteenth at the$50,000 income level; fourteenth at the $75,000 and $100,000 income levels; and thirteenth at the$150,000 income level.
The District of Columbia has a relatively high percentage of low-income taxpayers, which limits theDistrict's revenue-raising capacity. Despite these limitations, the District of Columbia must perform andprovide funding for functions usually provided at both state and local levels of government. The non-municipal functions include responsibility for welfare programs, physical and mental health care, andmaintenance of the public education system.
Individual Income Tax
The individual income tax burden for Washington, D.C. is substantially above the average for the44 cities that levy an individual income tax at all income levels. Washington, D.C. levies an individualincome tax with three rates (for tax year 2002): 5 percent on the first $10,000 of taxable income; 7.0

Chapter IV: How Do Tax Burdens In Washington, D.C., Compare With Those In The Largest City In Each State?
Tax Rates and Tax Burdens in the District of Columbia: A Nationwide Comparison
Page 34
percent on the next $20,000 of taxable income; and 9.0 percent on taxable income over $30,000. Fortax year 2001 personal exemptions of $1,370 per dependent were allowed, as well as a $1,370exemption for the filer and spouse, respectively. A standard deduction of $2,000 ($1,000 for married-separate) was in effect for the period of this study. Itemized deductions are the same as those allowedin computing the federal income tax, but the District does not allow the deduction of its own individualincome tax. Washington, D.C. also has liberal "circuit-breaker" property tax relief programs for bothelderly and non-elderly qualified homeowners and renters, as well as a low-income credit, whicheliminates the District income tax for taxpayers with no federal income tax liability.
The individual income tax burden for Washington, D.C. is substantially above the average of the 51cities at the four income levels studied according to Table 11. The high income tax burden on thosesubject to the tax is due in part to restrictions on the individual income tax base of the District. TheCongress prohibits Washington, D.C. from taxing the earnings of non-residents working within the city,a restriction not imposed on any other city in the nation. As a result of this tax base restriction, theDistrict of Columbia is forced to tax its residents at higher rates than would otherwise be the case sinceapproximately 68 percent of the wages and salaries earned in the District of Columbia are earned bynon-residents.
Real Property Tax
Property tax burdens in the District of Columbia are below the 51-city average at all income levelsaccording to Table 11. A slightly higher than average housing-to-income ratio (Table 5) is offset by alow property tax rate (Table 4) combined with a $30,000 homestead deduction, which helps reduce theWashington, D.C., property tax burden.
The tax on residential property in the District of Columbia is based on the assessed value of theproperty. All property is assessed at a statutory level of 100 percent of its estimated market value. Since 1998, the District of Columbia has operated under a triennial assessment system. Properties inthe District are divided into three triennial groups (Tri-Groups) – each containing roughly one-third ofthe total taxable value of all real property in the District. Under the District’s triennial system onlyproperties in one Tri-Group have been reassessed each year. Increases in assessed value are phased-inover a three-year cycle. Reductions in assessed value are realized immediately in the effective tax year.
With the completion of reassessments for properties in Tri-Group 3 in FY 2000 for FY 2001billing, the District completed one full triennial cycle. Beginning in FY 2002, the District will transitionback to annual assessment. Property owners in all Tri-Groups, however, will receive the full benefit oftriennial assessment, as the reversion to annual assessment will be phased-in over a three-year period. In FY 2002, properties in Tri-Group 1 will return to annual assessment. This will be followed by areturn to annual assessment for properties in Tri-Group 2 in FY 2003, and properties in Tri-Group 3 inFY 2004 at which point all taxable property in the District will be assessed annually. The tax rate onresidential owner-occupied property in the District of Columbia was $0.96 per $100 for the period ofthis study. Washington, D.C. homeowners are allowed to deduct a homestead exemption of $30,000

Chapter IV: How Do Tax Burdens In Washington, D.C., Compare With Those In The Largest City In Each State?
Tax Rates and Tax Burdens in the District of Columbia: A Nationwide Comparison
Page 35
from the assessed base, not the tax bill before calculation of the property tax for all owner-occupieddwellings.
Despite the assumption of regressivity present in the housing value assumptions (Chapter I), thecomputed property tax for Washington, D.C., is slightly progressive because of the homesteaddeduction which reduces the property tax of each homeowner by $288 (at the $0.96 rate). The burdenis 1.9 percent at the $25,000 income level and 2.4 percent at $150,000 income.
Sales Tax
The District of Columbia levies a sales tax with five different rates. This rate structure is utilized, inpart, to take advantage of the District's special status as a tourist center and to increase the contributionof non-residents working in the city. These differential rates illustrate the concept of tax exporting. Thetable below details the sales tax rates in effect at the end of 2001.
Items Sales Tax RateTangible Personal Property 5.75%Alcohol for off premises consumption 8%Restaurant Meals, Take-Out Food, rental cars, Telephone calling cards 10%Commercial Parking 12%Hotel, Motel Rooms 14.5%
Items exempt from the District of Columbia sales tax include groceries and prescription drugs.
The sales tax burden in the District of Columbia is lower than the 51-City average at all the incomelevels.
Automobile Taxes
Washington, D.C. taxes gasoline and requires registration fees for automobile owners. Thegasoline tax rate is 20 cents per gallon. Registration fees of $55 on cars weighing less than 3,500pounds and $88 on cars equal to or greater than 3,500 pounds were in effect for the period of thisstudy. The District of Columbia does not impose an annual excise tax or personal property tax onautomobiles.
Washington, D.C., automobile tax burdens are below the 51-city average at all but the lowestincome level as shown in Table 11. High registration fees and a flat gasoline tax rate cause the Districtauto tax burden to be regressive. Washington, D.C., automobile tax burdens represent 0.9 percent ofincome at $25,000 and 0.3 percent at $150,000.

Chapter IV: How Do Tax Burdens In Washington, D.C., Compare With Those In The Largest City In Each State?
Tax Rates and Tax Burdens in the District of Columbia: A Nationwide Comparison
Page 36
Summary
As noted above, the tax burden of the District of Columbia is influenced by many factors. Oneof the major reasons District of Columbia tax burdens are above the average is the restriction on theDistrict's taxing authority mandated by Congress. Factors such as the prohibition on taxing non-residentincome, plus the large percentage of tax-exempt federal property (over fifty-six percent of Districtacreage is tax-exempt), have combined to create difficult conditions under which to raise revenues tooperate the city. Some of the positive factors, which tend to increase the District tax base, includesubstantial tourist activity as well as large volume of business and lobbying activity generated by thefederal presence.
TABLE 11
TAX BURDENS IN WASHINGTON, D.C. COMPARED WITH THE AVERAGE FOR
THE LARGEST CITY IN EACH STATE BY INCOME CLASS, 2001
DISTRICT AVERAGE
OF FOR CITIES PERCENT
COLUMBIA LEVYING TAX 1/ DIFFERENCE
$25,000 INCOME LEVEL
Income $ 690 $389 77.2%
Property 481 985 -51.2%
Sales 378 399 -5.4%
Auto 213 200 6.4%
TOTAL DC $1,761 51 CITY AVERAGE $1,881 -6.4%
$50,000 INCOME LEVEL
Income $2,784 $1,628 71.0%
Property 1,176 1,929 -39.0%
Sales 754 799 -5.6%
Auto 218 244 -10.6%
TOTAL DC $4,933 51 CITY AVERAGE $4,299 14.7%
$75,000 INCOME LEVEL
Income $4,774 $2,940 62.4%
Property 1,908 2,953 -35.4%
Sales 1,131 1,197 -5.5%
Auto 363 409 -11.1%
TOTAL DC $8,177 51 CITY AVERAGE $6,978 17.2%
$100,000 INCOME LEVEL
Income $6,838 $4,349 57.2%
Property 2,494 3,791 -34.2%
Sales 1,509 1,598 -5.6%

Chapter IV: How Do Tax Burdens In Washington, D.C., Compare With Those In The Largest City In Each State?
Tax Rates and Tax Burdens in the District of Columbia: A Nationwide Comparison
Page 37
Auto 380 523 -27.4%
TOTAL DC $11,220 51 CITY AVERAGE $9,507 18.0%
$150,000 INCOME LEVEL
Income $10,908 $7,208 51.3%
Property 3,665 5,462 -32.9%
Sales 2,263 2,394 -5.5%
Auto 380 667 -43.1%
TOTAL DC $17,215 51 CITY AVERAGE $14,507 18.7%
1/ Averages based on cities actually levying each tax. The total average is not presented because each jurisdiction may use only some of the taxes specified.

Chapter V: Why Do Tax Burdens Differ From One City To Another?
Tax Rates and Tax Burdens in the District of Columbia: A Nationwide Comparison
Page 38
CHAPTER VWhy Do Tax Burdens Differ From
One City To Another?
In the preceding chapters, the differences in tax burdens for the largest city in each state in theUnited States were discussed. The assumptions used to compute the various tax burdens will affect tosome extent the relative tax burdens for the 51 cities. This is especially true for the real estate tax,because both the methodology used to derive housing values and the relative housing values from oneincome level to another and from one city to another are important determinants of the real property taxburden. However, no matter what set of assumptions is used in such a study, there will be substantialtax burden differences from one city to another. Some of the reasons for these differences are asfollows:
1) This study only measures major state and local tax burdens for individuals. Businesstax burdens also differ substantially from one city to another. Many cities, becauseof a large manufacturing base or because of a dominant industry, can shift a largeportion of the tax burden away from individuals to businesses. Cities in naturalresource states, for example, may shift a substantial portion of the tax burden toindustry, thus exporting, to some extent, their local government tax burden. Convention and tourist activity in cities such as Chicago, Washington, D.C., NewYork City and Las Vegas can help reduce local tax burdens by increasing sales tax,gasoline tax and parking tax revenues from non-residents, another form of taxexporting.
2) Service demands in each of the 51 cities may vary a great deal. Cold weatherservices, such as snow removal, in northern cities may increase costs. Furthermore,citizens of some cities simply desire, or are accustomed to, more governmentservices than residents of other cities.
3) The costs of providing services may differ substantially from one city to another. Wage levels, efficiency of the work force and costs of overhead items, such asutilities, may be very different.
4) The tax base of each city is different. Cities that have a relatively large percentageof employed residents will normally have a broad tax base.

Chapter V: Why Do Tax Burdens Differ From One City To Another?
Tax Rates and Tax Burdens in the District of Columbia: A Nationwide Comparison
Page 39
This type of city can levy taxes at lower rates than can those with low levels ofemployment or high levels of exempt property. External forces such as the federalpresence in Washington, D.C. can restrict the tax base. The tax base can also bedefined by the scope of a particular tax. For example, it is desirable from a socialpoint of view to exempt groceries from the sales tax; however, such an exemptioncan narrow the sales tax base and may require a higher sales tax rate in order toraise sufficient revenues.
5) The proportion of public versus private services may differ from one city to another. Some cities may provide services such as garbage collection and hospital care,while in other cities, the private sector may perform these services for a fee.
As a result, a city in which the private sector performs such functions may have alower tax burden than one in which these functions are performed by the city. Inthese instances, the fees charged by the private sector represent payments byindividuals for public services that are not reflected in tax burdens.
6) Certain taxes that are not discussed in this study may affect state and local taxburdens. Taxes not covered by the study, which are levied on individuals, includeliquor and cigarette taxes and taxes on public utility bills.
7) The state and local tax burdens in this study are computed without regard to theireffect on the federal tax burden of individuals in the respective cities. To someextent, high state and local income and property taxes can be used to partiallyalleviate federal tax burdens through itemized deductions.
As noted in Chapter V, the number and kind of public services each city provides necessarilyhas a bearing on the amount of revenue that must be raised. The tax burden comparisons in this reportmust be studied in the context of these differing conditions.

Chapter V: Why Do Tax Burdens Differ From One City To Another?
Tax Rates and Tax Burdens in the District of Columbia: A Nationwide Comparison
Page 40
TABLE 12THE LARGEST CITY IN EACH STATE 1/
(2000 CENSUS OF POPULATION)
STATE CITY2000
POPULATION1990
POPULATIONPERCENT
DIFFERENCEAlabama Birmingham 242,820 265,968 -8.7%Alaska Anchorage 260,283 226,338 15.0%Arizona Phoenix 1,321,045 983,403 40.0%Arkansas Little Rock 183,133 175,795 4.2%California Los Angeles 3,694,820 3,485,398 6.0%
Colorado Denver 554,636 467,610 18.6%Connecticut Bridgeport 139,529 141,686 -1.5%Delaware Wilmington 72,664 71,529 1.6%Florida Jacksonville 735,617 672,971 9.3%Georgia Atlanta 416,474 394,017 5.7%
Hawaii Honolulu 371,657 377,059 -1.4%Idaho Boise 185,787 125,738 47.8%Illinois Chicago 2,896,016 2,783,726 4.0%Indiana Indianapolis 791,926 731,327 8.3%Iowa Des Moines 198,682 193,187 2.8%
Kansas Wichita 344,284 304,011 13.2%Kentucky Louisville 256,231 269,063 -4.8%Louisiana New Orleans 484,674 496,938 -2.5%Maine Portland 64,249 64,358 -0.2%Maryland Baltimore 651,154 736,014 -11.5%
Massachusetts Boston 589,141 574,283 2.6%Michigan Detroit 951,270 1,027,974 -7.5%Minnesota Minneapolis 382,618 368,383 3.9%Mississippi Jackson 184,256 196,637 -6.3%Missouri Kansas City 441,545 435,146 1.5%
Montana Billings 89,847 81,151 10.7%Nebraska Omaha 390,007 335,795 16.1%Nevada Las Vegas 478,434 258,295 85.2%New Hampshire Manchester 107,006 99,567 7.5%New Jersey Newark 273,546 275,221 -0.6%
New Mexico Albuquerque 448,607 384,736 16.6%New York New York City 8,008,278 7,322,564 9.4%North Carolina Charlotte 540,828 395,934 36.6%North Dakota Fargo 50,486 74,111 -31.9%Ohio Columbus 711,470 632,910 12.4%
Oklahoma Oklahoma City 506,132 444,719 13.8%Oregon Portland 529,121 437,319 21.0%Pennsylvania Philadelphia 1,517,550 1,585,577 -4.3%Rhode Island Providence 173,618 160,728 8.0%South Carolina Columbia 116,278 98,052 18.6%
South Dakota Sioux Falls 123,975 100,814 23.0%Tennessee Memphis 650,100 610,337 6.5%Texas Houston 1,953,631 1,630,553 19.8%Utah Salt Lake City 181,743 159,936 13.6%Vermont Burlington 38,889 39,127 -0.6%
Virginia Virginia Beach 425,257 393,069 8.2%Washington Seattle 563,374 516,259 9.1%West Virginia Charleston 53,421 57,287 -6.7%Wisconsin Milwaukee 596,974 628,088 -5.0%Wyoming Cheyenne 53,011 50,008 6.0%
WASHINGTON, DC 572,059 606,900 -5.7%1/ Source: U.S. Census Bureau, Census 2000. Table DP-1. Profile of General Demographic Characteristics: 2000.

Part II
A Comparison of SelectedTax Rates In The
District of ColumbiaWith Those In The 50 States
As of January 1, 2002

Part II: A Comparison of Selected Tax Rates In The District of Columbia With Those In The 50 States
Tax Rates and Tax Burdens in the District of Columbia: A Nationwide Comparison
Page 42
Overview
As can be seen from a review of the major taxes compared in this report, the tax rates in theDistrict of Columbia are among the highest in the nation. Of the 13 taxes compared, District taxcategories that are higher than in most of the states include: cigarette; corporate income; individualincome; deed recordation; motor vehicle excise; motor vehicle registration fees; and sales and use. In four tax categories -- insurance premiums, beer, dessert wine, and distilled spirits, -- the Districthas lower tax rates than most states. The District’s motor fuel tax rate is very close to average.
TABLE 13
COMPARISON OF SELECTED STATE TAX RATESNUMBER OF JURISDICTIONS
TAX LEVYING TAXLOWER
THAN DCSAMEAS DC
HIGHERTHAN DC
Beer 50 7 2 41
Cigarette 50 36 0 14
Corporate Income 44 42 0 2
Deed Recordation 36 36 0 0
Light Wine 46 6 2 38
Distilled Spirits 32 0 1 31
Individual Income 421/
392/
0 32/
Insurance 49 4 0 45
Motor Fuel 50 22 6 22
Motor Vehicle Excise Light Cars < 3,500 lbs. 47 32 9 6
Heavy Cars > 3,500 lbs. 47 46 1 0
Motor Vehicle Registration 3/ 49 46 0 3
Sales and Use 45 30 0 15
1/ Includes two states, which tax dividends and/or interest only.2/ Comparisons are based on highest comparable rate in each jurisdiction. Those based on federal liability are not included.3/ Heavy cars (> 3,500 lbs.)

Part II: A Comparison of Selected Tax Rates In The District of Columbia With Those In The 50 States
Tax Rates and Tax Burdens in the District of Columbia: A Nationwide Comparison
Page 43
TABLE 14INDIVIDUAL INCOME TAX
WASHINGTON METROPOLITAN AREAJANUARY 1, 2002
PERSONAL EXEMPTIONS (CREDITS)TAXABLEINCOME RATES
DISTRICT OF COLUMBIA
Single $1,370
Married Filing Separately $1,370
Married Filing Jointly $2,740
Head of Household $2,740
Dependent (additional) $1,370
Blind (additional) $1,370
Age 65 and over (additional) $1,370
Standard 1/
$0 - $10,000$10,000-$30,000
Over $30,000
5.0%$ 500 + 7.5% of excess > $10,000$2,000 + 9.3% of excess > $30,000
MARYLAND 2/
Single $2,100
Married Filing Separately $2,100
Married Filing Jointly $4,200
Head of Household $2,100
Dependent (additional) $2,100
Blind (additional) $1,000
Age 65 and over (additional) $1,000
Standard 3/
$0 - $1,000$1,001-$2,000$2,001-$3,000Over $3,000
2.0%$20 + 3.00% of excess > $1,000$50 + 4.00% of excess > $2,000$90 + 4.80% of excess > $3,000
VIRGINIA
Single $ 800
Married Filing Separately $ 800
Married Filing Jointly $1,600
Head of Household $ 800
Dependent (additional) $ 800
Blind (additional) $ 800
Age 65 and over (additional) $ 800
Standard 4/
$0 - $3,000$3,001-$5,000$5,001-$17,000Over $17,000
2.0%$ 60 + 3.00% of excess > $ 3,000$ 120 + 5.00% of excess > $ 5,000$ 720 + 5.75% of excess > $17,000
1/ Married persons filing separately - $1,000; all others - $2,000.2/ Maryland rates do not include local rates of which may be as much as 3.08%.3/ 15% of Maryland AGI not to exceed $2,000 ($4,000 for joint and head of household returns and those filing as qualifying widow(er) with dependent child). The minimum is $1,500 for single, married filing separately and dependent taxpayers. All others are allowed a minimum of $3,000.4/ Single - $3,000; married persons filing separately - $2,500; and married persons filing jointly or combined separate - $5,000.

Part II: A Comparison of Selected Tax Rates In The District of Columbia With Those In The 50 States
Tax Rates and Tax Burdens in the District of Columbia: A Nationwide Comparison
Page 44
TABLE 15INDIVIDUAL INCOME TAX
43 STATES AND DISTRICT OF COLUMBIAAS OF JANUARY 1, 2002
PERSONAL EXEMPTIONS (CREDITS)RATES AND TAXABLEINCOME BRACKETS
MINIMUM MAXIMUM
SINGLE M/J DEPENDENTS RATE UP TO RATE OVERALABAMA 1/
$1,500 $3,000 $300 S,HH,MM/J
2.0%2.0%
$ 5001,000
5.0%5.0%
$ 3,0006,000
ARIZONA 2/3/
$2,100 $4,200 $2,300 S,M/SM/J,HH
2.87%2.87%
$ 10,00020,000
5.04%5.04%
$150,000300,000
ARKANSAS($20) ($40) ($20) 1.0% $ 2,999 7.0% $ 25,000
CALIFORNIA($79) ($158) ($247) S,M/S
HHM/J
1.0%1.0%1.0%
$ 5,74811,50011,496
9.3%9.3%9.3%
$ 37,72551,35075,450
COLORADO4.63% of federal taxable income with certain modifications.
CONNECTICUT 4/
$12,500 $24,000 --- S,M/SHHM/J
3.0%3.0%3.0%
$ 10,00016,00020,000
4.5%4.5%4.5%
$ 10,00016,00020,000
DELAWARE($110) ($220) ($110) 2.2% $ 5,000 5.95% $ 60,000
DISTRICT OF COLUMBIA$1,370 $2,740 $1,370 5.0% $ 10,000 9.5% $ 20,000
GEORGIA$2,700 $5,400 $2,700 M/S
SHH,M/J
1.0%1.0%1.0%
$ 500750
1,000
6.0%6.0%6.0%
$ 5,0007,000
10,000HAWAII
$1,040 $2,080 $1,040 M/S,SHH
SS,M/J
1.5%1.5%1.5%
$ 2,0003,0004,000
8.50%8.50%8.50%
$ 40,00060,00080,000

Part II: A Comparison of Selected Tax Rates In The District of Columbia With Those In The 50 States
Tax Rates and Tax Burdens in the District of Columbia: A Nationwide Comparison
Page 45
1/ Does not include various local income taxes.2/ If married filing joint with at least one dependent, exemption = $6,300.3/ If M/S, S and FAGI do not exceed $10,000 and if M/J, HH income limitation up to $31,000, based on the number of dependents. Limit of credit for M/J, HH is $240 and for M/S, S is $120, exemption for M/J = $80; and dependents = $40.4/ Head of Household personal exemption is $19,000.
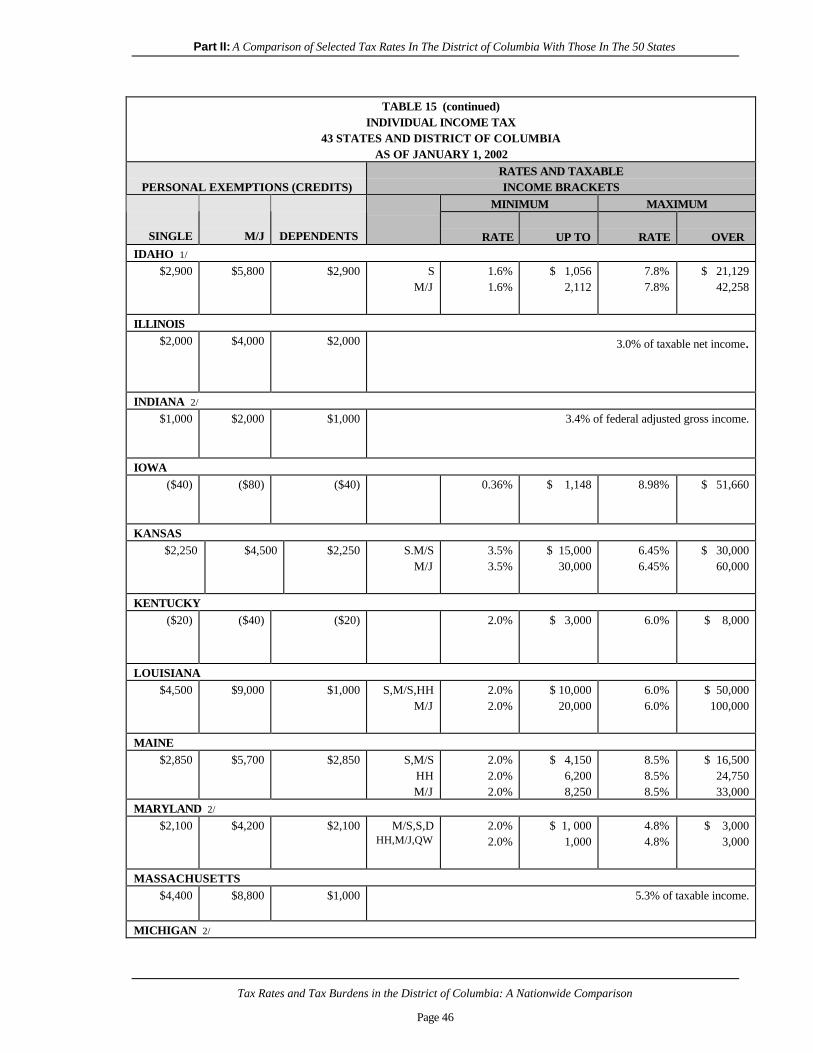
Part II: A Comparison of Selected Tax Rates In The District of Columbia With Those In The 50 States
Tax Rates and Tax Burdens in the District of Columbia: A Nationwide Comparison
Page 46
TABLE 15 (continued)INDIVIDUAL INCOME TAX
43 STATES AND DISTRICT OF COLUMBIAAS OF JANUARY 1, 2002
PERSONAL EXEMPTIONS (CREDITS)RATES AND TAXABLEINCOME BRACKETS
MINIMUM MAXIMUM
SINGLE M/J DEPENDENTS RATE UP TO RATE OVERIDAHO 1/
$2,900 $5,800 $2,900 SM/J
1.6%1.6%
$ 1,0562,112
7.8%7.8%
$ 21,12942,258
ILLINOIS$2,000 $4,000 $2,000 3.0% of taxable net income.
INDIANA 2/
$1,000 $2,000 $1,000 3.4% of federal adjusted gross income.
IOWA($40) ($80) ($40) 0.36% $ 1,148 8.98% $ 51,660
KANSAS$2,250 $4,500 $2,250 S.M/S
M/J3.5%3.5%
$ 15,00030,000
6.45%6.45%
$ 30,00060,000
KENTUCKY($20) ($40) ($20) 2.0% $ 3,000 6.0% $ 8,000
LOUISIANA$4,500 $9,000 $1,000 S,M/S,HH
M/J2.0%2.0%
$ 10,00020,000
6.0%6.0%
$ 50,000100,000
MAINE$2,850 $5,700 $2,850 S,M/S
HHM/J
2.0%2.0%2.0%
$ 4,1506,2008,250
8.5%8.5%8.5%
$ 16,50024,75033,000
MARYLAND 2/
$2,100 $4,200 $2,100 M/S,S,DHH,M/J,QW
2.0%2.0%
$ 1, 0001,000
4.8%4.8%
$ 3,0003,000
MASSACHUSETTS$4,400 $8,800 $1,000 5.3% of taxable income.
MICHIGAN 2/

Part II: A Comparison of Selected Tax Rates In The District of Columbia With Those In The 50 States
Tax Rates and Tax Burdens in the District of Columbia: A Nationwide Comparison
Page 47
$2,900 $5,800 $2,900 4.2% of federal adjusted gross income.
1/ Does not include filing fee of $10.2/ Does not include various local income taxes.

Part II: A Comparison of Selected Tax Rates In The District of Columbia With Those In The 50 States
Tax Rates and Tax Burdens in the District of Columbia: A Nationwide Comparison
Page 48
TABLE 15 (continued)INDIVIDUAL INCOME TAX
43 STATES AND DISTRICT OF COLUMBIAAS OF JANUARY 1, 2002
PERSONAL EXEMPTIONS (CREDITS)RATES AND TAXABLEINCOME BRACKETS
MINIMUM MAXIMUM
SINGLE M/J DEPENDENTS RATE UP TO RATE OVERMINNESOTA
$2,900 $5,800 $2,900 M/SS
HHM/J
5.35%5.35%5.35%5.35%
$ 13,24018,12022,30026,480
7.85%7.85%7.85%7.85%
$ 52,60059,50089,610
105,200MISSISSIPPI
$6,000 $12,000 $1,500 3.0% $ 10,000 5.0% $ 10,000
MISSOURI 1/
$2,100 $4,200 $1,200 1.5% $ 1,000 6.0% $ 9,000
MONTANA$1,720 $3,440 $1,720 2.0% $ 2,200 11.0% $ 75,400
NEBRASKA($94) ($188) ($94) S.M/S
M/J,HH2.51%2.51%
$ 2,4004,000
6.68%6.68%
$ 26,50046,750
NEW HAMPSHIRE$2,400 $4,800 --- 5.0% on dividend and interest income over personal exemption.
NEW JERSEY$1,000 $2,000 $1,500 S,M/S
HH,M/J1.4%1.4%
$ 20,00020,000
6.37%6.37%
$ 75,001150,001
NEW MEXICO$2,800 $5,600 $2,800 M/S
SHHM/J
1.7%1.7%1.7%1.7%
$ 4,0005,5007,0008,000
8.2%8.2%8.2%8.2%
$ 50,00065,00083,000
100,000NEW YORK
--- --- $1,000 M/S,SHHM/J
4.0%4.0%4.0%
$ 8, 00011,00016,000
6.85%6.85%6.85%
$ 20,00030,00040,000
NORTH CAROLINA 2/
$2,500 $5,000 $2,500 M/SS
HHM/J,SS
6.0%6.0%6.0%6.0%
$ 10,62512,75017,00021,250
8.25%8.25%8.25%8.25%
$ 100,000120,000160,000200,000

Part II: A Comparison of Selected Tax Rates In The District of Columbia With Those In The 50 States
Tax Rates and Tax Burdens in the District of Columbia: A Nationwide Comparison
Page 49
NORTH DAKOTA$2,900 $5,800 $2,900 M/S
SHH
M/J,SS
2.1%2.1%2.1%2.1%
$ 22,60027,05036,25045,200
5.54%5.54%5.54%5.54%
$ 148,675297,350297,350297,350
1/ Does not include various local income taxes.2/ A taxpayer whose Federal AGI is >= the threshold amounts shown is allowed a personal exemption of $2,000 and $2,000 for each dependent.

Part II: A Comparison of Selected Tax Rates In The District of Columbia With Those In The 50 States
Tax Rates and Tax Burdens in the District of Columbia: A Nationwide Comparison
Page 50
TABLE 15 (continued)INDIVIDUAL INCOME TAX
43 STATES AND DISTRICT OF COLUMBIAAS OF JANUARY 1, 2002
PERSONAL EXEMPTIONS (CREDITS)RATES AND TAXABLEINCOME BRACKETS
MINIMUM MAXIMUM
SINGLE M/J DEPENDENTS RATE UP TO RATE OVEROHIO 1/
$1,150($20)
$2,300($40)
$1,150($20)
0.743% $ 5,000 7.5% $200,000
OKLAHOMA Without federal deduction
$1,000 $2,000 $1,000 S,M/SSS,HH,M/J
0.5%0.5%
$ 1,0002,000
6.75%6.75%
$ 10,00021,000
With federal deduction$1,000 $2,000 $1,000 S,M/S
SS,HH,M/J0.5%0.5%
$ 1,0002,000
10.0%10.0%
$ 16,00024,000
OREGON 1/
($142) ($284) ($142) S,M/SHH,M/J
5.0%5.0%
$ 2,5005,000
9.0%9.0%
$ 6,25012,500
PENNSYLVANIA 1/
--- --- --- 2.8% of specified classes of taxable income is effective rate.
RHODE ISLAND--- --- --- M/S
SHHM/J
3.8%3.8%3.8%3.8%
$ 8641,0351,3871,729
10.098%10.098%10.098%10.098%
$ 148,675297,350297,350297,350
SOUTH CAROLINA$2,750 $5,500 $2,750
2/2.5% $ 2,340 7.0% $ 11,700
TENNESSEE$1,250 $2,500 --- 6.0% on interest and dividend income.
UTAH$2,100 $4,200 $2,100 M/S,S
HH,M/J2.3%2.3%
$ 8631,726
7.0%7.0%
$ 4,3138,626
VERMONT--- --- --- 24% of federal income tax liability.
VIRGINIA$800 $1,600 $800 2.0% $ 3,000 5.75% $ 17,000
WEST VIRGINIA
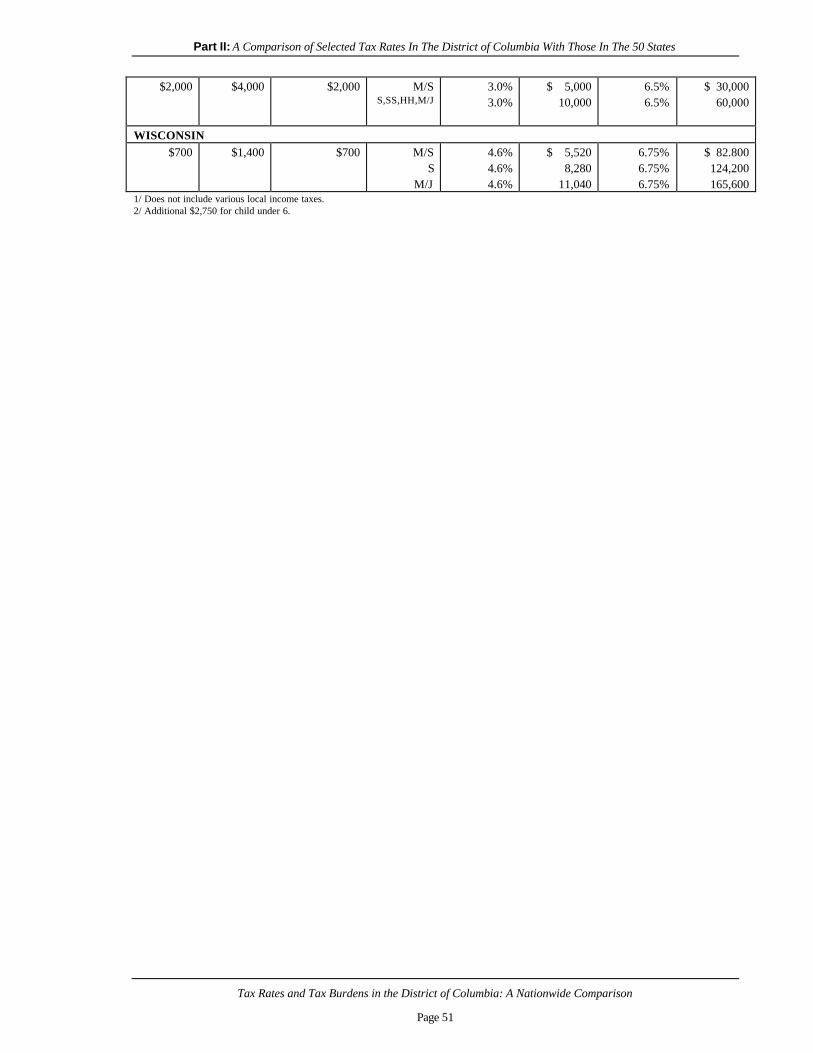
Part II: A Comparison of Selected Tax Rates In The District of Columbia With Those In The 50 States
Tax Rates and Tax Burdens in the District of Columbia: A Nationwide Comparison
Page 51
$2,000 $4,000 $2,000 M/SS,SS,HH,M/J
3.0%3.0%
$ 5,00010,000
6.5%6.5%
$ 30,00060,000
WISCONSIN$700 $1,400 $700 M/S
SM/J
4.6%4.6%4.6%
$ 5,5208,280
11,040
6.75%6.75%6.75%
$ 82.800124,200165,600
1/ Does not include various local income taxes.2/ Additional $2,750 for child under 6.

Part II: A Comparison of Selected Tax Rates In The District of Columbia With Those In The 50 States
Tax Rates and Tax Burdens in the District of Columbia: A Nationwide Comparison
Page 52
TABLE 16
CHARACTERISTICS OF STATE INDIVIDUAL INCOME TAXES
JURISDICTION
FEDERALINCOME TAXDEDUCTIBLE
NO INCOMETAX
WITH-HOLDING
FEDERALDEFINITIONOF INCOMEFOR STATETAX BASE
STATEDEFINITIONOF INCOMEFOR STATETAX BASE
FEDERALTAX
LIABILITYFOR STATETAX BASE
ALABAMA AL AL AL
ALASKA AK
ARIZONA AZ AZ
ARKANSAS AR AR
CALIFORNIA CA CA
COLORADO CO CO
CONNECTICUT CT CT
DELAWARE DE DE
DISTRICT OFCOLUMBIA DC DCFLORIDA FL
GEORGIA GA GA
HAWAII HI HI
IDAHO ID ID
ILLINOIS IL IL
INDIANA IN IN
IOWA IA IA IA
KANSAS KS KS
KENTUCKY KY KY
LOUISIANA LA LA LA
MAINE ME ME
MARYLAND MD MD
MASSACHUSETTS MA MA
MICHIGAN MI MI
MINNESOTA MN MN
MISSISSIPPI MS MS
MISSOURI MO MO MO

Part II: A Comparison of Selected Tax Rates In The District of Columbia With Those In The 50 States
Tax Rates and Tax Burdens in the District of Columbia: A Nationwide Comparison
Page 53
TABLE 16 (continued)
CHARACTERISTICS OF STATE INDIVIDUAL INCOME TAXES
JURISDICTION
FEDERALINCOME TAXDEDUCTIBLE
NO INCOMETAX
WITH-HOLDING
FEDERALDEFINITIONOF INCOMEFOR STATETAX BASE
STATEDEFINITIONOF INCOMEFOR STATETAX BASE
FEDERALTAX
LIABILITYFOR STATETAX BASE
MONTANA MT MT MT
NEBRASKA NE NE
NEVADA NV
NEW HAMPSHIRE 1/ NH
NEW JERSEY NJ NJ
NEW MEXICO NM NM
NEW YORK NY NY
NORTH CAROLINA NC NC
NORTH DAKOTA ND ND
OHIO OH OH
OKLAHOMA 2/ OK OK OK
OREGON 3/ OR OR OR
PENNSYLVANIA PA PA
RHODE ISLAND RI RI
SOUTH CAROLINA SC SC
SOUTH DAKOTA SD
TENNESSEE TN
TEXAS TX
UTAH 3/ UT UT UT
VERMONT VT
VIRGINIA VA VA
WASHINGTON WA
WEST VIRGINIA WV WV
WISCONSIN WI WI
WYOMING WY
1/ Tax only on interest and dividends.2/ Method 2 only.3/ Federal deductibility is limited.

Part II: A Comparison of Selected Tax Rates In The District of Columbia With Those In The 50 States
Tax Rates and Tax Burdens in the District of Columbia: A Nationwide Comparison
Page 54
TABLE 17
STATE CORPORATION INCOME TAX RATES
(Maximum Rates)
DISTRICT OF COLUMBIA: 9.975%
LOWER THAN THE DISTRICT42 STATES
ColoradoMississippiSouth CarolinaUtahFlorida
GeorgiaOklahomaTennesseeVIRGINIAMissouri
HawaiiAlabamaArkansasOregonMontana
North DakotaNorth CarolinaArizonaMARYLANDIllinois
Kansas
4.63%5.00%5.00%5.00%5.50%
6.00%6.00%6.00%6.00%6.25%
6.40%6.50%6.50%6.60%6.75%
6.83%6.90%6.96%7.00%7.30%
7.35%
ConnecticutNew YorkIdahoNew MexicoNebraska
IndianaWisconsinLouisianaKentuckyNew Hampshire
OhioDelawareCaliforniaMaineNew Jersey 1/
Rhode IslandWest VirginiaAlaskaMassachusettsVermont
Minnesota
7.50%7.50%7.60%7.60%7.81%
7.90%7.90%8.00%8.25%8.50%
8.50%8.70%8.84%8.93%9.00%
9.00%9.00%9.40%9.50%9.75%
9.80%
HIGHER THAN THE DISTRICT2 STATES
Pennsylvania 9.99% Iowa 12.00%
NO TAX6 STATES
Michigan (Single Business Tax)NevadaSouth Dakota
TexasWashington (Gross Receipts Tax)
Wyoming
1/ The rate is 7.5% for corporations with net income of $50,000 or less.

Part II: A Comparison of Selected Tax Rates In The District of Columbia With Those In The 50 States
Tax Rates and Tax Burdens in the District of Columbia: A Nationwide Comparison
Page 55
TABLE 18STATE GROSS PREMIUMS TAX RATES ON FOREIGN LIFE INSURERS
DISTRICT OF COLUMBIA: 1.7%
LOWER THAN THE DISTRICT5 STATES
New YorkSouth CarolinaNebraska
0.70%0.75%1.00%
MichiganOhio
1.29%1.62%
HIGHER THAN THE DISTRICT44 STATES
ConnecticutFloridaTennesseeTexasNorth Carolina 1/
ArizonaColoradoDelawareIndianaIowa
KansasKentuckyMaineMARYLANDMassachusetts
MinnesotaMissouriNew HampshireNorth DakotaPennsylvania
Rhode IslandVermont
1.75%1.75%1.75%1.75%1.90%
2.00%2.00%2.00%2.00%2.00%
2.00%2.00%2.00%2.00%2.00%
2.00%2.00%2.00%2.00%2.00%
2.00%2.00%
WashingtonWisconsinNew JerseyGeorgiaLouisiana 2/
OklahomaUtahVIRGINIAAlabamaCalifornia
ArkansasSouth DakotaWyomingAlaskaHawaii
MontanaIdahoMississippiNew MexicoWest Virginia
NevadaIllinois 4/
2.00%2.00%2.10%2.25%2.25%
2.25%2.25%2.25%2.30%2.35%
2.50%2.50%2.50%2.70%2.75%
2.75%3.00%3.00%3.00%3.00% 3/
3.50%4.00%
NO TAX1 STATE
Oregon
1/ An additional 6.5% insurance regulatory charge applied to premium tax liability. An additional 1.33% premium tax for fire related insurance policies.2/ Maximum rate.3/ An additional 1% premium tax for fire and casualty insurance. There is also a surcharge on fire and casualty insurance policyholders that is equal to 1% of the gross direct premium paid on each policy.4/ An additional 1% premium tax for fire or fire related insurance policies.

Part II: A Comparison of Selected Tax Rates In The District of Columbia With Those In The 50 States
Tax Rates and Tax Burdens in the District of Columbia: A Nationwide Comparison
Page 56
TABLE 19
STATE GENERAL SALES AND USE TAX RATES
DISTRICT OF COLUMBIA: 5.75%
LOWER THAN THE DISTRICT30 STATES
Nevada (4.5)Colorado (6.0%)VIRGINIA (1%)Alabama (4.5%)Georgia (3%)
HawaiiLouisiana (5%)New York (4.25%)South Dakota (2%)Wyoming (1%)
Missouri (5.3125%)Arkansas (4.625%)North Carolina (2.0%)Oklahoma (6%)Utah (1.85%)
2.00%2.90%3.50%4.00%4.00%
4.00%4.00%4.00%4.00%4.00%
4.225%4.50%4.50%4.50%4.75%
Kansas (2%)ArizonaIdahoIndianaIowa (1%)
MaineMARYLANDMassachusettsNebraska (2.6875%)New Mexico 1/
North Dakota (2.0%)Ohio (0-3%)South CarolinaVermontWisconsin (.6%)
4.90%5.00%5.00%5.00%5.00%
5.00%5.00%5.00%5.00%5.00%
5.00%5.00%5.00%5.00%5.00%
HIGHER THAN THE DISTRICT15 STATES
California (2.50%)ConnecticutFloridaKentuckyMichigan
New JerseyPennsylvania (1%)Tennessee (2.75%)
6.00%6.00%6.00%6.00%6.00%
6.00%6.00%6.00%
West VirginiaIllinois (3%)Texas (2%)Minnesota (1%)Washington (2.3%)
MississippiRhode Island
6.00%6.25%6.25%6.50%6.50%
7.00%7.00%
NO TAX5 STATES
AlaskaDelawareMontanaNew HampshireOregon
1/ .5% credit within municipal boundaries => 4.5% state rate within municipalities.
Note: Maximum local rates in parentheses
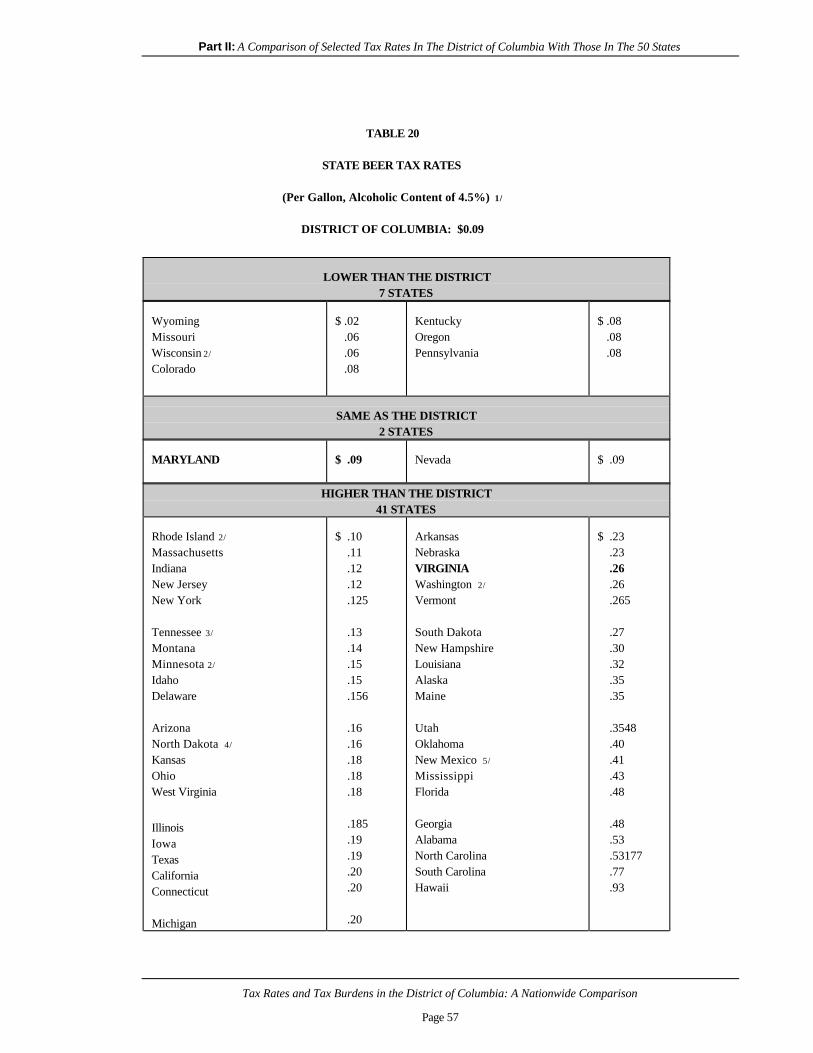
Part II: A Comparison of Selected Tax Rates In The District of Columbia With Those In The 50 States
Tax Rates and Tax Burdens in the District of Columbia: A Nationwide Comparison
Page 57
TABLE 20
STATE BEER TAX RATES
(Per Gallon, Alcoholic Content of 4.5%) 1/
DISTRICT OF COLUMBIA: $0.09
LOWER THAN THE DISTRICT7 STATES
WyomingMissouriWisconsin 2/
Colorado
$ .02 .06 .06 .08
KentuckyOregonPennsylvania
$ .08 .08 .08
SAME AS THE DISTRICT2 STATES
MARYLAND $ .09 Nevada $ .09
HIGHER THAN THE DISTRICT41 STATES
Rhode Island 2/
MassachusettsIndianaNew JerseyNew York
Tennessee 3/
MontanaMinnesota 2/
IdahoDelaware
ArizonaNorth Dakota 4/
KansasOhioWest Virginia
IllinoisIowaTexasCaliforniaConnecticut
Michigan
$ .10 .11 .12 .12 .125
.13 .14 .15 .15 .156
.16 .16 .18 .18 .18
.185 .19 .19 .20 .20
.20
ArkansasNebraskaVIRGINIAWashington 2/
Vermont
South DakotaNew HampshireLouisianaAlaskaMaine
UtahOklahomaNew Mexico 5/
MississippiFlorida
GeorgiaAlabamaNorth CarolinaSouth CarolinaHawaii
$ .23 .23 .26 .26 .265
.27 .30 .32 .35 .35
.3548 .40 .41 .43 .48 .48 .53 .53177 .77 .93

Part II: A Comparison of Selected Tax Rates In The District of Columbia With Those In The 50 States
Tax Rates and Tax Burdens in the District of Columbia: A Nationwide Comparison
Page 58
1/ Rates per 31-gallon barrel have been converted to rates per gallon. In some cases this required rounding of the per gallon rate.2/ Credit allowed to small brewers.3/ Additional tax of 17% of wholesale price.4/ $.08 per gallon for bulk beer.5/ Rate is $.08 per gallon for microbrewer.

Part II: A Comparison of Selected Tax Rates In The District of Columbia With Those In The 50 States
Tax Rates and Tax Burdens in the District of Columbia: A Nationwide Comparison
Page 59
TABLE 21
STATE LIGHT WINE TAX RATES(Per Gallon, Alcoholic Content of 12%)
DISTRICT OF COLUMBIA: $0.30
MONOPOLY STATES4 STATES
New HampshirePennsylvania
Utah 1/
Wyoming
LOWER THAN THE DISTRICT6 STATES
LouisianaNew YorkCalifornia
$ .11 .19 .20
TexasWisconsinColorado
$ .20 .25 .28
SAME AS THE DISTRICT2 STATES
Kansas $ .30 Minnesota $ .30
HIGHER THAN THE DISTRICT38 STATES
OhioMississippiMissouriMARYLANDNevada
IdahoIndianaKentuckyNorth DakotaMichigan
MassachusettsVermontConnecticutMaineRhode Island
OregonNew JerseyOklahomaIllinois
$ .32 .35 .36 .40 .40 .45 .47 .50 .50 .51
.55 .55 .60 .60 .60
.67 .70 .72 .73
ArkansasNebraskaNorth CarolinaArizonaAlaska
WashingtonSouth CarolinaSouth DakotaDelawareWest Virginia
MontanaTennesseeHawaiiGeorgiaVIRGINIA
AlabamaIowaNew MexicoFlorida
$ .75 .75 .79 .84 .85
.87 .90 .93 .97 1.00
1.02 1.10 1.38 1.51 1.51
1.70 1.75 1.90 2.25
1/ 13% wine & liquor tax on top of monopoly markup of atleast 61%.

Part II: A Comparison of Selected Tax Rates In The District of Columbia With Those In The 50 States
Tax Rates and Tax Burdens in the District of Columbia: A Nationwide Comparison
Page 60
TABLE 22
STATE DISTILLED SPIRITS TAX RATES
(Per Gallon)
DISTRICT OF COLUMBIA: $ 1.50
CONTROL BOARD STATES18 STATES
AlabamaIdahoIowaMaineMichigan
MississippiMontanaNew HampshireNorth Carolina 1/
OhioOregonPennsylvaniaUtah 2/
Vermont
VIRGINIAWashingtonWest VirginiaWyoming
SAME AS THE DISTRICT1 STATE
MARYLAND $ 1.50
HIGHER THAN THE DISTRICT31 STATES
KentuckyMissouriNevadaColoradoTexas
ArkansasKansasLouisianaNorth DakotaIndiana
South CarolinaArizonaNebraskaWisconsinCalifornia
$ 1.92 2.00 2.05 2.28 2.40
2.50 2.50 2.50 2.50 2.68 2.72 3.00 3.00 3.25 3.30
Rhode IslandDelawareGeorgiaSouth DakotaTennessee
MassachusettsNew JerseyConnecticutIllinoisMinnesotaOklahoma
AlaskaHawaiiNew YorkFloridaNew Mexico
$ 3.75 3/
3.75 4/
3.79 3.93 4.00
4.05 4.40 4.50 4.50 5.03 5.56
5.60 5.98 6.43 6.50 6.75
1/ 28% Excise Tax. An additional 6% state sales tax.2/ 13% wine & liquor tax on top of atleast 61% markup.3/ Distilled spirits less than 30% proof at $1.10 per gallon.4/ Spirits with more than 25% ethyl alcohol. Spirits with less than 25% ethyl alcohol by volume at $2.50/gallon.

Part II: A Comparison of Selected Tax Rates In The District of Columbia With Those In The 50 States
Tax Rates and Tax Burdens in the District of Columbia: A Nationwide Comparison
Page 61
TABLE 23
STATE CIGARETTE TAX RATES
(Per Pack of 20)
DISTRICT OF COLUMBIA: $ .65
LOWER THAN THE DISTRICT36 STATES
VIRGINIAKentuckyNorth CarolinaSouth CarolinaGeorgia
WyomingTennesseeIndianaAlabamaMissouri
West VirginiaMississippiMontanaColoradoLouisiana
New MexicoOklahomaDelaware
$ .025 .03 .05 .07 .12
.12 .13 .155 .165 .17
.17 .18 .18 .20 .24
.21 .23 .24
KansasOhioIdahoPennsylvaniaArkansas
South DakotaFloridaNebraskaNevadaIowa
TexasNorth DakotaVermontMinnesotaUtah
New HampshireArizonaIllinois
$ .24 .24 .28 .31 .315
.33 .339 .34 .35 .36
.41 .44 .44 .48 .515
.52 .58 .58
HIGHER THAN THE DISTRICT14 STATES
MARYLANDOregonRhode IslandMaine Massachusetts
WisconsinNew Jersey
$ .66 .68 .71 .74 .76
.77 .80
WashingtonCaliforniaAlaskaHawaiiMichigan
ConnecticutNew York
$ .825 .87 1.00 1.00 1.00 1.11 1.30

Part II: A Comparison of Selected Tax Rates In The District of Columbia With Those In The 50 States
Tax Rates and Tax Burdens in the District of Columbia: A Nationwide Comparison
Page 62
TABLE 24
MOTOR FUEL TAX RATES
(Per Gallon)
DISTRICT OF COLUMBIA: $ .20
LOWER THAN THE DISTRICT22 STATES
GeorgiaAlaskaNew YorkNew JerseyWyoming
FloridaIndianaKentuckyAlabamaHawaii
South Carolina
$ .075 .08 .08 .105 .13
.139 .15 .15 .16 .16
.16
MissouriNew MexicoOklahomaVIRGINIAArizona
CaliforniaMississippiNew HampshireIllinoisMichigan
Vermont
$ .17 .17 .17 .175 .18
.18 .18 .18 .19 .19
.19
SAME AS THE DISTRICT6 STATES
IowaLouisianaKansas
$ .20 .20 .20
MinnesotaTennesseeTexas
$ .20 .20 .20
HIGHER THAN THE DISTRICT22 STATES
ArkansasMassachusettsNorth DakotaColoradoOhio
MaineSouth DakotaDelawareWashingtonMARYLAND
North Carolina
$ .205 .21 .21 .22 .22
.22 .22 .23 .23 .235
.241
OregonNevadaUtahConnecticutNebraska
IdahoWest VirginiaPennsylvaniaMontanaWisconsin
Rhode Island
$ .24 .24 .245 .245 .25
.25 .2535 .266 .27 .273 .28

Part II: A Comparison of Selected Tax Rates In The District of Columbia With Those In The 50 States
Tax Rates and Tax Burdens in the District of Columbia: A Nationwide Comparison
Page 63
TABLE 25
MOTOR VEHICLE SALES AND EXCISE TAXES
PAID AT TIME OF SALES OR TITLING47 STATES AND D.C.
DISTRICT OF COLUMBIA: 1/
6% of fair market value - 3,499 pounds or less7% of fair market value - 3,500 pounds or more
Alabama (.125-2.5%)DelawareColoradoNorth Carolina
New MexicoSouth DakotaVIRGINIAWyoming (1%)Oklahoma
Georgia (3%)HawaiiLouisiana (1%-5%)New York (2%-4.5%)Missouri (.375-3%)
Arkansas (1%)Utah (1.85%)Kansas (0%-2%)Arizona (1.0%-3%)Idaho
IndianaIowaMaineMARYLAND
2.75% 2.75% 2.9% 3.0%
3.0% 3.0% 3.0% 3.0% 3.25%
4.0% 4.0% 4.0% 4.0% 4.225%
4.625% 4.75% 4.9% 5.0% 5.0%
5.0% 5.0% 5.0% 5.0%
MassachusettsMississippiNebraskaNorth DakotaOhio (0%-3%)
South Carolina 2/
West VirginiaWisconsin (.6%)California (1.25%-2.5%)Connecticut
FloridaKentuckyMichiganNew JerseyPennsylvania
Tennessee (2.75%) 3/
VermontIllinois (.25%-1%)TexasMinnesota
NevadaWashington (.5%-2.3%)Rhode Island
5.0% 5.0% 5.0% 5.0% 5.0%
5.0% 5.0% 5.0% 6.0% 6.0%
6.0% 6.0% 6.0% 6.0% 6.0%
6.0% 6.0% 6.25% 6.25% 6.5%
6.5% 6.5% 7.0%
NO TAX4 STATES
AlaskaMontanaNew HampshireOregon
1/ Tax does not apply to vehicles previously tilted in another jurisdiction, when owners move to the District.2/ Maximum of $300.003/ Maximum of $44.00 (2.75% on 1 st $1,600)

Part II: A Comparison of Selected Tax Rates In The District of Columbia With Those In The 50 States
Tax Rates and Tax Burdens in the District of Columbia: A Nationwide Comparison
Page 64
TABLE 26
STATE MOTOR VEHICLE REGISTRATION FEES
Automobile Costing $7,900, Bought New and Weighing 3,522 Pounds(4-Door, 6-Passenger, 8-Cylinder)
DISTRICT OF COLUMBIA: $ 88.00
LOWER THAN THE DISTRICT46 STATES
Arizona 1/
IndianaKentuckySouth CarolinaMississippi
OregonWyomingNebraskaMontanaDelaware
GeorgiaNorth CarolinaTennesseeNew YorkOhio
AlabamaMaineUtahArkansasKansas
MassachusettsLouisianaVIRGINIA
$ 8.00 12.00 12.00 12.00 15.00
15.00 15.00 17.50 19.25 20.00
20.00 20.00 21.50 22.50 22.75
23.00 23.00 24.50 25.00 25.00
25.00 26.50 26.50
CaliforniaRhode IslandWashingtonWest VirginiaNew Hampshire
FloridaColoradoNevadaAlaskaConnecticut
PennsylvaniaMARYLAND 2/
MissouriNew MexicoSouth Dakota
VermontWisconsinHawaiiIdahoTexas
New JerseyIllinoisNorth Dakota
$ 30.00 30.00 30.00 30.00 31.20
32.50 32.74 33.00 34.00 35.00
36.00 38.00 39.00 42.00 42.00
43.00 45.00 46.42 48.00 59.80
73.50 78.00 79.00
HIGHER THAN THE DISTRICT3 STATES
OklahomaIowa
$ 90.00 93.00
Minnesota 3/ $108.75
OTHER BASIS
Michigan
1/ There is also a $1.50 fee earmarked for air quality.2/ Includes $11 fee earmarked for Emergency Medical Services System.3/ Maximum tax.

Part II: A Comparison of Selected Tax Rates In The District of Columbia With Those In The 50 States
Tax Rates and Tax Burdens in the District of Columbia: A Nationwide Comparison
Page 65
TABLE 27
STATE REAL ESTATE DEED RECORDATION AND TRANSFER TAX RATES
(Per $500 of Consideration)
DISTRICT OF COLUMBIA: $ 11.00
LOWER THAN THE DISTRICT36 STATES
ColoradoAlabamaGeorgiaHawaiiIllinois
OhioSouth DakotaNevadaOklahomaVIRGINIA ($.25)
IowaNebraskaNorth CarolinaMaineWest Virginia ($1.10)
KansasSouth CarolinaRhode Island
$ .05 .50 .50 .50 .50
.50 .50 .65 1/
.75 .75
.80 .875 1.00 1.10 1.10 1.30 1.30 1.40
WisconsinArkansasMinnesotaNew Jersey 2/
Tennessee
ArizonaNew YorkMassachusetts ($10.25)MARYLAND ($ 10.25) 3/
Connecticut
FloridaKentuckyMichigan (.55%)Pennsylvania ($5.00)Washington ($2.50)
Vermont 4/
New HampshireDelaware ($5.00)
$ 1.50 1.65 1.65 1.75 1.85
2.00 2.00 2.28 2.50 3.05
3.50 3.50 3.75 5.00 6.40
6.50 7.50 10.00
NO TAX14 STATES
AlaskaCalifornia ($ .55)IdahoIndianaLouisiana
MississippiMissouri
MontanaNew MexicoNorth DakotaOregonTexas
UtahWyoming
NOTE: Maximum local rate in parentheses.
1/ In county whose population is 400,000 or more, $1.25.2/ Additional $0.75 for each $500 of consideration over $150,000.3/ State transfer tax rate only. Rate is $1.25 for first-time home buyers. State recordation tax is only collected in certain instances and is not reflected in this number.4/ $2.50 on first $100,000.

Part II: A Comparison of Selected Tax Rates In The District of Columbia With Those In The 50 States
Tax Rates and Tax Burdens in the District of Columbia: A Nationwide Comparison
Page 66
TABLE 28
TYPES OF STATE INHERITANCE AND ESTATE TAXES
INHERITANCE TAX STATES WITH AN ESTATE TAX TO ABSORB FEDERAL CREDIT12 STATES
ConnecticutIdahoIndianaIowaKentucky
Louisiana
MARYLANDNebraskaNew HampshireNew JerseyPennsylvania
Tennessee
ESTATE TAX STATES WITH AN ESTATE TAX TO ABSORB FEDERAL CREDIT10 STATES
AlaskaIllinoisMassachusettsMississippiMontana
OhioOklahomaRhode IslandSouth DakotaWest Virginia
ESTATE TAX TO ABSORB FEDERAL CREDIT29 STATES AND D.C.
AlabamaArizonaArkansasCaliforniaColorado
DelawareDistrict of ColumbiaHawaiiFloridaGeorgia
KansasMaineMinnesotaMichiganMissouri
NevadaNew MexicoNew YorkNorth CarolinaNorth Dakota
OregonSouth CarolinaTexasUtahVermont
VIRGINIAWashingtonWisconsinWyoming

Part II: A Comparison of Selected Tax Rates In The District of Columbia With Those In The 50 States
Tax Rates and Tax Burdens in the District of Columbia: A Nationwide Comparison
Page 67
OFFICE LOCATIONS AND TELEPHONE NUMBERS
Office of the Chief Financial OfficerJohn A. Wilson Building
1350 Pennsylvania Avenue, NW, Suite 203 Washington, DC 20004
Office hours: Monday through Friday, 8:00 a.m. – 6:00 p.m.(202) 727-2476
Office of the Chief Financial OfficerNatwar M. Gandhi, Chief Financial OfficerLucille Dickinson, Acting Chief of StaffJerry Malone, General CounselRick Hays, Special AssistantMichael Kirby, Special AssistantClarice Nassif Ransom, Director of CommunicationsBen Lorigo, Internal Audit and Internal Security Director
Office of Research and AnalysisJulia Friedman, Deputy Chief Financial Officer441 4th Street, NW, Suite 400 South, Washington, DC 20001(202) 727-7775
Office of Budget and PlanningBert Molina, Deputy Chief Financial Officer1350 Pennsylvania Avenue, NW, Suite 229, Washington, DC 20004(202) 727-6234
Office of Finance and TreasuryN. Anthony Calhoun, Deputy Chief Financial Officer441 4th Street, NW, Suite 360 North, Washington, DC 20001(202) 727-0758
Office of Financial Operations and SystemsAnthony F. Pompa, Deputy Chief Financial Officer810 1st Street, N.E., Suite 200, Washington, DC 20002(202) 442-8200
Office of Tax and RevenueHerbert Huff, Deputy Chief Financial Officer941 North Capitol Street, N.E., Suite 800, Washington, DC 20002(202) 442-6383

Prepared By:
Government of the District of ColumbiaOffice of the Chief Financial Officer
Office of Research and Analysis441 4th Street, NWSuite 400 South
Washington, D.C. 20001(202) 727-7775