improvement of resolution of mössbauer and other spectra by fourier transform techniques
TRANSCRIPT
Volume 6. number 1 CHEMICAL PHYSICS LETTERS 15 August 19iO
IMPROVEMENT OF RESOLUTION OF MOSSBAUER
AND OTHER SPECTRA BY FOURIER TRANSFORM TECHNIQUE’S
A. J. STONE University Chemical Labcratmy, Lensfield Road, Cambridge. UK
Received 28 May i970
Althmgh the resolution of Mdssbauer spectra is limited by lifetime broadening. it is possible to sharpen the lines significantly by using Fourier transform techniques, and to obtain a s;bst,antia[ improve_ ment in resolution.
One of the ‘&conveniences of Miissbauer spec- troscopy is the fact that the width of the lines cannot be reduced below a limiting value, which is the value corresponding to the natural life-
time of the Mdssbauer state, and which is use- ally comparable with and often larger than the shifts and splittings which are of interest to the spectroscopist. It is the purpose of this note to show that the linewidth in the observed spectrum
can nevertheless be reduced by simple numeri- cal processing of the data. The method is quite general and can be applied to any spectrum whose lineshape is known
The spectrum can be written in the following form as a function of Doppler valocity x:
Y(x)=S*L+N, (1)
where S is the ‘ideal’ spectrum with no line broadening, L is the. line-shape function, and N describes the noise, or statistical fluctuation of the count rate Y. The asterisk denotes a convo- lution:
s*L3~~s(u)L(%-u)du.‘ (21
YI Now one may form the Fourier transform of
y(o) = leaiG Y(x)&; (3)
(small letters are used for Fourier transforms and large letters for. functions of x). Since Y is available only at finite intervals in x, the inte- gral ip (3) will, in practice, be replaced by a sum. The transform y will of course be complex Fn general. . .
It is a standard theorem that the transform of a convolution of two functions is the product of the two transforms, so that
y =sZ+72, (4)
using s, Z and n to denote the transforms of S, L. and N. If Lis a lorentzian function with width I? at half-height:
(5)
then Z is an exponential:
Z(w) = exp(- lw Ir/z1 , 05)
where the units of w are radians/channel if I? is measured in channels.
Thus the quantities y and ! in eq. (4) are known, and the problem is to extract s. The presence of n prevents this being done, but we may instead proceed as follows. If we diyide by Z’ = exp( - !ti Ir(/2) we get
y/L’ = sl/l’ + n/l’.
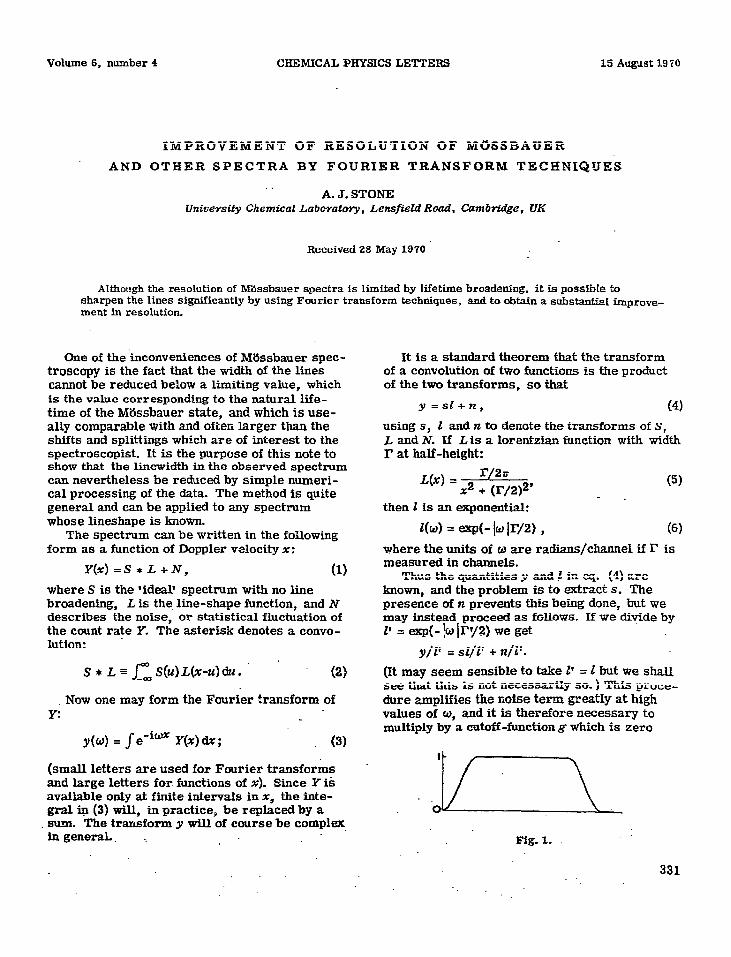
(It may seem sensible to take I’ = Z but we shall see that this is not necessarily SO. ) This proce- dure amplifies the noise term greatly at high values of w, and it is therefore necessary to multiply by a cutoff-functiong which is zero
J//--y-\_ Fig. 1.
331
Volume 6..au~r 4 CZEMICAL PHYSICS LZTTERS‘ .: 15August1970 . . .
4 t _;_-_-_._-___ _ . . c- _ __ - ._. _- . ._ _--
Pam 19ch
XC== 6 ch
4-l I -r:-; , y, , ::. , -, .:.-
0 100
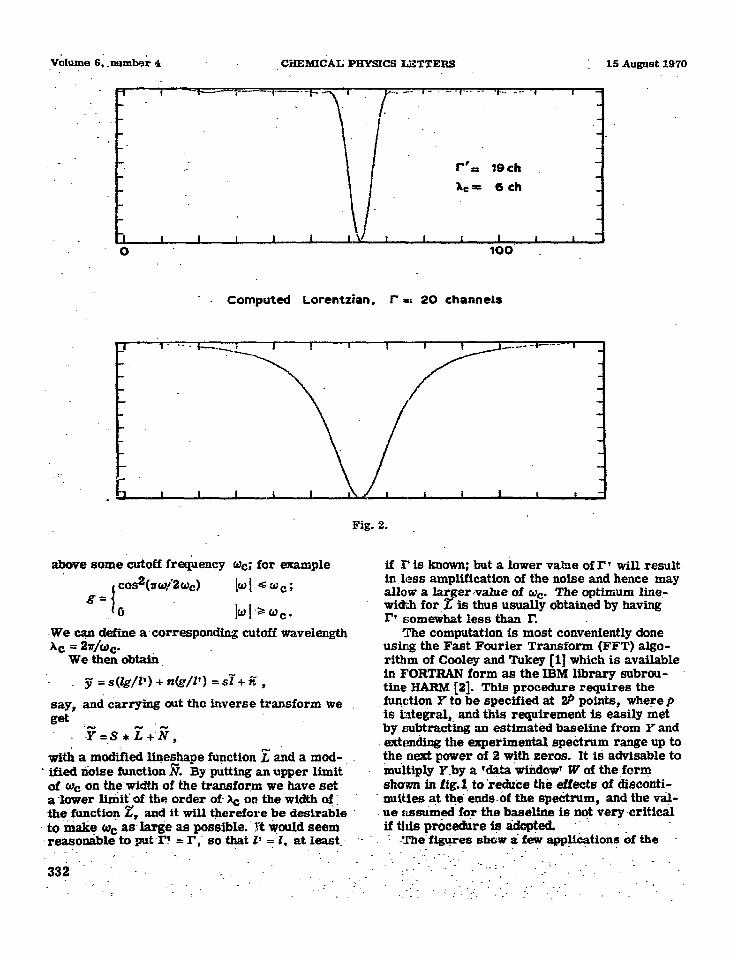
Computed Lorentrion. r =i 20 channels
above some cutoff fre&ency WC; for -example
-We can define a-corresponding cutoff wavelength AC = an/Q.
We then obtain
jj = s(&/Z’) + n(g/Z’) = s-i + SC ,
say, and carrying out the inverse transform we
gd :_ Y=+rLU*%,
witk a modified lineshape function L” and a mod- . ified fioise function g. By pkng an upper limit of cd, on thewidth of the transform we have set a -lower U&it of the order of X, on the wi&h of : the functiOp z, and it will therefore be desirable to %iake oc as larie as possible.. ?‘t %ould seem ~reasonableto put~l? = r,- so that Z’ = Z, at least:
_ -.,
Fig. 2.
if l? is known; but a lower value of rV will result in.less amplification of the noise and hence may allow a larger.-value of w,. The optimum line,- wickh for z is thus usually obtained by having P somex&# less than I!,
The computation is most conveniently done using the Fast Fourier Transform (FFT) algo-- ritbm of Cooley and Tukey [l] which is available in FORTRAN form a~ the IBM library cmbrou- tine HARM [2]. This procedure requires the fuqction Y to be specified at @ points, where p is Me&l,. and this requirement is easily met by Gubtracting an estimated baseline from Y and extding the experimental ape&rum range up to the next power of 2 $th zeros. It ti advisable to kultiply Y.by a (&+a tidow’ W of the-f&m shown in fig.? tO’re$h t&3 efk& of diSCOnti- mities _+t tl+ ends-of the spehrum, and the v& ue .nsemed for the baseline is IK$ very-critical if this prfkdure-@3 3dcp@d ‘- .- ’ : --Y’he’flggres show ti few appliiations &f the
__ _. ,
.’ ,. ,, -_ _. ..:, ; 3 -
. . . _- . ..: ..,“ __. . . :_ ~,
Volume 6, number 4 _ CHJIMICAL PHYSICS LETTERS 15 August 1970
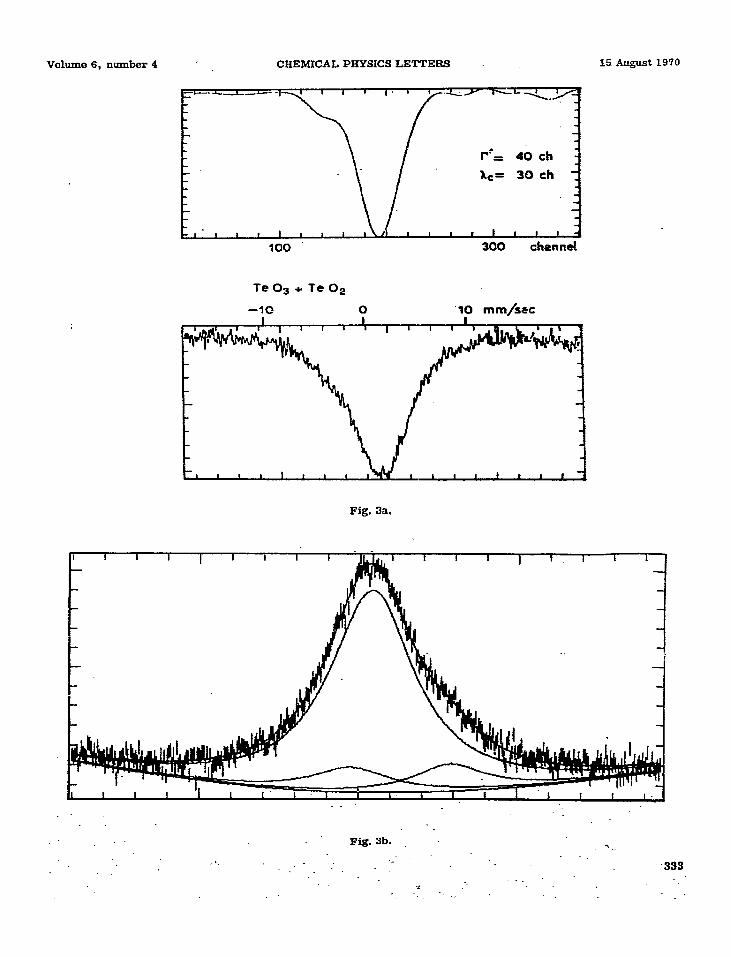
Te03 + Te02
-10 0 .lO mm/ssc
Fig. 3a.
. . Fig. 3b.
:
-. - .. ,_ . . -333
.: _-- -. -.
.,,. -y_.-- ^ _’ -
Volume 6..number 4 CHEMICAL PHYSICS LET+ERS ’ . -- IS-August 1970
.; _’
: .
.’ -., ;
,_ ,.
.
:_.
,
:
_- ,.
. .
.’
. . ., .
,.
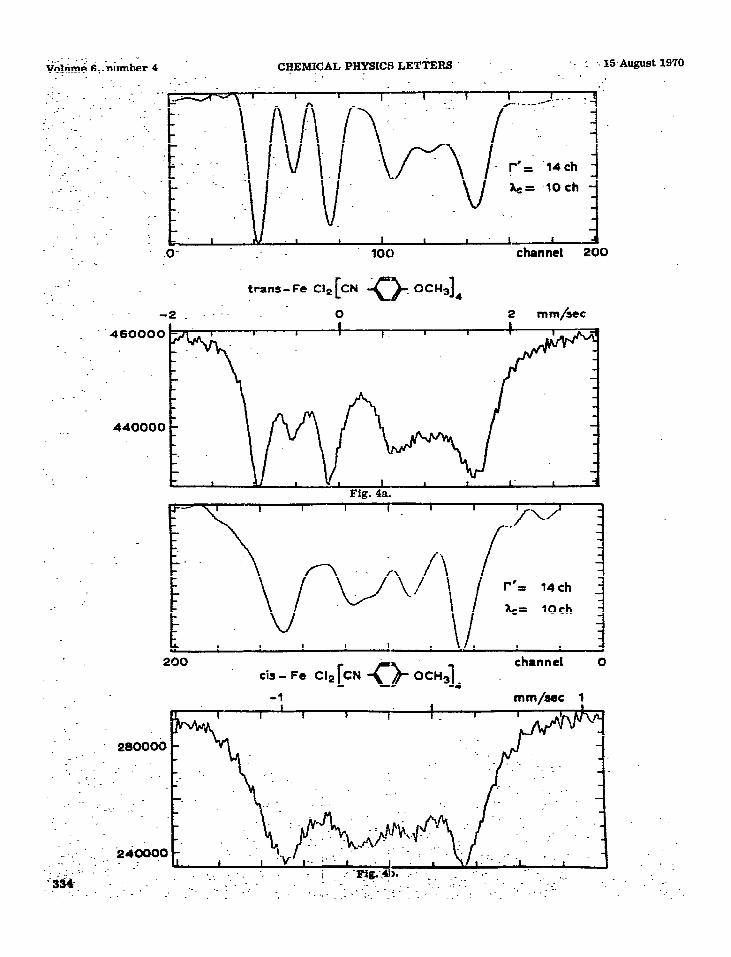
tram- Fe Cl, [CN 0. oC+],
-2~ ..:. - 0 2 mm/see
Fig. 4a.
200 cis - Fe C&[CN 0 cd,], channc’ ’
-1 mm/sax 1
Vohme 6. number 4 CHEMICAL PHYSICS LETTEBS 15 August 1970
method Fig.2 shows the result obtained starting with a computed lorentzian; the width at half- height has been reduced by a factor of 3, but notice also that the broad lorentzian wings have disappeared. Fig. 3a shows an application to a line spectrum (TeO3); it is apparent from the modified spectrum that there is a shoulder due to an impurity which is certainly not apparent in the original spectrum. The impurity is expect- ed to be TeO3, and the spectrum can be fitted very satisfactorily using the known parameters for TeO3 (fig. 3b). Fig. 4 shows an application to band spectra of the type obtained when both hyperfine and quadrupole effects are present. There is no method available at present for deter- mining the sign of quadrupole splittings in such cases except comparison with computed spectra [3], and so an improvement in resolution is very helpful. The spectrum of the fra8.s complex (fig. 4a) is already well resolved, with the & triplet at low energy and the if doublet at high energy, so that the quadrupole splitting is clear- ly positive; but the cis spectrum (fig. 4b) is not nearly so well resolved. The modified spectrum shows clearly that the triplet is at high energy and the doublet at low energy, so the sign here is negative. This example [4] is a pleasing con-
firmation of the 2 : -1 role for bans : cis quad- rupole splittings in low-spin ferras complexes 151.
It is reasonable to hope that the procedure will be useful in assigning signs of quadrupole splittings in other 3 --Q transitions, notably in tin, where the spectra are much more difficult to :aterpret. It will be apparent that the method is not limited to MlSssbauer spectra, though in most other forms of spectroscopy the lineshape is less well known and there is usually some possibility of improving resolution by purely experimental means.
I am indebted to professor .I. WK. Tckey for a most helpful discussion.
REFERENCES
[l! J. W. Cooley and J. W. Tukey. Mati. Comp. 19 (1965) 297.
[2] IBM System/360 Scientffto Subroutine Pa&age. 131 R. L. Collins and J. C. Travis. E6ssbauer Effect . -
Methdoiogy 3 (l963 123. [4] G. M.Bancroft et al.. Chem.Commun. (l.070) 200. [S] M.G.Clark. Discussions Faraday Sot. 47 0969)
144.
,, : :- 335
. . . .- - ,- .‘-