improvement of reproducibility in grazing-exit epma (ge-epma)
TRANSCRIPT
X-RAY SPECTROMETRYX-Ray Spectrom. 2006; 35: 89–92Published online 23 June 2005 in Wiley InterScience (www.interscience.wiley.com). DOI: 10.1002/xrs.845
Improvement of reproducibility in grazing-exit EPMA(GE-EPMA)
K. Tetsuoka,1 T. Nagamura2 and K. Tsuji1,3∗
1 Department of Applied Chemistry, Graduate School of Engineering, Osaka City University, 3-3-138 Sugimoto, Sumiyoshi-ku, Osaka 558-8585, Japan2 Unisoku Co., 2-4-3 Kasugano, Hirakata, 594-1111, Japan3 PRESTO, JST, 4-1-8 Honcho Kawaguchi, Saitama, 332-0012, Japan
Received 3 August 2004; Accepted 1 March 2005
In grazing exit electron probe microanalysis (GE-EPMA), characteristic x-rays emitted from only nearsurface regions of a specimen are detected at extremely low exit angles near 0◦. Therefore, GE-EPMAis useful for localized surface analysis. However, there is a practical problem with GE-EPMA, namely,reproducibility of angle adjustment. Therefore, we developed a new instrument, a ‘laser beam and four-separated photodetector system’, to adjust the sample inclination. It was found that the reproducibility ofangle adjustment was improved by about one-tenth by applying this system. Copyright 2005 John Wiley& Sons, Ltd.
INTRODUCTION
In grazing exit electron probe microanalysis (GE-EPMA),characteristic x-rays emitted from only near surface regionsof a specimen are detected at extremely low exit angles near0°.1 Compared with conventional EPMA, it is very importantin GE-EPMA to control the take-off angle. In the case of GE-EPMA, x-rays must be measured at grazing angles smallerthan 1°, leading to surface-sensitive analysis. X-rays, whichare produced deep inside a sample, are strongly absorbedin the sample before they reach the detector. In addition,these x-rays are refracted at the surface of the sample and areobstructed by the slit, which is fixed in front of the detector.Therefore, these x-rays are not detected through the slitunder grazing exit conditions. GE-EPMA has been appliedsuccessfully to localized thin-film analysis and single-particleanalysis.1 – 3
However, we had a practical problem with GE-EPMAwhen the measurement was carried out at grazing exitconditions, namely reproducibility of angle adjustment.It was very difficult with our instrument to set thesample at exactly same conditions for every measurement.If the detection angle changes with every measurement,quantitative analysis would be difficult. Therefore, wedeveloped a new instrument, a ‘laser beam and four-separated photodetector system’, to adjust the sampleinclination.
EXPERIMENTAL
Setup for GE-EPMADetails of the GE-EPMA setup used in this study havebeen described elsewhere.2,4 The experimental setup for
ŁCorrespondence to: K. Tsuji, Department of Applied Chemistry,Graduate School of Engineering, Osaka City University, Sugimoto3-3-138 Sumiyoshi-ku, Osaka 558-8585, Japan.E-mail: [email protected]
GE-EPMA is shown in Fig. 1. To change exit angles, theposition of the EDX (energy-dispersive x-ray) detector waschanged using a linear positioning stage. The sample positionwas fixed and was not changed when the exit angle waschanged. The SEM (scanning electron microscope) and theEDX detector were connected by means of a stainless-steelflexible tube. A slit (0.2 mm) was attached in front of theEDX detector. A computer controlled both the EDX analysisand the linear positioning stage. Experimental conditionsof electron beam energy of typically 20 keV and samplecurrent of ca 0.5 nA were applied. The angle dependence ofcharacteristic x-ray intensities was measured for a countingtime of 60 s at each exit angle.
Equipment for adjusting exit anglesThe newly developed system consisted of both an He–Nelaser beam and four-separated photodetector as shown inFig. 2; L is the distance between the sample and photode-tector. The diameter of the laser beam is certified to be0.46 mm. The sample was irradiated with the laser. We usedthe four-separated photodetector of the PSD (Position Sensi-tive Detector, Hamamatsu, Japan). Figure 3 shows how thelaser beam and four-separated photodetector system works.Here, the four parts are labeled 1, 2, 3 and 4. In Fig. 3, the Xmeter indicates the balance between the up signal (1 C 2) andthe down signal (3 C 4). Similarly, the Y meter indicates thebalance between the right signal (2 C 4) and the left signal(1 C 3). For example, if the signal intensity of up (1 C 2) equalsthat of down (3 C 4), the value of the X meter indicates center(0 V). If the signal intensity of up (1 C 2) is stronger than thatof down (3 C 4), the value of the X meter indicates a positivevoltage. In Fig. 3, � indicates the angle between the laser andthe surface of the sample. A voltage of 1 V corresponds to ashift of 2 mm in both the X meter and Y meter.
Experimental procedureAn Si wafer was used as a sample because flatness is requiredfor GE-EPMA. First, the sample was fixed on the sample
Copyright 2005 John Wiley & Sons, Ltd.

90 K. Tetsuoka, T. Nagamura and K. Tsuji
Figure 1. Setup for GE-EPMA.
laser
Conv.EPMAphoto detector
GE_EPMA
SEM
L
sample
mirror
Figure 2. Top view of laser and photodetector.
holder. The sample was irradiated with a laser and the spotof the reflected laser beam was fixed at the center of thefour-separated photodetector. Here, the position of the laserand the photodetector are fixed. Next, the measurement atgrazing exit conditions by EPMA is carried out. To evaluatethe reproducibility, whenever the measurement is finished,the sample is taken from the sample holder, and then thesample is fixed on the sample holder again and irradiatedwith the laser. If the position of the photo spot changes, theheight or inclination of sample holder is adjusted so that thespot is at the center of four-separated photodetector. A seriesof these operations is repeated 10 times. The measurementconditions are shown in Table 1 (concerning of � and L). Asmentioned previously, � indicates the angle between the laserand the surface of the sample and L indicates the distancebetween the sample and the photodetector.
RESULTS
The angle dependent results for the Si wafer in two mea-surements without using a laser beam and the four-separatedphotodetector system are shown in Fig. 4. Here, a white circleindicates the first measurement and a solid circle the second
laser
photo detector
Si
sample 11+3
2+4
+−
q
(V)
X Y
+
+
−
−
+
−
12
43
+ 2
3 + 4
X meter (3 + 4) (1 + 2)⇔
Y meter (1 + 3) (2 + 4)⇔
Figure 3. Laser beam and four-separated photodetectorsystem.
Table 1. Measurement conditions, the result of adjusting theexit angle and theoretical value
� (°) 10 5 10 30L (m) 0.55 0.85 0.85 0.85Difference from criticalangle (SD) (°)
0.092 0.085 0.042 0.089
Y (˛ D 0.1°,X D 1.0 mm) (mm)a
2.978 3.988 4.057 4.948
a Y: total shift of Y(height) in Fig. 7 and Y(angle) in Fig. 8.
0.0 0.5 1.0 1.5 2.0 2.5 3.0 3.5 4.0
0
200
400
600
800
1000
1200
inte
nsity
of X
-ray
Exit angle (degree)
(1)(2)
Figure 4. Measurement of Si wafer by GE-EPMA without usingthe laser beam and four-separated photodetector system.
measurement. Although the measurements were indepen-dently carried out under the same conditions, the firstmeasurement was different from the second measurementconcerning the critical angle at which the x-ray intensitiesincreased sharply for Si in GE-EPMA. Therefore, we used the
Copyright 2005 John Wiley & Sons, Ltd. X-Ray Spectrom. 2006; 35: 89–92
Improvement of reproducibility in GE-EPMA 91
0.0 0.5 1.0 1.5 2.0 2.5 3.0 3.5 4.0
0
200
400
600
800
1000
1200
1400
X-r
ay in
tens
ity
Exit angle (degree)
(1)(2)(3)(4)(5)(6)(7)(8)(9)(10)
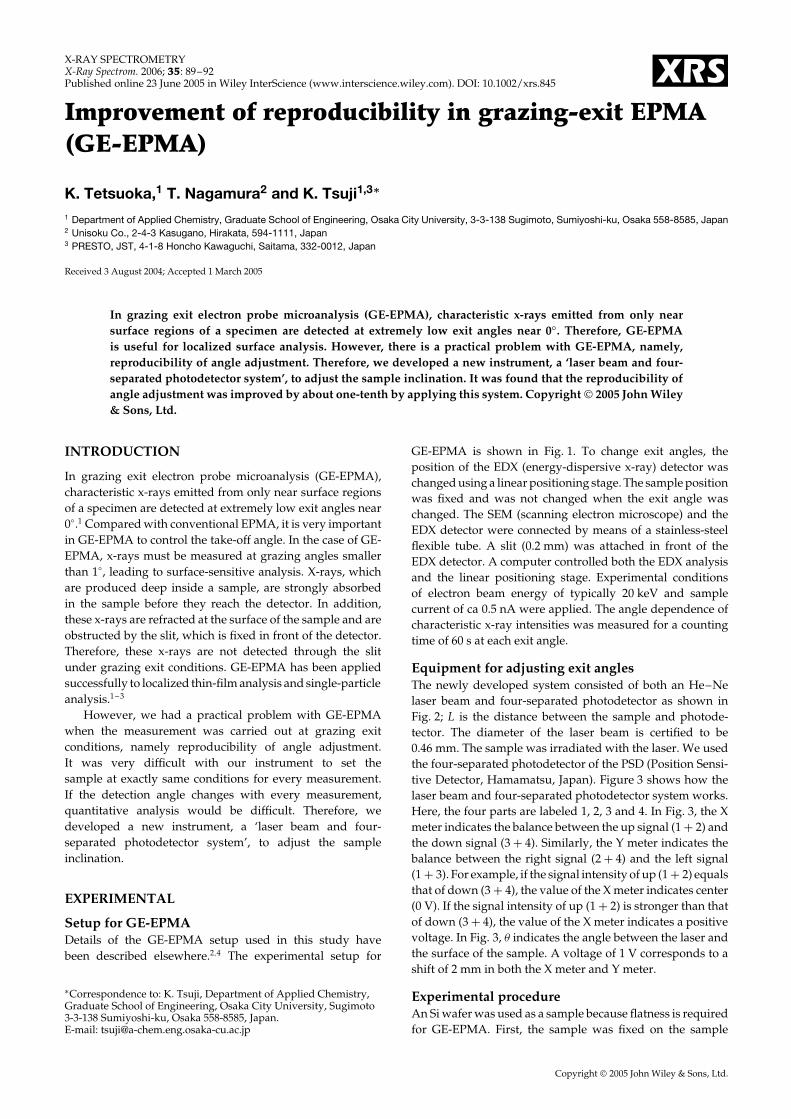
Figure 5. Measurement of Si wafer by GE-EPMA using thelaser beam and four-separated photodetector system.Measurement conditions � D 10°, L D 0.85 m.
new laser beam and four-separated photodetector system toimprove the results. The experimental results for 10 mea-surements using this system with � D 10° and L D 0.55 m areshown in Fig. 5. In the same way, the intensities of Si K˛ x-rays were measured at each exit angle. The results confirmedthat the reproducibility of angle adjustment is apparentlyimproved.
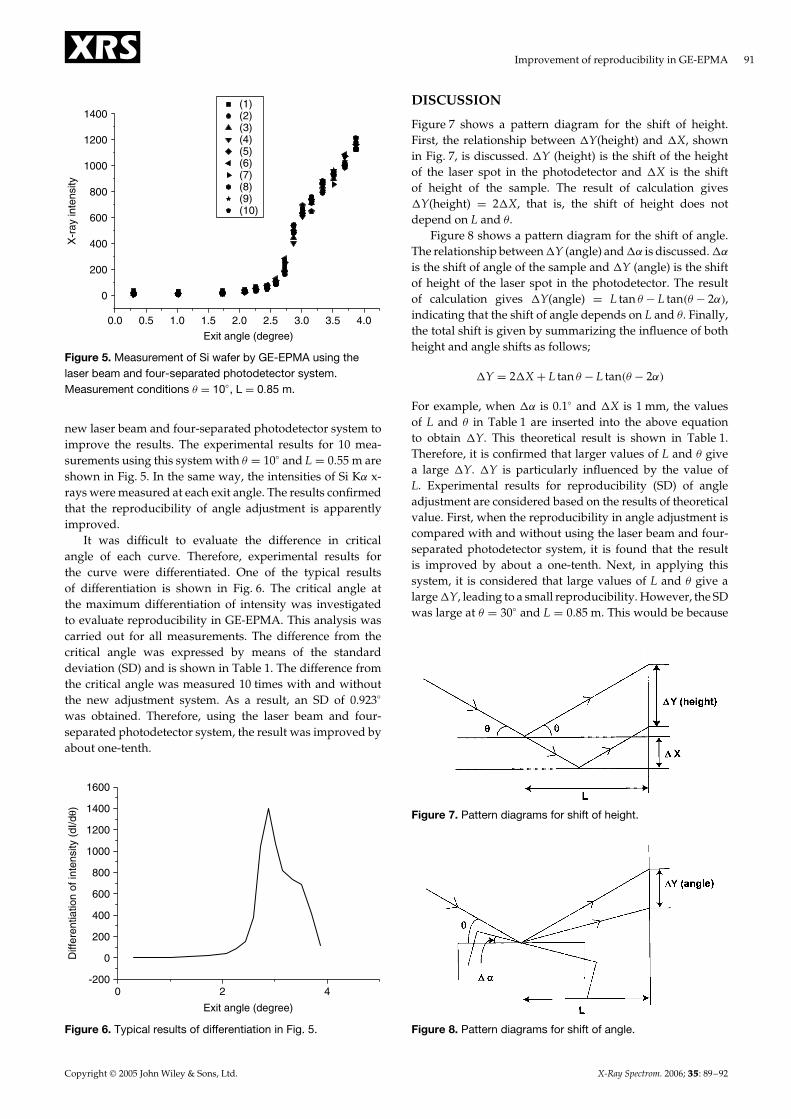
It was difficult to evaluate the difference in criticalangle of each curve. Therefore, experimental results forthe curve were differentiated. One of the typical resultsof differentiation is shown in Fig. 6. The critical angle atthe maximum differentiation of intensity was investigatedto evaluate reproducibility in GE-EPMA. This analysis wascarried out for all measurements. The difference from thecritical angle was expressed by means of the standarddeviation (SD) and is shown in Table 1. The difference fromthe critical angle was measured 10 times with and withoutthe new adjustment system. As a result, an SD of 0.923°
was obtained. Therefore, using the laser beam and four-separated photodetector system, the result was improved byabout one-tenth.
0 4-200
0
200
400
600
800
1000
1200
1400
1600
Diff
eren
tiatio
n of
inte
nsity
(dI
/dθ)
Exit angle (degree)
2
Figure 6. Typical results of differentiation in Fig. 5.
DISCUSSION
Figure 7 shows a pattern diagram for the shift of height.First, the relationship between Y(height) and X, shownin Fig. 7, is discussed. Y (height) is the shift of the heightof the laser spot in the photodetector and X is the shiftof height of the sample. The result of calculation givesY(height) D 2X, that is, the shift of height does notdepend on L and �.
Figure 8 shows a pattern diagram for the shift of angle.The relationship between Y (angle) and ˛ is discussed. ˛is the shift of angle of the sample and Y (angle) is the shiftof height of the laser spot in the photodetector. The resultof calculation gives Y(angle) D L tan � � L tan�� � 2˛�,indicating that the shift of angle depends on L and �. Finally,the total shift is given by summarizing the influence of bothheight and angle shifts as follows;
Y D 2X C L tan � � L tan�� � 2˛�
For example, when ˛ is 0.1° and X is 1 mm, the valuesof L and � in Table 1 are inserted into the above equationto obtain Y. This theoretical result is shown in Table 1.Therefore, it is confirmed that larger values of L and � givea large Y. Y is particularly influenced by the value ofL. Experimental results for reproducibility (SD) of angleadjustment are considered based on the results of theoreticalvalue. First, when the reproducibility in angle adjustment iscompared with and without using the laser beam and four-separated photodetector system, it is found that the resultis improved by about a one-tenth. Next, in applying thissystem, it is considered that large values of L and � give alarge Y, leading to a small reproducibility. However, the SDwas large at � D 30° and L D 0.85 m. This would be because
Figure 7. Pattern diagrams for shift of height.
Figure 8. Pattern diagrams for shift of angle.
Copyright 2005 John Wiley & Sons, Ltd. X-Ray Spectrom. 2006; 35: 89–92

92 K. Tetsuoka, T. Nagamura and K. Tsuji
the four-separated photodetector and the laser were notfixed steadily owing to their high position. In conclusion, thelargest values of L and � are preferable when the alignmentof the four-separated photodetector and the laser is possible.
CONCLUSIONS
Improvement of the reproducibility of GE-EPMA wasattempted by using a laser beam and four-separated pho-todetector system. This newly developed system consistedof an He–Ne laser beam and four-separated photodetec-tor. By using this system, the reproducibility (SD) of angleadjustment was improved by about one-tenth. It was found
that the reproducibility (SD) of angle adjustment was depen-dent on both L and �. In conclusion, the largest values ofL and � are preferable when the alignment of the device ispossible.
REFERENCES1. Tsuji K, Wagatsuma K, Nullens R, Van Grieken R. Anal. Chem.
1999; 71: 2497.2. Tsuji K, Saito K, Asami K, Wagatsuma K, Delalieux F, Spolnik Z.
Spectrochim. Acta, Part B 2002; 57: 897.3. Tsuji K, Wagatsuma K, Nullens R, Van Grieken R. J. Anal. At.
Spectrom. 1999; 14: 1711.4. Tsuji K, Sponlnik Z, Ashino T. Rev. Sci. Instrum. 2001; 72: 3933.
Copyright 2005 John Wiley & Sons, Ltd. X-Ray Spectrom. 2006; 35: 89–92