improvement of k-nearest neighbors (knn) algorithm for
TRANSCRIPT
Improvement of K-nearest Neighbors (KNN) Algorithm for
Network Intrusion Detection Using Shannon-Entropy
Nguyen Gia Bach, Le Huy Hoang, and Tran Hoang Hai School of Information and Communication Technology, Hanoi University of Science and Technology, Hanoi, Vietnam
Email: {ngb1998; huyhoang100697}@gmail.com, [email protected]
Abstract—Non-parametric Nearest Neighbor is an algorithm
seeking for the closest data points based on the Euclidean Norm
(the standard distance between two data points in a
multidimensional space). The classical K-nearest Neighbor
(KNN) algorithm applies this theory to find K data points in a
vicinity of the considering data, then uses majority voting to
label its category. This paper proposes a modification to the
original KNN to improve its accuracy by changing that
Euclidean Norm based on Shannon-Entropy theory in the
context of Network Intrusion Detecton System. Shannon-
Entropy calculates the importance of features based on the
labels of those data points, then the distance between data points
would be re-calculated through the new weights found for these
features. Therefore, it is possible to find the more suitable K
data points nearby. NSL - KDD dataset is used in this paper to
evaluate the performance of the proposed model. A comparison
is drawn between the results of the classic KNN, related work
on its improvement and the proposed algorithm as well as novel
deep learning approaches to evaluate its effectivenes in different
scenarios. Results reveal that the proposed algorithm shows
good performance on NSL - KDD data set. Specifically, an
accuracy up to 99.73% detecting DoS attacks is obtained, 5.46%
higher than the original KNN, and 1.15% higher than the related
work of M-KNN. Recalculating the Euclidean-Norm distance
retains the contribution of the features with low importance to
the data classification, while assuring that features with higher
importance will have a higher impact. Thus, the proposal does
not raise any concern for losing information, and even achieves
high efficiency in the classification of features and data
classification. Index Terms—KNN, Shannon-entropy, classification,
improving KNN, NSL-KDD, intrusion detection
I. INTRODUCTION
A. Intrusion Detection System
In recent years, cyber-attacks have caused significant
losses to the industry and government due to an
increasing number of devices connected to the Internet.
Such devices use services-over-Internet frequently with
services characterized and provided seamlessly by 5G,
Cloud and Edge Computing. Network devices. These
technologies interact with services and applications that
allow remote access through the Internet, and thus
allowing malicious agents to attack the device. Intrusion
Manuscript received January 12, 2021; revised July 2, 2021.
This work was supported by a research grant, T2020-PC-209, from
Hanoi University of Science and Technology Research Fund.
Corresponding author email: [email protected]
doi:10.12720/jcm.16.8.347-354
Detection System (IDS) monitors network system for
malicious flow or policy violations [1]. A key difference
between firewall and IDS is that firewall only monitors
and prevents external attacks. On the other hand, IDS can
capture and detect both external and internal intrusion
into the system. IDS play an essential role in security
management, supporting network administrators to detect
a variety of attacks based on their unusual behaviours,
indicating whether a traffic flow might be an attack or
normal. The more sophisticated and diverse attack
methods on the network layer becomes, the more urgent
for an IDS system to change and evolve and adapt to that
intelligence and diversity. In terms of the detection
technique, IDS is categorized into two classes, signature-
based detection [2] and anomaly-based detection [3].
Signature-based IDS detects attacks based on predefined
rules, through network traffic analysis and system logs.
This technique requires maintaining a signature database,
which must be updated on a regular basis for every new
intrusion technique. Anomaly-based IDS detects intrusion
by statistically comparing the current traffic with the
usual one from system operations to detect anomaly that
might be a sign of intrusion. Anomaly-based IDS
detecting network intrusion based on the behaviour or
pattern is said to overcome the disadvantages of
signature-based IDS. As a result, it has the ability to
detect zero-day attacks [4]. The downside of this
approach is that the system must be regularly trained
from the system logs to identify the normal behaviour,
before handled by the network administrator, leading to a
waste of both time and human resources. Nowadays, with
the vast development of technology, especially in the
field of artificial intelligence, the IDS integrated with
machine learning modules to automatically detect
abnormal traffic network seems to be a potential solution
to solve the mentioned problems. Machine learning
algorithms can provide a high accuracy for the
classification of network traffic and help reduce false
positive rate or avoid missing attacks.
B. Problem Statement
One of the most basic algorithms commonly used in
IDS is K-nearest Neighbours (KNN) [5] algorithm. KNN
is well-known for its simple implementation since the
classes are not linearly separable and no complexity for
training process. However, the main disadvantage of
KNN is its being sensitive with noises or irrelevant
Journal of Communications Vol. 16, No. 8, August 2021
©2021 Journal of Communications 347
attributes, leading to less meaningful distance among
points. This paper mitigates the issue by applying
Shannon entropy to calculate the correlation of
importance between features in a data matrix. The more
significant features being more determined would have
higher priority in classifying than the less significant,
which is the noise. However, in the classic KNN, every
feature plays an equal role in classifying the data. There
are other mitigations such as putting weight on every
point in the vicinity [6], showing promising results, yet
failed to reflect the correlation between features.
II. RELATED WORK
A. K-Nearest Neighbors (KNN) Algorithm
KNN is a non-parametric method used for
classification and regressionn. The algorithm calculates
the Euclid distance from the data to be classified to all
points in the data space, then selects K points with the
closest distances. Among K points, the majority class will
be assigned to the data point being labeled. KNN is a
simple and intuitive model, yet still highly effective
because it is non-parametric, making no assumption
about data distribution. Also, it can be used directly for
multi-class classification. Nevertheless, it poses several
drawbacks, such as expensive computation of the training
data in testing phase or being sensitive to noises. The
authors in [7] adapted two fast KNN classification
algorithms i.e., Indexed Partial Distance Search K-
Nearest Neighbours (IKPDS), Partial Distance Search K-
Nearest Neighbours (KPDS) and comparing with
traditional KNN classification for Network Intrusion
Detection on NSL-KDD dataset 2017 [8]. In [9], the
authors propose to use PCA-fuzzy Clustering-KNN
method which ensemble of Analysis of Principal
Component and Fuzzy Clustering with K-Nearest
Neighbours feature selection technics to detect anomalies.
In recent work, [10] introduced modified KNN (M-KNN)
using Gaussian fuzzy membership function to compute
data values distance from K-nearest neighbors and the
memberships of possible classes. It is shown that no
arbitrary assignments are made by the algorithm, which
might arise in choosing different k values in the original
KNN. The accuracy of M-KNN on NSL-KDD dataset
can reach up to 98.58%, a 4.31% increase from the
original. Therefore, M-KNN is chosen in this paper to
make comparison with the proposed algorithm.
B. Deep Learning
In [11], Multi-Layer Perceptron (MLP) was
implemented to classify normal traffic and several types
of network intrusion in NSL-KDD including ipsweep,
neptune, nmap, smurf, satan. The authors used feature
reduction methods such as Best First Search [12] and
Genetic Search [13] then trained basic MLP using Weka
with default configuration in 500 epochs, 1 hidden layer,
60 neurons and achieved average accuracy of 98.72% on
the merged dataset after cross-validation. A deeper MLP
trained on the dataset with full features will be made as a
comparison in our paper. In addition, the work in [14]
utilized Convolution Neural Network (CNN), Deep
Belief Network (DBN), and Long Short Term Memory
(LSTM) on the full NSL-KDD then emphasized on the
superior performance of CNN detecting uncommon
attacks over traditional machine learning methods and
novel deep learning approaches. An accuracy reaching
80.1% was obtained by CNN on a separated testing set,
KDDTest, reflecting a more objective evaluation since
some attacks are unknown to the training phase.
Nevertheless, aiming to compare with the proposed KNN
improvement and related work, CNN and LSTM are
trained and cross-validated on the merged dataset in this
paper.
C. NSL-KDD Dataset
A wide variety of cybersecurity datasets have been
published over the years, yet with a few shortcomings.
For instance, the DARPA dataset published in 1998 [15],
does not reflect the actual data and its release date is too
old. KDD’99 and Kyoto 2006+ [16] were announced too
long ago, failed to update new attack patterns. Twente
published in 2009 [17] is a dataset obtained from a
honeynet network, yet its disadvantage is shown in the
monotonous data and lack of attack types. ISCX2012
published in 2012 [18] is a set of data created by two
systems, in which the alpha system is responsible for
executing the attack scripts and the beta system performs
the same tasks as the normal user. However, its downside
is the lack of HTTPS port traffic that is popular today. In
addition, the distribution of attack traffic does not seem
practical, causing a lack of reliability. CICIDS2017
published in 2017 is a relatively complete and accurate
dataset to train the model, but this dataset poses a few
drawbacks. Apart from being too large and spanning over
eight files, the distribution of attacks is not uniform,
meaning that some types of attacks can overbalance the
minor. Therefore, NSL - KDD dataset is chosen for this
paper, which is quite diverse in terms of attack types,
eliminating redundant records of the KDD'99 dataset and
not too large for building models in the lab. This dataset
consists of four subsets: KDDTest+, KDDTest-21,
KDDTrain+, KDDTrain+_20Percent, but KDDTest-21
and KDDTrain+_20Percent are subsets of KDDTest+ and
KDDTrain+. Our test dataset is not from the same
probability distribution of attack types as the training data,
some are unknown to the training phase, which makes it
more realistic. The dataset consists of Internet traffic
records observed by a simple intrusion detection network
and are the traffic an IDS may encounter, which are
residual traces. Each record contains 43 features, with 41
features related to the network traffic, the last 2 features
being label (attack or not attack) and level of attack
(severity of the incoming traffic). 24 attack types are
found in training set, whereas additional 14 attack types
only exist in testing set. Table I illustrates different attack
types in NSL-KDD dataset. This paper focuses on the
detection of DoS/DDoS attacks.
Journal of Communications Vol. 16, No. 8, August 2021
©2021 Journal of Communications 348
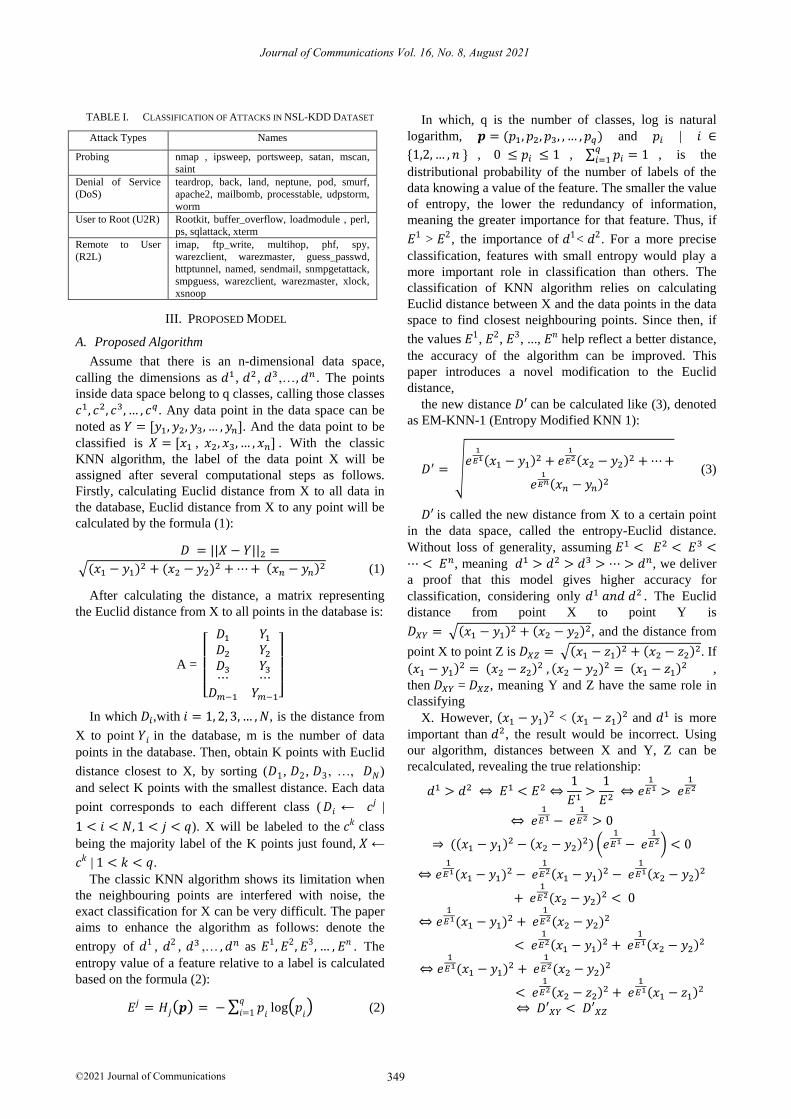
TABLE I. CLASSIFICATION OF ATTACKS IN NSL-KDD DATASET
Attack Types Names
Probing nmap , ipsweep, portsweep, satan, mscan,
saint
Denial of Service
(DoS)
teardrop, back, land, neptune, pod, smurf,
apache2, mailbomb, processtable, udpstorm,
worm
User to Root (U2R) Rootkit, buffer_overflow, loadmodule , perl,
ps, sqlattack, xterm
Remote to User
(R2L)
imap, ftp_write, multihop, phf, spy,
warezclient, warezmaster, guess_passwd,
httptunnel, named, sendmail, snmpgetattack,
smpguess, warezclient, warezmaster, xlock,
xsnoop
III. PROPOSED MODEL
A. Proposed Algorithm
Assume that there is an n-dimensional data space,
calling the dimensions as 𝑑1 , 𝑑2 , 𝑑3 ,…, 𝑑𝑛 . The points
inside data space belong to q classes, calling those classes
𝑐1, 𝑐2, 𝑐3, … , 𝑐𝑞. Any data point in the data space can be
noted as 𝑌 = [𝑦1, 𝑦2, 𝑦3, … , 𝑦𝑛]. And the data point to be
classified is 𝑋 = [𝑥1 , 𝑥2, 𝑥3, … , 𝑥𝑛] . With the classic
KNN algorithm, the label of the data point X will be
assigned after several computational steps as follows.
Firstly, calculating Euclid distance from X to all data in
the database, Euclid distance from X to any point will be
calculated by the formula (1):
𝐷 = ||𝑋 − 𝑌||2 =
√(𝑥1 − 𝑦1)2 + (𝑥2 − 𝑦2)
2 + ⋯+ (𝑥𝑛 − 𝑦𝑛)2 (1)
After calculating the distance, a matrix representing
the Euclid distance from X to all points in the database is:
A =
[
𝐷1
𝐷2
𝐷3⋯
𝐷𝑚−1
𝑌1
𝑌2
𝑌3⋯
𝑌𝑚−1]
In which 𝐷𝑖,with 𝑖 = 1, 2, 3,… , 𝑁, is the distance from
X to point 𝑌𝑖 in the database, m is the number of data
points in the database. Then, obtain K points with Euclid
distance closest to X, by sorting (𝐷1, 𝐷2, 𝐷3, …, 𝐷𝑁)
and select K points with the smallest distance. Each data
point corresponds to each different class (𝐷𝑖 ← 𝑐𝑗 |
1 < 𝑖 < 𝑁, 1 < 𝑗 < 𝑞). X will be labeled to the 𝑐𝑘 class
being the majority label of the K points just found, 𝑋 ←
𝑐𝑘 | 1 < 𝑘 < 𝑞.
The classic KNN algorithm shows its limitation when
the neighbouring points are interfered with noise, the
exact classification for X can be very difficult. The paper
aims to enhance the algorithm as follows: denote the
entropy of 𝑑1 , 𝑑2 , 𝑑3 ,… , 𝑑𝑛 as 𝐸1, 𝐸2, 𝐸3, … , 𝐸𝑛 . The
entropy value of a feature relative to a label is calculated
based on the formula (2):
𝐸𝑗 = 𝐻𝑗(𝒑) = − ∑ 𝑝𝑖log(𝑝
𝑖)𝑞
𝑖=1 (2)
In which, q is the number of classes, log is natural
logarithm, 𝒑 = (𝑝1, 𝑝2, 𝑝3, , … , 𝑝𝑞) and 𝑝𝑖 | 𝑖 ∈
{1,2, … , 𝑛 } , 0 ≤ 𝑝𝑖 ≤ 1 , ∑ 𝑝𝑖𝑞𝑖=1 = 1 , is the
distributional probability of the number of labels of the
data knowing a value of the feature. The smaller the value
of entropy, the lower the redundancy of information,
meaning the greater importance for that feature. Thus, if
𝐸1 > 𝐸2, the importance of 𝑑1< 𝑑2. For a more precise
classification, features with small entropy would play a
more important role in classification than others. The
classification of KNN algorithm relies on calculating
Euclid distance between X and the data points in the data
space to find closest neighbouring points. Since then, if
the values 𝐸1, 𝐸2, 𝐸3, ..., 𝐸𝑛 help reflect a better distance,
the accuracy of the algorithm can be improved. This
paper introduces a novel modification to the Euclid
distance,
the new distance 𝐷′ can be calculated like (3), denoted
as EM-KNN-1 (Entropy Modified KNN 1):
𝐷′ = √𝑒
1
𝐸1(𝑥1 − 𝑦1)2 + 𝑒
1
𝐸2(𝑥2 − 𝑦2)2 + ⋯+
𝑒1
𝐸𝑛(𝑥𝑛 − 𝑦𝑛)2 (3)
𝐷′ is called the new distance from X to a certain point
in the data space, called the entropy-Euclid distance.
Without loss of generality, assuming 𝐸1 < 𝐸2 < 𝐸3 <⋯ < 𝐸𝑛, meaning 𝑑1 > 𝑑2 > 𝑑3 > ⋯ > 𝑑𝑛, we deliver
a proof that this model gives higher accuracy for
classification, considering only 𝑑1 𝑎𝑛𝑑 𝑑2 . The Euclid
distance from point X to point Y is
𝐷𝑋𝑌 = √(𝑥1 − 𝑦1)2 + (𝑥2 − 𝑦2)
2, and the distance from
point X to point Z is 𝐷𝑋𝑍 = √(𝑥1 − 𝑧1)2 + (𝑥2 − 𝑧2)
2. If
(𝑥1 − 𝑦1)2 = (𝑥2 − 𝑧2)
2 , (𝑥2 − 𝑦2)2 = (𝑥1 − 𝑧1)
2 ,
then 𝐷𝑋𝑌 = 𝐷𝑋𝑍, meaning Y and Z have the same role in
classifying
X. However, (𝑥1 − 𝑦1)2 < (𝑥1 − 𝑧1)
2 and 𝑑1 is more
important than 𝑑2, the result would be incorrect. Using
our algorithm, distances between X and Y, Z can be
recalculated, revealing the true relationship:
𝑑1 > 𝑑2 ⇔ 𝐸1 < 𝐸2 ⇔1
𝐸1>
1
𝐸2 ⇔ 𝑒
1𝐸1 > 𝑒
1𝐸2
⇔ 𝑒1𝐸1 − 𝑒
1𝐸2 > 0
⇒ ((𝑥1 − 𝑦1)2 − (𝑥2 − 𝑦2)
2) (𝑒1𝐸1 − 𝑒
1𝐸2) < 0
⇔ 𝑒1𝐸1(𝑥1 − 𝑦1)
2 − 𝑒1𝐸2(𝑥1 − 𝑦1)
2 − 𝑒1𝐸1(𝑥2 − 𝑦2)
2
+ 𝑒1𝐸2(𝑥2 − 𝑦2)
2 < 0
⇔ 𝑒1𝐸1(𝑥1 − 𝑦1)
2 + 𝑒1𝐸2(𝑥2 − 𝑦2)
2
< 𝑒1𝐸2(𝑥1 − 𝑦1)
2 + 𝑒1𝐸1(𝑥2 − 𝑦2)
2
⇔ 𝑒1𝐸1(𝑥1 − 𝑦1)
2 + 𝑒1𝐸2(𝑥2 − 𝑦2)
2
< 𝑒1𝐸2(𝑥2 − 𝑧2)
2 + 𝑒1𝐸1(𝑥1 − 𝑧1)
2
⇔ 𝐷′𝑋𝑌 < 𝐷′𝑋𝑍
Journal of Communications Vol. 16, No. 8, August 2021
©2021 Journal of Communications 349
Therefore, we see that the entropy-Euclid distance
from X to the data point Y is closer than the distance
from X to Z, reflecting the correlation between features
and eliminating potential noises, and thus increase
accuracy of the algorithm.
The entropy-Euclid distance can also be represented in
2 other forms, denoted as EM-KNN-2 and EM-KNN-3:
EM-KNN-2:
𝐷′ = √(
𝑥1−𝑦1
𝐸1 )2
+ (𝑥2−𝑦2
𝐸2 )2
+ ⋯+
(𝑥𝑛−𝑦𝑛
𝐸𝑛 )2 (4)
EM-KNN-3:
𝐷′ = √[(𝑥1 − 𝑦1)𝑒
1
𝐸1]2
+ [(𝑥2 − 𝑦2)𝑒1
𝐸2]2
+ ⋯+
[(𝑥𝑛 − 𝑦𝑛)𝑒1
𝐸𝑛]2
(5)
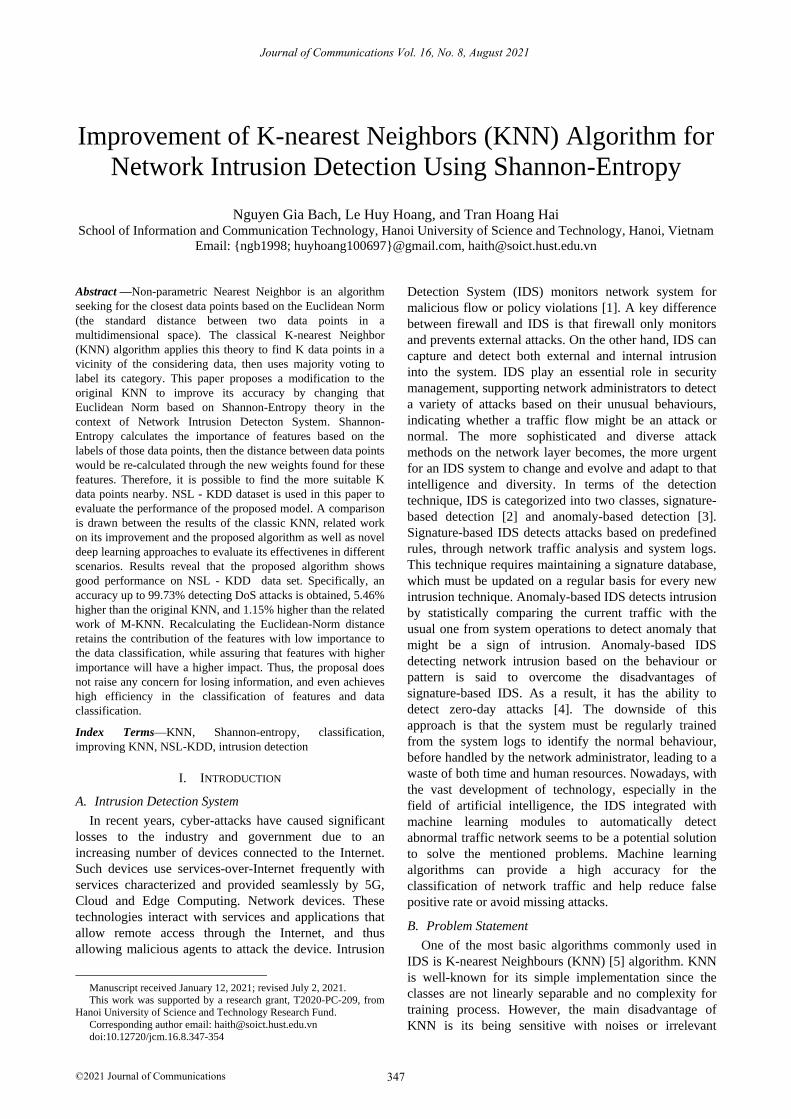
B. Data Processing
In this paper, 80% of NSL-KDD dataset is used for
training and 20% used in testing phase. The steps for pre-
processing data are as follows:
Data digitization: In the dataset there are a lot of
string data, for example protocols include TCP,
UDP, ... So, digitizing the data helps the machine
learning model to understand the data that we have.
Data normalization: Bringing values to a certain
range helps to narrow the loss function of the MLP
algorithm, while reducing data imbalance, when one
feature contains values too large than the other
features, this can make the prediction of the KNN
algorithm will be incorrect.
After preprocessing the data, the data is saved in two
files called Training, which are used to train the model
and Testing is used to test the model. Fig. 1 illustrates the
process.
Fig. 1. Data preprocessing
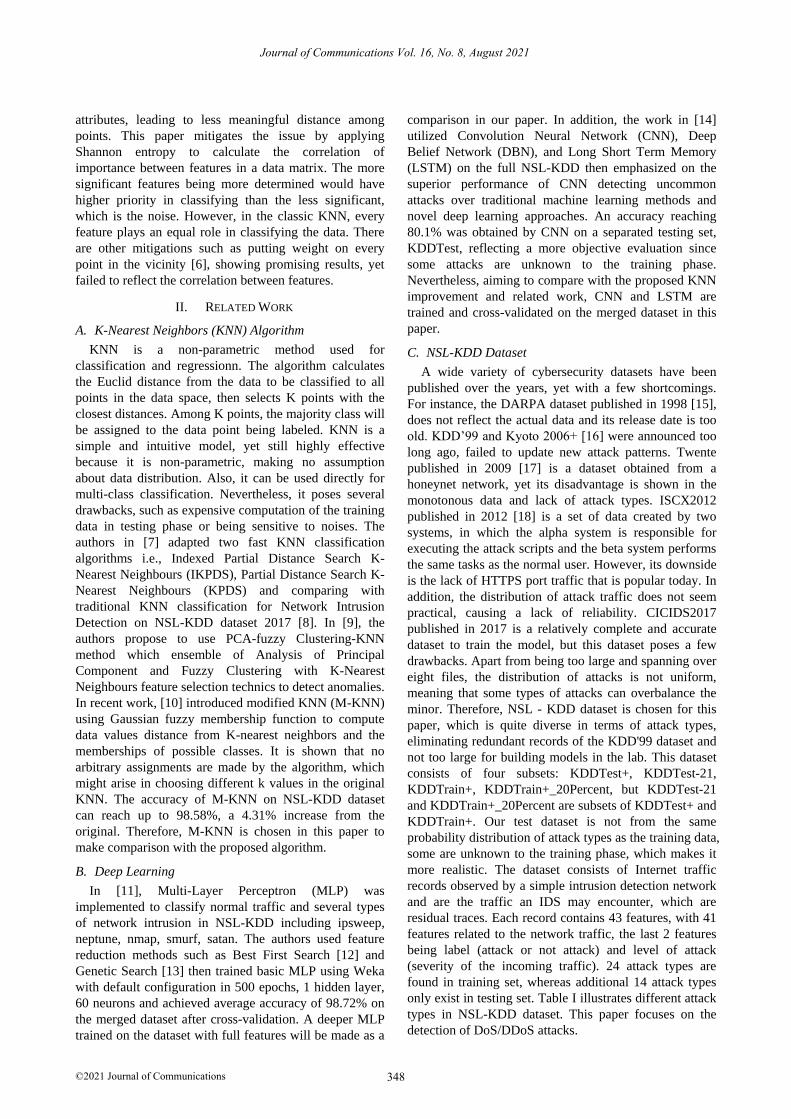
C. Proposal Model
The model is described in details in Fig. 2:
Fig. 2. Proposal model KNN and shannon entropy.
The Training dataset is provided for the proposed
KNN - entropy algorithm to train, then save the model.
Next, pass the Testing dataset to calculate Accuracy,
Precision, Recall, F1 regarding DoS detection and
compare those results with the classic KNN algorithm
and M-KNN.
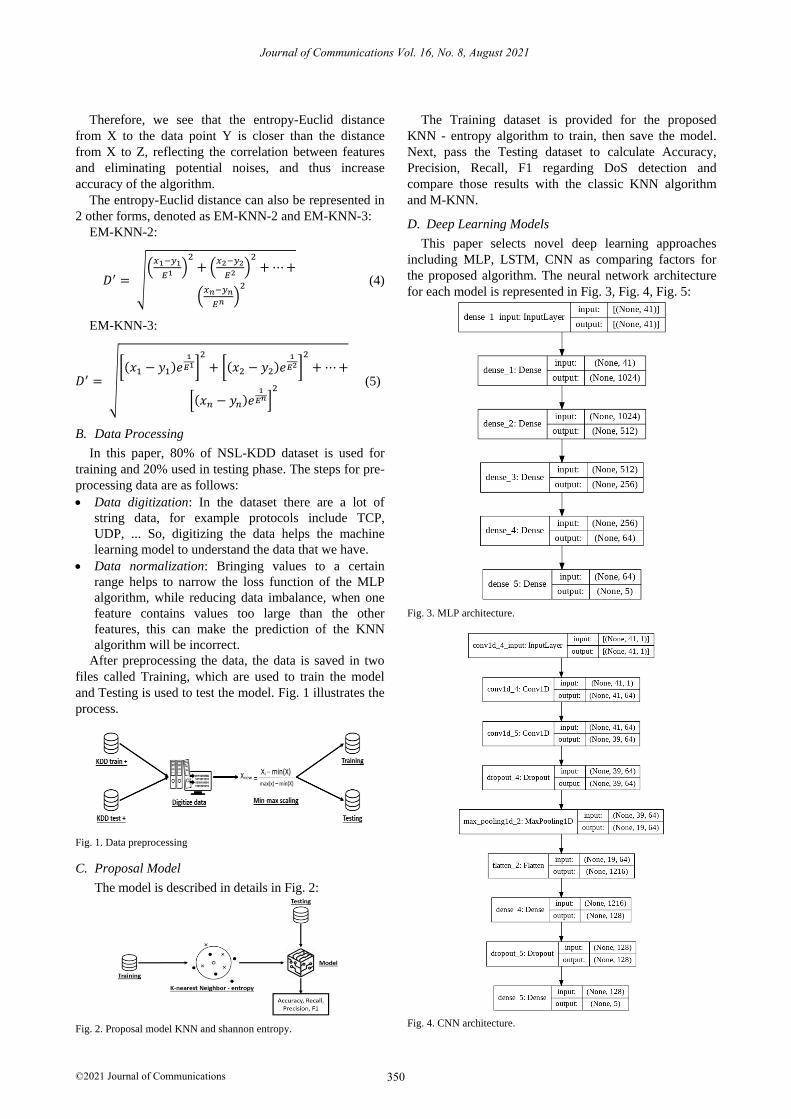
D. Deep Learning Models
This paper selects novel deep learning approaches
including MLP, LSTM, CNN as comparing factors for
the proposed algorithm. The neural network architecture
for each model is represented in Fig. 3, Fig. 4, Fig. 5:
Fig. 3. MLP architecture.
Fig. 4. CNN architecture.
Journal of Communications Vol. 16, No. 8, August 2021
©2021 Journal of Communications 350
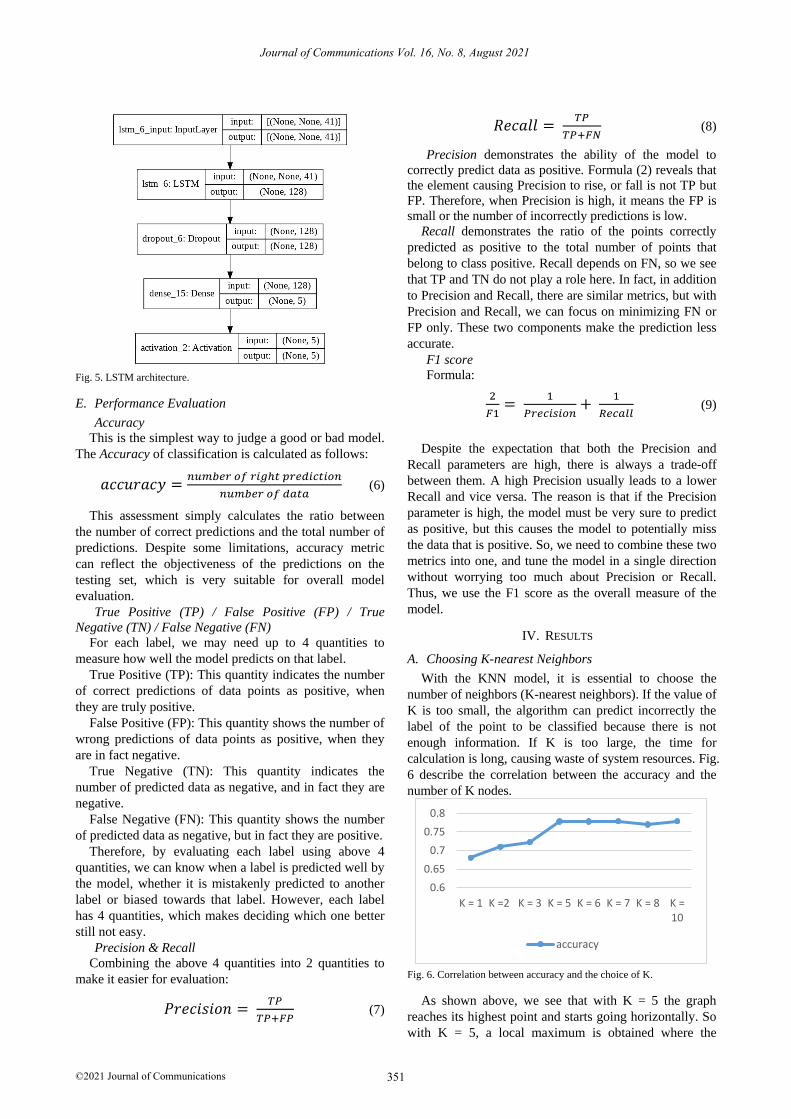
Fig. 5. LSTM architecture.
E. Performance Evaluation
Accuracy
This is the simplest way to judge a good or bad model.
The Accuracy of classification is calculated as follows:
𝑎𝑐𝑐𝑢𝑟𝑎𝑐𝑦 =𝑛𝑢𝑚𝑏𝑒𝑟 𝑜𝑓 𝑟𝑖𝑔ℎ𝑡 𝑝𝑟𝑒𝑑𝑖𝑐𝑡𝑖𝑜𝑛
𝑛𝑢𝑚𝑏𝑒𝑟 𝑜𝑓 𝑑𝑎𝑡𝑎 (6)
This assessment simply calculates the ratio between
the number of correct predictions and the total number of
predictions. Despite some limitations, accuracy metric
can reflect the objectiveness of the predictions on the
testing set, which is very suitable for overall model
evaluation.
True Positive (TP) / False Positive (FP) / True
Negative (TN) / False Negative (FN)
For each label, we may need up to 4 quantities to
measure how well the model predicts on that label.
True Positive (TP): This quantity indicates the number
of correct predictions of data points as positive, when
they are truly positive.
False Positive (FP): This quantity shows the number of
wrong predictions of data points as positive, when they
are in fact negative.
True Negative (TN): This quantity indicates the
number of predicted data as negative, and in fact they are
negative.
False Negative (FN): This quantity shows the number
of predicted data as negative, but in fact they are positive.
Therefore, by evaluating each label using above 4
quantities, we can know when a label is predicted well by
the model, whether it is mistakenly predicted to another
label or biased towards that label. However, each label
has 4 quantities, which makes deciding which one better
still not easy.
Precision & Recall
Combining the above 4 quantities into 2 quantities to
make it easier for evaluation:
𝑃𝑟𝑒𝑐𝑖𝑠𝑖𝑜𝑛 = 𝑇𝑃
𝑇𝑃+𝐹𝑃 (7)
𝑅𝑒𝑐𝑎𝑙𝑙 = 𝑇𝑃
𝑇𝑃+𝐹𝑁 (8)
Precision demonstrates the ability of the model to
correctly predict data as positive. Formula (2) reveals that
the element causing Precision to rise, or fall is not TP but
FP. Therefore, when Precision is high, it means the FP is
small or the number of incorrectly predictions is low.
Recall demonstrates the ratio of the points correctly
predicted as positive to the total number of points that
belong to class positive. Recall depends on FN, so we see
that TP and TN do not play a role here. In fact, in addition
to Precision and Recall, there are similar metrics, but with
Precision and Recall, we can focus on minimizing FN or
FP only. These two components make the prediction less
accurate.
F1 score
Formula:
2
𝐹1=
1
𝑃𝑟𝑒𝑐𝑖𝑠𝑖𝑜𝑛+
1
𝑅𝑒𝑐𝑎𝑙𝑙 (9)
Despite the expectation that both the Precision and
Recall parameters are high, there is always a trade-off
between them. A high Precision usually leads to a lower
Recall and vice versa. The reason is that if the Precision
parameter is high, the model must be very sure to predict
as positive, but this causes the model to potentially miss
the data that is positive. So, we need to combine these two
metrics into one, and tune the model in a single direction
without worrying too much about Precision or Recall.
Thus, we use the F1 score as the overall measure of the
model.
IV. RESULTS
A. Choosing K-nearest Neighbors
With the KNN model, it is essential to choose the
number of neighbors (K-nearest neighbors). If the value of
K is too small, the algorithm can predict incorrectly the
label of the point to be classified because there is not
enough information. If K is too large, the time for
calculation is long, causing waste of system resources. Fig.
6 describe the correlation between the accuracy and the
number of K nodes.
Fig. 6. Correlation between accuracy and the choice of K.
As shown above, we see that with K = 5 the graph
reaches its highest point and starts going horizontally. So
with K = 5, a local maximum is obtained where the
0.6
0.65
0.7
0.75
0.8
K = 1 K =2 K = 3 K = 5 K = 6 K = 7 K = 8 K =10
accuracy
Journal of Communications Vol. 16, No. 8, August 2021
©2021 Journal of Communications 351
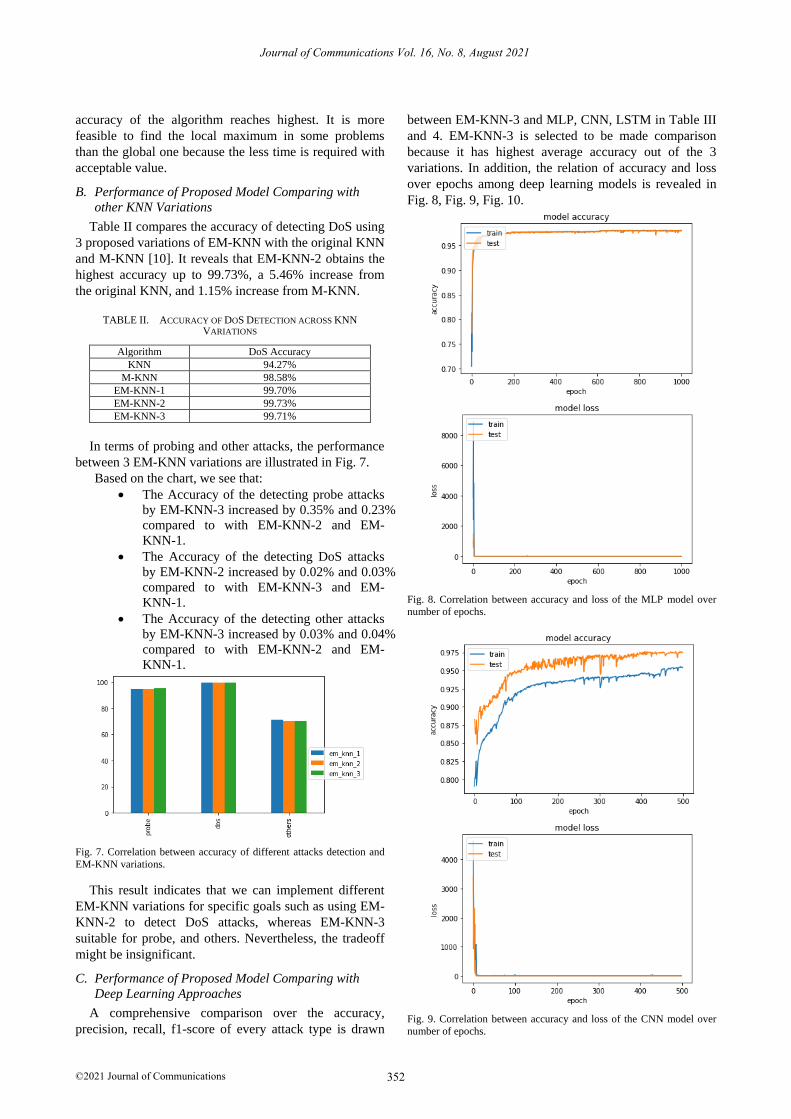
accuracy of the algorithm reaches highest. It is more
feasible to find the local maximum in some problems
than the global one because the less time is required with
acceptable value.
B. Performance of Proposed Model Comparing with
other KNN Variations
Table II compares the accuracy of detecting DoS using
3 proposed variations of EM-KNN with the original KNN
and M-KNN [10]. It reveals that EM-KNN-2 obtains the
highest accuracy up to 99.73%, a 5.46% increase from
the original KNN, and 1.15% increase from M-KNN.
TABLE II. ACCURACY OF DOS DETECTION ACROSS KNN
VARIATIONS
Algorithm DoS Accuracy
KNN 94.27%
M-KNN 98.58%
EM-KNN-1 99.70%
EM-KNN-2 99.73%
EM-KNN-3 99.71%
In terms of probing and other attacks, the performance
between 3 EM-KNN variations are illustrated in Fig. 7.
Based on the chart, we see that:
The Accuracy of the detecting probe attacks
by EM-KNN-3 increased by 0.35% and 0.23%
compared to with EM-KNN-2 and EM-
KNN-1.
The Accuracy of the detecting DoS attacks
by EM-KNN-2 increased by 0.02% and 0.03%
compared to with EM-KNN-3 and EM-
KNN-1.
The Accuracy of the detecting other attacks
by EM-KNN-3 increased by 0.03% and 0.04%
compared to with EM-KNN-2 and EM-
KNN-1.
Fig. 7. Correlation between accuracy of different attacks detection and
EM-KNN variations.
This result indicates that we can implement different
EM-KNN variations for specific goals such as using EM-
KNN-2 to detect DoS attacks, whereas EM-KNN-3
suitable for probe, and others. Nevertheless, the tradeoff
might be insignificant.
C. Performance of Proposed Model Comparing with
Deep Learning Approaches
A comprehensive comparison over the accuracy,
precision, recall, f1-score of every attack type is drawn
between EM-KNN-3 and MLP, CNN, LSTM in Table III
and 4. EM-KNN-3 is selected to be made comparison
because it has highest average accuracy out of the 3
variations. In addition, the relation of accuracy and loss
over epochs among deep learning models is revealed in
Fig. 8, Fig. 9, Fig. 10.
Fig. 8. Correlation between accuracy and loss of the MLP model over
number of epochs.
Fig. 9. Correlation between accuracy and loss of the CNN model over
number of epochs.
Journal of Communications Vol. 16, No. 8, August 2021
©2021 Journal of Communications 352
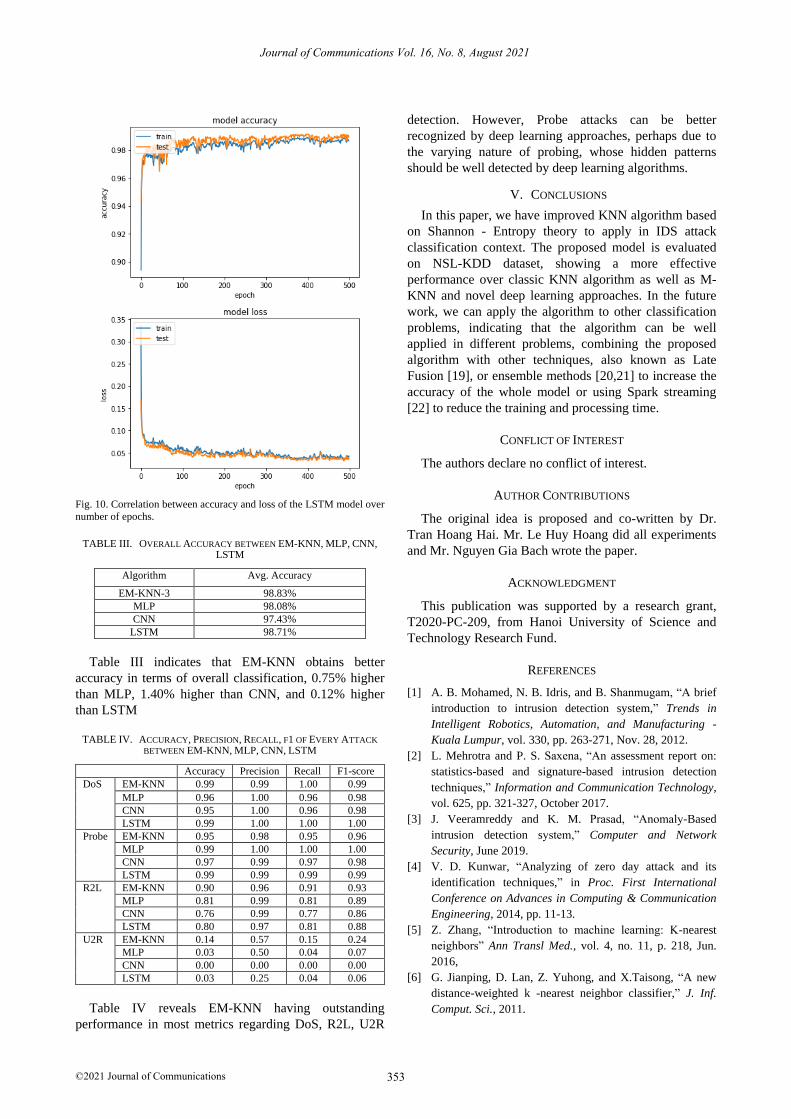
Fig. 10. Correlation between accuracy and loss of the LSTM model over
number of epochs.
TABLE III. OVERALL ACCURACY BETWEEN EM-KNN, MLP, CNN, LSTM
Algorithm Avg. Accuracy
EM-KNN-3 98.83%
MLP 98.08%
CNN 97.43%
LSTM 98.71%
Table III indicates that EM-KNN obtains better
accuracy in terms of overall classification, 0.75% higher
than MLP, 1.40% higher than CNN, and 0.12% higher
than LSTM
TABLE IV. ACCURACY, PRECISION, RECALL, F1 OF EVERY ATTACK
BETWEEN EM-KNN, MLP, CNN, LSTM
Accuracy Precision Recall F1-score
DoS EM-KNN 0.99 0.99 1.00 0.99
MLP 0.96 1.00 0.96 0.98
CNN 0.95 1.00 0.96 0.98
LSTM 0.99 1.00 1.00 1.00
Probe EM-KNN 0.95 0.98 0.95 0.96
MLP 0.99 1.00 1.00 1.00
CNN 0.97 0.99 0.97 0.98
LSTM 0.99 0.99 0.99 0.99
R2L EM-KNN 0.90 0.96 0.91 0.93
MLP 0.81 0.99 0.81 0.89
CNN 0.76 0.99 0.77 0.86
LSTM 0.80 0.97 0.81 0.88
U2R EM-KNN 0.14 0.57 0.15 0.24
MLP 0.03 0.50 0.04 0.07
CNN 0.00 0.00 0.00 0.00
LSTM 0.03 0.25 0.04 0.06
Table IV reveals EM-KNN having outstanding
performance in most metrics regarding DoS, R2L, U2R
detection. However, Probe attacks can be better
recognized by deep learning approaches, perhaps due to
the varying nature of probing, whose hidden patterns
should be well detected by deep learning algorithms.
V. CONCLUSIONS
In this paper, we have improved KNN algorithm based
on Shannon - Entropy theory to apply in IDS attack
classification context. The proposed model is evaluated
on NSL-KDD dataset, showing a more effective
performance over classic KNN algorithm as well as M-
KNN and novel deep learning approaches. In the future
work, we can apply the algorithm to other classification
problems, indicating that the algorithm can be well
applied in different problems, combining the proposed
algorithm with other techniques, also known as Late
Fusion [19], or ensemble methods [20,21] to increase the
accuracy of the whole model or using Spark streaming
[22] to reduce the training and processing time.
CONFLICT OF INTEREST
The authors declare no conflict of interest.
AUTHOR CONTRIBUTIONS
The original idea is proposed and co-written by Dr.
Tran Hoang Hai. Mr. Le Huy Hoang did all experiments
and Mr. Nguyen Gia Bach wrote the paper.
ACKNOWLEDGMENT
This publication was supported by a research grant,
T2020-PC-209, from Hanoi University of Science and
Technology Research Fund.
REFERENCES
[1] A. B. Mohamed, N. B. Idris, and B. Shanmugam, “A brief
introduction to intrusion detection system,” Trends in
Intelligent Robotics, Automation, and Manufacturing -
Kuala Lumpur, vol. 330, pp. 263-271, Nov. 28, 2012.
[2] L. Mehrotra and P. S. Saxena, “An assessment report on:
statistics-based and signature-based intrusion detection
techniques,” Information and Communication Technology,
vol. 625, pp. 321-327, October 2017.
[3] J. Veeramreddy and K. M. Prasad, “Anomaly-Based
intrusion detection system,” Computer and Network
Security, June 2019.
[4] V. D. Kunwar, “Analyzing of zero day attack and its
identification techniques,” in Proc. First International
Conference on Advances in Computing & Communication
Engineering, 2014, pp. 11-13.
[5] Z. Zhang, “Introduction to machine learning: K-nearest
neighbors” Ann Transl Med., vol. 4, no. 11, p. 218, Jun.
2016,
[6] G. Jianping, D. Lan, Z. Yuhong, and X.Taisong, “A new
distance-weighted k -nearest neighbor classifier,” J. Inf.
Comput. Sci., 2011.
Journal of Communications Vol. 16, No. 8, August 2021
©2021 Journal of Communications 353
[7] B.Bobba and S. Kailasam, “Fast kNN classifiers for
network intrusion detection system,” Indian Journal of
Science and Technology, vol. 10, no. 14, April 2017.
[8] H. Benaddi, K. Ibrahimi, and A. Benslimane, “Improving
the intrusion detection system for NSL-KDD dataset based
on PCA-Fuzzy Clustering-KNN,” in Proc. 6th
International Conference on Wireless Networks and
Mobile Communications (WINCOM), Marrakesh, Morocco,
2018, pp. 1-6.
[9] NSL-KDD data set for network-based intrusion detection
systems. [Online]. Available:
http://nsl.cs.unb.ca/KDD/NSLKDD.html, March 2009.
[10] B. Senthilnayaki, K. Venkatalakshmi, and A. Kannan,
“Intrusion detection system using fuzzy rough set feature
selection and modified KNN classifier,” Int. Arab J. Inf.
Technol., 16, 746-753, 2019.
[11] S. Alaa and A. Amneh, “A professional comparison of
C4.5, MLP, SVM for network intrusion detection based
feature analysis,” ICGST Journal of Computer Networks
and Internet Research, 2015.
[12] X. Lei, Y. Pingfan, and C. Tong, “Best first strategy for
feature selection,” in Proc. International Conference on
Pattern Recognition, 1988, pp. 706-708.
[13] M. Héctor and Y. Georgios, “Genetic search feature
selection for affective modeling: A case study on reported
preferences,” in Proc. 3rd International Workshop on
Affective Interaction in Natural Environments, 2010.
[14] D. Yalei and Z. Yuqing, “Intrusion detection system for
NSL-KDD dataset using convolutional neural networks,”
in Proc. 2nd International Conference on Computer
Science and Artificial Intelligence, 2018, pp. 81-85.
[15] T. Ciz, S. Vishwas, and B. Narayanaswamy, “Usefulness
of DARPA dataset for intrusion detection system
evaluation,” in Proc. SPIE 6973, Data Mining, Intrusion
Detection, Information Assurance, and Data Networks
Security, 2008.
[16] D. D. Protić, “Review of KDD Cup '99, NSL-KDD and
Kyoto 2006+ datasets,” Vojnotehnicki Glasnik/Military
Technical Courier, vol. 66, no. 3, pp. 580-596, 2018.
[17] A. Sperotto, R. Sadre, F. V. Vliet, and A. Pras, “A labeled
data set for flow-based intrusion detection,” in Proc. IP
Operations and Management (IPOM 2009), Lecture Notes
in Computer Science, 2009, vol. 5843, pp 39-50.
[18] P. S. Bhattacharjee, A. K. M. Fujail, and S. A. Begum, “A
comparison of intrusion detection by K-Means and fuzzy
c-means clustering algorithm over the NSL-KDD Dataset,”
in Proc. IEEE International Conference on Computational
Intelligence and Computing Research, 2017, pp. 1-6.
[19] T. H. Hai, L. H. Hoang, and E. Huh, “Network anomaly
detection based on late fusion of several machine learning
models,” International Journal of Computer Network and
Communications, 2020.
[20] Y. Zhou, G. Cheng, S. Jiang, and M. Dai, “Building an
efficient intrusion detection system based on feature
selection and ensemble classifier,” arXiv e-prints, 2019.
[21] Y. Xiao, J. Wu, Z. Lin, and X. Zhao, “A deep learning-
based multi-model ensemble method for cancer prediction,”
Computer Methods and Programs in Biomedicine, vol. 153,
pp. 1-9, 2018.
[22] T. H. Hai and N. T. Khiem, “Architecture for IDS log
processing using spark streaming,” in Proc. 2nd
International Conference on Electrical, Communication
and Computer Engineering (ICECCE 2020), Istanbul,
Turkey, 2020.
Copyright © 2021 by the authors. This is an open access article
distributed under the Creative Commons Attribution License
(CC BY-NC-ND 4.0), which permits use, distribution and
reproduction in any medium, provided that the article is
properly cited, the use is non-commercial and no modifications
or adaptations are made.
Nguyen Gia Bach is pursuing his B.S
degree in Computer Science from Hanoi
University of Science and Technology,
Vietnam, expected June 2021. His
scientific interests are Machine Learning,
Deep Learning, Network Security, and
Intrusion Detection & Prevention System.
Le Huy Hoang received his B.S degree
in Information Security from Hanoi
University of Science and Technology,
Vietnam in 2020. His interesting research
areas are network security, machine
learning, and network intrusion detection
system.
Tran Hoang Hai received his B.S
degree from Hanoi University of Science
and Technology in Vietnam and M.S
degree in Computer Engineering from
Kyung Hee University, South Korea in
2008. Since then, he has worked at
INRIA joint Alcatel-Lucent Bell
Laboratory and got his Ph.D degree in
computer science from University of Rennes 1 (France) in 2012.
His interesting research areas are network security, routing and
resource allocation mechanisms in the next generation Internet,
and applied game theory to communication network. He has
published several papers on those issues. He is currently
Assistant Professor at Department of Data Communication &
Computer Networks, School of Information & Communication
Technology, Hanoi University of Science and Technology,
Vietnam.
Journal of Communications Vol. 16, No. 8, August 2021
©2021 Journal of Communications 354