importance of background climate in determining impact of land-cover change on regional climate
TRANSCRIPT
LETTERSPUBLISHED ONLINE: 20 NOVEMBER 2011 | DOI: 10.1038/NCLIMATE1294
Importance of background climate in determiningimpact of land-cover change on regional climateA. J. Pitman1*, F. B. Avila1, G. Abramowitz1, Y. P. Wang2, S. J. Phipps1 and N. de Noblet-Ducoudré3
Humans have modified the Earth’s climate through emissionsof greenhouse gases and through land-use and land-coverchange (LULCC)1. Increasing concentrations of greenhousegases in the atmosphere warm the mid-latitudes more thanthe tropics, in part owing to a reduced snow–albedo feedbackas snow cover decreases2. Higher concentration of carbondioxide also increases precipitation in many regions1, as aresult of an intensification of the hydrological cycle2. Thebiophysical effects of LULCC since pre-industrial times haveprobably cooled temperate and boreal regions and warmedsome tropical regions3. Here we use a climate model to showthat how snow and rainfall change under increased greenhousegases dominates how LULCC affects regional temperature.Increased greenhouse-gas-driven changes in snow and rainfallaffect the snow–albedo feedback and the supply of water,which in turn limits evaporation. These changes largely controlthe net impact of LULCC on regional climate. Our resultsshow that capturing whether future biophysical changes dueto LULCC warm or cool a specific region therefore requiresan accurate simulation of changes in snow cover and rainfallgeographically coincident with regions of LULCC. This is achallenge to current climate models, but also provides potentialfor further improving detection and attribution methods.
Although many studies of the global and regional biophysicalimpacts of LULCC have been conducted4–8, the impact of LULCCon regional-scale climate remains quite uncertain6,7.Most probably,LULCC in the form of deforestation acts to cool mid- and highlatitudes3, particularly in the winter and spring, and to warmthe tropics and sub-tropics. The biophysical impact of LULCC isrealized through three mechanisms: (1) an increased albedo andhence a reduction in net radiation9 (crops are commonly morereflective than forests); (2) an amplification of the positive snow–albedo feedback (forests mask snow on the ground more effectivelythan crops and pasture)10; and (3) a change in how net radiationis partitioned between latent heat and sensible heat fluxes (cropsand pasture have less capacity to sustain high latent heat fluxes,compared with forests, when evaporative demand is high). LULCCin mid- and high latitudes tends to cool because mechanisms (1)and (2) dominate in winter and spring owing to snow. In summer,in the absence of snow,mechanism (3) can be significant ifmoisturelimits evaporation. In the tropics, LULCC tends to be associatedwith warming and drying3 because mechanism (3) dominates andsensible heat fluxes increase, warming the atmosphere. The relativedominance of these mechanisms depends on the amount of snowand the amount and seasonality of precipitation. Less snow in a
1ARC Centre of Excellence for Climate System Science and Climate Change Research Centre, University of New South Wales, Sydney 2052, Australia, 2TheCentre for Australian Weather and Climate Research, CSIRO Marine and Atmospheric Research, Private Bag 1, Aspendale, Victoria 3195, Australia,3Laboratoire des Sciences du Climat et de l’Environnement, Unité Mixte CEA-CNRS-UVSQ, 91191 Gif-sur-Yvette cédex, France.*e-mail: [email protected].
warmer world would weaken the positive snow–albedo feedback,reduce the influence of mechanism (2) and partially negate coolingfrom LULCC at high latitudes. In all regions, mechanism (3) canbe masked by higher precipitation because this would reduce thelikelihood of moisture stress limiting the latent heat flux, tending tominimize increases in sensible heat fluxes.
There is a conflicting signal in these two drivers of climate.LULCC tends to cool mid- and high latitudes and potentially offsetsCO2-induced warming whereas LULCC adds to CO2-inducedwarming in the tropics. Our focus here is whether these tendenciesare sustained as the seasonal extent of snow decreases and thehydrological cycle intensifies2 in the future under increased CO2.Does the regional role of LULCC change significantly under futureclimate conditions? We use a climate model to examine howthe changing climate associated with increased CO2 affects thebiophysical impact of LULCC. The LULCC perturbation representsthe expansion of crops and pasture until 2000 (SupplementaryFig. S1). We do not increase the scale of LULCC into the future.We use a state-of-the-art land-surface scheme11, which has beenextensively evaluated11–13, coupled to an atmospheric model thatcan be integrated for multiple centuries14. We use fixed sea surfacetemperatures (SSTs) representative of an equilibrated climate atpre-industrial CO2 concentrations (280 ppmv) and doubled CO2concentrations (560 ppmv). Each simulation is conducted from aninitial stable state for 300 years, providing a stable climatology fortwo CO2 concentrations, each with land cover representative ofboth a natural and a current state.
We focus on the eastern United States, Eurasia and Asia. Becausethe impact of LULCC in isolation from other forcings on large-scaleclimate is becoming better known, we describe the impact ofLULCC on climate at 1×CO2 and 2×CO2 (see SupplementaryInformation). We focus on the reasons for a change in the impactof LULCC due to the change in CO2 in March–April–May (MAM)and June–July–August (JJA). Results for other seasons are in theSupplementary Information.
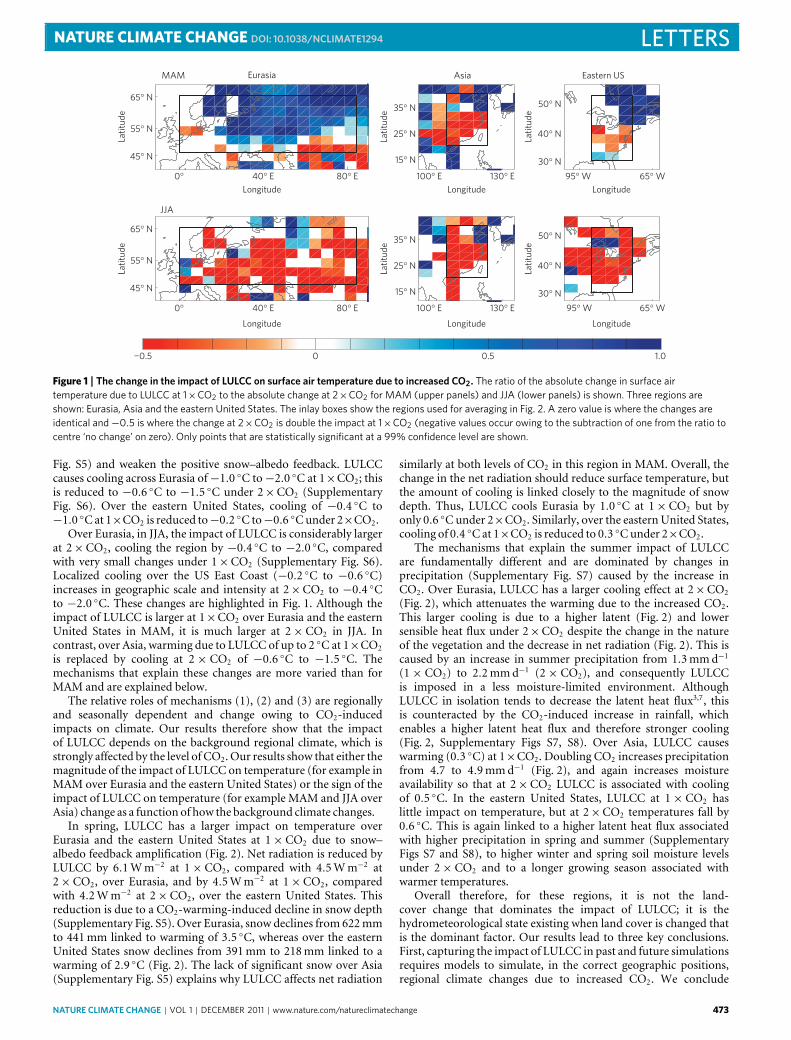
Figure 1 shows the ratio of the impact of LULCC at 1×CO2 tothe impact at 2×CO2 (minus one so that no change is representedby zero) on surface air temperature. The seasonal version of thisfigure is shown in Supplementary Fig. S2, and for precipitationin Supplementary Fig. S3. There is a substantial reduction in theimpact of LULCC on surface air temperature over Eurasia, easternUnited States and northern Asia in MAM under 2×CO2 relativeto 1×CO2. This is due to a much smaller change in net radiationunder 2×CO2 due to LULCC (Supplementary Fig. S4), becausethe warmer temperatures decrease the snow depth (Supplementary
472 NATURE CLIMATE CHANGE | VOL 1 | DECEMBER 2011 | www.nature.com/natureclimatechange
NATURE CLIMATE CHANGE DOI: 10.1038/NCLIMATE1294 LETTERS
0° 40° E 100° E 130° E 95° W 65° W80° E
0° 40° E 80° E
MAM Eurasia Asia Eastern US
0.5
JJA
0¬0.5 1.0
65° N
55° N
45° N
35° N
25° N
15° N
50° N
40° N
30° N
95° W 65° W
50° N
40° N
30° N
100° E 130° E
35° N
25° N
15° N
65° N
55° N
45° N
Latit
ude
Latit
ude
Latit
ude
Latit
ude
Latit
ude
Latit
ude
Longitude Longitude Longitude
Longitude Longitude Longitude
Figure 1 | The change in the impact of LULCC on surface air temperature due to increased CO2. The ratio of the absolute change in surface airtemperature due to LULCC at 1×CO2 to the absolute change at 2×CO2 for MAM (upper panels) and JJA (lower panels) is shown. Three regions areshown: Eurasia, Asia and the eastern United States. The inlay boxes show the regions used for averaging in Fig. 2. A zero value is where the changes areidentical and−0.5 is where the change at 2×CO2 is double the impact at 1×CO2 (negative values occur owing to the subtraction of one from the ratio tocentre ‘no change’ on zero). Only points that are statistically significant at a 99% confidence level are shown.
Fig. S5) and weaken the positive snow–albedo feedback. LULCCcauses cooling across Eurasia of−1.0 ◦C to−2.0 ◦C at 1×CO2; thisis reduced to −0.6 ◦C to −1.5 ◦C under 2×CO2 (SupplementaryFig. S6). Over the eastern United States, cooling of −0.4 ◦C to−1.0 ◦Cat 1×CO2 is reduced to−0.2 ◦C to−0.6 ◦Cunder 2×CO2.
Over Eurasia, in JJA, the impact of LULCC is considerably largerat 2×CO2, cooling the region by −0.4 ◦C to −2.0 ◦C, comparedwith very small changes under 1×CO2 (Supplementary Fig. S6).Localized cooling over the US East Coast (−0.2 ◦C to −0.6 ◦C)increases in geographic scale and intensity at 2×CO2 to −0.4 ◦Cto −2.0 ◦C. These changes are highlighted in Fig. 1. Although theimpact of LULCC is larger at 1×CO2 over Eurasia and the easternUnited States in MAM, it is much larger at 2×CO2 in JJA. Incontrast, over Asia, warming due to LULCC of up to 2 ◦C at 1×CO2is replaced by cooling at 2× CO2 of −0.6 ◦C to −1.5 ◦C. Themechanisms that explain these changes are more varied than forMAM and are explained below.
The relative roles of mechanisms (1), (2) and (3) are regionallyand seasonally dependent and change owing to CO2-inducedimpacts on climate. Our results therefore show that the impactof LULCC depends on the background regional climate, which isstrongly affected by the level of CO2. Our results show that either themagnitude of the impact of LULCC on temperature (for example inMAM over Eurasia and the eastern United States) or the sign of theimpact of LULCC on temperature (for example MAM and JJA overAsia) change as a function of how the background climate changes.
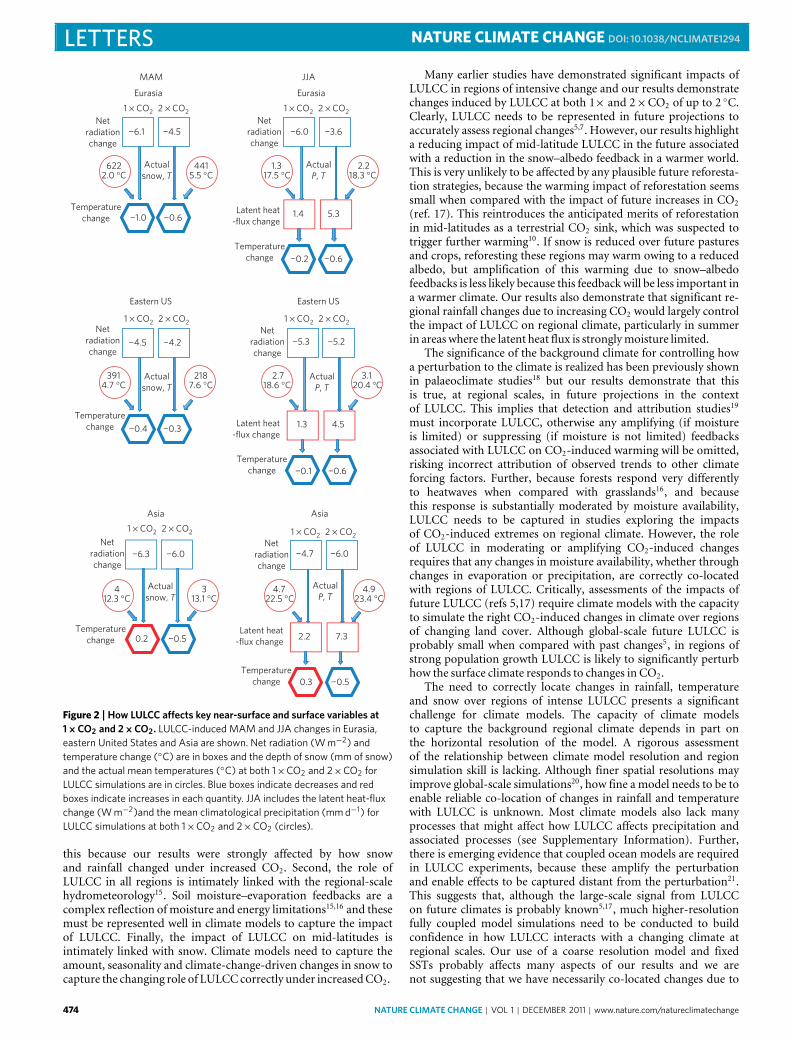
In spring, LULCC has a larger impact on temperature overEurasia and the eastern United States at 1×CO2 due to snow–albedo feedback amplification (Fig. 2). Net radiation is reduced byLULCC by 6.1Wm−2 at 1×CO2, compared with 4.5Wm−2 at2×CO2, over Eurasia, and by 4.5Wm−2 at 1×CO2, comparedwith 4.2Wm−2 at 2×CO2, over the eastern United States. Thisreduction is due to a CO2-warming-induced decline in snow depth(Supplementary Fig. S5). Over Eurasia, snow declines from 622mmto 441mm linked to warming of 3.5 ◦C, whereas over the easternUnited States snow declines from 391mm to 218mm linked to awarming of 2.9 ◦C (Fig. 2). The lack of significant snow over Asia(Supplementary Fig. S5) explains why LULCC affects net radiation
similarly at both levels of CO2 in this region in MAM. Overall, thechange in the net radiation should reduce surface temperature, butthe amount of cooling is linked closely to the magnitude of snowdepth. Thus, LULCC cools Eurasia by 1.0 ◦C at 1×CO2 but byonly 0.6 ◦Cunder 2×CO2. Similarly, over the easternUnited States,cooling of 0.4 ◦Cat 1×CO2 is reduced to 0.3 ◦Cunder 2×CO2.
The mechanisms that explain the summer impact of LULCCare fundamentally different and are dominated by changes inprecipitation (Supplementary Fig. S7) caused by the increase inCO2. Over Eurasia, LULCC has a larger cooling effect at 2×CO2(Fig. 2), which attenuates the warming due to the increased CO2.This larger cooling is due to a higher latent (Fig. 2) and lowersensible heat flux under 2×CO2 despite the change in the natureof the vegetation and the decrease in net radiation (Fig. 2). This iscaused by an increase in summer precipitation from 1.3mmd−1(1× CO2) to 2.2mmd−1 (2× CO2), and consequently LULCCis imposed in a less moisture-limited environment. AlthoughLULCC in isolation tends to decrease the latent heat flux3,7, thisis counteracted by the CO2-induced increase in rainfall, whichenables a higher latent heat flux and therefore stronger cooling(Fig. 2, Supplementary Figs S7, S8). Over Asia, LULCC causeswarming (0.3 ◦C) at 1×CO2. Doubling CO2 increases precipitationfrom 4.7 to 4.9mmd−1 (Fig. 2), and again increases moistureavailability so that at 2×CO2 LULCC is associated with coolingof 0.5 ◦C. In the eastern United States, LULCC at 1× CO2 haslittle impact on temperature, but at 2×CO2 temperatures fall by0.6 ◦C. This is again linked to a higher latent heat flux associatedwith higher precipitation in spring and summer (SupplementaryFigs S7 and S8), to higher winter and spring soil moisture levelsunder 2× CO2 and to a longer growing season associated withwarmer temperatures.
Overall therefore, for these regions, it is not the land-cover change that dominates the impact of LULCC; it is thehydrometeorological state existing when land cover is changed thatis the dominant factor. Our results lead to three key conclusions.First, capturing the impact of LULCC in past and future simulationsrequires models to simulate, in the correct geographic positions,regional climate changes due to increased CO2. We conclude
NATURE CLIMATE CHANGE | VOL 1 | DECEMBER 2011 | www.nature.com/natureclimatechange 473
LETTERS NATURE CLIMATE CHANGE DOI: 10.1038/NCLIMATE1294
Eurasia Eurasia
Temperature change
Temperature change
Temperature change
Temperature change
AsiaAsia
MAM JJA
¬1.0
1 × CO2 2 × CO2 1 × CO2 2 × CO2
1 × CO2 2 × CO2 1 × CO2 2 × CO2
1 × CO2 2 × CO2 1 × CO2 2 × CO2
Net radiation change
Net radiation change
Net radiation change
Net radiation change
Net radiation change
Net radiation change
¬6.1 ¬6.0 ¬3.6
¬0.2 ¬0.6
¬0.1 ¬0.6
¬0.4 ¬0.3
¬4.5
6222.0 °C
4415.5 °C
3914.7 °C
2187.6 °C
412.3 °C
4.722.5 °C
4.923.4 °C
313.1 °C
2.718.6 °C
3.120.4 °C
1.317.5 °C
2.218.3 °C
Actual snow, T
Actual P, T
Actual snow, T
Actual snow, T
Actual P, T
Actual P, T
¬0.6Latent heat
-flux change
Temperature change
Temperature change
Latent heat -flux change
Latent heat -flux change
1.4 5.3
¬4.5 ¬4.2
¬6.3 ¬6.0 ¬4.7 ¬6.0
¬5.3 ¬5.2
Eastern US Eastern US
1.3 4.5
0.2 ¬0.5
¬0.5
2.2 7.3
0.3
Figure 2 |How LULCC affects key near-surface and surface variables at1×CO2 and 2×CO2. LULCC-induced MAM and JJA changes in Eurasia,eastern United States and Asia are shown. Net radiation (W m−2) andtemperature change (◦C) are in boxes and the depth of snow (mm of snow)and the actual mean temperatures (◦C) at both 1×CO2 and 2×CO2 forLULCC simulations are in circles. Blue boxes indicate decreases and redboxes indicate increases in each quantity. JJA includes the latent heat-fluxchange (W m−2)and the mean climatological precipitation (mm d−1) forLULCC simulations at both 1×CO2 and 2×CO2 (circles).
this because our results were strongly affected by how snowand rainfall changed under increased CO2. Second, the role ofLULCC in all regions is intimately linked with the regional-scalehydrometeorology15. Soil moisture–evaporation feedbacks are acomplex reflection of moisture and energy limitations15,16 and thesemust be represented well in climate models to capture the impactof LULCC. Finally, the impact of LULCC on mid-latitudes isintimately linked with snow. Climate models need to capture theamount, seasonality and climate-change-driven changes in snow tocapture the changing role of LULCCcorrectly under increasedCO2.
Many earlier studies have demonstrated significant impacts ofLULCC in regions of intensive change and our results demonstratechanges induced by LULCC at both 1× and 2×CO2 of up to 2 ◦C.Clearly, LULCC needs to be represented in future projections toaccurately assess regional changes5,7. However, our results highlighta reducing impact of mid-latitude LULCC in the future associatedwith a reduction in the snow–albedo feedback in a warmer world.This is very unlikely to be affected by any plausible future reforesta-tion strategies, because the warming impact of reforestation seemssmall when compared with the impact of future increases in CO2(ref. 17). This reintroduces the anticipated merits of reforestationin mid-latitudes as a terrestrial CO2 sink, which was suspected totrigger further warming10. If snow is reduced over future pasturesand crops, reforesting these regions may warm owing to a reducedalbedo, but amplification of this warming due to snow–albedofeedbacks is less likely because this feedback will be less important ina warmer climate. Our results also demonstrate that significant re-gional rainfall changes due to increasing CO2 would largely controlthe impact of LULCC on regional climate, particularly in summerin areas where the latent heat flux is stronglymoisture limited.
The significance of the background climate for controlling howa perturbation to the climate is realized has been previously shownin palaeoclimate studies18 but our results demonstrate that thisis true, at regional scales, in future projections in the contextof LULCC. This implies that detection and attribution studies19must incorporate LULCC, otherwise any amplifying (if moistureis limited) or suppressing (if moisture is not limited) feedbacksassociated with LULCC on CO2-induced warming will be omitted,risking incorrect attribution of observed trends to other climateforcing factors. Further, because forests respond very differentlyto heatwaves when compared with grasslands16, and becausethis response is substantially moderated by moisture availability,LULCC needs to be captured in studies exploring the impactsof CO2-induced extremes on regional climate. However, the roleof LULCC in moderating or amplifying CO2-induced changesrequires that any changes in moisture availability, whether throughchanges in evaporation or precipitation, are correctly co-locatedwith regions of LULCC. Critically, assessments of the impacts offuture LULCC (refs 5,17) require climate models with the capacityto simulate the right CO2-induced changes in climate over regionsof changing land cover. Although global-scale future LULCC isprobably small when compared with past changes5, in regions ofstrong population growth LULCC is likely to significantly perturbhow the surface climate responds to changes in CO2.
The need to correctly locate changes in rainfall, temperatureand snow over regions of intense LULCC presents a significantchallenge for climate models. The capacity of climate modelsto capture the background regional climate depends in part onthe horizontal resolution of the model. A rigorous assessmentof the relationship between climate model resolution and regionsimulation skill is lacking. Although finer spatial resolutions mayimprove global-scale simulations20, how fine a model needs to be toenable reliable co-location of changes in rainfall and temperaturewith LULCC is unknown. Most climate models also lack manyprocesses that might affect how LULCC affects precipitation andassociated processes (see Supplementary Information). Further,there is emerging evidence that coupled ocean models are requiredin LULCC experiments, because these amplify the perturbationand enable effects to be captured distant from the perturbation21.This suggests that, although the large-scale signal from LULCCon future climates is probably known5,17, much higher-resolutionfully coupled model simulations need to be conducted to buildconfidence in how LULCC interacts with a changing climate atregional scales. Our use of a coarse resolution model and fixedSSTs probably affects many aspects of our results and we arenot suggesting that we have necessarily co-located changes due to
474 NATURE CLIMATE CHANGE | VOL 1 | DECEMBER 2011 | www.nature.com/natureclimatechange
NATURE CLIMATE CHANGE DOI: 10.1038/NCLIMATE1294 LETTERSCO2 with LULCC correctly. However, our main conclusion thatchanges in rainfall and snow caused by increases in CO2 dominatehow LULCC affects climate, thereby necessitating climate modelsto correctly locate changes in rainfall and temperature relative toLULCC, is very probably robust.
MethodsThe climate model. The Commonwealth Scientific and Industrial ResearchOrganisation (CSIRO) Mk3L climate system model is a relatively low-resolutionmodel developed for studies of climate on centennial to millennial timescales14.The atmospheric component has a horizontal resolution of 5.6◦ by 3.2◦ and 18vertical levels. This relatively coarse horizontal resolution enables long simulations,and therefore rigorous statistical testing of our results, but is otherwise a limitationto our methodology (see Supplementary Information for a discussion). Torepresent terrestrial processes, we use the Community Atmosphere Biosphere LandExchange model (CABLE)11. CABLE is a two-leaf canopy model that calculatesthe radiation absorbed by sunlit and shaded leaves and enables calculation ofair temperature and humidity within the canopy. It also includes a coupledmodel of stomatal conductance, photosynthesis and partitioning of net radiationinto latent and sensible heat fluxes and calculates carbon assimilation throughrespiratory loss. Physiological effects of increased CO2 on stomatal conductanceand biophysical effects of vegetation height and surface albedo on surface energybalance and partitioning are accounted for11. However, we do not account for thebiogeochemical effects of LULCC (ref. 22). These would affect the atmosphericCO2 concentration17 and therefore the detailed patterns of the changes simulated,but it is very unlikely that they would affect our conclusions. The key impactof biogeochemical cycles is the extra CO2 released through LULCC; this wouldprobably increase the relative impact of future climate changes and increase thesignificance of regional climate changes in the future. The CSIRO Mk3L has acompetitive climatology14 and a climate sensitivity to a doubling of atmosphericCO2 consistent with the range of other models used for climate projections2(see Supplementary Information). A detailed analysis of the climate simulatedwith CABLE, and of how coupling the CABLE model improves the simulation ofnear-surface and surface variables, is also available13.
Experiments. To simulate the effect of LULCC and changes in CO2, we ran thefollowing experiments. The first set of experiments with natural and perturbedvegetation cover was run at the 1×CO2 concentration (280 ppmv). The naturalvegetation-cover map23 represents the potential vegetation cover withoutanthropogenic influence. The perturbed vegetation-cover map modified thenatural vegetation cover on the basis of the crop and pasture cover in year 2000 ofthe Land Use Harmonization dataset24. Where crop and pasture covered more than10% of a region naturally covered by forest, the forest was converted to croplandvegetation. These half-degree vegetation cover maps were then interpolated to theMk3L grid, retaining the mosaic of vegetation types within each CABLE grid cell.The cropland fraction map shown in Supplementary Fig. S1 represents the totalfraction of vegetation converted from forest type to cropland type for each gridpoint. A second set of experiments, with the same natural and perturbed vegetationcovers, were run at 2×CO2 concentration level (560 ppmv). All simulations wererun for 300 years and the monthly outputs for the last 200 years of simulationswere used in the analysis. For both the 1×CO2 and 2×CO2 experiments, weused SSTs from the Mk3L model taken from the model at equilibrium. This is apotential weakness in our methodology, because there is evidence that fixed SSTslead to an underestimation of the large-scale impacts of LULCC (ref. 21). Thestatistical significance tests used the modified t -test25, which accounts for timedependence within the data.
Received 27 April 2011; accepted 24 October 2011;published online 20 November 2011
References1. IPCC Climate Change 2007: The Physical Science Basis (eds Solomon, S. et al.)
(Cambridge Univ. Press, 2007).2. Meehl, G. A. et al. in IPCC Climate Change 2007: The Physical Science Basis
(eds Solomon, S. et al.) 747–845 (Cambridge Univ. Press, 2007).3. Lawrence, P. J. & Chase, T. N. Investigating the climate impacts of global land
cover change in the community climate system model. Int. J. Climatol. 30,2066–2087 (2010).
4. Bonan, G. B. Effects of land use on the climate of the United States.Climatic Change 37, 449–486 (1997).
5. Feddema, J. J. et al. The importance of land-cover change in simulating futureclimates. Science 310, 1674–1678 (2005).
6. Findell, K. L., Pitman, A. J., England, M. H. & Pegion, P. J. Regional and globalimpacts of land cover change and sea surface temperature anomalies. J. Clim.22, 3248–3269 (2009).
7. Pitman, A. J. et al. Uncertainties in climate responses to past land cover change:First results from the LUCID intercomparison study. Geophys. Res. Lett. 36,L14814 (2009).
8. Hasler, N., Werth, D. & Avissar, R. Effects of tropical deforestation onglobal hydroclimate: A multimodel ensemble analysis. J. Clim. 22,1124–1141 (2009).
9. Forster, P. et al. in IPCC Climate Change 2007: The Physical Science Basis(eds Solomon, S. et al.) 129–234 (Cambridge Univ. Press, 2007).
10. Betts, R. A. Offset of the potential carbon sink from boreal forestation bydecreases in surface albedo. Nature 408, 187–190 (2000).
11. Wang, Y-P. et al. Diagnosing errors in a land surface model (CABLE) in thetime and frequency domain. J. Geophys. Res. 116, G01034 (2011).
12. Abramowitz, G., Leuning, R., Clark, M. & Pitman, A. J. Evaluating theperformance of land surface models. J. Clim. 21, 5468–5481 (2008).
13. Mao, J. et al. The CSIRO Mk3L climate system model v1.0 coupled to theCABLE land surface scheme v1.4b: valuation of the control climatology.Geosci. Model Dev. Discuss. 4, 1611–1642 (2011).
14. Phipps, S. J. et al. The CSIRO Mk3L climate system model version 1.0 - Part 1:Description and evaluation. Geosci. Model Dev. 4, 1–27 (2011).
15. Seneviratne, S. I. et al. Investigating soil moisture–climate interactions in achanging climate: A review. Earth-Sci. Rev. 99, 125–161 (2010).
16. Teuling, A. J. et al. Contrasting response of European forest and grasslandenergy exchange to heatwaves. Nature Geosci. 3, 722–727 (2010).
17. Arora, V. K. &Montenegro, A. Small temperature benefits provided by realisticafforestation efforts. Nature Geosci. 4, 514–518 (2011).
18. Bonfils, C., de Noblet-Ducoudré, N., Guiot, J. & Bartlein, P. Some mechanismsof mid-Holocene climate change in Europe, inferred from comparing PMIPmodels to data. Clim. Dyn. 23, 79–98 (2004).
19. Christidis, N. et al. Detection of changes in temperature extremes during thesecond half of the 20th century. Geophys. Res. Lett 32, L20716 (2005).
20. Boville, B.A. Sensitivity of simulated climate to model resolution. J. Clim. 4,469–485 (1991).
21. Davin, E. L. & de Noblet-Ducoudré, N. Climatic impact of global-scaledeforestation: Radiative versus nonradiative processes. J. Clim. 23,97–112 (2010).
22. Sitch, S. et al. Impacts of future land cover changes on atmospheric CO2 andclimate. Glob. Biogeochem. Cycles 19, GB2013 (2005).
23. Ramankutty, N. & Foley, J. A. Estimating historical changes in globalland cover: Croplands from 1700 to 1992. Glob. Biogeochem. Cycles 13,997–1027 (1999).
24. Hurtt, G. C. et al. The underpinnings of land-use history: Three centuriesof global gridded land-use transitions, wood harvest activity, and resultingsecondary lands. Glob. Change Biol. 12, 1208–1229 (2006).
25. Findell, K. R., Knutson, T. R. & Milly, P. C. D. Weak simulatedextratropical responses to complete tropical deforestation. J. Clim. 19,2835–2850 (2006).
AcknowledgementsWe acknowledge the support of the Australian Research Council through the Centre ofExcellence for Climate System Science (CE110001028).
Author contributionsA.J.P. designed the study. F.B.A. conducted the experiments and managed the data. S.J.P.contributed the Mk3L model. A.J.P., F.B.A., G.A., Y.P.W. S.J.P. and N. de N-D. assistedwith the analysis and wrote the paper.
Additional informationThe authors declare no competing financial interests. Supplementary informationaccompanies this paper on www.nature.com/natureclimatechange. Reprints andpermissions information is available online at http://www.nature.com/reprints.Correspondence and requests formaterials should be addressed to A.J.P.
NATURE CLIMATE CHANGE | VOL 1 | DECEMBER 2011 | www.nature.com/natureclimatechange 475