implicit measurement of extraversion and agreeableness
TRANSCRIPT

IMPLICIT MEASUREMENT OF EXTRAVERSION AND AGREEABLENESS
USING CONDITIONAL REASONING TESTS: THE IMPACT OF FAKING
A Dissertation
by
JENNIFER LYNN RASMUSSEN
Submitted to the Office of Graduate and Professional Studies of
Texas A&M University
in partial fulfillment of the requirements for the degree of
DOCTOR OF PHILOSOPHY
Chair of Committee, Mindy E. Bergman
Committee Members, Winfred Arthur, Jr.
Charles D. Samuelson
Victor Willson
Head of Department, Douglas W. Woods
August 2015
Major Subject: Psychology
Copyright 2015 Jennifer L. Rasmussen
ii
ABSTRACT
Faking on personality tests in selection contexts remains a concern for
organizations and researchers. Conditional reasoning tests (CRTs) are purported to
predict construct-related outcomes and circumvent the faking issue by tapping into
subconscious aspects of personality. However, because CRTs are designed to look like
inductive reasoning tests, the true purpose of the test may remain hidden from test takers
resulting in this reduction in fakeability. In order to investigate these claims, conditional
reasoning tests for Extraversion and Agreeableness were developed and the validity and
fakeability of these CRTs to traditional, self-report personality tests was compared.
Additionally, the current study examines whether any reduction in the ability of test
takers to fake the CRTs is due to the implicit nature of the test or the superficial
appearance of conditional reasoning items as inductive reasoning items. The results of
this study show that participants were not able to fake the CRT if the purpose of the test
at a personality measure remains hidden. This finding persists when analyzing the
effects on Extraversion and Agreeableness separately or when the true purpose of the
test as a personality measure is revealed. This is a positive outcome for proponents of
conditional reasoning tests. The results of this study indicate that it is the endorsement
of justification mechanisms that prevent test takers from faking, supporting the social
cognitive theory on which CRTs are based. However, the CRTs do not predict relevant
outcomes as well as traditional personality tests for Agreeableness and Extraversion.
The implications of these findings and suggestions for future research are discussed.
iii
ACKNOWLEDGEMENTS
I would first like to thank my advisor and committee chair, Dr. Mindy Bergman
for her continued support and guidance throughout my graduate career. Without her, my
degree would not have been possible. Her excitement and knowledge of the Industrial
and Organizational Psychology (I/O) field kept me engaged throughout the process and
her friendship is cherished. I would also like to thank my committee members, Drs.
Arthur, Samuelson, and Willson and former committee member Dr. Berry for their
invaluable input on the project. Their contributions have helped transform the project
for the better. I also wish to thank Drs. Mort McPhail and Dick Jeanneret for their
mentorship within the applied I/O discipline. I appreciate the time they took to help me
grow both as a student of I/O and as a person. They helped me to recognize the impact
I/O psychology can have in the everyday lives of individuals and to appreciate the value
of scientific rigor in the workplace.
Thanks also go to my parents, Kathy and Irv Rasmussen, for their encouragement
during the writing process. They constantly motivated me to push harder, showing me
love and patience along the way. Great appreciation also goes to the faculty and
graduate students with whom I interacted at Texas A&M University. I have had the
honor of learning from great scholars, not only in the psychology department, but also in
the management, sociology, and educational psychology departments; knowledge that
will stay with me throughout my lifetime. Lastly, I wish to acknowledge my colleagues
and friends in I/O psychology, both from Texas A&M University and other academic
iv
institutions, namely Jennifer Rodriguez, Michael Smith, Kori Callison, Neha Singla,
Kayo Sady, Meg Horner, Allison Cook, Ryan Glaze, Carolyn Stufft, Izzy Diaz, Clare
Barrett, and Becky Thompson. Their insight and continued emotional support helped
shape this dissertation and gave me the strength I needed to succeed.
v
TABLE OF CONTENTS
Page
ABSTRACT .......................................................................................................................ii
ACKNOWLEDGEMENTS ............................................................................................. iii
TABLE OF CONTENTS ................................................................................................... v
LIST OF TABLES ...........................................................................................................vii
CHAPTER I INTRODUCTION ....................................................................................... 1
CHAPTER II PERSONALITY .......................................................................................... 2
CHAPTER III FAKING AND PERSONALITY TESTS .................................................. 6
Previous Research of the Effects of Faking ................................................................... 7 Outcomes of Faking on Test Validity ............................................................................ 9 Individual Differences in Faking.................................................................................... 9 Social Desirability/Impression Management/Self-Deception ...................................... 11 Reducing the Impact of Faking .................................................................................... 11
CHAPTER IV CONDITIONAL REASONING TESTS AND THE SOCIAL
COGNITIVE THEORY OF PERSONALITY ................................................................ 22
Social Cognitive Theory of Personality ....................................................................... 23 Comparison of Trait and Social Cognitive Theories of Personality ............................ 24
CHAPTER V CONDITIONAL REASONING TESTS IN PRACTICE ......................... 26
Validity of Conditional Reasoning Tests ..................................................................... 28
CHAPTER VI JUSTIFICATION MECHANISMS OF EXTRAVERSION AND
AGREEABLENESS ........................................................................................................ 32
Extraversion Justification Mechanisms ........................................................................ 35 Agreeableness Justification Mechanisms ..................................................................... 41
vi
CHAPTER VII THE CURRENT STUDY: FAKING ON TRADITIONAL
PERSONALITY TESTS AND CONDITIONAL REASONING TESTS FOR
EXTRAVERSION AND AGREEABLENESS ............................................................... 47
Traditional Personality Tests ........................................................................................ 47 Conditional Reasoning Tests ........................................................................................ 50
CHAPTER VIII METHOD .............................................................................................. 59
Participants ................................................................................................................... 59
Study Design and Methodology ................................................................................... 60 Measures....................................................................................................................... 62 Experimental Conditions .............................................................................................. 68 Manipulation Check ..................................................................................................... 72 Preference for Tests ...................................................................................................... 74 Validation Measures ..................................................................................................... 74
CHAPTER IX RESULTS ................................................................................................ 81
Counterbalancing ......................................................................................................... 81 Manipulation Check ..................................................................................................... 83 Face Validity ................................................................................................................ 86
Illogical Responses ....................................................................................................... 86 Tests of Hypotheses ..................................................................................................... 91
CHAPTER X CONCLUSIONS ..................................................................................... 117
Overview .................................................................................................................... 117 Criterion-Related Validity of the CRT and NEO-PI-R .............................................. 118 Faking on Traditional and Conditional Reasoning Tests of Personality .................... 120 Faking when the Nature of the Test is Revealed ........................................................ 122 Faking on Tests of Different Constructs .................................................................... 123 Faking Related to both Test Purpose Revelation and Construct ................................ 124
Limitations and Future Directions.............................................................................. 124 Conclusions ................................................................................................................ 128
REFERENCES ............................................................................................................... 130
vii
LIST OF TABLES
TABLE Page
1. Summary of Strategies Identified to Prevent or Reduce the Negative Impact of
Faking ................................................................................................................... 20
2. Justification Mechanisms for Extraversion .......................................................... 40
3. Justification Mechanisms for Agreeableness ....................................................... 46
4. Study Hypotheses ................................................................................................. 58
5. Example Conditional Reasoning Item for Agreeableness .................................... 66
6. Sample Size by Condition .................................................................................... 73
7. CRT_FG_NR: Illogical Responses Chosen by Participants ................................ 87
8. CRT_FG_R: Illogical Responses Chosen by Participants ................................... 88
9. CRT_H_NR: Illogical Responses Chosen by Participants................................... 89
10. CRT_H_R: Illogical Responses Chosen by Participants ..................................... 90
11. Statistics for Study Variables ............................................................................... 96
12. Hierarchical Regression Results ......................................................................... 108
13. Study Results ...................................................................................................... 114
1
CHAPTER I
INTRODUCTION
Personality has been a promising and fruitful area of research in the past two
decades, particularly with respect to the Big Five. However, there is still much to learn,
especially with respect to the limitations of trait views of personality and trait-based
measures of personality as predictors of work-related outcomes in applied settings and
the impact of faking on employment decisions (Arthur, Woehr, & Graziano, 2001). This
paper will describe a new method of measurement and how the application of this
measurement method will alleviate concerns about faking on personality tests and add to
the predictive validity of performance by tapping into subconscious portions of
personality. Another contribution of this study is that it answers the call of several
researchers (Barrick & Mount, 2005; Hogan, 2005; Tett & Christiansen, 2007) to
incorporate social cognitive theory into personality assessment. To this end, I will begin
by reviewing the concept of Big Five personality traits followed by a discussion of
faking on personality tests. I will also introduce a relatively new method of
measurement, conditional reasoning tests (James, 1998; James et al., 2005), which I will
use to assess two factors of Big Five personality: Agreeableness and Extraversion.
Lastly, I will investigate whether conditional reasoning tests (CRTs) can mitigate faking
on personality tests and whether the ability to fake responses on these tests are related to
type of personality construct.
2
CHAPTER II
PERSONALITY
Most research on personality in the Industrial and Organizational (I/O)
psychology and management literature, particularly with respect to personality testing,
has focused on the Big Five perspective of personality, a trait theory of personality.
Allport (1937) pioneered the term trait to describe the unique, internal characteristics
that people possess. The trait theory of personality is concerned with the structure and
taxonomy of personality and sees personality traits as existing on a continuum from low
to high (Campbell, 2008). Trait theory allows psychologists to describe people with
respect to different dimensions and to study the relationship between possession of these
traits and specific outcomes. The benefit of trait theory is that people can be compared
based on their varying degrees of individual differences. However, the major deficit of
trait theory is that it does not explain the underlying cause of personality (Campbell,
2008; McCrae & Costa, 1999).
The Big Five theory of personality describes personality along five main factors:
Conscientiousness, Agreeableness, Extraversion, Neuroticism (within the normal range
of personality), and Openness to Experience (Digman, 1990; Goldberg, 1992; McCrae &
Costa, 1987). Conscientiousness is defined in terms of being responsible, dependable,
achievement-oriented, careful, and planful. Agreeable people are courteous, flexible,
good-natured, forgiving, softhearted, and tolerant. Extraversion relates to a person’s
sociability, gregariousness, assertiveness, talkativeness, and activeness. Neuroticism
3
refers to traits such as anxious, depressed, angry, insecure, worried, or emotional.
Frequently, Neuroticism is described in terms of its polar opposite, Emotional Stability.
Finally, Openness to Experience is described with traits such as intellectual, imaginative,
cultured, original, and artistic. Part of the reason that the use of the Big Five to describe
normal personality has been so popular among social scientists is that the taxonomy
allows researchers and practitioners to quickly and easily describe people based on
several broad traits and explore how these traits are related to several outcomes (Boyle,
Matthews, & Saklofske, 2008). The Big Five theory of personality has also been found
to be cross-culturally valid leading to an interest in its use for multinational
organizations (Church & Lonner, 1998).
Based on meta-analytic research, several conclusions can be made regarding the
validity of the Big Five as a predictor of work-related outcomes. Tett, Jackson, and
Rothstein (1991) found a corrected validity of .24 between personality (comprised of the
Big Five, Type A, Locus of Control, and Miscellaneous) measures and job performance
(corrected for predictor and criterion unreliability). Numerous meta-analytic studies
have investigated relationships between Big Five traits and various outcomes. The
following specific relationships come from Barrick, Mount, and Judge, (2001) and
Hough and Furnham (2003); two of the more seminal works in workplace personality
psychology. Other meta analyses on the impact of personality on job performance have
been conducted (e.g., Hurtz & Donovan, 2000; Judge, Rodell, Klinger, Simon, and
Crawford, 2013), and validity coefficients are similar across these studies. Thus, it is
4
clear that the Big Five personality traits are useful, in varying degrees, in the prediction
of performance and a good construct to use for this new measurement method.
Conscientiousness typically has the highest predictive validity. Meta-analytic
correlations are about .22 for Conscientiousness and overall job performance and are
consistent across many occupational types. Emotional Stability (normal range) is found
to be a valid predictor of overall job performance across occupational types (ρ = .13) and
may be particularly relevant for sales jobs (ρ =.27). The validity of Extraversion for
overall job performance ranges between .10 and .15, and validities for jobs that have
social requirements range between .18 and .22. Extraversion is also related to training
performance (ρ = .26). Agreeableness and Openness to Experience validity estimates are
smaller; the meta-analytic correlation between Agreeableness and overall job
performance ranges from .07 to .13 and the validity for Openness to Experience and
overall performance is the lowest at .07. Agreeableness and Openness have been found
to be substantially related to specific outcome measures, however. Agreeableness is
significantly related to performance in teams (.33) and Openness is significantly related
to training performance (.33). A meta-analysis by Hurtz and Donovan (2000) found
somewhat lower validities for the Big Five across multiple occupations and criteria. The
values these authors obtained ranged from .07 to .22 (corrected for range restriction,
sampling, error, criterion unreliability, and predictor unreliability).
Validities for the Big Five can be increased when predicting construct-congruent
behaviors (Hogan & Holland, 2003). When measuring specific, construct-congruent
behaviors, validities for these predictors range from .25 to .34. Also, combining all traits
5
to form a composite predictor can maximize validities particularly when predicting
global outcomes (Barrick & Mount, 2005; Ones, Dilchert, Viswesvaran, & Judge, 2007;
Ones, Viswesvaran, & Dilchert, 2005). Personality tests are also useful because they
produce incremental validity over and above cognitive ability tests (Mount, Witt, &
Barrick, 2000; McHenry, Hough, Toquam, Hanson, & Ashworth, 1990; Schmidt &
Hunter, 1998). Ones et al. (2007) report that the incremental validity of personality
scales over and above cognitive ability in predicting job performance is between .07 and
.16. Unlike measures of cognitive ability, personality tests show little or no subgroup
differences which means they are unlikely to result in adverse impact for protected
groups (Hough, Oswald, & Ployhart, 2001).
Besides performance, Big Five personality predicts a number of other work-
related outcomes and attitudes, such as leadership (Bono & Judge, 2004; Oh & Berry,
2009; Van Iddekinge, Ferris, & Heffner, 2009), job satisfaction (Judge, Heller, & Mount,
2002; van den Berg & Feij, 2003, organizational commitment (Erdheim, Wang, &
Zickar, 2006), turnover (Salgado, 2002; Zimmerman, 2008), counterproductive work
behaviors (Mount, Ilies, & Johnson, 2006) and training proficiency (Barrick & Mount,
1991; Dean, Conte, & Blackenhorn, 2006).
6
CHAPTER III
FAKING AND PERSONALITY TESTS
Concerns about faking on personality tests have been around for almost as long
as personality tests themselves (Zickar & Gibby, 2007). Although some authors have
downplayed the importance of faking in personality testing due to its minimal effect on
criterion-related validity (e.g., Hough, Eaton, Dunnette, Kamp, McCloy, 1990; Ones,
Viswesvaran, & Reiss, 1996), some real concerns still remain. Very few studies have
actually used applicant samples, instead focusing on student and incumbent samples that
may lack the same motivation to fake as job applicants (Hough et al., 1990; Viswesvaran
& Ones, 1999). In addition, faking has an effect on the rank ordering of candidates
when personality tests are used in top-down selection processes, resulting in a
disproportionate number of those who fake securing the top slots (Arthur et al., 2001;
Griffith, Chmielowski, & Yoshita, 2007). There are also concerns that individual
differences in faking may result in adverse impact during the selection process (Hough
& Oswald, 2008; Jackson, Ashton, & Tomes, 1996; Snell, Sydell, & Lueke, 1999).
Therefore, although the overall criterion-related validity of the personality test may not
be affected, the effects on individuals and the organization can be profound. In sum,
psychologists should be concerned with faking on personality tests when used as part of
the selection process, both from a scientific and practical standpoint. The following
sections discuss these assertions in detail and outline how conditional reasoning tests can
address faking concerns.
7
Previous Research of the Effects of Faking
Research has shown that people have the ability to fake on non-cognitive
measures (Hough et al., 1990; Viswesvaran & Ones, 1999). Meta-analytic results of
faking show that when instructed to do so, people can improve their scores on non-
cognitive tests by half a standard deviation on average (Viswesvaran & Ones, 1999).
Typical faking studies involve asking participants to complete the personality scale
under an honest condition and a “fake good (or bad)” condition (Hough et al., 1990).
Although research shows that people can fake when instructed to do so, research
is less consistent with respect to whether applicants actually fake in employment
contexts (Griffith et al., 2007; Hough et al., 1990; Ones et al., 1996). Rosse, Stecher,
Miller, and Levin (1998) found that job applicants were more likely than job incumbents
to fake on personality tests, with 29% of job applicants scoring two standard deviations
above the job incumbent mean. A meta-analysis by Birkeland, Manson, Kisamore,
Brannick, and Smith (2006) investigated the effects of personality test faking in actual
applicant samples. The authors found that applicants had larger standardized mean
differences on four factors of the Big Five (d’s ranging from .11 to .45) than non-
applicants. Agreeableness was the only factor that did not have significant mean
differences. However, after examining job type as a moderator, the authors concluded
that there were mean differences in faking on Extraversion and Agreeableness for those
applying to sales versus non-sales jobs. Applicants applying for sales jobs were more
likely to increase their Extraversion scores and to decrease their Agreeableness scores,
presumably to match the characteristics that applicants thought were important for the
8
job for which they were applying. Therefore, although Agreeableness mean differences
were not found to differ between applicants and non-applicants, there is still an
important mean difference for Agreeableness for certain jobs.
Griffith et al. (2007) investigated whether applicants fake in selection contexts.
Applicants completed a personality test as part of the selection process for a temporary
employment agency. One month later, the applicants were asked to complete the
personality measure two more times, one under an honest condition where applicants
were assured that their responses would never be seen by employers and one under a
“fake good” condition where applicants were asked to respond in a way that would make
them most desirable to a potential employer. The results of study showed mean
differences between the three response instructions such that the honest condition
produced the lowest mean values, the applicant condition produced higher mean values,
and the fake good condition produced the highest mean values. In addition, chi-square
tests revealed that a significant number of applicants faked their responses on the test
(between 22% and 49% depending on the rigidity of the definition used to categorize
people as fakers). Griffith et al. (2007) also investigated the effect of applicant faking on
their rank order. Under selection ratios of 50%, 20%, and 10%, the percentage of
applicants who would not have been hired had their honest conditions been used would
have been 31%, 33%, and 66%, respectively. In sum, faking among applicants can have
a detrimental effect on the applicants not selected into organizations. Another unique
contribution of this paper is that it investigates an actual applicant group as opposed to
student or incumbent groups. It is important to study faking in applicant samples
9
because applicants have a high motivation to fake and this motivation may be difficult to
reproduce in student or incumbent samples.
Outcomes of Faking on Test Validity
Research on the effect of faking on validity has also been mixed (Griffith, 1998;
Ones et al., 1996; Stark, Chernyshenko, Chan, Lee, & Drasgow, 2001). An oft-cited
study by Ones et al. (1996) found that partialling out social desirability from the
personality and performance relationship resulted in no effect on criterion-related
validity. The authors asserted that faking on personality tests posed no threat to the use
of personality tests in employment contexts. However, Ellingson, Sackett, and Hough
(1999) found that similar to the effects of faking on criterion-related validity, faking
does negatively impact the construct validity for personality tests in laboratory faking
studies, but not in real-world settings.
Monte Carlo studies have found that faking can dramatically alter the rank
ordering of applicants and can decrease mean validities (Zickar & Drasgow, 1996).
Other studies also reported that faking is problematic for hiring decisions, particularly
when selection ratios are low (Rosse et al., 1998) and that criterion-related validity
between personality scores and job performance were lower for those who scored in the
upper range of the personality test values and was negative for top scorers (Haaland &
Christiansen, 2002).
Individual Differences in Faking
Jackson et al. (1996) argue that faking is a function of personal, situational, and
motivational factors and the ability to fake is an individual difference in and of itself.

10
This leads to a disparity between people who fake and those who do not, which may
result in negative selection outcomes for those who do not fake, particularly in cases
where the number of applicants is greater than the number of available positions and
when top-down selection is used (as is true in many selection contexts).
Faking on personality tests contains three components: whether a test taker has
the ability to fake, whether they have the opportunity to fake, and whether they have the
motivation to fake (Tett, Freund, Christiansen, Fox, & Coaster, 2012). Each of these
components can be affected by individual differences, which may result in differential
prediction for protected groups (Snell et al., 1999). Research has shown substantial
subgroup differences in scores on cognitive ability tests based on race (Hough et al.,
2001). It has been argued that cognitive ability may be related to test taking strategy,
which may influence the ability to fake on noncognitive tests (Snell et al., 1999). If this
is the case then differences in faking may lead to adverse impact for protected groups.
Research has found differences for sex and age with respect to the motivation to fake
(Graham, Monday, O’Brien, & Steffen, 1994; Newstead, Franklyn-Stokes, & Armstead,
1996). While personality tests themselves have been purported to result in little to no
adverse impact (Hough et al., 2001; Ployhart & Holtz, 2008), differential prediction may
occur in selection contexts due to group differences in the ability and the motivation to
fake. This could result in adverse impact for protected groups, particularly if top-down
selection procedures are used.
In sum, previous research has shown that faking can pose a threat to the validity
and adverse impact of personality tests when they are used in selection contexts. These
11
threats are cause for concern for organizations desiring to use personality assessments as
part of their selection procedure. A number of strategies have been advanced as ways to
ameliorate the negative outcomes of faking. These strategies are discussed further in
this chapter.
Social Desirability/Impression Management/Self-Deception
Meehl and Hathaway (1946) first introduced the concepts of conscious and
unconscious faking, known as faking and self-deception, respectively. Response
distortions can occur when one makes a motivated effort to distort responses (faking)
whereas self-deception involves people who believe they are honestly responding even
though their responses do not match objective personality (Ones et al., 1996; Zickar &
Gibby, 2007). Another term found in the literature is social desirability. Paulhus (2002)
describes socially desirable responding as the tendency to give overly positive self-
descriptions. It is generally believed that socially desirable responding consists of two
facets: self-deception and impression management (synonymous with faking).
Reducing the Impact of Faking
A number of solutions have been suggested as means to curtail the
preponderance of faking or to reduce the impact of faking on personality tests (Arthur &
Glaze, 2011; Hough, 1998). These methods fall into two general categories: methods
used to detect faking on personality tests and methods used to deter test takers from
faking (Arthur & Glaze, 2011; Glaze, 2012). Techniques such as score comparison and
verification testing, use of lie scales, response patterns, and response latencies comprise
the detection category. The deterrence category involves techniques such as forced-
12
choice responding, empirical keying, verification and threats, elaboration, profile
matching, and nonlinear modeling. These techniques are briefly described below. For a
summary of these strategies, see Table 1.
Detection- Lie scales. One method to detect faking involves developing lie
scales that are designed to tap into individual differences in the proclivity to fake. Lie
scales typically ask test takers to agree or disagree with statements that elicit socially
desirable responding (Crowne & Marlowe, 1960; Hough, 1998). Then, by comparing
the responses of individuals under faking and honest conditions, faking can be detected.
These scales can be interlaced within the personality measure or administered separately.
The argument could be made that an effective way to control for the negative
effects of social desirability is to correct applicant test scores before making hiring
decisions. Lie scales have been used to correct personality test scores (Meehl &
Hathaway, 1946). Assuming these corrections could be applied in a fair and consistent
manner, the need for new personality tests to circumvent the faking issue would be
unnecessary. Considerable research has been conducted on the use of social desirability
scales to correct for faking (Burns & Christiansen, 2006; Goffin & Christiansen, 2003).
Although many practitioners believe that correcting for social desirability can improve
the validity of personality tests (Burns & Christiansen, 2006), research has shown that
these corrections only have a negligible effect on the criterion-related validity, implying
that their use is inconsequential (at least when rank order selection is not used; Ones et
al., 1996). Moreover, applying social desirability corrections for faking has been found
to reduce the construct validity of personality scales (Nicholson & Hogan, 1990). Social
13
desirability has been found to be related to real differences in Emotional Stability (ρ =
.37 for self-ratings of personality and .18 for other’s ratings) and Conscientiousness (ρ =
.20 for self, .13 for other), so partialling out the effects of social desirability results in a
reduction of the true variance in personality scores (Ones et al., 1996). In addition,
social desirability, as measured by traditional social desirability tests, may not fully
capture the behavior exhibited by job candidates in the real world (Kluger & Collela,
1993; Ones et al., 1996; Paulhus, 1984). Applicants may be motivated to respond to
personality tests in ways that are consistent with the job, but are not socially desirable.
For instance, applicants for sales jobs would not want to seem overly agreeable, lest they
be seen as pushovers.
Detection- Response patterns. Test administrators can also examine the pattern
of responses supplied by test takers to identify possible faking. Early methods involved
identifying test respondents who selected answers in the extremes of the scale more
frequently than normal (e.g., Humm & Wadsworth, 1934). Many current, commercially-
available personality scales include response styles in reports such as the extent to which
test takers agree (acquiescence) or disagree (nay-saying) with test statements regardless
of content (e.g., Guilford-Zimmerman Temperament Survey; Guilford, Zimmerman, &
Guilford, 1976; NEO-PI-R; Psychological Assessment Resources, Inc., 2000). While
response pattern analysis is able to identify erratic or biased responding, it is unclear
how test administrators should utilize this information. Similar to lie scales, legal and
ethical challenges emerge if test taker scores are corrected or disqualified during the
application process.
14
Detection- Response latencies. Based on findings that demonstrate that
individuals take longer to respond than people who are responding honestly (Holden,
1998; Vasilopoulos, Reilly, & Leaman, 2000), it has been posited that a way to detect
faking is by measuring the amount of time between the presentation of the item and the
response to the item (response latency) . Research on the effectiveness of this method
for detection of faking has been mixed, however. Although McDaniel (1990) found
slower responding for test takers faking an integrity test compared to those who
responding honestly, other research indicate no difference in the response latencies of
test takers under honest and faking conditions (Kluger, Reilly, & Russell, 1991;
McManus, 1990,Vasilopoulos, et al., 2000). Inconsistencies in results may be due to
item characteristics and individual differences impact response latencies (Holden,
Fekken, & Cotton, 1991). Another factor involving the use of response latencies for
detection is the requirement of computer-administered tests. Although the use of
technology-enabled assessment has become increasingly commonplace (Tippins et al.,
2006), certain environmental obstacles (e.g., onsite testing at an oil refinery) may
prohibit its use.
Summary of detection methods. Although a number of strategies have been
suggested as a means to detect faking, they all raise the question of what to do when
fakers are identified. As mentioned in the section on lie scales, the test scores of those
identified as fakers can be statistically corrected. Alternatively, those identified as
fakers can be removed from the applicant pool altogether. Removing applicants from
the selection process has not been found to affect criterion-related validities (Hough,
15
1998). However, other researchers have called into question the efficacy of such
statistical control methods (Ellingson et al., 1999; Goffin & Christiansen, 2003; Ones et
al., 1996). Not to mention, the practical impact of corrections or eliminations may have
a pronounced effect on adverse impact or perceived test fairness.
Empirical keying. In addition to detecting individuals who fake on personality
tests, other precautions can be taken to reduce faking on tests. For example, empirical
keying, a method by which items or item responses are scored according to their
relationship with a criterion measure is sometimes utilized to mask responses that are
socially desirable (Hogan, 1994). This technique is most frequently used with biodata
measures but has also been used for situational judgment tests (Bergman, Drasgow,
Donovan, Henning, & Juraska, 2006; Mumford & Owens, 1987). Research on this
method suggests that, although it may reduce the impact of faking, it does not eliminate
it (Kluger et al., 1991).
Warnings, verifications, and threats. Other methods to control faking on
personality tests involve creating testing conditions that foster honest responding. Test
administrators can convince test takers that it is not in their best interest to distort
answers, warn against purposefully distorting answers, and threaten test takers with
negative consequences of distortion (Hough et al. 1990; Ones et al., 1996). Early
attempts to control faking often directly asked applicants to respond honestly. Tests
themselves can contain warnings that answers can be verified or test takers can be
warned if responses are inconsistent. Research has been mixed with respect to the
usefulness of these methods (Dwight & Donovan, 2003; Meehl & Hathaway, 1946). For
16
the response verification technique, stronger correlations were found between
personality and cognitive ability and response latencies were more exaggerated when
warnings were present suggesting that such warnings increase the complexity of the tests
(Vasilopoulos, Cucina, & McElreath, 2005).
Elaboration may also help deter faking by asking test takers to expand on their
responses on some or all items. It is posited that test takers who are contemplating
faking on a test item will be less likely to do so if they know they must also fabricate an
elaboration (Arthur & Glaze, 2011). However, this strategy may produce unintended
consequences when test takers are required to elaborate only when certain response
options are endorsed; test takers may refrain from selecting options that require greater
effort. Schmitt et al. (2003) found that although elaboration does not affect correlations
between social desirability and responses, test scores are much lower under elaboration
conditions than nonelaboration conditions.
Profile matching and nonlinear modeling. Profile matching is an additional
way to mitigate the negative impact of faking. Profile matching involves assessing the
match (or mismatch) between test taker personality profiles. These profiles consist of
the compilation of scores for multiple personality constructs. Profile matching can be
used within a selection context by comparing an applicant profile to the profile of an
“ideal” candidate (Arthur & Glaze, 2011). Profile matching involves the combination of
two profiles into a single score that represents their overall congruence (Edwards, 1993;
also known as similarity, fit, or agreement). Underlying profile matching is
acknowledgement that the specified relationships in profiles are nonlinear (Arthur &
17
Glaze, 2011). Research has begun to support the notion that at least some personality
constructs have a nonlinear relationship to performance (Arthur et al., 2001; Waller,
Tellegen, McDonald, & Lykken, 1996).
Similarity in profiles can be indicated through correlations between profiles or
the sum of differences in profiles. Research on the efficacy of profile matching has been
sparse (Glaze, 2012). However, the typical way that profile matching is utilized in the
literature results in several drawbacks (Edwards, 1993). Profile matching combines
several components into a single score, making interpretation conceptually ambiguous; it
is unknown which element of the profile contributes to the differences. Sum of
differences indices can overlook important information concerning the absolute level
(i.e., different scores can be of equal distance from the comparison score yet differ in
their placement on the scale) and, often, the directionality (i.e., different scores can be of
equal distance from the comparison score yet positive or negative in comparison) of the
difference. However, this drawback can be avoided by using different decision rules.
Correlational indices can omit information about the magnitude of the difference
between profiles.
Several best practice guidelines have been advanced with profile matching.
Stating the aims of the project in specific, rather than general terms and focusing on
specific dimensions as opposed to overall profiles may alleviate concerns related to
ignoring information. Multi-item, as opposed to single-item measures should be used
and profiles should be comprised of normative instead of ipsative measures. Lastly,
congruence should be analyzed using polynomial regression in order to avoid
18
amalgamating measures into a single score. However, these guidelines still exhibit
limitations (Edwards, 1993; Edwards & Parry, 1993). It may be impractical or
undesirable to separate measures within profiles and reliabilities may be low if the
original measures are specific due to the increase in specific-item variance above
common-item variance. In reference to the polynomial regression recommendation,
residual degrees of freedom will be reduced as the number of profile components
increases. Also, because of the exploratory nature of the process, the methodology used
in polynomial regression may result in capitalization on chance and arbitrarily ordered
variables in the equation. The large number of significance tests required for polynomial
regression is likely to inflate Type I error rates and any curvilinear or interaction terms
may be difficult to interpret.
Test methodologies. A number of testing methodologies have been advanced as
resistant to faking. Biodata, situational judgment tests, and structured interviews have
been advanced as ways to reduce faking compared to traditional Likert-type personality
tests (Cascio, 1975; McCarthy, Van Iddekinge, & Campion, 2010; Weekley & Ployhart,
2006). However, the usefulness of these testing methodologies as a way to reduce
faking has been called into question (Hooper, Cullen, & Sackett, 2008; Levashina &
Campion, 2006; McFarland & Ryan, 2000; Ramsay, Schmitt, Oswald, Kim & Gillespie,
2006).
Forced-choice formatting for personality tests has been advocated as a way to
reduce faking by asking test takers to choose between options that are equally socially
desirable (Edwards, 1957). Forced-choice tests suffer from several drawbacks (Zickar &

19
Gibby, 2007). First, forced-choice options are difficult to create because test writers
must develop options with equal valence. Also, respondents often dislike making the
difficult choices necessary in forced-choice formats. This could be especially
problematic for the face validity of forced-choice formats. There are three potential
outcomes of lower face validity for organizations (Chan, Schmitt, DeShon, Clause, &
Delbridge, 1997; Smither, Reilly, Millsap, Pearlman, & Stoffey, 1993). Lower face
validity may impact the organizational attractiveness of an organization leading to
changes in applicants’ likelihood of seeking or accepting job offers, particularly when
the job market is favorable to employees. Lower face validity may also be related to
increased likelihood of litigation or decrease in the success of the legal defense of the
selection procedure. Face validity can also have an impact on the validity and utility of a
selection procedure due to its effect on test-taking motivation and loss of qualified
applicants. Also, forced-choice formats result in ipsative data, making comparisons
between individuals less meaningful (Meade, 2004). Lastly, research indicates that
people are able to fake forced-choice tests (Waters, 1965).
In sum, there have been many attempts to reduce faking and/or its effect in
testing. However, many of these have had little success at best and are often costly to
organizations or test takers. Therefore, it is necessary to explore alternative strategies
that attempt to make faking an irrelevant issue altogether. Implicit tests that are
purported to measure personality at the subconscious level bypass the ability of test
takers to fake. Conditional reasoning tests are argued to be the implicit test that may be
of great benefit to organizations.
20
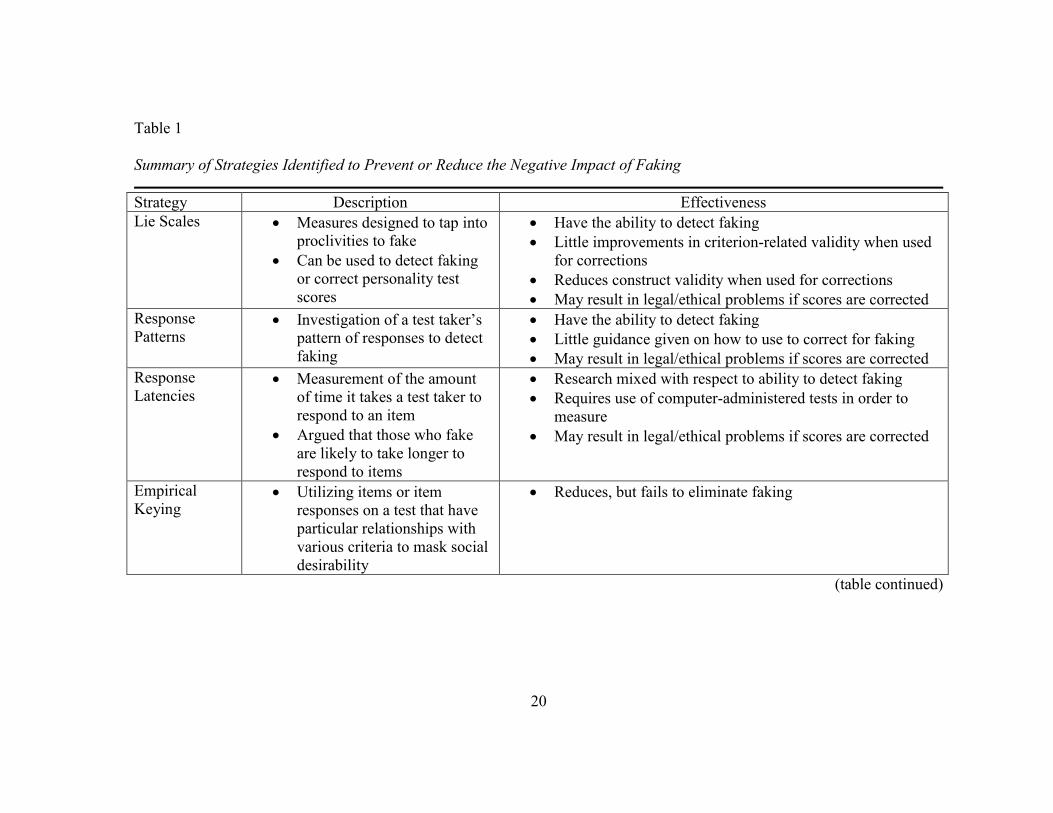
Table 1
Summary of Strategies Identified to Prevent or Reduce the Negative Impact of Faking
(table continued)
Strategy Description Effectiveness
Lie Scales Measures designed to tap into
proclivities to fake
Can be used to detect faking
or correct personality test
scores
Have the ability to detect faking
Little improvements in criterion-related validity when used
for corrections
Reduces construct validity when used for corrections
May result in legal/ethical problems if scores are corrected
Response
Patterns Investigation of a test taker’s
pattern of responses to detect
faking
Have the ability to detect faking
Little guidance given on how to use to correct for faking
May result in legal/ethical problems if scores are corrected
Response
Latencies Measurement of the amount
of time it takes a test taker to
respond to an item
Argued that those who fake
are likely to take longer to
respond to items
Research mixed with respect to ability to detect faking
Requires use of computer-administered tests in order to
measure
May result in legal/ethical problems if scores are corrected
Empirical
Keying Utilizing items or item
responses on a test that have
particular relationships with
various criteria to mask social
desirability
Reduces, but fails to eliminate faking
21
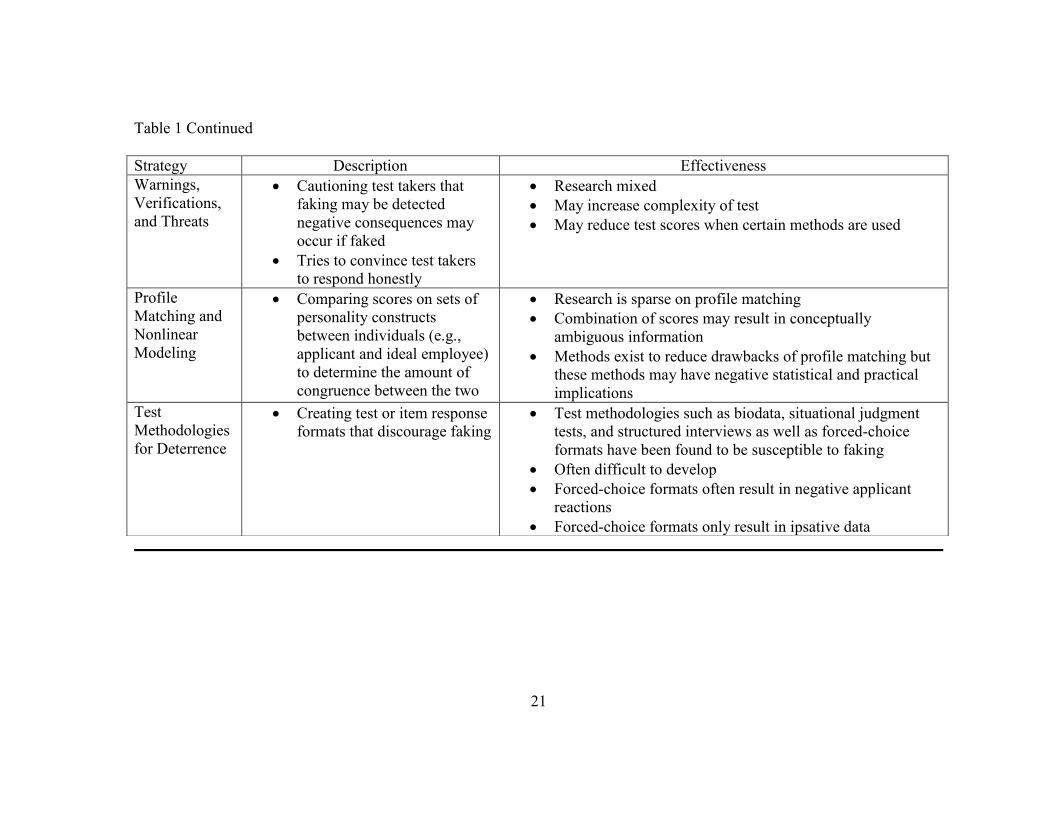
Table 1 Continued
Strategy Description Effectiveness
Warnings,
Verifications,
and Threats
Cautioning test takers that
faking may be detected
negative consequences may
occur if faked
Tries to convince test takers
to respond honestly
Research mixed
May increase complexity of test
May reduce test scores when certain methods are used
Profile
Matching and
Nonlinear
Modeling
Comparing scores on sets of
personality constructs
between individuals (e.g.,
applicant and ideal employee)
to determine the amount of
congruence between the two
Research is sparse on profile matching
Combination of scores may result in conceptually
ambiguous information
Methods exist to reduce drawbacks of profile matching but
these methods may have negative statistical and practical
implications
Test
Methodologies
for Deterrence
Creating test or item response
formats that discourage faking
Test methodologies such as biodata, situational judgment
tests, and structured interviews as well as forced-choice
formats have been found to be susceptible to faking
Often difficult to develop
Forced-choice formats often result in negative applicant
reactions
Forced-choice formats only result in ipsative data

22
CHAPTER IV
CONDITIONAL REASONING TESTS AND THE SOCIAL COGNITIVE
THEORY OF PERSONALITY
Implicit personality tests attempt to circumvent the faking issue by measuring
implicit personality. Implicit personality occurs outside of a person’s awareness
(Epstein, 1994; Mierke & Klauer, 2003; Schmukle & Egloff, 2005; Wilson, Lindsley &
Schooler, 2000). Because this component of personality occurs outside a person’s
awareness, neither accurate self-insight nor deliberate misrepresentation should affect an
individual’s scores on implicit tests of personality (Robinson & Neighbors, 2006).
There are a number of implicit tests that have been designed to tap into subconscious
constructs (e.g., the Implicit Association Test, the Thematic Apperception Test, and
Rorschach). One such test is the conditional reasoning test.
Conditional reasoning tests (CRTs) are a relatively recent approach of implicitly
measuring personality traits (James, 1998; James et al., 2005; LeBreton, Barksdale,
Robin, & James, 2007). CRTs are based upon “the judgments, explanations, and
theories people have about the causes and effects of their own behavior and the behavior
of others in social environments” (James & Mazerolle, 2003, pp. 3-4). Unlike traditional
self-report personality tests, which typically derive from the trait perspective of
personality, CRTs utilize social cognitive theory of personality to identify people with
particular personality traits.
23
Social Cognitive Theory of Personality
Social cognitive theory of personality seeks to understand the person as a whole
and both the stable and dynamic nature of personality in different contexts. Cervone,
Shadel, and Jencius (2001) emphasize that a person’s experiences and personality
characteristics shape their interpretation of the world and this in turn affects their
behaviors. One type of social cognitive theory of personality is the cognitive-affective
processing system theory (CAPS) which states that things like a person’s abilities,
attitudes, and emotions interact with the environment to predict stable patterns of
behavior (Mischel & Shoda, 1995; Mischel, Shoda, & Mendoza-Denton, 2002). For
example, a person who is talkative and outgoing when in the presence of good friends
may be less talkative and outgoing when meeting people for the first time. Following
this line of reasoning, even relatively stable cognitions and behaviors are influenced by
the situation.
Rationalizations are another part of social cognitive theory. Mischel (1969)
argues that people want to see continuity between the way they think they are and the
way they actually behave. There is a need to maintain the whole even when engaging in
seemingly separate behaviors. When individuals engage in behaviors that do not match
their attitudes or values, they are likely to change their cognitions instead of their
behavior because they are unable to change past behavior (Festinger, 1957; Festinger &
Carlsmith, 1959). By engaging in rationalizations, people can provide explanations for
their behaviors so that their behaviors seem to match with the way they think.
24
One’s thinking, emotions, and actions are derived from one’s subjective
interpretation of the world, the self, and others (Cervone, 2008). These cognitions, in
turn, affect the behavior of people. James and colleagues argue that people have a need
to view their behaviors as rational as opposed to irrational and they frame and analyze
the world differently in order to match the world with these views (James, 1998; James
& Mazerolle, 2003; LeBreton et al., 2007). In other words, people want to believe that
their behaviors are logical and sensible, so they rationalize behaviors in a manner
consistent with their worldview. It is believed that these rationalizations are based on
people’s personalities (James & LeBreton, 2012). The purpose of rationalizations is to
convince oneself and others that their actions and cognitions are in unison (Allport,
1937). No one wants to admit that they may be irrational (or in some cases even
unethical), so they justify their behaviors to not only convince others that their behaviors
are just, but to ease the dissonance between their thoughts and their actions (Festinger,
1957). It is a self-protective process, and because people receive rewards (e.g., social
approval, attenuation of distress) from engaging in these cognitive ploys, it reinforces
the behavior and leads naturally to the tendency to engage in them in the future.
Comparison of Trait and Social Cognitive Theories of Personality
Social cognitive theory of personality brings an added benefit to the
measurement of traits in terms of understanding the underlying mechanisms in shaping
behavior. Self-reported traits are often used to predict the behaviors they are intended to
describe, resulting in tautology (Cervone & Shoda, 1999). Social cognitive theorists
argue that it is important to understand the theoretical underpinnings of personality in
25
order to fully comprehend the relationships of personality to various outcomes (Ozer &
Reise, 1994). These underlying mechanisms allow researchers to have a better
understanding of the person as a whole. Allport and Allport (1921) argue that traits
represent a superficial understanding of a person’s personality. Although outward
expressions of personality traits are important, they are but one aspect of a person’s
personality. A deeper, less apparent component of personality also exists, relating to the
underlying causes of personality and greatly affects the way personality manifests itself
in the individual (Allport & Allport, 1921). For instance, while it is true that a person
who finishes their work on time would be described as having high Conscientiousness,
they may engage in this behavior for a variety of reasons including good habits learned
from parents, compensation for bad habits, or a need to be submissive to the demands of
others. Allport and Allport (1921) argue that these underlying causes determine the
intensity of the personality trait being exhibited and this component is overlooked when
simply examining the traits of individuals. Social cognitive theory addresses these
concerns by incorporating the influence of the environment and the individual’s
perception of the situation. This discussion is not intended to devalue the importance of
trait theory in psychology. As mentioned above, trait-based measures of personality are
valid, reliable, and can be used to predict a wide variety of trait-relevant behaviors.
Instead, social cognitive theory is seen as an explanatory mechanism of trait theory; it
describes how traits come to exist.
26
CHAPTER V
CONDITIONAL REASONING TESTS IN PRACTICE
Conditional reasoning tests (CRTs) incorporate social cognitive theory of
personality into personality measurement by tapping into the rationalizations that people
use to make sense of their own behavior. This method of measurement allows
researchers to obtain a more comprehensive view of the individual rather than trait-based
tests alone. The rationalizations people give for their behaviors represent unconscious
biases in the interpretation of events and are known in the CRT literature as justification
mechanisms (JMs). JMs are implicit; people are unaware that their own biases influence
their reasoning (James, 1998; James & Mazerolle, 2003). CRTs also capture contextual
components of personality. CRTs are designed to elicit responses based on the
justification mechanisms people give to rationalize their behaviors. This is a large part
of the social cognitive basis of personality, leading to a different measurement of
personality than trait-based measures.
People try to enhance the rational appeal of their behaviors by framing the
situation in ways consistent with their personality; that is, they engage in implicit
reasoning biases. For example, people with different personalities use different
adjectives to describe a given situation; they make different attributions regarding their
behavior and the behavior of others and assign different probabilities to particular
outcomes (James & Mazerolle, 2003). These are all JMs for a particular personality
trait. With respect to aggression, James (1998) argues that someone who is aggressive

27
tends to view their aggressive behaviors as justified for several reasons (e.g., they see
themselves as victims of oppression by a powerful other, they have a tendency to see the
actions of others as hostile, and they prefer retaliation over reconciliation).
The process by which people invoke a particular JM due to their personalities is
termed conditional reasoning. Conditional reasoning tests capitalize on this process by
assuming that people will differentially respond to personality test questions based on
their personality trait standings because they will interpret the same event differently due
to the influence of their justification mechanisms. For example, conscientious people
perceive following rules and obeying others as positive because it is the responsible
thing to do in a social world. Those who are low in Conscientiousness perceive
following rules and obeying others as negative because these are seen as an impediment
to their autonomy. In the previous example, the justification mechanism is the extent to
which following rules is seen as an impediment to an individual’s autonomy. CRTs are
designed to tap into these differences in JMs.
In general, CRTs are constructed so that they appear to be an inductive reasoning
test. Test takers are instructed to read a brief paragraph and then choose the most logical
option based on the information given. Two options are structured around the JMs
associated with opposite poles of the personality trait. The other options are nonsensical
given the information in the stem and are used primarily to make the measure face valid.
Test takers endorse the option that is consistent with their own conditional reasoning
(see LeBreton et al., 2007 for an example Aggression CRT item).
28
CRTs are scored such that a test taker receives one point for selecting a trait-
congruent response and loses one point for selecting the trait-incongruent option. The
test taker receives no points for selecting illogical options. Thus, the range of scores for
a particular item can range from -1 to +1. Scores are then summed across items to
determine a total scale score, with higher scores indicating higher levels of the trait.
The purpose of the illogical items is to reinforce the appearance of an inductive
reasoning problem. However, the question has been raised about the impact of these
illogical options on CRTs. Although little data has been published on the frequency of
people selecting illogical responses, James et al. (2005, p. 77) report most respondents
choose responses related to JMs. The development of illogical options is given careful
consideration in the test development process to reduce the superfluous impact of these
options. LeBreton et al. (2007) emphasize that CRT distractor options are created to be
clearly illogical and the CRT-A was reviewed by a logician to ensure that items were
logically sound. Because of these precautions, less than 5% of respondents chose
illogical items over the course of thousands of test administrations (James, 2005;
LeBreton et al., 2007). The current study will report the number of illogical responses
chosen by participants in order to more fully investigate this issue.
Validity of Conditional Reasoning Tests
James et al. (2005) found validity estimates for the Aggression CRT (CRT-A)
ranging from .32 to .64 with an average validity coefficient of .44 (corrected for
dichotomization of criteria). These estimates are based on the criteria of job
performance and aggressive and counterproductive behavior including lack of
29
truthfulness about extra credit, absences, conduct violations, attrition, theft, and hard
fouls in intramural basketball games. These values suggest that a benefit of CRTs may
not only be a reduction in faking due to the implicit nature of the test but also an increase
in the ability to measure personality. However, a recent meta-analysis of the Aggression
CRT (Berry, Sackett, & Tobares, 2010) found that validity estimates are more likely in
the range of .14 to .16 (depending on criteria) but may be as high as .24 to .26 when
predicting continuous criteria, similar to traditional, Likert-type personality tests.
Although CRT items appear to be logical reasoning problems, the relationship of
cognitive ability and the CRT-A has been consistently found to be nonsignificant (James
et al., 2005; LeBreton et al., 2007). Correlations between the CRT-A and cognitive
ability (ACT scores) across multiple studies range from -.08 to .06 (all nonsignificant; N
= 95-832). The CRT-A often has low and nonsignificant correlations with self-report
measures of personality. James et al. (2005) investigated the correlations between scores
on an Aggression CRT and several self-report measures of Aggression including the
Personality Research Form (PRF), the NEO-PI-R, and the aggression questionnaire.
Correlations between the Aggression, Dominance, and Impulsivity subscales of the PRF
ranged from .05 to .14 (nonsignificant; N = 60). Correlations between the Aggression
CRT and the NEO-PI-R were .002 (nonsignificant; N = 191) and .26 (p<.05; N = 225)
for the Angry Hostility subscale and -.18 (p<.05; N = 225) for the Dutifulness subscale.
Lastly, the relationship between the aggression questionnaire and the Aggression CRT
was .24 (p< .05; N = 95). The lack of substantial overlap may not indicate absence of
convergent validity, however. James et al. (2005) argue that explicit and implicit
30
measures of personality tap into different aspects of personality and, therefore, should
not be expected to produce high correlations. Indeed, relatively low correlations are
frequently found between explicit and implicit measures in the extant literature
(Bornstein, 2002; Greenwald & Banaji, 1995; McClelland, Koestner, & Weinberger,
1989). In order to determine the relative proportion of R2 attributable to the conditional
reasoning test or self-report measures, a dominance analysis was performed (James et
al., 2005). The contribution of the Aggression CRT to the prediction of aggressive
behavior predicted by personality was 83% for lack of truthfulness about extra credit,
78% for student conduct violations, 72% for theft, and 74% for hard fouls in basketball.
In comparison, the relative importance of self-report measures in the prediction of
aggressive behaviors ranged from 1% to 28%.
The current study investigated the validity of a CRT for measuring
Agreeableness and Extraversion. For the test to have any utility in practice, it is
necessary to ensure that these tests are in fact measuring what their intended constructs
are and/or they predict important outcomes. Also, due to the onerous development
process involved with conditional reasoning tests and the increased time required to
administer the measure, it is important to compare their validity to Likert-type
personality tests. There are a number of ways to compare the validity of one test to the
validity of another test. Two options will be examined as part of this study. First, zero-
order correlations between the test and construct-relevant outcomes should be present for
the CRTs as well as the traditional personality tests. Validity coefficients should be of
roughly the same magnitude between the two tests. In addition, a rigorous test of
31
validity will be conducted to determine if the CRT can provide any more explanation of
variance than the traditional personality tests do. If evidence of the incremental validity
of CRTs over and above traditional personality tests exists, then there would be ample
evidence that CRTs are superior to traditional tests. Therefore, the following hypotheses
are offered:
Hypothesis 1: Traditional, self-report personality tests for Agreeableness and
Extraversion will be positively correlated to construct-relevant criteria.
Hypothesis 2: CRTs for Agreeableness and Extraversion will be positively
correlated to construct-relevant criteria.
Hypothesis 3: CRTs for Agreeableness and Extraversion will have incremental
validity in the prediction of construct-relevant outcomes over and above
traditional tests of these constructs.
32
CHAPTER VI
JUSTIFICATION MECHANISMS OF EXTRAVERSION AND
AGREEABLENESS
Research on the trait theories of personality, such as the Big Five, has largely
focused on the description of the traits as opposed to underlying mechanisms.
Therefore, it was necessary to undertake a review of the literature from the inception of
these traits to have an understanding of the justification mechanisms people use to
rationalize their behavior. According to social cognitive theory of personality (Bandura,
1986), the underlying mechanisms of personality are unique to the individual, based on
their past experiences. However, research has identified several common themes upon
which these personality traits have been built (Allport & Allport, 1921). These serve as
the justification mechanisms on which the current CRT items will be based.
Before discussing the justification mechanisms (JMs) for both Extraversion and
Agreeableness, it is important to understand how personality forms and what gives rise
to the rationalizations for behavior that determine what each construct’s JM will be.
Based on a review of several philosophical, sociological, psychological, literary, and
religious conceptualizations, Allport (1937) defined personality as “the dynamic
organization, within the individual, of those psychophysical systems that determine his
unique adjustments to his environment” (p. 48). Allport (1921; 1924; 1937) recognized
the importance of the environment, and an individual’s response to it, in the shaping of
personality. Personalities form from the multitude of experiences to which people have
33
been exposed. People are born with a temperament and this temperament combines with
influences from the environment to form a person’s personality (Deal, Halverson, Havill,
& Martin, 2005). The behaviors that have proven adaptive to the environment in the
past combine to become personalities; these behaviors are indirect signs of personality
(Mischel, 1972).
Research has shown that infants possess a number of innate temperaments that
lead them into particular environments where temperament-consistent behaviors can be
reinforced (Martin, Wisenbaker, & Huttunen, 1994; Rothbart, Ahadi, Hershey, & Fisher,
2001). For example, infants who are low in sociability tend to find social situations
intimidating and wish to avoid them. These infants are more likely to engage in
behaviors that are inwardly focused. From an adaptive standpoint, these types of
behaviors serve the function of buffering the individual from social situations, while
reducing the individual’s discomfort and stress, and are therefore likely to be repeated in
the future (Thorndike, 1927). Allport (1937) affirmed that this process is unique to each
individual; things that may seem maladaptive to one person can be seen as adaptive to
another.
Although these responses transpire because they were adaptive in the past and
thus reinforced, over the course of time, they become habits to the individual and
eventually become integrated as personalities. Allport (1937) argued that personality
begins at birth, although babies do not innately have personalities when they are born.
In a process called differentiation, babies exhibit random actions and predetermined
reflexes to generate individual skills. These skills are maintained through differences in
34
sensitivity to the external world and innate drives such as hunger and thirst to produce
individual differences in temperament and potential for adaptive behavior. For example,
an infant, through random motor movement can eventually become skilled at producing
different facial expressions. In addition, infants are especially sensitive to environmental
stimuli (Parry, 1972) and are thus likely to use their newly acquired skills to better adapt
to it. The facial expressions that develop as an infant could be further refined through
interactions with the environment. If these facial expressions happen to produce an
initial positive reaction from the mother, the infant may further refine facial movements
toward a specific expression, such as smiling. Through a process called integration,
Allport (1937) believes that conditioned reflexes (such as the smiling mentioned above)
become habits, or integrated systems of conditioned responses. These habits are then
further environmentally conditioned such that particular situations (and situations similar
to it) induce these habits naturally. For example, smiling may produce positive reactions
not only from the mother but also other people whom the individual encounters.
Therefore, the individual learns to smile when meeting new people for the first time
because it has been adaptive in the past, becoming a habit. Finally, through further
adaptive interaction with one’s own environment, the integration of several habits forms
the basis of traits. Perhaps an individual not only smiles in response to meeting someone
for the first time but also engages in small talk and listens to what the other individual
has to say. From another person’s point of view, it may seem as though this individual is
friendly or outgoing but it is really an integrated set of habits, which have allowed the
individual to adapt to his or her environment.
35
Extraversion Justification Mechanisms
It is believed that Introversion and Extraversion arise from adaptations made to
one’s social environment at a young age (Allport, 1921). People are inclined to repeat
behaviors that they find rewarding (Thorndike, 1927) and different personalities arise
because different people find different situations rewarding. For example, one person
may find social interactions to be rewarding because they can gain approval from others.
However, if a person is ignored or teased by others they may find the social world to be
intimidating and choose instead to focus inward, engaging in a marked fantasy life
characterized by high imagination and daydreaming. By exploring the underlying
differences between these two groups, a list of justification mechanisms can be
determined. The following justification mechanisms for Extraversion were obtained
through a literature review of seminal work in the field of personality research and
theory. This section will explain the findings of the literature review and describe the
justification mechanisms in which people with Extraversion and Introversion engage.
High versus low arousal. Carl Jung introduced the terms Extraversion and
Introversion when he was examining personality types in abnormal psychology (Wilt &
Revelle, 2009). However, Hans Eysenck found that Introversion and Extraversion had a
biological basis related to the excitation and inhibition in the brain (Eysenck, 1967).
Introverts had lower thresholds for activation than extroverts, which would lead
introverts to perform better than extroverts in low arousal conditions and extraverts to
perform better than introverts in high arousal conditions, thus avoiding under or over
arousal. In addition, Eysenck believed that in conditions of moderate arousal, extraverts
36
should act more frequently and quickly in order to increase their general level of arousal.
Eysenck’s arousal theory has received support (Matthews & Gilliland, 1999); introverts
are more likely to feel aroused than extraverts, especially in the morning.
As an alternative to arousal theory, Gray (1970) introduced the reinforcement
sensitivity theory to explain Introversion and Extraversion. The reinforcement
sensitivity theory argues a psychophysiological cause for Introversion and Extraversion
through the behavioral approach and behavioral inhibition systems. Gray argued that
sensitivities in these areas lead to either impulsivity (behavioral approach system,
associated with Extraversion) or anxiety (behavioral inhibition system, associated with
Introversion). Based on the reinforcement sensitivity theory, extraverts should be
quicker to condition than introverts because they are more sensitive to reinforcers. In
addition, extraverts should have higher positive affect than introverts. Research has
supported both hypotheses; extraverts possess higher positive affect than introverts and
extraverts condition to reinforcers more quickly (Matthews & Gilliland, 1999).
High versus low positive affectivity. In general, Extraversion is related to state
and trait tendencies to experience positive affect (happiness and excitability; Watson &
Clark, 1997; Wilt & Revelle, 2009). Extraverts have a lower threshold for experiencing
positive affect than introverts and extraverts require less stimulation than introverts to
feel positive affect (Gross, Sutton, & Ketelaar, 1998). Although one may assume that
extraverts have greater positive affect than introverts because they spend more time in
social situations, research has not overwhelmingly supported this assertion. Research
suggests that extraverts are happier than introverts in both social and nonsocial
37
environments and that introverts do not necessarily spend less time in social situations
(Wilt & Revelle, 2009).
Objective versus inner worlds. Allport (1921) describes Introversion and
Extraversion in terms of the internal versus the external world. Although this is a
rudimentary definition of Introversion and Extraversion, it provides important insight
into a potential component of Introversion and Extraversion. The introvert views the
external world as lacking in some form and instead prefers to focus inward into an
imaginary world where experiences can be rich and rewarding. The extravert finds the
social world more rewarding and finds little practicality in the inward self. Creativity for
the introvert and realism for the extrovert allow the individual to adapt to his or her
environment.
Confidence versus embarrassment. Allport and Allport (1921) describe
extroverts as ones whose “mental images, thoughts, and problems find ready expression
in overt behavior” (p. 12). In other words, an extravert speaks his or her mind without
worrying what others think about their thoughts; they have nothing to hide. An introvert
“dwells largely in a realm of imagination, creating inwardly a more desirable ideal world
rather than adjusting himself outwardly to the real one” (p. 12). Introverts are self-
searching and may be afraid of exposing their vulnerabilities when expressing
themselves (i.e., are sensitive to social situations and are afraid of embarrassing
themselves).
Expansion versus reclusion. It is necessary to discuss some traits that may be
components of Introversion and Extroversion in order to fully understand the construct.
38
Dominance (also called ascension) and submission are two personal characteristics that
become evident in social situations (Allport 1924; 1937). Submissive qualities are a
component of Introversion and domineering qualities reflect Extroversion. Submission
is characterized by feeling self-conscious in the presence of powerful others. Dominant
qualities include asserting oneself in a given situation and actively struggling against
others (Allport & Allport, 1921). Related are Allport’s (1921) explanations of expansion
and reclusion. People who exhibit expansion find it easy to talk to others, particularly
when expressing their opinions. Expansive people insert themselves (and their
personalities) into conversations with others. Reclusive people find it difficult to open
up about themselves or to insert their own opinions. While expansion and reclusion are
not mutually inclusive of Introversion and Extroversion, they are related at least in the
current definitions of Introversion and Extroversion. Some of the first measurements of
expansion involve the number of times respondents express their personal views or the
number of times they use personal pronouns when speaking.
Growing versus dwelling. Introverts spend a great deal of time engaging in
self-evaluation whereas extroverts do not dwell on the self frequently or for long periods
of time. Allport (1921) also mentions the relative importance of the opinions of others;
extroverts care little about what others have to say about them while introverts dwell on
the potential criticisms of others. Additionally, introverts retain experiences of praise or
blame in memory for long periods of time because of their preoccupation with the
opinions of others; extraverts tend to ignore or forget their failures. Related to the fear
associated with being perceived negatively by others, introverts tend to take things
39
personally. The extrovert is unconcerned with social evaluation. Lastly, Allport
describes extroverts as being tough-minded and having a pragmatic outlook on life
whereas introverts are sensitive in feeling and idealistic. Allport (1937) also states that
there are emotional components of Introversion-Extraversion; introverts are sensitive to
emotions and delay expression of emotions or react to stimuli in bizarre ways, whereas
extraverts display emotions in a natural way. When dealing with conflicts, extraverts
deal with them in person, while introverts internalize them and handle them in their own
fantasy world.
Influence versus passivity. Extroverts seek the company of others and despise
being alone; introverts find comfort in solitude and avoid the company of others. In
addition, extraverts create a positive social environment and can actually change the
behavior and affect of the people with whom they are interacting (Eaton & Funder,
2003). Extraverts are more likely than introverts to believe that the world is a positive
place and to judge neutral events as positive (Uziel, 2006). Extraversion has also been
found to be related to a drive for social contact, power, status, and intimacy (Wilt &
Revelle, 2009). Extraverts are more likely to seek and attain high status and
accomplishments, fun and excitement, and opportunities to lead and influence others
(Wilt & Revelle, 2009). See Table 2 for a summary of justification mechanisms for
Extraversion.
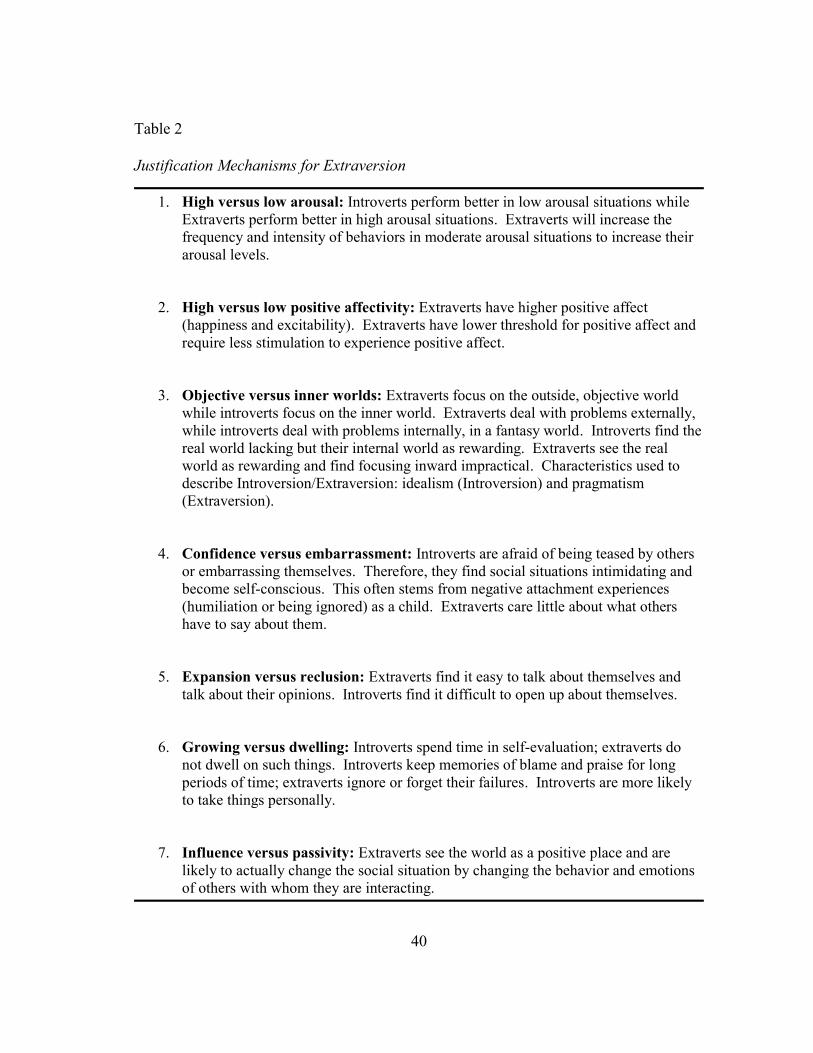
40
Table 2
Justification Mechanisms for Extraversion
1. High versus low arousal: Introverts perform better in low arousal situations while
Extraverts perform better in high arousal situations. Extraverts will increase the
frequency and intensity of behaviors in moderate arousal situations to increase their
arousal levels.
2. High versus low positive affectivity: Extraverts have higher positive affect
(happiness and excitability). Extraverts have lower threshold for positive affect and
require less stimulation to experience positive affect.
3. Objective versus inner worlds: Extraverts focus on the outside, objective world
while introverts focus on the inner world. Extraverts deal with problems externally,
while introverts deal with problems internally, in a fantasy world. Introverts find the
real world lacking but their internal world as rewarding. Extraverts see the real
world as rewarding and find focusing inward impractical. Characteristics used to
describe Introversion/Extraversion: idealism (Introversion) and pragmatism
(Extraversion).
4. Confidence versus embarrassment: Introverts are afraid of being teased by others
or embarrassing themselves. Therefore, they find social situations intimidating and
become self-conscious. This often stems from negative attachment experiences
(humiliation or being ignored) as a child. Extraverts care little about what others
have to say about them.
5. Expansion versus reclusion: Extraverts find it easy to talk about themselves and
talk about their opinions. Introverts find it difficult to open up about themselves.
6. Growing versus dwelling: Introverts spend time in self-evaluation; extraverts do
not dwell on such things. Introverts keep memories of blame and praise for long
periods of time; extraverts ignore or forget their failures. Introverts are more likely
to take things personally.
7. Influence versus passivity: Extraverts see the world as a positive place and are
likely to actually change the social situation by changing the behavior and emotions
of others with whom they are interacting.
41
Agreeableness Justification Mechanisms
In general, Agreeableness pertains to the qualities of being likable and pleasant
and seeking good relations with others. Per social cognitive theory and the law of effect,
Agreeableness is thought to arise due to the repeated engagement in agreeable behaviors
that are beneficial to the individual (Cervone et al., 2001; Thorndike, 1927). Those who
are high in the trait of Agreeableness may find that by being pleasant and likeable, others
will treat them positively (a direct benefit) and may provide them with social support
that may help them accomplish tasks. Those low in Agreeableness also see their
personality as positive. For example, those low in Agreeableness may have pursued
their own wants and needs by acting competitively instead of cooperatively with others.
They are likely to achieve their goals by making others fail and receive rewards on their
own. These ideas will be explored in more detail with the discussion of the justification
mechanisms for Agreeableness.
Getting along versus getting ahead. Some people modify their actions in the
interest of others while some are concerned about their own self-interests. This
characteristic is known as altruism and self-seeking according to Allport (1937). Those
who help others in need report that engaging in these behaviors makes them feel good
(Graziano & Tobin, 2009). This feeling of goodwill can serve as a motivator to continue
to engage in such acts and the repeated engagement in behaviors that elicit that feeling
will eventually lead to the development of an altruistic self; one who is empathetic with
the plights of others and works cooperatively to help them attain their goals. Those high
42
in Agreeableness likely see cooperation as a positive trait and are cooperative with most
people. Those low in Agreeableness may still strive for others, just not many others.
Another trait related to Agreeableness is something Allport (1937) labeled social
intelligence. Social intelligence involves recognizing what is needed in a given social
situation and adjusting one’s behaviors to act in accordance to those needs. Social
intelligence involves being flexible in social situations, tailoring one’s needs to ensure
smooth social interactions (a construct similar to self-monitoring; Snyder, 1974). Those
who utilize one social tactic throughout all interactions lack this trait. Low social
intelligence may also be characterized by social rebellion, espousing one’s personal
values when they are contrary to established custom. For example, a person who shows
up for a job interview for a high-level position wearing shorts instead of a business suit
is exhibiting low social intelligence. Although some people may engage in the same
behavior out of ignorance, those exceptionally low in Agreeableness desire to rebel and
dresses how he or she pleases because of rugged individualism.
Sympathy versus retaliation. People high in Agreeableness are more likely
than their less agreeable counterparts to see others in a positive light and to make
excuses for other’s shortcomings (Graziano & Tobin, 2009). Because engaging in these
behaviors is likely to produce new friendships, those high in Agreeableness are likely to
see them as positive, continue to engage in them in the future and to incorporate them
into the sense of self. High Agreeableness is associated with perceiving less conflict in
social interactions, transforming competitive situations into cooperative ones and using
more constructive conflict resolution techniques (Graziano & Tobin, 2009).
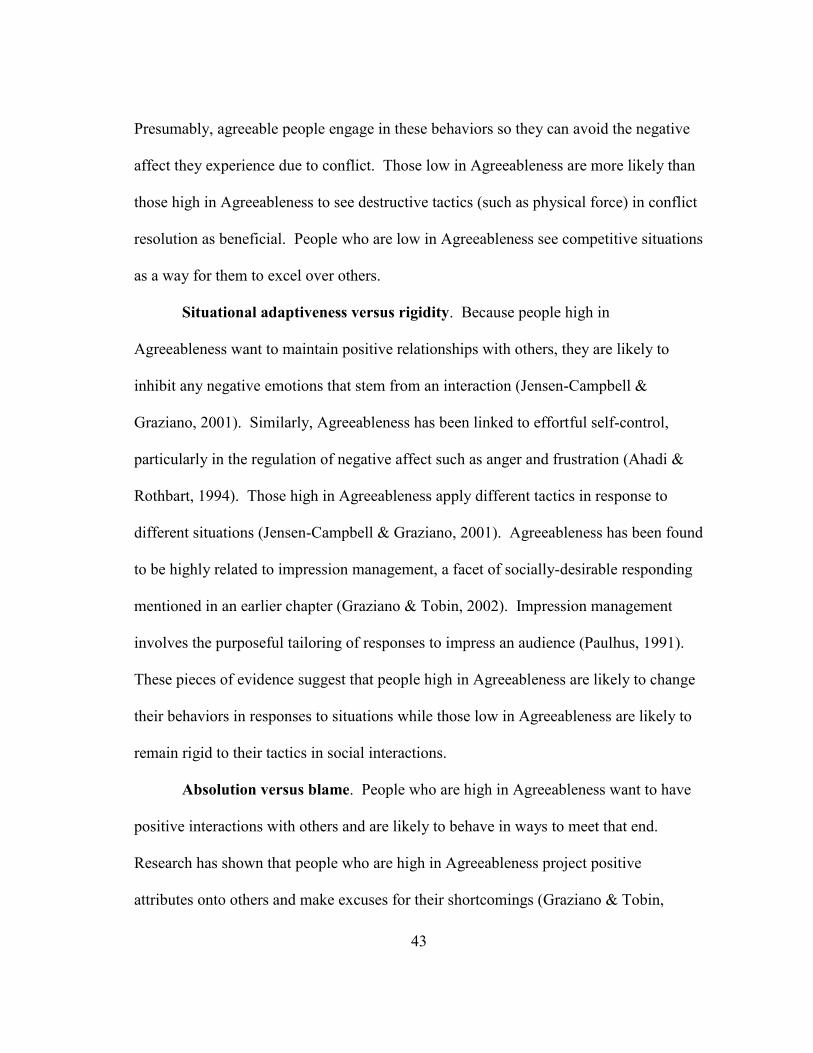
43
Presumably, agreeable people engage in these behaviors so they can avoid the negative
affect they experience due to conflict. Those low in Agreeableness are more likely than
those high in Agreeableness to see destructive tactics (such as physical force) in conflict
resolution as beneficial. People who are low in Agreeableness see competitive situations
as a way for them to excel over others.
Situational adaptiveness versus rigidity. Because people high in
Agreeableness want to maintain positive relationships with others, they are likely to
inhibit any negative emotions that stem from an interaction (Jensen-Campbell &
Graziano, 2001). Similarly, Agreeableness has been linked to effortful self-control,
particularly in the regulation of negative affect such as anger and frustration (Ahadi &
Rothbart, 1994). Those high in Agreeableness apply different tactics in response to
different situations (Jensen-Campbell & Graziano, 2001). Agreeableness has been found
to be highly related to impression management, a facet of socially-desirable responding
mentioned in an earlier chapter (Graziano & Tobin, 2002). Impression management
involves the purposeful tailoring of responses to impress an audience (Paulhus, 1991).
These pieces of evidence suggest that people high in Agreeableness are likely to change
their behaviors in responses to situations while those low in Agreeableness are likely to
remain rigid to their tactics in social interactions.
Absolution versus blame. People who are high in Agreeableness want to have
positive interactions with others and are likely to behave in ways to meet that end.
Research has shown that people who are high in Agreeableness project positive
attributes onto others and make excuses for their shortcomings (Graziano & Tobin,
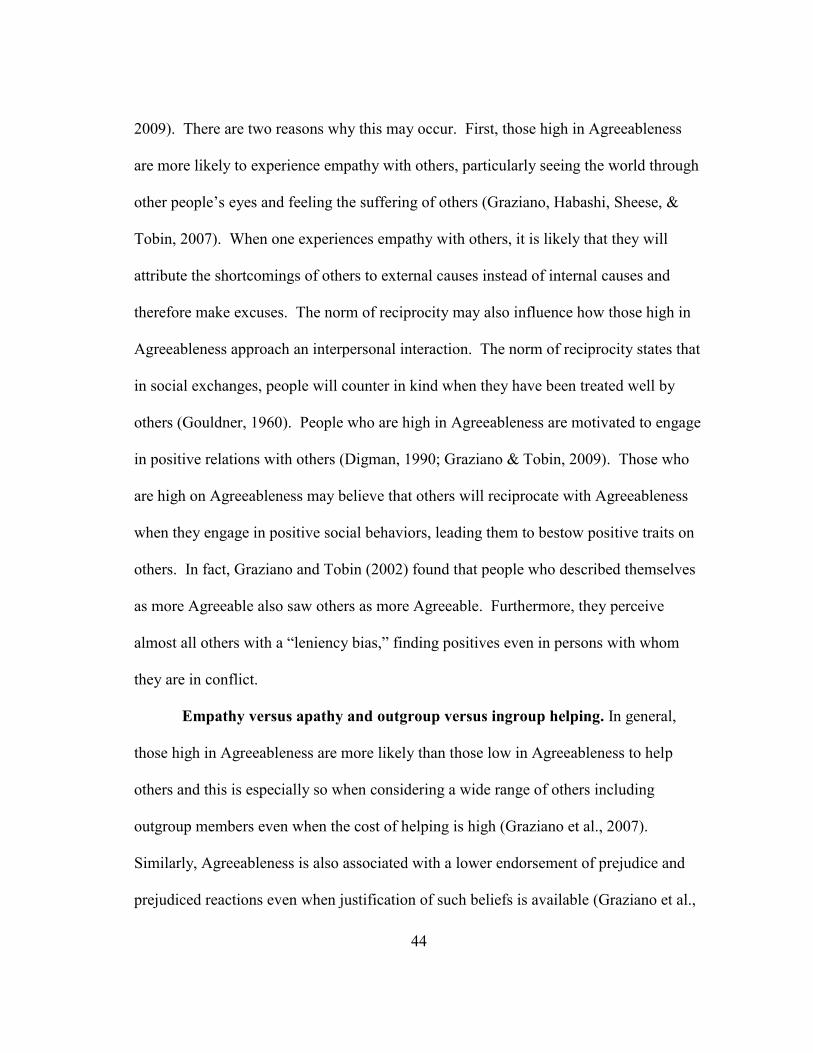
44
2009). There are two reasons why this may occur. First, those high in Agreeableness
are more likely to experience empathy with others, particularly seeing the world through
other people’s eyes and feeling the suffering of others (Graziano, Habashi, Sheese, &
Tobin, 2007). When one experiences empathy with others, it is likely that they will
attribute the shortcomings of others to external causes instead of internal causes and
therefore make excuses. The norm of reciprocity may also influence how those high in
Agreeableness approach an interpersonal interaction. The norm of reciprocity states that
in social exchanges, people will counter in kind when they have been treated well by
others (Gouldner, 1960). People who are high in Agreeableness are motivated to engage
in positive relations with others (Digman, 1990; Graziano & Tobin, 2009). Those who
are high on Agreeableness may believe that others will reciprocate with Agreeableness
when they engage in positive social behaviors, leading them to bestow positive traits on
others. In fact, Graziano and Tobin (2002) found that people who described themselves
as more Agreeable also saw others as more Agreeable. Furthermore, they perceive
almost all others with a “leniency bias,” finding positives even in persons with whom
they are in conflict.
Empathy versus apathy and outgroup versus ingroup helping. In general,
those high in Agreeableness are more likely than those low in Agreeableness to help
others and this is especially so when considering a wide range of others including
outgroup members even when the cost of helping is high (Graziano et al., 2007).
Similarly, Agreeableness is also associated with a lower endorsement of prejudice and
prejudiced reactions even when justification of such beliefs is available (Graziano et al.,
45
2007). The mechanism through which this behavior occurs is Agreeableness’
relationship to empathetic concern. Those high in Agreeableness are better able to see
the world through other people’s points of view and to sympathize with others’ emotions
leading to increased empathy with others. See Table 3 for a summary of justification
mechanisms for Agreeableness.
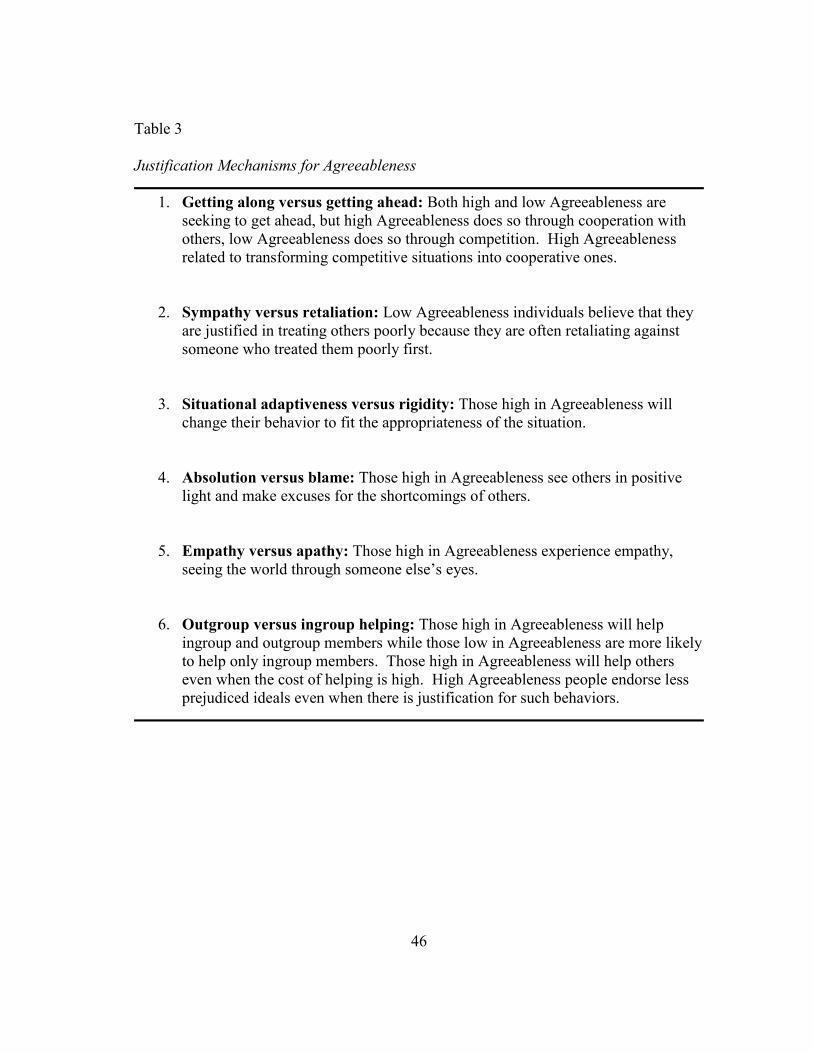
46
Table 3
Justification Mechanisms for Agreeableness
1. Getting along versus getting ahead: Both high and low Agreeableness are
seeking to get ahead, but high Agreeableness does so through cooperation with
others, low Agreeableness does so through competition. High Agreeableness
related to transforming competitive situations into cooperative ones.
2. Sympathy versus retaliation: Low Agreeableness individuals believe that they
are justified in treating others poorly because they are often retaliating against
someone who treated them poorly first.
3. Situational adaptiveness versus rigidity: Those high in Agreeableness will
change their behavior to fit the appropriateness of the situation.
4. Absolution versus blame: Those high in Agreeableness see others in positive
light and make excuses for the shortcomings of others.
5. Empathy versus apathy: Those high in Agreeableness experience empathy,
seeing the world through someone else’s eyes.
6. Outgroup versus ingroup helping: Those high in Agreeableness will help
ingroup and outgroup members while those low in Agreeableness are more likely
to help only ingroup members. Those high in Agreeableness will help others
even when the cost of helping is high. High Agreeableness people endorse less
prejudiced ideals even when there is justification for such behaviors.
47
CHAPTER VII
THE CURRENT STUDY: FAKING ON TRADITIONAL PERSONALITY TESTS
AND CONDITIONAL REASONING TESTS FOR EXTRAVERSION AND
AGREEABLENESS
Traditional Personality Tests
The current project focuses on developing CRTs for two factors of the Big Five:
Extraversion and Agreeableness and investigates the impact of faking for both traditional
and conditional reasoning tests. As mentioned in Chapter 3, previous research has found
that for traditional personality tests, people have the ability to fake when instructed to do
so (Hough et al., 1990; Viswesvaran & Ones, 1999), therefore, the following hypothesis
for the current study is proposed:
Hypothesis 4: Test takers will be able to fake on traditional personality tests
when instructed to do so such that test scores for individuals in a “fake good”
condition will have higher mean scores than individuals in an honest response
condition.
Test characteristics may also impact whether or not a test taker has the ability or
opportunity to fake. Faking on cognitive ability tests is difficult because these tests only
have one logical answer. The purpose of traditional personality tests is to identify
whether (or to what extent) an individual possesses a particular characteristic and,
therefore, has many logically plausible answers. This is the reasoning for the continued
concern over the faking of non-cognitive measures. If test takers are notified that the
48
test they are about to take is a personality test, it is likely to reinforce the subjective
nature of personality and signal the ability and opportunity to fake on such a test.
Therefore,
Hypothesis 5: Differences will exist when the true nature of the traditional
personality test is revealed such that mean scores on the personality test will be small,
yet significantly higher when test takers are told the test they are about to take is a
personality test than when they are not directly told it is a personality test.
As mentioned earlier, Extraversion and Agreeableness are important predictors
of job-related outcomes (Barrick et al., 2001; Hough & Furnham, 2003). While other
factors of the Big Five may contribute to a larger proportion of variance in job
performance, Extraversion and Agreeableness are influenced by socially desirable
responding (Paulhus & John, 1998). Paulhus and John (1998) report that self-deceptive
enhancement correlates most positively with Extraversion and Openness to Experience
while impression management correlates most positively with Agreeableness and
Conscientiousness. When selecting these particular constructs, careful consideration
was given to the amount of research dedicated to the underlying motives of these traits
because that is how justification mechanisms can be identified. Agreeableness and
Extraversion both have a long history of theoretical development (Allport & Allport,
1921; Thorndike, 1927).
Paulhus and John (1998) describe different types of biases associated with self-
deception: egoistic bias and moralistic bias. Egoistic bias describes the tendency to
exaggerate one’s social and intellectual status and is argued to be rooted in the
49
perception of an individual to act upon the social world. This egoistic bias results in a
motive to express personality dimensions such as Power, Dominance, Fearlessness,
Emotional Stability, Intellect, and Creativity. Alternatively, the moralistic bias involves
self-deception and derives from a need to seek approval from others. The moralistic bias
results in a tendency to eschew socially deviant impulses, instead espousing “saint-like
qualities” such as Agreeableness, Dutifulness, and Nurturance (Paulhus & John, 1998,
pp. 1026). Factor analyses have supported these distinctions, confirming two self-
favorability factors (Paulhus & John, 1998). Data suggest that the egoistic bias is indeed
comprised of Extraversion, Dominance, Intellect, and Openness and the moralistic bias
is comprised of Agreeableness, Dutifulnesss, and Nurturance.
Agreeableness has been found to be related to self-deception and Extraversion
has been found to be related to impression management (Paulhus & John, 1998). It is
likely that characteristics related to impression management are more susceptible to
faking because this type of faking is more likely to be conscious to the test taker.
Characteristics that are related to self-deception on the other hand are likely to be less
susceptible to faking because the test taker is not aware of their own status regarding the
personality trait. Therefore,
Hypothesis 6: Traditional personality tests of Extraversion will be more
susceptible to faking as evidenced by mean score differences than traditional
tests of Agreeableness.
50
Conditional Reasoning Tests
The current study will also test whether a new conditional reasoning test intended
to measure Agreeableness and Extraversion is impervious to faking by test takers. It has
been argued that the implicit nature of conditional reasoning tests circumvents the
potential problem of faking because people are unable to alter that of which they are
unaware (James, 1998; James & Mazerolle, 2003). It is unclear as to whether it is the
implicit nature of the test (as has been suggested by James and colleagues) or whether it
is the obfuscation of the true nature of the test (i.e., presented the test as a measure of
reasoning ability instead of personality) that is responsible for the resistance to faking on
CRTs. This study will directly examine this issue. As mentioned previously, CRTs are
purported to measure aspects of personality that occur outside one’s own consciousness.
People can distort their responses on personality tests because they see themselves too
positively (i.e., self-deception; Dunning, Heath, & Suls, 2004; Paulhus & John, 1998).
Because CRTs are designed to tap into subconscious motives that theoretically underlie
traits, CRTs should effectively circumvent the social desirability of traits. In addition,
the concealed purpose of the test prohibits test takers from knowing the best way to fake
a test and will result in decreased faking as compared to a test whose true purpose is
known. CRTs are designed to look like an inductive reasoning test. People who are
intentionally distorting their responses will try to select the most rational response
without regard for personality traits. Therefore,
Hypothesis 7: Test takers will not be able to fake on conditional reasoning tests
when instructed to do so such that test scores for individuals in a “fake good”
51
condition will not be significantly different than the test scores of individuals in
an honest response condition.
Hypothesis 8: Conditional reasoning tests will be less susceptible to faking than
traditional personality tests as evidenced by standardized mean score differences.
A CRT should reduce faking because it misleads fakers to the purpose of the test.
Although the benefits of CRTs as a way to eliminate faking concerns have been
widely theorized in the literature, only one study to date has empirically tested this claim
(LeBreton et al, 2007). LeBreton et al. (2007) investigated the impact of preserving the
obfuscated purpose of the test on faking. The authors found that once the true nature of
the CRT as a personality test was revealed, participants were able to distort their
responses on the test (partial η2 = .83). However, when the true nature of the test was
not revealed to participants, no mean differences were found for scores on an Aggression
CRT under “fake good” and control conditions. LeBreton et al. (2007) argued that when
the purpose of the test is revealed to participants, the measure becomes explicit as
opposed to implicit and is therefore susceptible to faking. The test is susceptible to
faking when the true nature of the test remains hidden. It is important to investigate
whether the same effects apply to other constructs besides Aggression.
Hypothesis 9: Conditional reasoning tests for Agreeableness and Extraversion
will only be resistant to faking when the purpose of the test is not revealed to
participants. When the purpose of the test is revealed to participants, mean score
differences will be higher when participants are instructed to “fake good” than
when participants are instructed to respond honestly.
52
If, indeed, CRTs become explicit tests when the true nature of the test is
revealed, then they in essence operate similar to traditional personality tests. Although
the difference between scores when instructed to fake good or respond honestly are
likely to have only slight effects for traditional personality tests, the impact of the
revelation that the test is a personality test will have a profound impact on the CRT.
Hypothesis 10: There will be a greater impact of the revelation of the purpose of
the test on faking for CRTs compared to traditional personality tests.
Because it is hypothesized that CRTs will only be resistant to faking when the
purpose of the test is concealed from the test taker, standardized mean score differences
for the “fake good” and honest responding conditions will be smallest (i.e., least impact
of faking) for the CRT when the purpose of the test is not revealed. There will be larger
standardized mean score differences for faking (i.e., greater impact of faking) for the
traditional personality test when the purpose of the test is not revealed because the
traditional test is an explicit test. It is expected that there will be slightly greater
standardized mean score differences in faking for the traditional personality test when
the purpose of the test is revealed and that when the purpose of the test is revealed for
the CRT, standardized mean score differences in faking will be similar to the traditional
test.
From a theoretical standpoint, it is interesting to study the ability of CRTs to
deter faking of egoistic and moralistic factors. The two factors have different motives
that drive different types of faking (i.e., self-deception and impression management).
Because of the unique ability of CRTs to tap into people’s rationalizations, it may be
53
easier (or more difficult) for people to fake constructs that are related to self-deception
or impression management. In particular, it may be more difficult for individuals to fake
on an Agreeableness CRT where the moralistic bias arises because the justification
mechanisms (JMs) are more deeply ingrained. Similarly, it may be easier to fake the
Extraversion CRT because it is related to the egotistic bias and the JMs are more
superficial. These differences may become more pronounced if the true nature of the
CRT as a measure of personality is revealed. By revealing the true nature of the test, test
takers are likely to be cued into the fact that response options are designed to
differentiate between low and high levels of a particular personality trait. After reading
all of the response options, test takers may be more likely to see that two of the response
options are comprised of opposite conclusions to the item prompt and therefore are
likely the responses that are related to the personality trait. For traits related to the
egoistic bias, such as Extraversion, it may be easier for test takers to see the logical
appeal of both personality response options since the JMs are not as deeply held. For
example, assume that a test taker is aware of the fact that they are low in Extraversion
but are being driven to respond in a way that would present himself as high in
Extraversion. If the true nature of the test is revealed, the test taker may be better able to
mentally label the two personality congruent response options as representing either high
or low Extraversion. Because both response options are valid and the JMs for
Extraversion are more superficial, it may be easier for the low Extraversion test taker to
simply choose the response option that is opposite of the way he truly feels. However,
for traits related to the moralistic bias, such as Agreeableness, the JMs are more deeply
54
ingrained and it becomes much more difficult for the test taker to see the opposing
response option as logical. Given that the test taker is instructed to choose the logical
response, and two of the response options are clearly illogical, the only choice the test
taker has is to select the option that aligns with his personality. Based on this reasoning,
Hypothesis 11: For the conditional reasoning tests, the Extraversion construct
will be more susceptible to faking than the Agreeableness construct as evidenced
by mean score differences.
The process of completing a CRT involves the indirect measurement of the
constructs being tested. In traditional personality tests, the process is overt, making it
theoretically easier to fake on these tests. While the type of construct being measured
(i.e., egoistic or moralistic factors) is likely to influence responding in both types of
personality tests, the propensity of egoistic factors to be more susceptible to faking is
likely to have a more pronounced impact in the traditional personality tests where there
is no competing forces from justification mechanisms. Therefore,
Hypothesis 12: There will be a greater impact of the type of construct (egoistic or
moralistic) on faking for the traditional personality test than the CRT such that
standardized mean score differences for the “fake good” and honest responding
conditions is greatest (i.e., more impact of faking) for the traditional Extraversion
test, followed by the traditional Agreeableness test, the Extraversion CRT, and
the Agreeableness CRT.
Taking all hypotheses together, a pattern of expected relationships emerges
among all four factors (construct, faking, type of test, purpose of test) in the current
55
study. For traditional tests, test takers are expected to be able to fake when instructed to
do so, leading to higher mean differences for those in the “fake good” condition
compared to the honest responding condition (Hypothesis 4). Additionally, it is
expected for traditional tests that there will be a small, yet significant, increase in the
ability to fake when the purpose of the test is revealed instead of when it is kept hidden
(Hypothesis 5). It is also expected that it will be easier to fake the Extraversion
construct compared to the Agreeableness construct (Hypothesis 6). For CRTs, it is
expected that test takers will have difficulty faking these tests (Hypothesis 7) compared
to traditional personality tests (Hypothesis 8), but only when the true purpose of the test
remains hidden (Hypotheses 9 and 10). The Agreeableness CRT will be more difficult
to fake than the Extraversion CRT (Hypothesis 11); however, the impact of the type of
construct being measured is greater for traditional tests than CRTs (Hypothesis 12).
Therefore,
Hypothesis 13: The type of test, construct, and the purpose of the test will
interact to produce significant differences in faking.
Standardized mean score differences between the “fake good” and honest
responding conditions will be the least (i.e., little effect of faking) for the Agreeableness
CRT when the purpose of the test is not revealed. There will be a slightly greater impact
of faking (i.e., higher standardized mean score differences) for the Extraversion CRT
when the purpose of the test is not revealed. However, it is expected that once the
purpose of the test is revealed, the CRT will function as an explicit test and standardized
mean score differences for the “fake good” and honest responding conditions will be
56
similar to the traditional tests. Standardized mean score differences between the “fake
good” and honest responding conditions for the traditional test will be greater for the
Agreeableness and Extraversion traditional personality tests when the purpose of the test
as a personality measure is not revealed than the CRT when the purpose of the test as a
personality measure is not revealed. However, the Extraversion traditional test will have
a greater impact of faking than the Agreeableness traditional test. When the purpose of
the test is revealed, standardized mean score differences between the “fake good” and
honest responding conditions for both the traditional tests and CRTs will be greater than
any of the previous conditions. CRT and traditional tests of Extraversion will have the
greatest impact of faking as evidenced by standardized mean score differences, followed
by tests of Agreeableness. Standardized mean score differences for these types of tests,
when the purpose of the test is revealed, will be similar for CRTs and traditional tests.
Please see Table 4 for a summary of study hypotheses.
The current study investigates the impact of faking on a relatively new method of
measurement, the conditional reasoning test. In order to explore this research topic, it
was necessary to create two new CRTs for Agreeableness and Extraversion. For the
current study, there are 4 main variables as evidenced by the hypotheses. The current
study investigates the impact of faking based on type of test (CRT vs. traditional),
construct (Extraversion vs. Agreeableness), and whether or not the true purpose of the
test is revealed.
Participants were assigned to one of four experimental conditions. Some factors
were studied within subjects (type of test and construct) and others between subjects
57
(faking and revelation of the purpose of the test). This design will require a smaller
sample size for analysis and lead to more robust assertions than a complete between-
subjects design (Maxwell & Delaney, 2004). A fully within-subjects design would be a
more robust analysis; however, the time requirements for participants would be onerous
and there may be issues with retest effects. Therefore, it is necessary to counterbalance
both the type of test and the construct being measured in order to remove a potential
confounding order effects. Order effects may occur when tests are closely presented in
time to test takers. Practice effects are defined as increase in a subject’s test score from
one administration to the next in the absence of any interventions (Bartels, Wegrzyn,
Wiedl, Ackermann, & Ehrenreich, 2010). There are a number of reasons why practice
effects may exist; however, the most important issue in this study is recall effects due to
the minimal down time between tests. Each participant is asked to complete all tests
successively, and the likelihood that each may remember previous responses is great.
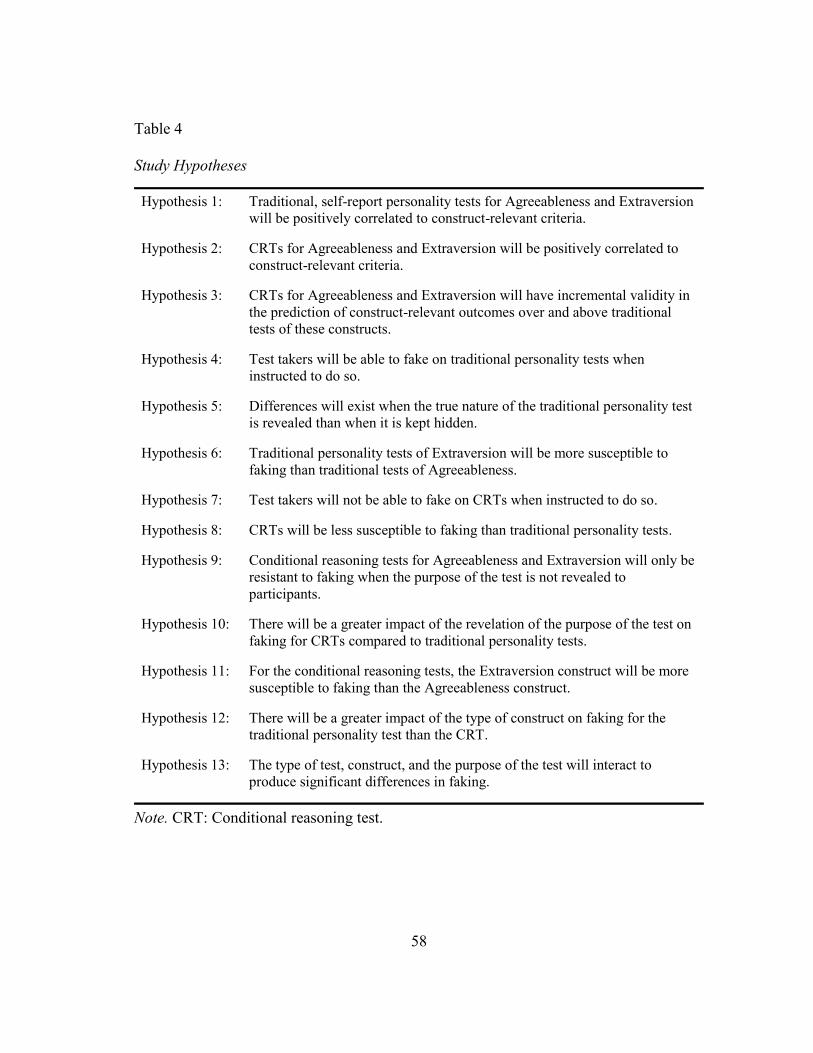
58
Table 4
Study Hypotheses
Hypothesis 1: Traditional, self-report personality tests for Agreeableness and Extraversion
will be positively correlated to construct-relevant criteria.
Hypothesis 2: CRTs for Agreeableness and Extraversion will be positively correlated to
construct-relevant criteria.
Hypothesis 3: CRTs for Agreeableness and Extraversion will have incremental validity in
the prediction of construct-relevant outcomes over and above traditional
tests of these constructs.
Hypothesis 4: Test takers will be able to fake on traditional personality tests when
instructed to do so.
Hypothesis 5: Differences will exist when the true nature of the traditional personality test
is revealed than when it is kept hidden.
Hypothesis 6: Traditional personality tests of Extraversion will be more susceptible to
faking than traditional tests of Agreeableness.
Hypothesis 7: Test takers will not be able to fake on CRTs when instructed to do so.
Hypothesis 8: CRTs will be less susceptible to faking than traditional personality tests.
Hypothesis 9: Conditional reasoning tests for Agreeableness and Extraversion will only be
resistant to faking when the purpose of the test is not revealed to
participants.
Hypothesis 10: There will be a greater impact of the revelation of the purpose of the test on
faking for CRTs compared to traditional personality tests.
Hypothesis 11: For the conditional reasoning tests, the Extraversion construct will be more
susceptible to faking than the Agreeableness construct.
Hypothesis 12: There will be a greater impact of the type of construct on faking for the
traditional personality test than the CRT.
Hypothesis 13: The type of test, construct, and the purpose of the test will interact to
produce significant differences in faking.
Note. CRT: Conditional reasoning test.
59
CHAPTER VIII
METHOD
Participants
Participants were recruited through an online subject recruitment organization,
StudyResponse. StudyResponse is an academic recruitment website that agrees to email
a link to the study to its current list of members for a fee. In addition, StudyResponse
sends reminder emails and prescreens participants based on qualifying criteria. Previous
research has shown that data collected from online recruiting sites are relatively similar
to the data collected from student, other internet, and worker samples (Barger, & Sinar,
2011; Behrend, Sharek, Meade, & Wiebe, 2011; Buhrmester, Kwang, & Gosling, 2011;
Paolacci, Chandler, & Ipeirotis, 2010). Due to the relatively high reading demands and
cultural context of the CRT items used in this study, participants were prescreened for
adequate U.S. English reading comprehension and were required to reside in the U.S.
The study took approximately 1 hour to complete and respondents were financially
compensated for their time in accordance with the minimum pay rate suggested by
StudyResponse ($10 per hour).
Using G*Power, an a priori power analysis was conducted to determine the
minimum sample size required to detect effects within the study (Faul, Erdfelder, Lang,
& Buchner, 2007). A total sample size of 176 (11 per condition) is required in order to
achieve an acceptable power level (.90) to detect small effects (d = .25). This value
includes two extra factors for counterbalancing the type of test (traditional and CRT) and
60
the construct (Agreeableness and Extraversion) so as to reduce test-retest effects. In
order to ensure that the final sample contained the needed number of participants, a
sample size of 208 (13 per condition) was sought from StudyResponse. This
oversampling allowed the researcher to omit cases due to missing data, if needed.
Thirty-one participants were excluded from analyses either based on missing data
(when at least one predictor scale was missing) or when the amount of time taken to
complete the study was below 30 minutes, indicating lack of engagement in the study.
This resulted in a final sample of 187 participants. Of these participants, 152 (81.3%)
were Caucasian, 12 (6.4%) were Black, and 9 (4.8%) were Hispanic. A total of 79
(42.2%) participants were male and the average age of the group was 48.32 years of age
(SD = 13.01). Approximately 70% were members of the workforce.
The mean age for this study was 48 years old (SD = 13). Compared to many
other studies which sample only college students, the age of this sample is more diverse
and thus may be more generalizable to the working population. The average level of
education was between an Associate’s degree and a Bachelor’s degree and participants
generally were native English speakers and could read and comprehend complex written
English. Based on this information, it is expected that the sample was able to understand
the conditional reasoning test (CRT) items.
Study Design and Methodology
A within- and between-subjects, 2 (type of test) x 2 (test construct) x 2 (purpose
of test) x 2 (faking condition) mixed design was utilized to test whether Agreeableness
or Extraversion CRTs are fakeable and, if so, whether the fakeability is due to the

61
implicit nature of the test or the obfuscated nature of the items of the test. The within-
subjects factors for this study were type of test (traditional or CRT) and construct
(Agreeableness or Extraversion). The between-subjects factors for this study were
faking (“fake good” or honest responding) and (purpose of the test (revealed or not
revealed). Participants completed both a traditional, self-report and a conditional
reasoning test for Extraversion and Agreeableness (2 x 2 within-subjects conditions).
Half of the participants had the true nature of the tests (i.e., measurement of personality)
revealed to them while others had the true nature of the tests not revealed (between-
subjects condition). In addition, half of the participants were instructed to respond
honestly to all the tests while half the participants were instructed to respond as though
they were applying for a job that was attractive and required them to score high on
Extraversion or Agreeableness (i.e., the “fake good” condition). Participants also
completed a demographics questionnaire, a manipulation check, measures of face
validity, and several criterion measures.
Participants were placed into experimental conditions using random assignment.
At the beginning of the study, participants entered the last four digits of their telephone
number. The platform that hosted the survey, Qualtrics, then randomly placed
participants in one of 16 experimental conditions. These experimental conditions
consisted of four levels of the two between-subjects factors (faking condition and
purpose of test). For each of the between-subjects conditions, there were a total of four
possible combinations of the within-subjects factors (two levels of the two factors that
were counterbalanced). This design represents a Latin Square design in which one
62
traditional personality test always follows the other traditional personality test and the
conditional reasoning test always follows the other conditional reasoning test.
Participants were placed into experimental conditions with the criteria that sample sizes
for each were to remain relatively equal (N ~ 13).
Measures
Demographics questionnaire. Participants completed a demographics
questionnaire. Participants were asked their age, sex, race, and level of educational
attainment. In addition, participants self-reported their U.S. residency and ability to read
and understand the English language. These last items were included in the
questionnaire in order to verify that participants met study inclusion criteria.
Traditional personality test. The NEO-PI-R (Goldberg, 1999) was used as a
“traditional” measure of Agreeableness and Extraversion. This measure consisted of ten
items per construct. Data consisted of ratings of short phrases on a five-point scale
(Very Inaccurate to Very Accurate). An example of an Agreeableness item is, “I make
friends easily” and an example of an Extraversion item is, “I feel comfortable around
people.”
Conditional reasoning tests. Two conditional reasoning tests were developed
by the researcher to assess Agreeableness and Extraversion. The Agreeableness CRT
consisted of 18 items and the Extraversion CRT consisted of 15 items. Participants were
required to read a short passage and select which option of four best answered the
question in the item stem. In the following paragraphs, the development of the CRTs is
described.
63
The justification mechanisms for Agreeableness and Extraversion determined
during the literature review process were empirically supported using an undergraduate
student sample via an on-line survey. First, 91 (74% female, 70% White) students’
personalities were assessed using the NEO-PI-R (10 items per facet; Goldberg, 1999).
Participants were then asked to respond to several questions asking them to describe
instances when they were particularly extraverted and introverted as well as particularly
agreeable and disagreeable and to provide reasoning as to why they believed they
behaved in that way. An example item was “Think of a time when you were particularly
outgoing, sociable, talkative, or assertive. Describe the situation and how you reacted in
the space below. Also, why do you think you behaved in this way? What was your
interpretation of the events?” After the data were collected, individuals scoring in the 10
percent of highest or lowest Extraversion scores and the 10 percent highest and lowest
Agreeableness scores were selected and their responses to the descriptions and
explanations of the questions were examined. Responses were content analyzed to
provide evidence of the justification mechanisms developed through the literature
review. This step confirmed the existence of the previously described justification
mechanisms for Agreeableness and Extraversion; no justification mechanisms were
changed, added, or removed.
A total of 18 Agreeableness items and 15 Extraversion items were created based
on the justification mechanisms outlined in the introduction. For each justification
mechanism listed, several items were created. The topic of these items was broad and
typically focused on areas in which competing viewpoints, research, or conclusions
64
could be readily conceived. Item topics were generated through two different strategies.
Sometimes, current events were used as the foundation for items, but careful
consideration was taken to ensure that item topics would not become obsolete in the
future. Also, responses from the highest and lowest Agreeableness and Extraversion
scorers on the survey described in the preceding paragraph were used to generate item
topics. This step allowed the test author to generate items that were relevant to real-
world experiences. Depending upon the topic that was chosen for a particular item, an
item generation strategy was selected (see James, 1998 for a description of CRT item
writing strategies).
As a concrete example of the item generation process, I will explain the
technique I used to create an Agreeableness CRT item. Beginning with the justification
mechanism “Social Adaptiveness versus Rigidity” (see Table 3), I selected an item
generation technique by contemplating the meaning of the particular JM. Social
Adaptiveness versus Rigidity refers to the concept that those who are high in
Agreeableness are more likely than those low in Agreeableness to change their behavior
to fit the appropriateness of the situation. Next, I imagined contexts in which Social
Adaptiveness could be both appropriate and inappropriate depending upon the way a
person looks at the situation. For example, honesty is typically seen as a virtue and thus
many people would believe that honesty is always a good quality to possess; however,
others may believe that it is important to sometimes tell “little white lies” to others,
particularly when it involves the feelings of others. With this item content in mind, I
chose the item generation strategy that seemed appropriate, in this case “Positive versus

65
Negative Consequences.” If those high and low in Agreeableness deem the
appropriateness of complete honesty differently, then it follows that these people would
expect different outcomes if one were to always be honest with others. People low in
Agreeableness will believe that constancy in behavior is good no matter what the
situation demands and will thus see the consequence of always being honest as positive
(e.g., you get to be true to yourself when you are always honest). Those high in
Agreeableness, on the other hand, believe that people should adapt their behavior to the
situation and thus see the consequence of always being honest as negative (e.g., it might
offend other people if you are honest about a person’s disheveled look). This process
led to the final item, seen in Table 5.
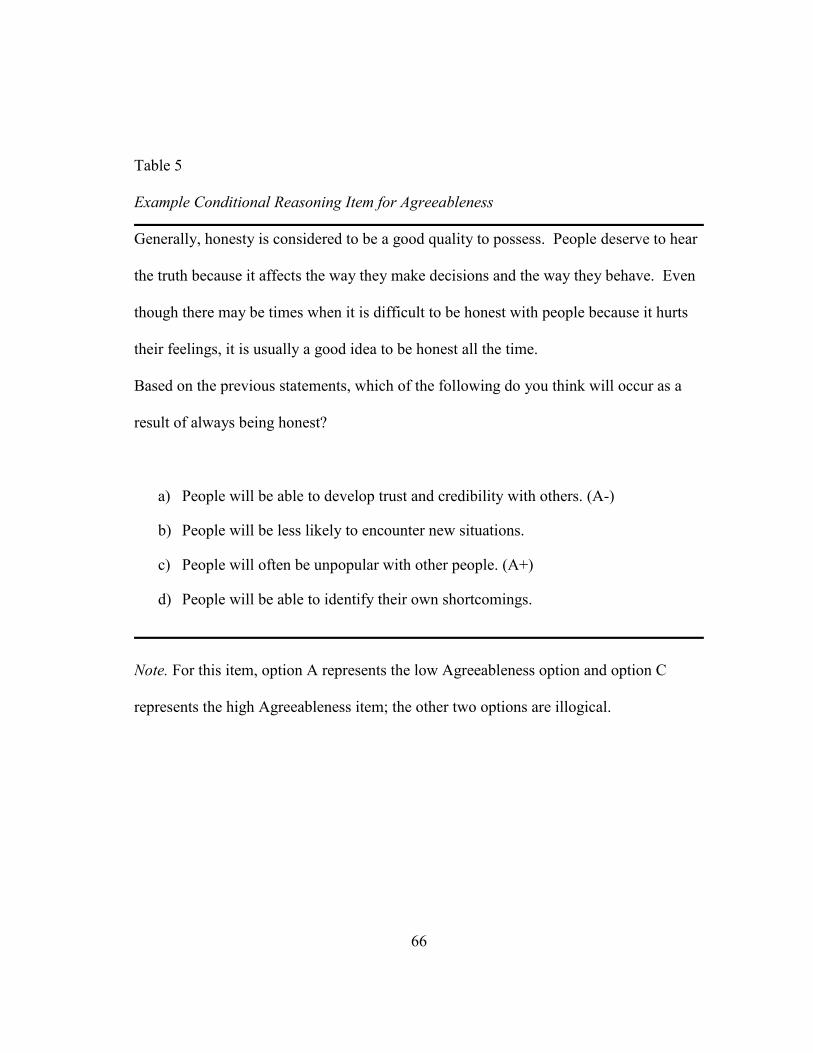
66
Table 5
Example Conditional Reasoning Item for Agreeableness
Generally, honesty is considered to be a good quality to possess. People deserve to hear
the truth because it affects the way they make decisions and the way they behave. Even
though there may be times when it is difficult to be honest with people because it hurts
their feelings, it is usually a good idea to be honest all the time.
Based on the previous statements, which of the following do you think will occur as a
result of always being honest?
a) People will be able to develop trust and credibility with others. (A-)
b) People will be less likely to encounter new situations.
c) People will often be unpopular with other people. (A+)
d) People will be able to identify their own shortcomings.
Note. For this item, option A represents the low Agreeableness option and option C
represents the high Agreeableness item; the other two options are illogical.
67
In order to generate items, it was also necessary to learn some basic principles of
logic in order to ensure the inductive reasoning quality of the items. The author of the
test checked the items for proper argument form (e.g., modus ponens and modus tollens),
logical fallacies, rules of inference, and methods of agreement based on mathematical
and philosophical logics (Bell, DeVidi, & Solomon, 2001; Hurley, 2008). Specifically,
the modus ponens argument form determines consequences based a set of antecedent
parameters, such as “If a psychology student graduated, then the student must have taken
a statistics course. Molly is a psychology student who graduated; therefore, she must
have taken a statistics course.” The modus tollens is similar to the modus ponens but
determines a consequence based on a negative argument: “If it is Tuesday, then you have
yoga class. You do not have yoga class, therefore it is not Tuesday.” The investigation
into classical logic texts combined with the item revision process mentioned below
strengthened the illogical nature of the distractor items (similar to techniques used by
James, 1998).
Following item generation, graduate students and faculty members reviewed the
18 Agreeableness items and 15 Extraversion items. All graduate students who reviewed
items were familiar with the concept of CRTs due to their participation in a graduate-
level class in individual differences. A total of five people reviewed the Agreeableness
items and a total of four people reviewed the Extraversion items. Reviewers provided
feedback on grammatical and typographical errors in the items, readability and
understandability of the items for a typical undergraduate student, the ability of the item
to measure the personality trait being assessed, contamination of the item by other
68
constructs, and the appropriateness of the illogical options. The existing CRT items
were edited based on reviewer feedback.
Experimental Conditions
The 2 x 2 within-subjects portion of the study was manipulated by having
respondents complete both the traditional, Likert-type personality measure and the CRT
for both Agreeableness and Extraversion constructs. Depending on experimental
condition, the participants responded either under honest or “fake good” conditions with
either the true purpose of the test revealed or the true purpose kept hidden. Participants
were given a target for faking good, a sales job that required the test taker to possess
construct-relevant characteristics (see instruction sets below). These between-subjects
conditions were manipulated using different instruction sets. Instructions for the
experimental manipulations related to faking were derived from a similar study
investigating the effects of response instructions on faking situational judgment tests
(Nguyen, Biderman, & McDaniel, 2005). In addition, half of the participants were told
the true purpose of the tests (i.e., measuring personality) and half of the participants were
not told the true purpose of the test. This methodology has been utilized in other faking
studies (e.g., LeBreton et al., 2007). This methodology resulted in four sets of
instructions for each type of test (see below). See Table 6 for sample size for each
condition.
Traditional Personality Test Instructions: Honest Condition, Purpose of Test Not
Revealed: Below are phrases describing people. Please use the rating scale
below to describe how accurately each statement reflects you. Describe yourself
69
as you generally are now, not as you wish to be in the future. Describe yourself
as you honestly see yourself, in relation to other people you know of the same
gender as you are, and roughly your same age. It is very important that you
answer as honestly as possible even if you think the phrase is negative or
unflattering. Remember that your responses will be used for research purposes
only and no one will have access to your responses.
Traditional Personality Test Instructions: Fake Good Condition, Purpose of Test
Not Revealed: Imagine that you are applying for a job as a sales representative.
This job is very attractive to you because it is high paying. However, people in
this role must be social and assertive (for the Extraversion construct) or friendly
and cooperative (for the Agreeableness construct). You have been asked to take
this test as part of the hiring process. Please respond in a way that would best
guarantee that you would get the sales representative job.
Traditional Personality Test Instructions: Honest Condition, Purpose of Test
Revealed: THIS IS A PERSONALITY TEST! Below are phrases describing
people. Please use the rating scale below to describe how accurately each
statement reflects you. Although this questionnaire contains general phrases, it is
designed to measure your personality traits. Describe yourself as you generally
are now, not as you wish to be in the future. Describe yourself as you honestly
see yourself, in relation to other people you know of the same gender as you are,
and roughly your same age. It is very important that you answer as honestly as
possible even if you think the phrase is negative or unflattering. Remember that
70
your responses will be used for research purposes only and no one will have
access to your responses.
Traditional Personality Test Instructions: Fake Good Condition, Purpose of Test
Revealed: THIS IS A PERSONALITY TEST! Imagine that you are applying for
a job as a sales representative. This job is very attractive to you because it is
high paying. However, people in this role must be social and assertive (for the
Extraversion construct) or friendly and cooperative (for the Agreeableness
construct). You have been asked to take this test as part of the hiring process.
Below are phrases describing people. Please respond in a way that would best
guarantee that you would get the sales representative job. Use the rating scale
below to describe how each statement would reflect a successful sales
representative. Although this questionnaire contains general phrases, it is
designed to measure your personality traits.
Conditional Reasoning Test Instructions: Honest Condition, Purpose of Test Not
Revealed: For each of the following questions, read the passage carefully then
choose the option that best answers the given question. It is very important that
you answer as honestly as possible even if you think the answer is negative or
unflattering. Remember that your responses will be used for research purposes
only and no one will have access to your responses.
Conditional Reasoning Test Instructions: Fake Good Condition, Purpose of Test
Not Revealed: Imagine that you are applying for a job as a sales representative.
This job is very attractive to you because it is high paying. However, people in
71
this role must be friendly and cooperative (Agreeableness instructions) or social
and assertive (Extraversion instructions). You have been asked to take this test
as part of the hiring process. Please respond in a way that would best guarantee
that you would get the sales representative job.
Conditional Reasoning Test Instructions: Honest Condition, Purpose of Test
Revealed: THIS IS A PERSONALITY TEST NOT A LOGICAL REASONING
TEST! For each of the following questions, read the passage carefully then
choose the option that best answers the given question. Although this
questionnaire appears to be a logical reasoning test, it is actually designed to
measure your personality traits. It is very important that you answer as honestly
as possible even if you think the phrase is negative or unflattering. Remember
that your responses will be used for research purposes only and no one will have
access to your responses.
Conditional Reasoning Test Instructions: Fake Good Condition, Purpose of Test
Revealed: THIS IS A PERSONALITY TEST NOT A LOGICAL REASONING
TEST! Imagine that you are applying for a job as a sales representative. This
job is very attractive to you because it is high paying. However, people in this
role must be social and assertive (for the Extraversion construct) or friendly and
cooperative (for the Agreeableness construct). You have been asked to take this
test as part of the hiring process. Please respond in a way that would best
guarantee that you would get the sales representative job.
72
For each of the following questions, read the passage carefully then choose the
option that best answers the given question. Although this questionnaire appears
to be a logical reasoning test, it is actually designed to measure your personality
traits.
Manipulation Check
Two items were created to ensure that participants were cognizant of the study
instructions. In the first item, participants were asked how they responded to the
previous questionnaires. Response options were: (1) I responded honestly to all tests, (2)
I responded in a desirable way to all tests, (3) I responded randomly to all tests, and (4) I
responded both honestly and in a desirable way, depending on instructions. The second
item asked what the tests were designed to measure. Response options were: (1) All
questionnaires measured personality, (2) Some questionnaires measured personality
while some measure logical reasoning, and (3) All questionnaires measured logical
reasoning.
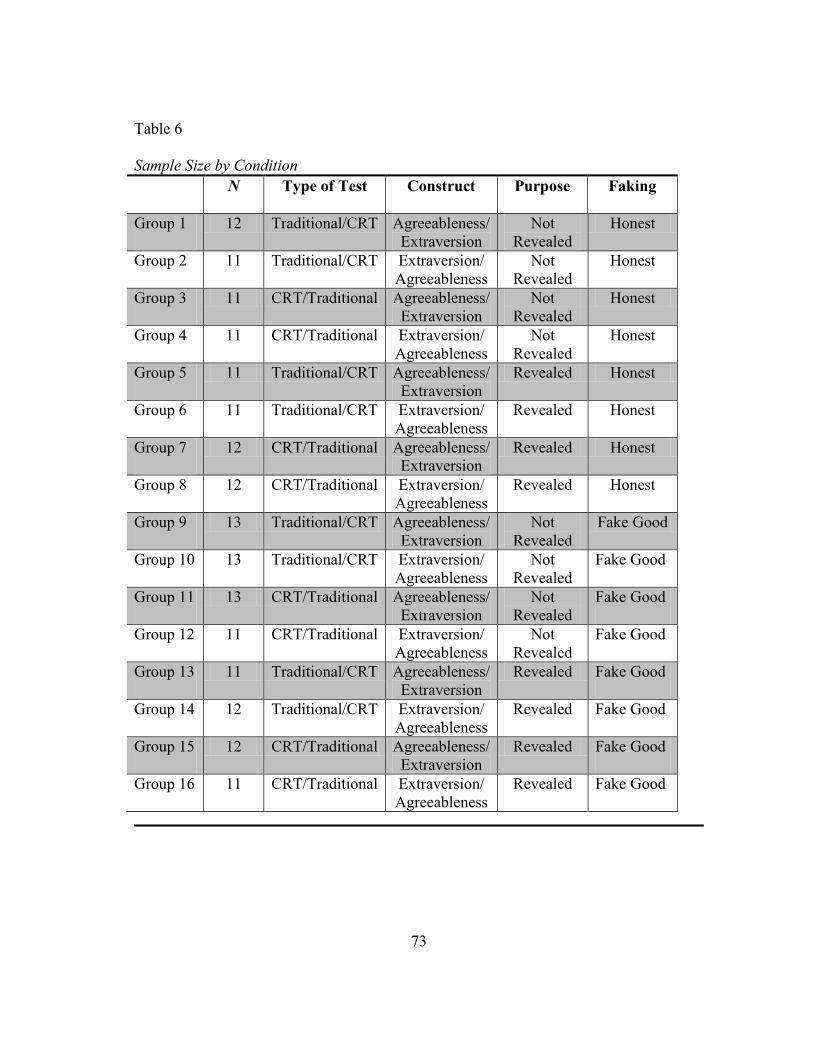
73
Table 6
Sample Size by Condition
N Type of Test Construct Purpose Faking
Group 1 12 Traditional/CRT Agreeableness/
Extraversion
Not
Revealed
Honest
Group 2 11 Traditional/CRT Extraversion/
Agreeableness
Not
Revealed
Honest
Group 3 11 CRT/Traditional Agreeableness/
Extraversion
Not
Revealed
Honest
Group 4 11 CRT/Traditional Extraversion/
Agreeableness
Not
Revealed
Honest
Group 5 11 Traditional/CRT Agreeableness/
Extraversion
Revealed Honest
Group 6 11 Traditional/CRT Extraversion/
Agreeableness
Revealed Honest
Group 7 12 CRT/Traditional Agreeableness/
Extraversion
Revealed Honest
Group 8 12 CRT/Traditional Extraversion/
Agreeableness
Revealed Honest
Group 9 13 Traditional/CRT Agreeableness/
Extraversion
Not
Revealed
Fake Good
Group 10 13 Traditional/CRT Extraversion/
Agreeableness
Not
Revealed
Fake Good
Group 11 13 CRT/Traditional Agreeableness/
Extraversion
Not
Revealed
Fake Good
Group 12 11 CRT/Traditional Extraversion/
Agreeableness
Not
Revealed
Fake Good
Group 13 11 Traditional/CRT Agreeableness/
Extraversion
Revealed Fake Good
Group 14 12 Traditional/CRT Extraversion/
Agreeableness
Revealed Fake Good
Group 15 12 CRT/Traditional Agreeableness/
Extraversion
Revealed Fake Good
Group 16 11 CRT/Traditional Extraversion/
Agreeableness
Revealed Fake Good
74
Preference for Tests
Participants completed three items designed to assess their attitudes towards the
two different types of tests presented in the study. Participants were asked which type of
test they would most prefer to take if applying for a job, which type of test would be
most fair in a selection context, and which would be most accurate in a selection context.
Although not directly related to the hypotheses of the current study, these items are
important in determining applicant preferences for the CRT compared to more
traditional personality tests.
Validation Measures
Several criteria measures were included as part of the study in order to determine
the construct-related and criterion-related validity of the CRTs and to compare the
validity of these tests to traditional personality tests used in practice.
Interpersonal conflict. Interpersonal conflict has been found to be negatively
related to Agreeableness (Graziano, Jensen-Campbell, & Hair, 1996). In order to assess
interpersonal conflict as evidence of construct-related validity, participants completed a
four-item measure (Spector & Jex, 1998; α = .74). Participants rated the frequency of
experiences such as “How often do you get into arguments with others?” on a five-point
scale from Never to Very Often. Internal consistency reliability for this measure in the
current study was .85.
Empathy. A five-item Empathy measure was administered to provide evidence
of the construct validity of the Agreeableness CRT. The current study used the
Sympathy Tendency subscale of Mehrabian and Epstein’s (1972) 33-item measure of
75
empathy. Previous research has found that sympathy is related to Agreeableness
(Graziano et al., 2007). Other subscales of this measure such as “Willingness to be in
Contact with Others Who Have Problems” and “Susceptibility to Emotional Contagion”
were omitted due to the weaker expected relationships to Agreeableness and due to time
constraints. Participants indicated their agreement on a five-point scale with several
statements, including, “It makes me sad to see a lonely stranger in a group” and “I really
get involved with the feelings of the characters in a novel.” Internal consistency
reliability for this five-item measure in this study was .39. The Empathy scale reliability
is surprising, but may be lower due to the fact that only a subset of items were
administered to participants. Past research on the scale indicated that the full scale
reliability was sufficient (split-half reliability = .84; Mehrabian & Epstein, 1972).
However, reliabilities of the subscales were not reported and may be lower than the
overall scale.
Positive and negative affect. As mentioned in the introduction, people high in
Extraversion tend to have a higher positive affect than those low in Extraversion
(Watson & Clark, 1997; Wilt & Revelle, 2009). Watson, Clark, and Tellegen’s (1988)
Positive and Negative Affect Scale (PANAS) was administered to participants. This
widely-used scale consists of 20 items and asks participants to indicate the extent to
which they generally feel certain emotions. Participants rated words such as “Irritable”
or “Alert” on a five-point scale ranging from Very Slightly or Not at All to Extremely.
Internal consistency reliability for this measure in the current study was .86.

76
Volunteerism. Participants completed four items from Clary et al.’s (1998) 30-
item Volunteer Functions Inventory (VFI). Volunteerism attitudes and behaviors have
been found to be related to the altruism component of Agreeableness (Clary et al., 1998;
Mehrabian & Epstein, 1972). The four items used in the current study were taken from
the Values subscale of the VFI. Participants rated nine statements on a five-point Likert
scale (1 = Strongly Disagree, 5 = Strongly Agree). Example items include, “I plan to
participate in volunteer activities” and “I feel compassion toward people in need.”
Internal consistency reliability for this measure in the current study was .86.
Team player inventory. In order to assess teamwork, participants completed a
measure created and validated by Kline (1999). Participants indicated the extent to
which they agreed with ten statements including, “I enjoy working on team/group
projects” and “My own work is enhanced when I am in a group/team situation.” Internal
consistency for this measure in the current study is .84.
Friendships. Participants were also asked about the number of friendships they
have and interactions with others. It is expected that high rather than low levels of
Extraversion would be positively related to a large number of close and peripheral
friends, new friends, and greater frequencies of face-to-face and technology-mediated
interactions. The five items (developed for the current study) related to friendships
were:
1. How many close friends do you have?
2. How many peripheral (non-close) friendships do you have?
3. How many new friends have you made in the past year?
77
4. How many hours during the average day do you spend interacting with friends in
person?
5. How many hours during the average day do you spend with friends through
technology (e.g., Facebook, texting, chat)?
Organizations and leadership. Participants were asked to indicate the number
and level of involvement in both service and social organizations. Participants were also
asked if they had any leadership experience within these organizations. It is expected
that individuals high in Extraversion will become more involved with organizations in
order to engage in social interactions. In addition, those high in Extraversion will likely
seek out leadership positions as a means to have greater influence over others. Items
were generated for the current study and consisted of:
1. How many service clubs or organizations are you a part of?
2. On average, what is your level of involvement within these service
organizations?
3. Do you hold a leadership position in any these service organizations?
4. Would you like to hold a leadership position in these service organizations?
5. How many social clubs or organizations are you a part of?
6. What is your level of involvement within these social organizations?
7. Do you hold a leadership position in any of these social organizations?
8. Would you like to hold a leadership position in these social organizations?
Work experience and job performance. Consistent with the literature, it was
expected that job performance would be positively related to both Agreeableness and
78
Extraversion (e.g., Barrick & Mount, 1991; Hough & Furnham, 2003). Participants
were first asked about their work history (i.e., Do you currently have a job, How many
hours do you work at this job per week, and If you don’t currently work, how long ago
were you in your last job?). Then participants indicated their job performance on their
current or most previous job using three performance items from Williams and Anderson
(1991). Participants rated their level of agreement with statements including, “I perform
tasks that are expected of me” and “I fulfill responsibilities specified in job description.”
In addition, participants indicated their job performance overall and on several
personality-congruent work behaviors because personality-congruent behaviors have
been found to be more highly related to personality constructs (Barrick & Mount, 1991).
The measure used for the current study consisted of the following items and had an
internal consistency of .93 for the current study:
1. My overall job performance is good.
2. I am able to successfully complete aspects of my job that require me to be
outgoing.
3. I am able to successfully complete aspects of my job that require me to be social
with people I do not know well.
4. I am able to successfully complete aspects of my job that require me to be
assertive.
5. I am able to successfully complete aspects of my job that require me to be
friendly to others.
79
6. I am able to successfully complete aspects of my job that require me to treat
others with dignity.
7. I am able to successfully complete aspects of my job that require me to
empathize with others.
General and open-ended items. Participants were asked several open-ended
items designed to tap into Agreeableness and Extraversion. The responses were then
content-analyzed on a five-point scale ranging from Very Low Agreeableness (or
Extraversion) to Very High Agreeableness (or Extraversion). Participant responses that
were unrelated to Agreeableness or Extraversion were not rated. The open-ended items
were:
1. Describe your idea of a perfect Friday night. (Extraversion)
2. Describe how you make friends with others. (Extraversion)
3. Describe how you interact with people you don’t know. (Extraversion)
4. Describe how you achieve what you want when working as part of a team.
(Agreeableness)
5. Describe how you would react if someone tried to get you to do something you
didn’t want to do. (Agreeableness)
6. When making decisions with others, do you prefer to stick to your own beliefs or
try to reach a compromise? (Agreeableness)
Except for item six which is a dichotomous item, the researcher’s judgment was used to
code the open-ended responses into a five-point scale. Although ideally responses
would have been coded by more than one rater, precautions were taken to ensure as
80
accurate coding as possible. The author created a priori critical incidents for each of the
items in order to score the open-ended responses. For example, the scale used with the
item, “Describe your idea of a perfect Friday night” was:
1. (Very Low Extraversion) – Staying at home and doing activities alone
2. (Low Extraversion) – Staying at home with family or close friends
3. (Average Extraversion) – Going out to dinner with friends or family
4. (High Extraversion) – Going to multiple places with friends or family or
engaging in social events (e.g., dancing) with friends or family
5. (Very High Extraversion) – Going out to a dance club or party to meet new
people
Standardized internal consistency reliability for the three Extraversion items was .55
and standardized internal consistency reliability was .46 for the three Agreeableness
items. Although these reliabilities are low compared to general statistical conventions,
it is believed that these items are diverse and are tapping into different aspects of the
constructs.
81
CHAPTER IX
RESULTS
Counterbalancing
As mentioned in the method section, both the type of test (traditional personality
or CRT) and the construct being measured (Agreeableness or Extraversion) were
counterbalanced. To determine whether there were order effects, variables were
analyzed using a one-way ANOVA. For the fake good, purpose of test not revealed
(FG-NR) condition, no significant mean differences were found for mean scores on the
NEO-E, F(3, 41) = 1.88, p = .15, η2 = .12, NEO-A, F(3, 41) = 1.34, p =.27, η
2 = .09, or
the CRT-E, F(3, 41) = .1.85, p =.15, η2 = .12. Significant differences were found for
scores on the CRT-A, F(3, 41) = .3.05, p =.04, η2 = .18. Because sample sizes are
relatively equal and multiple comparisons are being made, Tukey’s HSD is an
appropriate statistical test for post hoc comparisons. Post-hoc analyses using Tukey’s
Honest Significant Difference test (HSD) indicated significant differences in CRT-A
means when the order of tests was CRT-E, CRT-A, NEO-E, and NEO-A (M = 1.73, SD
= 4.92) than when the order of tests was NEO-E, NEO-A, CRT-E, CRT-A (M = 6.25,
SD = 3.00). No other significant differences were found for any other comparisons. For
the fake good, purpose of test revealed condition (FG-R), mean scores on the NEO-E,
F(3, 42) = 1.13, p = .35, η2 = .08, the NEO-A, F(3, 42) = 1.56, p = .21, η
2 = .10, the
CRT-E, F(3, 42) = .15, p = .93, η2 = .01, and CRT-A, F(3, 42) = .29, p = .83, η
2 = .02
were all nonsignificant, indicating that there were no differences in mean scores on any
82
of the tests due to presentation of tests for the fake good, purpose of test revealed
conditions. For the honest, purpose of test not revealed condition (H-NR), an ANOVA
revealed no significant differences for the NEO-E, F(3, 46) = 1.35, p = .27, η2 = .08,
NEO-A, F(3, 46) = .53, p = .67, η2 = .03, or the CRT-E, F(3, 46) = .24, p = .87, η
2 = .02.
There was a significant difference for the CRT-A, F(3, 46) = 2.87, p = .047, η2 = .16.
Post-hoc analyses using Tukey’s Honest Significant Difference test (HSD) indicated
significant differences in CRT-A means when the order of tests was CRT-E, CRT-A,
NEO-E, and NEO-A (M = 1.69, SD = 3.57) than when the order of tests was CRT-A,
CRT-E, NEO-A, NEO-E (M = 6.27, SD = 3.58). No other significant differences were
found for any other comparisons. Lastly, the honest, purpose of test revealed condition
(H-R) indicated no significant differences in mean scores for the NEO-E, F(3, 42) = .60,
p = .62, η2 = .04, NEO-A, F(3, 42) = .57, p = .64, η
2 = .04, CRT-E, F(3, 42) = 1.25, p =
.30, η2 = .08, or CRT-A, F(3, 42) = .09, p = .97, η
2 = .01.
It is theoretically unknown why there would be differences for some (but not
most) of the test presentation schemes. The only mean scores that were effected were
for the CRT-A under both fake good and honest conditions when the purpose of the test
was not revealed. It is unknown exactly why this order effect exists. Because means on
the CRT-A were higher when the CRT was presented last, it may be the case that people
simply become better at differentiating between the justification mechanism-congruent
options and are then better at selecting the Agreeable option. The effect sizes for the
order effects are relatively small, however. Given the relatively small sample sizes for
83
each condition, it is argued that these effects are not so troublesome as to negate the
current study results.
Manipulation Check
For the faking manipulation check, 7.7% of participants in the fake good
condition correctly identified their experimental condition and 44.0% of participants
indicated that they responded both honestly and in a desirable manner. However, 48.4%
indicated that they responded honestly instead of faking. Results show that 82.3% of
participants in the honest condition correctly identified their experimental condition and
11.5% of participants indicated that they responded both honestly and in a desirable
manner. Several test takers (5.2%) indicated that they were in the fake good condition
instead of the honest condition.
The high number of participants incorrectly identifying their experimental
condition could be an indicator that participants did not fully comprehend the survey
instructions. However, the placement of the manipulation check items in the survey may
have created confusion about which questionnaires the researcher was referencing. The
manipulation check items followed questions about demographics and face validity in
addition to the NEO and CRT items. Participants may have been indicating that they
responded honestly to the demographic and/or face validity items in an honest manner
even though they were part of the fake good condition. Also, the term “socially
desirable” may have been confusing for participants. For example, someone who
responded honestly on the Agreeableness personality tests but who is, in fact, highly
84
Agreeable is likely to say that they are responding honestly and in a socially desirable
way (given that high Agreeableness is seen as a socially desirable trait).
The manipulation check for the purpose of the test condition showed that 48.9%
of participants who had the purpose of the test revealed to them correctly identified their
experimental condition (that all test measured personality) and 3.3% indicated that all
questionnaires measured logical reasoning. In addition, 47.8% of participants indicated
that some questionnaires measured personality while some measured logical reasoning.
For participants who did not have the purpose of the test revealed to them, 87.4% of
participants indicated that some tests measured personality while others measured
logical reasoning (which should be the case if the purpose of the test is not revealed).
Three percent of participants indicated that all the questionnaires measured logical
reasoning and 9.5% of participants indicated that all the questionnaires measured
personality.
The large percentage of participants indicating that some tests measured logical
reasoning and some measured personality when the instructions indicated that they all
measured personality may be an indicator of the pervasiveness of the logical reasoning
test format of the CRT. It may be that participants continued to believe that the CRTs
were measuring logical reasoning because they are designed to have the look and feel of
such tests. Also, because of the placement of the manipulation check items, participants
may have been confused about which questionnaires the researcher was referring to,
similar to the fake good condition mentioned above. Lastly, participants may have been
wary of the questions particularly because they were aware of the fact it was part of a
85
psychological study. The seemingly obvious layout of the CRT as a logical reasoning
test as compared to a personality test may have overridden the instruction set which said
that it was indeed a personality test. It may be that test takers were suspicious of the
instructions, did not want to seem as though they had been deceived in any way, and
therefore did not heed the true experimental instructions.
Given these ambiguous results, an ANOVA was conducted to determine if mean
scores on the traditional personality tests were actually higher when participants were
instructed to fake. Given that previous research has found that individuals are able to
fake when instructed to do so (Hough et al., 1990; Viswesvaran & Ones, 1999),
increases in scores on the personality tests for participants in the fake good condition
should indicate whether or not participants followed the instructions. Results indicate
that both the NEO-E and the NEO-A scores were higher in the faking condition
compared to the honest condition, F(1, 186) = 36.41, p = .00, η2 = .16 and F(1, 186) =
36.39, p = .00, η2 = .16, respectively. These results give support to the conclusion that
the manipulation check was successful. In hindsight, a better manipulation check would
have specifically asked test takers whether or not they were instructed to fake good on
the tests or whether or not the purpose of the test was revealed to them. By collecting
these types of data, the researcher would be able to ascertain whether or not test takers
understood and complied with the experimental instructions. The results of the
manipulation check are mixed and the data call into question the veracity of the findings.
However, because of the many possible alternative explanations or interpretations of the
data, analyses for the main research questions of the current study will be presented.

86
Face Validity
Three items were administered as part of the study to determine participants’
attitudes and preferences for taking traditional personality tests compared to CRTs. The
first item assessed which type of test participants would prefer to take if they were
applying for a job. Participants indicated they would prefer to take the NEO-PI-R
(59.4%) over the CRT (40.6%). However, when asked which type of test would be most
fair in identifying high performing job applicants, participants selected the CRT (58.8%)
over the NEO-PI-R (24.1%). Participants also indicated that they believed the CRT
(60.4%) would be more accurate at identifying high-performing job applicants than the
NEO-PI-R (23.5%).
Illogical Responses
According to James et al. (2005), most respondents of the Aggression CRT
choose options related to justification mechanisms instead of the illogical options.
Tables 7-10 show the number of participants selecting either of the illogical response
options for each CRT item. Many of the items for Agreeableness and Extraversion
CRTs were at or below 10% choosing illogical options. Extraversion item 12 and
Agreeableness item 18 have a high percentage of people (30% or greater) choosing
illogical options. Although the logicality of CRT response options were vetted during
the item development stage, items with a high percentage of illogical responses chosen
likely indicate poor items.
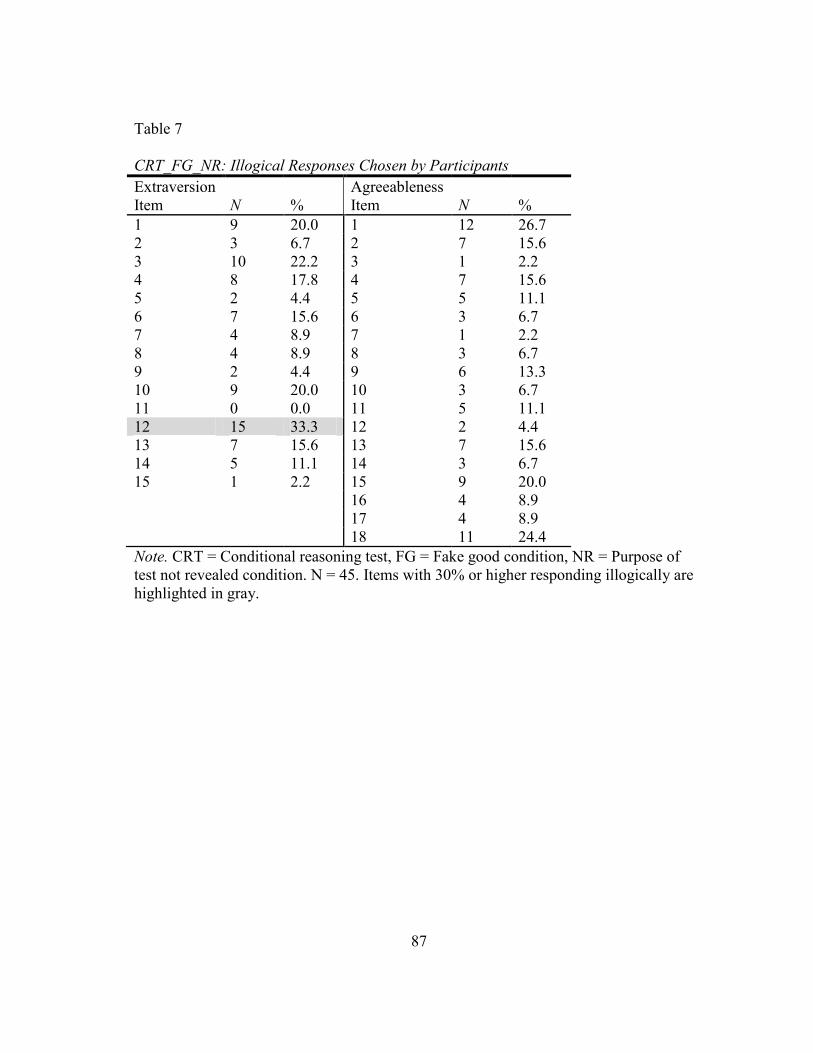
87
Table 7
CRT_FG_NR: Illogical Responses Chosen by Participants
Extraversion
Item N %
Agreeableness
Item N %
1 9 20.0 1 12 26.7
2 3 6.7 2 7 15.6
3 10 22.2 3 1 2.2
4 8 17.8 4 7 15.6
5 2 4.4 5 5 11.1
6 7 15.6 6 3 6.7
7 4 8.9 7 1 2.2
8 4 8.9 8 3 6.7
9 2 4.4 9 6 13.3
10 9 20.0 10 3 6.7
11 0 0.0 11 5 11.1
12 15 33.3 12 2 4.4
13 7 15.6 13 7 15.6
14 5 11.1 14 3 6.7
15 1 2.2 15 9 20.0
16 4 8.9
17 4 8.9
18 11 24.4
Note. CRT = Conditional reasoning test, FG = Fake good condition, NR = Purpose of
test not revealed condition. N = 45. Items with 30% or higher responding illogically are
highlighted in gray.

88
Table 8
CRT_FG_R: Illogical Responses Chosen by Participants
Extraversion
Item N %
Agreeableness
Item N %
1 5 10.9 1 7 15.2
2 7 15.2 2 8 17.4
3 8 17.4 3 4 8.7
4 11 23.9 4 8 17.4
5 2 4.3 5 5 10.9
6 9 19.6 6 0 0.0
7 3 6.5 7 1 2.2
8 3 6.5 8 5 10.9
9 3 6.5 9 0 0.0
10 11 23.9 10 2 4.3
11 5 10.9 11 4 8.7
12 15 32.6 12 3 6.5
13 11 23.9 13 5 10.9
14 4 8.9 14 1 2.2
15 7 15.2 15 9 19.6
16 3 6.5
17 7 15.2
18 16 34.8
Note. CRT = Conditional reasoning test, FG = Fake good condition, R = Purpose of test
revealed condition. N = 46. Items with 30% or higher responding illogically are
highlighted in gray.
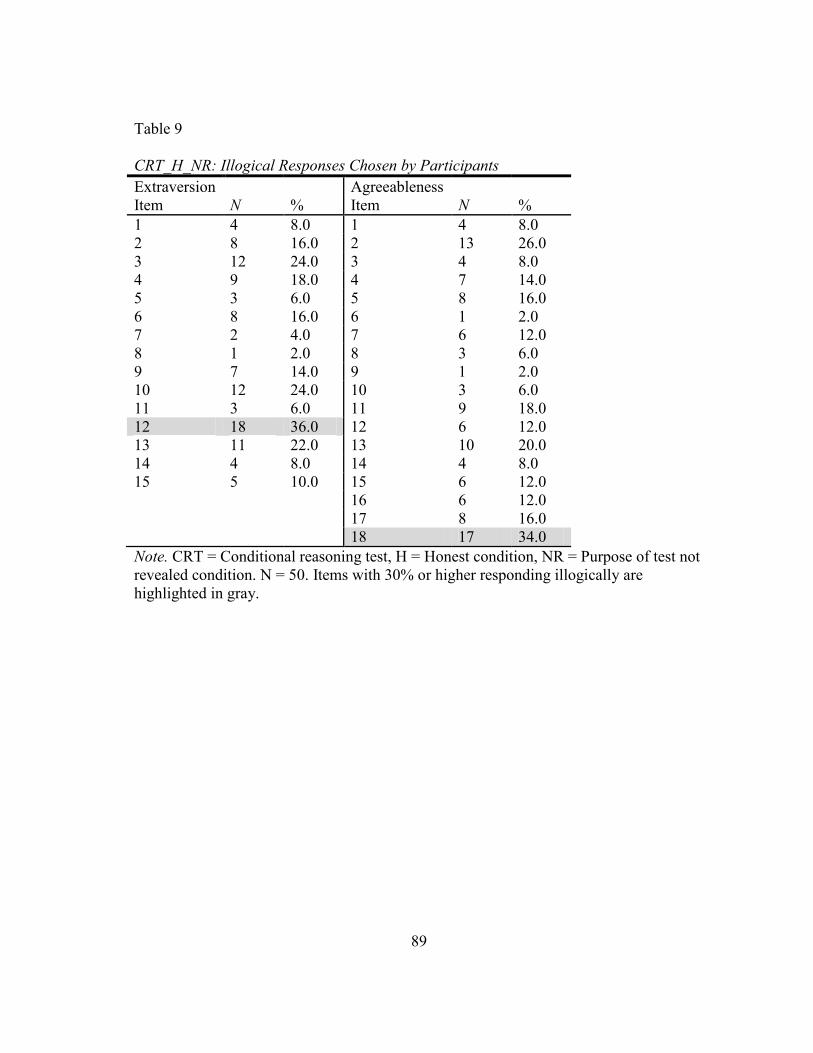
89
Table 9
CRT_H_NR: Illogical Responses Chosen by Participants
Extraversion
Item N %
Agreeableness
Item N %
1 4 8.0 1 4 8.0
2 8 16.0 2 13 26.0
3 12 24.0 3 4 8.0
4 9 18.0 4 7 14.0
5 3 6.0 5 8 16.0
6 8 16.0 6 1 2.0
7 2 4.0 7 6 12.0
8 1 2.0 8 3 6.0
9 7 14.0 9 1 2.0
10 12 24.0 10 3 6.0
11 3 6.0 11 9 18.0
12 18 36.0 12 6 12.0
13 11 22.0 13 10 20.0
14 4 8.0 14 4 8.0
15 5 10.0 15 6 12.0
16 6 12.0
17 8 16.0
18 17 34.0
Note. CRT = Conditional reasoning test, H = Honest condition, NR = Purpose of test not
revealed condition. N = 50. Items with 30% or higher responding illogically are
highlighted in gray.
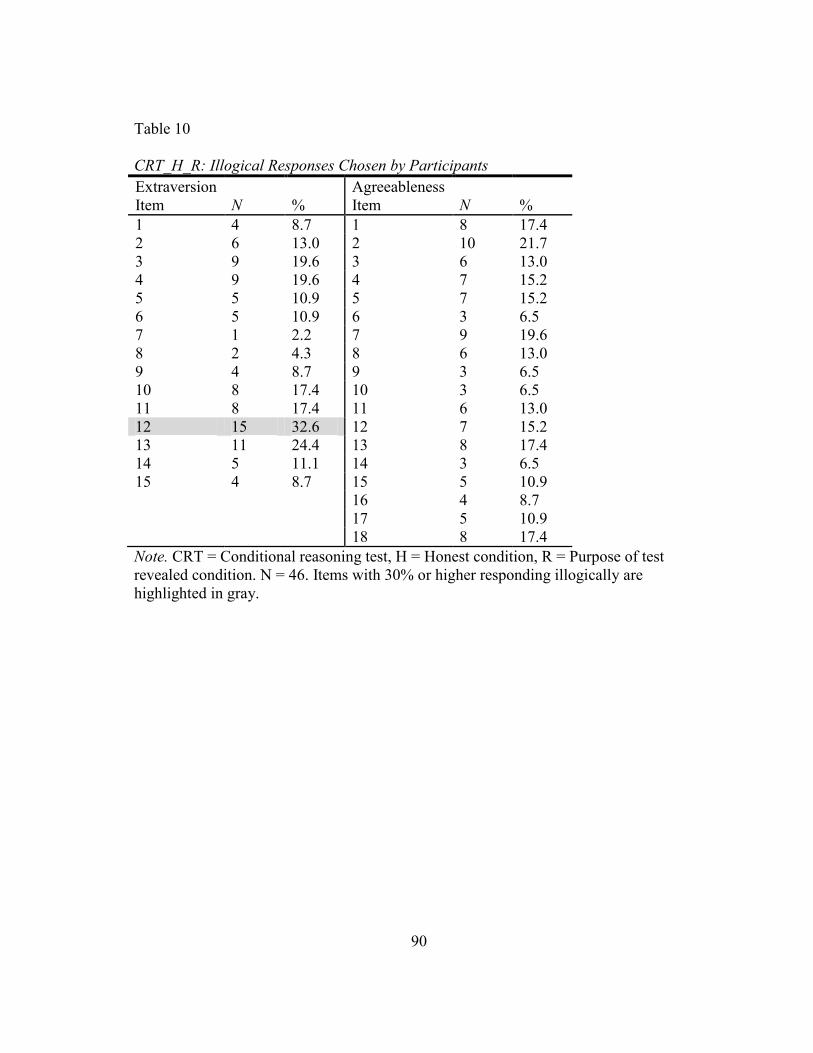
90
Table 10
CRT_H_R: Illogical Responses Chosen by Participants
Extraversion
Item N %
Agreeableness
Item N %
1 4 8.7 1 8 17.4
2 6 13.0 2 10 21.7
3 9 19.6 3 6 13.0
4 9 19.6 4 7 15.2
5 5 10.9 5 7 15.2
6 5 10.9 6 3 6.5
7 1 2.2 7 9 19.6
8 2 4.3 8 6 13.0
9 4 8.7 9 3 6.5
10 8 17.4 10 3 6.5
11 8 17.4 11 6 13.0
12 15 32.6 12 7 15.2
13 11 24.4 13 8 17.4
14 5 11.1 14 3 6.5
15 4 8.7 15 5 10.9
16 4 8.7
17 5 10.9
18 8 17.4
Note. CRT = Conditional reasoning test, H = Honest condition, R = Purpose of test
revealed condition. N = 46. Items with 30% or higher responding illogically are
highlighted in gray.
91
Tests of Hypotheses
Validity results. In order to assess the utility of the conditional reasoning tests
created with the traditional NEO personality assessment, correlations between scores on
the test and the relevant outcome variables were conducted and analyzed. See Table 11
for correlations and scale reliabilities.
Correlations. Hypothesis 1 stated that traditional, self-report personality tests
for Agreeableness and Extraversion would be positively correlated to construct-relevant
criteria and Hypothesis 2 stated that CRTs for Agreeableness and Extraversion would be
positively correlated to construct-relevant criteria.
The NEO-PI-R tests tend to significantly correlate with more of the relevant
criteria than the CRTs and the NEO-PI-R correlations tend to be of greater magnitude
than the CRT correlations. For example, the NEO-A-H-R significantly correlated with
the open-ended Agreeableness questions (ZGQ_A; r = .58, p < .01), the number of
people they have as close friends (r = .30, p < .05), the number of people who they feel
call them a close friend (r = .29, p < .05), volunteer behaviors (r = .50, p < .01), and
interpersonal conflict. The CRT-A-H-R only significantly correlated in an expected
manner with interpersonal conflict (r = -.34, p < .05). There are a few instances where
the CRTs were significantly correlated with relevant criteria, but opposite of
expectations (e.g., correlation between CRT-E-H-NR and number of people calling the
participant a close friend, r = -.32, p < .05). These opposite correlations are more
prevalent in the faking conditions for the CRT (e.g., correlation between CRT-A-FG-R
and number of close friends, r = -.34, p < .05). Upon analysis of the data, it was
92
determined that small sample sizes (N = 11-13) were driving the unexpected
correlations.
It is also important to examine the correlations between the tests and relevant
criteria for the honest versus fake good conditions. These results provide insight into the
effect of faking on criterion-related validity. Overall, the NEO tests tend to significantly
correlate with more relevant criteria under the honest conditions compared to the fake
good conditions (e.g., the many significant correlations for the NEO-A-H-R) and these
correlations tend to be of equal or higher magnitude than the fake good conditions (e.g.,
NEO-A and the open-ended general Agreeableness item 3 for the purpose of the test not
revealed condition, honest r = .34, p < .05, fake good r = .31, p < .05). A similar trend is
found in the correlations between the CRTs and relevant outcomes (e.g., CRT-A and
interpersonal conflict for the purpose of the test revealed condition, honest r = -.34, p <
.05, fake good r = -.26, p > .05).
Correlations between the CRT and NEO tests can indicate construct-related
validity evidence (i.e., mutitrait-multimethod matrix; Campbell & Fiske, 1959). Results
show that, similar to other research on CRTs, the correlations between CRTs and the
NEO-PI-R tests for the same experimental conditions are predominantly nonsignificant
or low. These results are consistent with previous research on CRTs. James (1998)
argues that the lack of significant correlations between CRTs and other personality tests
of the same constructs is due to the CRT tapping into subconscious aspects of
personality.
93
Based on the findings of this study, the CRTs are not a particularly valid measure
of Agreeableness and Extraversion and the traditional, self-report measure is much better
at predicting relevant outcomes. When analyzing differences between faking conditions
and honest conditions for both types of tests, there appears to be a greater number of
significant correlations and correlations of higher magnitudes for the honest NEO-PI-R
tests compared to the fake good NEO-PI-R tests; there does not appear to be a large
difference between fake good and honest responding for the CRTs. It should be noted
that traditional test development techniques such as analysis of inter-item correlations,
factor analysis, or empirical keying will likely increase criterion-related validity. The
CRTs developed for this study are in the infancy of their development and exploratory in
terms of criterion-related validity. Future research should investigate the prospect of
adding or removing items to improve these results.
Although this study did not specifically investigate demographic variables, the
correlations for sex and age and the variables of interest were analyzed. Sex was found
to be significantly correlated with the NEO-E-FG-NR (r = .31, p < .05) such that women
were more likely to have higher scores than men when the test instructions are to fake
good on the test and when the purpose of the test is not revealed. These findings suggest
that there may be sex differences in the ability to fake the traditional personality test.
Research with respect to sex has found mixed results. Ones and Viswesvaran (1998)
found higher scores for males than females on social desirability scales. However,
Graham et al. (1994) found that females self-reported higher levels of cheating than men.
Age was found to be related to the NEO-A-FG-R (r = .35, p < .05 such that older
94
individuals had higher scores on the traditional Agreeableness test than younger
individuals when the instructions for the test were as obvious as possible (fake good,
purpose of the test revealed). Ones and Viswesvaran (1998) found that older individuals
score somewhat higher on social desirability scales than younger individuals (corrected d
= .12). Future research may further want to investigate differences in responding
between age and sex, particularly if CRTs are used in selection contexts.
It is also important to note that participant educational level was only
significantly related to the CRT-A-FG-R (r = .30, p<.05) and that reading ability was
significantly negatively related to the NEO-E-FG-NR (r = -.38, p<.05) and the NEO-A-
H-R (r = -.30, p<.05). Past research has shown that education is an acceptable, though
not optimal, proxy for cognitive ability (Berry, Gruys, & Sackett, 2006). Although one
might expect CRTs to be related to cognitive ability because of the higher reading
demands placed on test takers, studies using the Aggression CRT find nonsignificant
correlations with cognitive ability (James et al., 2005; LeBreton et al., 2007). The
correlation between educational level and the CRT-A-FG-R was the only significant
correlation across all CRT experimental conditions (and the criterion of English literacy
and reading ability) and no patterns can be detected. These findings indicate that the
CRTs have little relationship with cognitive ability, consistent with other CRT research.
Future research should directly test this claim, using an actual measure of cognitive
ability, however. The negative correlations for reading ability and the NEO-E-FG-NR
and NEO-A-H-R are somewhat surprising. It is unclear why these findings may be
present, however, it should be mentioned that the variance in the reading ability variable
95
(σ2 = .14) is relatively low which is likely restricting the range of that variable.
Restriction of range reduces the magnitude of correlations in the sample compared to the
population.
Reliabilities for the scales are presented in the diagonal of Table 11. The internal
consistency reliabilities of the CRTs were low across many of the instruction sets and
constructs (α = .05-.30) and the reliability for the CRT-E-H-R was negative (α = -.07)
even after ensuring that items were coded correctly. Cronbach and Hartmann (1954)
state that in the case of negative internal consistency coefficients, a typical interpretation
is there is zero internal consistency of the test. Although internal consistency
reliabilities have been presented in previous CRT literature, researchers argue that
because CRTs are multidimensional, internal consistency is likely not the appropriate
measure of reliability (James, 1998; LeBreton et al., 2007). Responses to CRT items
may be based on any number of unique combinations of JM endorsement; not every
participant may subscribe to all justification mechanisms (i.e., endorsing some JMs but
not others). Therefore, other forms of reliability, such as factorial or test-retest may be
better forms. In order to obtain high coefficient alpha, CRTs would need to be
administered using many items to test each justification mechanism. Given the lengthy
amount of time it takes participants to complete CRT items and the number of JMs
identified for Extraversion and Agreeableness in this study (7 and 6, respectively), tests
would take hours to complete.
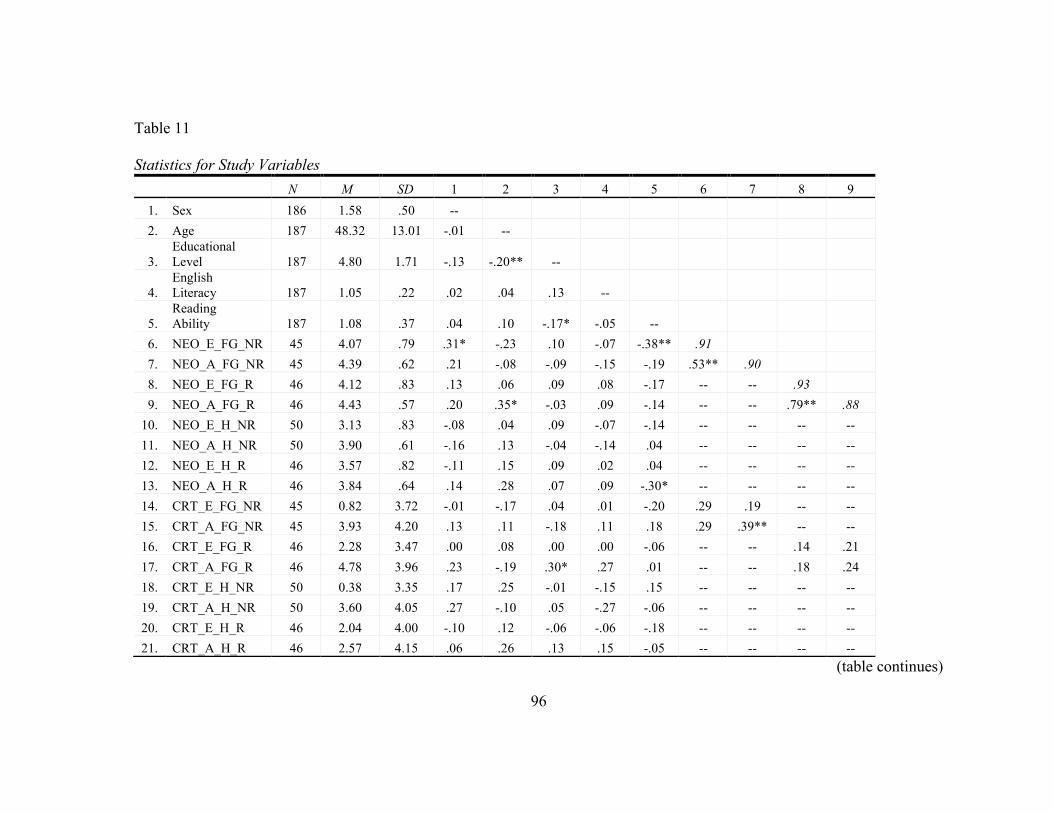
96
Table 11
Statistics for Study Variables
N M SD 1 2 3 4 5 6 7 8 9
1. Sex 186 1.58 .50 --
2. Age 187 48.32 13.01 -.01 --
3.
Educational
Level 187 4.80 1.71 -.13 -.20** --
4.
English
Literacy 187 1.05 .22 .02 .04 .13 --
5.
Reading
Ability 187 1.08 .37 .04 .10 -.17* -.05 --
6. NEO_E_FG_NR 45 4.07 .79 .31* -.23 .10 -.07 -.38** .91
7. NEO_A_FG_NR 45 4.39 .62 .21 -.08 -.09 -.15 -.19 .53** .90
8. NEO_E_FG_R 46 4.12 .83 .13 .06 .09 .08 -.17 -- -- .93
9. NEO_A_FG_R 46 4.43 .57 .20 .35* -.03 .09 -.14 -- -- .79** .88
10. NEO_E_H_NR 50 3.13 .83 -.08 .04 .09 -.07 -.14 -- -- -- --
11. NEO_A_H_NR 50 3.90 .61 -.16 .13 -.04 -.14 .04 -- -- -- --
12. NEO_E_H_R 46 3.57 .82 -.11 .15 .09 .02 .04 -- -- -- --
13. NEO_A_H_R 46 3.84 .64 .14 .28 .07 .09 -.30* -- -- -- --
14. CRT_E_FG_NR 45 0.82 3.72 -.01 -.17 .04 .01 -.20 .29 .19 -- --
15. CRT_A_FG_NR 45 3.93 4.20 .13 .11 -.18 .11 .18 .29 .39** -- --
16. CRT_E_FG_R 46 2.28 3.47 .00 .08 .00 .00 -.06 -- -- .14 .21
17. CRT_A_FG_R 46 4.78 3.96 .23 -.19 .30* .27 .01 -- -- .18 .24
18. CRT_E_H_NR 50 0.38 3.35 .17 .25 -.01 -.15 .15 -- -- -- --
19. CRT_A_H_NR 50 3.60 4.05 .27 -.10 .05 -.27 -.06 -- -- -- --
20. CRT_E_H_R 46 2.04 4.00 -.10 .12 -.06 -.06 -.18 -- -- -- --
21. CRT_A_H_R 46 2.57 4.15 .06 .26 .13 .15 -.05 -- -- -- --
(table continues)
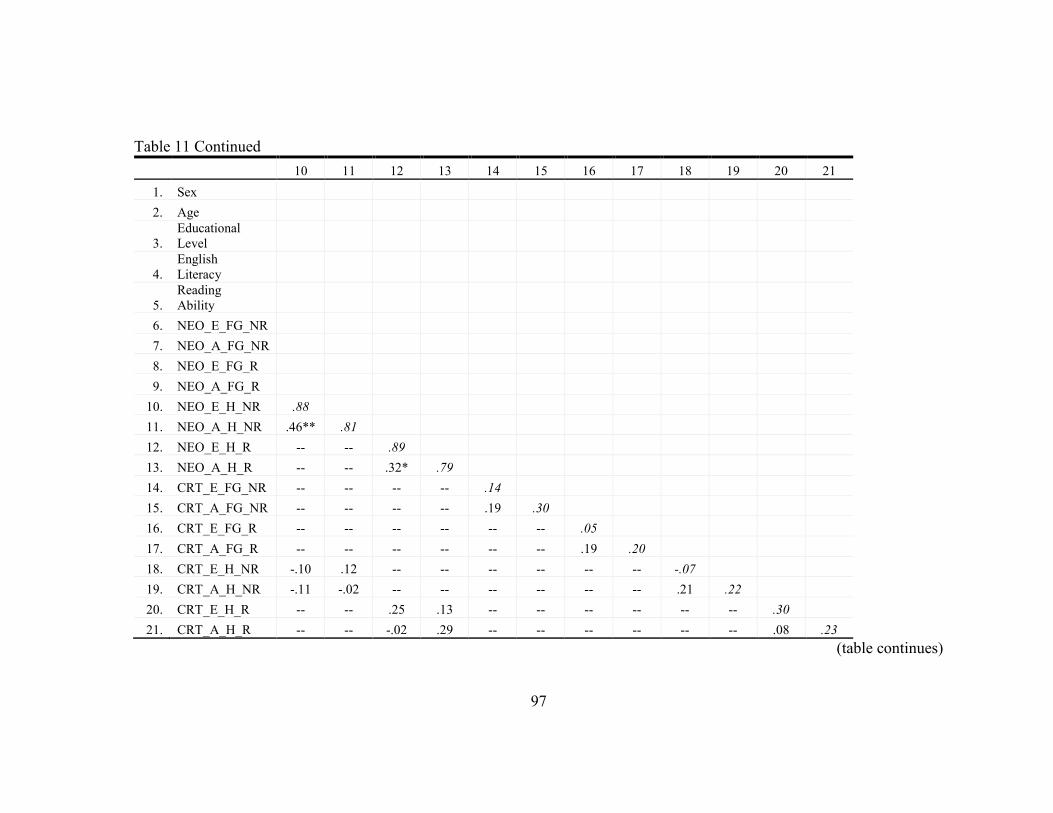
97
Table 11 Continued
10 11 12 13 14 15 16 17 18 19 20 21
1. Sex
2. Age
3.
Educational
Level
4.
English
Literacy
5.
Reading
Ability
6. NEO_E_FG_NR
7. NEO_A_FG_NR
8. NEO_E_FG_R
9. NEO_A_FG_R
10. NEO_E_H_NR .88
11. NEO_A_H_NR .46** .81
12. NEO_E_H_R -- -- .89
13. NEO_A_H_R -- -- .32* .79
14. CRT_E_FG_NR -- -- -- -- .14
15. CRT_A_FG_NR -- -- -- -- .19 .30
16. CRT_E_FG_R -- -- -- -- -- -- .05
17. CRT_A_FG_R -- -- -- -- -- -- .19 .20
18. CRT_E_H_NR -.10 .12 -- -- -- -- -- -- -.07
19. CRT_A_H_NR -.11 -.02 -- -- -- -- -- -- .21 .22
20. CRT_E_H_R -- -- .25 .13 -- -- -- -- -- -- .30
21. CRT_A_H_R -- -- -.02 .29 -- -- -- -- -- -- .08 .23
(table continues)
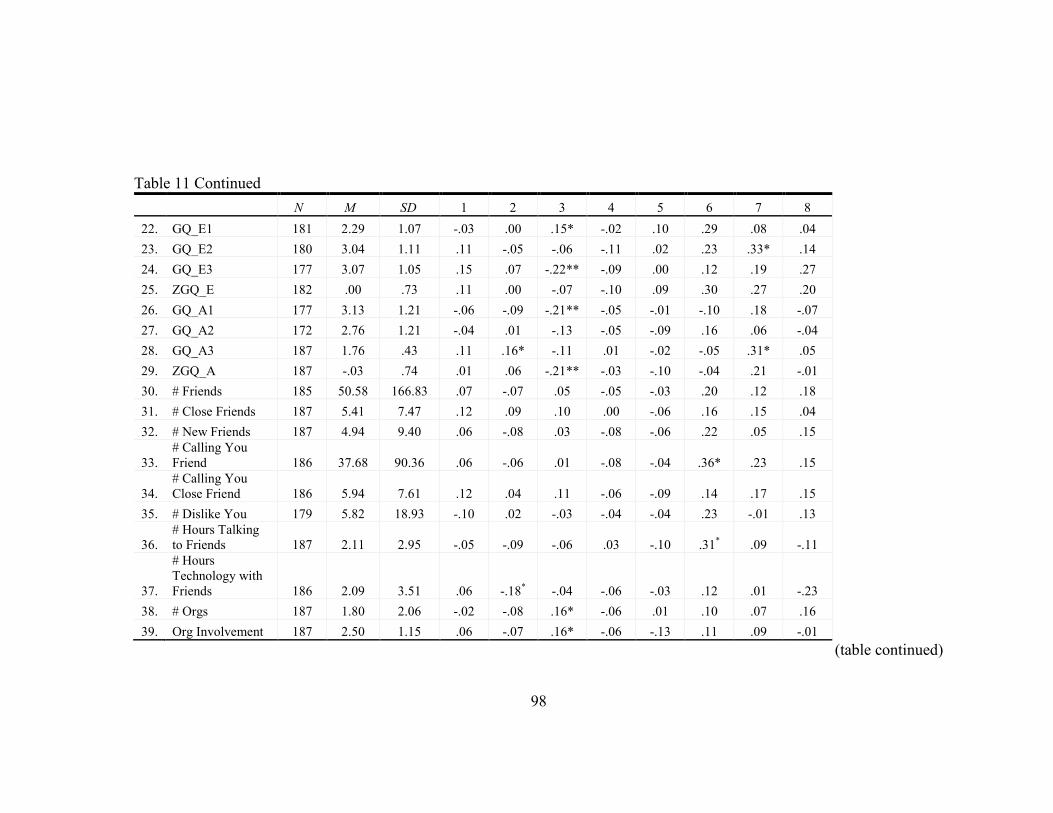
98
Table 11 Continued
N M SD 1 2 3 4 5 6 7 8
22. GQ_E1 181 2.29 1.07 -.03 .00 .15* -.02 .10 .29 .08 .04
23. GQ_E2 180 3.04 1.11 .11 -.05 -.06 -.11 .02 .23 .33* .14
24. GQ_E3 177 3.07 1.05 .15 .07 -.22** -.09 .00 .12 .19 .27
25. ZGQ_E 182 .00 .73 .11 .00 -.07 -.10 .09 .30 .27 .20
26. GQ_A1 177 3.13 1.21 -.06 -.09 -.21** -.05 -.01 -.10 .18 -.07
27. GQ_A2 172 2.76 1.21 -.04 .01 -.13 -.05 -.09 .16 .06 -.04
28. GQ_A3 187 1.76 .43 .11 .16* -.11 .01 -.02 -.05 .31* .05
29. ZGQ_A 187 -.03 .74 .01 .06 -.21** -.03 -.10 -.04 .21 -.01
30. # Friends 185 50.58 166.83 .07 -.07 .05 -.05 -.03 .20 .12 .18
31. # Close Friends 187 5.41 7.47 .12 .09 .10 .00 -.06 .16 .15 .04
32. # New Friends 187 4.94 9.40 .06 -.08 .03 -.08 -.06 .22 .05 .15
33.
# Calling You
Friend 186 37.68 90.36 .06 -.06 .01 -.08 -.04 .36* .23 .15
34.
# Calling You
Close Friend 186 5.94 7.61 .12 .04 .11 -.06 -.09 .14 .17 .15
35. # Dislike You 179 5.82 18.93 -.10 .02 -.03 -.04 -.04 .23 -.01 .13
36.
# Hours Talking
to Friends 187 2.11 2.95 -.05 -.09 -.06 .03 -.10 .31* .09 -.11
37.
# Hours
Technology with
Friends 186 2.09 3.51 .06 -.18* -.04 -.06 -.03 .12 .01 -.23
38. # Orgs 187 1.80 2.06 -.02 -.08 .16* -.06 .01 .10 .07 .16
39. Org Involvement 187 2.50 1.15 .06 -.07 .16* -.06 -.13 .11 .09 -.01
(table continued)
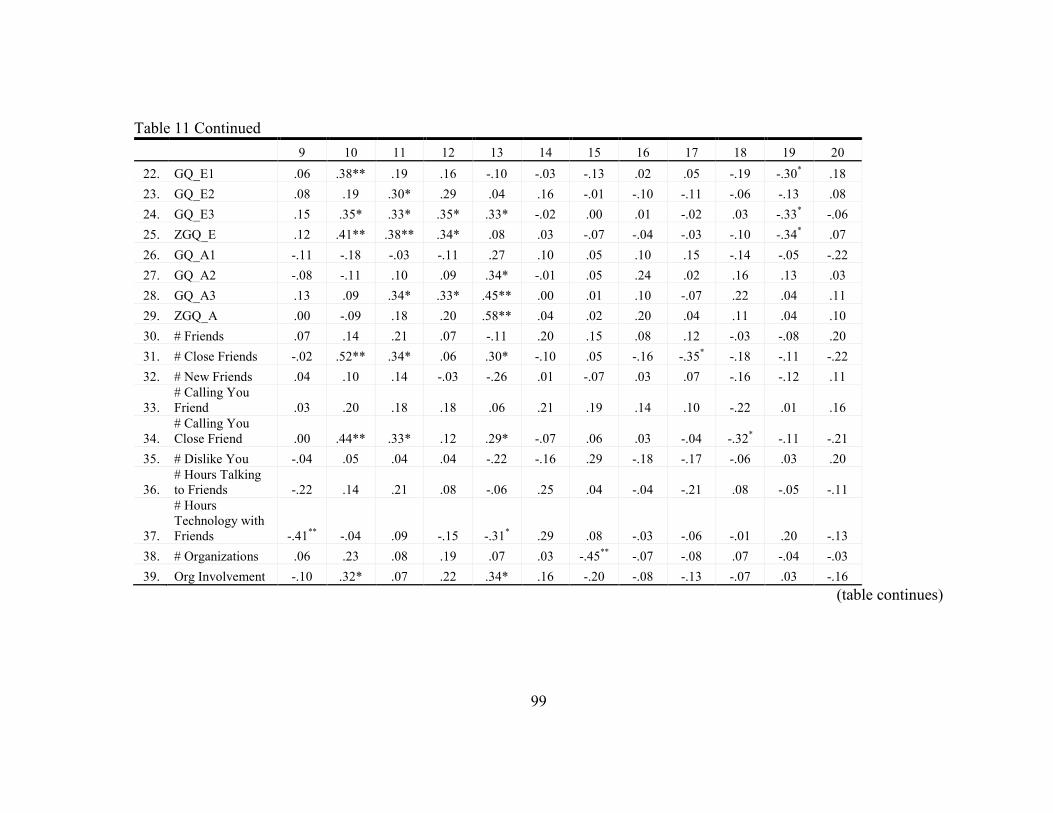
99
Table 11 Continued
9 10 11 12 13 14 15 16 17 18 19 20
22. GQ_E1 .06 .38** .19 .16 -.10 -.03 -.13 .02 .05 -.19 -.30* .18
23. GQ_E2 .08 .19 .30* .29 .04 .16 -.01 -.10 -.11 -.06 -.13 .08
24. GQ_E3 .15 .35* .33* .35* .33* -.02 .00 .01 -.02 .03 -.33* -.06
25. ZGQ_E .12 .41** .38** .34* .08 .03 -.07 -.04 -.03 -.10 -.34* .07
26. GQ_A1 -.11 -.18 -.03 -.11 .27 .10 .05 .10 .15 -.14 -.05 -.22
27. GQ_A2 -.08 -.11 .10 .09 .34* -.01 .05 .24 .02 .16 .13 .03
28. GQ_A3 .13 .09 .34* .33* .45** .00 .01 .10 -.07 .22 .04 .11
29. ZGQ_A .00 -.09 .18 .20 .58** .04 .02 .20 .04 .11 .04 .10
30. # Friends .07 .14 .21 .07 -.11 .20 .15 .08 .12 -.03 -.08 .20
31. # Close Friends -.02 .52** .34* .06 .30* -.10 .05 -.16 -.35* -.18 -.11 -.22
32. # New Friends .04 .10 .14 -.03 -.26 .01 -.07 .03 .07 -.16 -.12 .11
33.
# Calling You
Friend .03 .20 .18 .18 .06 .21 .19 .14 .10 -.22 .01 .16
34.
# Calling You
Close Friend .00 .44** .33* .12 .29* -.07 .06 .03 -.04 -.32* -.11 -.21
35. # Dislike You -.04 .05 .04 .04 -.22 -.16 .29 -.18 -.17 -.06 .03 .20
36.
# Hours Talking
to Friends -.22 .14 .21 .08 -.06 .25 .04 -.04 -.21 .08 -.05 -.11
37.
# Hours
Technology with
Friends -.41**
-.04 .09 -.15 -.31* .29 .08 -.03 -.06 -.01 .20 -.13
38. # Organizations .06 .23 .08 .19 .07 .03 -.45**
-.07 -.08 .07 -.04 -.03
39. Org Involvement -.10 .32* .07 .22 .34* .16 -.20 -.08 -.13 -.07 .03 -.16
(table continues)
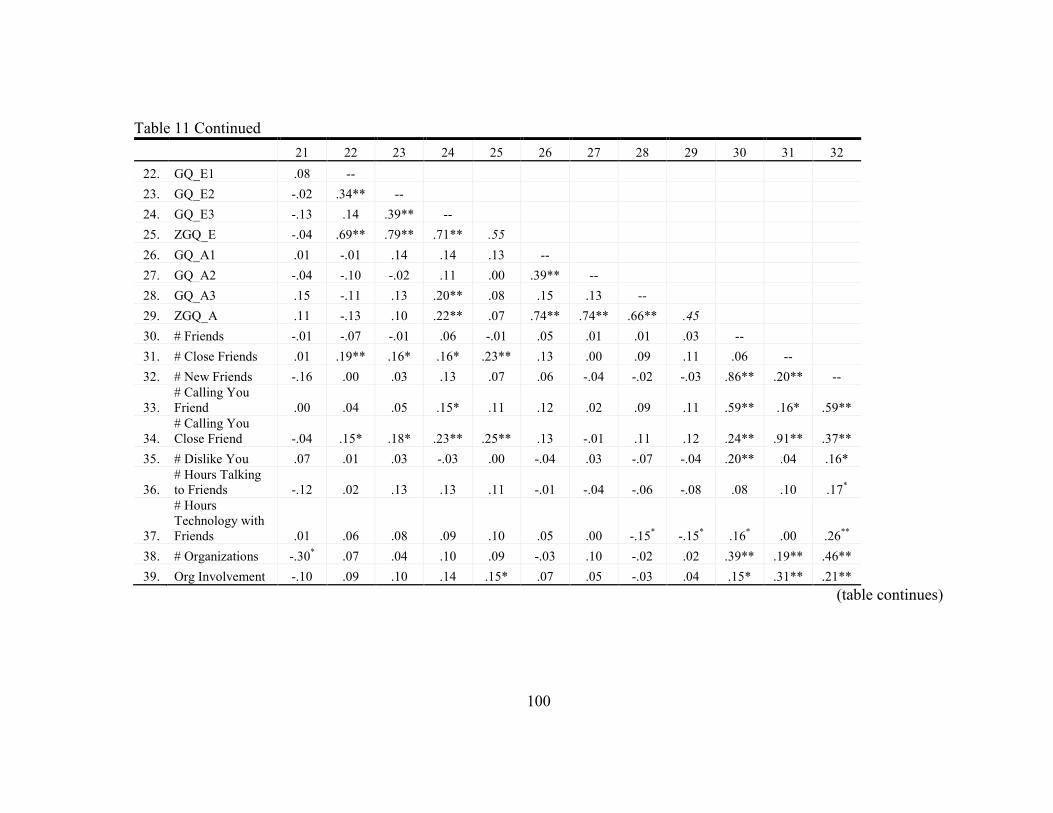
100
Table 11 Continued
21 22 23 24 25 26 27 28 29 30 31 32
22. GQ_E1 .08 --
23. GQ_E2 -.02 .34** --
24. GQ_E3 -.13 .14 .39** --
25. ZGQ_E -.04 .69** .79** .71** .55
26. GQ_A1 .01 -.01 .14 .14 .13 --
27. GQ_A2 -.04 -.10 -.02 .11 .00 .39** --
28. GQ_A3 .15 -.11 .13 .20** .08 .15 .13 --
29. ZGQ_A .11 -.13 .10 .22** .07 .74** .74** .66** .45
30. # Friends -.01 -.07 -.01 .06 -.01 .05 .01 .01 .03 --
31. # Close Friends .01 .19** .16* .16* .23** .13 .00 .09 .11 .06 --
32. # New Friends -.16 .00 .03 .13 .07 .06 -.04 -.02 -.03 .86** .20** --
33.
# Calling You
Friend .00 .04 .05 .15* .11 .12 .02 .09 .11 .59** .16* .59**
34.
# Calling You
Close Friend -.04 .15* .18* .23** .25** .13 -.01 .11 .12 .24** .91** .37**
35. # Dislike You .07 .01 .03 -.03 .00 -.04 .03 -.07 -.04 .20** .04 .16*
36.
# Hours Talking
to Friends -.12 .02 .13 .13 .11 -.01 -.04 -.06 -.08 .08 .10 .17*
37.
# Hours
Technology with
Friends .01 .06 .08 .09 .10 .05 .00 -.15* -.15
* .16
* .00 .26
**
38. # Organizations -.30* .07 .04 .10 .09 -.03 .10 -.02 .02 .39** .19** .46**
39. Org Involvement -.10 .09 .10 .14 .15* .07 .05 -.03 .04 .15* .31** .21**
(table continues)
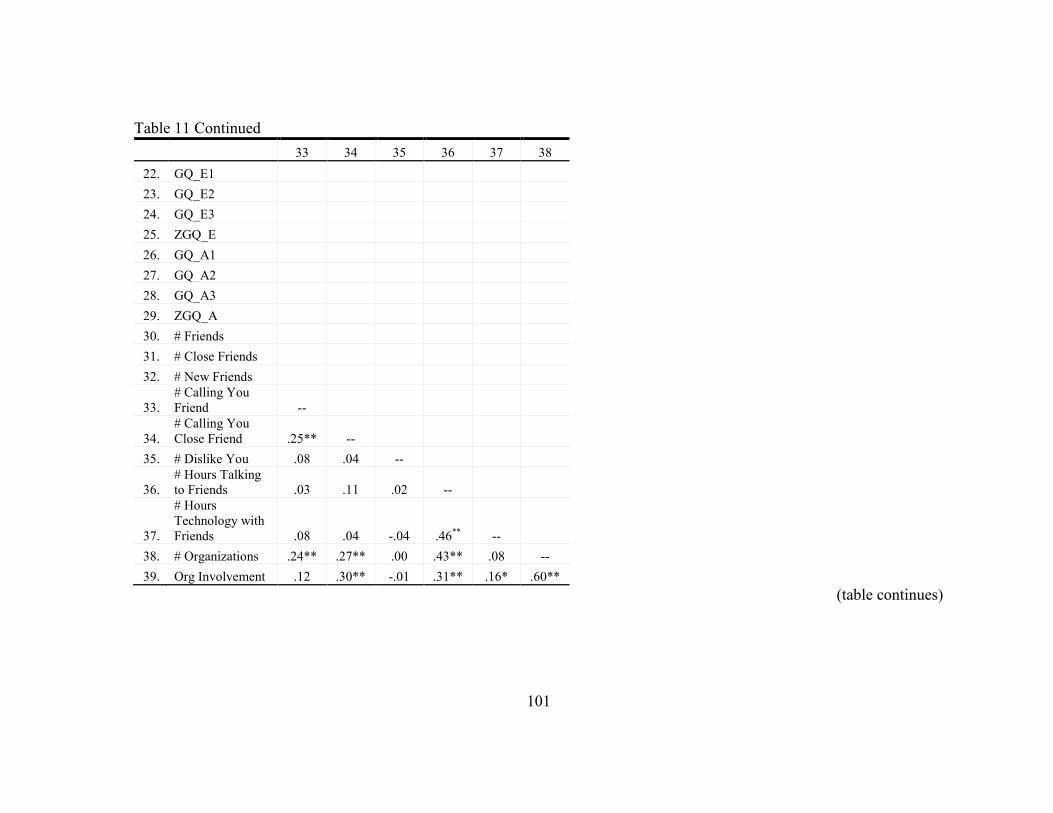
101
Table 11 Continued
33 34 35 36 37 38
22. GQ_E1
23. GQ_E2
24. GQ_E3
25. ZGQ_E
26. GQ_A1
27. GQ_A2
28. GQ_A3
29. ZGQ_A
30. # Friends
31. # Close Friends
32. # New Friends
33.
# Calling You
Friend --
34.
# Calling You
Close Friend .25** --
35. # Dislike You .08 .04 --
36.
# Hours Talking
to Friends .03 .11 .02 --
37.
# Hours
Technology with
Friends .08 .04 -.04 .46**
--
38. # Organizations .24** .27** .00 .43** .08 --
39. Org Involvement .12 .30** -.01 .31** .16* .60**
(table continues)
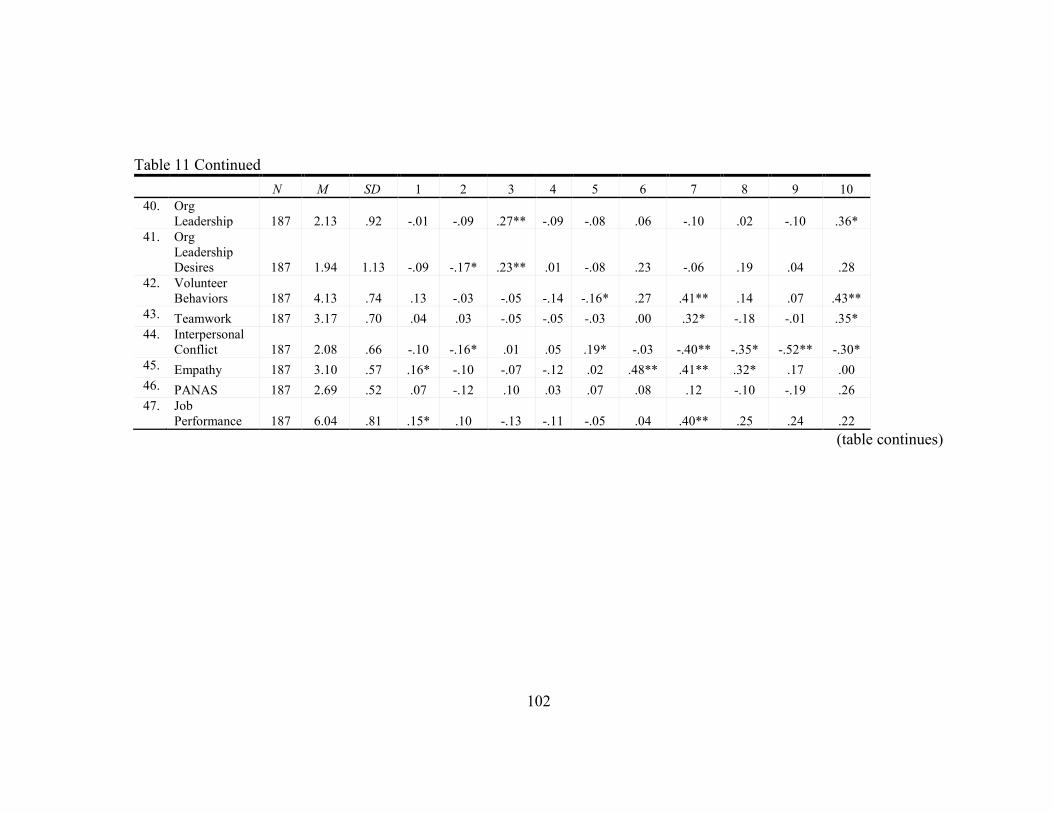
102
Table 11 Continued
N M SD 1 2 3 4 5 6 7 8 9 10
40. Org
Leadership 187 2.13 .92 -.01 -.09 .27** -.09 -.08 .06 -.10 .02 -.10 .36*
41. Org
Leadership
Desires 187 1.94 1.13 -.09 -.17* .23** .01 -.08 .23 -.06 .19 .04 .28
42. Volunteer
Behaviors 187 4.13 .74 .13 -.03 -.05 -.14 -.16* .27 .41** .14 .07 .43**
43. Teamwork 187 3.17 .70 .04 .03 -.05 -.05 -.03 .00 .32* -.18 -.01 .35*
44. Interpersonal
Conflict 187 2.08 .66 -.10 -.16* .01 .05 .19* -.03 -.40** -.35* -.52** -.30*
45. Empathy 187 3.10 .57 .16* -.10 -.07 -.12 .02 .48** .41** .32* .17 .00
46. PANAS 187 2.69 .52 .07 -.12 .10 .03 .07 .08 .12 -.10 -.19 .26
47. Job
Performance 187 6.04 .81 .15* .10 -.13 -.11 -.05 .04 .40** .25 .24 .22
(table continues)
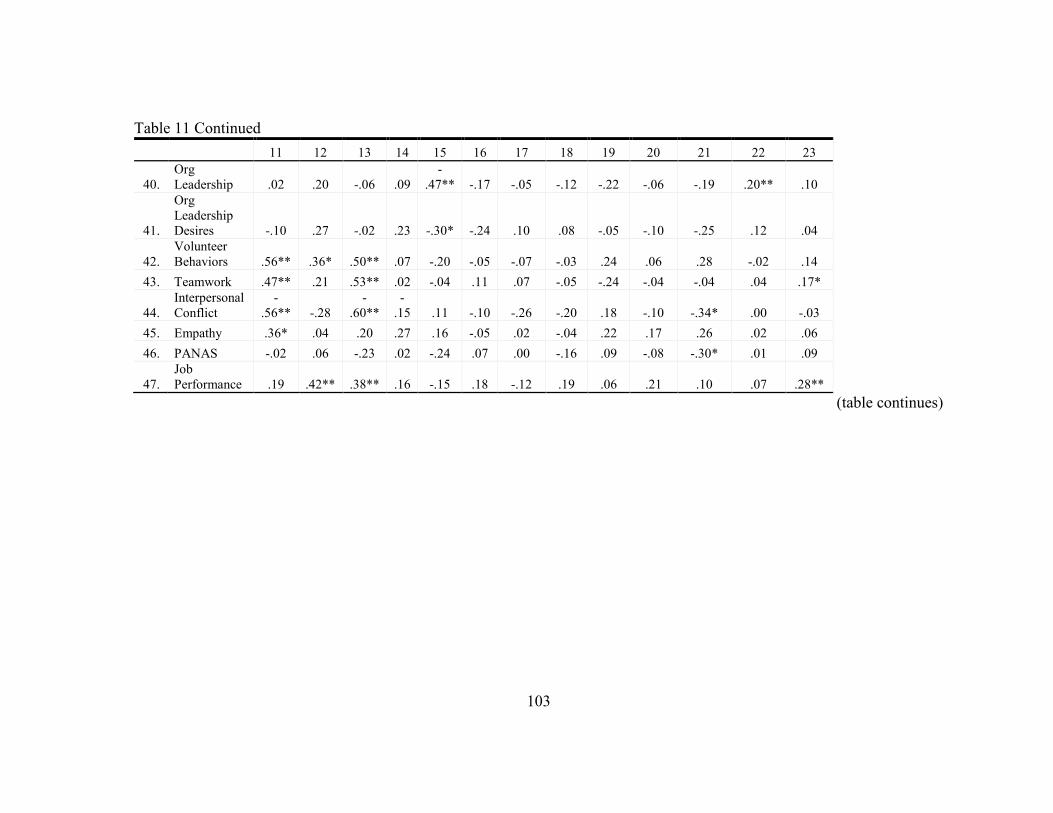
103
Table 11 Continued
11 12 13 14 15 16 17 18 19 20 21 22 23
40.
Org
Leadership .02 .20 -.06 .09
-
.47** -.17 -.05 -.12 -.22 -.06 -.19 .20** .10
41.
Org
Leadership
Desires -.10 .27 -.02 .23 -.30* -.24 .10 .08 -.05 -.10 -.25 .12 .04
42.
Volunteer
Behaviors .56** .36* .50** .07 -.20 -.05 -.07 -.03 .24 .06 .28 -.02 .14
43. Teamwork .47** .21 .53** .02 -.04 .11 .07 -.05 -.24 -.04 -.04 .04 .17*
44.
Interpersonal
Conflict
-
.56** -.28
-
.60**
-
.15 .11 -.10 -.26 -.20 .18 -.10 -.34* .00 -.03
45. Empathy .36* .04 .20 .27 .16 -.05 .02 -.04 .22 .17 .26 .02 .06
46. PANAS -.02 .06 -.23 .02 -.24 .07 .00 -.16 .09 -.08 -.30* .01 .09
47.
Job
Performance .19 .42** .38** .16 -.15 .18 -.12 .19 .06 .21 .10 .07 .28**
(table continues)
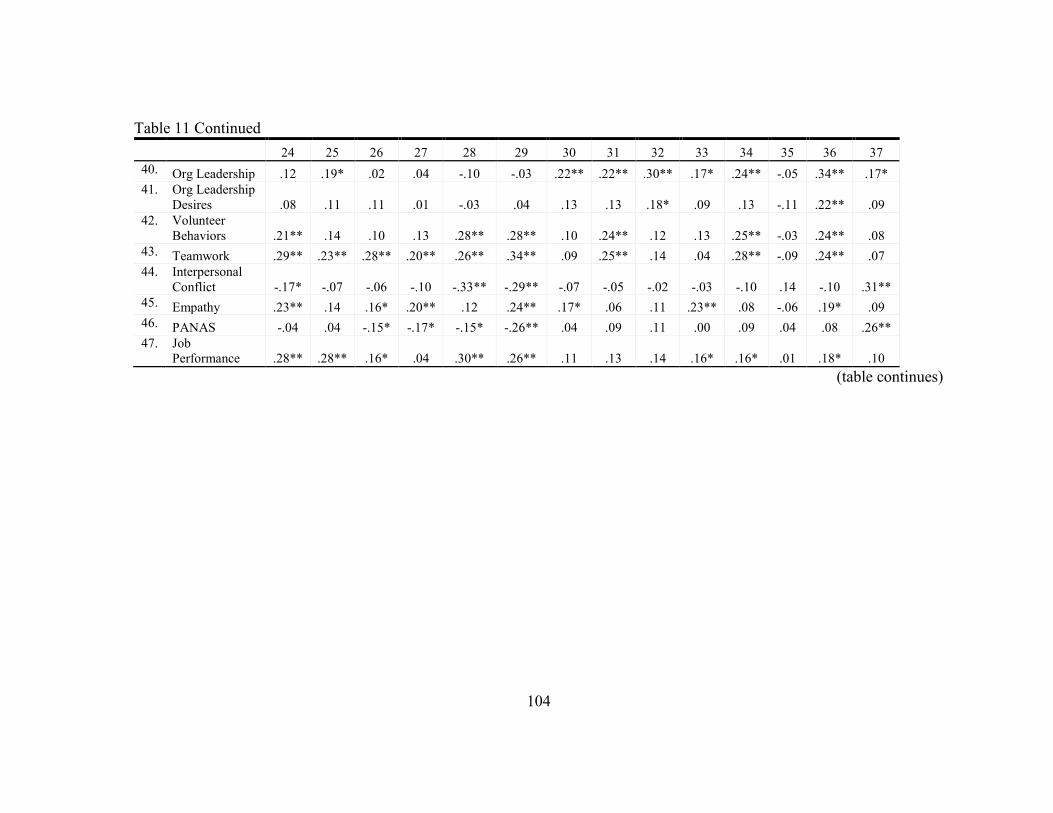
104
Table 11 Continued
24 25 26 27 28 29 30 31 32 33 34 35 36 37
40. Org Leadership .12 .19* .02 .04 -.10 -.03 .22** .22** .30** .17* .24** -.05 .34** .17*
41. Org Leadership
Desires .08 .11 .11 .01 -.03 .04 .13 .13 .18* .09 .13 -.11 .22** .09
42. Volunteer
Behaviors .21** .14 .10 .13 .28** .28** .10 .24** .12 .13 .25** -.03 .24** .08
43. Teamwork .29** .23** .28** .20** .26** .34** .09 .25** .14 .04 .28** -.09 .24** .07
44. Interpersonal
Conflict -.17* -.07 -.06 -.10 -.33** -.29** -.07 -.05 -.02 -.03 -.10 .14 -.10 .31**
45. Empathy .23** .14 .16* .20** .12 .24** .17* .06 .11 .23** .08 -.06 .19* .09
46. PANAS -.04 .04 -.15* -.17* -.15* -.26** .04 .09 .11 .00 .09 .04 .08 .26**
47. Job
Performance .28** .28** .16* .04 .30** .26** .11 .13 .14 .16* .16* .01 .18* .10
(table continues)

105
Table 11 Continued
38 39 40 41 42 43 44 45 46 47
40. Org Leadership .72** .77** --
41.
Org Leadership
Desires .51** .50** .72** --
42. Volunteer Behaviors .26** .41** .34** .26** .86
43. Teamwork .15* .23** .16* .15* .39** .84
44. Interpersonal Conflict .01 .04 .11 .08 -.22** -.28** .85
45. Empathy .10 .16* .08 .06 .43** .19** -.21** .39
46. PANAS .11 .22** .19** .11 .03 -.05 .36** -.08 .86
47. Job Performance .12 .21** .12 .18* .39** .34** -.25** .25** .15* .93
Note. For sex, 1 = male and 2 = female. For educational level, 1 = less than high school, 2 = high school, 3 = some college but no degree, 4 =
Associate’s degree, 5 = Bachelor’s degree, 6 = some graduate school but no degree, 7 = Master’s degree, and 8 = Doctoral degree. For English literacy,
1 = I am a native English speaker, 2 = I learned English as a second language, and 3 = I do not speak fluent English. For reading comprehension, 1 = I
can read and comprehend complex text such as books or reports that are lengthy or contain technical information, 2= I can read and comprehend
average-level text such as magazine or newspaper articles, 3= I can read and comprehend simple text such as street signs or application forms, and 4 = I
cannot read and comprehend written text. NEO: NEO-PI-R, FG: Fake good condition, Honest: Honest condition, Not Revealed: Purpose of test not
revealed condition, Revealed: Purpose of test revealed condition, CRT: Conditional reasoning test, E: Extraversion, A: Agreeableness, z: Standardized
variable, GQ: General question, Org: Organizational, PANAS: Positive and negative affect scale.
* = Correlation is significant at the 0.05 level, two-tailed. ** = Correlation is significant at the 0.01 level, two-tailed. Coefficient alphas for each scale
are presented in the diagonals. Standardized reliabilities are presented for standardized scales.
106
Exploratory results for criterion-related validity. In order to explore the
development of the Agreeableness and Extraversion CRT measure further, item-level
analyses were conducted determine if certain items predicted relevant outcomes better
than other. Correlations between each CRT item and the criteria examined in the studies
were analyzed. For the Extraversion CRT, it was found that five of the 15 items did not
correlate with any of the construct-relevant outcomes. An additional five items
correlated with either one or two criteria and one item correlated with three relevant
outcomes. The other four items were retained in the revised Extraversion CRT
correlating with at least four relevant outcomes. After rerunning the correlations, the
Extraversion CRT was significantly positively related to job performance (r = .20, p
<.01) and preferring to reach a compromise when making decisions with others (r = .23,
p <.01). Extraversion CRT scores were significantly negatively related to the number of
people they consider a close friend (r = -.18, p <.05), and interpersonal conflict (r = -.29,
p <.01). However, after cross validating those results by selecting a new random sample
from the dataset, all correlations become nonsignificant except preferring to reach a
compromise when making decisions with others (r = .32, p <.01) which was originally
developed as an Agreeableness criterion. It is concluded that these preliminary scale
refinement techniques did not improve the Extraversion CRT.
For the Agreeableness CRT, the same revision process was conducted. Looking
at the item-level correlations, three of the 18 items correlated with none of the relevant
outcomes, four correlated with one or two of the relevant outcomes and five correlated
with three of the outcomes. The other eight items were retained in the revised
107
Agreeableness CRT. Results correlating the Agreeableness CRT scores with the
relevant outcomes result in a significantly positively related to preferring to reach a
compromise when making decisions with others (r = .19, p <.01). Agreeableness CRT
scores were significantly negatively related to the number of organizations the person is
a part of (r = -.18, p <.05), the level of involvement in these organizations, (r = -.15, p
<.05), and holding a leadership position (r = -.25, p <.01) or wanting to hold a leadership
position (r = -.15, p <.05) in these organizations, the PANAS (r = -.17, p <.05), and
interpersonal conflict (r = -.21, p <.01). Cross-validation results show a significantly
positive relationship with preferring to reach a compromise when making decisions with
others (r = .27, p <.01) and a significantly negative relationship with the number of
organizations the person is a part of (r = -.29, p <.05), the level of involvement in these
organizations, (r = -.28, p <.05), and holding a leadership position (r = -.37, p <.01) in
these organizations as well as the PANAS (r = -.25, p <.05). Although these preliminary
scale refinement techniques produced many large correlations for selection research, it
did not greatly improve the criterion-related validity of the measure.
Incremental validity. Hypothesis 3 postulated that CRTs for Agreeableness and
Extraversion would have incremental validity in the prediction of construct-relevant
outcomes over and above traditional tests of these constructs. In order to test this
hypothesis, a hierarchical regression was conducted. Looking over the significant
correlations from Table 11, it was determined that the criteria of number of close friends,
number of people calling you a close friend, and interpersonal conflict were the only
outcome variables that had significant correlations with both types of personality tests.
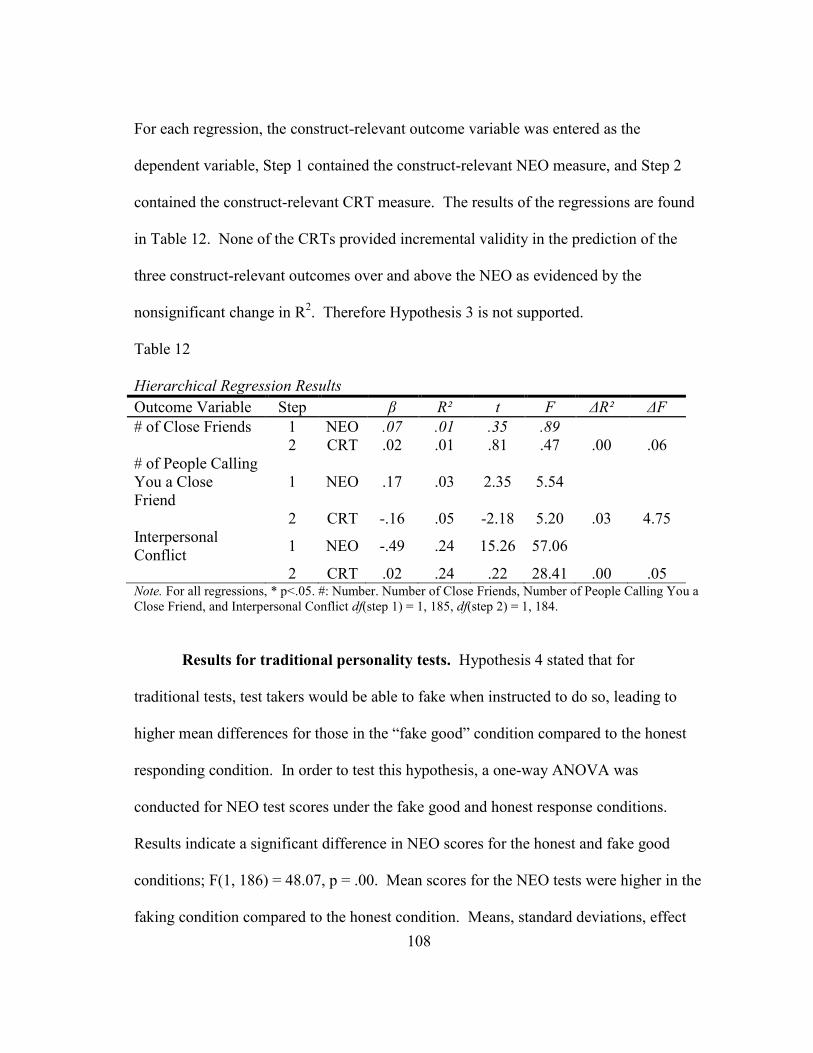
108
For each regression, the construct-relevant outcome variable was entered as the
dependent variable, Step 1 contained the construct-relevant NEO measure, and Step 2
contained the construct-relevant CRT measure. The results of the regressions are found
in Table 12. None of the CRTs provided incremental validity in the prediction of the
three construct-relevant outcomes over and above the NEO as evidenced by the
nonsignificant change in R2. Therefore Hypothesis 3 is not supported.
Table 12
Hierarchical Regression Results
Outcome Variable Step β R² t F ΔR² ΔF
# of Close Friends 1 NEO .07 .01 .35 .89
2 CRT .02 .01 .81 .47 .00 .06
# of People Calling
You a Close
Friend
1 NEO .17 .03 2.35 5.54
2 CRT -.16 .05 -2.18 5.20 .03 4.75
Interpersonal
Conflict 1 NEO -.49 .24 15.26 57.06
2 CRT .02 .24 .22 28.41 .00 .05 Note. For all regressions, * p<.05. #: Number. Number of Close Friends, Number of People Calling You a
Close Friend, and Interpersonal Conflict df(step 1) = 1, 185, df(step 2) = 1, 184.
Results for traditional personality tests. Hypothesis 4 stated that for
traditional tests, test takers would be able to fake when instructed to do so, leading to
higher mean differences for those in the “fake good” condition compared to the honest
responding condition. In order to test this hypothesis, a one-way ANOVA was
conducted for NEO test scores under the fake good and honest response conditions.
Results indicate a significant difference in NEO scores for the honest and fake good
conditions; F(1, 186) = 48.07, p = .00. Mean scores for the NEO tests were higher in the
faking condition compared to the honest condition. Means, standard deviations, effect
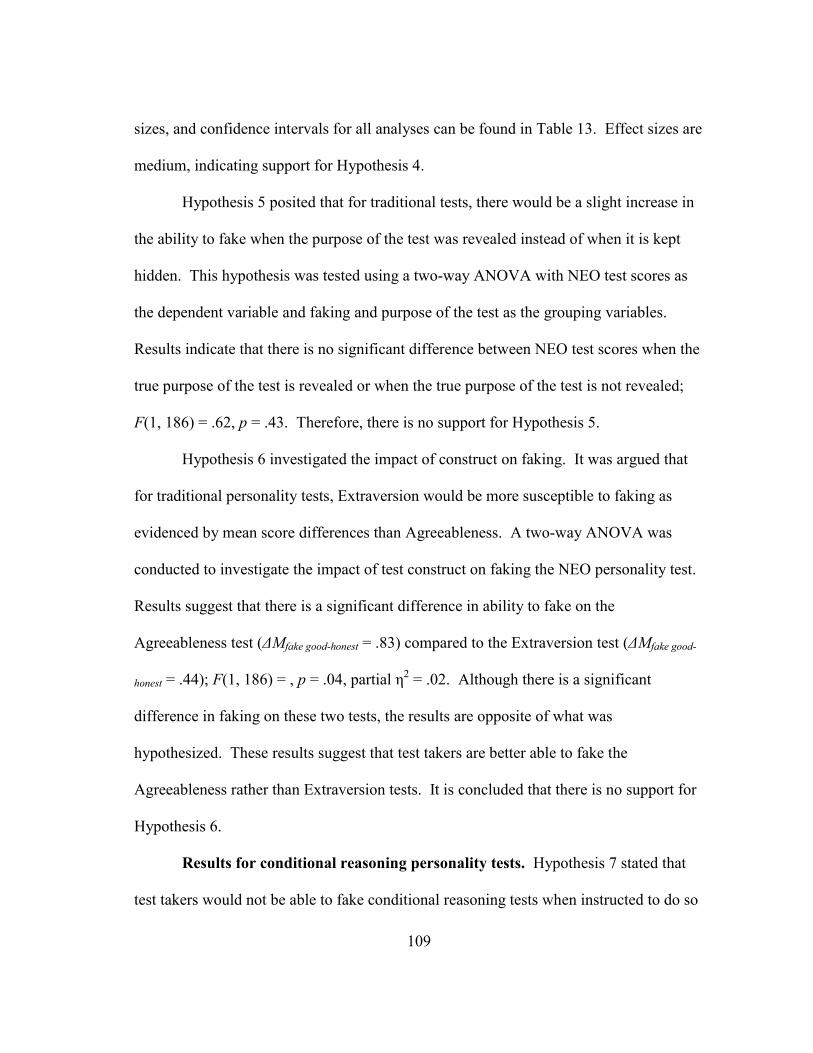
109
sizes, and confidence intervals for all analyses can be found in Table 13. Effect sizes are
medium, indicating support for Hypothesis 4.
Hypothesis 5 posited that for traditional tests, there would be a slight increase in
the ability to fake when the purpose of the test was revealed instead of when it is kept
hidden. This hypothesis was tested using a two-way ANOVA with NEO test scores as
the dependent variable and faking and purpose of the test as the grouping variables.
Results indicate that there is no significant difference between NEO test scores when the
true purpose of the test is revealed or when the true purpose of the test is not revealed;
F(1, 186) = .62, p = .43. Therefore, there is no support for Hypothesis 5.
Hypothesis 6 investigated the impact of construct on faking. It was argued that
for traditional personality tests, Extraversion would be more susceptible to faking as
evidenced by mean score differences than Agreeableness. A two-way ANOVA was
conducted to investigate the impact of test construct on faking the NEO personality test.
Results suggest that there is a significant difference in ability to fake on the
Agreeableness test (ΔMfake good-honest = .83) compared to the Extraversion test (ΔMfake good-
honest = .44); F(1, 186) = , p = .04, partial η2 = .02. Although there is a significant
difference in faking on these two tests, the results are opposite of what was
hypothesized. These results suggest that test takers are better able to fake the
Agreeableness rather than Extraversion tests. It is concluded that there is no support for
Hypothesis 6.
Results for conditional reasoning personality tests. Hypothesis 7 stated that
test takers would not be able to fake conditional reasoning tests when instructed to do so
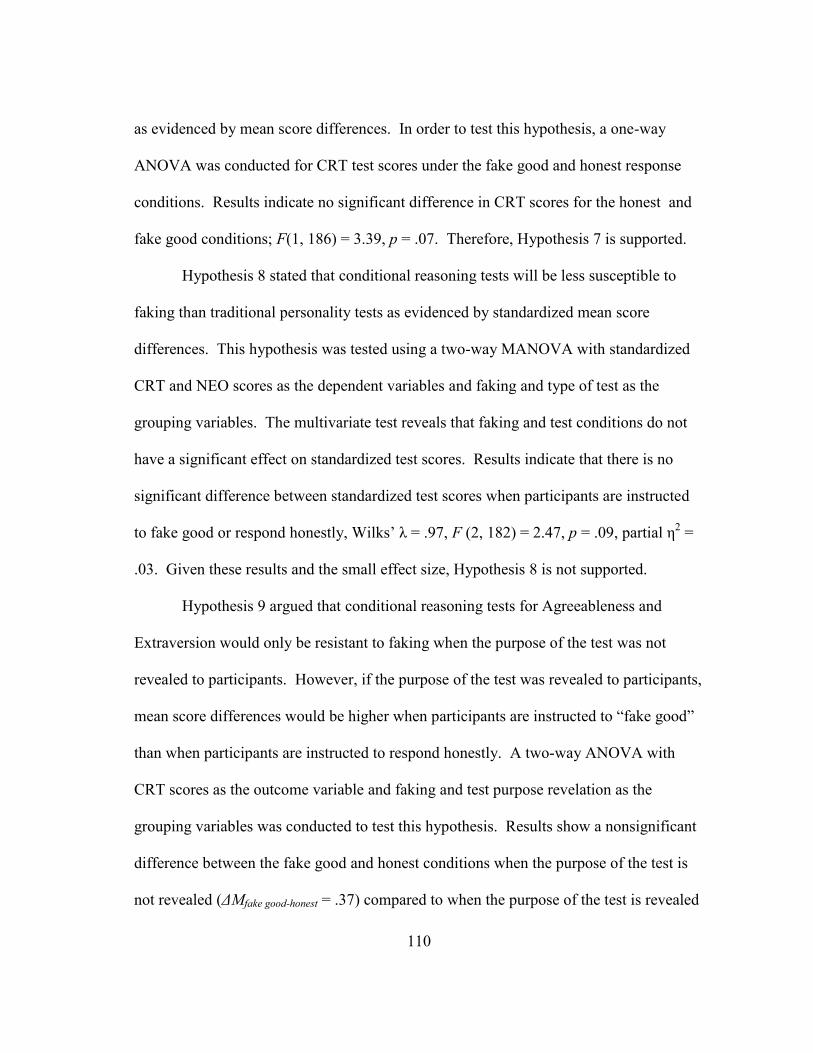
110
as evidenced by mean score differences. In order to test this hypothesis, a one-way
ANOVA was conducted for CRT test scores under the fake good and honest response
conditions. Results indicate no significant difference in CRT scores for the honest and
fake good conditions; F(1, 186) = 3.39, p = .07. Therefore, Hypothesis 7 is supported.
Hypothesis 8 stated that conditional reasoning tests will be less susceptible to
faking than traditional personality tests as evidenced by standardized mean score
differences. This hypothesis was tested using a two-way MANOVA with standardized
CRT and NEO scores as the dependent variables and faking and type of test as the
grouping variables. The multivariate test reveals that faking and test conditions do not
have a significant effect on standardized test scores. Results indicate that there is no
significant difference between standardized test scores when participants are instructed
to fake good or respond honestly, Wilks’ λ = .97, F (2, 182) = 2.47, p = .09, partial η2 =
.03. Given these results and the small effect size, Hypothesis 8 is not supported.
Hypothesis 9 argued that conditional reasoning tests for Agreeableness and
Extraversion would only be resistant to faking when the purpose of the test was not
revealed to participants. However, if the purpose of the test was revealed to participants,
mean score differences would be higher when participants are instructed to “fake good”
than when participants are instructed to respond honestly. A two-way ANOVA with
CRT scores as the outcome variable and faking and test purpose revelation as the
grouping variables was conducted to test this hypothesis. Results show a nonsignificant
difference between the fake good and honest conditions when the purpose of the test is
not revealed (ΔMfake good-honest = .37) compared to when the purpose of the test is revealed
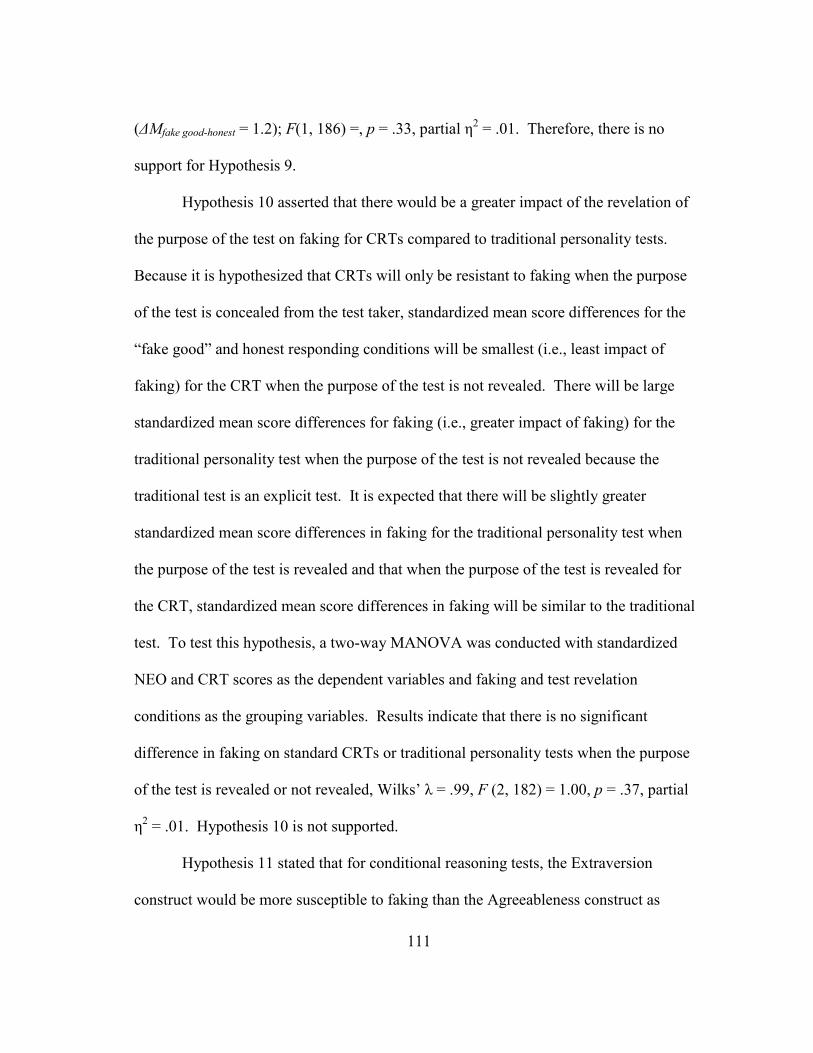
111
(ΔMfake good-honest = 1.2); F(1, 186) =, p = .33, partial η2 = .01. Therefore, there is no
support for Hypothesis 9.
Hypothesis 10 asserted that there would be a greater impact of the revelation of
the purpose of the test on faking for CRTs compared to traditional personality tests.
Because it is hypothesized that CRTs will only be resistant to faking when the purpose
of the test is concealed from the test taker, standardized mean score differences for the
“fake good” and honest responding conditions will be smallest (i.e., least impact of
faking) for the CRT when the purpose of the test is not revealed. There will be large
standardized mean score differences for faking (i.e., greater impact of faking) for the
traditional personality test when the purpose of the test is not revealed because the
traditional test is an explicit test. It is expected that there will be slightly greater
standardized mean score differences in faking for the traditional personality test when
the purpose of the test is revealed and that when the purpose of the test is revealed for
the CRT, standardized mean score differences in faking will be similar to the traditional
test. To test this hypothesis, a two-way MANOVA was conducted with standardized
NEO and CRT scores as the dependent variables and faking and test revelation
conditions as the grouping variables. Results indicate that there is no significant
difference in faking on standard CRTs or traditional personality tests when the purpose
of the test is revealed or not revealed, Wilks’ λ = .99, F (2, 182) = 1.00, p = .37, partial
η2 = .01. Hypothesis 10 is not supported.
Hypothesis 11 stated that for conditional reasoning tests, the Extraversion
construct would be more susceptible to faking than the Agreeableness construct as
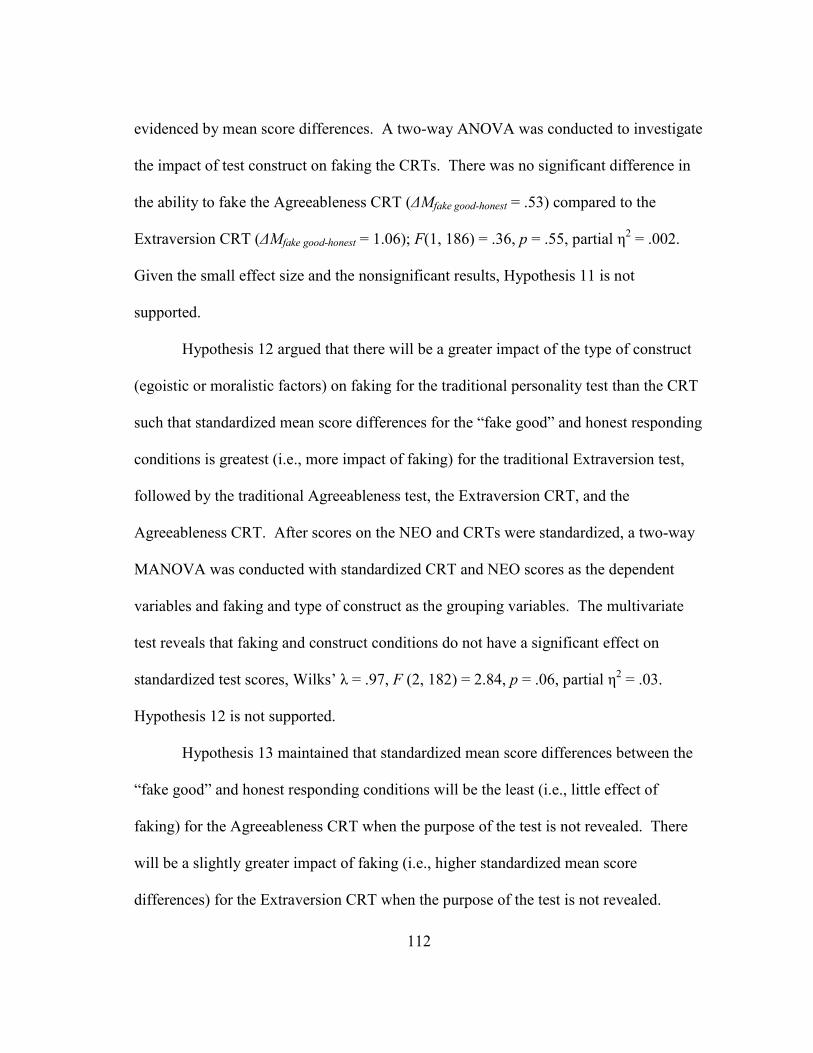
112
evidenced by mean score differences. A two-way ANOVA was conducted to investigate
the impact of test construct on faking the CRTs. There was no significant difference in
the ability to fake the Agreeableness CRT (ΔMfake good-honest = .53) compared to the
Extraversion CRT (ΔMfake good-honest = 1.06); F(1, 186) = .36, p = .55, partial η2 = .002.
Given the small effect size and the nonsignificant results, Hypothesis 11 is not
supported.
Hypothesis 12 argued that there will be a greater impact of the type of construct
(egoistic or moralistic factors) on faking for the traditional personality test than the CRT
such that standardized mean score differences for the “fake good” and honest responding
conditions is greatest (i.e., more impact of faking) for the traditional Extraversion test,
followed by the traditional Agreeableness test, the Extraversion CRT, and the
Agreeableness CRT. After scores on the NEO and CRTs were standardized, a two-way
MANOVA was conducted with standardized CRT and NEO scores as the dependent
variables and faking and type of construct as the grouping variables. The multivariate
test reveals that faking and construct conditions do not have a significant effect on
standardized test scores, Wilks’ λ = .97, F (2, 182) = 2.84, p = .06, partial η2 = .03.
Hypothesis 12 is not supported.
Hypothesis 13 maintained that standardized mean score differences between the
“fake good” and honest responding conditions will be the least (i.e., little effect of
faking) for the Agreeableness CRT when the purpose of the test is not revealed. There
will be a slightly greater impact of faking (i.e., higher standardized mean score
differences) for the Extraversion CRT when the purpose of the test is not revealed.
113
However, it is expected that once the purpose of the test is revealed, the CRT will
function as an explicit test and standardized mean score differences for the “fake good”
and honest responding conditions will be similar to the traditional tests. Standardized
mean score differences between the “fake good” and honest responding conditions for
the traditional test will be greater for the Agreeableness and Extraversion traditional
personality tests when the purpose of the test is not revealed than the CRT when the
purpose of the test is not revealed; however, the Extraversion traditional test will have a
greater impact of faking than the Agreeableness traditional test. When the purpose of
the test is revealed, standardized mean score differences between the “fake good” and
honest responding conditions for both the traditional tests and CRTs will be greater than
any of the previous conditions. CRT and traditional tests of Extraversion will have the
greatest impact of faking as evidenced by standardized mean score differences, followed
by tests of Agreeableness. Standardized mean score differences for these types of tests
when the purpose of the test is revealed will be similar for CRTs and traditional tests. In
order to test this hypothesis a three-way MANOVA was conducted with NEO and CRT
scores as the dependent variables and faking, construct, and revelation conditions as the
grouping variables. Results indicate that there is no significant difference in faking on
standardized CRTs or traditional personality tests when the purpose of the test is
revealed or not revealed, for either Agreeableness or Extraversion measures, Wilks’ λ =
.99, F (2, 182) = .96, p = .38, partial η2 = .01. Therefore, there was no support for
Hypothesis 13.
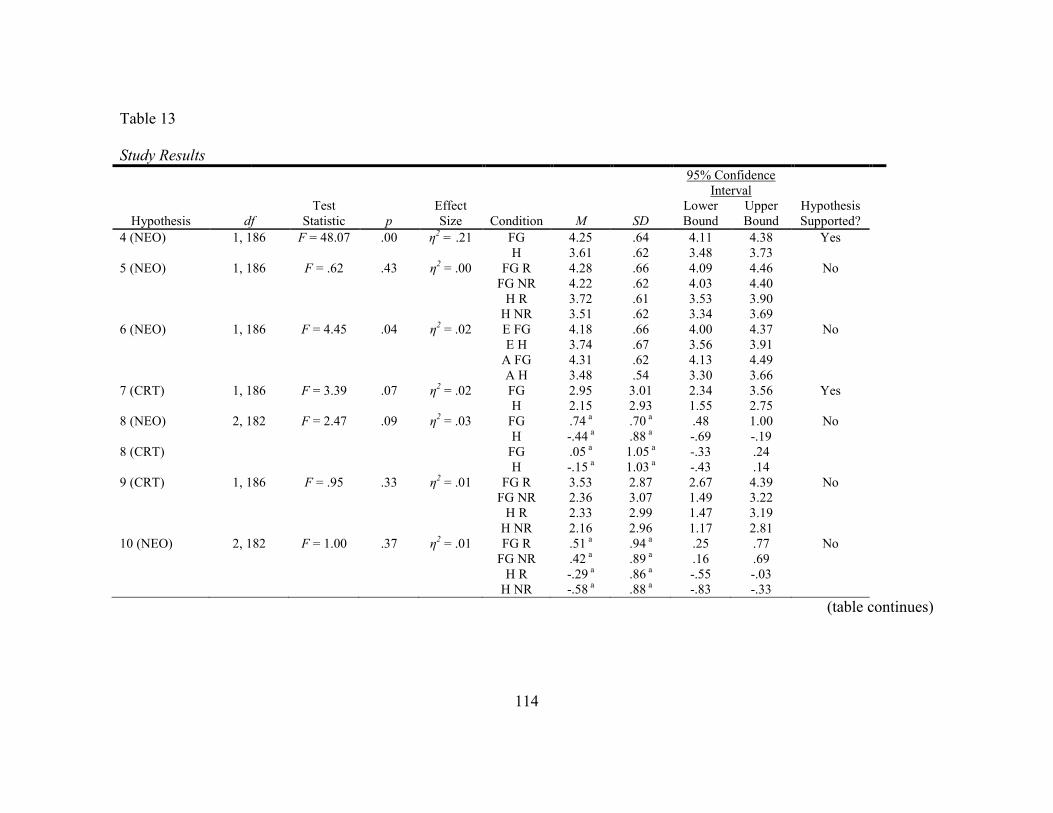
114
Table 13
Study Results
95% Confidence
Interval
Hypothesis df
Test
Statistic p
Effect
Size Condition M SD
Lower
Bound
Upper
Bound
Hypothesis
Supported?
4 (NEO) 1, 186 F = 48.07 .00 η2 = .21 FG 4.25 .64 4.11 4.38 Yes
H 3.61 .62 3.48 3.73
5 (NEO) 1, 186 F = .62 .43 η2 = .00 FG R 4.28 .66 4.09 4.46 No
FG NR 4.22 .62 4.03 4.40
H R 3.72 .61 3.53 3.90
H NR 3.51 .62 3.34 3.69
6 (NEO) 1, 186 F = 4.45 .04 η2 = .02 E FG 4.18 .66 4.00 4.37 No
E H 3.74 .67 3.56 3.91
A FG 4.31 .62 4.13 4.49
A H 3.48 .54 3.30 3.66
7 (CRT) 1, 186 F = 3.39 .07 η2 = .02 FG 2.95 3.01 2.34 3.56 Yes
H 2.15 2.93 1.55 2.75
8 (NEO) 2, 182 F = 2.47 .09 η2 = .03 FG .74
a .70
a .48 1.00 No
H -.44 a .88
a -.69 -.19
8 (CRT) FG .05 a 1.05
a -.33 .24
H -.15 a 1.03
a -.43 .14
9 (CRT) 1, 186 F = .95 .33 η2 = .01 FG R 3.53 2.87 2.67 4.39 No
FG NR 2.36 3.07 1.49 3.22
H R 2.33 2.99 1.47 3.19
H NR 2.16 2.96 1.17 2.81
10 (NEO) 2, 182 F = 1.00 .37 η2 = .01 FG R .51
a .94
a .25 .77 No
FG NR .42 a .89
a .16 .69
H R -.29 a .86
a -.55 -.03
H NR -.58 a .88
a -.83 -.33
(table continues)
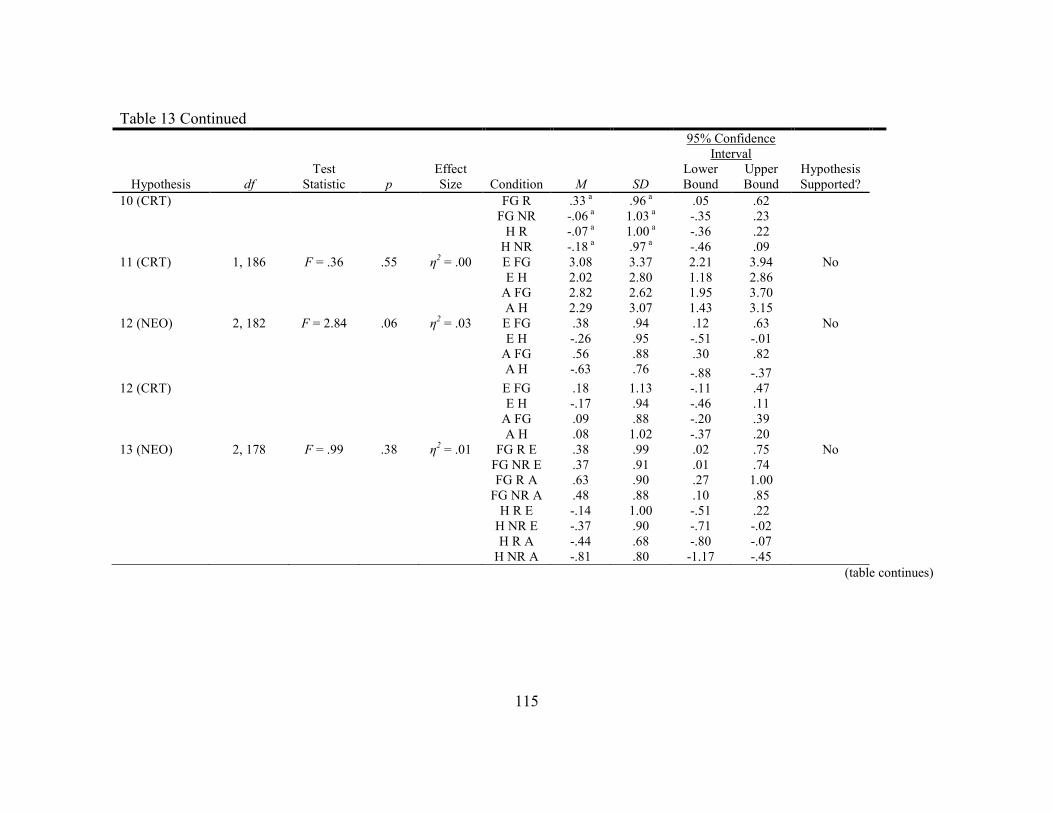
115
Table 13 Continued
95% Confidence
Interval
Hypothesis df
Test
Statistic p
Effect
Size Condition M SD
Lower
Bound
Upper
Bound
Hypothesis
Supported?
10 (CRT) FG R .33 a .96
a .05 .62
FG NR -.06 a 1.03
a -.35 .23
H R -.07 a 1.00
a -.36 .22
H NR -.18 a .97
a -.46 .09
11 (CRT) 1, 186 F = .36 .55 η2 = .00 E FG 3.08 3.37 2.21 3.94 No
E H 2.02 2.80 1.18 2.86
A FG 2.82 2.62 1.95 3.70
A H 2.29 3.07 1.43 3.15
12 (NEO) 2, 182 F = 2.84 .06 η2 = .03 E FG .38 .94 .12 .63 No
E H -.26 .95 -.51 -.01
A FG .56 .88 .30 .82
A H -.63 .76 -.88 -.37
12 (CRT) E FG .18 1.13 -.11 .47
E H -.17 .94 -.46 .11
A FG .09 .88 -.20 .39
A H .08 1.02 -.37 .20
13 (NEO) 2, 178 F = .99 .38 η2 = .01 FG R E .38 .99 .02 .75 No
FG NR E .37 .91 .01 .74
FG R A .63 .90 .27 1.00
FG NR A .48 .88 .10 .85
H R E -.14 1.00 -.51 .22
H NR E -.37 .90 -.71 -.02
H R A -.44 .68 -.80 -.07
H NR A -.81 .80 -1.17 -.45
(table continues)
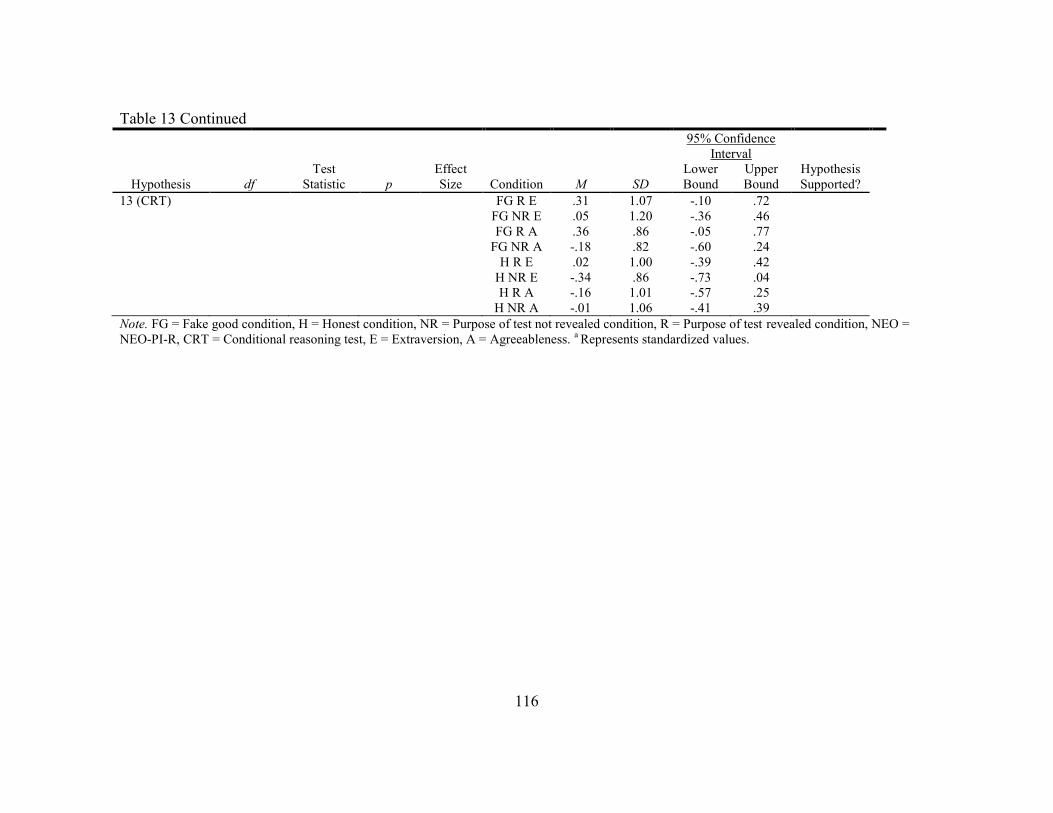
116
Table 13 Continued
95% Confidence
Interval
Hypothesis df
Test
Statistic p
Effect
Size Condition M SD
Lower
Bound
Upper
Bound
Hypothesis
Supported?
13 (CRT) FG R E .31 1.07 -.10 .72
FG NR E .05 1.20 -.36 .46
FG R A .36 .86 -.05 .77
FG NR A -.18 .82 -.60 .24
H R E .02 1.00 -.39 .42
H NR E -.34 .86 -.73 .04
H R A -.16 1.01 -.57 .25
H NR A -.01 1.06 -.41 .39
Note. FG = Fake good condition, H = Honest condition, NR = Purpose of test not revealed condition, R = Purpose of test revealed condition, NEO =
NEO-PI-R, CRT = Conditional reasoning test, E = Extraversion, A = Agreeableness. a Represents standardized values.
117
CHAPTER X
CONCLUSIONS
Overview
The purpose of this study was to investigate the impact of faking on traditional,
self-report personality tests (such as the NEO-PI-R) and a new test for personality, the
conditional reasoning test (CRT). CRTs have been argued to be superior to other
personality tests because they operate at a subconscious level and are therefore difficult
to fake (James, 1998, LeBreton et al., 2007). CRTs have also been reported to be just as
valid, or more valid, in predicting relevant outcomes (Berry et al., 2010; James et al.,
2005). However, previous studies have primarily focused on measuring the construct of
Aggression. The current study departs from this trend by exploring the utility of the
conditional reasoning method of assessment for two often studied constructs in the I/O
psychology literature: Extraversion and Agreeableness. These CRTs and corresponding
traditional personality measures were administered under a variety of conditions (faking
instructions, revelation of the true purpose of the test) to determine whether CRTs were
useful in the prediction of several construct-relevant criteria and whether CRTs could be
faked. Results show that the CRTs for Agreeableness and Extraversion are related to
construct-related criteria. However, the NEO tests are more valid in the prediction of
these criteria. In terms of faking, participants were not able to fake the CRT if the
purpose of the test at a personality measure remained hidden. When the true nature of
the test was revealed, participants were still unable to fake the Agreeableness or
118
Extraversion CRT. This lends support to the notion that the justification mechanisms
people endorse occur at the level of the subconscious.
Criterion-Related Validity of the CRT and NEO-PI-R
The criterion-related validity of the CRTs was compared to the criterion-related
validity of the NEO-PI-R to determine the utility of the CRTs. Because CRTs are much
more onerous to develop than traditional self-report personality tests, it is important to
make sure that CRTs do, in fact, measure what they purport to measure and they do so
comparably to traditional tests. For Hypotheses 1 and 2, it was found that both the NEO
and the CRT correlated with relevant outcomes. However, the NEO tests were
significantly related to more positive outcomes (and in some instances correlations had a
greater magnitude with criteria) than the CRT and the CRT failed to provide incremental
validity above and beyond the CRT for construct-related criteria (Hypothesis 3). These
results show that the CRT-E and CRT-A do not predict relevant outcomes as well as the
NEO-PI-R tests.
Although these results are not encouraging for the usefulness of CRTs for
Agreeableness and Extraversion, it should be noted that these tests have not been
subjected to the same development and research as the Aggression CRT. Berry
(personal communication, November, 2012) stated that, although not widely known, the
Aggression CRT initially contained hundreds of items and only a very low percentage of
items were found to correlate well with relevant outcomes. Therefore, future research
into the applicability of the conditional reasoning method for other personality tests
should aim to generate a large item pool so that traditional test development techniques
119
can reveal a more valid test. Many personality tests are developed in exactly this
manner. Indeed, the items that were the basis for the International Personality Item Pool
NEO (IPIP-NEO) originally began as 1,311 Dutch items that were reduced to 914
(Hofstee, Kiers, De Raad, Goldberg, & Ostendorf, 1997). Similarly, the
Multidimensional Personality Questionnaire (MPQ) initially contained 1, 082 items but
was reduced to 276 items through test refinement (Tellegen & Waller, 2008).
Although scale refinement was not a main aim of the current paper, it would be
interesting to see how the most predictive ten items from the current CRTs for
Agreeableness and Extraversion would compare against the Agreeableness and
Extraversion NEO-PI-R. The NEO-PI-R has undergone many changes since its
inception. Therefore, it would be more reasonable to analyze the criterion-related
validity of the best possible version of the CRTs to the NEO. Although some
preliminary analyses were conducted without much change in criterion-related validity, a
more rigorous item refinement process may result in an equally valid measure of these
traits. Future research in this line of research will include these next steps.
It is also important to note that some of the CRT items were answered in an
illogical manner, despite the fact that the illogical items should in fact be irrational given
the item stem. The CRT items were examined by several industrial and organizational
graduate students and faculty to help ensure clarity as well as illogical answers. Further,
illogical responding occurred for both CRTs and under both fake good or honest
responding sets. It is unclear why participants in this study chose illogical responses
more frequently than other CRTs. As discussed in the limitations section of this paper,

120
perhaps participant motivation to read and fully comprehend the CRT items was
diminished because of the online administration of the test. Further, it might be that even
though these options were illogical to the highly educated item reviewers, this was less
obvious to the members of the sample whose educational level, on average, was lower
than the item reviewers.
Faking on Traditional and Conditional Reasoning Tests of Personality
One of the proposed advantages of CRTs over traditional tests is that CRTs are
less susceptible to faking (i.e., “faking good” to increase likelihood of selection) than are
traditional tests. This was tested by asking respondents to complete both a traditional,
self-report measure of Agreeableness and Extraversion and a CRT for Agreeableness
and Extraversion. Half of the participants were instructed to respond to the measures
honestly while half of the participants were instructed to fake good on the measures.
This methodology allowed the researcher to determine the fakeability of CRTs compared
to traditional personality tests.
Hypothesis 4 investigated the ability of test takers to fake the NEO tests when
instructed to do so. Consistent with previous research (Hough et al., 1990; Viswesvaran
& Ones, 1999), Hypothesis 4 was supported, indicating that test takers can fake
traditional tests when instructed to do so. This significant finding gives credibility to the
validity of the experimental manipulation, even though the manipulation check did not
necessarily indicate that the manipulation was successful. As mentioned in the Results
section, placement and wording of the manipulation check likely led to participant
confusion about what the question was truly asking. The results for Hypothesis 4
121
emphasize the negative impact faking can have on personality tests and reiterates the
need for strategies to reduce faking.
In parallel, Hypothesis 7 proposed that test takers who were instructed to fake
good on the CRTs would not be able to do so. No significant differences between fake
good and honest conditions for the CRTs were found indicating that test takers were
unable to fake the CRTs. This is consistent with past research (LeBreton et al., 2007)
which found that CRTs are resistant to faking if the true purpose of the test is kept
hidden. This result is encouraging because the major benefit of CRTs compared to other
methods of measurement is that CRTs are implicit and impervious to faking.
However, conditional reasoning tests were not found to be significantly less
susceptible to faking than traditional personality tests as evidenced by standardized mean
score differences (Hypothesis 8). This finding greatly reduces the attractiveness of
CRTs compared to traditional personality tests. The development and administration of
CRTs are onerous compared to traditional personality tests. The excitement surrounding
the use of CRTs as a predictor of employment outcomes is mainly driven by the
possibility that CRTs can circumvent the faking issue. Without evidence of the ability of
CRTs to reduce faking, it is difficult to recommend CRTs as a practical replacement for
traditional personality tests. Given past studies on other CRTs, it is interesting that there
was not a significant difference in faking between the two types of tests, although the
current author is unaware of any research that directly tests this comparison. It may be
that response options to the CRT were not equally socially desirable. When the items
were reviewed by faculty members and graduate students, the social desirability of the
122
response options was not directly assessed. Future CRT development should ensure that
this important component of test development is not overlooked.
Faking when the Nature of the Test is Revealed
Another proposed advantage of CRTs over traditional tests is that the implicit
nature of the test also makes the true nature of the test covert. This lack of transparency
again makes it more difficult to fake relative to traditional tests, so people cannot
intentionally inflate scores. This was tested by informing half of the participants from
the honest and fake good conditions of the true nature of the test (i.e., that the tests
measure personality) while the other half had the true purpose of the test kept hidden.
This research design allowed the researcher to determine whether a reduction in
fakeability for CRTs was due to the implicit nature of the test or whether it is due to
mere test taker deception about what the test measures.
First, revealing the nature of the NEO personality measure had no effect on test
scores. Although this finding is not consistent with Hypothesis 5, it is not surprising.
Test takers have likely been exposed to personality tests that are similar in structure to
the NEO-PI-R. Even if test takers were not familiar with such a test, the phrases that are
rated as part of the NEO-PI-R are likely to be seen as related to one’s personality.
Therefore, it is likely that any changes in the difference between the purpose of the test
conditions would be due only for the CRT and not enough to drive significant results.
According to Hypothesis 9, conditional reasoning tests for Agreeableness and
Extraversion should only be resistant to faking when the purpose of the test is not
revealed to participants. Support was not found for this hypothesis. These results
123
suggest that there were no differences in mean scores regardless of whether or not the
purpose of the test is revealed and test takers are not able to fake to a greater extent when
they are told the true nature of the test. Therefore the reduction in the ability to fake on
CRTs is not merely driven by the fact that items appear to be logical reasoning
problems, but are impervious to faking because test takers rely on the justification
mechanisms underlying the test items. In regards to Hypothesis 10, there was not a
greater impact of the revelation of the purpose of the test on faking for CRTs compared
to traditional personality tests.
Faking on Tests of Different Constructs
However, Hypothesis 6, traditional Extraversion tests would be easier to fake
than Agreeableness tests, was not supported. Contrary to the hypothesis, traditional
Agreeableness tests were more susceptible to faking than Extraversion tests. Other
studies have found similar results for the high fakeability of Agreeableness, particularly
in older samples, as is the case in the current study (Donnellan & Lucas, 2008; Furnham,
1997; McCrae et al., 1999; Mount, Barrick, & Strauss, 1994). Also, the response
instructions given to participants may have inadvertently influenced the fakeability of
the Agreeableness test compared to the Extraversion test because the NEO test items
were more similar to the adjectives used to describe the trait in the response instructions
for the Agreeableness test than the Extraversion test. This similarity might allow test
takers to more easily identify the test items that need to be faked.
Hypothesis 11 stated that the Extraversion CRT would have greater mean test
scores than the Agreeableness CRT. No significant differences were found for the
124
conditional reasoning tests, however. This result is somewhat surprising given the
significant result for differences in faking on the traditional personality test. Given the
small effect size for the effect of construct on traditional personality tests, it may be that
the implicit nature of the CRT overrides any effect attributed to the construct. If people
are unconsciously selecting a response option based on their personality, and by doing so
making the faking issue irrelevant, it may mean that any differences derived from either
the egoistic or moralistic construct would be exceeded by the fact that self-deception and
impression management do not play a role in the CRT. Similarly, Hypothesis 12 found
no differences in faking based on construct (Agreeableness and Extraversion) such that
the differences due to construct had a greater impact for the traditional test compared to
the CRT. Given that there were no significant findings for the effect of construct on
CRT, it is not surprising that the effect is not larger for CRTs than traditional personality
tests.
Faking Related to both Test Purpose Revelation and Construct
Hypothesis 13 was related to the interaction effect of construct and revelation of
the purpose of the test on the faking of traditional and conditional reasoning personality
tests. No significant differences were found for these interactions. Given the fact that
there were no significant effects for the purpose and the construct, as noted above, this
result is not surprising.
Limitations and Future Directions
There are several limitations to this study. As mentioned previously, the number
of CRT items for the Extraversion (15 items) and the Agreeableness (18 items) was
125
likely too few to provide a large enough item pool from which to pull valid items.
Future research would benefit greatly from a personality test for the Big Five traits that
is based on conditional reasoning. In order to generate a useful test, a large scale test
development process is needed. This process includes generating a large number of
items, collecting data and examining inter-item correlations, reliabilities, factor structure,
and criterion-related, construct, and content-related validity data. Then, items of poor
quality could be deleted from the scales, new items written, and further data collected.
Should future CRTs for factors of the Big Five be developed, it would also be useful to
generate multiple items for each of the justification mechanisms in order to make sure
that the content domain is being adequately captured. The difficulty in obtaining this
type of data for conditional reasoning test items is the length of time that it takes
participants to read and respond to these items. Test taker fatigue is an issue in
collecting this data so careful consideration should be given to the number of items
participants are given in any one test session. In order to create a high-caliber CRT,
multiple iterations of data collection and analysis is needed, likely taking many years to
complete.
Similarly, a potential limitation of this study is participant motivation. The
Aggression CRT was developed and refined using student data that was obtained in a
paper-and-pencil format (James, 1998). While previous studies have shown that online
participant recruiting sites collect equally valid data compared to traditional ways of
collecting data (Barger, & Sinar, 2011; Behrend et al., 2011; Buhrmester et al., 2011;
Paolacci et al., 2010), it is unknown how high reading load affects test taker motivation
126
when items are presented in paper-and-pencil format compared to a computer-based
method. Participants were reimbursed for their time at a rate above minimum wage. The
median amount of time taken to complete the study was 46 minutes, making the pay rate
approximately 13 dollars per hour. After examining several studies that are published on
StudyResponse, it appears that studies run approximately 10-20 minutes in length
(Burnfield & Rogelberg, 2003; Van Ryzin, 2003). However, this rate of pay may not
have seemed adequate for the perceived amount of tediousness involved in answering
the items. Even though participants were informed that the study would likely take an
hour to complete, this sample might not be used to partaking in studies this long, leading
to fatigue and decreased motivation. The format of the CRT items may also have been
perceived as cumbersome compared to other surveys in which they have participated
which typically ask short questions that require little effort to read and understand.
Lastly, due to the relative anonymity of using a computer and/or lack of engagement in
the study, participants may have believed that there would be relatively little risk in
determining whether or not their responses were legitimate and not random. Participants
were warned in the information sheets that they would not be compensated if it was
found that they responded randomly; however, this threat may have been disregarded. It
would have been more helpful to include items about participants’ motivation to engage
in the study and specific information related to their attitudes toward the CRTs. The
relatively high rate of endorsement of illogical responding may be evidence of lack of
test taker motivation and random responding.
127
The current study utilized the “fake good” paradigm often seen in the faking
literature (Hough et al., 1990; LeBreton et al., 2007). However, future research would
benefit from measuring social desirability directly. As mentioned previously in the
paper, faking can be operationalized as social desirability or impression management
(Ones et al., 1996; Paulhus, 2002). Including a social desirability scale in the next
administration of the CRTs would provide an alternative way to test whether or not test
takers can fake the CRT. Measuring social desirability would also allow for the
investigation of the impact of corrections for faking on CRTs, an avenue of research that
has not been explored.
It would also be interesting to investigate the impact of different scoring
algorithms on the validity and fakeability of CRTs. Currently, CRTs are scored such
that each item is worth -1, 0 or +1. Each item score is then summed to arrive at the final
scale score; higher positive scores theoretically indicate that the test taker possesses
more of the intended construct and larger negative scores theoretically indicate that the
test taker possesses more of the trait on the opposite of the intended construct. It is
unclear what exactly a score of zero across all items means, however. A score of zero
may mean that the test taker chose all illogical options or that they score midway
between opposite poles of the construct of interest. The current scoring methodology
conceptualizes the construct of interest in a dichotomous way, but different scoring
methodologies could use justification mechanisms to place the test taker on a continuum.
Similar to the outcomes of research on biodata and situational judgment tests (SJTs),
128
different scoring methodologies may impact the validity of CRTs (Bergman et al., 2006).
Therefore, future research should examine the impact of differences in scoring.
Another limitation of this study is that the reliabilities for each of the CRTs were
low even compared to reported alphas from other studies. The range of alphas for the
CRTs was -.04 to .30. As mentioned previously, CRTs, as evidenced by Cronbach’s
alpha, are typically low and it is likely that other types of reliability are more appropriate
(James, 1998; Le Breton et al., 2007). Published alphas for the Aggression CRT have
been above the .70 cutoff typically used during the test development stage (LeBreton et
al., 2007). This might have contributed to lack of support for the hypotheses.
Conclusions
This study adds to the understanding of CRTs in a variety of ways. First, this
study examined whether the methodology of conditional reasoning that had only been
previously used for measures of Aggression and Achievement Motivation could be
applied to other personality traits such as Agreeableness and Extraversion. This study
also tested the claim that CRTs are resistant to faking (as long as the purpose of the test
is obscured). The findings from this study indicate that traditional, self-report
personality tests are more valid at predicting relevant outcomes and that there are no
differences between CRTs or traditional tests for Agreeableness and Extraversion when
it comes to participant faking. Although the conditional reasoning format provides a
new and exciting method of assessment, based on these results its utility as a practical
predictor likely should be tempered due to the amount of resources required to develop

129
and administer such tests. At least for the CRT-A and the CRT-E, the meager ends do
not justify the means.
130
REFERENCES
Ahadi, S. A., & Rothbart, M. K. (1994). Temperament, development, and the Big Five.
(pp. 189-207). Hillsdale, NJ: Lawrence Erlbaum Associates, Inc.
Allport, G. W. (1937). Personality: A psychological interpretation. Oxford, England:
Holt.
Allport, G. W. (1924). The study of the undivided personality. The Journal of Abnormal
Psychology and Social Psychology, 19, 132-141. doi: 10.1037/h0064744
Allport, G. W. (1921). Personality and character. Psychological Bulletin, 18, 441-455.
doi: 10.1037/h0066265
Allport, F. H., & Allport, G. W. (1921). Personality traits: Their classification and
measurement. The Journal of Abnormal Psychology and Social Psychology, 16,
6-40. doi: 10.1037/h0069790
Arthur, W. Jr., & Glaze, R. M. (2011). Cheating and response distortion on remotely
delivered assessments. In N. T. Tippins & S. Adler (Eds.), Technology-enhanced
assessment of talent (pp. 99-152). San Francisco, CA: Jossey-Bass.
Arthur, W., Jr., Woehr, D. J., & Graziano, W. G. (2001). Personality testing in
employment settings: Problems and issues in the application of typical selection
practices. Personnel Review, 30, 657-676. doi:10.1108/eum0000000005978
Bandura A. 1986. Social foundations of thought and action: A social-cognitive view.
Englewood Cliffs, NJ: Prentice-Hall.
Barger, P. B. & Sinar, E. F. (2011, April). Psychological data from Amazon.com’s
MTurk: Rapid and inexpensive—But high-quality? Poster presented at the 26th

131
Annual Conference for the Society for Industrial and Organizational Psychology,
Chicago, IL.
Barrick, M. R., & Mount, M. K. (2005). Yes, personality matters: Moving on to more
important matters. Human Performance, 18, 359-372.
doi:10.1207/s15327043hup1804_3
Barrick, M. R., & Mount, M. K. (1991). The Big Five personality dimensions and job
performance: A meta-analysis. Personnel Psychology, 44, 1-26.
doi:10.1111/j.1744-6570.1991.tb00688.x
Barrick, M. R., Mount, M. K., & Judge, T. A. (2001). Personality and performance at the
beginning of the new millennium: What do we know and where do we go next?
International Journal of Selection and Assessment, 9, 9-30. doi:10.1111/1468-
2389.00160
Behrend, T. S., Sharek, D. J., Meade, A. W. & Wiebe, E. N. (2011). The viability of
crowdsourcing for survey research. Behavior Research Methods, 43, 1–14. doi:
10.3758/s13428-011-0081-0
Bell, J. L., DeVidi, D., & Solomon, G. (2001). Logical options: An introduction to
classical and alternative logics. Peterborough, Ontario: Broadview.
Bergman, M. E., Drasgow, F., Donovan, M. A., Henning, J. B., & Juraska, S. E. (2006).
Scoring situational judgment tests: Once you get the data, your troubles begin.
International Journal of Selection and Assessment, 14, 223-235. doi:
10.1111/j.1468-2389.2006.00345.x

132
Berry, C. M., Gruys, M. L., & Sackett, P. R. (2006). Education attainment as a proxy for
cognitive ability in selection: Effects on levels of cognitive ability and adverse
impact. Journal of Applied Psychology, 91, 696-705. doi: 10.1037/e518632013-448
Berry, C. M., Sackett, P. R., & Tobares, V. (2010). A meta-analysis of conditional
reasoning tests of aggression. Personnel Psychology, 63, 361- 384. doi:
10.1111/j.1744-6570.2010.01173.x
Birkeland, S. A., Manson, T. M., Kisamore, J. L., Brannick, M. T., & Smith, M. A.
(2006). A meta-analytic investigation of job applicant faking on personality
measures. International Journal of Selection and Assessment, 14, 317-335. doi:
10.1111/j.1468-2389.2006.00354.x
Bono, J.E., & Judge, T.A. (2004). Personality and transformational and transactional
leadership: A meta-analysis. Journal of Applied Psychology, 89, 901-910.
doi:10.1037/0021-9010.89.5.901
Bornstein, R. F. (2002). A process dissociation approach to objective-projective test
score interrelationships. Journal of Personality Assessment, 78, 47-68. doi:
10.1207/s15327752jpa7801_04
Boyle, G. J., Matthews, G., & Saklofske, D. H. (2008). Personality theories and models:
An overview. In G. J. Boyle, G. Matthews, & D. H. Saklofske (Eds.), The SAGE
handbook of personality theory and assessment (Vol. 1, pp. 1-29). Thousand
Oaks, CA: SAGE.
133
Buhrmester, M., Kwang, T., & Gosling, S. D. (2011). Amazon’s Mechanical Turk: A
new source of inexpensive, yet high-quality, data? Perspectives on Psychological
Science, 6, 3–5. doi: 10.1177/1745691610393980
Burnfield, J. L., & Rogelberg, S. G. (2003). An international study of meetings with
Study Response panelists: Sampling from multiple recruitment sources. (Tech.
Rep. No. 13004). Syracuse, NY: Syracuse University, School of Information
Studies.
Burns, G. N., & Christiansen, N. D. (2006). Sensitive or senseless: On the use of social
desirability measures in selection and assessment. In R. L. Griffith & M. H.
Peterson (Eds.), A closer examination of applicant faking behavior (pp. 115-150).
Greenwich, CT: Information Age.
Campbell, J. B. (2008). Modern personality theories: What have we gained? What have
we lost? In G. J. Boyle, G. Matthews, & D. H. Saklofske (Eds.), The SAGE
handbook of personality theory and assessment (Vol. 1, pp. 190-212). Thousand
Oaks, CA: SAGE.
Campbell, D. T., & Fiske, D. W. (1959). Convergent and discriminant validation by the
multitrait-multimethod matrix. Psychological Bulletin, 56, 81-105. doi:
10.1037/h0046016
Cascio, W. F. (1975). Accuracy of verifiable biographical information blank responses.
Journal of Applied Psychology, 60, 767-769. doi: 10.1037/0021-9010.60.6.767
Cervone, D. (2008). Explanatory models of personality: Social cognitive theories and the
knowledge-and-appraisal model of personality architecture. In G. J. Boyle, G.
134
Matthews, & D. H. Saklofske (Eds.), The SAGE handbook of personality theory
and assessment (Vol. 1, pp. 80-100). Thousand Oaks, CA: SAGE.
Cervone, D., Shadel, W. G., & Jencius, S. (2001). Social-cognitive theory of personality
assessment. Personality and Social Psychology Review, 5, 33-51. doi:
10.1207/S15327957PSPR0501_3
Cervone, D., & Shoda, Y. (1999). Beyond traits in the study of personality coherence.
Current Directions in Psychological Science, 8, 27-32. doi: 10.1111/1467-
8721.00007
Chan, D., Schmitt, N., DeShon, R. P., Clause, C. S., & Delbridge, K. (1997). Reactions
to cognitive ability tests: The relationships between race, test performance, face
validity perceptions, and test-taking motivation. Journal of Applied Psychology,
82, 300-310. doi: 10.1037/0021-9010.82.2.300
Church, A. T., & Lonner, W. J. (1998). The cross-cultural perspective in the study of
psychology: Rationale and current research. Journal of Cross-Cultural
Psychology, 29, 32-62. doi: 10.1177/0022022198291003
Clary, E. G., Snyder, M., Ridge, R. D., Copeland, J., Stukas, A. A., Haugen, J., &
Miene, P. (1998). Understanding and assessing the motivations of volunteers: a
functional approach. Journal of Personality and Social Psychology, 74, 1516-
1530. doi: 10.1037/0022-3514.74.6.1516
Cohen, J. (1992). A power primer. Psychological Bulletin, 112, 155-159. doi:
10.1037/0033-2909.112.1.155
135
Cronbach, L. J., & Hartmann, W. (1954). A note on negative reliabilities. Educational
and Psychological Measurement, 14, 342-346. doi:
10.1177/001316445401400213
Crowne, D. P., & Marlowe, D. (1960). A new scale of social desirability independent of
psychopathology. Journal of Consulting Psychology, 24, 349-354. doi:
10.1037/h0047358
Deal, J. E, Halverson, C. F., Jr., Havill, V., & Martin, R. P. (2005). Temperament factors
as longitudinal predictors of young adult personality. Merrill-Palmer Quarterly,
51, 315-334.
Dean, M. A., Conte, J. M., & Blankenhorn, T. R. (2006). Examination of the predictive
validity of big five personality dimensions across training performance criteria.
Personality and Individual Differences, 41, 1229-1239.
doi:10.1016/j.paid.2006.04.020
Digman, J. M. (1990). Personality structure: Emergence of the five-factor model. Annual
Review of Psychology, 41, 417-440. doi: 10.1146/annurev.ps.41.020190.002221
Donnellan, M. B., & Lucas, R. E. (2008). Age differences in the Big Five across the life
span: Evidence from two national samples. Psychology and Aging, 23, 558.
doi: 10.1037/a0012897
Dunning, D., Heath, C. & Suls, J.M. (2004). Flawed self-assessment: Implications for
health, education, and the workplace. Psychological Science in the Public
Interest, 5, 69-106. doi:10.1111/j.1529-1006.2004.00018.x
136
Dwight, S. A., & Donovan, J. J. (2003). Do warnings not to fake reduce faking? Human
Performance, 16, 1-23. doi: 10.1207/s15327043hup1601_1
Eaton, L. G., & Funder, D. C. (2003). The creation and consequences of the social
world: An interactional analysis of extraversion. European Journal of
Personality, 17, 375-395. doi: 10.1002/per.477
Edwards, A. L. (1957). Social desirability and probability of endorsement of items in the
interpersonal check list. The Journal of Abnormal and Social Psychology, 55,
394-396. doi: 10.1037/h0048497
Edwards, J. R. (1993). Problems with the use of profile similarity indices in the study of
congruence in organizational research. Personnel Psychology, 46, 641-665. doi:
10.1111/j.1744-6570.1993.tb00889.x
Edwards, J. R., & Parry, M. E. (1993). On the use of polynomial regression equations as
an alternative to difference scores in organizational research. Academy of
Management Journal, 36, 1577-1613. doi: 10.2307/256822
Ellingson, J. E., Sackett, P. R., & Hough, L. M. (1999). Social desirability corrections in
personality measurement: Issues of applicant comparison and construct validity.
Journal of Applied Psychology, 84, 155-166. doi:10.1037//0021-9010.84.2.155
Epstein, S. (1994). Integration of the cognitive and psychodynamic unconscious.
American Psychologist, 49, 709-724. doi:10.1037//0003-066X.49.8.709
Erdheim, J., Wang, M., & Zickar, M. J. (2006). Linking the big five personality
constructs to organizational commitment. Personality and Individual
Differences, 41, 959-970. doi:10.1016/j.paid.2006.04.005
137
Eysenck, H. J. (1967). The biological basis of personality. Springfield, IL: Thomas.
Faul, F., Erdfelder, E., Lang, A.-G., & Buchner, A. (2007). G*Power 3: A flexible
statistical power analysis program for the social, behavioral, and biomedical
sciences. Behavior Research Methods, 39, 175-191. doi: 10.3758/bf0319314
Festinger, L. (1957). A theory of cognitive dissonance. Evanston, IL: Row, Peterson, and
Co.
Festinger, L. & Carlsmith, J. M. (1959). Cognitive consequences of forced compliance.
Journal of Abnormal and Social Psychology, 58, 203-210.
doi:10.1037/h0041593
Furnham, A. (1997). Knowing and faking one’s five-factor personality score. Journal of
Personality Assessment, 69, 229-243. doi: 10.1207/s15327752jpa6901_14
Glaze, R. M. (2012). The efficacy of profile matching as a means of controlling for the
effects of response distortion on personality measures. Retrieved from ProQuest
Dissertations and Theses. (Order No. 3537073)
Goffin, R. D., & Christiansen, N. D. (2003). Correcting personality tests for faking: A
review of popular personality tests and an initial survey of researchers.
International Journal of Selection and Assessment, 11, 340-344.
doi:10.1111/j.0965-075X.2003.00256.x
Goldberg, L. R. (1992). The development of markers for the Big-Five factor structure.
Psychological Assessment, 4, 26-42. doi:10.1037/1040-3590.4.1.26
Goldberg, L. R. (1999). A broad-bandwidth, public domain, personality inventory
measuring the lower-level facets of several five-factor models. In I. Mervielde, I.

138
Deary, F. De Fruyt, & F. Ostendorf (Eds.), Personality psychology in Europe,
(Vol. 7, pp. 7-28). Tilburg, The Netherlands: Tilburg University Press.
Gouldner, A. (1960). The norm of reciprocity: a preliminary statement. American
Sociological Review, 25, 161-178. doi:10.2307/2092623
Graham, M. A., Monday, J., O'Brien, K., & Steffen, S. (1994). Cheating at small
colleges: An examination of student and faculty attitudes and behaviors. Journal
of College Student Development, 35, 255-260.
Gray, J. A. (1970). The psychophysiological basis of introversion-extraversion.
Behaviour Research and Therapy, 8, 249-266. doi: 10.1016/0005-
7967(70)90069-0
Graziano, W. G., Habashi, M. M., Sheese, B. E., & Tobin, R. M. (2007). Agreeableness,
empathy, and helping: A person-situation perspective. Journal of Personality and
Social Psychology, 93, 583-599. doi: 10.1037/0022-3514.93.4.583
Graziano, W. G., Jensen-Campbell, L. A., Hair, E. C. (1996). Perceiving interpersonal
conflict and reacting to it: The case for agreeableness. Journal of Personality and
Social Psychology, 70, 820-835. doi: 10.1037/0022-3514.70.4.820
Graziano, W. G., & Tobin, R. M. (2009). Agreeableness. New York, NY: Guilford
Press.
Graziano, W. G., & Tobin, R. M. (2002). Agreeableness: Dimension of personality or
social desirability artifact? Journal of Personality, 70, 695-727. doi:
10.1111/1467-6494.05021
139
Greenwald, A. G., & Banaji, M. R. (1995). Implicit social cognition: Attitudes, self-
esteem, and stereotypes. Psychological Review, 102, 4-27. doi: 10.1037/0033-
295x.102.1.4
Griffith, R. (1998). Faking of noncognitive selection devices: Red herring is hard to
swallow. Dissertation Abstracts International: Section B: The Sciences and
Engineering, 5681.
Griffith, R. L., Chmielowski, T., & Yoshita, Y. (2007). Do applicants fake? An
examination of the frequency of applicant faking behavior. Personnel Review,
36, 341-355. doi: 10.1108/00483480710731310
Gross, J. J., Sutton, S. K., & Ketelaar, T. (1998). Relations between affect and
personality: Support for the affect-level and affective reactivity views.
Personality and Social Psychology Bulletin, 24, 279-288. doi:
10.1177/0146167298243005
Guilford, J. S., Zimmerman, W. S., & Guilford, J. P. (1976). The Guilford-Zimmerman
Temperament Survey handbook: Twenty-five years of research and application.
San Diego, CA: EDITS.
Haaland, S., & Christiansen, N. D. (2002). Implications of trait-activation theory for
evaluating the construct validity of assessment center ratings. Personnel
Psychology, 55, 137-163. doi: 10.1111/j.1744-6570.2002.tb00106.x
Hogan, R. (2005). In defense of personality measurement: New wine for old whiners.
Human Performance, 18, 331-341. doi:10.1207/s15327043hup1804_1
140
Hofstee, W.K.B., Kiers, A.L., De Raad, B., Goldberg, L.R., & Ostendorf, F. (1997).
Comparison of Big-Five structures of personality traits in Dutch, English, and
German. European Journal of Personality, 11, 15-31. doi: 10.1002/sici1099-
0984(199703)11:1<15::aid-per273>3.0.co;2-8
Hogan, J.B. (1994) Empirical keying of background data measures. In G.S. Stokes, M.D.
Mumford and W.A. Owens (Eds), Biodata handbook: Theory, research, and use
of biographical information in selection and performance prediction (pp. 69–
107). Palo Alto: Consulting Psychologists Press.
Hogan, J., & Holland, B. (2003). Using theory to evaluate personality and job-
performance relations: A socioanalytic perspective. Journal of Applied
Psychology, 88, 100-112. doi:10.1037/0021-9010.88.1.100
Holden, R. R. (1998). Detecting fakers on a personnel test: Response latencies versus a
standard validity scale. Journal of Social Behavior and Personality, 13, 387-398.
Holden, R. R., Fekken, G. C., & Cotton, D. H. (1991). Assessing psychopathology using
structured test-item response latencies. Psychological Assessment: A Journal of
Consulting and Clinical Psychology, 3, 111-118. doi: 10.1037/1040-
3590.3.1.111
Hooper, A. C., Cullen, M. J., & Sackett, P. R. (2006). Operational threats to the use of
SJTs: Faking, coaching, and retesting issues. Situational judgment tests: Theory,
measurement, and application. (pp. 205-232). Mahwah, NJ: Lawrence Erlbaum
Associates Publishers.
141
Hough, L. M. (1998). Effects of intentional distortion in personality measurement and
evaluation of suggested palliatives. Human Performance, 11, 209-244. doi:
10.1080/08959285.1998.9668032
Hough, L. M., Eaton, N. K., Dunnette, M. D., Kamp, J. D., & McCloy, R. A. (1990).
Criterion-related validities of personality constructs and the effect of response
distortion on those validities. Journal of Applied Psychology, 75, 581-595.
doi:10.1037//0021-9010.75.5.581
Hough, L. M., & Furnham, A. (2003). Use of personality variables in work settings. In
W. C. Borman, D. R. Ilgen & R. J. Klimoski (Eds.), Handbook of psychology:
Industrial and organizational psychology (Vol. 12, pp. 131-169). Hoboken, NJ:
John Wiley & Sons Inc.
Hough, L. M., & Oswald, F. L. (2008). Personality testing and industrial-organizational
psychology: Reflections, progress, and prospects. Industrial and Organizational
Psychology: Perspectives on Science and Practice, 1, 272-290. doi:
10.1111/j.1754-9434.2008.00048.x
Hough, L. M., Oswald, F. L., & Ployhart, R. E. (2001). Determinants, detection and
amelioration of adverse impact in personnel selection procedures: Issues,
evidence and lessons learned. International Journal of Selection and Assessment,
9, 152-194. doi: 10.1111/1468-2389.00171
Humm, D. G., & Wadsworth, G. W. (1934). The Humm-Wadsworth temperament scale.
Personnel Journal, 12, 314-323. doi:10.1037/h0053963
142
Hurley, Patrick J. (2008). A concise introduction to logic (10th
ed.). Belmont, CA:
Thomson/Wadsworth.
Hurtz, G. M., & Donovan, J. J. (2000). Personality and job performance: The Big Five
revisited. Journal of Applied Psychology, 85, 869. doi: 10.1037/0021-
9010.85.6.869
Jackson, D. N., Ashton, M. C., & Tomes, J. L. (1996). The six-factor model of
personality: Facets from the Big Five. Personality and Individual Differences,
21, 391-402. doi:10.1016/0191-8869(96)00046-3
James, L. R. (1998). Measurement of personality via conditional reasoning.
Organizational Research Methods, 1, 131-163. doi:10.1177/109442819812001
James, L. R., & LeBreton, J. M. (2012). Assessing the implicit personality through
conditional reasoning. Washington, DC, US: American Psychological
Association.
James, L. R., & Mazerolle, M. D. (2003). Personality in work organizations. Thousand
Oaks, CA: SAGE.
James, L. R., McIntyre, M. D., Glisson, C. A., Green, P. D., Patton, T. W., LeBreton, J.
M., … Williams, L. J. (2005). A conditional reasoning measure for aggression.
Organizational Research Methods, 8, 69-99. doi:10.1177/1094428104272182
Jensen-Campbell, L., & Graziano, W. G. (2001). Agreeableness as a moderator of
interpersonal conflict. Journal of Personality, 69, 323-362. doi: 10.1111/1467-
6494.00148
143
Judge, T.A., Heller, D., & Mount, M.K. (2002). Five-factor model of personality and job
satisfaction: A meta-analysis. Journal of Applied Psychology, 87, 530-541.
doi:10.1037/0021-9010.87.3.530
Judge T.A., Rodell J.B., Klinger R.L., Simon L.S., Crawford E.R. (2013). Hierarchical
representations of the five-factor model of personality in predicting job
performance: Integrating three organizing frameworks with two theoretical
perspectives. Journal of Applied Psychology, 98, 875–925. doi:
10.1037/a0033901
Kline, T. J. (1999). The team player inventory: Reliability and validity of a measure of
predisposition toward organizational team-working environments. Journal for
Specialists in Group Work, 24, 102-112. doi: 10.1080/1933929908411422
Kluger, A. N., & Colella, A. (1993). Beyond the mean bias: The effect of warning
against faking on biodata item variances. Personnel Psychology, 46, 763-780.
doi:10.1111/j.1744-6570.1993.tb01568.x
Kluger, A. N., Reilly, R. R., & Russell, C. J. (1991). Faking biodata tests: Are option-
keyed instruments more resistant? Journal of Applied Psychology, 76, 889-896.
doi: 10.1037/0021-9010.76.6.889
LeBreton, J. M., Barksdale, C. D., Robin, J., & James, L. R. (2007). Measurement issues
associated with conditional reasoning tests: Indirect measurement and test faking.
Journal of Applied Psychology, 92, 1-16. doi:10.1037/0021-9010.92.1.1
144
Levashina, J., & Campion, M. A. (2006). A model of faking likelihood in the
employment interview. International Journal of Selection and Assessment, 14,
299-316. doi: 10.1111/j.1468-2389.2006.00353.x
Martin, R. P., Wisenbaker, J., & Huttunen, M. (1994). Review of factor analytic studies
of temperament measures based on the Thomas-Chess structural model:
Implications for the Big Five. In C. F. Halverson, G. A. Kohnstamm, & R. P.
Martin (Eds.), The developing structure of temperament and personality from
infancy to adulthood (pp. 157–172). Hillsdale, NJ: Erlbaum.
Matthews, G., & Gilliland, K. (1999). The personality theories of H. J. Eysenck and J. A.
Gray: A comparative review. Personality and Individual Differences, 26, 583-
626. doi: 10.1016/S0191-8869(98)00158-5
Maxwell, S. E., & Delaney, H. D. (2004). Designing experiments and analyzing data: A
model comparison perspective (2nd ed.). Mahwah, NJ: Lawrence Erlbaum
Associates Publishers.
McCarthy, J. M., Van Iddekinge, C. H., & Campion, M. A. (2010). Are highly structured
job interviews resistant to demographic similarity effects? Personnel Psychology,
63, 325-359. doi: 10.1111/j.1744-6570.2010.01172.x
McClelland, D. C., Koestner, R., & Weinberger, J. (1989). How do self-attributed and
implicit motives differ? Psychological Review, 96, 690-702. doi: 10.1037/0033-
295x.96.4.690
McCrae, R. R., & Costa, P. T. (1999). A five-factor theory of personality. New York,
NY: Guilford Press.
145
McCrae, R. R., & Costa, P. T. (1987). Validation of the five-factor model of personality
across instruments and observers. Journal of Personality and Social Psychology,
52, 81-90. doi: 10.1037/0022-3514.52.1.81
McCrae, R. R., Costa, P. T., de Lima, M. P., Simões, A., Ostendorf, F., Angleitner, A., .
. . Piedmont, R. L. (1999). Age differences in personality across the adult life
span: Parallels in five cultures. Developmental Psychology, 35, 466-477. doi:
10.1037/0012-1649.35.2.466
McDaniel, M. A. (1990). Lying takes time: Predicting deception in biodata using
response latencies. Paper presented at the 98th Annual Convention of the
American Psychological Association, Boston, MA.
McFarland, L. A., & Ryan, A. M. (2000). Variance in faking across noncognitive
measures. Journal of Applied Psychology, 85, 812-821. doi: 10.1037/0021-
9010.85.5.812
McHenry, J. J., Hough, L. M., Toquam, J. L., & Hanson, M. A., Ashworth, S. (1990).
Project A validity results: The relationship between predictor and criterion
domains. Personnel Psychology. Special Issue: Project A: The US Army
Selection and Classification Project, 43, 335-354. doi:10.1111/j.1744-
6570.1990.tb01562.x
146
McManus, M. A. (1990). Detection of faking on an empirically keyed biodata
instrument. Paper presented at the Fifth Annual Conference of the Society for
Industrial/Organizational Psychology, Miami, FL.
Meade, A. W. (2004). Psychometric problems and issues involved with creating and
using ipsative measures for selection. Journal of Occupational and
Organizational Psychology, 77, 531-552. doi: 10.1348/0963179042596504
Meehl, P. E., & Hathaway, S. R. (1946). The K factor as a suppressor variable in the
Minnesota Multiphasic Personality Inventory. Journal of Applied Psychology,
30, 525-564. doi: 10.1037/h0053634
Mehrabian, A., & Epstein, N. (1972). A measure of emotional empathy. Journal of
Personality, 40, 525-543. doi: 10.111/j.1467-6494.1972.tb00078.x
Mierke, J., & Klauer, K. C. (2003). Method-specific variance in the Implicit Association
Test. Journal of Personality and Social Psychology, 85, 1180-1192.
doi:10.1037/0022-3514.85.6.1180
Mischel, W. (1972). Direct versus indirect personality assessment: Evidence and
implications. Journal of Consulting and Clinical Psychology, 38, 319-324. doi:
10.1037/h0032896
Mischel, W. (1969). Continuity and change in personality. American Psychologist, 24,
1012-1018. doi: 10.1037/h0028886
Mischel, W., & Shoda, Y. (1995). A cognitive-affective system theory of personality:
Reconceptualizing situations, dispositions, dynamics, and invariance in
147
personality structure. Psychological Review, 102, 246-268. doi:10.1037//0033-
295X.102.2.246
Mischel, W., Shoda, Y., & Mendoza-Denton, R. (2002). Situation-behavior profiles as a
locus of consistency in personality. Current Directions in Psychological Science,
11, 50-54. doi:10.1111/1467-8721.00166
Mount, M. K., Barrick, M. R., & Strauss, J. P. (1994). Validity of observer ratings of the
big five personality factors. Journal of Applied Psychology, 79, 272-280. doi:
10.1037/0021-9010.79.2.272
Mount, M., Ilies, R., & Johnson, E. (2006). Relationship of personality traits and
counterproductive work behaviors: The mediating effects of job satisfaction.
Personnel Psychology, 59, 591-622. doi:10.1111/j.1744-6570.2006.00048.x
Mount, M. K., Witt, L. A., & Barrick, M. R. (2000). Incremental validity of empirically
keyed biodata scales over GMA and the five factor personality constructs.
Personnel Psychology, 53, 299-323. doi: 10.1111/j.1744-6570.2000.tb00203.x
Mumford, M.D. and Owens, W.A. (1987) Methodology review: Principles, procedures,
and findings in the application of background data measures. Applied
Psychological Measurement, 11, 1–31. doi: 10.1177/014662168701100101
Newstead, S. E., Franklyn-Stokes, A., & Armstead, P. (1996). Individual differences in
student cheating. Journal of Educational Psychology, 88, 229-241. doi:
10.1037/0022-0663.88.2.229
148
Nguyen, N.T., Biderman, M.D., & McDaniel, M.A. (2005). Effects of response
instructions on faking a situational judgment test. International Journal of
Selection and Assessment, 13, 250-260. doi: 10.1111/j.1468-2389.2005.00322.x
Nicholson, R. A., & Hogan, R. (1990). The construct validity of social desirability.
American Psychologist, 45, 290-292. doi: 10.1037/0003-066X.45.2.290
Nunnally, J. C. (1978). Psychometric theory (2nd
ed.). New York: McGraw-Hill.
Oh, I., & Berry, C. M. (2009). The five-factor model of personality and managerial
performance: Validity gains through the use of 360 degree performance ratings.
Journal of Applied Psychology, 94, 1498-1513. doi:10.1037/a0017221
Ones, D. S., Dilchert, S., Viswesvaran, C., & Judge, T. A. (2007). In support of
personality assessment in organizational settings. Personnel Psychology, 60, 995-
1027. doi:10.1111/j.1744-6570.2007.00099.x
Ones, D. S., & Viswesvaran, C. (1998). The effects of social desirability and faking on
personality and integrity assessment for personnel selection. Human
Performance, 11, 245-269. doi: 10.1207/s15327043hup1102&3_7
Ones, D. S., Viswesvaran, C., & Dilchert, S. (2005). Personality at work: Raising
awareness and correcting misconceptions. Human Performance, 18, 389-404.
doi:10.1207/s15327043hup1804_5
Ones, D. S., Viswesvaran, C., & Reiss, A. D. (1996). The role of social desirability in
personality testing: The red herring. Journal of Applied Psychology, 81, 660-679.
doi:10.1037//0021-9010.81.6.660
149
Ozer, D. J., & Reise, S. P. (1994). Personality assessment. Annual Review of Psychology,
45, 357-388. doi: 10.1146/annurev.ps.45.020194.002041
Paolacci, G., Chandler, J., & Ipeirotis, P. G. (2010). Running experiments on Amazon
Mechanical Turk. Judgment and Decision Making, 5, 411–419.
Parry, M. H. (1972). Infants’ responses to novelty in familiar and unfamiliar settings.
Child Development, 43, 233-237. doi:10.2307/1127886
Paulhus, D. L. (2002). Socially desirable responding: The evolution of a construct. In H.
I. Brown, D. N. Jackson, & D. E. Wiley (Eds.). The role of constructs in
psychological and educational measurement (pp. 49-69). Mahwah, NJ: Lawrence
Erlbaum.
Paulhus, D. L. (1991). Measurement and control of response bias. San Diego, CA:
Academic Press.
Paulhus, D. L. (1984). Two-component models of socially desirable responding. Journal
of Personality and Social Psychology, 46, 598-609. doi:10.1037//0022-
3514.46.3.598
Paulhus, D. L., & John, O. P. (1998). Egoistic and moralistic biases in self-perception:
The interplay of self-deceptive styles with basic traits and motives. Journal of
Psychology, 66, 1025-1059. doi:10.1111/1467-6494.00041
Ployhart, R. E., & Holtz, B. C. (2008). The diversity-validity dilemma: Strategies for
reducing racioethnic and sex subgroup differences and adverse impact in
selection. Personnel Psychology, 61, 153-172. doi:10.1111/j.1744-
6570.2008.00109.x
150
Psychological Assessment Resources, Inc. (2000). NEO PI-R interpretive report
(Version 1.02). Lutz, FL: PAR.
Ramsay, L. J., Schmitt, N., Oswald, F. L., Kim, B. H., & Gillespie, M. A. (2006). The
impact of situational context variables on responses to biodata and situational
judgment inventory items. Psychology Science, 48, 268-287.
Robinson, M. D., & Neighbors, C. (2006). Catching the mind in action: Implicit methods
in personality research and assessment. Washington, DC: American
Psychological Association.
Rosse, G. J., Stecher, M. D., Miller, J. L., & Levin, R. A. (1998). The impact of response
distortion on preemployment personality testing and hiring decisions. Journal of
Applied Psychology, 83, 634-644. doi:10.1037//0021-9010.83.4.634
Rothbart, M., Ahadi, S., Hershey, K., & Fisher, P. (2001). Investigations of temperament
at three to seven years: The Children's Behavior Questionnaire. Child
Development, 72, 1394–1408. doi:10.1111/1467-8624.00355
Salgado, J. (2002). The Big Five personality dimensions and counterproductive
behaviors. International Journal of Selection and Assessment. Special Issue:
Counterproductive Behaviors at Work, 10, 117-125. doi:10.1111/1468-
2389.00198
Schmidt, F. L., & Hunter, J. E. (1998). The validity and utility of selection methods in
personnel psychology: Practical and theoretical implications of 85 years of
research findings. Psychological Bulletin, 124, 262-274. doi:10.1037//0033-
2909.124.2.262
151
Schmitt, N., Oswald, F. L., Kim, B. H., Gillespie, M. A., Ramsay, L. J., & Yoo, T.
(2003). Impact of elaboration on socially desirable responding and the validity of
biodata measures. Journal of Applied Psychology, 88, 979-988.
doi:10.1037/0021-9010.88.6.979
Schmukle, S. C., & Egloff, B. (2005). A latent state-trait analysis of implicit and explicit
personality measures. European Journal of Psychological Assessment, 21, 100-
107. doi: 10.1027/1015-5759.21.2.100
Smither, J. W., Reilly, R. R., Millsap, R. E., Pearlman, K., & Stoffey, R. W. (1993).
Applicant reactions to selection procedures. Personnel Psychology, 46, 49-76.
doi: 10.111/j.1744-6570.1993.tb00867.x
Snell, A. F., Sydell, E. J., & Lueke, S. B. (1999). Towards a theory of applicant faking:
Integrating studies of deception. Human Resource Management Review, 9, 219-
242. doi: 10.1016/S1053-4822(99)00019-4
Snyder, M. (1974). Self-monitoring of expressive behavior. Journal of Personality and
Social Psychology, 30, 526-537. doi: 10.1037/h0037039
Spector, P. E., & Jex, S. M. (1998). Development of four self-report measures of job
stressors and strain: Interpersonal conflict at work scale, organizational constraints
scale, quantitative workload inventory, and physical symptoms inventory. Journal
of Occupational Health Psychology, 3, 356-367. doi: 10.1037/1076-8998.3.4.356
152
Stark, S., Chernyshenko, O. S., Chan, K., Lee, W. C., & Drasgow, F. (2001). Effects of
the testing situation on item responding: Cause for concern. Journal of Applied
Psychology, 86, 943-953. doi: 10.1037/0021-9010.86.5.943
Tellegen, A., & Waller, N. G. (2008). Exploring Personality Through Test Construction:
Development of the Multidimensional Personality Questionnaire. The SAGE
handbook of personality theory and assessment (Vol. 1, 261-292). Thousand
Oaks, CA: SAGE.
Tett, R. P., & Christiansen, N. D. (2007). Personality tests at the crossroads: A response
to Morgeson, Campion, Dipboye, Hollenbeck, Murphy, and Schmitt (2007).
Personnel Psychology, 60, 967-993. doi:10.1111/j.1744-6570.2007.00098.x
Tett, R. P., Freund, K. A., Christiansen, N. D., Fox, K. E., & Coaster, J. (2012). Faking
on self-report emotional intelligence and personality tests: Effects of faking
opportunity, cognitive ability, and job type. Personality and Individual
Differences, 52, 195-201. doi: 10.1046/j.paid.2011.10.017
Tett, R. P., Jackson, D. N., & Rothstein, M. (1991). Personality measures as predictors
of job performance: A meta-analytic review. Personnel Psychology, 44, 703.
doi: 10.1111/j.17446570.1991.tb00696.x
Thorndike, E. L. (1927). The law of effect. The American Journal of Psychology, 39,
212-222. doi:10.2307/1415413
Tippins, N. T., Beaty, J., Drasgow, F., Gibson, W. M., Pearlman, K., Segall, D. O., &
Shepherd, W. (2006). Unproctored internet testing in employment settings.
Personnel Psychology, 59, 189-225. doi: 10.1111/j.1744-6570.2006.00909.x
153
Uziel, L. (2006). The extraverted and the neurotic glasses are of different colors.
Personality and Individual Differences, 41, 745-754. doi:
10.1016/j.paid.2006.03.011
Van den Berg, P. T., & Feij, J. A. (2003). Complex relationships among personality
traits, job characteristics, and work behaviors. International Journal of Selection
and Assessment, 11, 326-339. doi:10.1111/j.0965-075X.2003.00255.x
Van Iddekinge, C. H., Ferris, G. R., & Heffner, T. S. (2009). Test of a multistage model
of distal and proximal antecedents of leader performance. Personnel Psychology,
62, 463-495. doi:10.1111/j.1744-6570.2009.01145.x
Van Ryzin, G. (2003). Survey of Satisfaction with Community and Local Government.
(Tech. Rep. No. 13005). Syracuse, NY: Syracuse University, School of
Information Studies.
Vasilopoulos, N. L., Cucina, J. M., & McElreath, J. M. (2005). Do warnings of response
verification moderate the relationship between personality and cognitive ability?
Journal of Applied Psychology, 90, 306-322. doi: 10.1037/0021-9010.90.2.306
Vasilopoulos, N. L., Reilly, R. R., & Leaman, J. A. (2000). The influence of job
familiarity and impression management on self-report measure scale scores and
response latencies. Journal of Applied Psychology, 85, 50-64. doi:
10.1037/0021-9010.85.1.50
Viswesvaran, C., & Ones, D. S. (1999). Meta-analyses of fakability estimates:
Implications for personality measurement. Educational and Psychological
Measurement, 59, 197-210. doi:10.1177/00131649921969802
154
Waters, L. K. (1965). A note on the "fakability" of forced-choice scales. Personnel
Psychology, 18, 187-191. doi: 10.1111/j.1744-6570.1965.tb00277.x
Watson, D., & Clark, L. A. (1997). Extraversion and its positive emotional core. San
Diego, CA: Academic Press.
Waller, N. G., Tellegen, A., McDonald, R. P., & Lykken, D. T. (1996). Exploring
nonlinear models in personality assessment: Development and preliminary
validation of a negative emotionality scale. Journal of Personality, 64, 545-576.
doi: 10.1111/j.1467-6494.1996.tb00521.x
Watson, D., Clark, L. A., & Tellegen, A. (1988). Development and validation of brief
measures of positive and negative affect: The PANAS scales. Journal of
Personality and Social Psychology, 54, 1063-1070. doi:10.1037/0022-
3514.54.6.1063
Weekley, J. A., Ployhart, R. E., & Holtz, B. C. (2006). On the development of situational
judgment tests: Issues in item development, scaling, and scoring. In J. A.
Weekley & R. E. Ployhart (Eds.), Situational judgment tests: Theory,
measurement, and application. (pp. 157-182). Mahwah, NJ: Lawrence Erlbaum
Associates.
Wilkinson, L. (1999). Statistical methods in psychology journals: Guidelines and
explanations. American Psychologist, 54, 594-604. doi: 10.1037/0003-
066X.54.8.594
155
Williams, L. J., & Anderson, S. E. (1991). Job satisfaction and organizational
commitment as predictors of organizational citizenship and in-role behaviors.
Journal of Management, 17, 601–617. doi: 10.1177/014920639101700305
Wilson, T. D., Lindsley, S., & Schooler, T. Y. (2000). A model of dual attitudes.
Psychological Review, 107, 101-126. doi:10.1037//0033-295X.107.1.101
Wilt, J., & Revelle, W. (2009). Extraversion. New York, NY: Guilford Press.
Zickar, M. J., & Drasgow, F. (1996). Detecting faking on a personality instrument using
appropriateness measurement. Applied Psychological Measurement, 20, 71-87.
doi: 10.1177/014662169602000107
Zickar, M. J., & Gibby, R. E. (2007). Four persistent themes throughout the history of
I-O psychology in the united states. (pp. 61-80). Mahwah, NJ: Lawrence
Erlbaum Associates.
Zimmerman, R. D. (2008). Understanding the impact of personality traits on individuals'
turnover decisions: A meta-analytic path model. Personnel Psychology, 61, 309-
348. doi:10.1111/j.1744-6570.2008.00115.x