implementation and evaluation of a blood products ... · implementation and evaluation of a blood...
TRANSCRIPT
i
Implementation and evaluation of a blood products traceability
procedure in a District General Hospital
By
Francis O Ajeneye MSc, FIBMS, CSci, CertHPM
A portfolio of research and development in a professional context
Submitted in partial fulfilment of the
Degree of Professional Doctorate in Biomedical Science
School of Pharmacy and Biomedical Sciences
Faculty of Science
University of Portsmouth
September 2012

ii
Abstract
The main aims of this study were to explore and identify why traceability
compliance was poor at the Homerton University Hospital NHS Trust and to
implement a suitable model to improve it. This study was a multi-stage
exploration of the various practices of staff involved in the blood transfusion
chain, both at the Trust and in some other NHS Trusts in the United Kingdom.
The study explored the reasons for the Trust‟s poor traceability of blood products,
which eventually led to poor compliance. It identified the risk factors that led to
poor traceability, explored why some wards had better compliance than others
and evaluated the direct costs and benefits of wastage.
The principal aim of these activities was to be able to take an informed decision
on the development of a new model to improve compliance.
A quantitative approach was adopted as it made it possible to measure the
frequency of actions, and this data was used to answer the research questions.
Data was collected using questionnaires, observations and an audit of
information extracted from the laboratory‟s information management systems. A
questionnaire was designed, piloted and sent to all ward managers at the Trust,
and survey data was analysed using the SPSS statistical package. Some of the
issues that were addressed and analysed included: staff training in blood product
collection and administration; knowledge of staff members of the concept of
traceability compliance; laboratory staff professionalism; ward staff
responsibilities for traceability compliance; and ward staff attitudes and opinions
about the traceability model.
To add rigour to the study, the survey was followed by structured observations at
the blood collection point and the patient‟s bedside. This data was also analysed
using descriptive statistics and the results showed that traceability compliance
was poor in some areas of the Trust. Problems included: the absence of a trainer
on the ward, lack of education, few transfusion episodes on the wards, variation
in the method of returning labels to the transfusion department, and poor
communication between frontline staff and the transfusion laboratory.
iii
The study resulted in the implementation of new approaches to the transfusion
chain in order to improve practice. These included: the appointment of a medical
laboratory assistant to assist with traceability compliance; the appointment of a
clinical transfusion nurse specialist to assist with training and ensure safe
practice on wards; the provision of trainers and clinical supervision on particular
wards; the development of a competence programme to assess staff involved in
blood collection and distribution; the development of clinical guidelines; and the
administration of an annual skills checks for staff involved in the transfusion
chain.
Most of the recommendations have been implemented and put into practice. A
formal audit will be conducted in the future to evaluate their success but to date,
65% of staff members have passed the annual skills‟ assessment and the
traceability compliance of the Trust has remained at 100%.
iv
Table of Contents
1. Introduction ..................................................................................................... 1
1.1. Globalisation and blood safety ................................................................... 2
1.2. Epidemiological monitoring of donors ......................................................... 5
1.3. Haemovigilance.......................................................................................... 6
1.4. Blood transfusion in the UK ........................................................................ 8
1.5. The regulatory framework ........................................................................ 13
1.6. Organisational and professional drivers for BSQR ................................... 14
1.6.1. Serious Hazards of Transfusion (SHOT) .................................................. 14
1.6.2. Clinical governance .................................................................................. 15
1.6.3. National Patient Safety Agency (NPSA) ................................................... 16
1.6.4. The UK Transfusion Laboratory Collaborative .......................................... 17
1.6.5. Better Blood Transfusion (BBT) ................................................................ 17
1.6.6. European Blood Safety Directives ............................................................ 18
1.6.7. UK Blood Safety and Quality Regulations ................................................ 19
1.6.8. Clinical audits and professional standards................................................ 20
1.7. Transfusion safety .................................................................................... 21
1.7.1. Recipient recall programmes .................................................................... 22
1.7.2. Methods to identify blood transfusion incidents ........................................ 23
1.7.3. Causes of incidents in blood transfusion .................................................. 27
1.7.4. Incident reporting ..................................................................................... 31
1.7.5. Traceability compliance ............................................................................ 33
1.8. Proposed programme of research ............................................................ 40
v
1.8.1. Research aim and objectives ................................................................... 41
2. Traceability compliance assessment (Method 1) ........................................ 43
2.1.1. Phase one: Quantitative assessment of traceability compliance ............... 44
2.1.2. Phase two: Survey of ward managers ...................................................... 49
2.1.3. Phase two: Direct observation .................................................................. 54
2.1.4. Discussion................................................................................................ 56
3. Blood product tracking models.................................................................... 60
3.1.1. Introduction .............................................................................................. 60
3.1.2. Method ..................................................................................................... 60
3.1.3. Results ..................................................................................................... 61
3.1.4. Discussion................................................................................................ 64
3.2. Commercial software products ................................................................. 67
3.2.1. Barcode tracking systems ........................................................................ 67
3.2.2. Radiofrequency tracking systems ............................................................. 69
3.2.3. Limitations and challenges of barcode and RFID technology ................... 70
3.3. Survey of blood bank managers ............................................................... 71
3.3.1. Method ..................................................................................................... 72
3.3.2. Results ..................................................................................................... 72
3.4. Discussion................................................................................................ 75
3.4.1. Literature review....................................................................................... 75
3.4.2. Tracking methods ..................................................................................... 76
4. New system implementation (Method 2) ..................................................... 77
4.1. Quantitative assessment of traceability compliance ................................. 78
4.1.1. Method ..................................................................................................... 78
vi
4.1.2. Results ..................................................................................................... 79
4.2. Further interventions to improve compliance ............................................ 83
4.2.1. Medical Laboratory Assistant ................................................................... 83
4.2.2. Medical/electronic processing records ...................................................... 84
4.2.3. Transfusion nurse specialist ..................................................................... 84
4.3. Discussion................................................................................................ 84
4.4. Change management ............................................................................... 85
4.4.1. Psychodynamic approaches to change .................................................... 86
4.4.2. Justification for change............................................................................. 89
4.4.3. Funding and training ................................................................................ 90
4.5. Clinical implications .................................................................................. 90
5. Application to practice .................................................................................. 91
5.1. Evidence of achievements ....................................................................... 92
5.1.1. Specialist transfusion nurse...................................................................... 94
5.1.2. Skills assessment ..................................................................................... 94
5.1.3. Redesign of information technology ......................................................... 95
5.1.4. Medical laboratory assistant (MLA) .......................................................... 95
5.1.5. Air tube system ........................................................................................ 96
5.2. Cost-benefit analysis ................................................................................ 96
5.3. Email questionnaire .................................................................................. 97
5.3.1. Method ..................................................................................................... 97
5.3.2. Results ..................................................................................................... 99
5.4. Summary.................................................................................................. 99
6. Reflection..................................................................................................... 101

vii
6.1. Developing the extending role ................................................................ 106
6.2. Future goals ........................................................................................... 106
6.3. Dissemination ........................................................................................ 106
7. References ................................................................................................... 108
viii
Appendices
Appendix 1 Information form LREC for the study approval
Appendix 2 Approval letter from the Trust Clinical Governance Committee
Appendix 3 Letter to blood bank managers
Appendix 4 Letter to ward managers
Appendix 5 Questionnaire sent to the ward managers
Appendix 6 Questionnaire sent to the NHS Trust blood bank managers
Appendix 7 Structure observation tools developed for blood collection point
and bedside checking procedure
Appendix 8 Procedure for collecting EU Directive compliance figures
at the Homerton University Hospital NHS Trust
Appendix 9 Developed competency assessment tools for the clinical and non-
clinical staff collecting blood products
Appendix 10 Dissemination
ix
List of tables
Table 1-1 Overview of national haemovigilance systems in the European Union. .. 7
Table 1-2 Blood products issued by UK blood services 1999-2011. ....................... 8
Table 1-3 Blood transfusion errors in the UK blood supply 1996-2011. .................. 9
Table 1-4 Total number of reports per 10,000 components 2007-2011 ................ 10
Table 1-5 Number of infected recipients and their outcome from 1996-2011. ....... 11
Table 1-6 Infrastructure, systems and processes related to clinical governance ... 16
Table 1-7 National Comparative Audit on Better Blood Transfusion .................... 18
Table 1-8 Predictive Human Error Analysis (PHEA) technique ............................. 23
Table 1-9 Error identification methods; advantages and limitations ...................... 23
Table 1-10 Summary of the types of clinical errors ............................................... 26
Table 1-11 Technological causes of blood transfusion errors. .............................. 27
Table 1-12 Patient identification tracking systems and errors prevented. ............. 28
Table 1-13 Special requirements incidents in the UK ........................................... 28
Table 1-14 Literature review of traceability compliance 2001-2012. ..................... 36
Table 2-1 Mean ward traceability compliance. ...................................................... 46
Table 2-2 Compliance as percentage of units issued for all wards 2005-08.......... 47
Table 2-3 Traceability compliance for all wards 2005-2008. ................................. 48
Table 2-4 Traceability compliance for usage groups 2005-2008 ........................... 48
Table 2-5 Ward demographics ............................................................................. 51
x
Table 2-6 Ward managers‟ assessment of traceability compliance. ...................... 52
Table 2-7 Observed compliance by ward staff ...................................................... 55
Table 3-1 Results of the literature review ............................................................. 63
Table 3-2 A sample of commercial products using bar-code technology. ............. 68
Table 3-3 Demographics of the 16 NHS Trusts surveyed. .................................... 73
Table 4-1 Average ward compliance 2009-2010. ................................................. 80
Table 4-2 Percentage compliance 2009-10. ......................................................... 81
Table 5-1 Reduction in red blood cell wastage 2006-2011 ................................... 97
Table 5-2 Demographics of the NHS Trusts surveyed. ......................................... 98
xi
List of figures
Figure 1.1 Summary of blood transfusion errors 2011 ...................................................... 10
Figure 1.2. The pillars of clinical governance .............................................. ……………..15
Figure 1.3 Steps in the transfusion chain. ......................................................................... 22
Figure 1.4 Organisational accident model…………….……………………………………31
Figure 1.5 Flow diagram identifying elements of the study…......……..…………….……42
Figure 2.1 Correlation between traceability compliance and units transferred……………. 47
Figure 2.2 Percentage compliance for usage group………………….....………..………....48
Figure 4.1 Air-tube system installed at the Trust ............................. ………………………78
Figure 4.2 Comparison of ward traceability compliance using Methods 1 and 2................ 81
Figure 4.3 shows 2012/13 the average traceability compliance within the Trust............….82
Figure 4.4 Usage group traceability compliance under Method 1………………………… 83
Figure 4.5 Usage group traceability compliance under Method 2 ...................................... 83
xii
Abbreviations
AIDS Acquired Immune Deficiency Syndrome
BSQR Blood Safety and Quality Regulations
EC European Commission
HBV Hepatitis B Virus
HCV Hepatitis C Virus
HPA Health Protection Agency
HIV Human Immunodeficiency Virus
IBMS Institute of Biomedical Sciences
ISBT International Society of Blood Transfusion
MHRA Medicine and Healthcare products Regulatory Agency
NHS National Health Services
NPSA National Patient Safety Agency
RFID Radio Frequency Identification
SCBU Special Care Baby Unit
SHOT Serious Hazard of Transfusion
UK United Kingdom
vCJD Variant Creutzfeldt Jakob Disease

xiii
Acknowledgements
I would like to thank my Academic Supervisors, Doctors Sally Kilburn and Bernie
Higgins and who have taught me and guided me so much. They have unfailingly
supported me in higher education and have encouraged me in my professional
development.
I am grateful to Professor Graham Mills for his in-depth critique of the study and his
support in undertaking the Professional Doctorate alongside my professional
practice.
Thanks to Steve O‟Kell for the first module of this Doctorate in Biomedical Sciences
programme. He stretched me to perform at my best and taught me the art of true
reflection. His continued professional support has been crucial to the
implementation of the recommendations that have arisen from this research.
I am obliged to those who participated in the questionnaires and who made this
thesis purposeful. They gave their time freely and willingly, talked openly and
honestly, and trusted me with their experience and knowledge.
I am grateful to work supervisors, Dr R Amos (Haematology Consultant), Ms
Yvonne Kelly (Laboratory Manager) and Bala Sirigireddy who painstakingly
validated my data at several stages, challenged and debated many issues and
assumptions throughout the development of categories, and helped me to value
and like my work at a time when I could have put it to one side indefinitely.
I am indebted to Mr Oluwatoyin Olamiji, my friend who embarked with me on the
professional doctorate a few years ago when we began to support each other. He
offered encouragement and gave me the self-belief that this journey is achievable.
I also thank my family, Oluwaseyi, Tomisin and my wife who have all played their
different parts, too numerous to mention individually, in this research journey. I look
forward to the return of a sociable family life.
xiv
Dissemination
Ajeneye, F. (2012) Blood storage and the 30-minute rule. The Biomedical
Scientist Gazette Vol 56, p.204–205.
Ajeneye, F. (2012) Blood Safety and Quality Regulations and the hospital
laboratory. Biomedical Scientist Gazette Vol 56, p.144–145.
Ajeneye, F. (2008) Traceability of blood and its products. The pursuit of 100%
compliance. Biomedical Scientist Gazette Vol. 52, p.1086–87.
Ajeneye, F. (2007) Pre-analytical quality assurance: A Biomedical Scientist
perspective. Biomedical Scientist Gazette Vol.51, p.86–87.
Ajeneye, F. (2006) Power and sample size estimation in research. Biomedical
Scientist Gazette Vol.50. p.988–990.
Ajeneye, F. (2006) How to validate a diagnostic research. Biomedical Scientist
Gazette Vol.50. p.535–537.
Ajeneye, F. (2005) Reflective practice: A Biomedical Scientist perspective.
Biomedical Scientist Gazette Vol. 49, p.572–573.
Oral presentations
Ajeneye, F. (2011). The impact of BSQR in the hospital transfusion laboratory: A
Biomedical Scientist perspective. IBMS International Congress, U.K.
Ajeneye, F. (2009). Blood products traceability: Where are we now? IBMS
International Congress September, U.K.
Poster presentations
Ajeneye, F. (2012) The two faces of traceability compliance at the Homerton
University Hospital. BBTS Annual Congress 2012.
Ajeneye, F. (2011) Blood product traceability: The pursuit of 100% compliance.
AMT conference, Miami,U.S.
xv
Ajeneye, F. (2009) Common errors in the blood transfusion chain. BBTS
International Congress, U.K.
Ajeneye, F. (2009) Blood products traceability compliance: How it all happened.
AMT conference, Minneapolis, U.S.
Ajeneye, F. (2007) Traceability of red cells within Trust: A retrospective audit.
IBMS International Congress U.K.
Ajeneye, F. (2005) Blood collection audit: compliance with the Trust policy.
IBMS International Congress, U.K.
Ajeneye, F. (2005) Recent development in blood transfusion. AMT Conference,
Nevada, U.S.
Ajeneye, F. (2005) Development and audit of rejected transfusion requests within
the Trust.IBMS International Congress, U.K.
Ajeneye, F. (2005) Common errors in blood transfusion. AMT Conference, Kansas
City, U.S.

xvi
Declaration
I declare that whilst studying for the Doctorate in Biomedical Science at the
University of Portsmouth, I have not been registered for any other award at another
university. The work undertaken for this degree has not been submitted elsewhere
for any other award. The work contained within this submission is my own work
and, to the best of my knowledge and belief, it contains no material previously
published or written by another person, except where due acknowledgement has
been made in the text.
Francis Ajeneye
September, 2012

xvii
Dedication
It gives me great pleasure to dedicate this work to all lovers of knowledge, my
family and colleagues at work, who dedicated their professional lives to the
National Health Service and continue to support it, even in retirement, by the
unceasing care and kindness they have bestowed on me.
1
1. Introduction
Blood is one of the world‟s vital substances. The Greeks referred to blood as a
component of universal order. The Romans felt blood carried a person‟s vital
essence; the gladiators drank the blood of their fallen opponents. Doctors, from
mediaeval to Victorian times assumed that blood had a fantastical power; draining
blood removed evil humour, transfusing blood pacified the deranged (Starr, 2001,
pp.119-120).
However, blood is fragile and expensive and has been a heavily traded product
across the world. The global trade in blood and its products developed in the early
1970s. Initially, red cells and white cells stayed within national boundaries except
for Swiss blood that was exported to Greece and the United States. Eventually,
plasma derivatives became international commodities when the United States
became the pioneer of plasmapheresis. A darker side of the industry emerged as
plasma mills appeared in deprived areas of American cities with donation sessions
from drug addicts and prisoners. Although Europe denounced this practice it
continued to quietly purchase plasma and its derivatives from America. Other
plasma mills, located in South and Central America were destroyed in 1978
(Farrugia, 2006).
The same, effective, system that was responsible for the collection of blood
products was equally effective in distributing diseases. Transfusion Transmitted
Infection became a significant and daily subject of alarm in western countries. Both
clinicians and politicians were blamed for delivering disease to the population
rather than preventing it (Feldman & Bayer, 1999, p.268).
Haemophilia patients became reliant on fractionated plasma in the early 1980s.
Because they did not need to go to a hospital for a plasma transfusion, some could
keep fractionated products at home. Easy access to fraction blood products gave
them a normal life (Feldman and Bayer, 1999, p. 269-270). Consequently, the
stock of residual plasma products could not meet worldwide demand. However,
more pooled plasma was needed worldwide than could be supplied from fresh
blood supplies.
2
Blood and its products (derived from whole human blood or plasma) saves millions
of lives every year but the entire process of collecting and distributing blood and its
products depends on the trust and the goodwill of the public. Although some
adverse events related to blood transfusions may occur immediately, transfusion
transmitted diseases may not produce any illness for months, or even years. The
ability to trace the path of the blood from the recipient to the original donor and vice
versa is an important public health safeguard. In addition, accurate and complete
record keeping is an essential part of professional practice.
1.1. Globalisation and blood safety
Globalisation may be defined as the, “transition from national and regional
economies to global economies. This includes a nexus of an economic and social
process where local market and culture are dominated by global market and
cultures” (Fisher, 2004). It is a consequence of the growing interdependence of
countries worldwide through an increasing volume of cross-border trading in goods
and services.
Data gathered by World Health Organization (World Health Organization, 2006)
showed that the blood donation rates and the extent of viral testing are dependent
on economic status (Mattar, 2004). In an ideal and globalised environment, one
would expect that the challenges faced by the world in terms of the safety and
supply of blood and its products would be addressed through the free movement of
blood derivatives. However, the developed world‟s capacity to deal with established
and emerging blood safety threats, many of which are the results of globalisation is
lacking (Snyder & Dodd, 2001, p.433). Malaria is the most common transfusion-
transmitted infection worldwide and in non-malarious area is introduced into the
blood supply via travellers returning from areas where it is endemic. In the United
Kingdom deferral measures applied to donors returning from such countries are
considered to provide adequate protection (Snyder & Dodd, 2001).
Unfortunately the continuing emergence of infectious agents is a feature of
globalisation. It affects the safety of the blood supply and makes the cross-border
movement of blood more difficult than in previous times. Nevertheless, the plasma
industry, where blood products are traded across national borders is one example
of the continuing global nature of the business. The reaction of humans to the
3
pressures of globalisation is responsible for many of the current challenges posed
by trade-related infections (Kimball, Arima & Hodges, 2005, p.2).
Higher levels of traffic in goods and people have affected both blood safety and
supply in many ways. The increasing movement of plasma products has eroded
some of the historical barriers between countries. Developed countries are
strengthening the blood safety infrastructure through the development of new tests
and pathogen elimination techniques (World Health Organisation, 2006). Many of
these measures are the result of trends initiated by pharmaceutical manufacturers
and in the healthcare sector although in general such processes have been
restricted to, and focused on, rich countries (Kreil et al., 2003, pp.1023–1026).
Variant Creutzfeldt Jakob Disease (vCJD) is a degenerative disorder that was first
recognized in 1996 in the UK. It is caused by bovine spongiform encephalopathy
(BSE) contaminated meat. From October 1996 to March 2011, 175 cases of vCJD
have been reported in the United Kingdom, 25 in France, five in Spain, four in
Ireland, three each in the Netherlands and the United States, two each in Canada,
Italy and Portugal and one each in Japan Saudi-Arabia and Taiwan. vCJD is a new
disease and the risk of transmission has been a major concern to blood services
since its discovery. The precautionary measures taken since 1999 include the
removal of white cells believed to contain much of the infectious agent-prions
(McClelland et al., 1996).
The first incident of the contamination of blood by Hepatitis B was seen in 1982 in
patients with haemophilia who had received blood fractions as therapy for their
clotting disorder. These products were produced from the pooled plasma from a
large number of donors, which was normal procedure at this time. Until then, the
potential contamination of blood products with infectious diseases had not been
seen as a risk. Since then, the response to Acquired Immune Deficiency Syndrome
(AIDS) that affected government policies and the reputation of the medical
profession has been called the blood scandal (Feldman,1999).
Canada, France, Japan, and the United States all contributed to the AIDS scare. All
four countries were self-sufficient in whole blood and blood components from
voluntary donors although France relied on prisoners as volunteers and Canada
and Japan imported blood fractions for haemophiliacs. Haemophiliac patients

4
organized themselves differently in different countries and this affected the
pressure that they were able to exert on the political structure. They gained most
recognition in Japan in the 1980s and received substantial compensation. In
Canada and France they accepted compensation schemes offered by the
government (Baldwin, 2005).
The French blood system was deeply involved in the scandal. Perhaps due to pride
in the purity of French blood, the downfall of the system was its involvement in
more than half of the blood-transmitted AIDS cases in Europe. In 1991, an internal
government document revealed that the early success of heat treatment of factor
VIII was ignored. The distribution of older, unheated, contaminated fractions
continued from some blood centres in France and was justified by the cost. In
1992, the Director of the National Centre in Paris was sentenced and jailed, an
event that is now widely believed to be a miscarriage of justice (Schmidt, 2006).
In Japan, as in France, the driving force behind the AIDS blood scandal was the
effect of infected blood fractions on the nation's haemophiliac population. At this
time commercial operators took control of plasmapheresis and Japan's
corporations guaranteed plasma collections. It was the product of this unholy
alliance that brought HIV to Japan. The problem set the stage for the most
prominent health scandal in Japan‟s history. Further evidence of failure was found
in the continued use of unheated plasma long after the heat treatment of plasma
was mandatory in the United States. The principals involved were charged with
murder (Schmidt,2006).
The Canadian blood system combined the problems seen in France of a loosely
controlled and overly-trusted source of whole blood, and contaminated plasma from
American blood. The government had left the regulation of the blood system to the
Canadian Red Cross and the therapy for haemophiliacs was being met by plasma
processed in the United States. The public became aware of the disaster as the
untreated plasma spread among the haemophiliac population in Canada. The Red
Cross‟s response was slow and when the government finally decided to fund blood
testing, the decision came seven months later than in the United States. The
Canadian Red Cross later filed for bankruptcy and removed itself from all activities
associated with the blood system. A new National Canadian Blood Service was
created to do the work of the Red Cross. Consequently, Canada, France and
5
Japan‟s blood system have been constructed to protect the public from the
previous mistakes (Gallo & Montagnier, 2003, pp. 2283–2284).
The United States carried out a major analysis of its blood programme in 1972
following the hepatitis problem. Although the United States was the country in
which the new disease (that turned out to be HIV) was first seen in 1990s.The
blood scandal resulted in lesser political and social upheaval than in Canada,
France and Japan. The peculiarities of United States liability laws required patients
to file for compensation in their local jurisdiction (Baldwin, 2005). Blood centres in
the United States were protected by blood shield laws passed during the hepatitis
era which absolved them of any responsibility if they had carried out the required
testing. Although court rulings always found against the patients, many cases never
reached the courts. It was not until 1995 that infected haemophiliacs were
compensated by the federal government.
Studies by Glynn et al. (2003) and Ling (2010) claimed that blood is safer than
ever. However, safety culture was not enforced during the hepatitis era. The
Department of Health and Human Services in the United States have implemented
a comprehensive safety vigilance system to address the threat from unknown and
emerging infectious sources (Busch et al., 1999). Blood is not entirely safe, but
neither is it our most dangerous drug. Like many good things, it comes with risks.
1.2. Epidemiological monitoring of donors
The purpose of epidemiology monitoring of donors is to gain a better understanding
of the various parameters that lead to donor exclusion either on medical grounds or
self-exclusion. In the United Kingdom (UK), data must be recorded in the national
blood collection surveillance registry. In 2010, the rate of infection among UK blood
donors was low, with approximately 11.7 infected donations per 100,000 tested. In
2010, 2.5 million donations were tested, of which 286 tested positive for a marker
of infection. Four out of five infections detected came from new donors (HPA,2011).
The residual risk of viral infection can be estimated from data measuring the
number and percentage of seropositive donations in previous years, the prevalence
of seropositive donors, the length of the pre-seroconversion window period, the
sensitivity of the screening test and the probability of blood components being
6
contaminated. These models have made it possible to identify a number of
preventative measures. The evaluation of blood donation safety can also be based
on the follow-up of recipient cohorts by assessing residual risks in a given
population, such as in multi-transfused patients (Debeir et al., 1999, p.81).
1.3. Haemovigilance
Haemovigilance is defined as, “a system of surveillance and alarm, ranging from
the collection of blood products to the follow up of recipients, to gather and assess
incidents resulting from the transfusion of the blood products”. The main goal of
haemovigilance is to prevent the recurrence of incidents by identifying their causes
(McClelland et al., 1998). Haemovigilance contributes to the process of maintaining
and improving transfusion safety. It grew out of government-driven reviews of the
organization of transfusions following the HIV transmission scare in the early 1980s
(Faber, 2002). The mandatory reporting at a national level of any undesirable
events related to blood transfusion was introduced in the United States in 1975.
The concept was first implemented in Europe in 1988 by Belgium, Denmark,
France, Luxembourg, the Netherlands, Portugal, Spain and Switzerland, with a
simple objective of being able to share alerts (Herve, 2002, p.30). In 1995, the
member states of the European Union indicated a need for countries to establish a
haemovigilance system. This culminated in the European Blood Directive (Faber,
2004). The directive states that, “member states shall ensure that there is a system
in place to collect, collate and transmit information about adverse reactions and
events related to the collection, testing, processing, storage and distribution of
blood and its components to the competent authority”. Consequently, most
European countries have had an established system for haemovigilance since
2010. (de Vries et al., 2011).
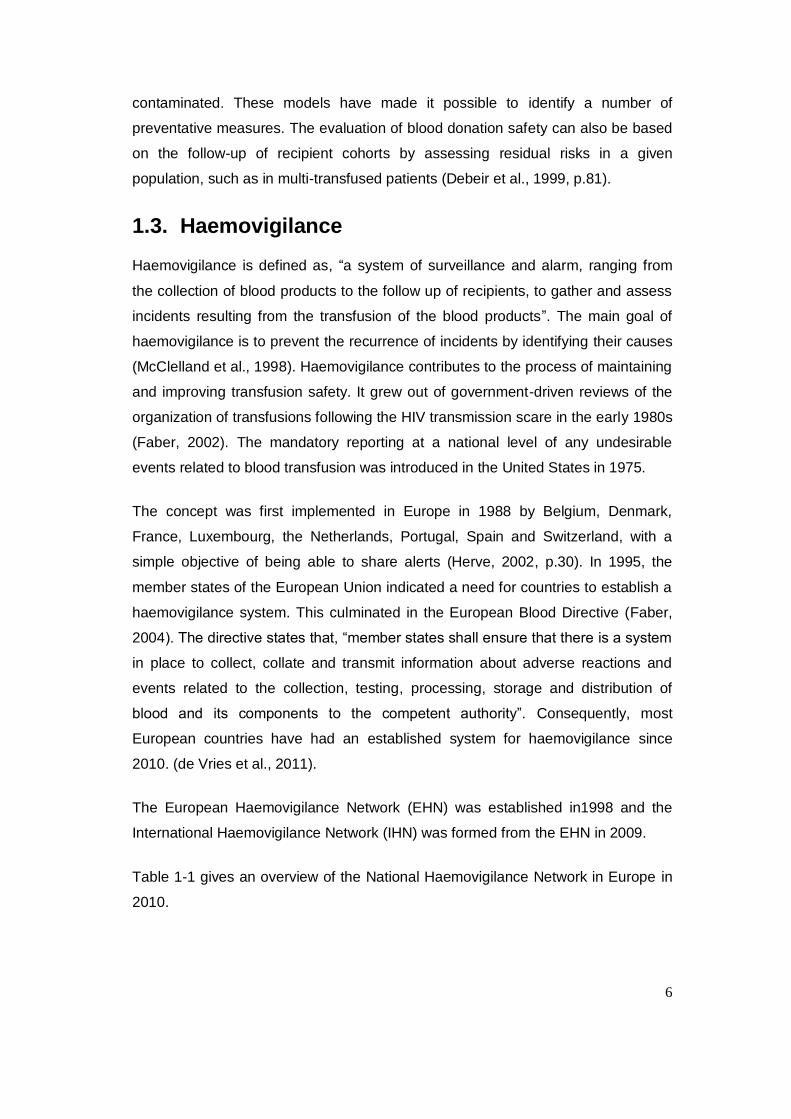
The European Haemovigilance Network (EHN) was established in1998 and the
International Haemovigilance Network (IHN) was formed from the EHN in 2009.
Table 1-1 gives an overview of the National Haemovigilance Network in Europe in
2010.
7
Table 1-1 Overview of national haemovigilance systems in the European Union.
Member States of European Union
Haemovigilance
Status Body responsible
Austria Established Mandatory OBIG
Belgium Established Voluntary Red Cross
Denmark Established Voluntary DART
Finland Established Voluntary Red Cross
France Established Mandatory AFSSAPS
Germany Established Mandatory PEI
Greece Established Voluntary SKAE/PEEL
Ireland Established Voluntary NHO
Italy Established Voluntary ISS
Luxembourg Established Voluntary Red Cross
Netherlands Established Voluntary TRIP
Portugal Building up Mandatory IPS/MoH
Spain Building up Voluntary SSTM/MoH
Sweden Established Voluntary SATM/Hospitals
United Kingdom Established Voluntary SHOT/SABRE
Greece Established Voluntary SKAE
Source: Updated from de Vries, Faber and Strengers, 2011
Key: AFSSAPS-Agence Francaise de Securite Sanitaire de Produits de Sante; DART-
Danish Registry for Adverse Reaction in Transfusion; IPS-Instituto Portugues do Sangue;
ISS-instituto Superiore de Sanita; NHO-National Haemovigilance Office; OBIG-
Osterreeischiches Bundes-Institut fur Gesundheit; PEI-Paul Ehrlich-Institut; SATM-Swedish
Association for Transfusion Medicine; SHOT-Serious Hazard of Transfusion; SABRE -
Serious Adverse Blood Reaction and Events; SKAE- Hellinic Coordinating Haemovigilance
Centre; SSTM-Spanish Society of Transfusion Medicine; MoH-Ministry of Health.
In Europe, the French and British systems are different. The French
haemovigilance system was established in 1994 (Andreu, Morel & Forestier, 2002),
it is nationwide and there is a legal obligation to report any untoward effects related
to blood transfusion (Andreu, Morel & Forestier, 2002). It must meet three
objectives at local and national level: (1) identify risks and related factors and
monitor these risks; (2) assess the relevance of medical indicators present in
8
individuals that wish to donate blood and (3) at the transfusion level, estimate the
incidence of transfusion-induced side-effects in recipients (de Vries et al., 2011).
In the UK, the Serious Hazards of Blood Transfusion (SHOT) was launched in
1996. Unlike France, only serious adverse reactions must be reported to SHOT on
a voluntary basis (Williamson, 2002). The participation of UK hospitals in
haemovigilance has improved since 2009 with an 85% increase in the number of
reports submitted in 2010. At the same time, the number of non-reporting hospitals
and trusts has fallen.
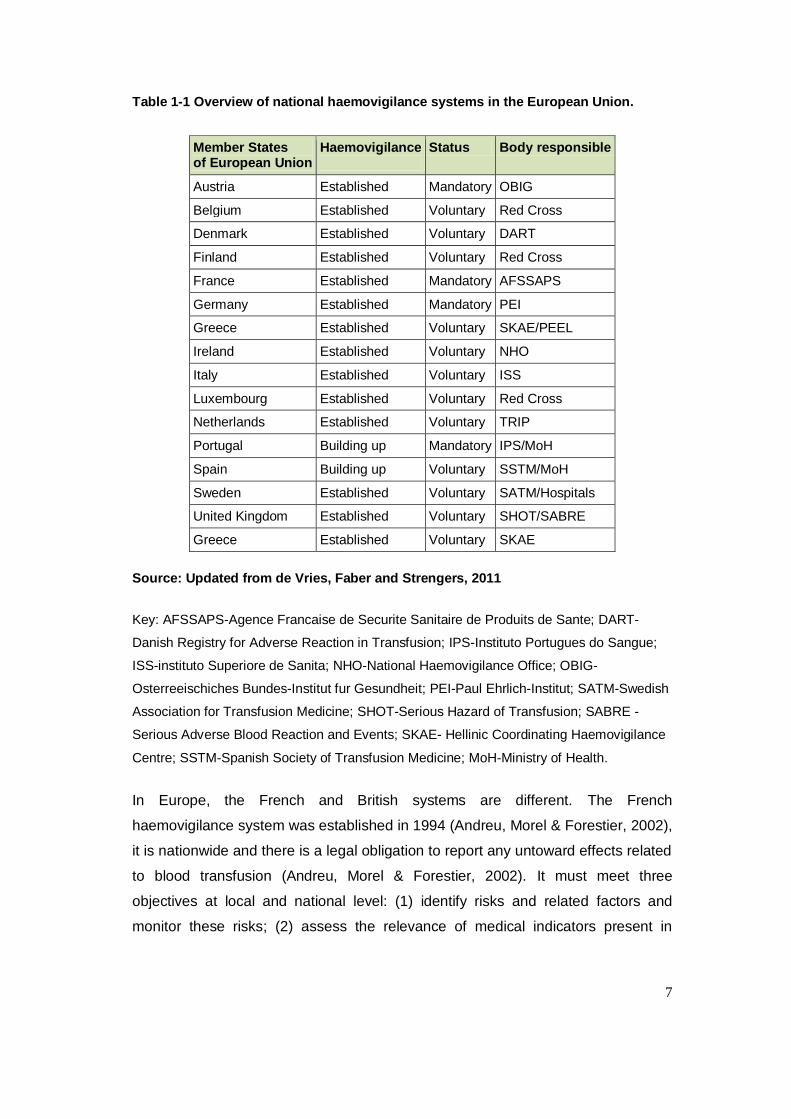
1.4. Blood transfusion in the UK
Over a 15 year period (1996-2011) more than 36 million blood components were
provided by the United Kingdom Blood Services and 4,334 untoward incidents
were analysed. Table 1-2 is a summary of all blood products issued 1999–2011 by
regional UK transfusion centres. It shows a downward trend in blood products
issued due to the postponement of blood donations during the influenza season
and measures taken to exclude potential donors to reduce the incidence of vCJD.
Table 1-2 Blood products issued by UK blood services 1999-2011.
Year Blood products issued
1999-2000 3,446,855
2000-2001 3,426,782
2001-2002 3,404,865
2002-2003 3,399,988
2003-2004 3,340,221
2004-2005 3,103,200
2005-2006 3,002,797
2006-2007 2,914,228
2007-2008 2,845,459
2008-2009 2,903,760
2009-2010 2,898,425
2010-2011 2,956,351
Source: Serious Hazards of Transfusion, 2011, p.2
9
In 2000, blood transfusions were estimated to cost the NHS £898 million,
representing a 256% increase since 1994/1995. The introduction of additional
technique for the screening of infections such as HIV, HTLV, HepB, HepC and
malaria contributed to the rise in cost. The estimated cost for an adult transfusion
was £635 for red blood cells, £375 for plasma, £347 for platelets and £834 for
cryoprecipitate (Varney, 2003).
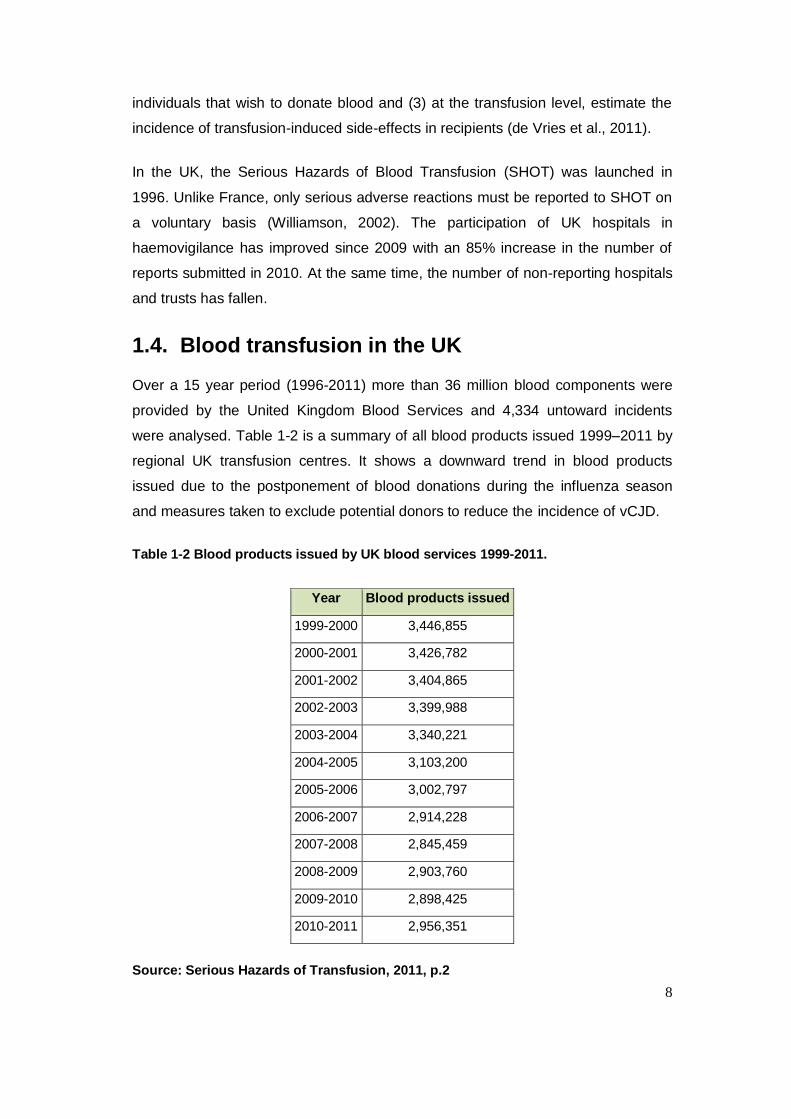
The most frequent hazard reported by the Serious Hazards of Blood Transfusion
(SHOT) is the transfusion of an incorrect blood component (Serious Hazards of
Transfusion, 2011).
Table 1-3 Blood transfusion errors in the UK blood supply 1996-2011.
Year Number of errors
1996-1997 63
1997-1998 107
1998-1999 131
1999-2000 188
2000-2001 173
2001-2002 302
2003 324
2006 1279
2007 1341
2008 2177
2009 2475
2010 1464
2011 1815
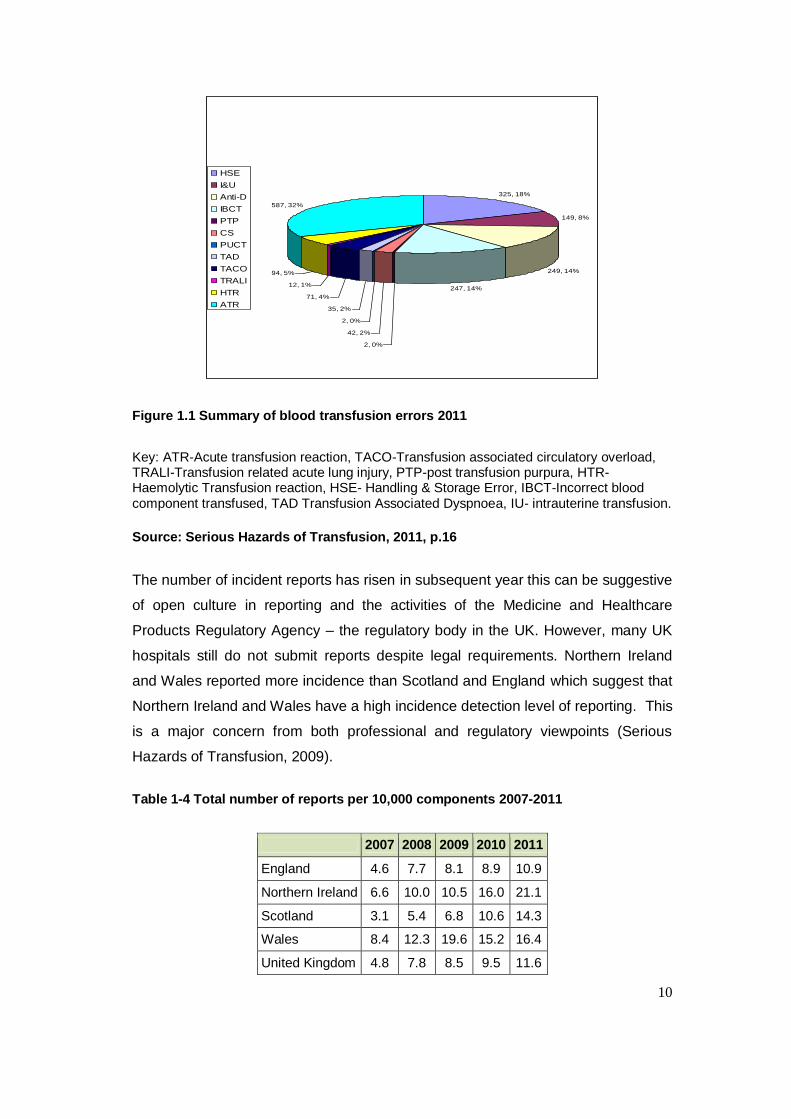
Source: Serious Hazards of Transfusion, 2011, p.16
Figure 1.1 shows the breakdown of errors reported to SHOT in 2011. Incorrect
Blood Component Transfused (IBCT) incidents accounted for 13.6% of errors
reported, even taking into account under-reporting. IBCT is a preventable error if
corrective and preventive actions are put in place.
10
325, 18%
149, 8%
249, 14%
247, 14%
2, 0%
42, 2%
2, 0%
35, 2%
71, 4%
12, 1%
94, 5%
587, 32%
HSE
I&U
Anti-D
IBCT
PTP
CS
PUCT
TAD
TACO
TRALI
HTR
ATR
Figure 1.1 Summary of blood transfusion errors 2011
Key: ATR-Acute transfusion reaction, TACO-Transfusion associated circulatory overload, TRALI-Transfusion related acute lung injury, PTP-post transfusion purpura, HTR-Haemolytic Transfusion reaction, HSE- Handling & Storage Error, IBCT-Incorrect blood component transfused, TAD Transfusion Associated Dyspnoea, IU- intrauterine transfusion.
Source: Serious Hazards of Transfusion, 2011, p.16
The number of incident reports has risen in subsequent year this can be suggestive
of open culture in reporting and the activities of the Medicine and Healthcare
Products Regulatory Agency – the regulatory body in the UK. However, many UK
hospitals still do not submit reports despite legal requirements. Northern Ireland
and Wales reported more incidence than Scotland and England which suggest that
Northern Ireland and Wales have a high incidence detection level of reporting. This
is a major concern from both professional and regulatory viewpoints (Serious
Hazards of Transfusion, 2009).
Table 1-4 Total number of reports per 10,000 components 2007-2011
2007 2008 2009 2010 2011
England 4.6 7.7 8.1 8.9 10.9
Northern Ireland 6.6 10.0 10.5 16.0 21.1
Scotland 3.1 5.4 6.8 10.6 14.3
Wales 8.4 12.3 19.6 15.2 16.4
United Kingdom 4.8 7.8 8.5 9.5 11.6
11
Source: Serious Hazards of Transfusion, 2011, p.8
In 1998, there were 33 suspected cases of transfusion-transmitted infection (TTI)
reported by blood centres and hospitals in the UK. The investigation of the blood
products involved showed that there were four incidents of contaminated units of
platelets that were proven to have transmitted bacterial infection to six recipients.
By 2008, there were no proven cases of viral or protozoan transmission, although
serious complications from bacterial contamination of blood components remained
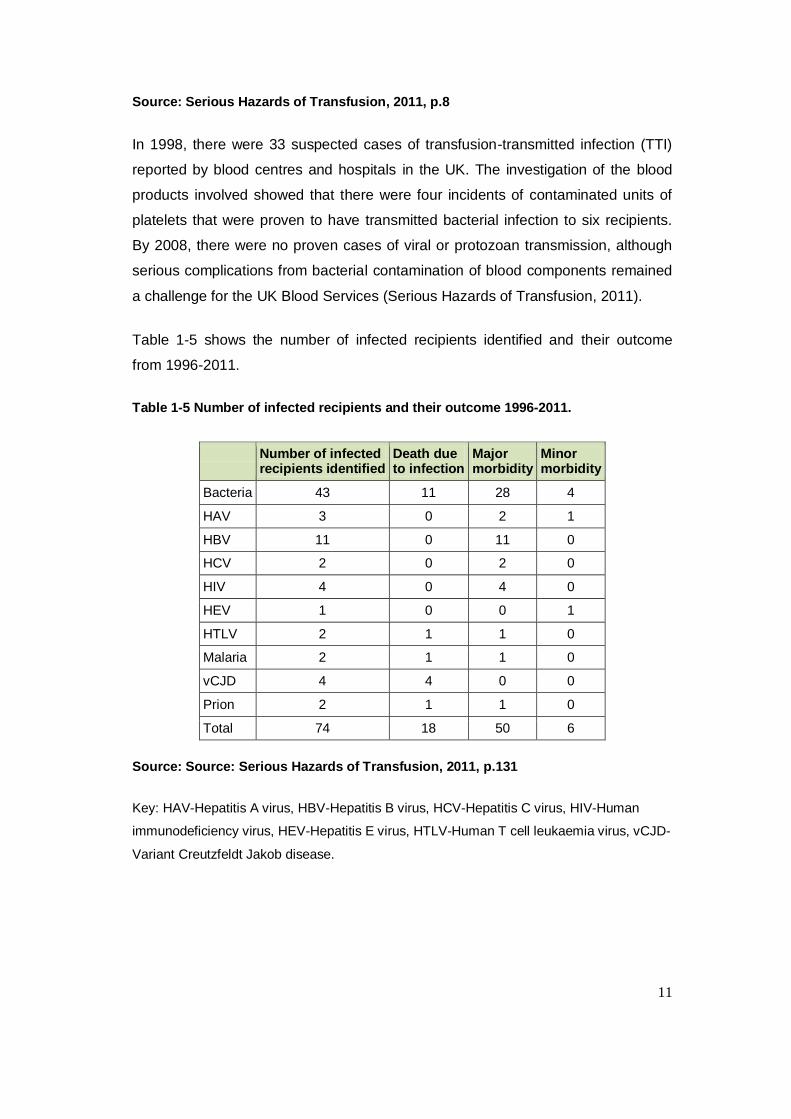
a challenge for the UK Blood Services (Serious Hazards of Transfusion, 2011).
Table 1-5 shows the number of infected recipients identified and their outcome
from 1996-2011.
Table 1-5 Number of infected recipients and their outcome 1996-2011.
Number of infected recipients identified
Death due to infection
Major morbidity
Minor morbidity
Bacteria 43 11 28 4
HAV 3 0 2 1
HBV 11 0 11 0
HCV 2 0 2 0
HIV 4 0 4 0
HEV 1 0 0 1
HTLV 2 1 1 0
Malaria 2 1 1 0
vCJD 4 4 0 0
Prion 2 1 1 0
Total 74 18 50 6
Source: Source: Serious Hazards of Transfusion, 2011, p.131
Key: HAV-Hepatitis A virus, HBV-Hepatitis B virus, HCV-Hepatitis C virus, HIV-Human
immunodeficiency virus, HEV-Hepatitis E virus, HTLV-Human T cell leukaemia virus, vCJD-
Variant Creutzfeldt Jakob disease.
12
The knowledge of ABO blood group system in the 18th and 19th century was
minimal which led to a lot disasters. According to (Starr, 2001). Further blood
transfusion procedures led to haemolytic episodes and deaths in the early part of
the 18th century and this eventually resulted in a ban for over a century. The
discovery of ABO blood group systems in the early part of the 20 th century
minimised haemolytic episodes but transfusion transmitted infections became a
major concern due to global trade of blood products and inadequate screening
(Fisher, 2004).
Blood transfusion in the 20th century had informed many of the decisions, initiatives
and guidelines in the 21st century and these are discussed fully in the following
sections 1.5. Following the increased of transfusion transmitted hepatitis, the term
haemovigilance was coined in the United States in the early 1970s to address the
threat to patient safety and tighten regulations on the use of blood products. This
led to the introduction of a robust quality management system for blood transfusion
in order to protect the patient and the public.
This concept was launched in Europe in 1988 and the French established a
haemovigilance programme in 1994. An incident in which the use of contaminated
blood led to the import and distribution of contaminated plasma products to
haemophiliacs in the United Kingdom undermined the government‟s ability respond
to the threat and led to immeasurable damage to the National Blood Service.
Although the European Blood Directive had indicated the need for haemovigilance,
the idea did not immediately take off. Consequently, the Serious Hazards of
Transfusion (SHOT) scheme was not launched until 1996.
The launch of SHOT was the starting point for haemovigilance in the United
Kingdom. Initially not all NHS Trusts fully participated in this scheme; few incidents
were reported and the data that was collected was not collated. Nevertheless,
improvements in quality assurance of blood and blood product testing became
clear as SHOT began to publish annual reports.
The introduction of the European Union Directive in 2002 and Blood Safety and
Quality Regulations (BSQR) in 2005 brought a big change in the collection,
storage, distribution, and traceability of blood products in the United Kingdom. The
13
BSQR became law in 2005 and failure to comply was considered to be a criminal
act.
The risk of mistransfusion became greater in the 21st century, see Page 34 “The
risk of mistransfusion was found to be greater than the risk of transmission of HIV
or HCV (Dzik, 2002, p.1190).” SHOT,(2011,p.16) also emphasized of the incidence
of incorrect blood component transfused in the U.K. Mistransfusion can also be due
to poor control or knowledge of the collection, storage, distribution and traceability
of blood products.
My research design was to explore and identify why traceability compliance was
poor within the Trust and to implement a suitable model to improve traceability
compliance within the Homerton University Hospital NHS Trust and to enhance
patient‟s safety within the transfusion chain.
1.5. The regulatory framework
European Commission Blood Directives 2002/98/EC (European Union Directive
2002/98/EC) and 2004/33/EC were transposed into the United Kingdom‟s Blood
Safety and Quality Regulations 2005 (Statutory Instruments 2005/50, 2005/1098
and 2006/2013) and became mandatory in the same year. The law imposed new
requirements on all hospital transfusion laboratories and clinical transfusion
process in the UK. The regulations required “unambiguous traceability” of all blood
and blood components from a donor to patient, or the final destination of all blood
and its components if not transfused. The final destination of every blood
component has to be retained and be made available for 30 years (Blood Safety
and Quality Regulations, 2005).
The Council of Europe defined traceability as, “the ability to identify the actual
recipient of every component released and, conversely, the ability to identify all
blood donors involved in the transfusion given to a patient. The active return of
information from the clinical area to the blood transfusion department after the
14
transfusion act is necessary to provide complete and reliable information about the
fate of the given blood component” (Council of Europe, 2003).
European Union Commission Directives 2005/61/EC and 2002/98/EC (2005), also
required the full traceability of blood and blood components. Blood establishments
and hospitals are required to implement a system that permits the identification of
each unit of blood component and its final destination. A system that has proved
effective in the UK is the so-called „bag & tag‟ label system. When a unit of blood is
prepared for a patient, a computerised laboratory system prints a tag. This includes
information that identifies the patient and two traceability labels bearing the
donation number.
It is important to understand the reasons behind the urgency of this current move to
the traceability of blood and its products. The emergence of transfusion transmitted
diseases has damaged trust in the blood establishment around the world and a
survey of various haemovigilance systems indicated that errors in the blood
transfusion chain, from the initial recipient identification to final blood administration
occur in about 1 in 1000 events (Pagliaro & Rebulla, 2006). Specific tools have
been developed to prevent the potentially fatal consequences of such mistakes.
These include barcoded patient identification bracelets and mechanical and
electronic locks that can allow full audit trail of all transfused blood products.
Although a number of studies have demonstrated the effectiveness of these
systems, they have not been widely adopted because of financial constraints.
1.6. Organisational and professional drivers of BSQR
A patient is entitled to be cared for by healthcare professionals with relevant and
up-to-date skills and expertise (Kennedy, 2001, p.322). For the general public, this
means that they can be also involved in the planning, organisation and delivery of
healthcare.
1.6.1. Serious Hazards of Transfusion (SHOT)
Serious Hazards of Transfusion is an independent, professionally-led
haemovigilance scheme that was launched in 1996 and collects data on serious
sequelae caused by the transfusion of blood components. The data collected
15
contributes to improvements in the safety of the blood transfusion process, informs
policy within the transfusion services in the UK and helps in the production of
clinical guidelines for the use of blood components.
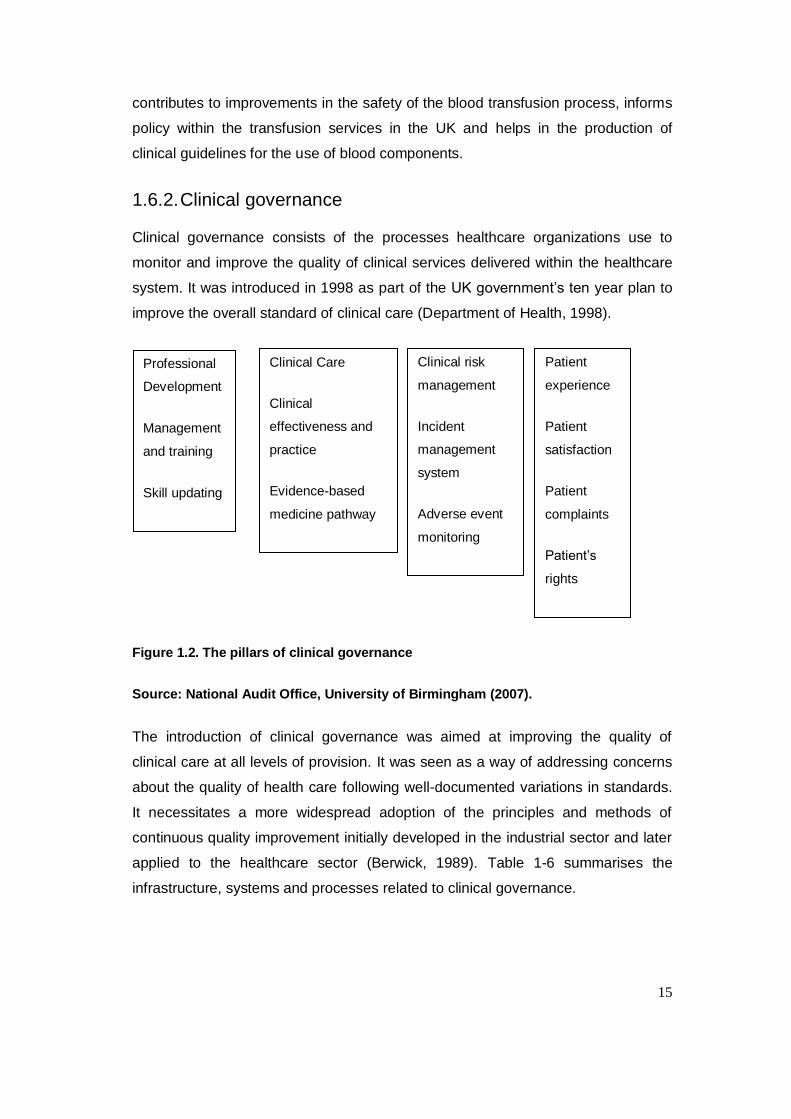
1.6.2. Clinical governance
Clinical governance consists of the processes healthcare organizations use to
monitor and improve the quality of clinical services delivered within the healthcare
system. It was introduced in 1998 as part of the UK government‟s ten year plan to
improve the overall standard of clinical care (Department of Health, 1998).
Figure 1.2. The pillars of clinical governance
Source: National Audit Office, University of Birmingham (2007).
The introduction of clinical governance was aimed at improving the quality of
clinical care at all levels of provision. It was seen as a way of addressing concerns
about the quality of health care following well-documented variations in standards.
It necessitates a more widespread adoption of the principles and methods of
continuous quality improvement initially developed in the industrial sector and later
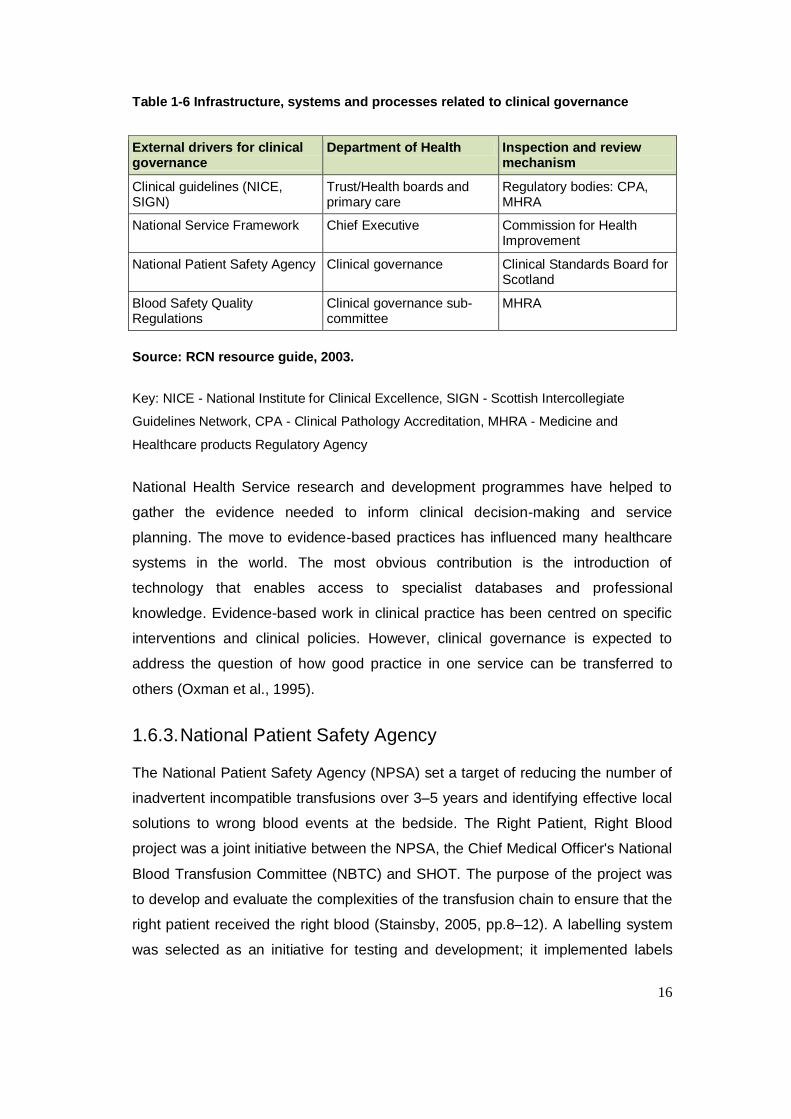
applied to the healthcare sector (Berwick, 1989). Table 1-6 summarises the
infrastructure, systems and processes related to clinical governance.
Clinical Care
Clinical
effectiveness and
practice
Evidence-based
medicine pathway
Clinical risk
management
Incident
management
system
Adverse event
monitoring
Patient
experience
Patient
satisfaction
Patient
complaints
Patient‟s
rights
Professional
Development
Management
and training
Skill updating
16
Table 1-6 Infrastructure, systems and processes related to clinical governance
External drivers for clinical governance
Department of Health Inspection and review mechanism
Clinical guidelines (NICE, SIGN)
Trust/Health boards and primary care
Regulatory bodies: CPA, MHRA
National Service Framework Chief Executive Commission for Health Improvement
National Patient Safety Agency Clinical governance Clinical Standards Board for Scotland
Blood Safety Quality Regulations
Clinical governance sub- committee
MHRA
Source: RCN resource guide, 2003.
Key: NICE - National Institute for Clinical Excellence, SIGN - Scottish Intercollegiate
Guidelines Network, CPA - Clinical Pathology Accreditation, MHRA - Medicine and
Healthcare products Regulatory Agency
National Health Service research and development programmes have helped to
gather the evidence needed to inform clinical decision-making and service
planning. The move to evidence-based practices has influenced many healthcare
systems in the world. The most obvious contribution is the introduction of
technology that enables access to specialist databases and professional
knowledge. Evidence-based work in clinical practice has been centred on specific
interventions and clinical policies. However, clinical governance is expected to
address the question of how good practice in one service can be transferred to
others (Oxman et al., 1995).
1.6.3. National Patient Safety Agency
The National Patient Safety Agency (NPSA) set a target of reducing the number of
inadvertent incompatible transfusions over 3–5 years and identifying effective local
solutions to wrong blood events at the bedside. The Right Patient, Right Blood
project was a joint initiative between the NPSA, the Chief Medical Officer's National
Blood Transfusion Committee (NBTC) and SHOT. The purpose of the project was
to develop and evaluate the complexities of the transfusion chain to ensure that the
right patient received the right blood (Stainsby, 2005, pp.8–12). A labelling system
was selected as an initiative for testing and development; it implemented labels
17
bearing a unique number that provided an additional link between the patient and
the blood product to be transfused (National Patient Safety Agency, 2006).
1.6.4. The UK Transfusion Laboratory Collaborative
The UK Transfusion Laboratory Collaborative was established in 2006 in response
to a SHOT report. The report identified that 30-40% of wrong blood events
originated from hospital blood transfusion laboratories with a disproportionate
number of events occurring outside core hours (Serious Hazards of Transfusion,
2001, p.9). The Collaborative was formed between SHOT and the Institute of
Biomedical Sciences (IBMS), but extended to other key professional groups
involved in laboratory medicine.
The Collaborative has produced recommendations on minimum standards for
hospital transfusion laboratories, which address training, staffing, technology and
competency (Chaffe et al., 2009). The recommendations were intended to
encourage the effective and appropriate use of technology within the framework of
legislative requirements, help hospital trusts to achieve minimum standards of
proficiency set by the Health Profession Council (HPC) and meet the requirements
of Blood Safety and Quality Regulations (Blood Safety and Quality Regulations,
2005).The overall aim was to reduce blood transfusion laboratory errors by 50% in
three years. The impact on transfusion laboratories was monitored through existing
MHRA inspections and reporting to SHOT.
1.6.5. Better Blood Transfusion
The Better Blood Transfusion circular (Department of Health, 1998a) was sent to all
NHS Trusts in the UK that undertook blood transfusions. It asked them to
participate in the SHOT scheme and fulfil MHRA requirements for the reporting of
Serious Adverse Blood Reaction and Events (SABRE). It also emphasized the
need for training for laboratory staff and giving them the power to review requests
for blood transfusions in order to reduce the inappropriate use of blood.
18
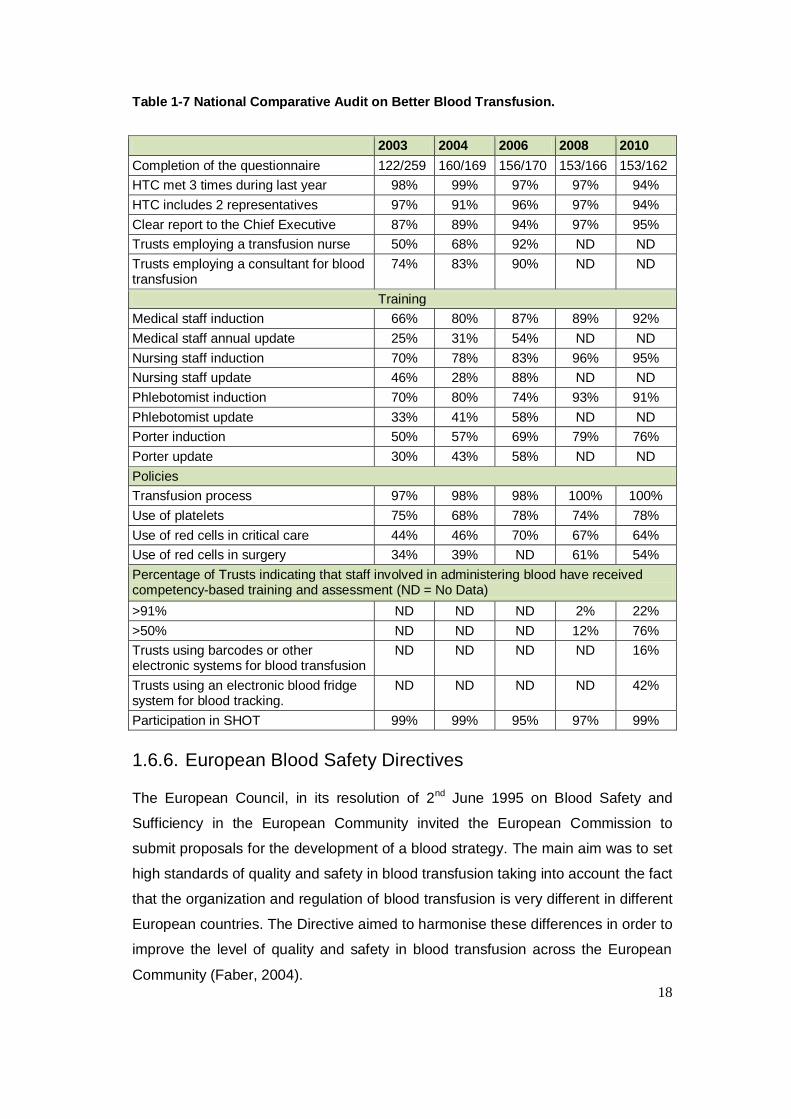
Table 1-7 National Comparative Audit on Better Blood Transfusion.
2003 2004 2006 2008 2010
Completion of the questionnaire 122/259 160/169 156/170 153/166 153/162
HTC met 3 times during last year 98% 99% 97% 97% 94%
HTC includes 2 representatives 97% 91% 96% 97% 94%
Clear report to the Chief Executive 87% 89% 94% 97% 95%
Trusts employing a transfusion nurse 50% 68% 92% ND ND
Trusts employing a consultant for blood transfusion
74% 83% 90% ND ND
Training
Medical staff induction 66% 80% 87% 89% 92%
Medical staff annual update 25% 31% 54% ND ND
Nursing staff induction 70% 78% 83% 96% 95%
Nursing staff update 46% 28% 88% ND ND
Phlebotomist induction 70% 80% 74% 93% 91%
Phlebotomist update 33% 41% 58% ND ND
Porter induction 50% 57% 69% 79% 76%
Porter update 30% 43% 58% ND ND
Policies
Transfusion process 97% 98% 98% 100% 100%
Use of platelets 75% 68% 78% 74% 78%
Use of red cells in critical care 44% 46% 70% 67% 64%
Use of red cells in surgery 34% 39% ND 61% 54%
Percentage of Trusts indicating that staff involved in administering blood have received competency-based training and assessment (ND = No Data)
>91% ND ND ND 2% 22%
>50% ND ND ND 12% 76%
Trusts using barcodes or other electronic systems for blood transfusion
ND ND ND
ND 16%
Trusts using an electronic blood fridge system for blood tracking.
ND ND ND ND 42%
Participation in SHOT 99% 99% 95% 97% 99%
1.6.6. European Blood Safety Directives
The European Council, in its resolution of 2nd June 1995 on Blood Safety and
Sufficiency in the European Community invited the European Commission to
submit proposals for the development of a blood strategy. The main aim was to set
high standards of quality and safety in blood transfusion taking into account the fact
that the organization and regulation of blood transfusion is very different in different
European countries. The Directive aimed to harmonise these differences in order to
improve the level of quality and safety in blood transfusion across the European
Community (Faber, 2004).
19
The European Union Directives (2002/98/EC and 2004/33/EC) set standards for
the quality and safety of blood collection and testing of human blood and blood
components. Directive 2002/98/EC began as the European Blood Directive
regulation. It covers the following areas:
a) Describes the content of the European Blood Directive, 2002/98/EC.
b) Describes the technical requirements addressed in the Directives to be
published as European Commission Directives.
c) This article also described the potential impact of the legislation related to
blood transfusion activities in the Member States of the European Union
and also on its strengths and weakness.
The European Blood Safety Directives became law in the UK on the 8th February,
2005 in the form of the Blood Safety and Quality Regulations 2005. The UK Health
Secretary is the designated competent authority for the Directive. The regulation
applies to the collection, testing, storage and distribution of blood and blood
component when they are intended to be used by humans.
1.6.7. UK Blood Safety and Quality Regulations
The Blood Safety and Quality Regulations 2005 require the full traceability of blood
and blood components from the point of receipt of the blood or blood components
by the hospital. The confirmed final destination of blood components received by
the site must be retained in a readily-available format, recoverable for thirty years.
The Medicine and Health Products Regulatory Agency (MHRA) was designated as
the competent authority in the UK under the legislation. The MHRA is a
government agency whose role is to enhance and safeguard the public‟s health by
ensuring that medicine and medical devices meets acceptable standards of safety
and they work. The MHRA aims to safeguard public health by:
Ensuring, through regulation, that medicine and devices have an acceptable
balance of risks and benefits.
Helping people to understand the benefits and risks of medicines and
devices.
Encouraging and helping the development of medicines and devices that
will contribute to health.
20
The regulations required that the competent authority ensure compliance with the
relevant regulations. To achieve this, the MHRA developed a compliance report
which all hospitals with blood banks must complete annually. Hospital blood banks
must provide details of their accreditation status, staffing levels, traceability and
quality management system within the department. The report is reviewed and an
on-site visit takes place if non-compliances are identified. The MHRA has also
established a system of reporting and recording transfusion-related incidents
known as Serious Adverse Blood Reactions and Events (SABRE).
1.6.8. Clinical audits and professional standards
The power of audits in the quality improvement process is well recognised, which is
reflected in the standards of a number of professional health organisations. The
Health Professions Council‟s Standards of Proficiency for Biomedical Scientists
(Health Professions Council, 2004) state that the skills required for application of
practice are:
“To be able to audit, reflect on and review practice you must understand the
principles of quality control and quality assurance, be aware of the role of audit and
review in quality management, including quality control, quality assurance and the
use of appropriate outcome measures, be able to maintain an effective audit trail
and work towards continual improvement, participate in quality assurance
programmes, where appropriate, understand the value of reflection on practice and
the need to record the outcome of such reflection and recognise the value of case
conferences and other methods of review.”
The General Medical Council’s Good Medical Practice states:
“You must work with colleagues and patients to maintain and improve the quality of
your work and promote patient safety. In particular, you must take part in regular
and systemic audit. take part in systems of quality assurance and quality
improvement and respond constructively to the outcome of audit, appraisals and
performance reviews, undertaking further training where necessary” (GMC,2011).
The Nursing and Midwifery Council’s standards of conduct, performance and
ethics (Nursing and Midwifery Council, 2009) requires registrants to provide a high
standard of practice and care at all times, and states,
21
“You must work with colleagues to monitor the quality of your work and maintain
the safety of those in your charge and also take part in appropriate learning and
practice activities that maintain and develop your competence and performance.
Traceability and identification management techniques increase interest in
healthcare is well emphasized.”
Some other performance management and improvement processes are:
The Healthcare Quality Improvement Partnership (HQIP)
NHS Litigation Authority Risk Management Standards
The Healthcare Commission
1.7. Transfusion safety
Although the potential untoward effects of blood transfusion have been recognized
almost since the practice began, no systematic data was collected for decades
despite the publication of several reports (Herve et al., 2000). The major steps in
the clinical transfusion process involve obtaining a patient sample, labelling it and
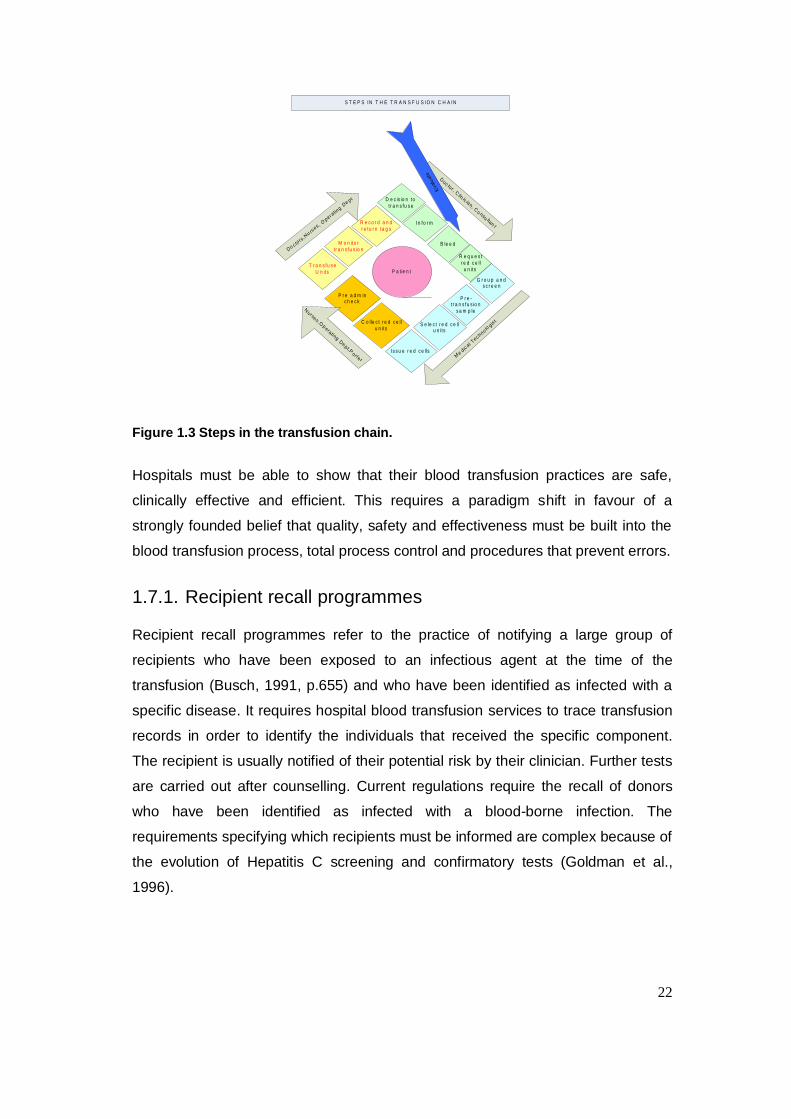
submitting it to the transfusion laboratory for cross-matching (Figure 1.3). The
intention is, “getting the right blood, to the right person, at the right place, at the
right time” (McClelland et al., 1996). Eliminating errors in matching patients with
their care is one of the key ways of improving safety. Although there are no
accurate figures on the frequency or cost of mismatching errors, research has
indicated that they form a significant proportion of healthcare errors (National
Patient Safety Agency, 2005).
22
D e c is io n to
t r a n s fu s e
In fo r m
B le e d
R e q u e s t
r e d c e ll
u n its
P r e -t r a n s fu s io n
s a m p le
G r o u p a n d s c r e e n
S e le c t r e d c e ll u n its
Is s u e r e d c e lls
C o lle c t r e d c e ll
u n its
P r e a d m in c h e c k
T r a n s fu s e
U n its
M o n ito r
t r a n s fu s io n
R e c o r d a n d
r e tu r n ta g s
P a t ie n t
Me
d ica l T
e c h n olo
g ist
Nu r se s ,O
pe ra t i n g
Dep t,P
o r te r
Do c to
r s, N
u rse s , O
p e r ati n
g D
e p t
S T E P S IN T H E T R A N S F U S IO N C H A IN
Do c to r , C
l in ic i an , C
o n su lta nt
Evalu
ate
Figure 1.3 Steps in the transfusion chain.
Hospitals must be able to show that their blood transfusion practices are safe,
clinically effective and efficient. This requires a paradigm shift in favour of a
strongly founded belief that quality, safety and effectiveness must be built into the
blood transfusion process, total process control and procedures that prevent errors.
1.7.1. Recipient recall programmes
Recipient recall programmes refer to the practice of notifying a large group of
recipients who have been exposed to an infectious agent at the time of the
transfusion (Busch, 1991, p.655) and who have been identified as infected with a
specific disease. It requires hospital blood transfusion services to trace transfusion
records in order to identify the individuals that received the specific component.
The recipient is usually notified of their potential risk by their clinician. Further tests
are carried out after counselling. Current regulations require the recall of donors
who have been identified as infected with a blood-borne infection. The
requirements specifying which recipients must be informed are complex because of
the evolution of Hepatitis C screening and confirmatory tests (Goldman et al.,
1996).
23
1.7.2. Methods to identify blood transfusion incidents
Human error is routinely blamed for accidents in healthcare. Humans tend to rush
to judgement following an incident and, all too often, blame the person most
associated with the accident. This prevents the discovery of the whole story (Cook,
Wood & Miller, 1998).
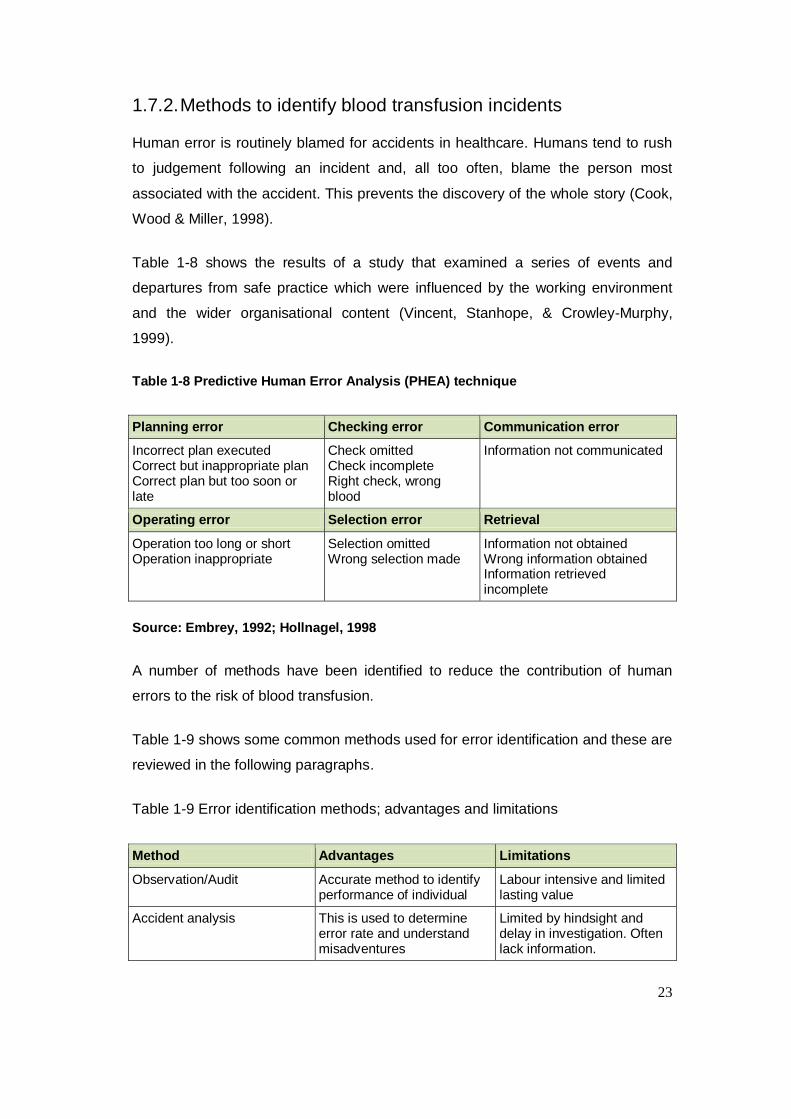
Table 1-8 shows the results of a study that examined a series of events and
departures from safe practice which were influenced by the working environment
and the wider organisational content (Vincent, Stanhope, & Crowley-Murphy,
1999).
Table 1-8 Predictive Human Error Analysis (PHEA) technique
Planning error Checking error Communication error
Incorrect plan executed Correct but inappropriate plan Correct plan but too soon or late
Check omitted Check incomplete Right check, wrong blood
Information not communicated
Operating error Selection error Retrieval
Operation too long or short Operation inappropriate
Selection omitted Wrong selection made
Information not obtained Wrong information obtained Information retrieved incomplete
Source: Embrey, 1992; Hollnagel, 1998
A number of methods have been identified to reduce the contribution of human
errors to the risk of blood transfusion.
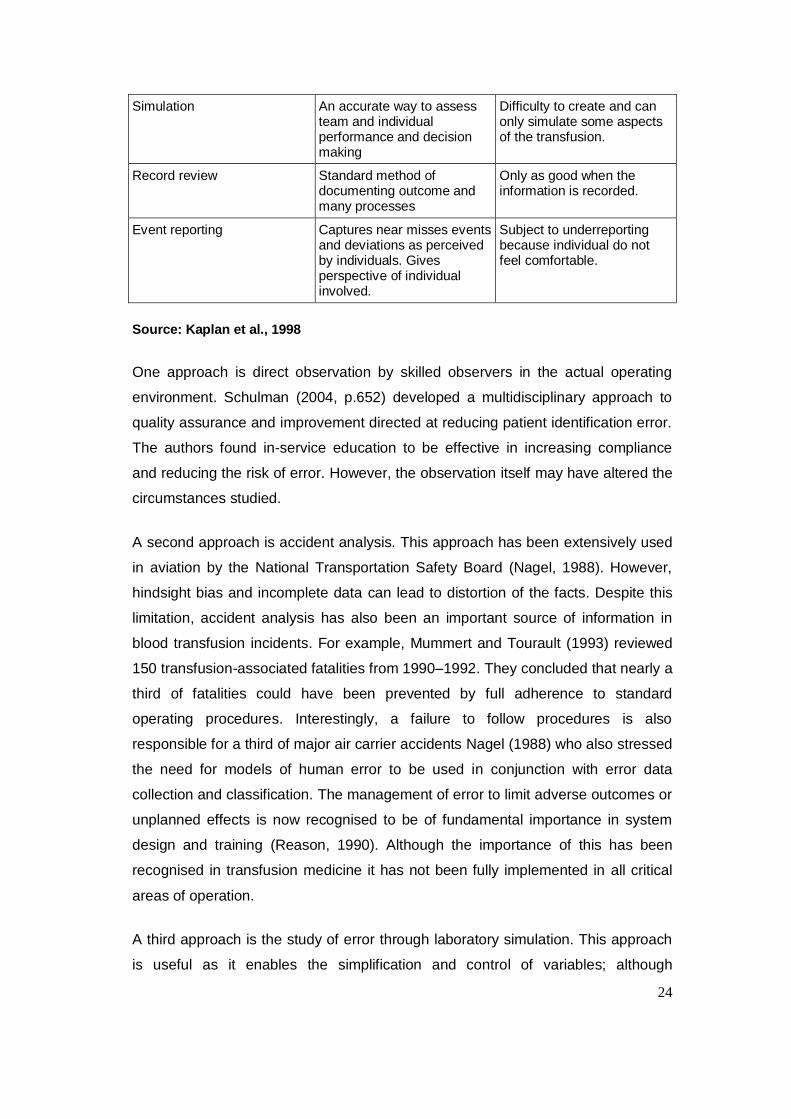
Table 1-9 shows some common methods used for error identification and these are
reviewed in the following paragraphs.
Table 1-9 Error identification methods; advantages and limitations
Method Advantages Limitations
Observation/Audit Accurate method to identify performance of individual
Labour intensive and limited lasting value
Accident analysis This is used to determine error rate and understand misadventures
Limited by hindsight and delay in investigation. Often lack information.
24
Simulation An accurate way to assess team and individual performance and decision making
Difficulty to create and can only simulate some aspects of the transfusion.
Record review Standard method of documenting outcome and many processes
Only as good when the information is recorded.
Event reporting Captures near misses events and deviations as perceived by individuals. Gives perspective of individual involved.
Subject to underreporting because individual do not feel comfortable.
Source: Kaplan et al., 1998
One approach is direct observation by skilled observers in the actual operating
environment. Schulman (2004, p.652) developed a multidisciplinary approach to
quality assurance and improvement directed at reducing patient identification error.
The authors found in-service education to be effective in increasing compliance
and reducing the risk of error. However, the observation itself may have altered the
circumstances studied.
A second approach is accident analysis. This approach has been extensively used
in aviation by the National Transportation Safety Board (Nagel, 1988). However,
hindsight bias and incomplete data can lead to distortion of the facts. Despite this
limitation, accident analysis has also been an important source of information in
blood transfusion incidents. For example, Mummert and Tourault (1993) reviewed
150 transfusion-associated fatalities from 1990–1992. They concluded that nearly a
third of fatalities could have been prevented by full adherence to standard
operating procedures. Interestingly, a failure to follow procedures is also
responsible for a third of major air carrier accidents Nagel (1988) who also stressed
the need for models of human error to be used in conjunction with error data
collection and classification. The management of error to limit adverse outcomes or
unplanned effects is now recognised to be of fundamental importance in system
design and training (Reason, 1990). Although the importance of this has been
recognised in transfusion medicine it has not been fully implemented in all critical
areas of operation.
A third approach is the study of error through laboratory simulation. This approach
is useful as it enables the simplification and control of variables; although
25
simplification may itself be an important shortcoming in understanding inherently
complex situations (Nagel, 1988). Taswell et al. (1974, p. 491) modified the
conditions of work by introducing known errors and provided positive feedback
when they were found. The blood transfusion department involved in the study not
only improved the detection rate of introduced errors, but also increased the
detection of real, previously undetected errors, from four in the first three months of
the study to 73 in the final three months.
A fourth approach to error identification is the review of records. This has been a
traditional way to perform quality assurance checks and document patient
outcomes. Patient records document actions performed and can highlight missing
information. The audit of records against predetermined criteria can be a valuable
way to identify errors or near misses. Classen et al. (1991, p.301) successfully
used a sophisticated automated hospital information and record system to identify
adverse drug events that would otherwise not have been reported.
A fifth approach is the event report, including self-reporting. In aviation, despite
excellent record keeping, human error is identified as a casual factor in more than
half of all airline accidents. More than 250,000 reports have been archived,
analysed and made available for research and study by interested professionals
and regulatory bodies (Nagel, 1988). This no-fault, confidential, voluntary, self-
reporting system enables pilots and controllers to report all non-calamitous
mistakes, including caught errors. Confidentiality and immunity from prosecution for
non-criminal acts are other important features of this or any system intended to
capture operational errors. The no-fault, confidential nature of the system has led to
an increased frankness in reporting and the provision of invaluable data (Classen
et al., 1991).
1.7.2.1 Haemovigilance
Haemovigilance provides information that is useful in the analysis of the various
causes of the untoward effects of blood transfusion. It provides reminders of known
protective measures and helps to identify new ones. Haemovigilance has also
helped to identify major technical, organizational and human errors. Table 1-10
Summary of the types of clinical errorsTable 1-10 is a summary of the various
types of clinical errors.
26
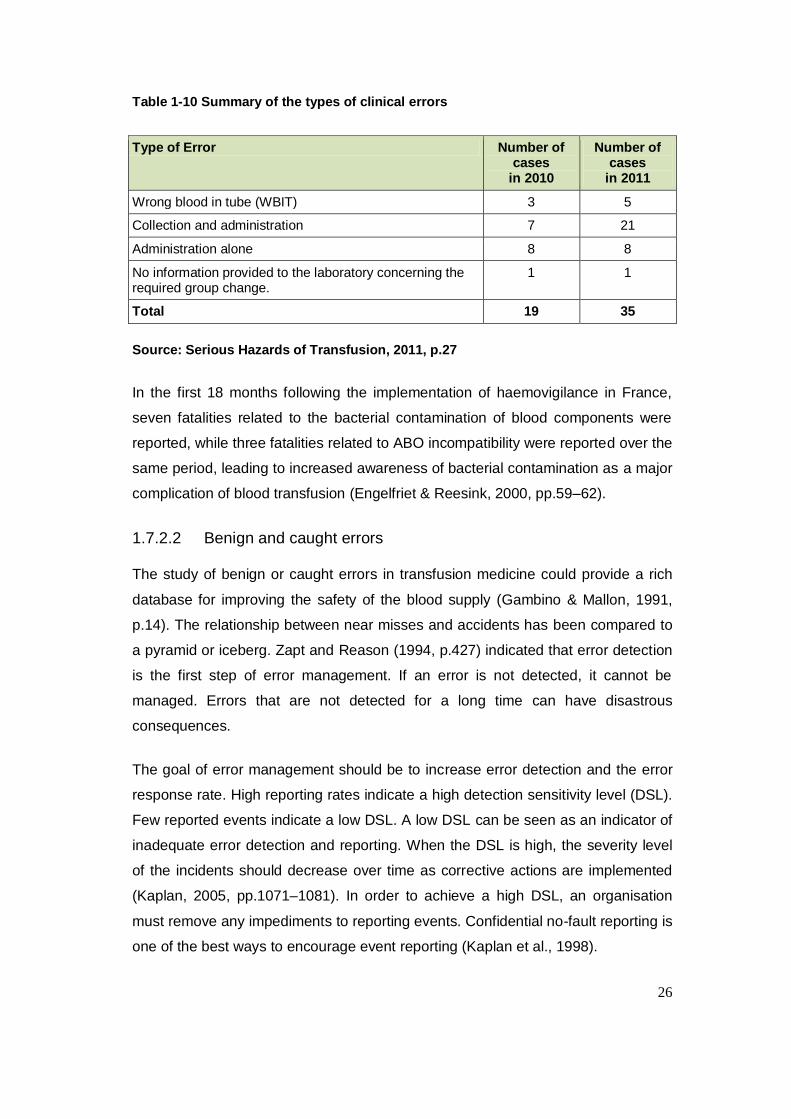
Table 1-10 Summary of the types of clinical errors
Type of Error Number of cases
in 2010
Number of cases
in 2011
Wrong blood in tube (WBIT) 3 5
Collection and administration 7 21
Administration alone 8 8
No information provided to the laboratory concerning the required group change.
1 1
Total 19 35
Source: Serious Hazards of Transfusion, 2011, p.27
In the first 18 months following the implementation of haemovigilance in France,
seven fatalities related to the bacterial contamination of blood components were
reported, while three fatalities related to ABO incompatibility were reported over the
same period, leading to increased awareness of bacterial contamination as a major
complication of blood transfusion (Engelfriet & Reesink, 2000, pp.59–62).
1.7.2.2 Benign and caught errors
The study of benign or caught errors in transfusion medicine could provide a rich
database for improving the safety of the blood supply (Gambino & Mallon, 1991,
p.14). The relationship between near misses and accidents has been compared to
a pyramid or iceberg. Zapt and Reason (1994, p.427) indicated that error detection
is the first step of error management. If an error is not detected, it cannot be
managed. Errors that are not detected for a long time can have disastrous
consequences.
The goal of error management should be to increase error detection and the error
response rate. High reporting rates indicate a high detection sensitivity level (DSL).
Few reported events indicate a low DSL. A low DSL can be seen as an indicator of
inadequate error detection and reporting. When the DSL is high, the severity level
of the incidents should decrease over time as corrective actions are implemented
(Kaplan, 2005, pp.1071–1081). In order to achieve a high DSL, an organisation
must remove any impediments to reporting events. Confidential no-fault reporting is
one of the best ways to encourage event reporting (Kaplan et al., 1998).
27
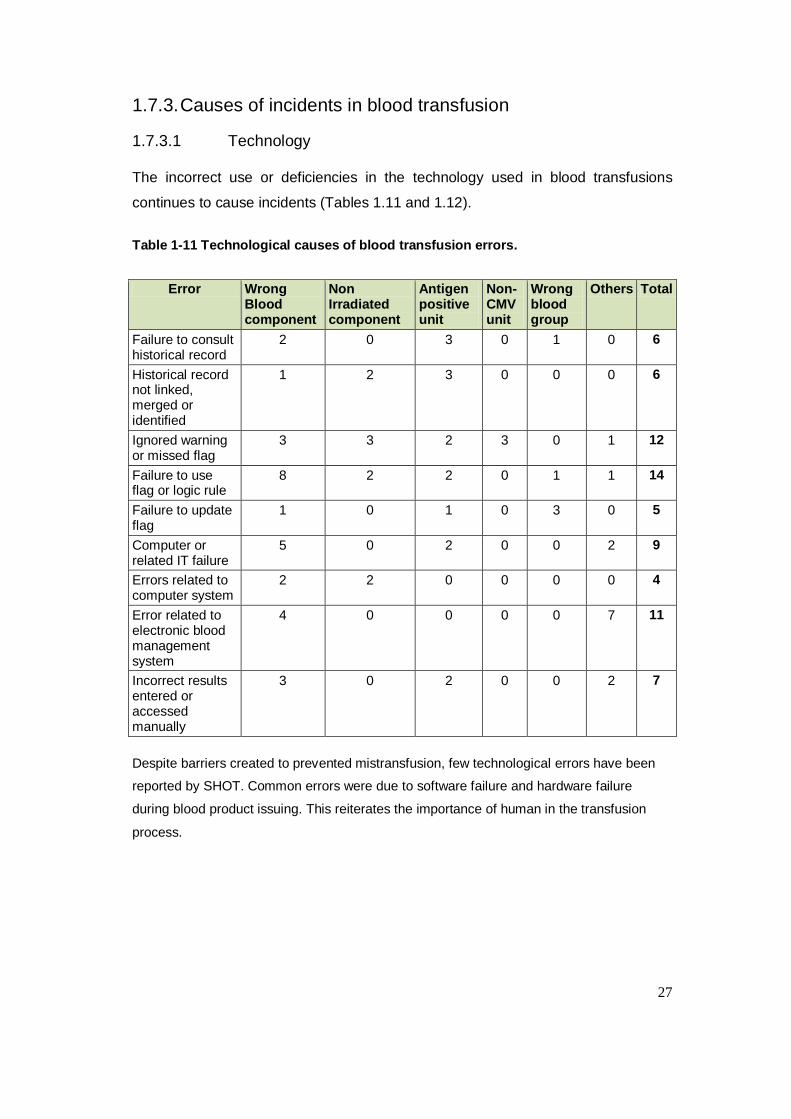
1.7.3. Causes of incidents in blood transfusion
1.7.3.1 Technology
The incorrect use or deficiencies in the technology used in blood transfusions
continues to cause incidents (Tables 1.11 and 1.12).
Table 1-11 Technological causes of blood transfusion errors.
Error Wrong Blood component
Non Irradiated component
Antigen positive unit
Non-CMV unit
Wrong blood group
Others Total
Failure to consult historical record
2 0 3 0 1 0 6
Historical record not linked, merged or identified
1 2 3 0 0 0 6
Ignored warning or missed flag
3 3 2 3 0 1 12
Failure to use flag or logic rule
8 2 2 0 1 1 14
Failure to update flag
1 0 1 0 3 0 5
Computer or related IT failure
5 0 2 0 0 2 9
Errors related to computer system
2 2 0 0 0 0 4
Error related to electronic blood management system
4 0 0 0 0 7 11
Incorrect results entered or accessed manually
3 0 2 0 0 2 7
Despite barriers created to prevented mistransfusion, few technological errors have been
reported by SHOT. Common errors were due to software failure and hardware failure
during blood product issuing. This reiterates the importance of human in the transfusion
process.
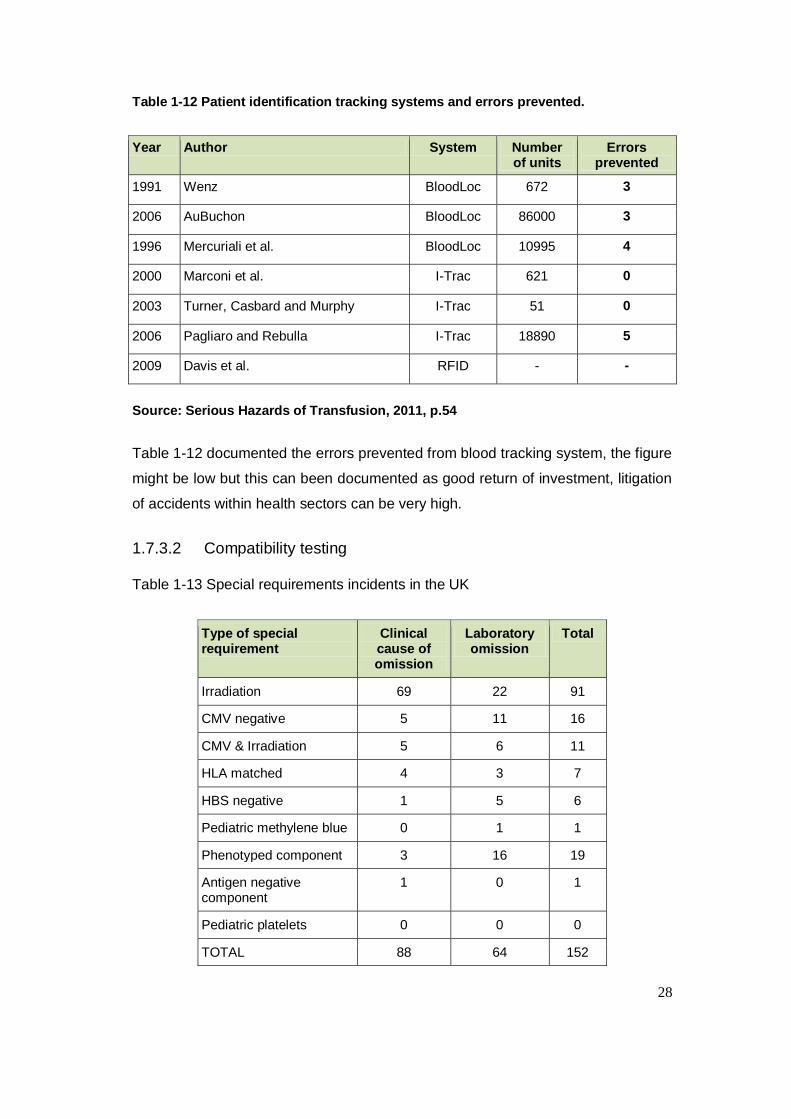
28
Table 1-12 Patient identification tracking systems and errors prevented.
Year Author System Number of units
Errors prevented
1991 Wenz BloodLoc 672 3
2006 AuBuchon BloodLoc 86000 3
1996 Mercuriali et al. BloodLoc 10995 4
2000 Marconi et al. I-Trac 621 0
2003 Turner, Casbard and Murphy I-Trac 51 0
2006 Pagliaro and Rebulla I-Trac 18890 5
2009 Davis et al. RFID - -
Source: Serious Hazards of Transfusion, 2011, p.54
Table 1-12 documented the errors prevented from blood tracking system, the figure
might be low but this can been documented as good return of investment, litigation
of accidents within health sectors can be very high.
1.7.3.2 Compatibility testing
Table 1-13 Special requirements incidents in the UK
Type of special requirement
Clinical cause of omission
Laboratory omission
Total
Irradiation 69 22 91
CMV negative 5 11 16
CMV & Irradiation 5 6 11
HLA matched 4 3 7
HBS negative 1 5 6
Pediatric methylene blue 0 1 1
Phenotyped component 3 16 19
Antigen negative component
1 0 1
Pediatric platelets 0 0 0
TOTAL 88 64 152
29
Source: Serious Hazards of Transfusion, 2011, p.134
1.7.3.3 Active and latent failures
Reason (1990) identified two major categories of failures or error that occur in a
complex system: active and latent. The distinction hinges on who initiated the
failure. Latent failures are the delayed-action consequences of technical designs or
organisational issues and decisions. They are often initiated at the upper levels of
the organisation. Active failures are committed by people in direct contact with
human/system interface. They are linked to human cognitive processes and
associated behaviours. Error researchers have stressed the importance of
examining both active and the underlying latent causes of system failures.
Rasmussen (1987, p.23) distinguishes the following types of human behaviour
underlying human error.
Skill-based behaviour: This refers to routine tasks requiring little or no
conscious attention during execution.
Rule-based behaviour: This refers to familiar procedures applied to frequent
decision-making situations.
Knowledge-based behaviour: This refers to problem-solving activities that
happen when confronted with a new situation for which no readily available
standard solution exists.
Most health professional operate in a skill-based behavioural mode for routine
tasks, from blood collection to the transfusion process (Kaplan et al., 1998). These
highly skilled activities become routine and can be executed without any thought.
Slips are unintended errors caused by either not doing part of the routine or being
distracted by someone. Slips can be prevented by the redesign of equipment and
procedures in ways that make it harder to make a slip. For example, feedback
mechanisms can be designed into the process that alerts individuals.
Rule-based behaviour involves recognising a situation and selecting the proper
routine or protocol. Mistakes happen under two conditions, either by selecting the
wrong rule for a given situation, or selecting the correct rule but carrying it out
incorrectly. Such failures can occur when someone carries out a procedure that
they are not trained or qualified to perform. Another example is inadequately
30
assessing the situation, for example failing to check the patient‟s identity before a
transfusion (Kaplan et al., 1998). Routine violations often occur when procedures
are changed and individuals continue to apply the old procedures. In some cases,
rule-based failures can be prevented by redesigning the task to force a procedure
to occur. An example would be a blood lock that prevents a transfusion starting
until the patient‟s identity has been matched to the blood product.
Knowledge-based behaviour involves solving unique problems or selecting a plan
of action in a new or unfamiliar setting. It often occurs with new employees who do
not have the knowledge to operate in a highly skilled mode and cannot draw upon
experience to select the appropriate rule or protocol to carry out the appropriate
task or solve a problem.
This suggests that the expert and the novice are likely to make different types of
errors. The expert is more likely to make a slip or an occasional rule-based error,
while the novice is more susceptible to knowledge-based failures. This is a strong
argument for assessing the performance of an individual when they move to a new
job or assume new responsibilities.
We can never eliminate human or active errors, but we can eliminate latent
technical or organisational aspects that may set people up for an active failure
(Reason, 1990). Reason refers to these as latent errors as organisational
pathogens, which wait to combine with the right active human failure to have an
adverse consequence. It is difficult to recognise a latent error or identify how it
might manifest in the future as there are so many possible outcomes of technical
and management decisions. However, since an event represents a fixed outcome,
one is often able to identify the causes of latent errors by reasoning backward from
the event. Once latent failures have been recognised, they can be diagnosed and
corrected before they combine with an active error to produce an unwanted
outcome.
Technical aspects associated with latent failures include such things as equipment
design, software and mobile and material facilities. Organisational aspects stem
from normal management responsibilities, which include the structure of the
organisation, planning and scheduling, forecasting, budgeting and allocating
resources.
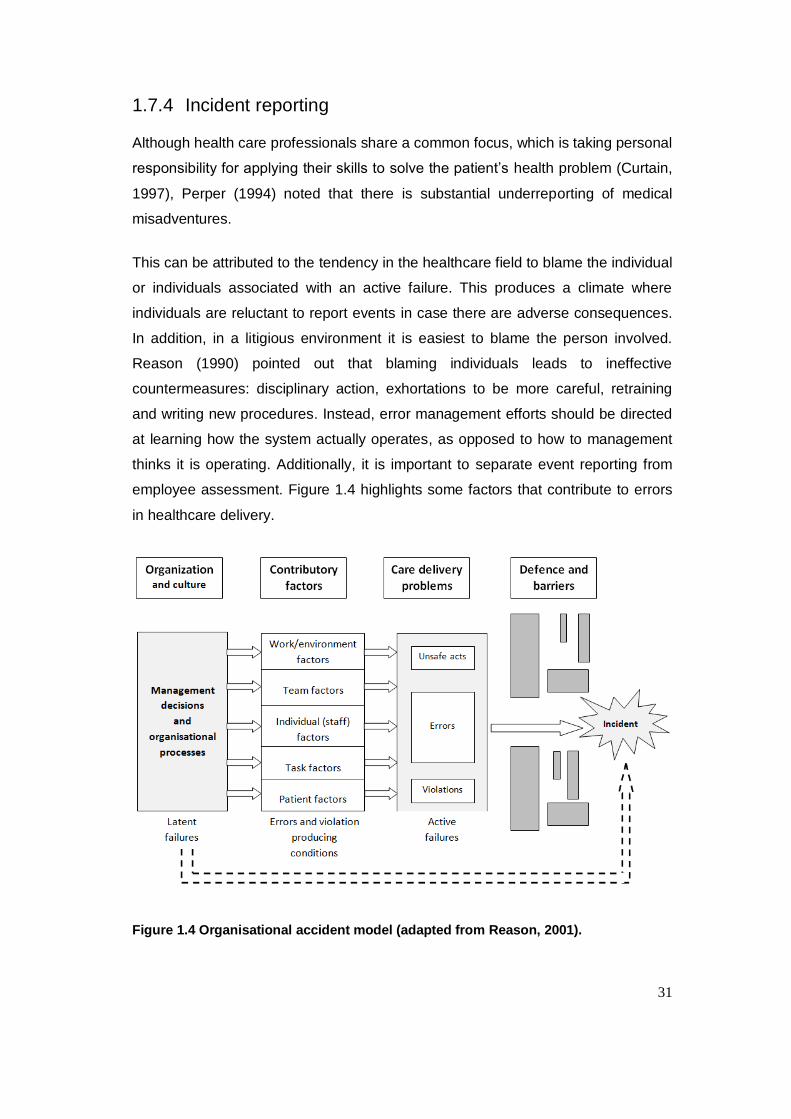
31
1.7.4 Incident reporting
Although health care professionals share a common focus, which is taking personal
responsibility for applying their skills to solve the patient‟s health problem (Curtain,
1997), Perper (1994) noted that there is substantial underreporting of medical
misadventures.
This can be attributed to the tendency in the healthcare field to blame the individual
or individuals associated with an active failure. This produces a climate where
individuals are reluctant to report events in case there are adverse consequences.
In addition, in a litigious environment it is easiest to blame the person involved.
Reason (1990) pointed out that blaming individuals leads to ineffective
countermeasures: disciplinary action, exhortations to be more careful, retraining
and writing new procedures. Instead, error management efforts should be directed
at learning how the system actually operates, as opposed to how to management
thinks it is operating. Additionally, it is important to separate event reporting from
employee assessment. Figure 1.4 highlights some factors that contribute to errors
in healthcare delivery.
Figure 1.4 Organisational accident model (adapted from Reason, 2001).
32
Blood transfusion safety can be improved if errors (that are an indication of a weak
system) can be identified before they result in an adverse outcome for a donor or
patient. It is also important to avoid assigning blame when an error is identified, and
to instead find the root causes of the error.
1.7.4.1 Barriers and limitations to incident reporting
Under-reporting of incidents is a widespread problem in the healthcare sector
(Murff et al., 2003). The key factor highlighted by many authors is that the fear of
reporting prevents the organisation from learning from the events and improving
practices. Research in the healthcare and other industries has indicated that
unjustified negative consequence have discouraged members of staff from
reporting incidents. The non-punitive approach taken by the aviation industry has
been a significant contributory factor to their impressive safety record in recent
years (Vincent, Stanhope, & Crowley-Murphy, 1999). In 2004, the National Patient
Safety Agency highlighted that the creation of strong safety culture in the
healthcare system was necessary. They indicated that timely feedback and
recommendations were essential to improved practice (National Patient Safety
Agency, 2004).
1.7.4.2 Overcoming the barriers to incident reporting
High levels of reporting are a mark of high-reliability organisation. Research shows
that Trusts in the UK with a high level of incident reporting are more likely to
demonstrate a safety culture (National Patient Safety Agency, 2006). The
involvement off all members of staff in the organisation can overcome under-
reporting. Staff members need to be provided with opportunities to reflect on
practices in a multidisciplinary environment in order to become less fearful and give
management an insight into the origins of incidents. More importantly, event
analysis should be carried out with the members of staff who were involved in the
incident, supported by a facilitator (Murff et al., 2003). Regulatory bodies and the
health service have developed various reporting systems, although it is doubtful
whether these reporting systems have in fact been utilised for organisational
learning or to improve practice.
33
1.7.5 Hazards of poor traceability compliance
There is a lack of appreciation of the complexity of the traceability pathway.
Traceability is poorly understood and inadequately controlled in many cases. The
level of safety, efficacy and quality of blood products must be maintained and
optimised on an on-going basis. The only real test of effectiveness tends to be in
live situations when an adverse event has occurred and needs to be handled
urgently. In such situations traceability has often found to be wanting with long
delays in tracing products and identifying recipients (Ashford, 2006).
Traceability is defined by three distinct elements. These are: the initial prescription
of blood components, the distribution sheet stating the name of the recipient and
the return of this sheet to the transfusion centre when the procedure is completed.
The prescription, distribution and transfusion of blood components is a complex
process within the transfusion chain, traceability compliance explores the quality
management system of the process.
1.7.5.1 The problems
In 2007 the National Health Service issued the Health Service Circular „Better
Blood Transfusion 2007‟, which outlined detailed actions to be taken by Trusts,
NHS Blood and Transplant (NHSBT) and clinicians to improve transfusion practice
(Department of Health, 1998a). In 2008 a national audit was carried out using an
online survey. The survey showed that 60% of Trusts in the UK had implemented
blood usage policies, 12% of Trusts had only assessed half of their staff and 13
Trusts administered less than 10% of transfusions using technology.
In 2001, an audit tool was developed for blood transfusion practice in a joint
collaboration between the Royal Colleges and specialist blood transfusion
societies. Fifty hospitals participated in the audit. The audit showed that 21% did
not provide training to staff members in blood administration procedures and there
was no wristband policy for patient identification at 11% of hospitals. While 80% of
hospitals had compatibility reports attached to the patient‟s prescription chart only
59% recorded the patient‟s pulse. The audit demonstrated considerable variations
in standard procedures in relation to blood transfusion administration. However, it
was difficult to draw valid conclusions as over half of hospitals failed to participate
and patient selection was different at different hospitals.
34
In 2003, the National Patient Safety Agency commissioned a study of manual
checking processes and the use of technologies in matching patients with blood
(National Patient Safety Agency, 2004). The evidence revealed failures in the use
of wristbands. An audit conducted at Guy‟s and St. Thomas Hospital identified that
34% of patients were not wearing a wristband.
Murphy and Kay (2004) looked at the extent of errors in many aspects of
healthcare, including blood transfusion. Their review addressed issues of
procedural errors and patient identification. The transfusion of blood to the wrong
patient has been identified as the most important hazard. The risk of mistransfusion
was found to be greater than the risk of transmission of HIV or HCV (Dzik, 2002,
p.1190). The mistransfusion of blood products typically results from errors made
during bedside checks prior to the transfusion (Sazama, 1990, p.583); this study
estimated mistransfusion to occur at a rate of 1 in 12,000 units. Similar results were
reported by Robillard, Chan and Kleimann (2004, p. 95) in Quebec. Moreover, they
estimated that the incidence of mistransfusion was probably even higher due to the
failure to recognise many errors. Another review by Pagliaro and Rebulla (2006,
p.98), noted that errors in the blood transfusion chain seem to occur at a rate of 1
in 1,000 events and the data probably underestimated the magnitude of failures,
not least because only one-third of errors have clinically significant consequences
(Steinbrook, 2002, p.1758).
Finally, a Belgian study (Baele et al., 1994, p.117) uncovered numerous instances
of mistransfusion that went unrecognised. When active tracking was introduced,
they estimated that 1 in 400 units were mistransfused and the true frequency of
some form of error in bedside blood administration was 30 times higher than rates
reported using passive systems.
1.7.5.2 Potential solutions
Such studies have prompted the development of simple and effective
methodologies to ensure correct patient identification in transfusion processes
(Goodnough & Spence, 2003, p.161). The first positive donor-recipient
identification study was described by Chambers et al. (1973, p.34). Since then, the
main strategies that have been developed include the appointment of a transfusion
safety officer, regular training, skills assessments, system re-engineering and the

35
introduction of standard operating procedures (Shulman, Saxena & Ramer, 1999,
p.595).
In addition to these organisational strategies, technology derived from industry and
commerce has been incorporated into the blood transfusion chain. The ultimate
purpose of these systems is to make the right and wrong actions easy and difficult
respectively (Kohn, Corrigan & Donaldson, 1999).
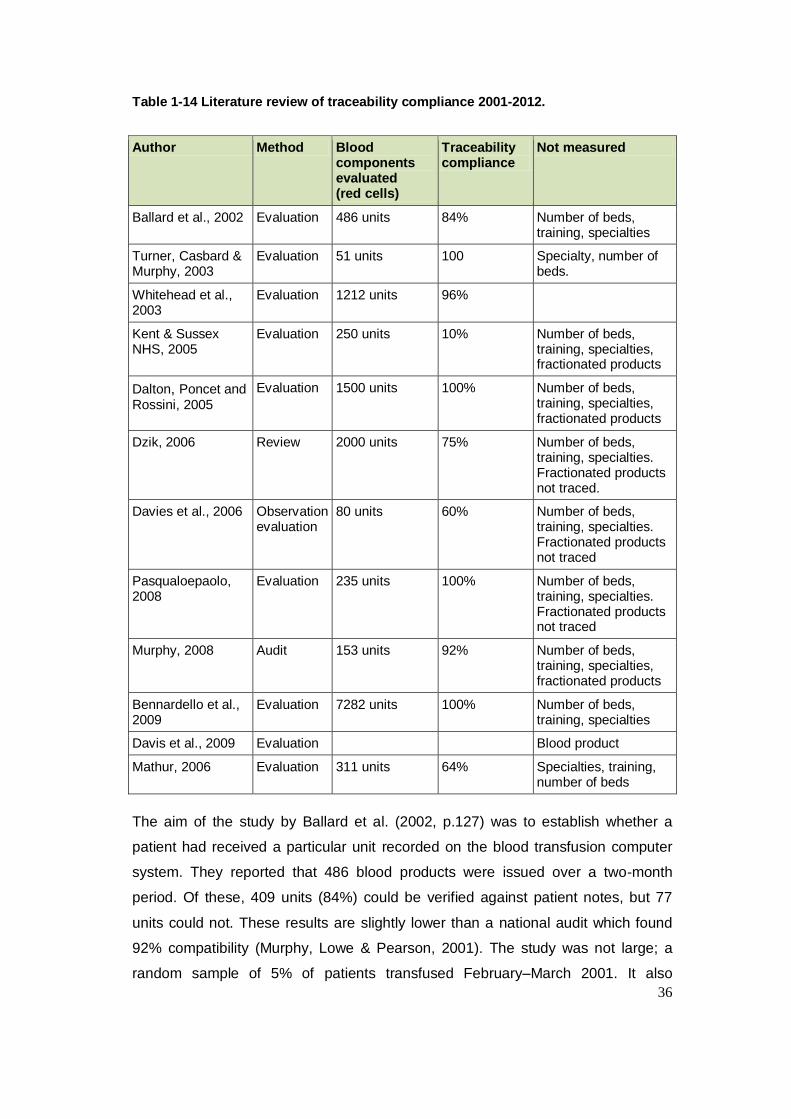
36
Table 1-14 Literature review of traceability compliance 2001-2012.
Author Method Blood components evaluated (red cells)
Traceability compliance
Not measured
Ballard et al., 2002 Evaluation 486 units 84% Number of beds, training, specialties
Turner, Casbard & Murphy, 2003
Evaluation 51 units 100 Specialty, number of beds.
Whitehead et al., 2003
Evaluation 1212 units 96%
Kent & Sussex NHS, 2005
Evaluation 250 units 10% Number of beds, training, specialties, fractionated products
Dalton, Poncet and Rossini, 2005
Evaluation 1500 units 100% Number of beds, training, specialties, fractionated products
Dzik, 2006 Review 2000 units 75% Number of beds, training, specialties. Fractionated products not traced.
Davies et al., 2006 Observation evaluation
80 units 60% Number of beds, training, specialties. Fractionated products not traced
Pasqualoepaolo, 2008
Evaluation 235 units 100% Number of beds, training, specialties. Fractionated products not traced
Murphy, 2008 Audit 153 units 92% Number of beds, training, specialties, fractionated products
Bennardello et al., 2009
Evaluation 7282 units 100% Number of beds, training, specialties
Davis et al., 2009 Evaluation Blood product
Mathur, 2006 Evaluation 311 units 64% Specialties, training, number of beds
The aim of the study by Ballard et al. (2002, p.127) was to establish whether a
patient had received a particular unit recorded on the blood transfusion computer
system. They reported that 486 blood products were issued over a two-month
period. Of these, 409 units (84%) could be verified against patient notes, but 77
units could not. These results are slightly lower than a national audit which found
92% compatibility (Murphy, Lowe & Pearson, 2001). The study was not large; a
random sample of 5% of patients transfused February–March 2001. It also
37
highlighted inconsistencies in documentation. Although the blood bank kept records
of the issue of blood components, they did not know the ultimate destination of the
blood, unless it was returned to them. The only proof that a specific unit had been
transfused to a patient lay in the patient‟s notes. This study did not identify or
describe the problem across different medical specialities.
Turner, Casbard and Murphy (2003) carried out a retrospective study. A total of 51
blood units were audited before and after the introduction of barcode patient
identification. The baseline data showed that only 14% of patients were asked to
verbally identify themselves before the administration of blood. Twelve per cent of
patients were not wearing their identification wristband when identification checks
were carried out. Non-compliance was shown to be particularly related to poor
checking of special blood requirements; proper procedures were followed in only
41% of cases. Furthermore, the study highlighted that there was no audible
communication between staff members and the patient in relation to special blood
requirements. After the introduction of barcode technology patients were asked to
state their surname and forename and 96% of patients with special requirements
had these matched to information on the blood bag. However, the barcode
technology did not guarantee that all the necessary steps had been carried out as
individuals could indicate that they had carried out checks when in fact they had
not. This study also did not identify the particular medical area.
Whitehead et al. (2003) conducted a survey of 500 sets of patient notes. A total of
1,212 blood components were issued and 47 labels were found to be missing.
Nursing staff in the clinical area were asked to assess a new system that used
peel-off labels to be stuck in patient notes. Almost all respondents preferred the
new system and found the labels easy to use. Other initiatives to improve the
safety of the blood transfusion process included an improved blood collection
protocol and staff training by a transfusion nurse.
Davies et al. (2006) carried out an extended evaluation of an electronic blood
collection system based on barcode technology. Practices were evaluated before
and after its introduction in cardiac surgery. The baseline audit showed that patient
documentation was brought to the refrigerator in 84%, 40% and 10% of collections
from the main blood bank, theatre and the cardiac rehabilitation unit refrigerators
respectively. Following the introduction of the electronic process, this increased to
38
95%, 90% and 100% respectively. The study estimated that there were 23 steps in
the collection of blood before the implementation of the electronic process; this was
reduced to nine.
The baseline audit demonstrated that there was very poor documentation of the
date and time of transfusion and the number of units transfused. Observation of
practices before implementation of the new procedures revealed that almost all the
key steps in the transfusion process were not carried out correctly. The design of
the electronic process highlighted the complexity of the transfusion process, which
was identified as a problem. Another problem was improved training to avoid over-
reliance on the technology for the patient identification. A further weakness was
that nursing staff were not required to enter any observations during and after the
transfusion.
The study highlighted that the main reason for introducing electronic checking was
that checking procedures were not being carried out correctly. However, the
authors pointed out that total reliance the electronic system was also undesirable
as the system was likely to fail from time to time. The study concluded that
technology should not be used to take over thinking and that it was vital not to
underestimate the role of education, training, and continued support.
A study by Davies et al. (2006, p.361) observed that traceability compliance was
poor in some clinical areas because of the complexity of the transfusion chain and
procedures. There were many steps in the requesting, matching, delivering and
transfusing of blood products that involved a number of different departments and
staff of different grades.
A pilot study at San Raffaele Hospital in Milan by Dalton, Poncet and Rossini
(2005) used radiofrequency identification (RFID). Blood donors were given a RFID
wristband and a label was placed on their donor unit at the time of donation. Later,
at the time of transfusion, the data on the wristband and the blood unit were
compared at the bedside using a handheld RFID reader. The reader communicated
with the hospital computer via a hospital-wide wireless network. Users of this
device reported that they were 27% more productive and no errors were observed
during the pilot. Although it was difficult to measure the impact of the technology as
39
only data estimates were collected prior to the study, 70% of staff commented that
the system had dramatically reduced their fear of making errors.
Another pilot study at Maidstone Hospital in Kent used a questionnaire to evaluate
a new labelling system. Seventy-nine per cent of respondents agreed that the
labels were easy to use, although the poor response rate made it impossible to
draw robust statistical conclusions from the analysis (NPSA,2006).
Salmi, Azanowsky and Perez (1997, pp. 964–974) highlighted that data gathered
from alert systems must be carefully interpreted to minimise bias. While Battle et al.
(1998) emphasized that the characteristics of a good vigilance system should
include no-fault reporting. They recommended that the donation number for blood
and blood components and batch products for pooled blood products should be
specifically recorded on the transfusion record. They also recommended the
establishment of national documentation standards.
Other solutions have been proposed to the problem of ensuring that the correct
blood unit is given to the patient. They include paper-based systems (Lau et al.,
2000), mechanical systems (AuBuchon & Littenberg, 1996) and electronic systems
(Norfolk, 2000). Dzik (2003) discussed technological approaches. The study
highlighted that reductions in transfusion-related, knowledge-based errors
depended on increased knowledge, more informed decision making and enhanced
feedback. It also noted that reductions in slip errors was a problem ideally suited to
machine-readable identification systems. Consolidated methodologies include
biometric technologies, such as fingerprint identification, facial and vocal
recognition (Ashbourn, 2004). Some of these technologies are not readily
applicable to the field of medicine and surgery.
1.7.5.3 Conclusions
Although considerable effort has been devoted to improving traceability compliance
following the introduction of national regulations,guidelines and mechanical barriers
to prevent mistransfusion Davies et al. (2006), the literature review did not reveal
any clear procedure for achieving it. The studies described in the previous sections
suggest that the traceability of blood products is a problem in all hospital
transfusion laboratories. Dzik (2006) and Murphy, Stearn and Dzik (2004) suggest
40
that training and education might improve matters. Bennardello et al. (2009) and
Pagliaro and Turdo (2008) also agreed that mechanical intervention may help.
However, none of these approaches attempted to assess the impact of ward size,
speciality, training, traceability methods or volume of transfusion. There were
considerable variations in the population and sampling criteria used in the various
studies, and weaknesses in the audit tools. The articles reviewed also varied in
quality and relevance. Most studies did not describe how fractionated products
were traced from the donor to the recipient and none of them evaluated the
variables that may affect traceability compliance, such as blood product usage by
different specialities.
The design of some the studies was not explained which may have affected the
results obtained. Other studies highlighted the problem before the introduction of
the new model or simply explained improvements in traceability compliance.
(Murphy and colleagues 2003), However, identified in their study tha the barcode
technology did not guarantee that all the necessary steps had been carried out and
the system can be overridden.
These findings justified the need of further investigation into why traceability
compliance was poor within the Trust and why some wards were more compliant
than others and the associated risk factors. While patients may be the victims of
human errors, members of staff can be the targets and casualties of systems that
are highly error-prone this will mostly contradict the research conducted by
(NPSA,2006) that demonstrated that Trusts in the UK with a high level of incident
reporting are more likely to demonstrate a safety culture (National Patient Safety
Agency, 2006).
1.8 Proposed programme of research
The literature review had revealed weakness in traceability procedures in the
healthcare sector and looked at some reasons why compliance is poor is some
areas. In some Trusts, considerable effort has been devoted to improving training,
redesigning electronic systems and proper patient identification before and after
41
transfusion. However, none of these approaches have fully addressed the
complexity of the transfusion chain which involves different specialities and staff.
Mandatory requirements introduced by European legislation, clinical governance
and patient safety concerns made this project necessary. There is a need for
further exploration and better understanding of the issues surrounding traceability. I
have some identified some that are realistic within the scope of this study. The
findings from this study will provide new knowledge and understanding of these
challenging problems.
1.8.1 Research aim and objectives
The overall aims of the project were to establish why traceability compliance was
poor in the Homerton University NHS Trust, to implement changes to improve
traceability compliance and to ensure that hospital wards complied with traceability
procedures. Compliance was also expected to identify blood distribution and
administration within the Trust.
1.8.1.1 Objectives
The study‟s objectives were as follows:
i. To undertake a six year cohort study to identify the risk factors of
traceability compliance for blood products within all wards of the Homerton
University Hospital NHS Trust and identify the processes that lead to poor
compliance.
ii. To select an appropriate traceability model and labelling procedure for
blood products within the Homerton University Hospital NHS Trust.
iii. To evaluate the subsequent intervention.
iv. To evaluate impact and direct cost and saving blood products.
v. To examine the transferability of this evaluation and reflect on the impact on
practice.
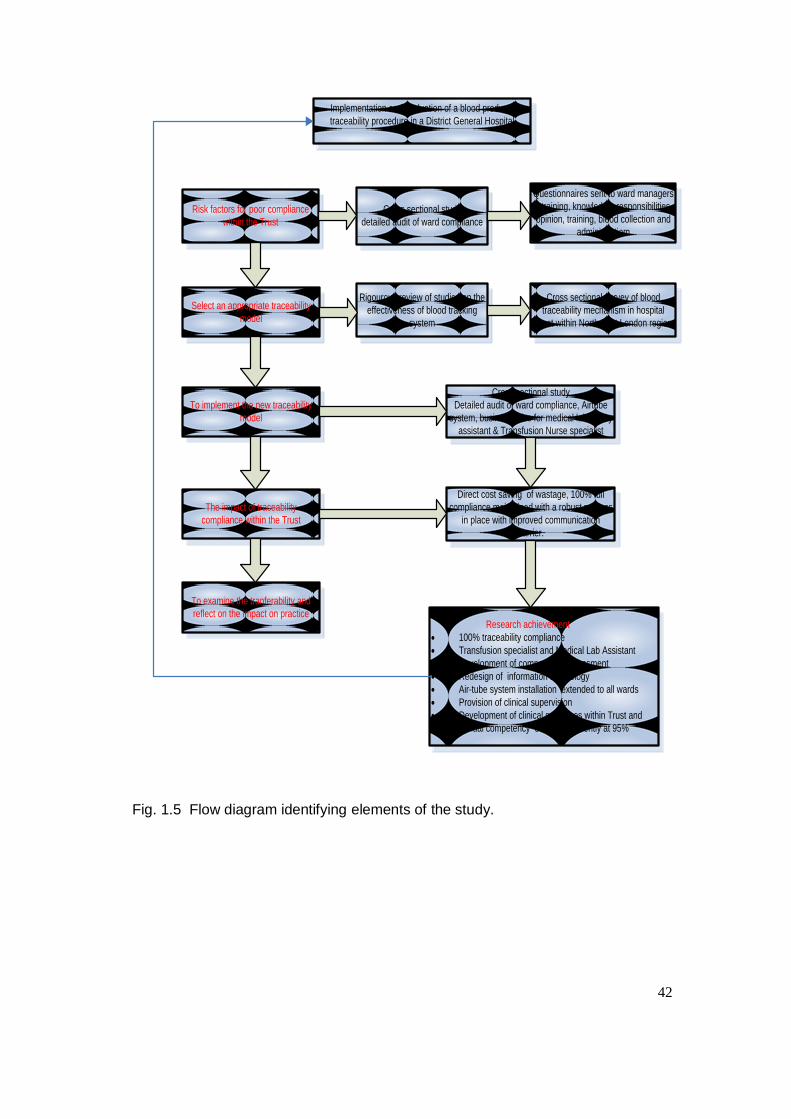
42
Cross sectional study
detailed audit of ward compliance
Questionnaires sent to ward managers
– training, knowledge, responsibilities,
opinion, training, blood collection and
administratiom
Risk factors for poor compliance
within the Trust
Select an appropriate traceability
model
To implement the new traceability
model
The impact of traceability
compliance within the Trust
Rigourous review of studies on the
effectiveness of blood tracking
system
Cross sectional survey of blood
traceability mechanism in hospital
Trust within North East London region
Cross sectional study
Detailed audit of ward compliance, Airtube
system, business case for medical laboratory
assistant & Transfusion Nurse specialist
Implementation and evaluation of a blood products
traceability procedure in a District General Hospital
Direct cost saving of wastage, 100% full
compliance maintained with a robust process
in place with improved communication
barrier.
To examine the tranferability and
reflect on the impact on practice Research achievement
100% traceability compliance
Transfusion specialist and Medical Lab Assistant
Development of competency assessment
Redesign of information technology
Air-tube system installation extended to all wards
Provision of clinical supervision
Development of clinical guidelines within Trust and
annual competency of staff is currently at 95%
Fig. 1.5 Flow diagram identifying elements of the study.
43
2 Traceability compliance assessment (Method 1)
This chapter describes the situation in Homerton University Hospital NHS Trust
with respect to compliance with traceability requirements for blood products at the
beginning of the study. It also identifies the processes associated with poor levels
of compliance. The information gathered and the analyses carried out in this phase
of the project provided the basis for the development of the modified traceability
system described in Chapter 4.
This stage of the project took place from 2005-08. At this time the Trust had
implemented a paper-based traceability method and paperwork was transported by
porters (referred to as Method 1).
Compliance was evaluated in two phases. In phase 1, traceability compliance was
calculated as the number of blood units successfully traced as a percentage of all
units issued from the blood stock fridge. The second phase looked at the potential
causes of poor compliance. Data was collected on the communication of the
traceability procedure to ward managers, access to training and the communication
of audit results to the wards. A statistical analysis of the data made it possible to
estimate the risk factors that influenced ward compliance rates within the Trust See
Table 2-1. Furthermore, a structured observation tool evaluated the compliance of
a sample of ward staff with the following procedures:
i. Blood collection at the blood stock fridge.
ii. Ward bedside checking procedures.
The Trust is a 500 beds hospital, medium size teaching hospital and offers many
services that require high amounts of blood transfusion in the Accident and
Emergency (A/E), Special Care Baby Unit (SCBU), Medical Day Unit (MDU),
Delivery Suite (DEL) and Acute Care Unit (ACU). Biomedical scientists routinely
carry out pre-transfusion testing prior to the issue of blood products and
transfusions are subsequently carried out on the wards or theatre by nursing staff.
Since 2005, an average of 6,000 red blood cells have been transfused annually.
44
Transfusion compatibility labels had been modified by the Hospital Transfusion
Team prior to the implementation of the European Union Directive (Blood Safety
and Quality Regulation, 2005) to include the date, time of transfusion and
signatures of nurses. Following each transfusion the ward nurse was responsible
for removing the empty blood bag and completing the information on the label.
Finally, the completed labels were placed in a Perspex box marked “returned
transfused tags”.
Hospital porters visited the wards on a daily basis to collect and return labels to the
laboratory. Data from the ward (date and time of transfusion) was entered into the
blood transfusion computer system by the medical laboratory assistant. Data was
compiled on a monthly basis and sent to the respective wards.
2.1.1 Phase one: Quantitative assessment of traceability compliance
2.1.1.1 Ethics
The hospital‟s local Research and Ethics division confirmed that the project did not
require ethical approval by a NHS Research Ethics Committee or the Trust‟s
research and development department; however approval was needed from the
Trust‟s clinical governance committee. Appendix 2 is a copy of the approval
document.
2.1.1.2 Method
Data about patient blood transfusions was gathered and reviewed after every
transfusion and the subsequent discharge of the patient. The data was extracted
from the blood transfusion information system and consisted of the final destination
of all transfused blood that could be traced and all the blood units assumed to have
been transfused (where tags were missing or labels had been destroyed). The final
traceability compliance was calculated as the number of units successfully traced
as a percentage of the total units issued.
All wards with more than two transfusion episodes per week were eligible for
inclusion in the study. Others, with less than two transfusion episodes per week
were excluded because their patients would eventually be transferred to other
45
wards. Participation in the study was voluntary. I extracted data for each ward from
the blood transfusion laboratory information system on a monthly basis.
Compliance was calculated as the total number of units where the final destination
could be traced (T) divided by the total of number of blood units issued (I)
expressed as percentage.
I implemented a database to record all the units transfused and calculated the
percentage compliance using the Statistical Package for Social Sciences (SPSS,
2010) software.
Descriptive statistics were used to determined the mean and standard deviation of
the annual compliance rate for each ward. Variance analysis determined whether
the frequency of transfusion was a predictor of compliance at a ward level. Wards
were categorized into three groups according to blood usage. Those that
consumed less than 500 units were grouped as low users, medium users
transfused 500-1200 blood units and those that transfused over 1201 blood units
were grouped as high users.
2.1.1.3 Results
The compliance data was normally distributed from 2005-08, the average
traceability compliance ranged from 50 – 90% (see Table 2-1 below). The overall
mean compliance for the entire period for all wards was 72% with a standard
deviation of 10.4.
2.1.1.1 Results
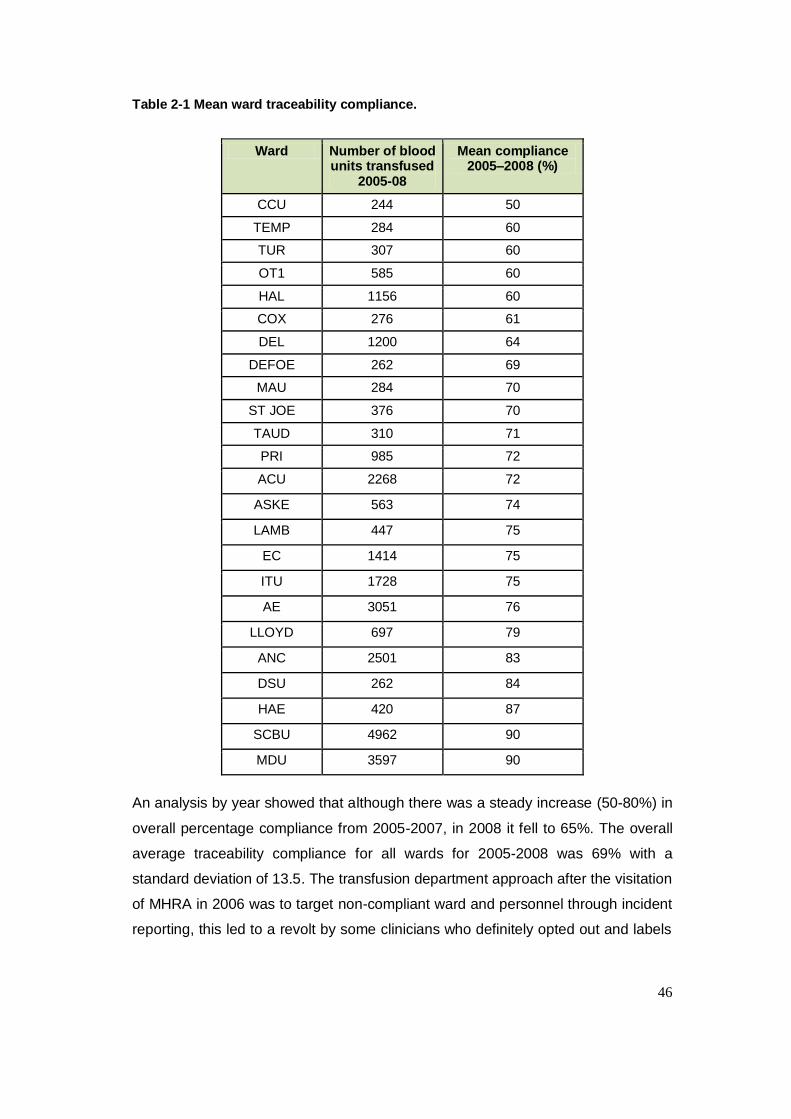
46
Table 2-1 Mean ward traceability compliance.
Ward Number of blood units transfused
2005-08
Mean compliance 2005–2008 (%)
CCU 244 50
TEMP 284 60
TUR 307 60
OT1 585 60
HAL 1156 60
COX 276 61
DEL 1200 64
DEFOE 262 69
MAU 284 70
ST JOE 376 70
TAUD 310 71
PRI 985 72
ACU 2268 72
ASKE 563 74
LAMB 447 75
EC 1414 75
ITU 1728 75
AE 3051 76
LLOYD 697 79
ANC 2501 83
DSU 262 84
HAE 420 87
SCBU 4962 90
MDU 3597 90
An analysis by year showed that although there was a steady increase (50-80%) in
overall percentage compliance from 2005-2007, in 2008 it fell to 65%. The overall
average traceability compliance for all wards for 2005-2008 was 69% with a
standard deviation of 13.5. The transfusion department approach after the visitation
of MHRA in 2006 was to target non-compliant ward and personnel through incident
reporting, this led to a revolt by some clinicians who definitely opted out and labels
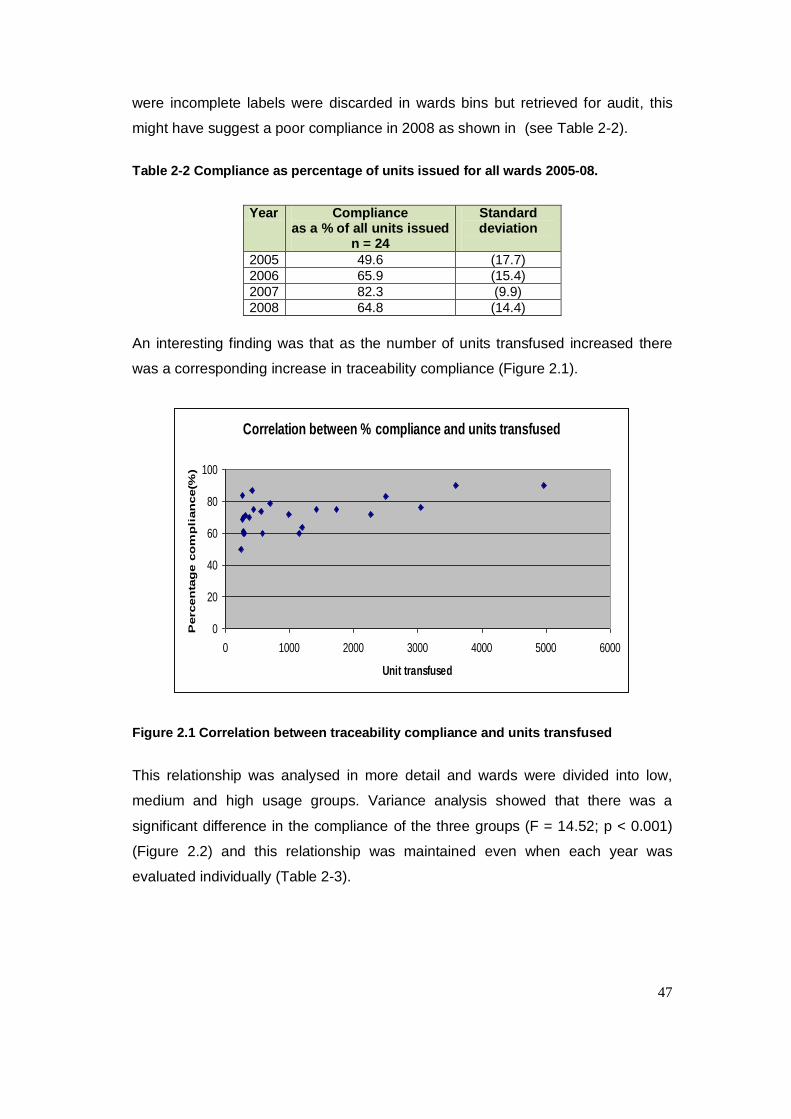
47
were incomplete labels were discarded in wards bins but retrieved for audit, this
might have suggest a poor compliance in 2008 as shown in (see Table 2-2).
Table 2-2 Compliance as percentage of units issued for all wards 2005-08.
Year Compliance as a % of all units issued
n = 24
Standard deviation
2005 49.6 (17.7)
2006 65.9 (15.4)
2007 82.3 (9.9)
2008 64.8 (14.4)
An interesting finding was that as the number of units transfused increased there
was a corresponding increase in traceability compliance (Figure 2.1).
Correlation between % compliance and units transfused
0
20
40
60
80
100
0 1000 2000 3000 4000 5000 6000
Unit transfused
Percen
tag
e c
om
pli
an
ce(%
)
Figure 2.1 Correlation between traceability compliance and units transfused
This relationship was analysed in more detail and wards were divided into low,
medium and high usage groups. Variance analysis showed that there was a
significant difference in the compliance of the three groups (F = 14.52; p < 0.001)
(Figure 2.2) and this relationship was maintained even when each year was
evaluated individually (Table 2-3).
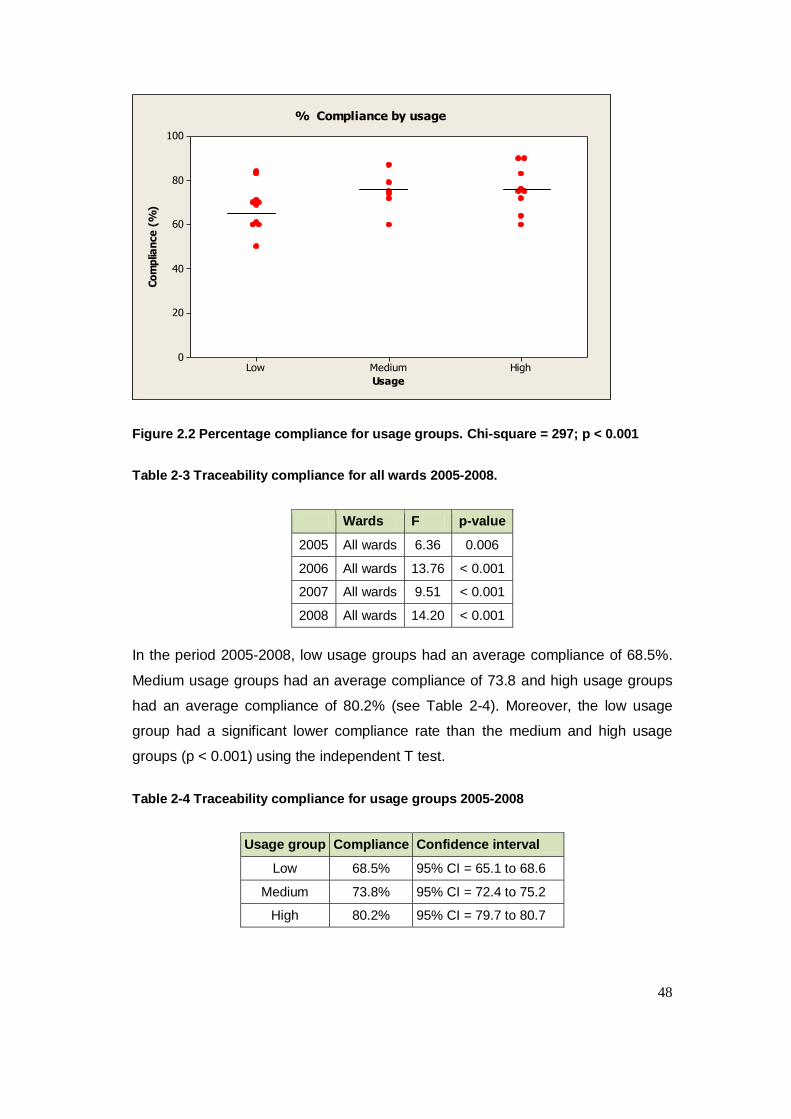
48
HighMediumLow
100
80
60
40
20
0
Usage
Co
mp
lian
ce
(%
)
% Compliance by usage
Figure 2.2 Percentage compliance for usage groups. Chi-square = 297; p < 0.001
Table 2-3 Traceability compliance for all wards 2005-2008.
Wards F p-value
2005 All wards 6.36 0.006
2006 All wards 13.76 < 0.001
2007 All wards 9.51 < 0.001
2008 All wards 14.20 < 0.001
In the period 2005-2008, low usage groups had an average compliance of 68.5%.
Medium usage groups had an average compliance of 73.8 and high usage groups
had an average compliance of 80.2% (see Table 2-4). Moreover, the low usage
group had a significant lower compliance rate than the medium and high usage
groups (p < 0.001) using the independent T test.
Table 2-4 Traceability compliance for usage groups 2005-2008
Usage group Compliance Confidence interval
Low 68.5% 95% CI = 65.1 to 68.6
Medium 73.8% 95% CI = 72.4 to 75.2
High 80.2% 95% CI = 79.7 to 80.7
49
2.1.2 Phase two: Survey of ward managers
The study was approved by the clinical governance committee of the Homerton
University Hospital NHS Trust. Emphasis was placed on voluntary informed
consent. The questionnaire was anonymous and any personal information that
could identify the respondent was kept to a minimum.
2.1.2.1 Method
A quantitative method was used because the frequency of occurrence was used to
answer my research questions and this approach ensured that I was able to collect
data and interpret comparatively. A major strength of using this method is that it
minimise bias in gathering, communicating information and makes it possible to
obtain precise information. Numbers are less vague than words. Qualitative
findings often are the basis for formulating hypothesis. Qualitative studies help
shape perceptions of a problem or situation and were not used.
The questionnaire was initially piloted to ensure that respondents could understand
the questions and the response format was suitable. It was divided into sections
that covered various aspects of the transfusion chain, including user satisfaction
and performance related to traceability compliance. The objective of the survey
was to gather more information related to the following research areas:
Training related to blood product collection and administration.
Knowledge of traceability procedures.
How traceability compliance can be improved within the Trust.
Laboratory staff professionalism.
Ward staff responsibilities related to compliance.
Ward staff opinion on traceability.
General considerations.
A postal questionnaire was used as this mitigates the effect of social acquiescence
particularly as some questions could have been considered sensitive (e.g. ward
staff compliance with Trust policy). A self-addressed envelope was enclosed for
return of the questionnaire. A reminder letter was sent approximately a month later
to encourage replies from non-responders. The initial response was not satisfactory
with a total of 10 out of 36 (28%) returns. Further telephone calls were made to
50
ward managers and a further 20 questionnaires were returned with a final response
rate of 30 out of 36 (83%). During the data analysis, the outstanding non-
responders returned their questionnaires, which were included in the final analysis
shown in Table 2-5.
A Likert-style rating scale was used, which asked the respondent to rate how
strongly they agreed or disagreed with a statement or series of statements. The
data collected was verified by a departmental biomedical scientist to ensure
accurate data entry, eliminate errors and identify missing values.
The data collected from the questionnaire was entered into a spreadsheet and
analysed using the SPSS statistical package (SPSS, 2010). All data was screened
to ensure that it did not violate the assumptions of non-parametric testing.
Descriptive statistics for each item were calculated.
The Kruskal-Wallis test is a non-parametric test used to compare more than two
independent groups. This test was used to compare the compliance rate between
different groups (e.g. specialities). Spearman‟s rank correlation coefficient was
used to analyse the strength of the relationship between continuous variables and
traceability compliance and the Mann-Whitney U test was used to compare
differences between two independent groups when the dependent variable was
either (a) ordinal or (b) interval but not normally distributed.
2.1.2.2 Results
The results of the questionnaire sent to ward managers are shown in table 2-5 and
2.6 below.
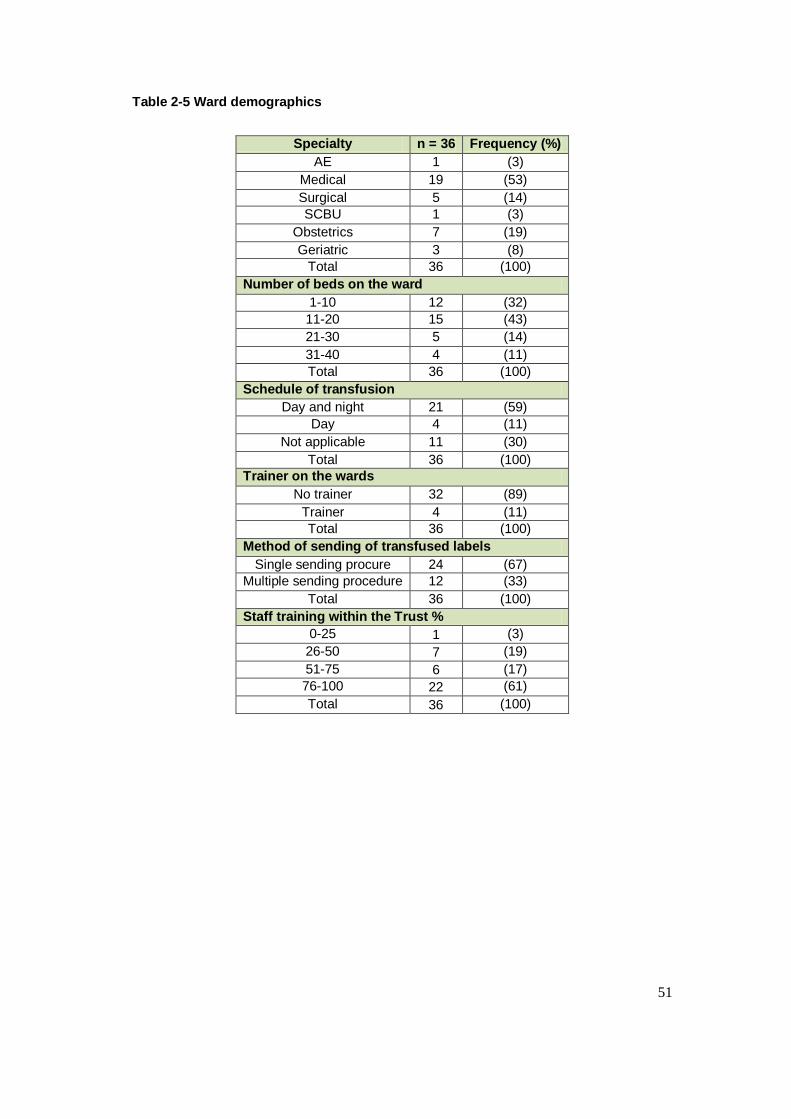
51
Table 2-5 Ward demographics
Specialty n = 36 Frequency (%)
AE 1 (3)
Medical 19 (53)
Surgical 5 (14)
SCBU 1 (3)
Obstetrics 7 (19)
Geriatric 3 (8)
Total 36 (100)
Number of beds on the ward
1-10 12 (32)
11-20 15 (43)
21-30 5 (14)
31-40 4 (11)
Total 36 (100)
Schedule of transfusion
Day and night 21 (59)
Day 4 (11)
Not applicable 11 (30)
Total 36 (100)
Trainer on the wards
No trainer 32 (89)
Trainer 4 (11)
Total 36 (100)
Method of sending of transfused labels
Single sending procure 24 (67)
Multiple sending procedure 12 (33)
Total 36 (100)
Staff training within the Trust %
0-25 1 (3)
26-50 7 (19)
51-75 6 (17)
76-100 22 (61)
Total 36 (100)
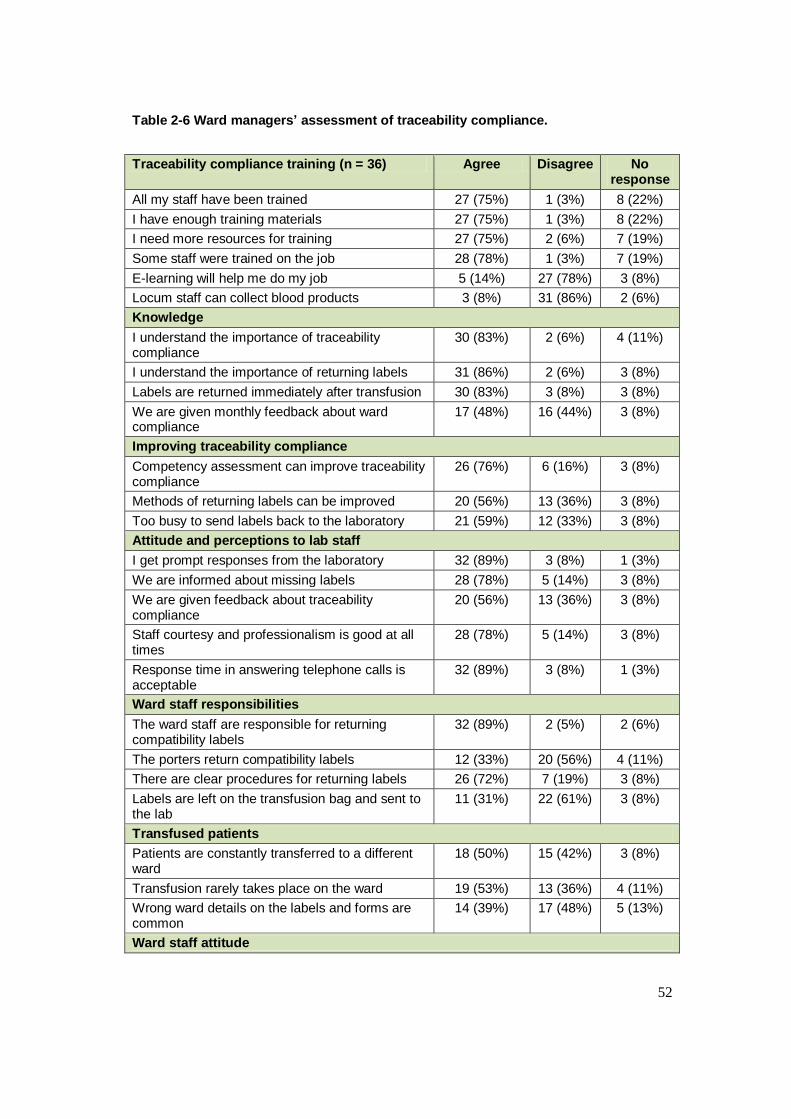
52
Table 2-6 Ward managers’ assessment of traceability compliance.
Traceability compliance training (n = 36) Agree Disagree No response
All my staff have been trained 27 (75%) 1 (3%) 8 (22%)
I have enough training materials 27 (75%) 1 (3%) 8 (22%)
I need more resources for training 27 (75%) 2 (6%) 7 (19%)
Some staff were trained on the job 28 (78%) 1 (3%) 7 (19%)
E-learning will help me do my job 5 (14%) 27 (78%) 3 (8%)
Locum staff can collect blood products 3 (8%) 31 (86%) 2 (6%)
Knowledge
I understand the importance of traceability compliance
30 (83%) 2 (6%) 4 (11%)
I understand the importance of returning labels 31 (86%) 2 (6%) 3 (8%)
Labels are returned immediately after transfusion 30 (83%) 3 (8%) 3 (8%)
We are given monthly feedback about ward compliance
17 (48%) 16 (44%) 3 (8%)
Improving traceability compliance
Competency assessment can improve traceability compliance
26 (76%) 6 (16%) 3 (8%)
Methods of returning labels can be improved 20 (56%) 13 (36%) 3 (8%)
Too busy to send labels back to the laboratory 21 (59%) 12 (33%) 3 (8%)
Attitude and perceptions to lab staff
I get prompt responses from the laboratory 32 (89%) 3 (8%) 1 (3%)
We are informed about missing labels 28 (78%) 5 (14%) 3 (8%)
We are given feedback about traceability compliance
20 (56%) 13 (36%) 3 (8%)
Staff courtesy and professionalism is good at all times
28 (78%) 5 (14%) 3 (8%)
Response time in answering telephone calls is acceptable
32 (89%) 3 (8%) 1 (3%)
Ward staff responsibilities
The ward staff are responsible for returning compatibility labels
32 (89%) 2 (5%) 2 (6%)
The porters return compatibility labels 12 (33%) 20 (56%) 4 (11%)
There are clear procedures for returning labels 26 (72%) 7 (19%) 3 (8%)
Labels are left on the transfusion bag and sent to the lab
11 (31%) 22 (61%) 3 (8%)
Transfused patients
Patients are constantly transferred to a different ward
18 (50%) 15 (42%) 3 (8%)
Transfusion rarely takes place on the ward 19 (53%) 13 (36%) 4 (11%)
Wrong ward details on the labels and forms are common
14 (39%) 17 (48%) 5 (13%)
Ward staff attitude
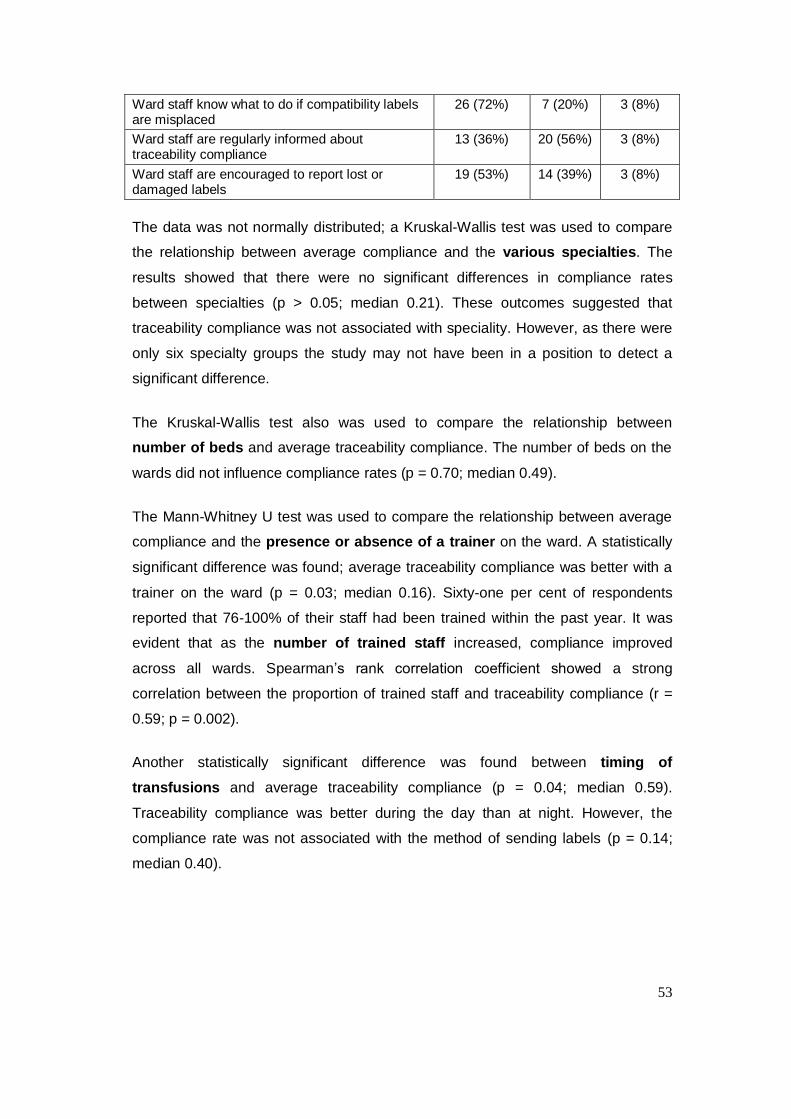
53
Ward staff know what to do if compatibility labels are misplaced
26 (72%) 7 (20%) 3 (8%)
Ward staff are regularly informed about traceability compliance
13 (36%) 20 (56%) 3 (8%)
Ward staff are encouraged to report lost or damaged labels
19 (53%) 14 (39%) 3 (8%)
The data was not normally distributed; a Kruskal-Wallis test was used to compare
the relationship between average compliance and the various specialties. The
results showed that there were no significant differences in compliance rates
between specialties (p > 0.05; median 0.21). These outcomes suggested that
traceability compliance was not associated with speciality. However, as there were
only six specialty groups the study may not have been in a position to detect a
significant difference.
The Kruskal-Wallis test also was used to compare the relationship between
number of beds and average traceability compliance. The number of beds on the
wards did not influence compliance rates (p = 0.70; median 0.49).
The Mann-Whitney U test was used to compare the relationship between average
compliance and the presence or absence of a trainer on the ward. A statistically
significant difference was found; average traceability compliance was better with a
trainer on the ward (p = 0.03; median 0.16). Sixty-one per cent of respondents
reported that 76-100% of their staff had been trained within the past year. It was
evident that as the number of trained staff increased, compliance improved
across all wards. Spearman‟s rank correlation coefficient showed a strong
correlation between the proportion of trained staff and traceability compliance (r =
0.59; p = 0.002).
Another statistically significant difference was found between timing of
transfusions and average traceability compliance (p = 0.04; median 0.59).
Traceability compliance was better during the day than at night. However, the
compliance rate was not associated with the method of sending labels (p = 0.14;
median 0.40).
54
Table 2-6 shows that not all respondents had a clear understanding of the
procedures for sending transfused blood labels back to the laboratory. Nineteen
per cent of respondent did not agree that there were clear procedures for returning
labels, although 56% of respondents agreed that they were informed about monthly
traceability compliance. It was also evident that some respondents did not think
that they should report damaged or destroyed labels.
The transfer of patients between wards could be considered another risk factor
for traceability compliance. Fifty per cent of respondents agreed.
2.1.3 Phase two: Direct observation
Direct observation was used to supplement the information obtained through the
questionnaire.
2.1.3.1 Method
A structured observation checklist was designed to evaluate blood collection and
bedside checking procedures at the Trust. The checklist highlighted relevant
information about how blood products should be collected and checked at the issue
fridge and patient‟s bedside respectively. The checklist covered the procedures and
standards issued by National Patient Safety Agency and SHOT, and British
Committee for Standard in Hematology guidelines for blood collection. It also
included the procedures displayed at the blood collection point and the bedside
checking procedure on the ward.
The drawback of observational data activities is that they are time-consuming and
the volume of data generated is immense. Therefore the sample size was kept
small. One of the threats to the validity and reliability of data collected through
observation is that of the observation effect. Another is time error. It is essential
that the time at which the observation is conducted does not provide data that is
atypical of the total period of the study.
I gave careful consideration to the composition of the sample. Because of
variations in blood collection, shift patterns, time availability and other practical
difficulties, I was the only researcher involved in data collection. Random sampling
would have been preferable but this was impossible because of the transfusion
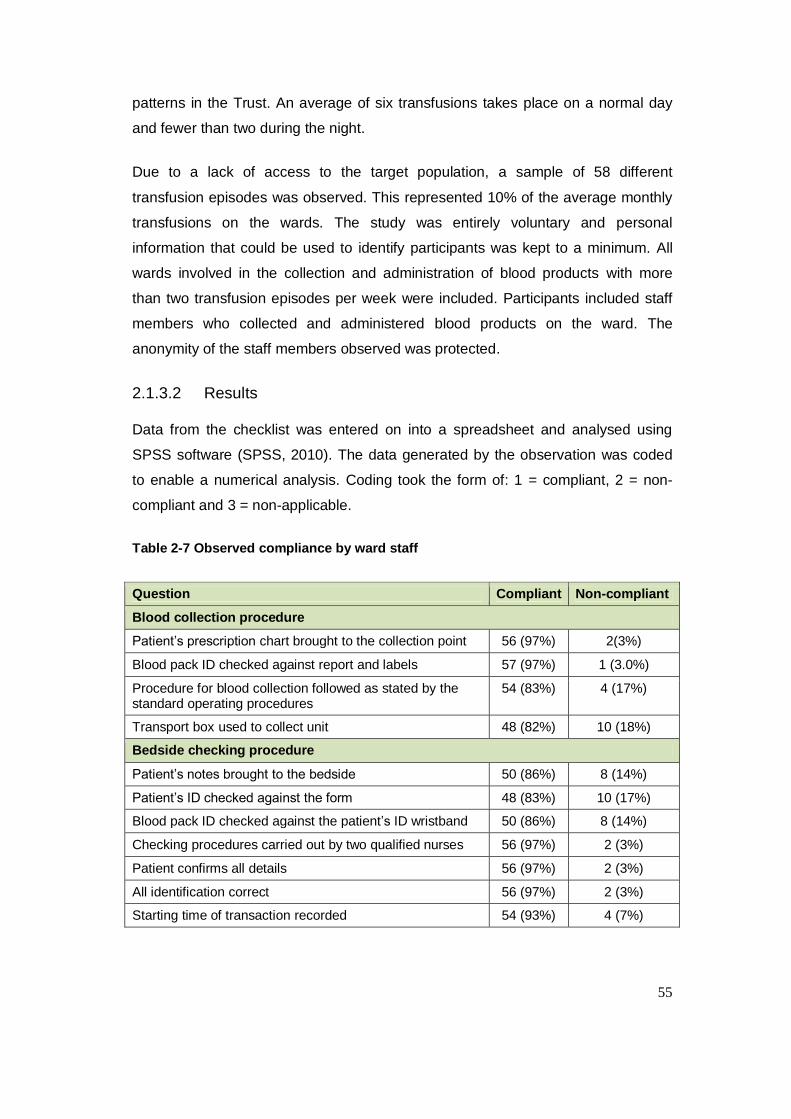
55
patterns in the Trust. An average of six transfusions takes place on a normal day
and fewer than two during the night.
Due to a lack of access to the target population, a sample of 58 different
transfusion episodes was observed. This represented 10% of the average monthly
transfusions on the wards. The study was entirely voluntary and personal
information that could be used to identify participants was kept to a minimum. All
wards involved in the collection and administration of blood products with more
than two transfusion episodes per week were included. Participants included staff
members who collected and administered blood products on the ward. The
anonymity of the staff members observed was protected.
2.1.3.2 Results
Data from the checklist was entered on into a spreadsheet and analysed using
SPSS software (SPSS, 2010). The data generated by the observation was coded
to enable a numerical analysis. Coding took the form of: 1 = compliant, 2 = non-
compliant and 3 = non-applicable.
Table 2-7 Observed compliance by ward staff
Question Compliant Non-compliant
Blood collection procedure
Patient‟s prescription chart brought to the collection point 56 (97%) 2(3%)
Blood pack ID checked against report and labels 57 (97%) 1 (3.0%)
Procedure for blood collection followed as stated by the standard operating procedures
54 (83%) 4 (17%)
Transport box used to collect unit 48 (82%) 10 (18%)
Bedside checking procedure
Patient‟s notes brought to the bedside 50 (86%) 8 (14%)
Patient‟s ID checked against the form 48 (83%) 10 (17%)
Blood pack ID checked against the patient‟s ID wristband 50 (86%) 8 (14%)
Checking procedures carried out by two qualified nurses 56 (97%) 2 (3%)
Patient confirms all details 56 (97%) 2 (3%)
All identification correct 56 (97%) 2 (3%)
Starting time of transaction recorded 54 (93%) 4 (7%)
56
Overall, the results obtained from the blood collection point and bedside check
suggested that most of the time ward staff did comply with checking procedures at
the blood collection point and the patient‟s bedside. However, full compliance was
not achieved at the blood collection point. Seven per cent of observed participants
did not bring the prescription sheet for checking at the blood collection point,
leading to the possibility of collecting the wrong blood. The transport box was not
used by 18% of participants for blood collection, which increases the incidence of
storage and wastage error. There was also non-compliance with the bedside
checking procedure by ward staff. Seventeen per cent of observed staff did not
check the patient‟s identification against the blood transfusion request form. The
patient‟s notes were not used in the bedside checking procedure by 14% of
observed staff and the blood pack was not checked against the form by another
14%.
My results was comparable to the National Comparative Audit of blood collection
conducted in 2009, which identified that 3.9% of staff did not bring documented
patient identification during blood collection and 5.3% did not check documentation
against the blood bag collected.
2.1.4 Discussion
The peak percentage traceability compliance of 82% was obtained in 2007. This
was followed by a drop to 65% in 2008. This led to the conclusion that the existing
approach to resolving poor compliance (reporting non-compliance using the Trust‟s
incident reporting mechanism and targeting staff) did not resolve the issue.
Moreover, reviewing the volume of incidents from wards was not sustainable. The
lowest traceability compliance was 50%, in 2005. The overall average traceability
compliance from 2005-2008 was 69%. This shows that there was some
improvement but it was not good enough. The results justified the need for
establishing an enhanced system of transfusion practice and a well-structured
change management programme which was not given a full attention during the
study. The presence and absence of a trainer on the ward had a positive impact on
traceability compliance within the Trust, there was a significant difference,
It was encouraging to note that most of the procedures in the observation
checklists were being adhered to. It was also encouraging to note that there was a
57
high awareness of error reporting in the Trust. Safety in blood transfusion is
enhanced if errors can be identified before they result into an adverse outcome for
a donor or patient (AuBuchon & Litternberg, 1996). Sellu et al., (2012) also
highlighted in their study that simulation training is one way in which staff within the
blood transfusion chain can be assessed effectively. This form of training has been
used in the aviation industry to decrease system failures and individual errors and
to introduce this method in the transfusion process is not easy as thought.
2.1.4.1 Blood usage levels and compliance
The study demonstrated a positive, significant correlation between the number of
units transfused and user compliance. Medium and high usage groups had higher
average traceability compliance than low usage groups throughout the years that
were investigated (2005-2008). High and medium usage groups did not have
significantly different means.
2.1.4.2 Staff training
Eighty-nine per cent of respondents reported that they did not have a trained
transfusion trainer or nurse on their ward, while 11% said they had such a
specialist in-house. When there was no in-house trainer, the results showed that
training was still given importance, even if a trainer was not available. This outcome
suggested that training is a key element in the Trust.
The majority of the wards were aware of the importance of staff training, and this
was highlighted by Murphy et al. (2004) who found that training and education may
improve traceability compliance. The employment of a ward trainer is not as critical
as the provision of other modes or means of training. However, the provision of
training is significantly and positively correlated with traceability compliance.
2.1.4.3 Blood labelling
The results of the survey suggested that staff members agreed on the importance
of blood labels. Moreover, survey participants strongly agreed that labels should be
returned immediately after transfusion and they understood the importance of
traceability compliance. It was encouraging to note that all the statements in the
survey related to this area were evaluated positively by respondents.
58
2.1.4.4 Blood and patient identification
Out of all the behaviours that were observed using the bedside point observation
checklist, the ones which were least observed were the patient's identity being
checked against forms and labels and the blood pack identification being checked
against reports and labels. Of the blood collection point checklist behaviours that
were observed, the ones that were least respected were using the right transport
box, patient identification being brought to the collection point and patient
identification being checked against reports and labels. While staff members take
their responsibilities in the transfusion process seriously, acknowledge the
importance of training and skills assessment and generally follow working
procedures there may be a need for a more permanent, technological intervention
to increase traceability compliance.
This is consistent with the results from Novis et al. (2003) who assessed the
frequency with which the basic elements of bedside checking procedures were
performed, including patient identification, blood compatibility identification and
expiry date information. Their study revealed a failure to match wristband
identification with the compatibility label in 25% of blood transfusions. The
outcomes of the current study showed persistent difficulties in observing these
patient identification protocols.
Errors in the blood transfusion process frequently relate to patient identification,
blood units and its components. These erroneous slips can be reduced with the
help of different techniques (Linden et al., 2000). In the case of the current study, it
was found that majority of the wards still employed a paper-based tracking system.
There are many alternative technological approaches that may help to improve
traceability compliance, such as mechanical barriers, barcodes, computerisation,
automatic interface systems, portable computers and radiofrequency devices, and
automated blood stores.
2.1.4.5 Feedback mechanisms
Slips are unintended errors caused by either not doing part of the routine or being
distracted by someone. Slips can be avoided by the redesign of equipment and
procedures in ways that make it more difficult to make a slip. For instance, a
feedback mechanism can be designed into the IT system that alerts the individual
59
when a slip is made i.e. alert from system to request label sent back and time and
question operator if odd decisions were made. This is one approach that could be
taken by the Trust to enhance traceability compliance.
2.1.4.6 Technology
Tracking blood samples using RFID technology has been cited in a number of
studies looking at blood products and may be considered by the Trust. However,
carrier and reader consistency and reliability are problems. A detailed evaluation is
necessary to establish the limits of such advanced technology.
2.1.4.7 Patient transfer periods
The results indicated that the patient transfer period was significantly and positively
correlated with ward compliance. The patient transfer period was measured by the
number of patients transferred to other wards. Transfers happen regularly on wards
and it is common to find the wrong ward indicated on the compatibility form and
label.
The transfer period may be classified as an active failure since it is the health
professional who decides it. A significant and positive correlation with traceability
compliance indicates that as transfers to different wards become more frequent
and the identification of the wrong ward on compatibility forms and labels
increases, the likelihood of compliance increases correspondingly. Possibly, the
identification of such errors causes more stringent enforcement of procedures,
leading to higher traceability compliance within the ward.
2.1.4.8 Latent factors
It may also be worth noting some latent errors behind non-compliant behaviours.
Technical aspects associated with latent failures include such things as equipment
design, computer software and mobile and material facilities, the barcode on the
transfusion labels were not water proof, this need to be transcribed onto the
computer system manually when damaged by an medical laboratory assistant. One
aspect of organisational failures stems from normal management issues. This
includes the structure of the organisation, planning and scheduling, forecasting,
budgeting and allocating resources.
60
3 Blood product tracking models
This chapter first reviews the literature on the effectiveness of commercial
traceability products. It then describes a survey of blood transfusion managers in
NHS Trusts in North East England that gathered information about the actual
process of traceability from professionals in the healthcare sector. The data
gathered was used to inform the choice of traceability processes implemented by
the Trust and described in Chapter 4. The purpose was to evaluate the error
detection level, robustness, sampling techniques and the secondary outcomes of
the blood tracking systems available.
3.1.1 Introduction
The aim of the literature review was to determine the range of blood tracking
systems available and to summarise the evidence on the effectiveness of these
systems. The specific objectives were:
To compare traceability procedures with the previous system or no system.
To assess performance in terms of percentage compliance, error detection
levels and mistransfusion events.
To assess secondary measures such as cost-effectiveness, robustness and
acceptance by staff members.
The review included any studies that evaluated the outcome of a traceability
process. Traceability processes could include electronic tracking systems or paper-
based methods. I included both randomized controlled trials and non-random trials,
but as it was unlikely there would be many studies of this type, I also reviewed
post-use evaluation reports and uncontrolled before-and-after studies.
3.1.2 Method
The review sought to identify all papers related to tracking systems for blood
transfusion. I used search engines such as Medline (1966-2012), EMBASE (1980-
2012) and CINAHL® (1982-2012), the Cochrane Library and the transfusion
evidence library, which contains the National Health Service Blood and Transplant
systematic reviews and Health Business Elite texts.
61
The search terms used were traceability (including tracking*, traceable*, tracking
system or vigilance), blood (including haem*, transfusion, red cell, blood* or blood
products*), haemovigilance (or vigilance*) and blood products (including red cells,
blood* or blood products*). In addition, the search included the websites of medical
companies that produce well-known tracking systems and a manual search of
conference proceedings up to 2012. The references of full papers were identified
electronically and also included in the review.
The data collected related to the number of beds, number of blood units transfused,
the need to trace blood products leaving the hospital (for external or home use), the
quality of the study, the date of implementation and description of the new system,
the system being replaced and outcome data. Studies were graded according to
quality i.e. designed and outcome. Controlled studies were considered to be better
quality than uncontrolled. Before-and-after and post-evaluation were both
considered as uncontrolled studies.
3.1.3 Results
The initial review identified 378 references. Of these, 106 were found to not be
relevant to the research question and were removed. The remaining 272
references were screened for eligibility against predefined criteria. Twelve
references were identified to be of particular interest. These are described in detail
in Table 3-1.
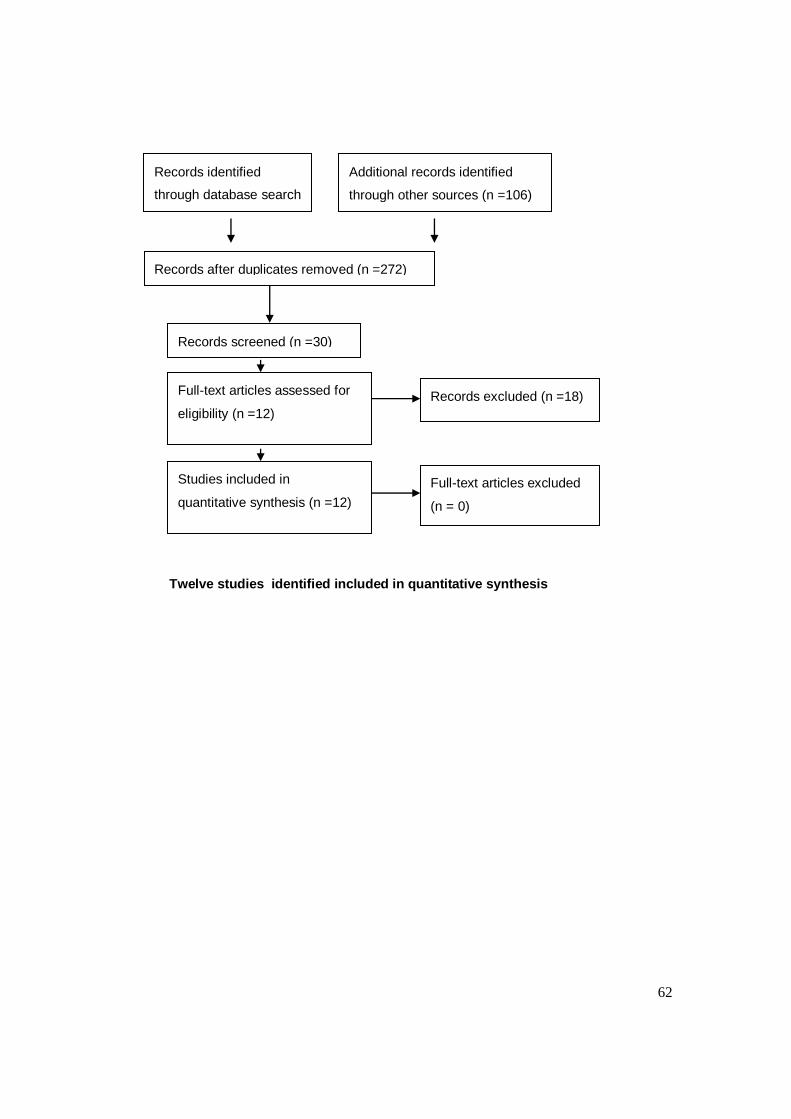
62
Twelve studies identified included in quantitative synthesis
Records identified
through database search
(n = 378)
Additional records identified
through other sources (n =106)
Records after duplicates removed (n =272)
Records screened (n =30)
Full-text articles assessed for
eligibility (n =12)
Studies included in
quantitative synthesis (n =12)
Records excluded (n =18)
Full-text articles excluded
(n = 0)
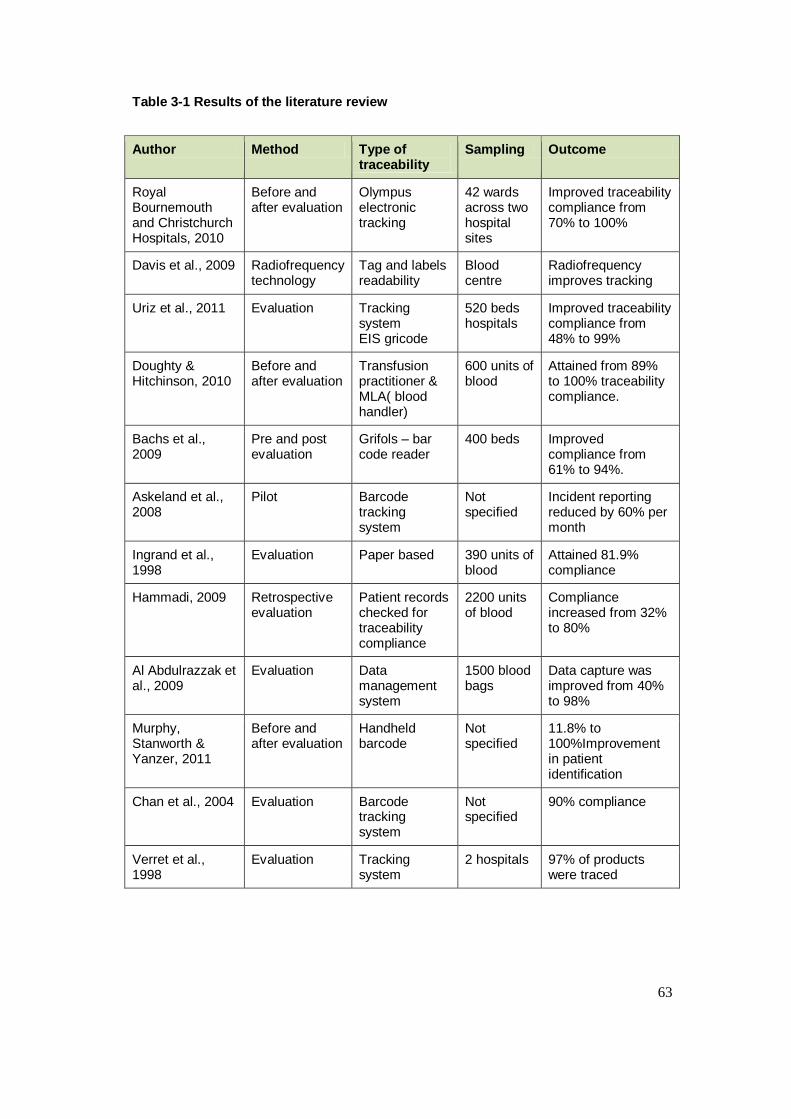
63
Table 3-1 Results of the literature review
Author Method Type of traceability
Sampling Outcome
Royal Bournemouth and Christchurch Hospitals, 2010
Before and after evaluation
Olympus electronic tracking
42 wards across two hospital sites
Improved traceability compliance from 70% to 100%
Davis et al., 2009 Radiofrequency technology
Tag and labels readability
Blood centre
Radiofrequency improves tracking
Uriz et al., 2011 Evaluation Tracking system EIS gricode
520 beds hospitals
Improved traceability compliance from 48% to 99%
Doughty & Hitchinson, 2010
Before and after evaluation
Transfusion practitioner & MLA( blood handler)
600 units of blood
Attained from 89% to 100% traceability compliance.
Bachs et al., 2009
Pre and post evaluation
Grifols – bar code reader
400 beds Improved compliance from 61% to 94%.
Askeland et al., 2008
Pilot Barcode tracking system
Not specified
Incident reporting reduced by 60% per month
Ingrand et al., 1998
Evaluation Paper based 390 units of blood
Attained 81.9% compliance
Hammadi, 2009 Retrospective evaluation
Patient records checked for traceability compliance
2200 units of blood
Compliance increased from 32% to 80%
Al Abdulrazzak et al., 2009
Evaluation Data management system
1500 blood bags
Data capture was improved from 40% to 98%
Murphy, Stanworth & Yanzer, 2011
Before and after evaluation
Handheld barcode
Not specified
11.8% to 100%Improvement in patient identification
Chan et al., 2004 Evaluation Barcode tracking system
Not specified
90% compliance
Verret et al., 1998
Evaluation Tracking system
2 hospitals 97% of products were traced
64
3.1.4 Discussion
The study at the Royal Bournemouth and Christchurch Hospitals showed that
traceability compliance had improved significantly by employing the Olympus blood
tracking system. Prior to the implementation, only 70% of transfused blood could
be traced. The blood tracking system enabled positive patient identification and
consisted of modular software, 2-dimensional barcoding and a wireless personal
digital assistance. The system was introduced on 42 wards in the Trust and
improved traceability compliance to 100%. The team also anticipated that future
financial savings would be made by the elimination of blood wastage and ultimately
free up staff time in the transfusion chain.
Davis et al. (2009) highlighted the benefits of Radiofrequency Identification (RFID)
technology, which included the reduction of discarded product and enhanced
visibility of large quantities of incoming stock. They claimed that more timely,
detailed and accurate information would support „Lean operations‟. High frequency
passive RFID technology was found to perform satisfactorily in blood centres and
assessed as safe when used with red blood cells and whole blood derivatives
platelets. However, they highlighted that additional research was needed to confirm
the performance and safety of RFID at very low temperatures with plasma
products.
Uriz et al. (2011) carried out a retrospective study of blood transfusion services at
their hospital. The Gricode® electronic identification system (EIS) had been
implemented in order to improve services. The EIS comprised a portable reader
with software tailored to the hospital‟s existing systems, sufficient storage space
and the ability to transfer data to the transfusion service. It recorded the beginning
and the end of the transfusion at the bedside and any adverse reactions. It enabled
patient, document and sample identification, together with the blood products
transfused and time tracking. Following the implementation of the new system in
2005 high levels of traceability were obtained, ranging from 99.5% in 2005 to
99.7% in 2008. Monthly analyses indicated that traceability was consistent. The
failure of ward staff to perform controls was also assessed in a subsequent
analysis. The emergency room failure rate was above 20% due to the malfunction
of the reader and the loss of data. The neuroscience unit failure rate was 25%,
although only a few transfusions were performed by the unit.
65
The transfer of data between hospitals and National Blood Service is emerging in
the U.K blood services but in its early stages. This will provide a complete
traceability of blood products in the future, lately we could assess patient‟s serology
reports from the NBS and check blood products issued to hospitals across the
country, and this is a beginning of total traceability within the health sector.
Doughty and Hitchinson (2010) described blood handling practices across several
sites serving one Trust and eight smaller sites. A medical laboratory assistant was
employed to handle the product, collect daily information from the ward and
reconcile it with the blood issue forms. A transfusion practitioner was also
appointed to deliver training to key groups of staff. They suggested that factors
contributing to good compliance included the appointment of a hospital transfusion
practitioner, electronic prescribing, a medical laboratory assistant in clinical units,
timely feedback and reinforcing success. The cost effectiveness of the full tracking
system requires further exploration.
Bachs et al. (2009) evaluated the safety transfusion system and traceability
compliance following the implementing of improvement measures. A tracking
system (Gricode®) was employed in the transfusion department. The software could
be accessed from the nurses‟ station and barcode readers were provided in 28
areas of the Trust in order to scan the transfusion process. The data collected
included the blood sample, the patient‟s identification bracelet, and the start and
end times of transfusion. All data was downloaded on a daily basis to the main
blood transfusion system where the whole process was supervised. The study
showed that wards with low levels of compliance were those that carried out the
fewest transfusions.
Askeland et al. (2008) evaluated incident reporting associated with the introduction
of wireless devices and barcoded labels to the transfusion process. Data was
collected from before and after the implementation. Incident reports decreased
from a mean of 41.5 reports per month in the six months before implementation to
a mean of 7.2 reports per month after the implementation. Errors detected by the
system included mis-scanning, skipped steps, wrong steps and identification errors.
The authors estimated that the new system had caused the mistransfusion rate to
drop to about once every 100 months. The bar-code based computerized tracking
66
system was shown to have reduced the proportion of errors in the transfusion chain
and enhanced patient safety.
Ingrand et al. (1998) conducted a pilot survey using information gathered from the
medical record department in a French university hospital. The availability of
transfusion information varied according to patient records and the type of ward.
The study showed 81.9% traceability. The study also showed that traceability
compliance differed according to the clinical area and was worst in surgical units.
They recommended that robust, efficient change in the organization and
information systems was needed.
Hammadi (2009) described the tools used for evaluating traceability compliance in
the medical sector. The patient‟s case notes, transfusion card and the transfusion
register were used to evaluate the final destination of transfused blood. The study
found that with the introduction of an electronic tracking system, the rate of
traceability compliance improved from 39% in 2001/2002 to 83.3% in 2006.
Al Abdulrazzak et al. (2009) conducted an evaluation of 1,500 red cells issued by
the Kuwait Central Blood Bank. Prior to the introduction of the Data Management
System (DMS), one hospital discarded all traceability records, while a second did
keep some but a lot were missing. The rates of missing data were 87% and 40%
respectively. After the DMS installation both hospitals were provided with a list of
products supplied/received and were requested to check individual traceability
records. Traceability compliance was found to have increased to 98%. The DMS
implementation had resulted in a significant decrease in the number of missing
records in both hospitals. The study recommended that manual records should not
be discarded, but should be archived for easy access and retrieval.
All methods of traceability system from this systematic review had improved
traceability compliance to a varied degree. The introduction of interactive training
and prompt built into this tracking system will be a useful innovation to improve
compliance and also a barrier to minimise poor compliance in areas of low usage of
blood product as identified by Bachs and colleagues. It is also important to identify
failure rate of electronic tracking system, an incident was identified in the
emergency room highlighted by Uriz et al., 2011. The use of electronic tracking had
improved traceability compliance in most of studies, but the occasional failure rate
67
requires a risk assessment and further exploration of the limitation of this systems.
Askeland et.al, (2008), also identified incidents such as mis-scanning of blood
products, skipped steps and wrong steps. This shows the vunerability of this
system.
3.2 Commercial software products
As early as the 1970s, Sherer et al. (1977) described studies that implemented
prototype handheld bedside donor-recipient identification systems, but none of the
systems proved acceptable under the clinical conditions. Since then, only small-
scale experiments have been reported, which makes it difficult to compare the
effectiveness of different technical approaches.
Murphy et al. (2004) highlighted that the current safeguards to prevent
mistransfusion are inadequate. Minimising transfusion errors requires a co-
ordinated effort from all stakeholders to enhance patient safety throughout the
transfusion chain. Automated identification and data capture systems such as
barcoding and radiofrequency identification (RFID) can be a key enabler in
reducing errors in blood transfusion, although the limitations of the technology have
proved to be a barrier to widespread adoption (Hopkins, 2005).
3.2.1 Barcode tracking systems
Gradual progress has been made in the last decade to apply barcode technology to
patient identification and transfusion medication safety. Barcode systems consist of
a handheld terminal, a barcode reader, a biometric sensor for reading fingerprints
and a keypad. The biometric sensor records the fingerprints of hospital staff and
the patient. The system makes it possible to identify and check which blood units to
assign to patients. Patients can be easily identified whether they are conscious or
unconscious. The technology is a widely used, stable and inexpensive means of
machine readable identification. Several commercially available products have
been deployed by hospitals and others are in development (Aller, 2005). Progress
in forward-looking hospitals is being stimulated by products that have been
specifically developed for the healthcare sector (Table 3-2).
Table 3-2 A sample of commercial products using bar-code technology.
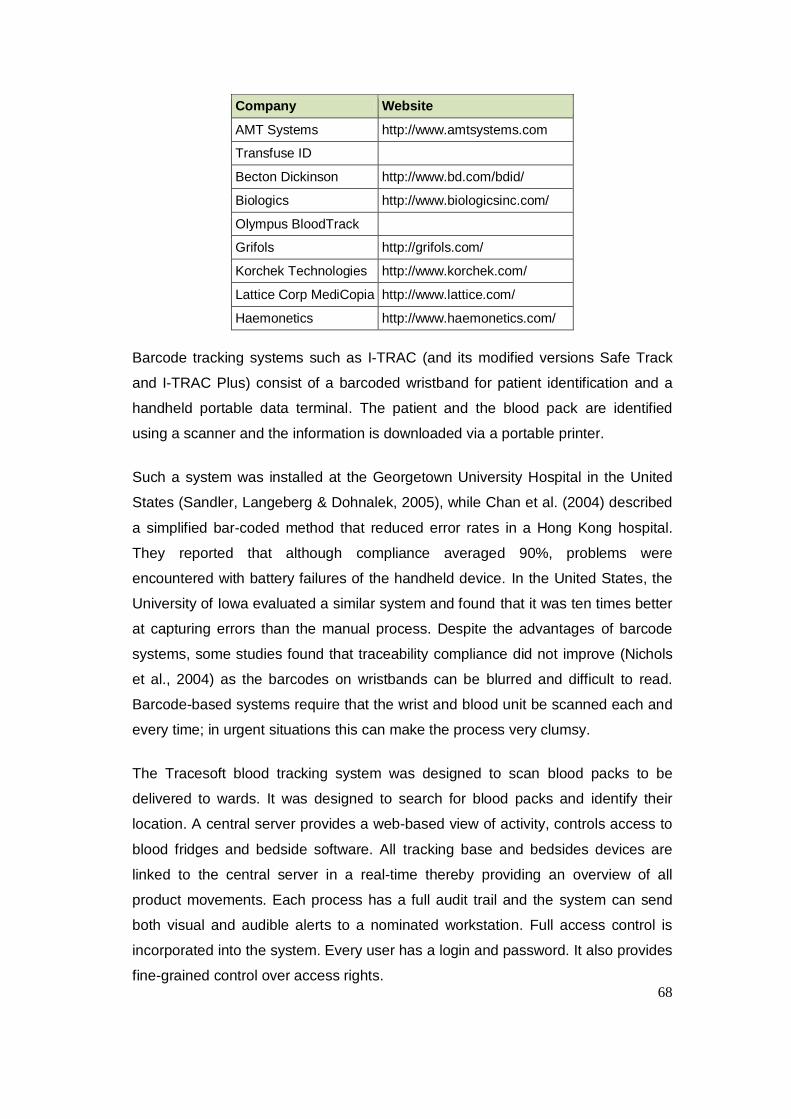
68
Company Website
AMT Systems http://www.amtsystems.com
Transfuse ID
Becton Dickinson http://www.bd.com/bdid/
Biologics http://www.biologicsinc.com/
Olympus BloodTrack
Grifols http://grifols.com/
Korchek Technologies http://www.korchek.com/
Lattice Corp MediCopia http://www.lattice.com/
Haemonetics http://www.haemonetics.com/
Barcode tracking systems such as I-TRAC (and its modified versions Safe Track
and I-TRAC Plus) consist of a barcoded wristband for patient identification and a
handheld portable data terminal. The patient and the blood pack are identified
using a scanner and the information is downloaded via a portable printer.
Such a system was installed at the Georgetown University Hospital in the United
States (Sandler, Langeberg & Dohnalek, 2005), while Chan et al. (2004) described
a simplified bar-coded method that reduced error rates in a Hong Kong hospital.
They reported that although compliance averaged 90%, problems were
encountered with battery failures of the handheld device. In the United States, the
University of Iowa evaluated a similar system and found that it was ten times better
at capturing errors than the manual process. Despite the advantages of barcode
systems, some studies found that traceability compliance did not improve (Nichols
et al., 2004) as the barcodes on wristbands can be blurred and difficult to read.
Barcode-based systems require that the wrist and blood unit be scanned each and
every time; in urgent situations this can make the process very clumsy.
The Tracesoft blood tracking system was designed to scan blood packs to be
delivered to wards. It was designed to search for blood packs and identify their
location. A central server provides a web-based view of activity, controls access to
blood fridges and bedside software. All tracking base and bedsides devices are
linked to the central server in a real-time thereby providing an overview of all
product movements. Each process has a full audit trail and the system can send
both visual and audible alerts to a nominated workstation. Full access control is
incorporated into the system. Every user has a login and password. It also provides
fine-grained control over access rights.
69
In 1991 the Albert Einstein College of Medicine in the United States evaluated the
BloodLoc system. In this system, an alphabetic code taken from the patient
identification bracelet must be used to access the assigned blood unit. The same
system was implemented at the Dartmouth-Hitchcock Medical Centre in New
Hampshire (United States) and the Gaetano Pini Orthopaedic Institute in Milan,
Italy (Mercurialli et al., 1996).
3.2.2 Radiofrequency tracking systems
Another method is radiofrequency identification (RFID) to link barcodes or
microchips to palm computers. In the mid-1990s, little attention was paid to RFID
but since then it has gained momentum as the cost of implementation has
decreased. Most studies show that the technology is suitable for transfusion
medicine but its implementation may present challenges. All blood bag trials have
used a frequency of 13.56 MHz, because of the ability to take readings through
fluids. Trials have tested the durability of tags under real conditions, such as
centrifugation, temperature changes and irradiation. There appear to be no trials
that investigated the entire blood chain, from blood bag manufacturers to donation,
production, storage, distribution and transfusion. Consequently, no studies have
been identified that determine the return on investment from RFID.
Radiofrequency tracking systems have several advantages over barcoding in terms
of patient safety. RFID chips can hold more data than a barcode and can include
more information such as patient allergies, blood needs and any special
requirements. Secondly, unlike a barcode, RFID does not require the use of light
beams and RFID chips are interrogated through simple proximity to an electric
reader. Dzik (2005) and Sandler, Langeberg and Dohnalek (2005) described the
radiofrequency (RFID) identification method using a frequency of 13.56MHz. Blood
bag tags were integrated into the blood bank computer system. Tags and patient
wristbands were read by a built-in radiofrequency reader.
There are two kinds of RFID technology. In Active RFID the chip is powered by a
battery and emits energy that can read over a distance, this is commonly used to
track assets within an establishment. Passive RFID technology is more suited for
blood bags and patient identification as it emits no energy. Tags are read only
when in close proximity to the reader. At Massachusetts General Hospital (United
70
States) a pilot study was conducted using passive RFID. A bedside reader was
used to identify the blood bag and to provide feedback on the match between the
identity of the patient and the blood bag (Dalton, 2005).
RFID was used at Saarbrucken Hospital in Germany to track blood bags, record
transfusions and ensure that patients received the right blood, this was a small
study and the effect of durability of the tags, centrifugation, temperature changes,
irradiation was not investigated (Wessel, 2006). Hospital staff attached self-
adhesive labels to all blood bags arriving at the hospital. The labels contained
passive RFID chips with two kilobytes memory for storing unique identification
numbers. The Return of investment is a big issue with the use of RFID in
transfusion medicine and this require full further evaluation.
3.2.3 Limitations and challenges of barcode and RFID technology
Although traceability should enable tracking of all phases of the transfusion
process, it can also breach privacy. Patient‟s data are stored on chips and
transmitted at different frequency depending on the reader and carrier. The full
security of this data have not been fully evaluated, even though firewalls can be
created to prevent access.
Carriers and readers are an important aspect of tracking. Carriers come in many
forms, such as barcodes, data matrices, RFID and smartcards and each carrier has
its own standards. RFID, for example, uses three frequency ranges (125 kHz,
13.56 GHz. and 900 MHz), each with advantages and disadvantages. Carriers and
readers must be standardised if the codes they carry are to be easily read and
stored. Moreover, there are still reliability problems with carriers. As yet, there is no
ideal carrier; the choice depends on physical and environmental constraints as well
as robustness and cost. Despite a lack of reliable studies, RFID is a very promising
technology and may have a significant impact in healthcare (Fanberg, 2004, p.43).
In the United States, the American Food and Drug Administration requested the
national RFID consortium to subject blood products to radiofrequency energy in
worst-case conditions to determine whether there was any in vitro adverse impact.
The aim of the study was to ensure that any impact of exposure to the
radiofrequency reader on blood safety could be assumed to be acceptable. Testing
71
included an evaluation of product heating and any key biochemical changes from
exposure to an intense radiofrequency magnetic field for longer than 23-25 hours
(Davis et al., 2009).
The use of handheld devices to capture barcoded information from the patient
wristband improves patient safety and minimises mistransfusion. The handheld
device of a typical commercially available system receives and transmits
information about patients and blood units. This requires an interface between the
handheld device and the hospital network or a dedicated wireless network. Privacy
and security are concerns with the use of both RFID and wireless technology.
Other technological limitations include the implementation of firewalls to protect the
RFID database, tag disposal and recycling and shielding RFID tag or tag reading
areas with metal screens to prevent unauthorized access (Davis et al., 2009). The
use of RFID on blood products is in its early stages, because of its return on
investment cannot be ascertain, most studies have been carried out on red cells,
the effect of radiation on plasma products requires further explorartion and effect of
electromagnetic radiation on blood products is currently under investigation. The
cost of installing a tracking system is becoming affordable and cost-effective since
the inception of this study compared to RFID.
3.3 Survey of blood bank managers
This phase of the study aimed to provide information about the actual process of
traceability and opinions from healthcare professionals. The data gathered was
used to inform the choice of traceability processes implemented by the Trust and
described in Chapter 4.
Data was gathered through a self-administered questionnaire sent to blood bank
managers working in NHS Trusts in North East of London. It aimed to answer the
question, “What variables are associated with traceability compliance in NHS Trust
hospitals in North East of London” (Appendix 6). Most of the NHS Trusts that
participated in this study came from Brentwood user group.
72
The Homerton University Hospital NHS Trust clinical governance committee
approved the study. Participants were informed in writing that their participation
was voluntary and anonymous. Non-respondents were not followed up as it was
felt that they should not have to justify their decision not to participate.
3.3.1 Method
Hospitals with no blood bank services were excluded from the study. Twenty-five
questionnaires were sent to blood bank managers who were invited to participate
on a voluntary basis. A covering letter was attached to the questionnaire explaining
that all data collected would be treated anonymously and destroyed following
analysis. The questions related to individual Trust traceability compliance and
addressed issues such as bed capacity, the availability of a satellite fridge, whether
there was a tracking system in place, its cost and training.
Questionnaires were posted to participants together with a self-addressed
envelope for the return of the questionnaire. Reminders were sent a month later to
maximize the response.
Completed questionnaires were numerically coded to facilitate the analysis and
organise the results. Descriptive statistics were used to evaluate the sample. The
data was not normally distributed; the Kruskal-Wallis test, Spearman‟s rank
correlation coefficient and the Mann-Whitney U test were used in the analysis.
3.3.2 Results
The response rate was 64% (16 out of 25 trusts) and table 3-3 shows the
demographics of the Trusts surveyed.
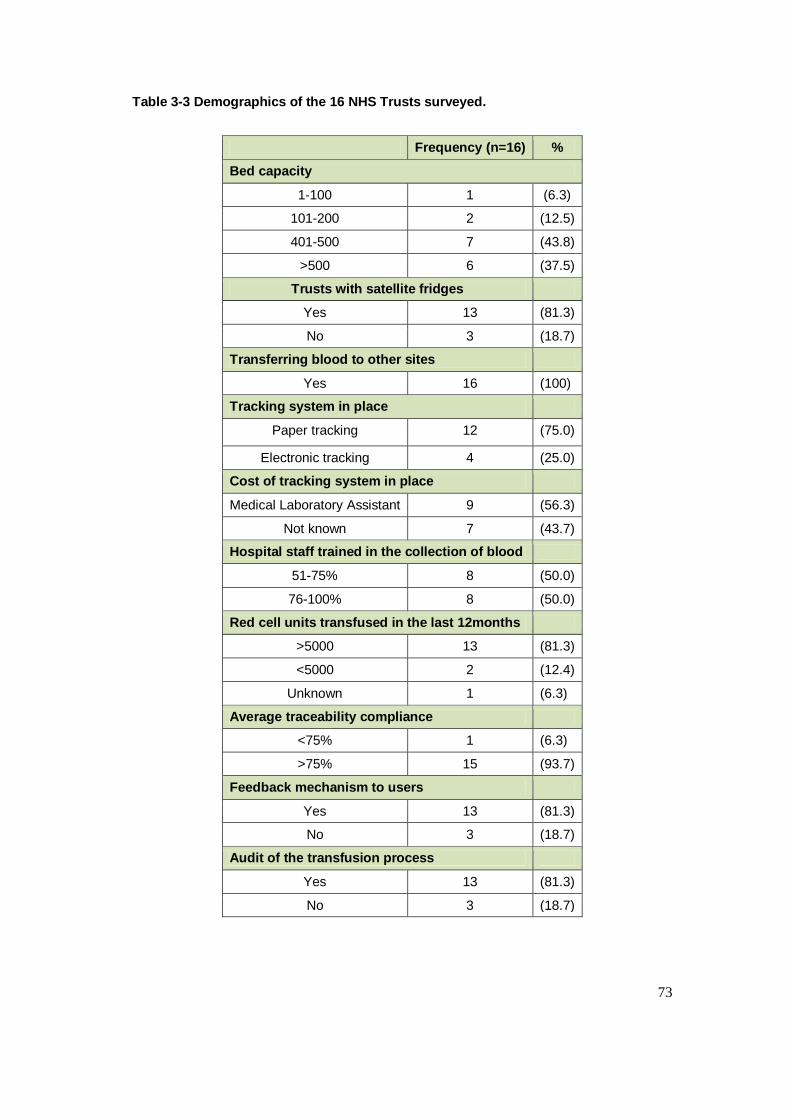
73
Table 3-3 Demographics of the 16 NHS Trusts surveyed.
Frequency (n=16) %
Bed capacity
1-100 1 (6.3)
101-200 2 (12.5)
401-500 7 (43.8)
>500 6 (37.5)
Trusts with satellite fridges
Yes 13 (81.3)
No 3 (18.7)
Transferring blood to other sites
Yes 16 (100)
Tracking system in place
Paper tracking 12 (75.0)
Electronic tracking 4 (25.0)
Cost of tracking system in place
Medical Laboratory Assistant 9 (56.3)
Not known 7 (43.7)
Hospital staff trained in the collection of blood
51-75% 8 (50.0)
76-100% 8 (50.0)
Red cell units transfused in the last 12months
>5000 13 (81.3)
<5000 2 (12.4)
Unknown 1 (6.3)
Average traceability compliance
<75% 1 (6.3)
>75% 15 (93.7)
Feedback mechanism to users
Yes 13 (81.3)
No 3 (18.7)
Audit of the transfusion process
Yes 13 (81.3)
No 3 (18.7)
74
Table 3-3 shows that 44% of the Trusts had a bed capacity of 401-500, similar to
the Homerton University Hospital NHS Trust.
Demographic data was not normally distributed; hence the Kruskal-Wallis test was
used to compare the relationship between bed capacity and average traceability
compliance. The number of beds on the wards did not influence compliance (p =
0.64; median 0.62).
All respondents confirmed that they transferred blood products to other sites or
hospitals, however the transfer of blood products to satellite hospitals did not
influence traceability compliance (p = 0.44).
Seventy-five per cent of respondents said they had a paper-based tracking system,
while 25% said they were using electronic tracking. The analysis showed that there
was no relationship between electronic tracking and traceability compliance (p =
0.52; median = 0.25). It was evident that although electronic tracking and paper-
based methods improved traceability compliance, the cost of the two systems
required further exploration.
Regarding the percentage of staff trained in the collection of blood products,
50% said the percentage was 51-75%, while the other half assessed it to be 76-
100%. The Trusts with most trained staff had better traceability compliance as
Spearman‟s correlation showed there was a positive correlation between training
and traceability compliance but not clinically significant (r = 0.48; p = 0.06).
Eighty-one per cent of respondents said that their hospital had transfused less than
5,000 red cell units in the past year. Twelve per cent reported transfusing more
than 5,000 red cell units and 6% did not know the number. There was positive
correlation between transfused units and traceability compliance (r = 0.54; p =
0.03).
Ninety-four per cent of respondents said that average traceability compliance was
greater than 75%. At the same time, few Trusts were working towards improving
their compliance which suggested that both tracking methods (paper and
electronic) improved traceability compliance.
75
3.4 Discussion
The objective of this review of current practice was to identify and explore the
effectiveness of different blood product tracking models to inform the choice of
traceability processes implemented by the Trust and described in Chapter 4. It was
evident that staff training within the transfusion chain remained a big issue in some
of the Trusts surveyed, and not all staff had been adequately trained.
Overall, the results showed that audits, regular feedback, traceability methods and
the percentage of trained staff positively influenced traceability compliance.
Nevertheless, there are limitations related to data collection and the transferability
of the study. The sample size was small and the selection of participating Trusts
was not representative, which might have skewed the data. Participant‟s were
assured that all respondents will not be identified, there is tendency that
compliance might have been overstated if they felt that they might be identified or
data might be used outside the purpose of this study. The NHS Trusts with good
compliance will likely give more information how compliance was achieved. Error
detection level within NHS Trusts remains a concern, hospital laboratories with high
error reportable level tends to come under scrutiny by regulatory bodies,
consequently this has led to underreporting of incidents as identified by SHOT,
2011. Further studies will be required on a larger scale to assess the transferability
and problems with traceability compliance .
3.4.1 Literature review
Of the 12 studies identified in the literature review, nine included data about post-
implementation traceability compliance. However, the quality of the evidence varied
and was subject to limitations. First, some studies did not specify the medical
speciality concerned. In other studies a before-and-after comparison was made,
but the lack of concurrent controls meant that there could be alternative
explanations for the change in the compliance rate. Moreover, before-and-after
studies and non-blind studies are prone to a reporting bias. One study simply
reported post-implementation compliance rates. There were inconsistencies in the
descriptions of how the studies were conducted and outcomes were reported. In
addition to the limitations of individual studies, there were several potential biases
in the review process itself. Relevant data may not have been captured either
76
because it was not provided or because it was not published. It was evident that
both the tracking system and the paper-based method shown in Table 3-1
improved traceability compliance; therefore the cost-effectiveness of both systems
needs further exploration. The tracking system also freed up staff time by sorting
blood products, reducing wastage and increasing the use of old stock.
3.4.2 Tracking methods
Documentation and tracking methods are important as they many improve
compliance. The review of records or audits has conventionally been a way of
performing quality assurance checks and documenting patient outcomes. The audit
of records against predetermined criteria can be an important method in identifying
errors or near miss events. In the survey of blood bank managers, 75% said they
had a paper-based tracking method, while 25% said they were using electronic
tracking. While this may be an area for improvement in compliance, technology is
not a panacea. Moreover, electronic tracking may be an expensive option, reflected
in the fact that 44% of respondents said they did not know the cost of the current
system.
RFID technology may be a valuable tool, if it is affordable. It captures the
movement of all blood products using a reader and carrier. It keeps patient
information safe and secure, reduces the turnaround time for blood products
tracing and helps to track and sort blood products in time and date order, hence
reducing wastage and improving stock management.
Self-assessment may be another way to improve practices that are likely to lead to
increased compliance. Self-assessment must be carried out regularly and
monitored so that incidents can be reported immediately. To achieve secure and
traceable procedures concepts regarding quality, security and efficiency must be
incorporated into the process itself. On the other hand, the members of staff that
are involved in the transfusion process must initiate action. Practices and methods
must be established to prevent errors. Furthermore, it is essential to have a robust
policy, implement systems that support the policy, assess the skills of staff
members against national standards and audit the process.
The cost benefit of RFID in light of its capability is enormous but requires NHS
funding.
77
4 New system implementation (Method 2)
The Trust had initially attempted to meet the requirements of MHRA guidelines
using a paper-based method, which failed to achieve 100% compliance. As the
guidelines required all Trusts to achieve 100% compliance this had become a
concern and the hospital management and transfusion teams were made aware of
the situation.
The Trust was not able to explore the electronic tracking systems described in
Chapter 3 because of lack of funding for this project. There were doubts about
whether it would be able to resolve the non-compliance issues. Consequently, the
Trust management asked the transfusion team to provide a business case for
alternative methods in order to achieve full compliance. This chapter describes and
evaluates the changes that were made to quality control processes to improve
traceability compliance at the Trust.
The new system consisted of an air-tube that was primarily designed for sending
samples from wards to the pathology department. In 2009 it was extended to
various other wards in the Trust who were asked to use it to return the labels from
transfused blood units. Every ward within the Trust was equipped with an air-tube
station and canisters. Samples and transfused labels sent directly to the blood
transfusion reception arrived within 60 seconds (Figure 4.1). An evaluation showed
that this brought about a huge improvement in traceability compliance
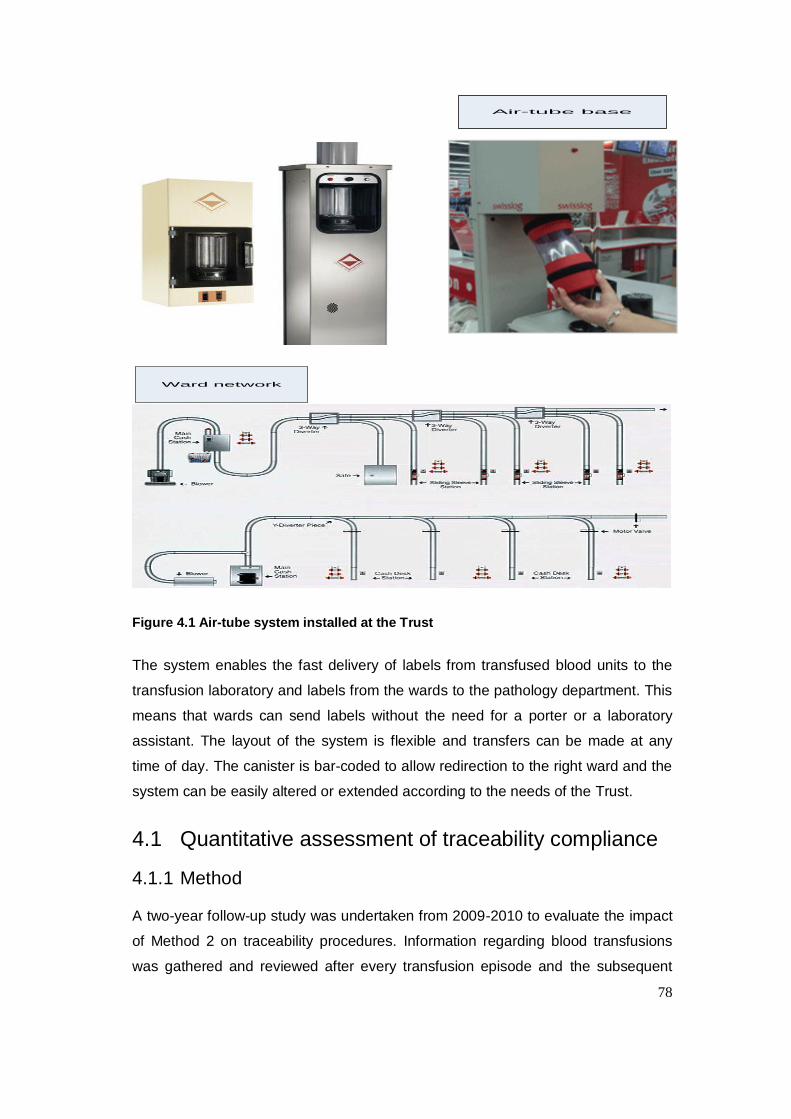
78
Air-tube base
Ward network
Figure 4.1 Air-tube system installed at the Trust
The system enables the fast delivery of labels from transfused blood units to the
transfusion laboratory and labels from the wards to the pathology department. This
means that wards can send labels without the need for a porter or a laboratory
assistant. The layout of the system is flexible and transfers can be made at any
time of day. The canister is bar-coded to allow redirection to the right ward and the
system can be easily altered or extended according to the needs of the Trust.
4.1 Quantitative assessment of traceability compliance
4.1.1 Method
A two-year follow-up study was undertaken from 2009-2010 to evaluate the impact
of Method 2 on traceability procedures. Information regarding blood transfusions
was gathered and reviewed after every transfusion episode and the subsequent
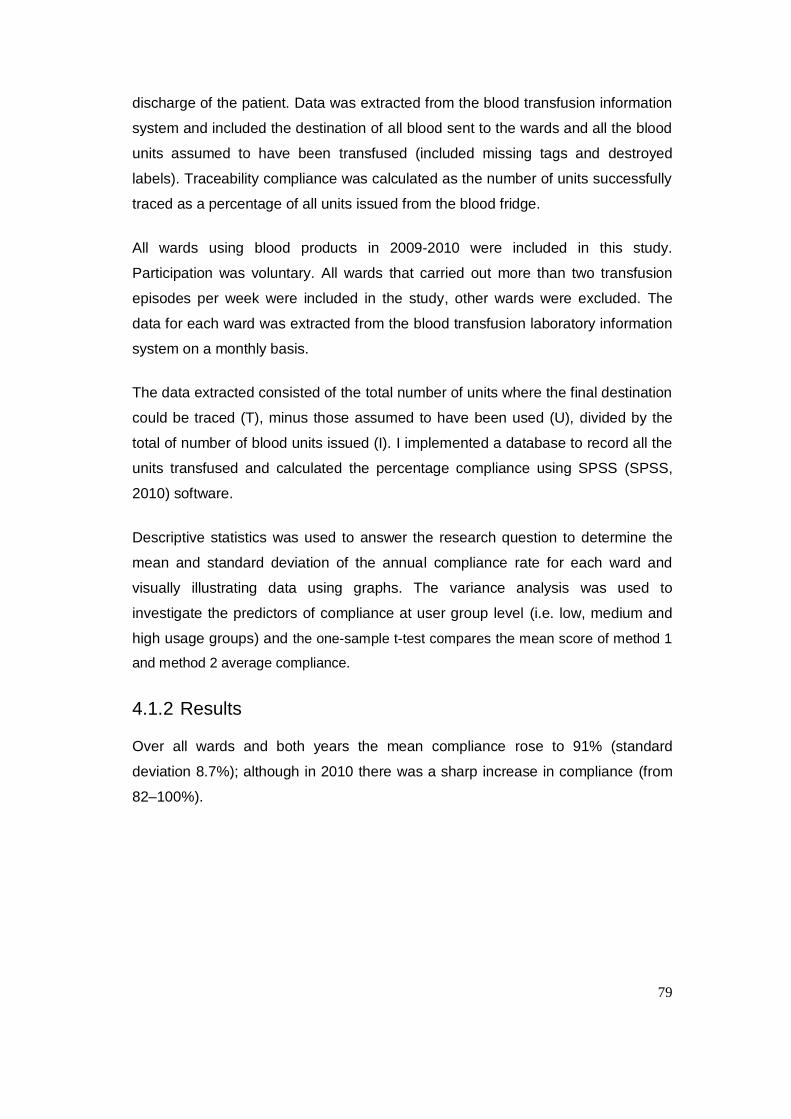
79
discharge of the patient. Data was extracted from the blood transfusion information
system and included the destination of all blood sent to the wards and all the blood
units assumed to have been transfused (included missing tags and destroyed
labels). Traceability compliance was calculated as the number of units successfully
traced as a percentage of all units issued from the blood fridge.
All wards using blood products in 2009-2010 were included in this study.
Participation was voluntary. All wards that carried out more than two transfusion
episodes per week were included in the study, other wards were excluded. The
data for each ward was extracted from the blood transfusion laboratory information
system on a monthly basis.
The data extracted consisted of the total number of units where the final destination
could be traced (T), minus those assumed to have been used (U), divided by the
total of number of blood units issued (I). I implemented a database to record all the
units transfused and calculated the percentage compliance using SPSS (SPSS,
2010) software.
Descriptive statistics was used to answer the research question to determine the
mean and standard deviation of the annual compliance rate for each ward and
visually illustrating data using graphs. The variance analysis was used to
investigate the predictors of compliance at user group level (i.e. low, medium and
high usage groups) and the one-sample t-test compares the mean score of method 1
and method 2 average compliance.
4.1.2 Results
Over all wards and both years the mean compliance rose to 91% (standard
deviation 8.7%); although in 2010 there was a sharp increase in compliance (from
82–100%).
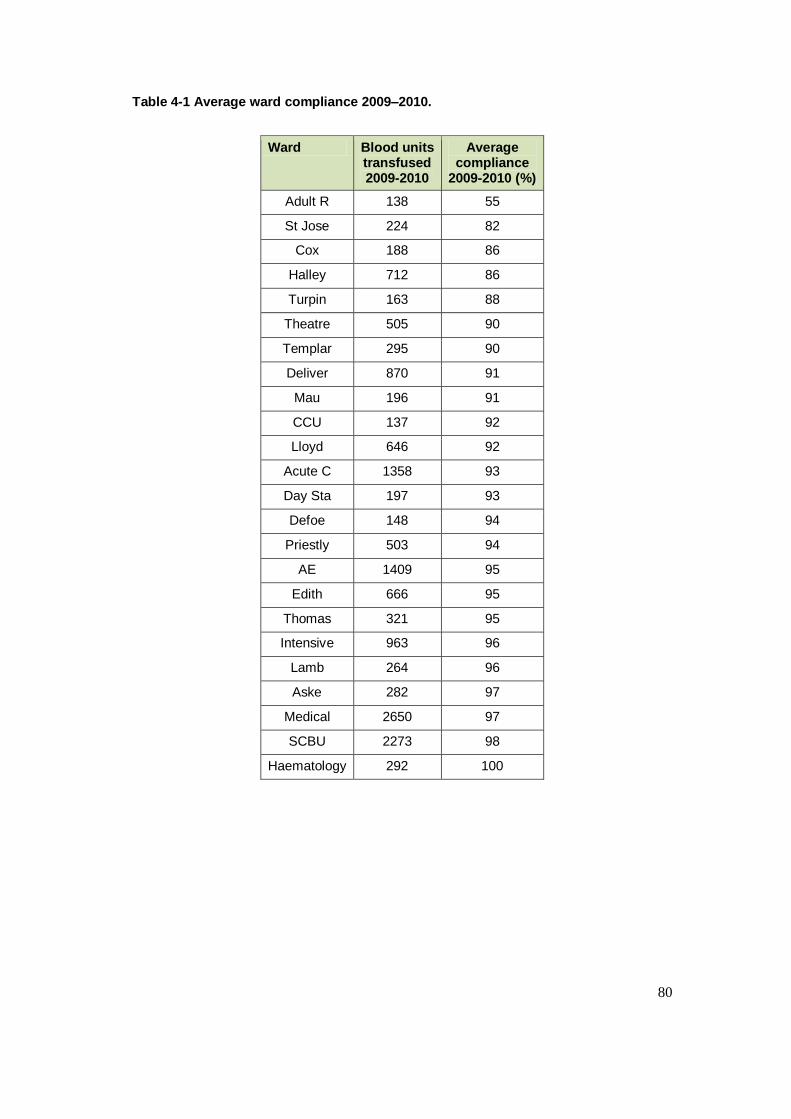
80
Table 4-1 Average ward compliance 2009–2010.
Ward Blood units transfused 2009-2010
Average compliance
2009-2010 (%)
Adult R 138 55
St Jose 224 82
Cox 188 86
Halley 712 86
Turpin 163 88
Theatre 505 90
Templar 295 90
Deliver 870 91
Mau 196 91
CCU 137 92
Lloyd 646 92
Acute C 1358 93
Day Sta 197 93
Defoe 148 94
Priestly 503 94
AE 1409 95
Edith 666 95
Thomas 321 95
Intensive 963 96
Lamb 264 96
Aske 282 97
Medical 2650 97
SCBU 2273 98
Haematology 292 100
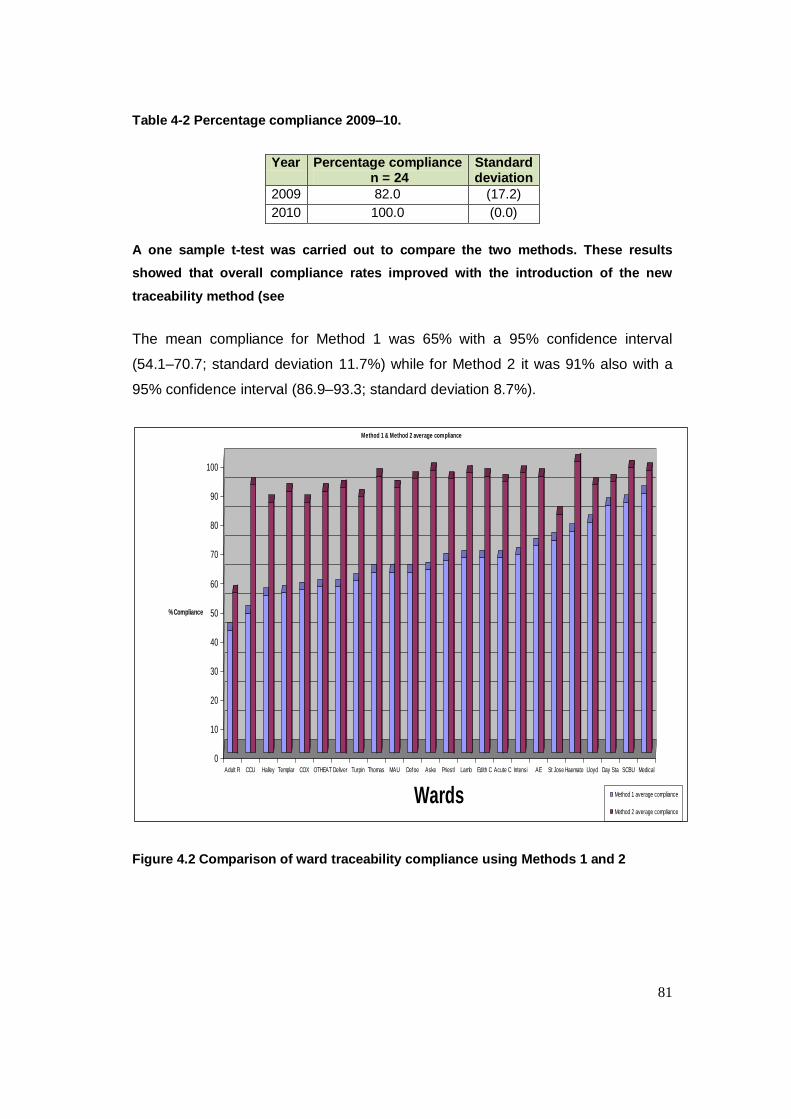
81
Table 4-2 Percentage compliance 2009–10.
Year Percentage compliance n = 24
Standard deviation
2009 82.0 (17.2)
2010 100.0 (0.0)
A one sample t-test was carried out to compare the two methods. These results
showed that overall compliance rates improved with the introduction of the new
traceability method (see
The mean compliance for Method 1 was 65% with a 95% confidence interval
(54.1–70.7; standard deviation 11.7%) while for Method 2 it was 91% also with a
95% confidence interval (86.9–93.3; standard deviation 8.7%).
0
10
20
30
40
50
60
70
80
90
100
% Compliance
Adult R CCU Halley Templar COX OTHEAT Deliver Turpin Thomas MAU Defoe Aske Priestl Lamb Edith C Acute C Intensi AE St Jose Haemato Lloyd Day Sta SCBU Medical
Wards
Method 1 & Method 2 average compliance
Method 1 average compliance
Method 2 average compliance
Figure 4.2 Comparison of ward traceability compliance using Methods 1 and 2
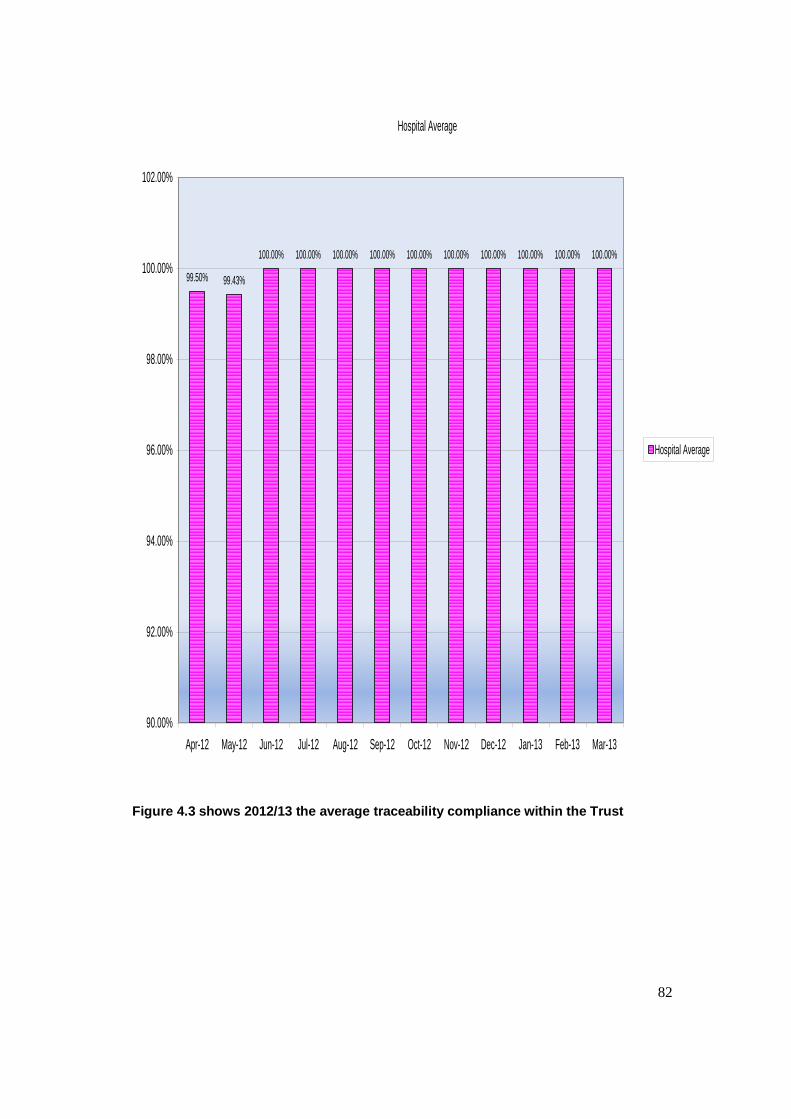
82
Hospital Average
99.50% 99.43%
100.00% 100.00% 100.00% 100.00% 100.00% 100.00% 100.00% 100.00% 100.00% 100.00%
90.00%
92.00%
94.00%
96.00%
98.00%
100.00%
102.00%
Apr-12 May-12 Jun-12 Jul-12 Aug-12 Sep-12 Oct-12 Nov-12 Dec-12 Jan-13 Feb-13 Mar-13
Hospital Average
Figure 4.3 shows 2012/13 the average traceability compliance within the Trust
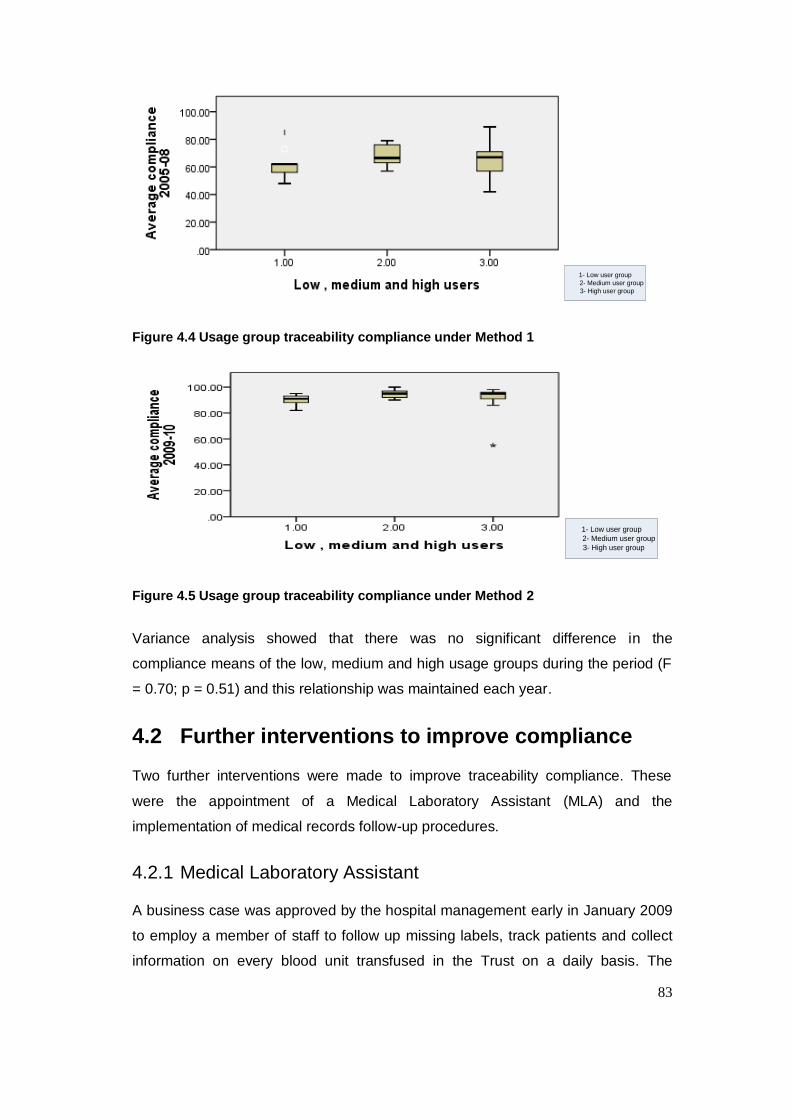
83
1- Low user group
2- Medium user group
3- High user group
Figure 4.4 Usage group traceability compliance under Method 1
1- Low user group
2- Medium user group
3- High user group
Figure 4.5 Usage group traceability compliance under Method 2
Variance analysis showed that there was no significant difference in the
compliance means of the low, medium and high usage groups during the period (F
= 0.70; p = 0.51) and this relationship was maintained each year.
4.2 Further interventions to improve compliance
Two further interventions were made to improve traceability compliance. These
were the appointment of a Medical Laboratory Assistant (MLA) and the
implementation of medical records follow-up procedures.
4.2.1 Medical Laboratory Assistant
A business case was approved by the hospital management early in January 2009
to employ a member of staff to follow up missing labels, track patients and collect
information on every blood unit transfused in the Trust on a daily basis. The
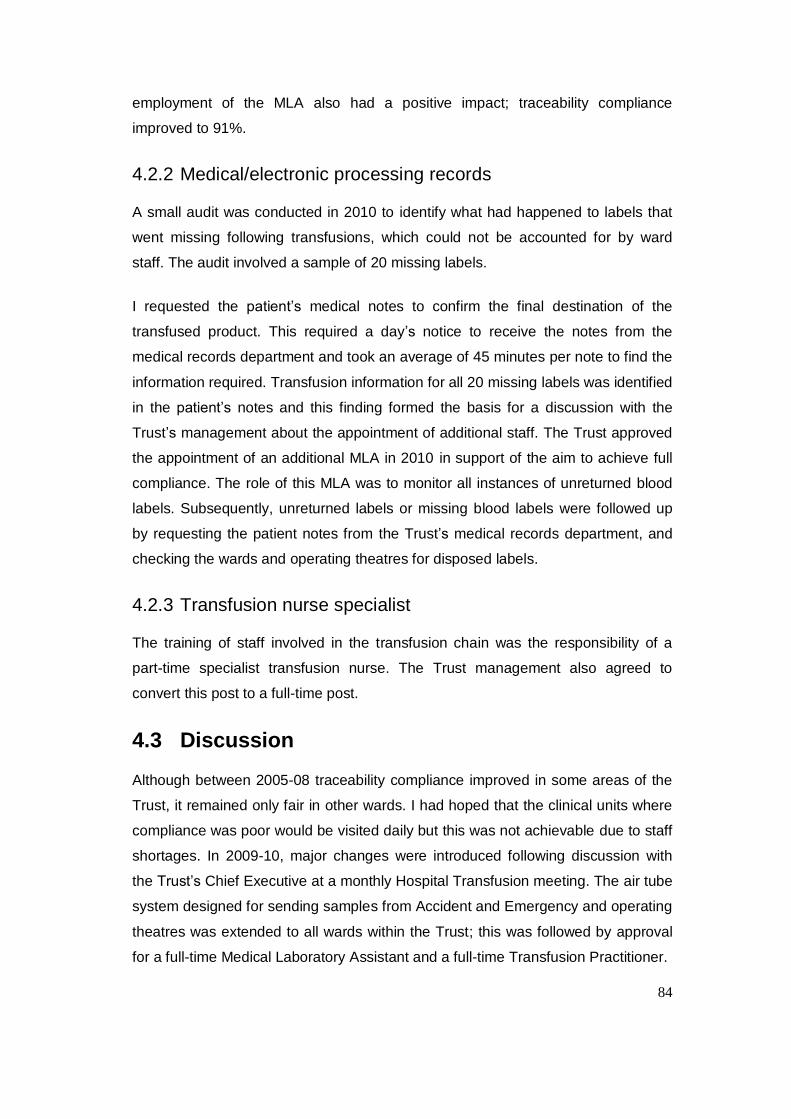
84
employment of the MLA also had a positive impact; traceability compliance
improved to 91%.
4.2.2 Medical/electronic processing records
A small audit was conducted in 2010 to identify what had happened to labels that
went missing following transfusions, which could not be accounted for by ward
staff. The audit involved a sample of 20 missing labels.
I requested the patient‟s medical notes to confirm the final destination of the
transfused product. This required a day‟s notice to receive the notes from the
medical records department and took an average of 45 minutes per note to find the
information required. Transfusion information for all 20 missing labels was identified
in the patient‟s notes and this finding formed the basis for a discussion with the
Trust‟s management about the appointment of additional staff. The Trust approved
the appointment of an additional MLA in 2010 in support of the aim to achieve full
compliance. The role of this MLA was to monitor all instances of unreturned blood
labels. Subsequently, unreturned labels or missing blood labels were followed up
by requesting the patient notes from the Trust‟s medical records department, and
checking the wards and operating theatres for disposed labels.
4.2.3 Transfusion nurse specialist
The training of staff involved in the transfusion chain was the responsibility of a
part-time specialist transfusion nurse. The Trust management also agreed to
convert this post to a full-time post.
4.3 Discussion
Although between 2005-08 traceability compliance improved in some areas of the
Trust, it remained only fair in other wards. I had hoped that the clinical units where
compliance was poor would be visited daily but this was not achievable due to staff
shortages. In 2009-10, major changes were introduced following discussion with
the Trust‟s Chief Executive at a monthly Hospital Transfusion meeting. The air tube
system designed for sending samples from Accident and Emergency and operating
theatres was extended to all wards within the Trust; this was followed by approval
for a full-time Medical Laboratory Assistant and a full-time Transfusion Practitioner.

85
Shulman, Saxena and Ramer (1999, p.595) highlighted that the main elements of a
quality approach for preventing identification errors include having a transfusion
safety officer, regular training, competent staff, system re-engineering and standard
operating procedures. Similarly, Doughty and Hitchinson (2010) identified the
factors associated with good levels of compliance as the appointment of a hospital
transfusion practitioner, electronic prescribing, having a medical laboratory
assistant in clinical units, timely feedback and reinforcing success. In the light of
these studies there are ongoing initiatives in the Trust to develop better testing and
assessment of competency for both clinical and laboratory staff. The major
changes made within the traceability procedure had improved our compliance to
100% as shown in fig. 4.3.
SHOT report (2011) pointed out that continued errors in the basic transfusion
process were disappointing given the various national initiatives and standards
introduced in the past ten years. They highlighted communication failures between
clinical and laboratory staff, and sharing care between hospitals or between
hospitals and the community as ongoing problems. In the project, good
communication helped to demonstrate that the new system had helped to solve the
issue of non-compliance.
Simple, innovative methods were developed to alert staff in the transfusion chain. A
barcode label was created to simplify data input into the hospital‟s information
system and minimise errors. This was attached to every blood product issued.
4.4 Change management
This project attempted to ensure the rapid adoption of traceability compliance by
wards in the Trust and improve the attitude of stakeholders to patient safety. A
major challenge of the project was to instigate a change in staff behaviour,
encourage them to move away from ritualistic practice and demonstrate that
change can be a good thing. It was difficult to introduce change in such a complex
setting and I encountered difficulties in breaking old habits.
Change management has been an integral part of organisational theory and
practice for a long time. Indeed, some suggest that the future survival of all
organisations will depend on their ability to successfully manage change (Burnes,
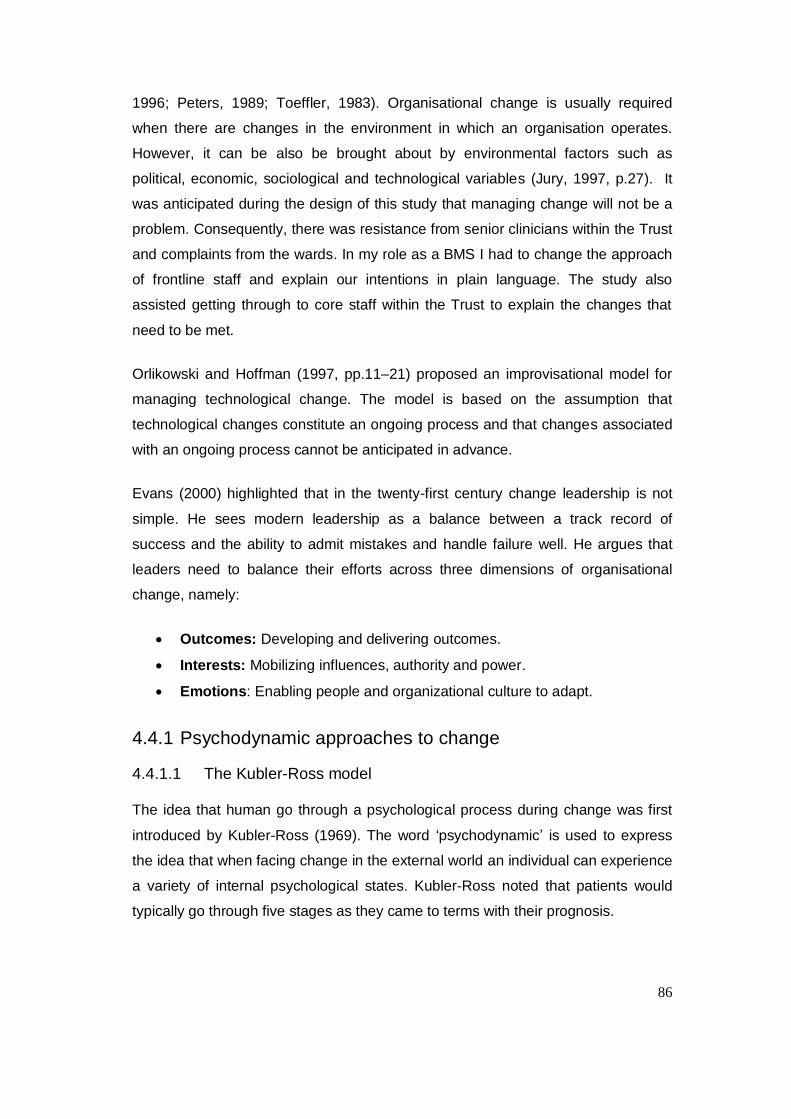
86
1996; Peters, 1989; Toeffler, 1983). Organisational change is usually required
when there are changes in the environment in which an organisation operates.
However, it can be also be brought about by environmental factors such as
political, economic, sociological and technological variables (Jury, 1997, p.27). It
was anticipated during the design of this study that managing change will not be a
problem. Consequently, there was resistance from senior clinicians within the Trust
and complaints from the wards. In my role as a BMS I had to change the approach
of frontline staff and explain our intentions in plain language. The study also
assisted getting through to core staff within the Trust to explain the changes that
need to be met.
Orlikowski and Hoffman (1997, pp.11–21) proposed an improvisational model for
managing technological change. The model is based on the assumption that
technological changes constitute an ongoing process and that changes associated
with an ongoing process cannot be anticipated in advance.
Evans (2000) highlighted that in the twenty-first century change leadership is not
simple. He sees modern leadership as a balance between a track record of
success and the ability to admit mistakes and handle failure well. He argues that
leaders need to balance their efforts across three dimensions of organisational
change, namely:
Outcomes: Developing and delivering outcomes.
Interests: Mobilizing influences, authority and power.
Emotions: Enabling people and organizational culture to adapt.
4.4.1 Psychodynamic approaches to change
4.4.1.1 The Kubler-Ross model
The idea that human go through a psychological process during change was first
introduced by Kubler-Ross (1969). The word „psychodynamic‟ is used to express
the idea that when facing change in the external world an individual can experience
a variety of internal psychological states. Kubler-Ross noted that patients would
typically go through five stages as they came to terms with their prognosis.
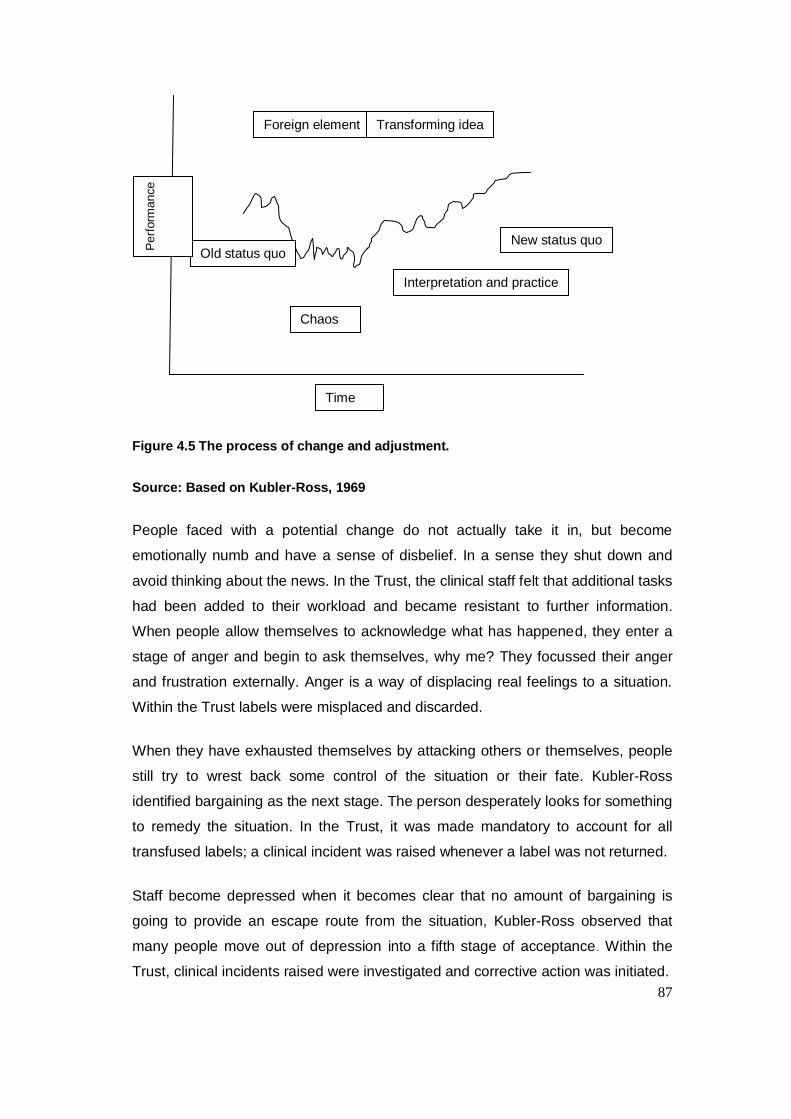
87
Figure 4.5 The process of change and adjustment.
Source: Based on Kubler-Ross, 1969
People faced with a potential change do not actually take it in, but become
emotionally numb and have a sense of disbelief. In a sense they shut down and
avoid thinking about the news. In the Trust, the clinical staff felt that additional tasks
had been added to their workload and became resistant to further information.
When people allow themselves to acknowledge what has happened, they enter a
stage of anger and begin to ask themselves, why me? They focussed their anger
and frustration externally. Anger is a way of displacing real feelings to a situation.
Within the Trust labels were misplaced and discarded.
When they have exhausted themselves by attacking others or themselves, people
still try to wrest back some control of the situation or their fate. Kubler-Ross
identified bargaining as the next stage. The person desperately looks for something
to remedy the situation. In the Trust, it was made mandatory to account for all
transfused labels; a clinical incident was raised whenever a label was not returned.
Staff become depressed when it becomes clear that no amount of bargaining is
going to provide an escape route from the situation, Kubler-Ross observed that
many people move out of depression into a fifth stage of acceptance. Within the
Trust, clinical incidents raised were investigated and corrective action was initiated.
Old status quo
Chaos
Interpretation and practice
Foreign element Transforming idea
New status quo
Perf
orm
ance
Time
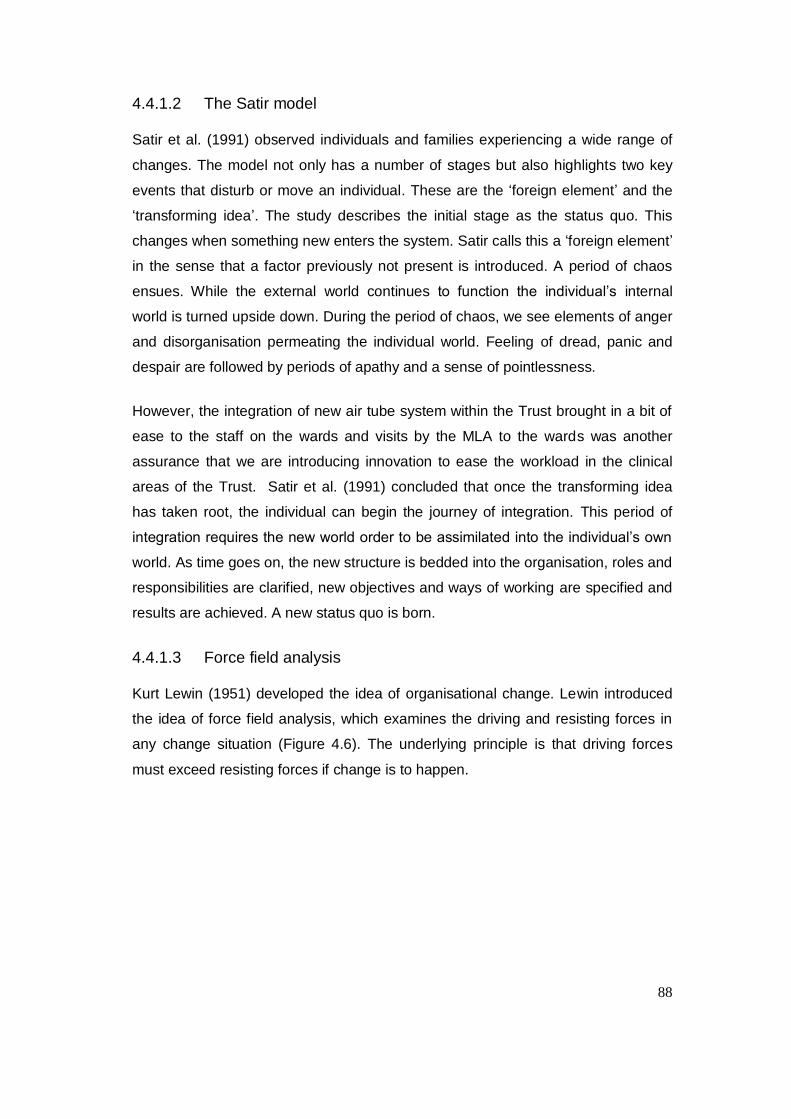
88
4.4.1.2 The Satir model
Satir et al. (1991) observed individuals and families experiencing a wide range of
changes. The model not only has a number of stages but also highlights two key
events that disturb or move an individual. These are the „foreign element‟ and the
„transforming idea‟. The study describes the initial stage as the status quo. This
changes when something new enters the system. Satir calls this a „foreign element‟
in the sense that a factor previously not present is introduced. A period of chaos
ensues. While the external world continues to function the individual‟s internal
world is turned upside down. During the period of chaos, we see elements of anger
and disorganisation permeating the individual world. Feeling of dread, panic and
despair are followed by periods of apathy and a sense of pointlessness.
However, the integration of new air tube system within the Trust brought in a bit of
ease to the staff on the wards and visits by the MLA to the wards was another
assurance that we are introducing innovation to ease the workload in the clinical
areas of the Trust. Satir et al. (1991) concluded that once the transforming idea
has taken root, the individual can begin the journey of integration. This period of
integration requires the new world order to be assimilated into the individual‟s own
world. As time goes on, the new structure is bedded into the organisation, roles and
responsibilities are clarified, new objectives and ways of working are specified and
results are achieved. A new status quo is born.
4.4.1.3 Force field analysis
Kurt Lewin (1951) developed the idea of organisational change. Lewin introduced
the idea of force field analysis, which examines the driving and resisting forces in
any change situation (Figure 4.6). The underlying principle is that driving forces
must exceed resisting forces if change is to happen.
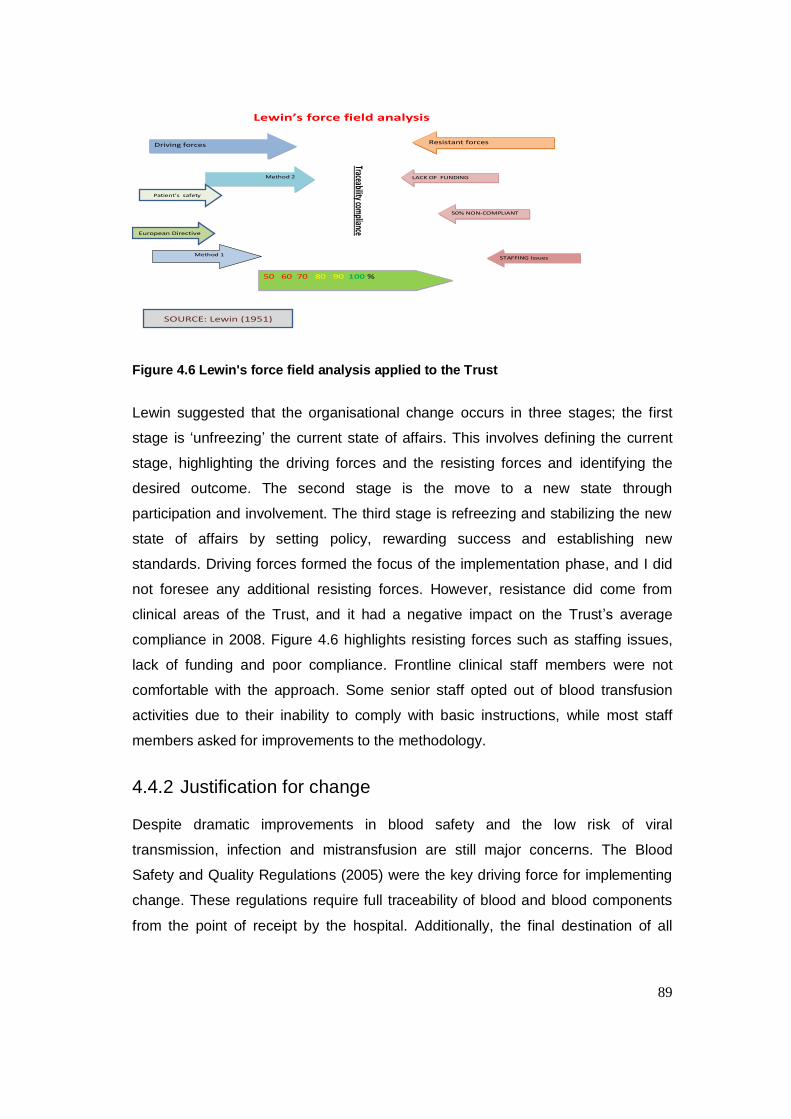
89
Driving forcesDriving forces
Method 2Method 2
Method 1
Traceability compliance
Resistant forcesResistant forces
LACK OF FUNDINGLACK OF FUNDING
50% NON-COMPLIANT50% NON-COMPLIANT
STAFFING IssuesSTAFFING Issues
50 60 70 80 90 100 %50 60 70 80 90 100 %
Lewin’s force field analysis
SOURCE: Lewin (1951)
Patient’s safety
European Directive
Figure 4.6 Lewin's force field analysis applied to the Trust
Lewin suggested that the organisational change occurs in three stages; the first
stage is „unfreezing‟ the current state of affairs. This involves defining the current
stage, highlighting the driving forces and the resisting forces and identifying the
desired outcome. The second stage is the move to a new state through
participation and involvement. The third stage is refreezing and stabilizing the new
state of affairs by setting policy, rewarding success and establishing new
standards. Driving forces formed the focus of the implementation phase, and I did
not foresee any additional resisting forces. However, resistance did come from
clinical areas of the Trust, and it had a negative impact on the Trust‟s average
compliance in 2008. Figure 4.6 highlights resisting forces such as staffing issues,
lack of funding and poor compliance. Frontline clinical staff members were not
comfortable with the approach. Some senior staff opted out of blood transfusion
activities due to their inability to comply with basic instructions, while most staff
members asked for improvements to the methodology.
4.4.2 Justification for change
Despite dramatic improvements in blood safety and the low risk of viral
transmission, infection and mistransfusion are still major concerns. The Blood
Safety and Quality Regulations (2005) were the key driving force for implementing
change. These regulations require full traceability of blood and blood components
from the point of receipt by the hospital. Additionally, the final destination of all
90
components should be retained in a readily available and recoverable format for
thirty years.
4.4.3 Funding and training
It is important to note that funding was a concern. Hiring additional staff to help to
achieve compliance with the new regulations was a challenge for the Trust. The
potential benefits of electronic tracking systems will be explored when funding
becomes available and a cost-benefit analysis will have to be carried out.
An in-house training session was developed for all staff involved in the transfusion
process and it is now a mandatory requirement that only trained staff members can
collect and administer blood products.
4.5 Clinical implications
This study has shown that several aspects of blood product traceability require
more rigorous research. For example, there are few studies that have looked at
traceability procedures after a blood product leaves the blood fridge. The impact of
temperature and electromagnetic radiation on blood products has not been fully
investigated and bacteria contamination has only been investigated. Few studies
have examined how blood products were traced offsite or when patients are in
transit or at home.
91
5 Application to practice
To reiterate briefly, the aims of the project were to explore reasons why traceability
compliance was poor within the Trust and identify why compliance varied between
wards. The key objectives were:
To assess traceability compliance for blood products in all wards of the
Trust and identify the processes that led to poor compliance.
To select an appropriate traceability model and labelling procedure for
blood products.
The results of the study showed that blood transfusion is a complex chain that
involves many stages. Some key variables were identified that had immediate
financial and business benefits i.e. there was a drop in wastage of blood within the
Trust, staff communication with transfusion department improved, more staff
phoned the department and were willing to get involved in the training and
assessment programme.
It also showed that training varied between wards and few wards were equipped
with a trainer. In fact, the majority of ward staff only had a formal introduction to
blood transfusion during their induction when they were first employed by the Trust.
Consequently, ward staff were not sure how to return transfusion labels to the
laboratory. Wards that carried out a large number of transfusions were more
compliant that wards that only did them occasionally.
The study also showed that traceability processes vary from Trust to Trust and the
most Trusts anticipated that they would request tenders for an electronic tracker
system in the future.
The study‟s objectives were as follows:
To examine the transferability of this evaluation and reflect on the impact on
practice.
92
5.1 Evidence of achievements
As a result of the project, the following objectives were met.
Objective 1.
To undertake a six year cohort study to identify the risk factors of traceability
compliance for blood products within all wards of the Homerton University
Hospital NHS Trust and identify the processes that lead to poor compliance.
Specialist transfusion nurse: It was evident from my report that, the
wards with a trainer had better traceability compliance. The report of my
findings was sent to the Hospital Transfusion Committee, which agreed that
we could submit a business case for a specialist transfusion nurse because
the frontline staff lacked the skills in blood transfusion. It took a further three
years to get funding but eventually the Trust approved full funding for the
position.
Development of competency: Following the appointment of the specialist
transfusion nurse, a skills assessment was developed to be taken by all
staff involved in the collection and administration of blood products.
Although the proposal was not welcomed by clinicians it eventually became
mandatory. Training has begun, but only 20% of staff members have been
assessed.
Provision of clinical supervision: There is now a system in place to
support all staff involved in blood transfusion, day and night. Academic
training has been provided to improve practice. The training is cascaded by
the specialist transfusion nurse and credits are awarded to participants to
promote professional development.
Objective 2
To select an appropriate traceability model and labelling procedure for blood
products within the Homerton University Hospital NHS Trust.
The Trust Chief Executive approved funding for the extension of the air-tube
system to the various wards within the Trust. The evidence gathered from the
auditing of patient‟s note resulted to the submission of a business case which
93
eventually led to the appointment of an MLA. This had impact on practice by
improving the return rate of labels from 90% to 100% and also investigating what
had happened to blood units with missing labels.
Air tube system: This was ordered by the pathology manager to improve
the turnaround time of samples sent from the various wards. Ward
managers were asked to use this traceability system to return labels to the
transfusion laboratory as soon as the transfusion was completed.
Redesign of information technology: Transfusion labels and forms were
redesigned to include the date, time and signature of the staff member that
checked the product at the bedside before the transfusion began. Currently
there are two different systems in place which do not comply with the
requirement for full traceability of blood products.
Objective 3
To assess the impact on traceability compliance at the Trust.
Annual skills check: it has become mandatory for all staff to be re-
assessed annually to prove that they are fit to practice. In the event of non-
compliance they are re-trained and assessed before being allowed to
collect or administer blood products.
Development of clinical guidelines: The Trust intranet has been updated
to cover aspects of Blood Safety and Quality Regulations and provide links
to examples of good practice, quality improvement and information about
clinical audits on blood transfusion topics, monthly feedback of traceability
compliance.
Objective 4
To evaluate the cost effectiveness of the traceability model.
The cost effectiveness of the traceability model was not fully met in this study
but the direct cost savings in wastage was evaluated in this study. I make a
total of £67,790 saving over a 6 year period see Table 5-1.
94
The following sections provide an overview of the implementation of these
recommendations, although it is not possible to provide complete details of the
planning, development and implementation of each initiative.
5.1.1 Specialist transfusion nurse
The study demonstrated that the role of a specialist transfusion nurse is crucial in
the delivery of an effective service. Results showed that wards with a trainer had
better traceability compliance than wards with no trainers. It was also clear that
supervision and training from a practitioner with skills in transfusion was an
essential requirement. The final outcome of the research was initiatives designed to
meet the need identified by the study. In particular:
Teach and support frontline staff throughout their induction and while
working on the wards.
Offer information and support to frontline staff on a daily basis.
Promote a range of continuous professional development options for staff
responsible for the collection and administration of blood and its products.
Assist staff in their training and become more proactive in identifying their
learning needs.
Promote and offer clinical supervision for the collection and transfusion of
blood products.
Liaise with transfusion laboratory scientific staff on clinical staff learning.
Plan, teach and support practice nurses throughout their induction training
programme.
This finding enabled the development of a tool for all frontline staff to encourage
them to maintain a personal development plan. This initiative was in keeping with
the requirement of the General Medical Services contract (Department of Health,
2003). It also provided supporting evidence for progression through the knowledge
and skills framework along within the Agenda for Change implementation
(Department of Health, 2004).
5.1.2 Skills assessment
In response to concerns from the National Patient Safety Agency, the clinical
governance committee suggested a training programme and competency
95
assessment designed to meet personal and professional accountability
requirements. This initiative prompted the development of an in-house weekly
training programme followed by a competency assessment. This new initiative
enabled frontline staff involved in the collection and administration of blood to
understand the issues, share their concerns and challenge evidence, which led to
improvements in the services provided by the Trust. In addition, a forum was
organised to improve awareness of blood transfusion services within the Trust.
5.1.3 Redesign of information technology
It was apparent that frontline staff involved in the transfusion chain lacked the skills
to handle evidence-based information. The hospital intranet was updated with more
information on transfusion services and hand-outs were made available. Nurses
were encouraged to enter all records of transfusion procedures into the information
system for accurate traceability.
5.1.4 Medical laboratory assistant (MLA)
The data obtained from this research revealed that there were various methods for
returning transfusion labels to the department. It was evident that although some
labels were left on the wards and others were found in the disposal bin the majority
were sent through the air-tube system. The appointment of an MLA had impact on
practice by improving the return rate of labels and also investigating what had
happened to blood units with missing labels. The appointment of an MLA met the
need highlighted in the study by:
Improving traceability of labels after the completion of the transfusion.
Encouraging frontline staff to call the laboratory when labels were
misplaced or destroyed.
Identifying areas of poor traceability compliance within the Trust as a
stimulus for more training.
Minimising potential problems in the surgical setting where there was
previously low compliance.
96
5.1.5 Air tube system
The air tube system installed at the Trust alleviated the pressure of returning the
labels from transfused products to the laboratory promptly. The system has also
changed and improved the rate of return to the pathology laboratory. The return of
the labels enables the transfusion department to track the destination of the unit
and update the system within 4-8 hours following the transfusion. Annual skills
check
Clinical governance introduced systems for continuing professional development
(Department of Health, 1997). These systems are monitored and linked to
registration, peer assessment, evidence-based standards of care and individual
appraisal (Barr, 2000, p.81). Clinical governance is concerned with the ways in
which the National Health Service can improve and maintain the quality of care and
services provided for patients (Scally & Donaldson, 1998, p.61). National
Occupation Standards were developed to raise the standard of practice in a given
sector and providing a benchmark against which the performance of both the
individual and the organization could be assessed and measured. These standards
provide a systematic approach to the establishment of good practice, supported by
a clear framework of underpinning knowledge, standards and expected outcomes
(National Institute for Mental Health in England, 2003, p.3, 5).
5.2 Cost-benefit analysis
There has been a drop in annual blood wastage within the Trust from 290 units in
2006 to 100 units in 2011. The benefit of these savings amounted to £67,790 over
the five year period within the Trust. The cost of for the full implementation was not
evaluated in this study. The average cost of a full tracking system in a medium size
hospital was valued at £350,000 excluding training and staffing during our lunch
time presentation by vendors. The main area of cost impact were the appointment
of a transfusion practitioner, a medical laboratory assistant and installation of the
air-tube system within Trust. Porters were not needed to carry out deliveries, the
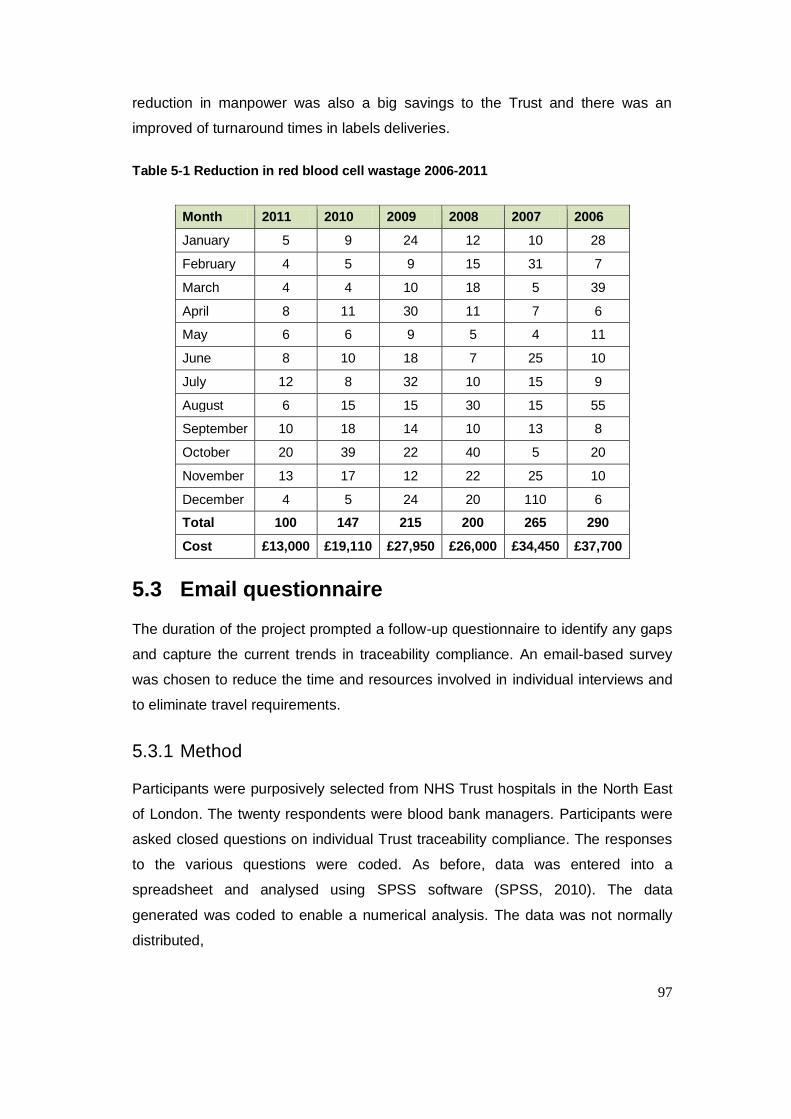
97
reduction in manpower was also a big savings to the Trust and there was an
improved of turnaround times in labels deliveries.
Table 5-1 Reduction in red blood cell wastage 2006-2011
Month 2011 2010 2009 2008 2007 2006
January 5 9 24 12 10 28
February 4 5 9 15 31 7
March 4 4 10 18 5 39
April 8 11 30 11 7 6
May 6 6 9 5 4 11
June 8 10 18 7 25 10
July 12 8 32 10 15 9
August 6 15 15 30 15 55
September 10 18 14 10 13 8
October 20 39 22 40 5 20
November 13 17 12 22 25 10
December 4 5 24 20 110 6
Total 100 147 215 200 265 290
Cost £13,000 £19,110 £27,950 £26,000 £34,450 £37,700
5.3 Email questionnaire
The duration of the project prompted a follow-up questionnaire to identify any gaps
and capture the current trends in traceability compliance. An email-based survey
was chosen to reduce the time and resources involved in individual interviews and
to eliminate travel requirements.
5.3.1 Method
Participants were purposively selected from NHS Trust hospitals in the North East
of London. The twenty respondents were blood bank managers. Participants were
asked closed questions on individual Trust traceability compliance. The responses
to the various questions were coded. As before, data was entered into a
spreadsheet and analysed using SPSS software (SPSS, 2010). The data
generated was coded to enable a numerical analysis. The data was not normally
distributed,
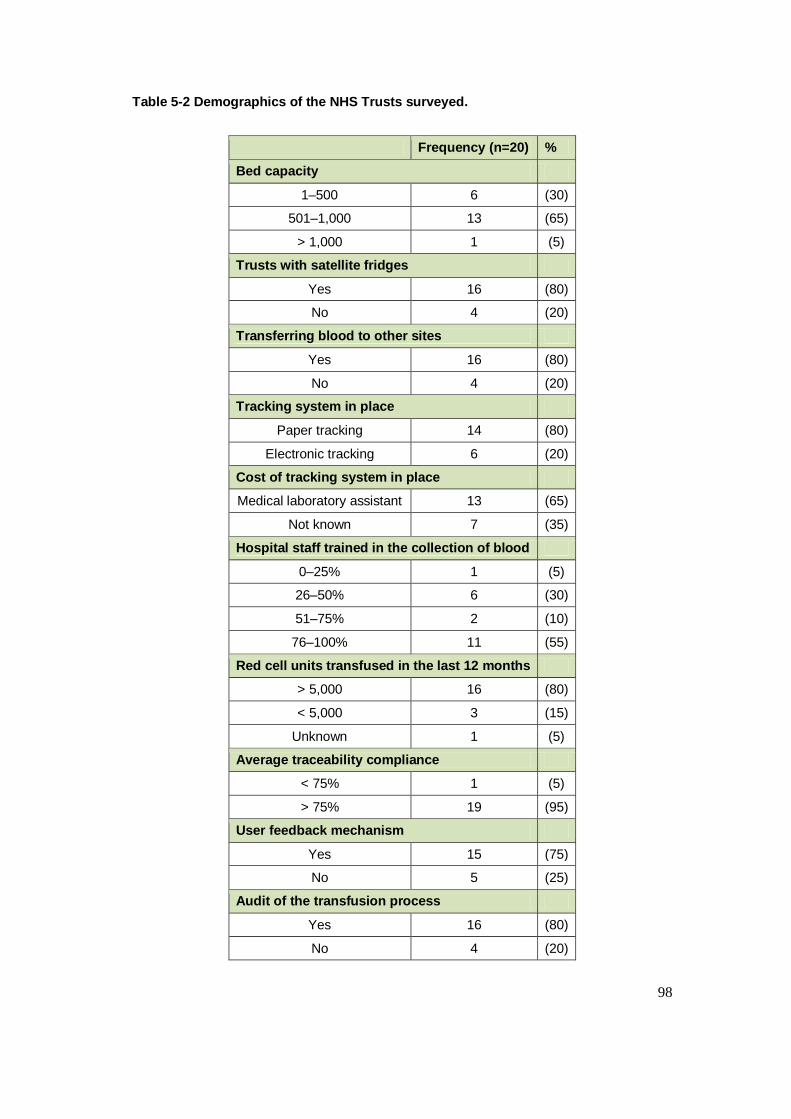
98
Table 5-2 Demographics of the NHS Trusts surveyed.
Frequency (n=20) %
Bed capacity
1–500 6 (30)
501–1,000 13 (65)
> 1,000 1 (5)
Trusts with satellite fridges
Yes 16 (80)
No 4 (20)
Transferring blood to other sites
Yes 16 (80)
No 4 (20)
Tracking system in place
Paper tracking 14 (80)
Electronic tracking 6 (20)
Cost of tracking system in place
Medical laboratory assistant 13 (65)
Not known 7 (35)
Hospital staff trained in the collection of blood
0–25% 1 (5)
26–50% 6 (30)
51–75% 2 (10)
76–100% 11 (55)
Red cell units transfused in the last 12 months
> 5,000 16 (80)
< 5,000 3 (15)
Unknown 1 (5)
Average traceability compliance
< 75% 1 (5)
> 75% 19 (95)
User feedback mechanism
Yes 15 (75)
No 5 (25)
Audit of the transfusion process
Yes 16 (80)
No 4 (20)
99
5.3.2 Results
Table 5-2 showed that out of 30 emails sent to blood bank managers, 20
responses (66%) were acknowledged. The results obtained were similar to my
previous study on page 71. There was a positive correlation between transfusion
and traceability compliance (r = 0.59; p = 0.01) and training but with no significant
difference (r = 0.30; p = 0.38).
5.4 Summary
The findings from the study reiterated that the importance of continuous
professional development and skills assessments cannot be overemphasized,
effective training at ward level improved traceability compliance.
The findings from this study also reiterated the importance of a trained specialist
transfusion nurse who can provide support and training to frontline personnel
involved in the collection and transfusion of blood products. Their role is also to
ensure that training and the delivery of healthcare meet acceptable standards. The
research highlighted the importance of training and continuing professional
development. Wards where there are trainers provide a higher standard of care
than wards without a trainer.
I also found out that wards that carried out many transfusions performed better
than those that only carried out a few. This information enabled enhanced training
to be provided in the poorly performing units.
The project provided an insight into the variety of services delivered to the end-
users of transfusion services. It highlighted a lack of training tools; poor procedures
for the return of labels and the unreliability of porters. Poor communication between
the laboratory and end-users was identified as another issue. The response to
these problems led to the innovative use of the air tube system and greater incident
reporting at every stage of the transfusion process.
The initial survey provided a baseline from the problems that can be encountered
at the blood collection point and in the bedside checking procedure. The issues that
were identified included incomplete documentation brought to the blood collection
point and untrained personnel collecting blood products at the blood collection
100
point. The problem of blood product collection was addressed by providing security
locks on the blood fridges to deter untrained staff collecting blood products, In
greater number of cases this had been effective. It has become mandatory that two
nurses must check blood products administered on the wards.
It became evident that traceability compliance varied from one Trust to the other
and various strategies were being deployed to attain full compliance. Technology
has been introduced by many Trusts, but in this case there was neither the time nor
the money to investigate it fully. This may not be so much of a problem; the study
by Murphy et al. (2004) observed that most tracking systems could be overridden
and concluded that such systems could only assist in reducing errors. Arinsburg et
al.,(2011) also concluded from their study that additional training in transfusion
medicine would be beneficial by physicians in all specialities. This was based on
their findings from the survey conducted which demonstrated lack of knowledge of
transfusion medicine across all specialities and all training levels.
It was also evident that previous studies had only focused on blood product
traceability and not on the direct or indirect variables that affected traceability e.g.
ward size, transfusion times, training, traceability methods, transfusion volume,
emergency situations, training and errors in the transfusion chain. The full impact of
traceability will only become clear when more rigorous, large-scale studies are
conducted that take into consideration all possible variables.

101
6 Reflection
My enrolment onto the professional doctorate has been an attempt to advance the
scope of my practice and become a competent professional. I have found the
professional doctorate to be both challenging and rewarding. The course has
improved how I think about different situations and how I function as an advanced
practitioner.
According to Honey and Munford (1992) I was exposed to new experiences
compared to my prior learning. The professional doctorate influenced me to adopt a
new learning style as an activist and a reflective thinker. Active learning engages
students in class activities was encouraged and cooperative learning (working in
small group teams under conditions that hold all team members accountable for the
learning objective associated with the assignment (Felder and Brent, 2003, pp.282-
283).
The curriculum was well-structured and related to my employment. There were
opportunities to ask questions and read extensively in order to confirm any unclear
evidence which I have missed during my previous learning.
Berhold et al. (2000, p.191) described two groups of students, one taught in a circle
and the other taught with tradition methods. The course grade of the two groups
were compared and indicated that the traditionally taught students were more likely
to get lower grades than the students taught in a circle. They concluded that holistic
instruction may help a more diverse group to succeed. According to Kolb (1993,
pp.3-4), learning begins with a concrete experience; the effect is reflective
observation, documenting what happened and making sense, then investigating or
theorizing. This allows conclusions to be drawn and plans to be made in order to
take further action based on the experience.
Felder and Brent (2004, p.269) proposed five instructional conditions that provide a
balance of challenge and need to promote intellectual growth:
Variety and choice of learning tasks.
Explicit communication and explanation of expectation.
Modelling, practice and constructive feedback.
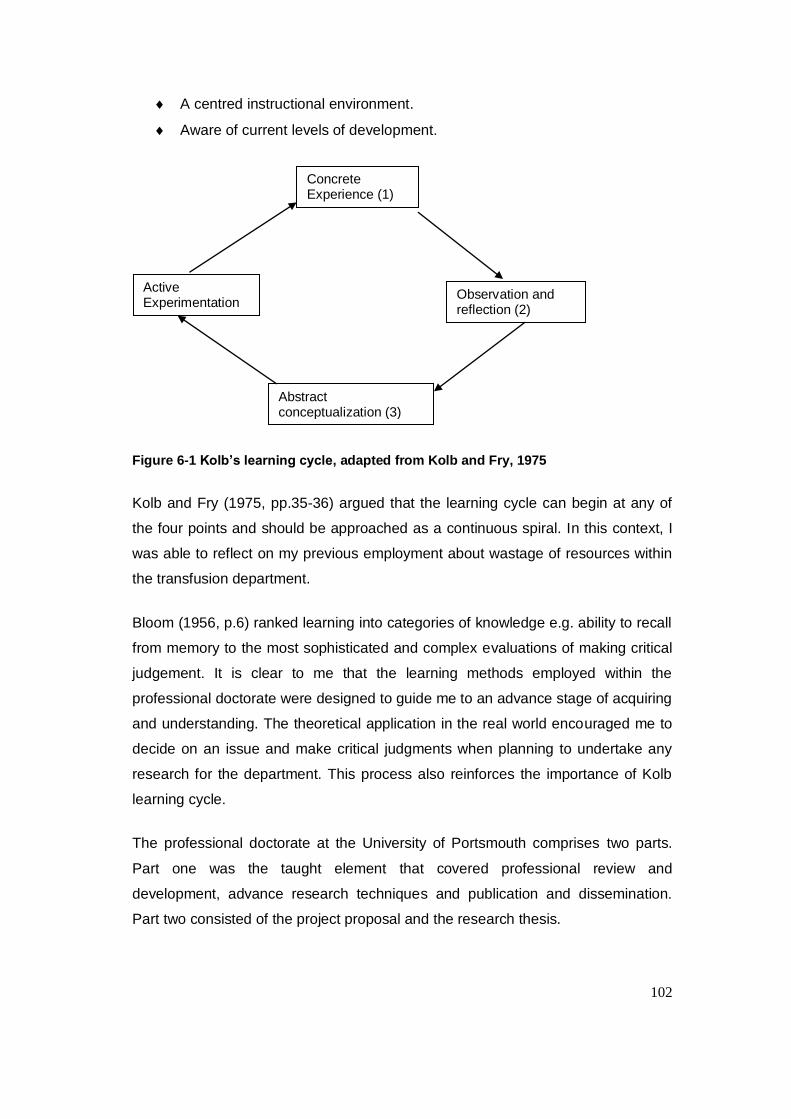
102
A centred instructional environment.
Aware of current levels of development.
Figure 6-1 Kolb’s learning cycle, adapted from Kolb and Fry, 1975
Kolb and Fry (1975, pp.35-36) argued that the learning cycle can begin at any of
the four points and should be approached as a continuous spiral. In this context, I
was able to reflect on my previous employment about wastage of resources within
the transfusion department.
Bloom (1956, p.6) ranked learning into categories of knowledge e.g. ability to recall
from memory to the most sophisticated and complex evaluations of making critical
judgement. It is clear to me that the learning methods employed within the
professional doctorate were designed to guide me to an advance stage of acquiring
and understanding. The theoretical application in the real world encouraged me to
decide on an issue and make critical judgments when planning to undertake any
research for the department. This process also reinforces the importance of Kolb
learning cycle.
The professional doctorate at the University of Portsmouth comprises two parts.
Part one was the taught element that covered professional review and
development, advance research techniques and publication and dissemination.
Part two consisted of the project proposal and the research thesis.
Abstract conceptualization (3)
Active Experimentation
Observation and reflection (2)
Concrete Experience (1)
103
I was motivated throughout the course to learn new skills in research methodology,
which I have overlooked in the past. The qualitative analysis was a challenge that
was completely new to me, which I later found useful. It became obvious that I
needed to focus more to understand this aspect. Aspects were the publication and
dissemination module, and research and development that I found more relevant
in. I have put this process into practice in decision-making as well as the
modification of the training programme for Biomedical Scientist undertaking
professional portfolio examination in Biomedical Sciences.
Part two of the course entailed completing an innovative research project that can
also help in providing data in support of evidence-based information in blood
transfusion.
I was excited to start this thesis that aimed to implement and evaluate blood
product traceability procedures at the Homerton University Hospital NHS Trust. In
the initial stages, it was clear that coordination was a problem because of a lack of
funding to implement a tracking system and the lack of support from management.
Most of the activities aimed at achieving good traceability compliance were carried
out behind closed doors and a lot of phone calls were made in order to follow up on
poor compliance within the Trust. This meant that there was a heavy workload for
myself and junior staff in the department and a steep learning curve. The project
entailed big changes within the Trust which I overlooked in the early stages. While
not stopping to think before taking action can produce spectacular results, I can
recall that on many occasions I made things worse by blaming frontline staff and
raising incident reports. Although this is normal procedure it did not resolve the
problem of poor compliance. This happened because I failed to stop and think
before trying to changes things. Later, I realised that I had to take a broader,
educational approach to deal with the situation and frontline staff.
The visit by the Medicines and Healthcare products Regulatory Agency (MHRA) at
an early stage of my project resulted in a change in direction concerning how
traceability was perceived by frontline staff. The visit reinforced the importance of
achieving full compliance, particularly as the Trust‟s management including the
Chief Executive were present to hear the MHRA‟s summary of the inspection. This
showed that traceability compliance was poor and that there were no structures in
104
place or indications that the Trust was addressing the situation. This gave my work
fresh impetus and management then took a lot of interest in my area of study.
I realised that I must take time to review the situation and consider theoretical
aspects prior to commencing any work. I was aware of the risk that I might lose
focus when working on such a large project, but I have a good record of bringing
tasks to completion. I believe that I have achieved success when I have
unconsciously taken the approach of breaking the task down into smaller bits, and
approaching the problem logically. I now appreciate that this approach includes
reflection as it creates natural breaks where I have been able to reflect upon what
has been done and plan what remains to be done; this has contributed to my
success.
The Trust‟s Chief Executive became involved when a message was sent to all staff
members saying that the collection, handling and usage of blood products was an
area of great concern. I realised at this stage that a few senior clinicians had opted
out, but the majority of frontline staff members were happy to be trained and
assessed.
In 2008, I was nominated by my professional body, the IBMS, and became an
assessor for Specialist Portfolios in Haematology and Blood Transfusion. This
means that I must provide reports against pre-defined standards, and made me
pay further attention to quality issues in blood transfusion; I compared information
from visits and developed a framework for my thesis as the study progressed.
Although my project has finally ended, the importance of clinical and non-clinical
personnel in the transfusion chain cannot be overemphasized. It was difficult to
coordinate and pass instructions to frontline staff at every stage of the study. These
issues were eventually overcome by asking the transfusion practitioner to feedback
any problems as soon as they occurred. During the project, it was necessary for
me to encourage open thinking.
I do feel that I have benefited from the course, even though it took me a while to
prepare the research proposal. The principles underpinning the whole study were
learnt throughout the course. I feel now that I can conduct and develop a research
method using the advanced research skills and the professional knowledge that I
105
have in my specialist area. I also fully understand the skills necessary to publish
rigorous clinical research.
I spent the early part of the course to learning critical reflection practices and
putting these into practice by reflecting on my own needs and learning styles. This
also helped in all the modules of the professional doctorate and find ways to better
understand what I was learning. The idea for my professional doctorate was initially
conceived through my reflective practices and I decided to write few publications on
these areas in my professional journal, the IBMS gazette.
I have taken the technique of reflection back to my clinical practice in order to
evaluate all the procedures we follow. My colleagues knew there would have to be
changes within the section. We set aside time for to investigate and reflect upon
incidents. We developed a habit of responding as fast as possible to incidents and
enquiries and since I started the professional doctorate the service within the Trust
has changed.
The research has been daunting. It has required me to rally a multidisciplinary task
force within the Trust for data collection and analysis. I had to get the complete
support of staff and the Trust for the study to succeed.
I found the data analysis very difficult, but interesting. It required coding and
rechecking for missing figures. The module I took on data analysis using SPSS
was useful and this was followed by months of writing up. I would like to commend
the patience of staff members; although many had little time, they listened and
participated in the study.
The literature review during the study, highlighted incidents in the early days of
blood and the advancement in blood, problems with blood safety, innovation
achieved in the collection, testing, distribution and traceability of blood products.
The human error in the handling and the use of blood and its products remains a
challenge in the 21st century. My thesis, identified that there was lack of knowledge
and training of personnel in the handling and the use of blood within the Trust
which led to .

106
6.1 Developing the extending role
Achieving traceability compliance within the Trust had been a painful and complex
process. I had to engage with all staff in the Trust in order to highlight the
importance of full traceability. The Trust management were very helpful in providing
their time and expertise. That the project has succeeded clearly demonstrates that
biomedical scientists can interact with other Trust professionals and extend their
role beyond the laboratory using their knowledge to provide diverse health service
models.
6.2 Future goals
The professional doctorate considerably contributed to my self-development and
management skills. I am confident in discussing research with my colleagues. My
role as the transfusion lead has led to increased exposure at a more senior level
allowing further development of my career.
My goal is to use my rich experience in clinical research to teach, and develop
protocols and guidelines within the profession. Specifically, to influence practice
through meetings, special interest group and disseminating information. I am also
keenly looking forward to helping others to develop and maximize their skills in
laboratory medicine. The achievement of the doctorate will help me to progress
towards the post of consultant biomedical scientist.
6.3 Dissemination
A requirement of the doctorate is to ensure dissemination of the data and the
outcome of the project; this has been achieved through various means both locally
and nationally.
Locally, I made audits presentations at lunchtime meetings to health personnel in
the Trust. Information was disseminated to wards with poor compliance levels in
writing during the implementation stages. Furthermore, I developed feedback on
the clinical effectiveness of the model, this was needed in order to assess its
success and determine any modifications required to improve full traceability
compliance.
107
Nationally, the findings of the project and the implementation of new compliance
measures have been disseminated through poster presentations and lectures at
meetings, including the Biomedical Sciences Congress (2011) in Birmingham and
the British Blood Transfusion Conference (2012) in Harrogate. A poster
presentation was also given at the American Medical Technology International
Conference (2011) in the United States.
The major learning outcome from the dissemination of my work was the ability to
communicate information in a clear and precise manner, particularly the ability to
communicate with the audience during poster presentations and hear their
feedback.
108
7 References
Abdulrazzak, R., Al-Muharib, S., Dashty, R. et al. (2009). Traceability of red cells
components. A two stage audit on the accuracy of traceability records in Kuwait
Central Blood Bank and two small hospitals blood banks. Vox Sanguinis, 96, 208.
Aller, R. (2005). Positive patient identification: more than a double check. CAP
today, 26–34.
Andreu, G., Morel, P. and Forestier, F. (2002). Haemovigilance Network in France.
Transfusion, 42: 1356-1364.
Arinsburgh, S., Skerrett, D., Friedman, M., Cushing, M. (2012). A survey to assess
transfusion medicine education needs for clinicians, Transfusion Medicine, 22:44-
51.
Asamoah, A. (2006). Not as easy as it appears: Using radiofrequency identification
technology. Food Drug Law Journal, 2, 385–418.
Ashbourn, J. (2004). Where we really are with biometrics. Biometric Technology
Today, 12(4), 7–9.
Ashford, P. (2006). ISBT 128 – improving security by international standardization.
ISBT Science Series, 1(1), 242–245.
Askeland, R. W., McGrane, S., Levitt, J. S., Dane, S. K., Greene, D. L., Vandeberg,
J. A., Walker, K., …Kemp, J. D. (2008). Improving transfusion safety:
implementation of a comprehensive computerized bar code-based tracking system
for detecting and preventing errors. Transfusion, 48 (7), 1308–17.
AuBuchon, J. (2006). How I minimise mistransfusion risk in my hospital.
Transfusion, 46, 1085–1089.
AuBuchon, J. and Litternberg, B. (1996). A cost effectiveness analysis of the use of
a mechanical barrier system to reduce the risk of mistransfusion. Transfusion, 36,
222–226.
109
Bachs, A., Aliu, G., Gmez, I., Orfila, R. and Mingo, T. (2009). Balance after
implementing a new transfusion safety system: A 2 year experience. Transfusion
Medicine, 20, 1295.
Baele, P., De Bruyere, M., Deney, V. and Dupont, E. (1994). Bedside transfusion
errors. A prospective study by Belgium Sanguins group. Vox Sanguinis, 66, 119–
121.
Baldwin, P. (2005). Disease and Democracy. The Industrialised World Faces AIDS.
Berkeley.
Ballard. S., J., Liewelyn, C., Murphy, M. and Williamson, L. (2002). Tracing blood
units to their recipients: results of a two-centre study. Transfusion Medicine, 13,
127–130.
Battle, J., Kaplan, H., Van der schaaf, T. and Shea, C. (1998). The attributes of
medical events-reporting system for transfusion medicine. Archives of Pathology &
Laboratory Medicine, 122, 231–238.
Barr, H. (2000) NHS new collaboration, New agenda for Education. Journal of
Interprofessional Care, 14 (1), 81–6.
Berhold, L., Bingham, W., McDonald, P. and Atta, M. (2000). Impact of Holistic and
Learning-Oriented Teaching on Academic Success. Journal of Engineering
Education, 89(2), 191–99.
Bennardello, F., Fidone, C., Cabibbo, S., Calabrese, S., ... Bonomo, P. (2009). Use
of an identification system based on biometric data for patients requiring
transfusion guarantees transfusion safety and traceability. Blood Transfusion,
7,193–203.
Berwick, D. (1989). Continuous improvement as an ideal in health care. New
England Journal of Medicine, 32, 53–56.
Blood Safety and Quality Regulations (2005). The Stationery Office Ltd, London.
Bloom, B. (1956). Taxonomy of Education objectives. New York: David Mckay and
Co.
110
Burnes, B. (1996). Managing Change: A Strategic Approach to Organisational
Dynamics.
Busch, M. (1991). Let's look at human immunodeficiency virus look-back before
leaping into hepatitis C virus look-back. Transfusion, 31, 655.
Busch, M., Chamberland, M., Epstein, J., Kleinman, S., Khabbaz, R. and Nemo, G.
(1999). Oversight and monitoring of blood safety in the United States. Vox
Sanguinis, 77, 67–76.
Chaffe, B., Jones, J., Milkins, C., Taylor, C., Asher, D., Glencross, H., Murphy, M.
and Cohen, H (2009). UK Transfusion Laboratory Collaborative Recommended
minimum standard of hospital transfusion laboratories. Transfusion Medicine, 19,
156–158.
Chambers, R., Rubin, M., Rath, C., Sandler, S. and Ball, J. (1973). A positive donor
recipient identification system for a regional blood transfusion service. Transfusion,
13, 34–6.
Chan, J., Chu, R., Young, B., Chan, F., Chow, C., Pang, W., Chan, C., Yeung S.,
Leung, P. (2004). Use of an electronic barcode system for patient identification
during blood transfusion: 3 year experience in a regional hospital. Hong Kong
Medical Journal, 10,166-71.
Classen, D., Stanley, M.D., Pestonik, S., Evans, R. and Burke, J. (1991).
Computerized surveillance of adverse drug events in hospital patients. JAMA, 266,
2847–2851.
Cook, R., Wood, D. and Miller, C. (1998). A tale of two stories: contrasting views of
patient safety. US National Patient Safety Foundation, MA. Retrieved from
http://www.npsf.org/exec/front.html.
Council of Europe (2003). Guide to the preparation use and quality assurance of
blood component. Recommendation No. R(95)15. Ninth Edition. Strasbourg.
Currie, L. (2003). Clinical Governance: An RCN resource guide. Retrieved from
www.ntac.nhs.uk/web/files.
111
Curtain, L. (1997). When negligence becomes homicide. Nursing Management, 2,
7-8.
Dalton, J., Poncet, I., Rossini, S. (2005). "Using RFID technologies to reduce
transfusion errors. Retrieved from http://www.cisco.com/global/IT/local_office/case_
History/rfid_in_blood_transfusion_final.pdf
Davies, J., Kay, J., Casbard, A. and Murphy, M. (2006). End to end electronic
control of the hospital transfusion process to increase the safety of blood
transfusion: Strengths and weaknesses. Transfusion, 46, 352-364.
Davis, R., Geiger, B., Gutierrez, A., Heaser,J. and Veeramani, D. (2009). Tracking
blood products in blood centres using radio frequency identification: a
comprehensive assessment. Vox Sanguinis, 97, 50–60.
de Vries, P., Faber, C. and Strengers, W. (2011). Haemovigilance: an effective tool
for improving transfusion. Vox Sanguinis, 100, 60–67.
Debeir, J., Noel, L., Aullen, J., Frette, C., Sar,i F., Mai, M.P. and Cosson, A. (1999).
The French Haemovigilance System. Vox Sanguinis, 2, 77–81.
Department of Health. (1997). The New NHS: modern, dependable. London:
HMSO.
Department of Health (1998). A first class service. Quality in the new NHS. London:
HMSO.
Department of Health (1998a). Better Blood Transfusion. Health Service Circular
1998/224.
Department of Health. (2003) Developing NHS Direct: a strategy document for the
next three years. London: HMSO
Department of Health. (2004). Pathology Modernisation., London: HMSO
Dodd, R. (2006). Other emerging viral pathogens. ISBT Science Series, 1(1), 257–
262.
112
Doughty, H. and Hitchinson, M. (2010). A tale of traceability. Transfusion Medicine,
20, 53.
Dzik, W. (2002). Transfusion safety in hospital. Transfusion, 43, 1190–1198.
Dzik, W. (2003) Emily Cooley Lecture 2002: transfusion safety in the hospital,
Transfusion, 43, 1190–1199.
Dzik, W. (2005) Technology for enhanced transfusion safety. American Society of
Hematology, Education Program, 476-82.
Dzik, W. (2006). New technology for transfusion safety. British Journal of
Hematology, 136, 181-190.
Embrey, D. (1992). Quantitative and qualitative prediction of human error in safety
assessment. Institute of chemical Engineering. Rugby.
Engelfriet, C. and Reesink, H. (2000). Bacterial contamination of blood
components. Vox Sanguinis, 78, 59-67.
European Union Directive 2002/98/EC. Retrieved from http://www.europa.e.int.
Evans, P. (2000) Management 21st Century: Someday we will all manage this way.
Chowdbury Financial Times. Prentice Hall, London.
Faber, J. (2002). Haemovigilance around the world. Vox Sanguinis, 1, 71-76.
Faber, J. (2004). The European Blood Directive: a new era of blood regulation has
begun. Transfusion Medicine, 14, 257-273.
Fanberg, H. (2004). The RFID revolution. Marketing Health Services. Fall 24, 22-4.
Farrugia, A. (2006). Globalization and blood safety. ISBT Science Series, 1(1), 25-
32.
Feldman, E. and Bayer, R. (1999). Blood Feud: AIDS, Blood and the politics of
Medical Disaster. New York: Oxford University Press.
113
Felder, M. and Brent, R. (2003) Learning by doing. Chemical Engineering
Education, 37(4) 282-3.
Felder, M. and Brent, R. (2004). The intellectual development of Sciences and
Engineering Student. Models and Challenges. Journal of Engineering Education,
93(4), 279-91.
Fisher W.(2004) The role of WIPO in addressing the health crisis in developing
countries. Retrieved from www.tacd.org/events/wipo/w_fisher.ppt.
Fisher W. (2004). The role of WIPO in addressing the health crisis in developing
countries. Retrieved from http://www.tacd.org/events/wipo/w_fisher.ppt.
Gallo, R. and Montagnier, L. (2003). The discovery of HIV as a case of AIDS, New
England Journal of Medicine, 349, 2283-2285.
Gambino, R. and Mallon, P. (1991). Near Misses: an untapped database to find
root causes. Lab report, 13, 41-44.
General Medical Council (2011). Good Medical Practise Framework for appraisal
and revalidation, London. Retrieved from www.gmc-uk.org/doctors/revalidation/asp.
Glynn, S., Busch, M., Schreiber, G. and Murphy, E. (2003). Effect of a national
disaster on blood supply and safety. JAMA, 17, 2246-2253.
Goodnough, L. and Spence, R. (2003). Bloodless medicine: clinical care without
allogeneic blood transfusion. Transfusion, 43, 668-676.
Goldman, M., Long, A., Roy, G., Decary, F. and Delage, G. (1996). Incidence of
bacterial cultures after donor call back. Transfusion, 36 (11-12), 1035.
Hammadi, A. (2009). The haemovigilance in Saida hospital - A prospective study.
ISBT Science series, 217.
Hay, S., Scanga, L. and Brecher, M.E. (2006). Life, death, and the risk of
transfusion: A University hospital experience. Transfusion, 46 (9), 1491-1493.
Health Professions Council (2004). HPC Standards of proficiency – Biomedical
Scientist. Retrieved from: http://www.hpc-uk.org/publications/index.asp?id=40.
114
Health Protection Agency Report (2011). Surveillance of viral infection in donated
blood ( England and Wales). Annual report 2011.
Herve, P. (2002). Haemovigilance network in France: organisation and analysis of
immediate transfusion incident report from 1994 to 1998. Transfusion, 42, 1356-
1364.
Herve, P., Rebibo, M., More, P. and Andreu, G. (2000). Haemovigilance in France.
Rev Bras Hematol.Hemoter, 22(3), 368-373.
Hollnagel, E. (1998). Cognitive reliability and error analysis method. Elsevier,
Oxford.
Honey, P. and Munford, A. (1992). The Manual of Learning Styles. Ardingly House,
Maidenhead: Peter Honey.
Hopkins, S. (2005). Advance in patient and specimen ID. Advance New Magazine,
2:13.
Ingrand, P., Salmi, R., Benz-Lemoine, E. and Dupuis, M. (1998). Evaluation of the
actual traceability of labile blood products using medical records. Transactions of
Clinical Biology, 6, 397-407.
Jury, G. (1997). Managing Technology. Engineering Management Journal, 7, 27-
32.
Kaplan, H., Battles, J. and Van der Schaaf, T, Shea, C.E. and Mercer, S.Q. (1998).
Identification and classification of the causes of events in blood transfusion
medicine. Transfusion, 38, 1071-1081.
Kaplan, H. (2005). Getting the right blood to the right patient: The contribution of
near miss events reporting and barrier analysis. Transfusion Clinique et Biologique,
12, 380-384.
Kennedy, I. (2001). The report of the public inquiry into children's heart surgery at
the Bristol Royal Infirmary 1984–1995.
115
Kimball, A., Arima, Y. and Hodges, J. (2005). Trade related infection: farther, faster,
quieter. Globalisation and Health, 1, 1–6.
Kleinman, S. (1991). Donor screening procedures and their role in enhancing
transfusion safety. American Society of Clinical Pathologists, p.207.
Kolb, D. and Fry, R. (1975). Toward an applied theory of experiential learning. In
C.L. Cooper (ed.), Theories of group processes (33-57). Chichester: Wiley & Sons.
Kohn, L., Corrigan, J. and Donaldson, M. (1999). To err is human: building a safer
health system. National Academy Press, Washington, DC.
Kolb, D. (1993). The process of experiential learning. Culture and processes of
adult learning. London: Routledge.
Kreil, T., Berting, A., Kisnter, O. and Kindermann, J. (2003). West Nile virus and
safety of plasma derivatives. Transfusion, 438, 1023–1028.
Kubler-Ross, E. (1969). On Death and Dying. Macmillan, New York.
Lau, F., Wong, R., Chui, C., Ng, E. and Cheng, G. (2000). Improvement in
transfusion safety using a special design transfusion wristband. Transfusion
Medicine, 1, 121-124.
Lewin, K. (1951). Field Theory in Social Sciences, Harper and Row, New York.
Linden, J., Wagner, K., Voytovich, A.E. and Sheehan, J. (2000). Transfusion errors
in New York State: an analysis of 10 years' experience. Transfusion, 40 (10),
1207–1213.
Ling, A. (2010). Failure of routine HIV test in a case involving transfusion of
seroconversion blood components during the infection window period. Journal of
American Medical Association, 284, 210-14.
Lovis, C. (2008). Traceability in Healthcare: Crossing Boundaries. Yearbook of
Medical Informatics 1998, 105–113.
116
Marconi, M. and Sirchia, G. (2000). Increasing transfusion safety by reducing
humam error. Current Opinion in Haematology, 7, 382-386.
Mathur et al., (2006) Compliance of West of Scotland Bolld Centre Audit of Hospital
Compliance with Traceability. Transfusion Medicine, 16:22
Mattar, M. (2004). Blood and you. Health and Science Alternative Medicine.
McClelland, B., McMenamin, J., Moore, M. and Barbara, J. (1996). Reducing risks
in blood transfusion. Transfusion Medicine, 6(1), 1-10.
McClelland, B., Love, E., Scott, S., & Williamson, M.(1998). Haemovigilance:
concept, Europe and UK initiative. Vox Sanguinis 74,431-439.
Mercurialli, E., Inghilleri, G., Colotti, M., Fare, M., Vinci, A., Podico, M. &
Scalamogna, R. (1996). Bedside transfusion errors: Analysis of two years use of a
system to monitor and prevent transfusion errors. Vox Sanguinis, 70, 16-20.
Mummert, E. and Tourault, M. (1993). Review of transfusion related fatalities: many
preventable. Hospital Technology Scanner, 4, 1-3.
Murff, H., Patel, V., Hripcsak, G., Bates, D. (2003) Detecting adverse events for
patient safety research: a review of current methodologies. Journal of Biomedical
Informatics, 36, 131-143.
Murphy,M. and Kay, J. (2004) Barcode identification for transfusion safety. Current
Opinion in Haematology, 5, 334-38.
Murphy, M., Stanworth, J. and Yazer, M. (2011). Transfusion practise and safety:
current status. Vox Sanguinis, 100, 46–59.
Murphy, M., Lowe, D. and Pearson, M (2001). National audit of the blood
transfusion process in the U.K. Transfusion Medicine, 11, 363-370.
Nagel, C. (1988). Human error in aviation operation. Academic Press, San Diego.
National Patient Safety Agency (2004) Incident Decision tree. Online retrieved from
http://www.npsa.nhs.uk.
117
National Patient Safety Agency (2005). Improving patient safety through better
manual and technology based system for identification and matching of patients
with care. Retrieved from http://www.npsa.nhs.uk.
National Patient Safety Agency (2006). Safer practice notice: Right Patient, Right
Blood. London NPSA.
Nevalainen D., Berte, L. and Callery, M. (1998). Quality system in blood bank
environment. Second edition. Bethesda,MD: American Association of Blood Banks.
Nevalainen D. and Lloyd, H. (1995). ISO 9000 quality standards: a model for blood
banking?. Transfusion, 35, 521-24.
Norfolk, D. (2000). Experience with electronic system control in clinical transfusion
process. SHOT Annual report.
Nichols, J., Bartholomew, C., Brunton, M., Clintron, C. Elliott, S., McGirr, J., Morsi,
D., Sinha, D. (2004). Reducing medical errors through barcoding at the point of
care. Clinical Leadership Management Review, 18, 328-34.
National Audit Office (2006). Progress in implementing Clinical Governance in
Primary Care Trust. Stationary Office.
National Institute for Mental Health in England (2003). National Occupational
Standard Implementation Guide. UK.
Novis, D., Miller, K., Howanitz, P., Renner, S. and Walsh, M. (2003). Audit of
transfusion procedures in 660 hospitals. Transfusion Medical Review, 17, 169-180.
Nursing and Midwifery Council. (2009) Code of professional conduct. London:
NMC.
Orlikowski, W.J. and Hoffman, J.D. (1997). An improvisational model for Change
Management: The Case of Groupware Technologies. Sloane Management Review,
11–21.
Oxman, A., Thomas, M., Davis, D. and Hayes, R. (1995). No magic bullets: a
systematic review of 102 trials of interventions to help health professionals deliver
118
services more effectively and efficiently. Canadian Medical Association Journal,
153,1423-31.
Pagliaro, P. and Rebulla, P. (2006). Transfusion recipient identification. Vox
Sanguinis, 91, 97-101.
Pagliaro, P. and Turdo, R. (2008). Transfusion management using a remote-
controlled automated blood storage. Blood Transfusion, 6, 101-106.
Perper, J. (1994). Life-threatening and fatal therapeutic misadventures. In Bogner,
M.S., Ed., Human Error in Medicine. Hillsdale, NJ.
Peters, T. (1989). Thriving on Chaos. Macmillan Ltd, London.
Rasmussen, J. (1987). The definition of human error and a taxonomy of technical
system design.London: John Wiley & Sons LTD.
Reason, J. (1990). Human Error. Cambridge University Press, New-York.
Reason, J. (2001). Understanding adverse events: the human factor. In: Vincent C (ed).
Robillard, P., Chan, P. and Kleimann, S. (2004). Haemovigilance for improvement
of blood safety. Transfusion Apheresis, 31, 95-98.
Salmi, L., Azanowsky, J. and Perez, P. (1997). Haemovigilance in France: Where
we stand in 1985. Proceedings of the ISBT-Ed, 964-974.
Sandler, S., Langeberg, A. and Dohnalek, I. (2005). Bar code technology improves
positive identification and transfusion safety. Developments in Biologicals, 120, 19-
24.
Satir, V., Banmen, J., Gerber, J. and Gomori, M. (1991). The Satir Model: Family
therapy and beyond.
Sazama, K. (1990). Reports of 355 transfusion associated deaths 1976-1985.
Transfusion, 7, 583-590.

119
Scally, G. and Donaldson, L. (1998). Clinical governance and the drive for quality
improvement in the new NHS in England. British Medical Journal, 317, 61-65.
Schreiber, G., Busch, M., Kleinman, S. and Korelitz, J.J. (1996). The risk of
transfusion transmitted viral infection: The Retrovirus epidemiology donor study.
The New England Journal of Medicine, 334, 1685-1690.
Schulman, P. (2004). General Attributes of safe Organisation. Quality and Safety In
Healthcare, 13, 39-44.
Sellu, D., Davis, R., Vincent, A. (2012). Assessment of blood administration
competencies using objective structured clinical examination. Transfusion
Medicine, 22: 409-417.
Serious Hazards of Transfusion (2001-2011) SHOT Reports and summaries.
Retrieved from http://www.shot-uk.org.
Serious Hazards of Transfusion (2011). Serious Hazards of Transfusion Annual
Report 2011. SHOT Office, Manchester, UK
Serious Hazards of Transfusion (2009). Serious Hazards of Transfusion Annual
Report 2009. SHOT Office, Manchester, UK
Sherer, P., Chambers, H., Taswell, C., Altshuler, R., Aster, K., Covino, S., Gordon,
M., Gajewski, A., Smith, S., Horrigan, K., & Pfatt, K. (1977). Automated Donor-
Recipient Identification Systems as a mean of reducing human error in blood
transfusion. Transfusion, 17, 586-597.
Shulman, I., Saxena, S. and Ramer, L. (1999). Assessing blood administering
practices. Archives of Pathology & Laboratory Medicine, 123, 595-598.
Snyder, E. and Dodd, R. (2001). Reducing the risk of blood transfusion.
Haematology, 433-442.
SPSS Inc (2010) SPSS Version 19.0 for Windows user guide. SPSS Inc, Chicago,
IL.
120
Stainsby, D. (2005). ABO incompatible transfusion experience from the UK Serious
Hazard of Transfusion scheme. Transfusion, 12, 380-384.
Starr, D. (2001).Medicine, money, and myth: an epic history of blood. Transfusion
Medicine, 11(2), 119-121.
Steinbrook, R. (2002). Nursing in the crossfire. New England Journal of Medicine,
346, 1757-1766.
Taswell, H., Smith, A., Sweatt, M. and Pfaff, K. (1974). Quality control in blood
bank: a new approach. American Journal of Clinical Pathology, 62, 491-495.
Toeffler, A. (1983). Future shock. Bodley Head.
Turner, C., Casbard, A.C. and Murphy, M.F. (2003). Barcode technology: its role in
increasing the safety of blood transfusion. Transfusion, 43, 1200-1209.
Tversky, A., Kahneman, D. (1974). Judgement under certainty: Heuristics and
biases. Science, 185, 1124-1131.
Uriz, J., Antelo, M., Zalba, S., Ugalde., N. and Corcoz, P. (2011). Improved
traceability and transfusion safety with a new portable computerized system in a
hospital with intermediate transfusion activity. Blood Transfusion, 9,172–81.
Varney, S. (2003). The annual cost of blood transfusion in the UK. Transfusion
Medicine, 13, 205-218.
Verret, C. (1998). Evaluation of aa tracking system for labile blood products in the
Midi-Pyrenes region. Transfusion Clinique et Biologique, 5, 275-282.
Vincent, C., Stanhope, N., and Crowley-Murphy, M. (1999). Reasons for not
reporting adverse incidents: An Empirical study. Journal of Evaluation in Clinical
Practice, 1, 13-21.
Wenz, B., (1991). Improvement in transfusion safety using a new blood unit and
patient identification systems as part of safe transfusion practice. Transfusion, 31,
401–403.
121
Wessel, R. (2006) German clinic uses RFID to track blood. RFID Journal, retrieved
from http://www. Rfidjournal.com/article/view/2169.
Whitehead, S., Kenny-Siddique, S., Scott Y, Parker, P.I., Hardy, J. and Wallis, J.P.
(2003). „Tag and label‟ system for checking and recording of blood transfusions.
Transfusion Medicine, 13(4), 197-204.
Williamson, L. (2002). Transfusion hazard reporting: powerful data, but do we know
how best to use it. Transfusion, 42, 1249-1252.
World Health Organisation (2006). The clinical use of blood: Handbook. World
Health Organization.
Zapt D. and Reason J. (1994). Introduction to error handling. Applied Psychology.
43, 427-432.

122