impacts of policies on poverty - food and agriculture ... of policies on poverty absolute poverty...
TRANSCRIPT

Impacts of Policies on Poverty Absolute Poverty Lines
Module 005

Impacts of Policies on Poverty
Absolute Poverty Lines by
Lorenzo Giovanni Bellù, Agricultural Policy Support Service, Policy Assistance Division, FAO, Rome, Italy
Paolo Liberati, University of Urbino, "Carlo Bo", Institute of Economics, Urbino, Italy for the Food and Agriculture Organization of the United Nations, FAO
About EASYPol EASYPol is a an on-line, interactive multilingual repository of downloadable resource materials for capacity development in policy making for food, agriculture and rural development. The EASYPol home page is available at: www.fao.org/tc/easypol. EASYPol has been developed and is maintained by the Agricultural Policy Support Service, Policy Assistance Division, FAO.
The designations employed and the presentation of the material in this information product do not imply the expression of any opinion whatsoever on the part of the Food and Agriculture Organization of the United Nations concerning the legal status of any country, territory, city or area or of its authorities, or concerning the delimitation of its frontiers or boundaries.
© FAO November 2005: All rights reserved. Reproduction and dissemination of material contained on FAO's Web site for educational or other non-commercial purposes are authorized without any prior written permission from the copyright holders provided the source is fully acknowledged. Reproduction of material for resale or other commercial purposes is prohibited without the written permission of the copyright holders. Applications for such permission should be addressed to: [email protected].

Impacts of Policies on Poverty Absolute Poverty Lines
Table of Contents
1 Summary.................................................................................. 1 2 Introduction .............................................................................. 1 3 Conceptual background............................................................... 2
3.1 The cost of Food Energy Intake (FEI) ............................................ 2 3.2 The cost of Basic Needs (CBN) ..................................................... 4 3.3 The Consumption Insufficiency (CI) method................................... 6 3.4 The Budget Standard (BS) method ............................................... 7
4 A step-by-step procedure to identify poverty by absolute concepts... 7 4.1 A step-by-step procedure for the cost of Food Energy Intake (FEI) .7 4.2 A step-by-step procedure for the Cost of Basic Needs (CBN)............ 9 4.3 A step-by-step procedure for the Consumption Insufficiency method
(CI) ...................................................................................... 11 4.4 A step-by-step procedure for the Budget Standard method (BS) .... 11
5 Examples of how to define poverty with absolute concepts..............12 5.1 The FEI method........................................................................ 12 5.2 The CBN method ...................................................................... 15 5.3 The CI and BS method .............................................................. 17
6 Discussion: critical aspects of absolute poverty lines ......................17 6.1 Critical aspects of FEI ............................................................... 17 6.2 Critical aspects of CBN.............................................................. 18 6.3 Critical aspects of CI ................................................................ 18 6.4 Critical aspects of BS................................................................ 18
7 Conclusions..............................................................................19 8 Readers' notes..........................................................................20
8.1 Time requirements .................................................................. 20 8.2 Frequently asked questions....................................................... 21 8.3 Complementary EASYPol modules.............................................. 21
9 References and further readings..................................................21 Module metadata..............................................................................23


Impacts of Policies on Poverty Absolute Poverty Lines
1
1 SUMMARY
This module illustrates how to define “absolute” poverty lines, i.e poverty lines based on approaches that consider the welfare position of each individual or household as if it were independent of the conditions of other individuals or households belonging to the same community. In particular, this module will discuss the following methods:
the food energy intake (FEI) the cost of basic needs (CBN)
the consumption insufficiency method (CI) the budget standard method (BS)
The analogies and differences of the above methods will be highlighted and we shall also illustrate how they can be made operational and how they work, by means of step-by-step procedures and examples.
2 INTRODUCTION
The aim of this module is to give the analyst the possibility to build poverty lines on the basis of absolute poverty concepts. This topic is particularly relevant to policy work in developing countries because absolutist concepts of poverty encompass almost all food-based measures of standards of living. Furthermore, the effects of anti-poverty policies are often assessed on their ability to fight absolute poverty.
Objectives
This module will give users the possibility to learn methods to define absolute poverty lines and their related advantages and shortcomings. By the end of this module, users should be able to calculate absolute poverty lines having received the conceptual elements and practical step-by-step exercises.
Target audience
This module targets applied analysts who want to work on poverty issues. In addition, academics, officers in ministries and other professionals can make use of this material for their work. Furthermore, students interested in poverty issues may find this material relevant for their studies.
Required background
The audience should be familiar with basic mathematics and statistics, with the notion of income distribution and with the way in which poverty can be defined. This module also belongs to a set of modules that discuss the definition of poverty, the identification of poor and the measurement of poverty. A complete set of links to related EASYPol modules is included at the end of this module and readers will also find useful links throughout the document1.
1 EASYPol hyperlinks are shown in blue, as follows: a) training paths are shown in underlined bold font;

EASYPol Module 005 Analytical Tools
2
3 CONCEPTUAL BACKGROUND
Poverty may be conceptualised either in absolute terms or in relative terms2. We will start from methods based on absolute concepts. In particular, the following methods will be investigated:
the food energy intake (FEI) the cost of basic needs (CBN) the consumption insufficiency method (CI) the budget standard method (BS)
All of the above methods define a set of goods that would ensure an adequate standard of living and convert this set of goods into monetary values. The final aim is to define a poverty line, i.e. a threshold below which an individual is considered to be poor.
3.1 The cost of Food Energy Intake (FEI)
The food energy intake (FEI) methodology defines the minimum food intake needed by a given individual to lead a decent life. By this definition, those people who cannot afford the cost of the FEI are poor3. In addition, by definition, FEI is an absolute concept of poverty that is entirely food-based. This measure, therefore, is a good indicator of poverty in those countries where a large part of the population spends a significant fraction of their budget on food. This is typical of less developed economies. Whereas, in more developed economies, a large part of the population spends a smaller fraction of their total income or total expenditures on food. This means that, in these cases, the caloric-food-based measure of standards of living should be complemented by other commodities, i.e. non-food items. In extreme cases, standards of living can be measured by total income or expenditure (in this way, you would cover all consumption items), which is the standard economic measure for advanced economies. It is worth noting that there might be a conflict between economic and food-based (i.e. nutritional) views of living standards4. Suppose that milk is subsidised by the government and that milk gives a significant nutritional intake to the poor. Now, suppose that the government wants to reduce the subsidy on milk and assume that milk has good substitutes (and, therefore, a sufficiently high price elasticity). By reducing the subsidy, the price will increase and poor individuals will start to consume substitute goods. Nutritionists would see this as a reduction of welfare for poor individuals, as the poor consume less milk. Nutritionists would like to have the subsidy maintained. For economists, the high price elasticity of milk means that subsidy reduction will not hurt poor individuals very much, as they may shift their consumption to what they consider as substitute goods. Economists would not object to having the subsidy reduced. The only case where there will be no conflict between economic and nutritional views of
b) other EASYPol modules or complementary EASYPol materials are in bold underlined italics; c) links to the glossary are in bold; and d) external links are in italics2 See EASYPol Module 004: Impacts of Policies on Poverty: The Definition of Poverty. 3 See, Ravallion and Bidani, 1994. 4 A clear example of this contrast is offered by Deaton, 1997, p. 209.

Impacts of Policies on Poverty Absolute Poverty Lines
3
living standards is when everyone spends all their income on food in exactly the way that is recommended by nutritionists. The basic issue of this conflict is whether one is disposed to accept that people are the best judge of their needs or whether one should introduce some paternalistic view of what is good for them5. The food energy intake calculations are based on nutritional information. Usually, the energy intake is defined in terms of calories, i.e. as the minimum caloric intake needed to live. Additional criteria can supplement the caloric intake, like the proteinic content and the micro-nutrients content6. Generally, this information comes from nutritionists’ expert studies. In this sense, there is no precise economic rationale to define the basket of food associated to a given energy intake. It means that the food energy intake has some unavoidable arbitrary content. The way in which the basket of food is chosen mostly depends on priorities set by the analysts. If the main aim is to minimise the cost of the basket, the choice will follow a minimum cost criterion. On the other hand, the proteinic content might be given priority; in this case, the selected basket need not to be that at the minimum cost. In all cases, poverty here is taken to be a situation where too little energy intake or too little specific nutrients are available. In addition, in all cases, in order to define a poverty line, nutritional information must be converted into monetary values. There are two main methods of pricing a given food energy intake:7
The least-cost method The expenditure-based method
According to nutritional information, the least-cost method first requires that one or more baskets of foods that give the same energy intake be specified. As every basket may have different combinations of goods, pricing these baskets may give rise to a different total cost for the same energy intake. The cost of the basket with the minimum cost is taken to be the poverty line. The expenditure-based method, instead, requires that the minimum caloric intake obtained by household groups be compared to their average consumption. Two cases may arise. First, if total calories obtained from average consumption are lower than the minimum food energy intake, average consumption must be re-evaluated by the ratio between the minimum caloric intake and the actual caloric intake. Re-evaluated average consumption must then be priced and the resulting cost is taken to be the poverty line. Second, if total calories obtained from average consumption are higher than the
5 This recalls the concept of «merit goods», i.e. those goods the consumption of which is either below or above the level of the individual’s optimal choice due to a paternalistic interference (e.g., compulsory education, restrictions to alcohol and tobacco consumption, compulsory vaccines, etc.). 6 Usually, the proteinic and other nutrient content may induce adjustments to the basket if minimum nutritional standards are not achieved. The problem of assessing the calorie and nutrient requirements of human beings with the greatest possible degree of accuracy has been recognised of great importance by FAO since 1950. See FAO, 1950, and FAO, 2003. See also http://www.fao.org/es/ESN. 7 Alternatively, we can simply look at the mean income or expenditure of that subsample of households whose caloric intake is approximately equal to the required caloric intake. See Ravallion and Bidani, 1994.
EASYPol Module 005 Analytical Tools
4
minimum caloric intake, the cost of the minimum caloric intake is taken to be the poverty line. Note that in this case, the cost of the minimum caloric intake is calculated by switching to the least-cost method. Therefore, the expenditure-based method usually applies only in the case where calories in average consumption fall short of the calories required by the food energy intake.
3.2 The Cost of Basic Needs (CBN)
The rationale of the cost of basic needs (CBN) is quite similar to that of FEI. CBN is, in acutal fact, an extension of FEI, as this method defines not only an adequate level of food items, but also an adequate level of non-food items8. In this sense, it embodies a milder concept of poverty, compared with FEI, and is closer to the budget standard methods (see below). Examples of adequate non-food items may be a given amount of housing space, a given amount of electricity and water and an adequate amount of clothing. However, there is no satisfactory way to define non-food expenditures. As reported by the World Bank, 2001, Poverty Manual, in Vietnam, researchers used the level of non-food spending by households that were in the middle expenditure quintile in 1993. For South Korea, non-food items have been taken to be the cost of housing that meets the official apartment size plus the cost of non-food items as measured by the average spending by households in the poorest two-fifths of the income distribution9. The most common procedures to calculate CBN are again two:
The least-cost method Scaling up the food poverty line
The least-cost method for food items is the same as in FEI. For non-food items, we first need to select which non-food items are deemed as being essential (e.g., a shelter). We must then price those items and calculate total expenditures required to achieve a proper basket of non-food items. The basket with the minimum cost must be selected. The minimum cost of food and non-food items is the CBN poverty line. Note that applying this method usually requires that you cost non-food items separately for each region in a given country. Furthermore, prices of these ietms are not usually reliably monitored in less developed countries. Finally, non-food items are not anchored to a clear basis like the food energy intake for food items. With the scaling up method, instead, the total poverty line is obtained by simply scaling up the food poverty line by a given factor taking into account non-food items. The obvious question is: How do we calculate this factor? Empirically, we can observe two very similar versions. The first version consists of calculating the average level of total expenditures of those individuals whose food expenditures are equal to the food poverty line. The resulting total poverty line is therefore that level of expenditures. Let us call this way food-based total poverty line (FBTPL); 8 See again Ravallion and Bidani, 1994. 9 See World Bank, 2000, Chapter 3.

Impacts of Policies on Poverty Absolute Poverty Lines
5
The second version consists of determining the average level of non-food expenditures of those individuals whose total expenditures are equal to the food poverty line. The resulting total poverty line is therefore the sum of the food poverty line and non-food average expenditures of those individuals. Let us call this method the total-based total poverty line (TBTPL). This version of the scaling up method is particularly well described in Ravallion and Bidani, 1994, who use a regression technique to scale the poverty line. In particular, they start from estimating the food share of total expenditures s as a linear function of the logarithm of total spending y (i.e. food plus non-food) normalised to the cost of the food poverty line zFEI (calculated as in FEI), a
constant α and an error term u: uz
ysFEI
+⎟⎠⎞
⎜⎝⎛+= lnβα .10 Individuals with a level of total
expenditures y equal to the food poverty line zFEI(i.e. y = zFEI ) will have an average food share equal to α<1.11 Therefore, their average non-food share of expenditure will be equal to (1-α). What we are doing exactly is to look at the average level of non-food expenditures of those individuals with total expenditures equal to the food poverty line. The cost of basic needs, therefore, will be the cost of the food poverty line scaled up by (1-α), i.e. the average non-food share of expenditure, i.e.
( )( ) ( )αα −=−+= 211 FEIFEICBN zzz .12
It is worthwhile stressing again the difference. In both cases, the food poverty line is determined as in FEI. With FBPTL, we look at total expenditures of those individuals having food expenditures equal to the food poverty line. With TBTPL, we look at non-food expenditures of those individuals having total expenditures equal to the food poverty line. The following table sums up the relevant variables in the scaling-up method.
Table 1: What to take into account in the scaling-up method
FBTPL TBTPL
Look at: Total expenditures Non-food expenditures
of those having .... equal to food poverty line
Food expenditures Total expenditures
Using the two different versions of the scaling-up method has implications on the level of the poverty line. Figure 1, below, compares the mechanics of FEI, FBTPL and TBTPL. In Figure 1, food expenditures is the bisecting line, while for any given level of food expenditures, there is a higher level of total expenditure. The assumption is that non-
10 Note that the assumption of linearity gives a simple scaling up factor. But non-linearity might also be used. See the technical Appendix in Ravallion and Bidani, 1994, where they included a squared term of ln (y/zFEI). 11 When y = zFEI, ln (y/zFEI)=0. 12 See example below.

EASYPol Module 005 Analytical Tools
6
food expenditures (the vertical distance between total and food expenditures) increase for higher levels of food expenditures. On the y-axis, OA is the FEI poverty line and the OB is the corresponding point on the x-axis thus giving the level of food expenditures equal to the food poverty line. To get the poverty line by CBN in the FBTPL version, look at the level of total expenditures of those having food expenditures equal to FEI poverty line. This level is BK. The corresponding point on the y-axis, OC, is therefore the FBTPL poverty line. To get the poverty line by CBN in the TBTPL version, we need to look at the level of non-food expenditures of those having total expenditures equal to FEI poverty line. This latter level is HD and the non-food expenditures are equal to the segment HW. Now, adding HW to the FEI poverty line, which gives HJ=HW, we can get the TBPTL. By construction, as total expenditures are never lower than food expenditures, FBTPL is always above TBTPL and both are above FEI. By construction, therefore, we always have: FEI ≤ TBPTL ≤ FBTPL.
Figure 1 - FEI, CBN-FBTPL and CBN-TBTPL
K
H
W
J
Y
Food expenditures(45° line)
Total expenditures
Food expendituresTotal expenditures
FEI
O
A
B
BK=Total expenditureof those having food expenditure
equal to BY=OA (FEI)
Food expenditures
CBN - FBTPL
C
HW=Non-food expendituresof those having total expenditure
equal to HD=OA (FEI). Note that HW=HJ.
D
CBN - TBTPL E
3.3 The Consumption Insufficiency (CI) method
Up till now, the focus has been on food items (FEI) or a mix of food and non-food items (CBN). To some extent, the CBN approach may be viewed as an extension of the FEI approach as it includes essential non-food items in the calculation of the absolute poverty line. In the same vein, the CBN approach may in turn be extended. Consumption Insufficiency (CI) methods are in fact an extension of the CBN, as also non-essential

Impacts of Policies on Poverty Absolute Poverty Lines
7
non-food items are included into the calculation of the poverty line. In this way, the concept of minimum subsistence is increasingly relaxed. The resulting poverty line is the cost of all food and non-food items (both essential and non-essential) included in the list. In order to convert this new basket into a poverty line, the least-cost method is usually adopted. Disagreement on what non-essential non-food items to include in the analysis exacerbates the problems already observed in the case of the cost-of-basic-needs approach. Difficulties in selecting non-essential non-food items and in pricing them reliably, may imply extending this method to take into account total expenditure on all goods.
3.4 The Budget Standard (BS) method
The Budget Standard method is the widest possible commodity-based method. In this case, besides food and non-food items, certain minimum amount of goods for social life are included in the list (e.g. recreational activities). The concept of minimum subsistence is therefore further weakened. The resulting poverty line is the aggregate cost of all quantities of goods and services, including the value of goods needed for social life, usually by adopting a least-cost method. Difficulties in selecting a minimum amount of goods for social life and in pricing them reliably, may suggest extending this method to take into account total expenditure on all goods, as in the previous case13.
4 A STEP-BY-STEP PROCEDURE TO IDENTIFY POVERTY BY ABSOLUTE CONCEPTS
4.1 A step-by-step procedure for the cost of Food Energy Intake (FEI)
Figure 2, below, illustrates the step-by-step procedure required to calculate the cost of FEI according to the least-cost method. Step 1 requires that FEI be calculated. This needs either external sources/information or ad hoc procedures. An example of the first case is included in Dandekar and Rath, 1971a; 1971b, for India. They started from an explicit calorie norm (2,250 calories per day) in both urban and rural areas (external information). In 1979, the Planning Commission revised the calorie norms to 2,400 in rural areas and 2,100 in urban areas, due to the lower rate of physical activity in urban areas14. An example of the second case (ad hoc procedures) is from Subramanian and Deaton, 1996, who used consumption data to estimate household calorie availability (see below)15. Once FEI has been set, we should build one or more baskets of goods giving the same food energy intake to individuals. Other nutritional features may help in this process,
13 An example of the budget standard method in measuring poverty is by Perumal, 1992, for Malaysia, where the food poverty line is first calculated and an allowance for non-food items is taken. 14 For a discussion, see Deaton, 1997, pp.142-143. 15 Other examples of countries in which the food energy intake has been used are: Osmani, 1982; Greer and Thorbecke, 1986; Paul, 1989; Ahmed, 1991; Ercelawn, 1991. More recent applications include the 1998 Bangladesh Poverty Assessment by World Bank, in particular the section Food Energy Intake and Cost of Basic Needs: Measuring Poverty in Bangladesh.

EASYPol Module 005 Analytical Tools
8
such as the proteinic content or the micro-nutrients content. In different baskets, there may be more rice and less cereals or less eggs and more tomatoes or more apples and less milk, and so on (Step 2). This procedure implies some degree of arbitrariness. Nutritionists may be better equipped to provide this information, i.e. what the basket should contain. Alternatively, we can start form revealed consumption patterns to estimate, for example, the average basket (and therefore the caloric intake) consumed by either total or groups of population16. All baskets must then be priced. This is done by attaching a market price to every good in the basket (Step 3). It will then be straightforward to calculate total expenditures for each basket by multiplying each price by the corresponding quantity of each item included in the basket (Step 4). If the same FEI can be achieved with less cost, one possibility is to set the minimum level of cost equal to the food poverty line (Step 5), which can be assumed to be “the” poverty line. The poverty line, therefore, corresponds to the minimum cost of buying different baskets with the same FEI.
Figure 2 - A step-by-step procedure to calculate FEI by the least-cost method
STEP OPERATIONAL CONTENT
1 Calculate the Food Energy Intake on the basis of external sources, nutritional studies, experts, etc.
2 Build one or more different baskets of goods having the same FEI
3 Price each item in the basket
4 Calculate, for each basket, the total cost of achieving FEI
5 Select the basket with the minimum cost. This is the poverty line
Figure 3, below, instead, illustrates the necessary steps to calculate the cost of FEI according to the expenditure-based method. This procedure is slightly more complicated. The starting point (Step 1) is the same as before. Step 2 underlines that to cost FEI by the expenditure-based method it is necessary to have information on average consumption. Step 3 requires that total calories must be calculated from this average consumption. Step 4 requires that the total calories of average consumption be compared to the required food energy intake. Two possibilities arise: i) if the calories in average consumption are lower than the calories required by FEI, average consumption of each item must be re-evaluated by a factor equal to the ratio between calories in FEI and calories in actual consumption (a factor greater than one) (Step 4a); ii) if calories in average consumption exceed calories in FEI, this latter must be selected (Step 4b). Step 5 requires that each item in the selected basket be priced (either in the re-evaluated
16 See Subramanian and Deaton, 1996.

Impacts of Policies on Poverty Absolute Poverty Lines
9
average consumption basket or in the FEI basket). Once priced, total expenditures corresponding to the selected basket defines the poverty line (Step 6).
Figure 3 - A step-by-step procedure to calculate FEI by the expenditure-based method
STEP OPERATIONAL
CONTENT
1 Calculate the Food Energy Intake on the basis of external sources, nutritional studies, experts, etc.
2 Observe average consumption of total population
3 Calculate total calories
corresponding to average consumption
4 Compare total calories
of average consumption with the FEI
4a If calories of average consumption falls short of calories of FEI, re-evaluate average consumption by the ratio between calories in FEI and calories in average consumption
4b If calories of average consumption exceed calories of FEI, select FEI and apply the least-cost method
5 Price each item of
either re-evaluated average consumption basket or FEI basket
6 Calculate
corresponding total expenditures. This level of expenditures is the poverty line
4.2 A step-by-step procedure for the Cost of Basic Needs (CBN)
Figure 4, below, illustrates the step-by-step procedure needed to calculate CBN by the least-cost method. Step 1 requires that the food poverty line be calculated as in FEI for the least-cost method. Step 2 requires that we select non-food items that are deemed essential (e.g. clothing, shelter, etc.). For non-food items, the procedure is equivalent to that followed in the case of the food poverty line. Non-food items must be priced and

EASYPol Module 005 Analytical Tools
10
total expenditures must be calculated (Step 3). Examples of non-food items may be: a given amount of housing space; a given amount of electricity and water, etc. This is the approach taken by Rowntree (1901) in his study of poverty in York. Orshansky (1965) used a shortcut for non-food items. She calculated the adequate amount of food intake, i.e. the food poverty line, and then multiplied it by 3, because the average food share in consumption, at that time, was 1/3. The cost of food items and the cost of non-food items must then be added together to get the poverty line (Step 4).
Figure 4 - A step-by-step procedure to calculate the CBN, least-cost method
STEP OPERATIONAL CONTENT
1 Calculate the food poverty line as in FEI. 2 Choose non-food items which are deemed as
essential
3 For non-food items, price each item and calculate total expenditures
4 Sum the cost of food and non-food items. This is the poverty line
Figure 5, below, instead, illustrates what is needed to apply the scaling-up method. Step 1 is common to the previous case and independent of the type of scaling-up. It requires that FEI be defined and that the food poverty line be calculated. After that, there are two possibilities. Step 2a, requires that we identify the average level of total expenditures of those individuals with food expenditures equal to the poverty line. This average level is the poverty line (FBTPL) and the end of the story. Step 2b, instead, requires that we identify the average level of non-food expenditures of those individuals with total expenditures equal to the food poverty line. In this case, there is a further step (Step 3), as the average level of non-food expenditures must be added to the food poverty line to get the total poverty line (TBTPL).

Impacts of Policies on Poverty Absolute Poverty Lines
11
Figure 5 - A step-by-step procedure to calculate the CBN, scaling-up method
STEP OPERATIONAL CONTENT
1 Calculate the food poverty line as in FEI
2a Calculate the average level of total expenditures of those individuals with food expenditures equal to the food poverty line. This average level is the FBTPL poverty line
2b Calculate the average level of non-food expenditures of those individuals with total expenditures equal to the food poverty line
3 Add the average level
of step 2b to the food poverty line. This is the TBTPL poverty line
4.3 A step-by-step procedure for the Consumption Insufficiency method (CI)
In the most popular version, CI methods follow the same procedure as in least-cost method for CBN. There is therefore nothing new in Figure 6, compared with Figure 4, if we make the exception of Step 2, where also non-essential non-food items must be chosen.
Figure 6 - A step-by-step procedure to calculate the CI, least-cost method
STEP OPERATIONAL CONTENT
1 Calculate the food poverty line as in FEI
2 Choose non-food items which are deemed as essential and non-essential non-food items
3 For non-food items, price each item and calculate non-food expenditures
4 Sum the cost of food and non-food items. This is the poverty line
4.4 A step-by-step procedure for the Budget Standard method (BS)
There are no particular steps to be followed to calculate BS in Figure 7, below, compared with CI and CBN methods. We only have to include in Step 2 some decision about which goods are adequate for social life, i.e. which of them should be considered in the calculation of poverty line.

EASYPol Module 005 Analytical Tools
12
Figure 7 - A step-by-step procedure to calculate BS
STEP OPERATIONAL CONTENT
1 Calculate the food poverty line as in FEI
2 Choose non-food items which are deemed as essential, non-essential non-food items and goods that are adequate for social life
3 For non-food items, price each item and calculate non-food expenditures
4 Sum the cost of food and non-food items. This is the poverty line
5 EXAMPLES OF HOW TO DEFINE POVERTY WITH ABSOLUTE CONCEPTS
5.1 The FEI method
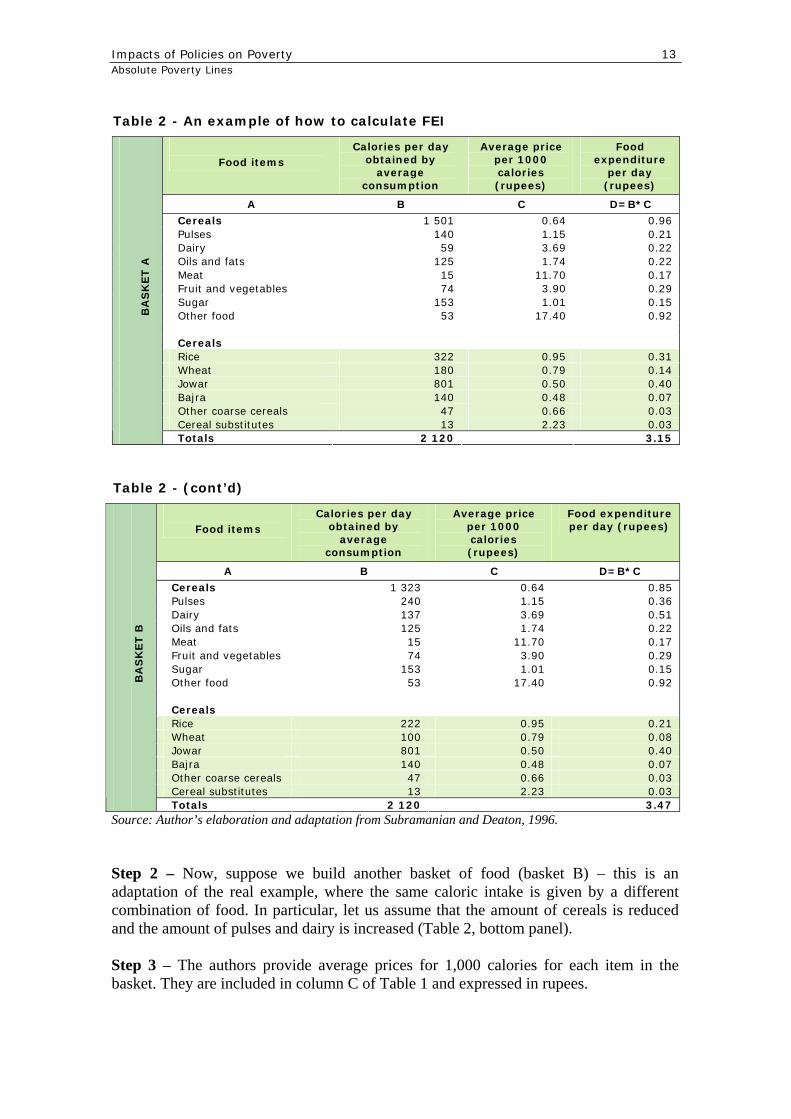
Let us start with an example of how to cost FEI according to the least-cost method is used (Table 2, below). Numbers are adapted from a real case for India, as described in Subramanian and Deaton, 1996. Step 1 – In order to calculate an adequate food energy intake, the authors start from observed consumption patterns in the household survey for the state of Maharashtra, in India. This survey contains data on both expenditure and quantities of 149 food items. Data on quantities are converted by the authors into calories using the tables on the nutritive values of Indian foods. For the average consumption of total population, the daily caloric intake is 2,120 calories (Table 2, top panel – basket A). As can be easily seen, most of the caloric intake comes from cereals (about 75 per cent).
Impacts of Policies on Poverty Absolute Poverty Lines
13
Table 2 - An example of how to calculate FEI
Food items
Calories per day obtained by
average consumption
Average price per 1000 calories (rupees)
Food expenditure
per day (rupees)
A B C D=B*C
Cereals 1 501 0.64 0.96 Pulses 140 1.15 0.21 Dairy 59 3.69 0.22 Oils and fats 125 1.74 0.22 Meat 15 11.70 0.17 Fruit and vegetables 74 3.90 0.29 Sugar 153 1.01 0.15 Other food 53 17.40 0.92 Cereals Rice 322 0.95 0.31 Wheat 180 0.79 0.14 Jowar 801 0.50 0.40 Bajra 140 0.48 0.07 Other coarse cereals 47 0.66 0.03 Cereal substitutes 13 2.23 0.03
B
AS
KET A
Totals 2 120 3.15
Table 2 - (cont’d)
Food items
Calories per day obtained by
average consumption
Average price per 1000 calories (rupees)
Food expenditure per day (rupees)
A B C D=B*C
Cereals 1 323 0.64 0.85 Pulses 240 1.15 0.36 Dairy 137 3.69 0.51 Oils and fats 125 1.74 0.22 Meat 15 11.70 0.17 Fruit and vegetables 74 3.90 0.29 Sugar 153 1.01 0.15 Other food 53 17.40 0.92 Cereals Rice 222 0.95 0.21 Wheat 100 0.79 0.08 Jowar 801 0.50 0.40 Bajra 140 0.48 0.07 Other coarse cereals 47 0.66 0.03 Cereal substitutes 13 2.23 0.03
B
AS
KET B
Totals 2 120 3.47 Source: Author’s elaboration and adaptation from Subramanian and Deaton, 1996. Step 2 – Now, suppose we build another basket of food (basket B) – this is an adaptation of the real example, where the same caloric intake is given by a different combination of food. In particular, let us assume that the amount of cereals is reduced and the amount of pulses and dairy is increased (Table 2, bottom panel). Step 3 – The authors provide average prices for 1,000 calories for each item in the basket. They are included in column C of Table 1 and expressed in rupees.

EASYPol Module 005 Analytical Tools
14
Step 4 – The total cost of achieving FEI is given in column D and obtained as the sum of the products of calories and corresponding prices for each item. Following this procedure, basket A would cost 3.15 rupees per day; basket B would cost 3.47 rupees per day. For comparison, the authors note that the wage rate in rural Maharashtra is about 15 rupees per day. Step 5 – Given that the same caloric intake can be obtained from two different baskets, the poverty line is taken to be the minimum cost to achieve that intake. The poverty line, in this case, would be 3.15 rupees per day. However, basket B could have still been chosen, if basket A falls short, say, of the minimum nutritional requirement. Table 3, below, instead, illustrates what is needed to cost FEI when the expenditure-based method is used. The table assumes that the minimum caloric intake is 2,822 calories per day and that the caloric intake derived from average observed consumption is equal to 2,120 calories. In this case, daily consumption of each item is reevaluated by the ratio (2,822/2,120) = 1.331. With this correction, the average consumption is proportionally scaled up in order to achieve the minimum caloric intake. Food expenditure per day, given the same prices as before, is therefore recalculated in column F. It gives a total amount of 4.19 rupees per day, which is taken to be the poverty line according to FEI (expenditure-based method).
Table 3 - An example of how to cost FEI by the expenditure-based method
Food items
Calories per day obtained by average consumption
Average price per 1000 calories (rupees)
Food expendi-ture per day (rupees)
Re-evaluated daily consump-tion
Food expendi-ture per day (rupees)
A B C D=B*C E(§) F=E*C
Cereals 1501 0.64 0.96 1998 1.28
Pulses 140 1.51 0.21 186 0.28
Dairy 59 3.69 0.22 79 0.29
Oils and fats 125 1.74 0.22 166 0.29
Meat 15 11.70 0.17 20 0.23
Fruit and vegetables
74 3.90 0.29 99 0.39
Sugar 153 1.01 0.15 203 0.21
Other food 53 17.40 0.92 71 1.23
Totals 2120
Minimum caloric intake
2822
B
AS
KET A
3.15 2822 4.19
(§) Obtained by multiplying each item in column B by the ratio between the minimum caloric intake (2,822) and the caloric intake from average consumption (2,120). Source: Author’s elaboration and adaptation from Subramanian and Deaton, 1996.

Impacts of Policies on Poverty Absolute Poverty Lines
15
5.2 The CBN method
Drawing on the same real case as before, Table 4, below, explains how to calculate the CBN by using the least-cost method. The top panel is the same as in the case of FEI. It gives a food poverty line of 3.15 rupees per day. No further comment is therefore needed. The bottom panel, instead, includes two basic non-food items, clothing and shelter. The hypothesis is that their daily cost is equal to 0.05 rupees and 0.10 rupees, respectively. Non-food expenditure per day would therefore be equal to 0.15 rupees per day. The CBN poverty line is calculated by summing this non-food expenditure to the food poverty line. It gives 3.30 rupees per day, which is taken to be the poverty line.
Table 4 - An example of how to build CBN, least-cost method
Food items
Calories per day obtained by average consumption
Average price per 1000 calories (rupees)
Food expenditure per day (rupees)
A B C D=B*C
Cereals 1501 0.64 0.96
Pulses 140 1.15 0.21
Dairy 59 3.69 0.22
Oils and fats 125 1.74 0.22
Meat 15 11.70 0.17
Fruit and vegetables
74 3.90 0.29
Sugar 153 1.01 0.15
Other food 53 17.40 0.92
Total calories 2120
Food poverty line (FEI) 3.15
Non-food items Non-food expenditure per day (rupees)
Clothing 0.05
Shelter and utilities 0.10
B
AS
KET A
CBN poverty line (least-cost)
3.30
Source: Author’s elaboration and adaptation from Subramanian and Deaton, 1996. Table 5, below, instead, illustrates the alternative method of building CBN, i.e. the scaling up method. Table 5 reports a hypothetical distribution of food and non-food expenditures of seven individuals. Let us also assume that the food poverty line is as calculated in Table 2, at 3.15 rupees per day. Let us first investigate how to calculate FBTPL. This is very simple. For example, in the table George and Mark have food expenditures (3.15 rupees) equal to the food poverty line. In order to calculate FBTPL, we must calculate the average total expenditures of

EASYPol Module 005 Analytical Tools
16
those individuals. This average is 4.575, which is also the poverty line according to the FBTPL. With regard to TBTPL, we must first identify those individuals with total expenditures equal to the food poverty line. As is the case for Jack and Frank in the table. Then, we must calculate the average level of their non-food expenditures, which is 0.67. This average level is the non-food poverty line. Adding it to the food poverty line, yields a TBTPL of 3.82. As can be easily seen, the two methods leads to different poverty lines. In particular, FEI < TBTPL < FBTPL, as discussed in Figure 1, as 3.15 < 3.82 < 4.575.
Table 5 - An example of how to build CBN, scaling up method
Individuals
Food expenditure per day (rupees)
Non-food expenditure per day (rupees)
Total expenditures per day (rupees)
A B C D=B*C
Jack 2.31 0.84 3.15
Frank 2.65 0.50 3.15
George 3.15 1.35 4.50
Mark 3.15 1.50 4.65
Paul 4.50 1.48 5.98
Charles 5.47 1.42 6.89
Edward 6.22 1.93 8.15
Food poverty line (see Table 2) 3.15
Calculation of FBTPL
a) Identify individuals with food expenditure = FEI poverty line. They are George and Mark.
b) Take their average total expenditure: (4.50+4.65)/2 = 4.575. This is the FBTPL poverty line (look at total expenditure of those having a level of food expenditure equal to the food poverty line).
Calculation of TBTPL
a) Identify individuals with total expenditure = FEI poverty line. They are Jack and Frank.
b) Take their average non-food expenditure: (0.84+0.50)/2 = 0.67.
B
AS
KET A
c) Sum up FEI poverty line (3.15) and average non-food expenditure (0.67). It gives 3.82. This is the TBTPL poverty line (look at non-food expenditure of those having total expenditure equal to the food poverty line).
Another possibility of calculating a TBTPL poverty line is given by Ravallion and Bidani, 1994. They used the regression method described in Section 3.2, using data on 45,000 households in the SUSENAS sample for Indonesia. They found that the average food share of those having total expenditure equal to the food poverty line was α=0.67. It means that the average non-food expenditure (1-α)=0.33. Therefore (2-0.67)=1.33 was the factor they applied to zFEI to obtain the cost of basic needs according to the TBTPL method. The method by Ravallion and Bidani is recommended when large datasets have to be handled. Furthermore, the econometric specification allows the analyst to take into account non-linearities in the relation between food share and

Impacts of Policies on Poverty Absolute Poverty Lines
17
income (i.e. a quadratic Engel curve, like in Ravallion and Bidani, 1994, and those socio-demographic characteristics that are likely to affect the relation between food share and income. Things are not always as simple as Table 5 may suggest.
5.3 The CI and BS method
The way in which the Consumption Insufficiency and Budget Standard methods can be applied do not differ in the technical procedure from what is illustrated in the previous section. When these methods are chosen, the problem is not how to calculate the poverty line, but how to select non-essential non-food items and goods for social life they require. The CI method, for example, could be easily applied following the example of Table 4, by adding a non-essential non-food item (e.g. a bicycle). The daily cost of this item should then be added to the CBN poverty line, in order to get a CI poverty line. In the same vein, BS methods could be easily applied following the same example, by adding a good for an individual’s social life, like, say, recreational activities. The daily cost per day of this good should then be added to the CI poverty line to get the BS poverty line. As already noted in the conceptual section, this way of proceeding is polluted by the increasing arbitrary content of the goods selected to define the poverty line. These two methods often end up with considering total expenditure as an indicator of standard of living, not least because of the extreme difficulty to get a reliable series of prices for non-essential goods in less developed countries.
6 DISCUSSION: CRITICAL ASPECTS OF ABSOLUTE POVERTY LINES
6.1 Critical aspects of FEI
Let us now focus on some critical aspects of these methodologies. Even though FEI is relatively parsimonious in its requirements, as we need to determine which food and the amount of food that is adequate for an individual to be in good health, it is a severe conception of minimum subsistence. Even extremely poor individuals should consume some clothing and shelter, but the value of these consumption items is not embodied in FEI. Furthermore, note that economic welfare and nutritional standards may give contradictory prescriptions (see Section 3.1). There might be difficulties to find consensus on which food is more adequate (basket A or basket B in Table 2?). Furthermore, the type and the amount of food needed to be in good health may vary among individuals and areas, with potential differences of the underlying poverty lines by subgroups of population. For example, Tarp et al., 2002, for the case of Mozambique, uses three variants of FEI poverty lines, finding that poverty comparisons are not robust with respect to the choice of the approach. FEI ignores the possibility of substitution among goods to achieve the same food energy intake (basket A and B in Table 1). Substitution may occur because of different tastes and basically depends on cross-price elasticities. FEI implies that the preference structure must be equal for all individuals and equal to that set by nutritional standards.

EASYPol Module 005 Analytical Tools
18
Substitution may also occur depending on relative prices. The cost of buying a fixed energy intake may change if the prices of food items are different over space and time. Poverty lines tend to be higher where the relative price of food is higher, even though consumers may be compensated by lower prices elsewhere in the budget17. As a consequence, food energy intakes may have different values in different areas because of different price levels. Ravallion and Bidani, 1994, give an example for Indonesia. They found that in the cities higher prices and lower caloric requirements prevail. Urban food prices were, on average, 12 per cent higher than in rural areas. At the same level of per capita expenditure, therefore, urban consumers consume less calories than rural consumers do. It follows that a common nutritional standard would require a higher per capita expenditure in the cities. This would result in a higher poverty line in urban than in rural areas. They show that it would mean that there appears to be more poverty in urban areas, even though real incomes and real levels of consumption are much higher in the cities. This also suggests that policies aimed to affect prices of food baskets are likely to affect their composition
6.2 Critical aspects of CBN
CBN shares with FEI the flaws and criticisms imputed to food items. In addition, it has its own flaws regarding the non-food side of the approach. In particular, as it requires the determination of an adequate set of non-food items (for which there is less objective standard than the nutritional requirements in the case of food), it may give rise to strong disagreements on the appropriate list, as well as the difficulty of correctly pricing them. The difficulty of valuing non-food items has led some countries to use shortcuts to estimate the non-food components. As noted above, Vietnam and South Korea, in the past, have used the median level of all non-food spending and the average spending in the poorest two-fifths of the population in the income distribution, respectively, without discriminating among non-food items. Such methods have the effect of changing the nature of the poverty from absolute to mixed (absolute in the food part and relative in the non-food part).
6.3 Critical aspects of CI
From a conceptual point of view, there is no difference with CBN. Flaws and criticisms are almost the same, with CI possibly exacerbating the disagreement about non-food items to be included in the list, as it is extremely difficult to find an objective basis to include non-essential items in the calculation of the poverty line.
6.4 Critical aspects of BS
BS requires that goods be defined as adequate for social life, which may cause further disagreement on the appropriateness of goods beyond that already discussed for both food and non-food items in other methods. More importantly, the value of goods for social life is not easily determined, as for many of them there is no market price. This makes their evaluation somewhat arbitrary, leading to arbitrary poverty lines.
17 See Deaton, 1997.

Impacts of Policies on Poverty Absolute Poverty Lines
19
7 CONCLUSIONS
The basic result of this module is that poverty lines may be defined with the help of some absolute concepts. Four concepts have been considered: FEI, CBN, CI and BS. FEI is the more restrictive, as it only includes food items in the calculation of the poverty line. The other methods progressively add other items for the definition of poverty line. Table 6, below, summarises these aspects, focusing on the definition of each method and the on the general concept of poverty it underlines, as well as the main flaws and criticisms. The far right column indicates how the poverty line is calculated.

EASYPol Module 005 Analytical Tools
20
Table 6 - Poverty lines in an absolutist perspective
METHODS
Definition General concept
Main requirements
Flaws/ Criticism
Poverty line measure-ment
1) Food Energy Intake (FEI)
Enough food to meet energy requirements
Severe conception of minimum subsistence. It disregards social needs
Determine the amount of food (nutritional requirements) that is adequate for good health
a) Difficulties about consensus on which kind of food is more adequate;
b) it ignores substitution possibilities;
c) it ignores different tastes
The cost of purchasing basic food
2) Cost of basic needs (CBN)
A consumption bundle with food and non-food items that are deemed to be adequate
Mild conception of minimum subsistence. Close to budget standard methods
As in 1 + the determination of which and how many non-food items
As in 1 + a) disagreement on the list of non-food items;
b) difficulty in valuing them.
The cost of purchasing the basket of food and non-food items
3) Consump-tion insufficiency (CI)
All goods and services considered necessary to satisfy the unit's basic needs
Weak conception of minimum subsistence. Very close to budget standard methods
As in 2 As in 2 The aggregate value of all goods and services
4) Budget standard methods (BS)
All goods and services considered necessary to satisfy the unit's basic needs plus a basic minimum for social lives
Weak conception of minimum subsistence
As in 3 + the need to define what is adequate for social lives.
As in 3 + disagreement about what constitutes adequate for social lives.
The aggregate value of all needs
8 READERS’ NOTES
8.1 Time requirements
The delivery of this module to an audience already familiar with the definition of poverty18 may take up to three hours.
18 See EASYPol Module 004: Impacts of Policies on Poverty: The Definition of Poverty.

Impacts of Policies on Poverty Absolute Poverty Lines
21
8.2 Frequently asked questions
Some frequently asked questions are the following: How is poverty defined? Poverty may be defined on an absolute basis, but methods
may differ according to which goods are included in calculating the cost of a decent living standard.
How do we build a poverty line? The main methods are FEI and CBN. They are also the most used in an absolutist perspective. CI and BS methods are flawed by the type of goods that should define the standard of living. These two latter methods are also the most polluted by relative concepts.
Is the poverty line a too rough a threshold to define who is poor and who is not? Yes, it is. Poverty is not usually such a discontinuous phenomenon to say that being just above the absolute poverty line means that you are a non-poor. Contradictory results may emerge if different versions of the poverty lines are used19 20.
8.3 Complementary EASYPol modules
Complementary EASYPol modules are: EASYPol Module 004: Impacts of Policies on Poverty: The Definition of Poverty.
which is propaedeutic to this module. EASYPol Module 035: Impacts of Policies on Poverty: Dominance and Poverty.
which is useful to understand how to skip the controversial issue of setting a poverty line. Before reading this module, however, it is best if other modules on poverty measurement are addressed first.
9 REFERENCES AND FURTHER READINGS
Ahmed T. U., 1991. Poverty in Bangladesh, Proceedings of the Workshop of
Dissemination of Current Statistics, Bureau of Statistics, Dhaka, Bangladesh. Dandekar V. M., Rath N., 1971a. Poverty in India: Dimensions and Trends, Economic
and Political Weekly, 6, pp. 25-48, Mumbai, India. Dandekar V. M., Rath N., 1971b. Poverty in India, Indian School of Political Economy,
Pune, India. Deaton A., 1997. The analysis of household surveys, The Johns Hopkins University
Press, Baltimore, USA. Ercelawn A., 1991. Absolute Poverty as Risk of Hunger: Norms, Incidence, and
Intensity for Rural and Urban Pakistan, University of Karachi, Applied Economics Research Centre, Karachi, Pakistan.
19 See, for example, Tarp et al. ,2002, for the case of Mozambique. 20 On this topic, see the Easypol Module 035: Impacts of Policies on Poverty: Poverty and
Dominance.

EASYPol Module 005 Analytical Tools
22
FAO, 1950. Calorie Requirements. Report of the Committee of Calorie Requirements, FAO Nutritional Studies No. 5, Rome, Italy.
FAO, 2003. Food Energy – Methods of Analysis and Conversion Factors, FAO Food and Nutrition Paper No. 77, FAO, Rome, Italy.
Greer J., Thorbecke E., 1986. A Methodology for Measuring Food Poverty Applied to Kenya, Journal of Development Economics, 24, pp. 59-74, Elsevier, BV.
Orshansky M., 1965. Counting the Poor: Another Look at the Poverty Profile, Social Security Bulletin, 28/1, pp. 3-29.
Osmani S., 1982. Economic Inequality and Group Welfare, Oxford University Press, Oxford, UK.
Park, N. H. 2001. Poverty Rate and Poverty Line in Korea, Conference Paper, Philippine Institute for Development Studies, Makati City, The Philippines.
Paul S., 1989. A model of construncting the poverty line, Journal of Development Economics, 30, pp. 129-144, Elsevier, BV.
Perumal M., 1992. New Budget Standard Poverty Lines for Malaysia, Review of Income and Wealth, 38, pp. 341-353, (also available at: http://www.roiw.org/1992/341.pdf)
Ravallion M., Bidani B., 1994. How Robust is a Poverty Profile?, The World Bank Economic Review, 8(1), pp. 75-102.
Rowntree B. S., 1901. Poverty: A Study of Town Life, MacMillan, London, UK. Subramanian S., Deaton A., 1996. The demand for Food and Calories, Journal of
Political Economy, 104, pp. 133-162, The University of Chicago Press, USA. Tarp F., Simler K., Matusse C., Heltberg R., Dava G., 2002. The Robustness of Poverty
Profiles Reconsidered, FCND Discussion Paper No. 124, IFPRI, Washington DC, USA.
World Bank, 2001. Poverty Manual (available at: http://web.worldbank.org/WBSITE/EXTERNAL/WBI/WBIPROGRAMS/PGLP/0,,contentMDK:202842
96~menuPK:461269~pagePK:64156158~piPK:64152884~theSitePK:461246,00.html).

Impacts of Policies on Poverty Absolute Poverty Lines
23
Module metadata
1. EASYPol module 005
2. Title in original language English Impacts of Policies on Poverty French Spanish Other language
3. Subtitle in original language English The Identification of Poverty by Absolute Concepts French Spanish Other language
4. Summary This module illustrates how to define “absolute” poverty lines, i.e poverty lines based on approaches that consider the welfare position of each individual or household as if it were independent of the conditions of other individuals or households belonging to the same community. In particular, this module will discuss the following methods: the food energy intake (FEI); the cost of basic needs (CBN); the consumption insufficiency method (CI); the budget standard method (BS). The analogies and differences of the above methods will be highlighted and we shall also illustrate how they can be made operational and how they work, by means of step-by-step procedures and examples.
5. Date November 2005
6. Author(s) Lorenzo Giovanni Bellù, Agricultural Policy Support Service, Policy Assistance Division, FAO, Rome, Italy Paolo Liberati, University of Urbino, "Carlo Bo", Institute of Economics, Urbino, Italy 7. Module type
Thematic overview Conceptual and technical materials Analytical tools Applied materials Complementary resources
8. Topic covered by the module
Agriculture in the macroeconomic context Agricultural and sub-sectoral policies Agro-industry and food chain policies Environment and sustainability Institutional and organizational development Investment planning and policies Poverty and food security Regional integration and international trade Rural Development
9. Subtopics covered by the module
10. Training path Analysis and monitoring of socio-economic impacts of policies
11. Keywords