impacts of land use change due to biofuel crops on carbon balance, bioenergy production, and...
TRANSCRIPT
Impacts of land use change due to biofuel crops oncarbon balance, bioenergy production, and agriculturalyield, in the conterminous United StatesZHANGCA I Q IN * , Q IANLA I ZHUANG* † and MIN CHEN*
*Department of Earth & Atmospheric Sciences, Purdue University, CIVIL 550 Stadium Mall Drive, West Lafayette, IN,
47907-2051, USA, †Department of Agronomy, Purdue University, West Lafayette, IN, 47907, USA
Abstract
Growing concerns about energy and the environment have led to worldwide use of bioenergy. Switching from
food crops to biofuel crops is an option to meet the fast-growing need for biofuel feedstocks. This land use
change consequently affects the ecosystem carbon balance. In this study, we used a biogeochemistry model, the
Terrestrial Ecosystem Model, to evaluate the impacts of this change on the carbon balance, bioenergy produc-
tion, and agricultural yield, assuming that several land use change scenarios from corn, soybean, and wheat to
biofuel crops of switchgrass and Miscanthus will occur. We found that biofuel crops have much higher net pri-
mary production (NPP) than soybean and wheat crops. When food crops from current agricultural lands were
changed to different biofuel crops, the national total NPP increased in all cases by a range of 0.14–0.88 PgC yr�1, except while switching from corn to switchgrass when a decrease of 14% was observed. Miscanthus is
more productive than switchgrass, producing about 2.5 times the NPP of switchgrass. The net carbon loss
ranges from 1.0 to 6.3 Tg C yr�1 if food crops are changed to switchgrass, and from 0.4 to 6.7 Tg C yr�1 if chan-
ged to Miscanthus. The largest loss was observed when soybean crops were replaced with biofuel crops. Soil
organic carbon increased significantly when land use changed, reaching 100 Mg C ha�1 in biofuel crop ecosys-
tems. When switching from food crops to Miscanthus, the per unit area croplands produced a larger amount of
ethanol than that of original food crops. In comparison, the land use change from wheat to Miscanthus producedmore biomass and sequestrated more carbon. Our study suggests that Miscanthus could better serve as an energycrop than food crops or switchgrass, considering both economic and environmental benefits.
Keywords: bioenergy, crop yield, net ecosystem production, net primary production, soil carbon, the Terrestrial Ecosystem
Model
Received 17 July 2011 and accepted 22 August 2011
Introduction
Increasing political, economic, and environmental secu-
rity concerns are linked to energy dependence. Bioener-
gy is expected to play an important role in the global
energy mix in the foreseeable future. Limited supply of
conventional energy and rising fossil fuel carbon emis-
sions have increased the need for renewable energy
(Kim et al., 2009; Melillo et al., 2009). Bioenergy made
available from materials derived from biologic sources
meets the dual purpose of enhancing energy security
and mitigating climate change, and is probably a reli-
able alternative to petroleum fuels (Kim et al., 2009;
Beringer et al., 2011). A number of countries have set
voluntary or mandatory biofuel targets for substituting
petroleum fuels with biofuels (Fargione et al., 2010).
Global biofuel production has increased dramatically in
the last decade, especially in United States and Brazil
(Carriquiry et al., 2011). For fuel ethanol in the United
States, production increased from less than 2 billion gal-
lons in the early 2000s to 4 billion gallons in 2005, and
13 billion gallons in 2010 (Renewable Fuels Association,
2011). According to the Energy Independence and Secu-
rity Act of 2007 (The United States of America, 2007),
the United States is expected to produce 36 billion gal-
lons (136 billion liters) of renewable fuels by 2022,
including 21 billion gallons (79 billion liters) of cellu-
losic ethanol.
However, the rapid growth of food-based biofuel is
controversial, and issues of food security and potential
ecological and environmental problems are often dis-
cussed. Currently, most biofuels are made from food
crops like corn and soybeans. This raises major nutri-
tional and ethical concerns, as growing crops for fuel
consumes land, water, and energy resources that couldCorrespondence: Zhangcai Qin, tel. + 1 765 494 0264,
fax + 1 765 496 1210, e-mail: [email protected]
© 2011 Blackwell Publishing Ltd 277
GCB Bioenergy (2012) 4, 277–288, doi: 10.1111/j.1757-1707.2011.01129.x
otherwise be used in food production for humans
(Pimentel et al., 2010). In the United States, 13 million
hectares of cropland is required to produce 37 million
liters biofuel production in 2008 (Fargione et al., 2010).
That is about 7% of the 179 million hectares of national
cropland (Lubowski et al., 2006). To meet the 2022 bio-
fuel mandate, another 15% of the cropland will be used
in the United States for biofuel production. Producing
biofuel from food threatens food security not only in
the United States but also in other countries, especially
countries that have populations suffering from malnour-
ishment (Tilman et al., 2009; Pimentel et al., 2010). Stud-
ies show that conventional food-based biofuels
contribute to monoculture and deforestation, which
jeopardizes ecological biodiversity and ecosystem ser-
vices (Fargione et al., 2008; Searchinger et al., 2008). Fur-
thermore, some biofuels are not competitive with
existing fossil fuels, and may result in negative energy
return and net greenhouse gas (GHG) emissions
(Searchinger et al., 2008; Pimentel et al., 2010). To date,
conventional biofuels manufacture has important limita-
tions (Evans, 2007) and the production may not be able
to keep pace with fast-growing industry needs and
energy demand (Hill et al., 2006; Hurt et al., 2006). These
problems limit further development of conventional
biofuels.
Second-generation biofuels are expected to help solve
these problems, and to provide a considerable propor-
tion of the fuel supply sustainably, affordably, and with
greater environmental benefits. These biofuels are
derived from lignocellulosic crops, and the biomass
feedstock encompasses a wide range of sources such as
food crop stalks, forest residues, and grass. Food crops
like corn and soybeans will be consumed less for biofuel
purposes. Tilman et al. (2006) reported that biofuels
derived from well-managed energy crops provide more
usable energy, higher GHG reductions, and less agri-
chemical pollution than conventional biofuels. Perennial
energy crops like switchgrass require less water and
nutrition input and produce much higher biomass per
hectare for biofuel use than food crops (Hill et al., 2006;
Fargione et al., 2010; Carriquiry et al., 2011), and can be
produced on degraded or abandoned agricultural land,
eliminating the competition with food production for
cropland, and without causing a loss of biodiversity via
habitat destruction (Tilman et al., 2006, 2009; Carriquiry
et al., 2011). Even though food-based biofuels currently
eat up most of the bioenergy market, the majority of
increased production after 2020 is expected to come
from second-generation biofuels (IEA bioenergy, 2008;
Fargione et al., 2010). Furthermore, the technologies
required to process cellulosic feedstocks into bioenergy
are expected to be available within the next 10–20 years
(Ragauskas et al., 2006; Beringer et al., 2011).
From the perspective of carbon mitigation, land use
change for biofuel production may impact the ecosys-
tem carbon balance both directly and indirectly. Soil
and plant biomass are the two largest biologically active
carbon stores in terrestrial ecosystems. Both land use
and land cover (LULC) conversions will affect the car-
bon exchange in soil-plant-atmosphere systems. Switch-
ing from natural habitats like forests or grasslands to
food crop-based biofuels creates a net ‘biofuel carbon
debt’ by releasing more CO2 than what is saved with
the replacement of fossil fuels (Fargione et al., 2008).
However, making biofuels from perennial biomass
grown on degraded or abandoned agricultural land
seems to be applicable and beneficial to GHG reduc-
tions (Campbell et al., 2008; Fargione et al., 2008). While
the debate continues, indirect land use change effects on
carbon balance should not be neglected when account-
ing for GHG reduction (Fargione et al., 2010). Possible
deforestation and other indirect land use changes asso-
ciated with biofuel production lead to uncertainties in
GHG accounting (Searchinger et al., 2008; Melillo et al.,
2009).
Considering the concerns of land source for biofuel
production, crop switching from food crops to biofuel
crops is one of the most promising options to meet
the fast-growing need for biofuel feedstocks in the
United States (Heaton et al., 2008; Hoekman, 2009;
Fargione et al., 2010). Available lands for biofuel pro-
duction are very limited; the direct sources can be
classified into three categories: previously cropped
land brought back into production, conversion of land
used for other purposes to cropland, and crop switch-
ing (Fargione et al., 2010). There are, however, many
economic, social, or environmental risks involved in
any of these three land sources. Cultivating the previ-
ously cropped land, the abandoned, or marginal land,
for biomass production jeopardizes benefits for small-
scale farmers and the rural poor. This may lead to
social issues like the displacement of rural communi-
ties (Beringer et al., 2011). Moreover, in the United
States, available marginal land sources for biofuel pro-
duction is not as encouraging when compared with
other regions like Africa or China (Cai et al., 2011).
Converting natural ecosystems to biofuel crops will
undoubtedly cause environmental problems, like
increased GHG emissions and loss of biodiversity
(Fargione et al., 2008; Searchinger et al., 2008; Melillo
et al., 2009; Fargione et al., 2010). Crop switching from
currently food-based crops to biofuels crops will
directly reduce the land available for food production,
and most probably lead to food reduction, discounting
any agricultural, agronomical technology, or manage-
ment improvement. To achieve the future bioenergy
goal, any of these land sources could potentially con-
© 2011 Blackwell Publishing Ltd, GCB Bioenergy, 4, 277–288
278 Z. QIN et al.
tribute to additional biofuel production and subse-
quent environmental effects.
To date, many studies have investigated the direct
and indirect effects of land use changes such as bring-
ing previously cropped land back into production and
converting land currently used for other purposes to
cropland (Fargione et al., 2008; Searchinger et al., 2008;
Melillo et al., 2009; Lapola et al., 2010). However, the
effects of land use change associated with possible crop
switching options for biofuel production on the ecosys-
tem carbon balance has been less addressed (Fargione
et al., 2010). Corn, soybeans, and wheat are three major
crops with the highest production among food crops in
United States, with about 220, 63, and 64 million tons
per year (of the 1990s), respectively (FAOSTAT, 2011).
Switchgrass (Panicum virgatum) and Miscanthus (e.g.
Miscanthus giganteus) are two important second-genera-
tion biofuel crops with the potential to produce a large
amount of biofuel feedstocks and mitigate carbon emis-
sions (Parrish & Fike, 2005; Clifton-Brown et al., 2007;
Tilman et al., 2009; Fargione et al., 2010; Pimentel et al.,
2010), and they are expected to be used to meet the US
bioenergy goals with less land compared with food
crops (McLaughlin & Kszos, 2005; Heaton et al., 2008).
Crop switching from corn, soybeans, or wheat to
switchgrass or Miscanthus is foreseeable for second-
generation biofuel production in the next several dec-
ades. The consequent land use change due to crop
switching will enormously impact the ecosystem carbon
dynamics, as well as change the regional carbon fluxes
and pool sizes, which are essential for GHG estimations
(Fargione et al., 2010).
In this study, using a biogeochemical model, the Ter-
restrial Ecosystem Model (TEM; Zhuang et al., 2003), we
quantified the carbon balance due to the direct land use
change associated with biofuel production in the conter-
minous US carbon fluxes, and pool sizes were evaluated
under the land use change scenarios of LULC change
from food crops (corn, soybeans, and wheat) to biofuel
crops (switchgrass and Miscanthus). We further dis-
cussed the energy production, food yield, and land
replacement associated with these land use changes.
Methods
Overview
Terrestrial Ecosystem Model was parameterized to quantitate
the carbon dynamics in the agroecosystems of corn, soybeans,
wheat, switchgrass, and Miscanthus. Regional land use change
effects on biomass production, soil carbon, and ecosystem car-
bon balance were then estimated for the conterminous United
States, followed by further discussion of land use change
effects on bioenergy production, crop yield, and land use.
TEM description and parameterization
Terrestrial Ecosystem Model is a process-based global-scale
ecosystem model that estimates carbon (C) and nitrogen (N)
fluxes and pool sizes in terrestrial ecosystems at a monthly
time step using spatial climate and ecological data (Raich et al.,
1991; McGuire et al., 1992). TEM has been well-documented in
simulating the C dynamics in natural ecosystems at regional
and global scales (e.g. McGuire et al., 2001; Lu et al., 2009; Lu &
Zhuang, 2010). TEM consists of two major C pools (vegetation
carbon and soil carbon) to simulate several C fluxes as gross
primary production (GPP), net primary production (NPP), net
ecosystem production (NEP), autotrophic respiration (RA), and
heterotrophic respiration (RH). In this study, TEM was coupled
with freezing and thawing dynamics (Zhuang et al., 2003).
Parameters in TEM are constant, vegetation-specific, or soil-
specific, and most of them have been well defined in previous
studies (e.g. Raich et al., 1991; McGuire et al., 1992; Zhuang
et al., 2003), but some still need to be determined via calibration
using site-level data of climate and ecosystem data. Previous
studies using TEM mostly focused on natural ecosystems like
forests or grasslands, and paid less attention to managed agri-
cultural ecosystems. In this study, we parameterized TEM for
food crop and biofuel crop ecosystems.
Climate data, together with the observed data of C and N
fluxes and pool sizes, was used to calibrate the model. The
monthly air temperature, precipitation, and cloudiness in the
1990s, obtained from the Climate Research Unit (CRU; Mitchell
& Jones, 2005), were used for the corresponding sites. C and N
fluxes and pool sizes used for corn, soybeans, wheat, Miscan-
thus, and switchgrass were documented in Table 1. TEM was
calibrated for each crop to obtain the values for each limiting
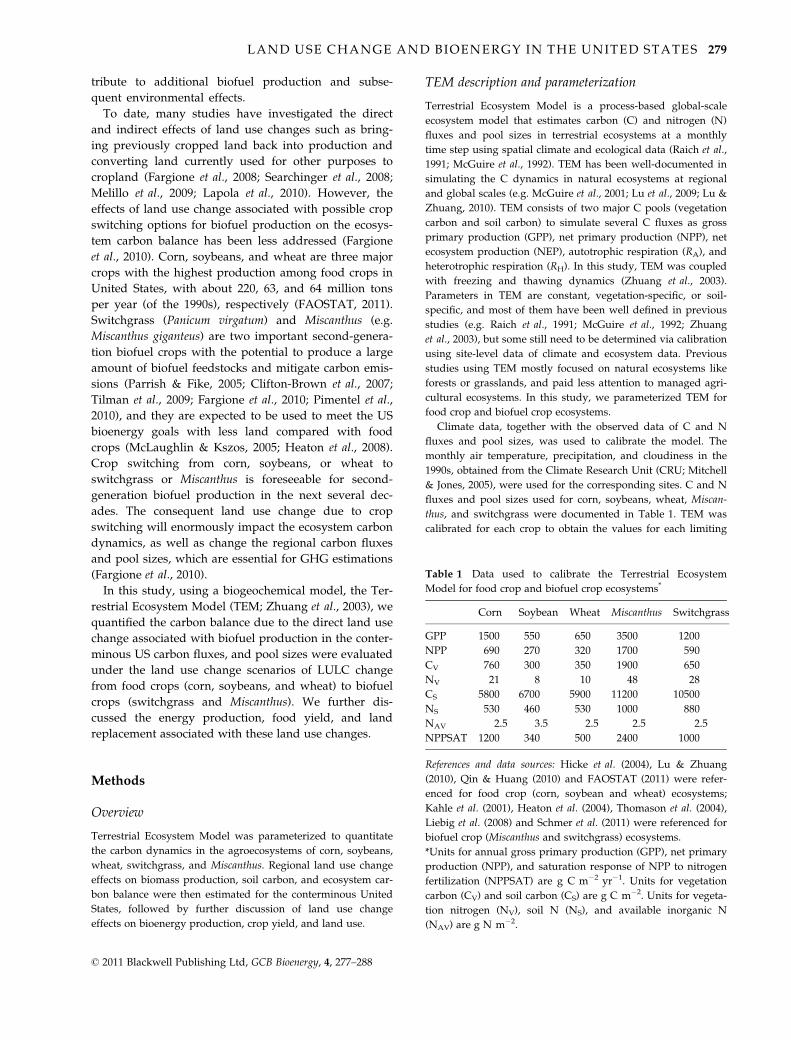
Table 1 Data used to calibrate the Terrestrial Ecosystem
Model for food crop and biofuel crop ecosystems*
Corn Soybean Wheat Miscanthus Switchgrass
GPP 1500 550 650 3500 1200
NPP 690 270 320 1700 590
CV 760 300 350 1900 650
NV 21 8 10 48 28
CS 5800 6700 5900 11200 10500
NS 530 460 530 1000 880
NAV 2.5 3.5 2.5 2.5 2.5
NPPSAT 1200 340 500 2400 1000
References and data sources: Hicke et al. (2004), Lu & Zhuang
(2010), Qin & Huang (2010) and FAOSTAT (2011) were refer-
enced for food crop (corn, soybean and wheat) ecosystems;
Kahle et al. (2001), Heaton et al. (2004), Thomason et al. (2004),
Liebig et al. (2008) and Schmer et al. (2011) were referenced for
biofuel crop (Miscanthus and switchgrass) ecosystems.
*Units for annual gross primary production (GPP), net primary
production (NPP), and saturation response of NPP to nitrogen
fertilization (NPPSAT) are g C m�2 yr�1. Units for vegetation
carbon (CV) and soil carbon (CS) are g C m�2. Units for vegeta-
tion nitrogen (NV), soil N (NS), and available inorganic N
(NAV) are g N m�2.
© 2011 Blackwell Publishing Ltd, GCB Bioenergy, 4, 277–288
LAND USE CHANGE AND BIOENERGY IN THE UNITED STATES 279
parameter. Details of calibration protocols can be found in pre-
vious studies (e.g. McGuire et al., 1992; Zhuang et al., 2003; Lu
et al., 2009).
Some calculations and derivations were made from observa-
tional data in this study. Following Hicke et al. (2004) and
Monfreda et al. (2008), food crop NPP was derived from the
corresponding crop economic yield according to Eqn (1):
NPPi ¼ EYi �Di � C� ðRSi þ 1ÞHIi
; ð1Þ
where, i is the specific food crop, either corn, soybeans, and
wheat, EY is the economic yield, and NPP is the net primary
production. HI refers to harvest index, which measures the pro-
portion of total aboveground biologic yield allocated to the eco-
nomic yield of the crop. D is the dry proportion of the EY, and C
is the carbon content in the dry matter (usually C = 0.45). RS is
the root to shoot ratio, which indicates the ratio of below to
aboveground biomass. Even though this conversion is widely
used, it still has some limitations in the way values are chosen
for the parameters for each crop (Hicke et al., 2004). For the
instances where soil carbon in the top soil layer (0–100 cm) is
not available, it is calculated from the soil carbon density at dif-
ferent depths according to the vertical distribution (cm) (Job-
bagy & Jackson, 2000; Wang et al., 2004; Qin & Huang, 2010):
SOC0�20 : SOC20�40 : SOC40�60 ¼ 41 : 64 : 100; ð2Þ
where SOC is the soil organic carbon. The subscripts indicate
soil organic carbon at different depths.
Regional simulations
With spatially referenced information on climate, elevation,
soil, and vegetation, the calibrated TEM was extrapolated to
estimate C balance in the conterminous US carbon fluxes, and
pool sizes were estimated separately for different LULC scenar-
ios. By assuming that LULC changes from the food crops corn,
soybeans, and wheat to the biofuel crops, switchgrass, and Mi-
scanthus, in total, six land use change scenarios and nine simu-
lations are included in the simulations. The land use change
scenarios are namely corn to switchgrass, corn to Miscanthus,
soybeans to switchgrass, soybeans to Miscanthus, wheat to
switchgrass, and wheat to Miscanthus. The nine simulations
include six for land use change scenarios plus three more for
separate crops.
For regional estimation, we first ran TEM to estimate C
dynamics at a grid cell level at a monthly time step from
1990 to 1999 (see protocols in McGuire et al., 1992; Lu et al.,
2009). We then calculated the annual C fluxes and pool sizes
for the whole United States. Each grid cell in TEM was
assigned a certain crop ecosystem type according to the vege-
tation data, and calculated separately for each crop ecosys-
tems (corn, soybeans, wheat, switchgrass, and Miscanthus).
The regional statistics were based on the crop harvest area
such that crop rotations can be considered in the estimation.
C fluxes and pool sizes were estimated separately to quanti-
tate C balance for land use change. The estimations were
averaged over the 10 years of the 1990s, to alleviate the
annual variations, and to be in accordance with the crop dis-
tribution information.
Spatial climate, elevation, soil, and vegetation data used in
TEM were organized at a 15′ latitude 9 15′ longitude (about
25 9 25 km) resolution for the conterminous United States.
Specifically, the driving climate datasets, including the monthly
air temperature, precipitation, and cloudiness, averaged from
1900 to 1999 based on CRU (Mitchell & Jones, 2005). For eleva-
tion, data were derived from the Shuttle Radar Topography
Mission (Farr et al., 2007) and resampled to the given resolution
(Lu et al., 2009). The soil texture data were based on the Food
and Agriculture Organization/Civil Service Reform Committee
(FAO/CSRC) digitization of the FAO/UNESCO soil map of the
World (1971). For each food crop, specific vegetation data
describing crop distribution is used for the TEM simulation,
according to the TEM vegetation classification scheme (Melillo
et al., 1993). The vegetation data for the conterminous United
States were excerpted from a global crop harvest area database
(Monfreda et al., 2008). The database contains crop distribution
information of year 2000 for 175 distinct crops from around the
world, with a 5′ 9 5′ spatial resolution in latitude by longitude
(Monfreda et al., 2008). Grid cells with no less than 1% crop
cover by area are regarded as cropland for each crop of corn,
soybeans, or wheat. The cropland data were then resampled to
a specific resolution (15′ latitude 9 15′ longitude) in TEM. The
harvest area determined for use in this study for corn, soy-
beans, and wheat in the conterminous United States are 30.9,
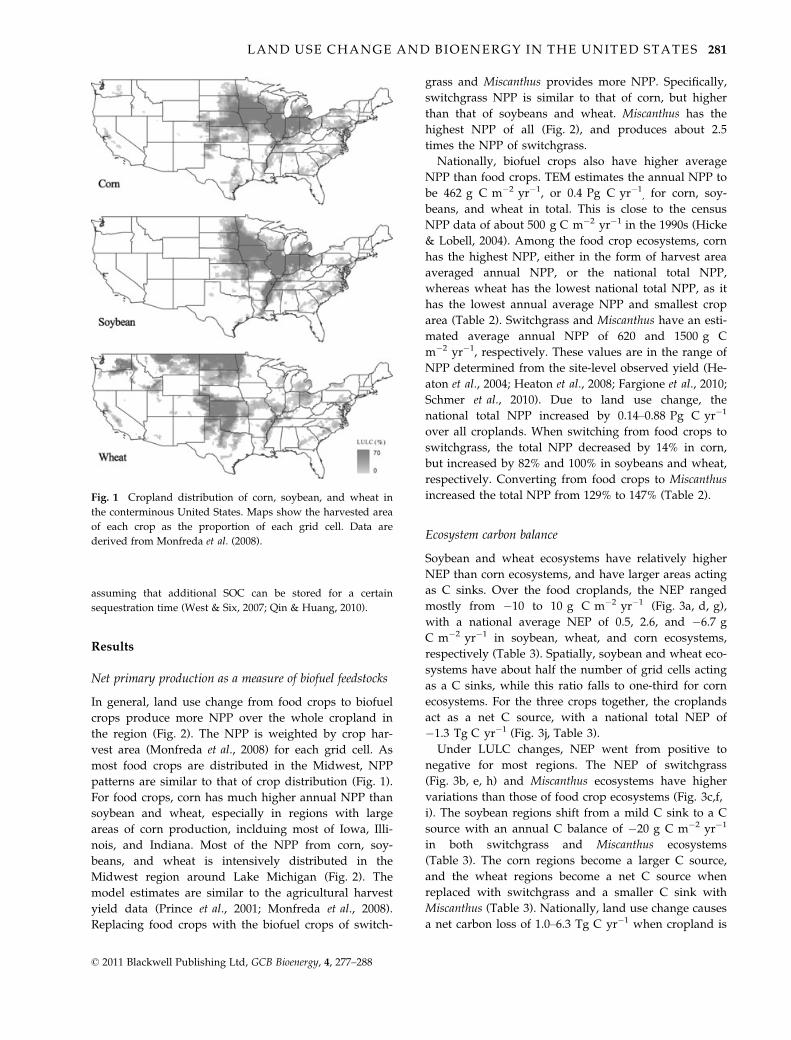
31.2, and 23.8 M ha, respectively, (Fig. 1).
Evaluation of national energy, food and carbonsequestration
Land use change due to crop switching from food crops to bio-
fuel crops will directly affect bioenergy production, food crop
yield, and CO2 emissions. To reach the goal of productive
energy and food security, we expect to have high bioenergy
production and little agricultural yield loss. We also expect less
GHG emissions for environmental concern. To evaluate the bal-
ance among the trilemma of energy, food, and carbon, several
variables were selected at a national scale. Biomass quantity,
specifically NPP in this study, is an indicator of food or biofuel
production. The food crop yield and ethanol production can be
converted from crop NPP as determined using TEM. CO2 emis-
sions are expressed as NEP, and as soil carbon sequestration
rate (SOCR) for additional carbon added into the soil as a result
of land use change. A positive NEP represents annual net car-
bon sequestration by crop ecosystems, whereas a negative
value represents that crop ecosystems are losing carbon.
Food crop yield is derived from NPP by reversing Eqn (1):
EYi ¼ NPPi �HIiDi � C� ðRSi þ 1Þ ; ð3Þ
where, i is the specific food crop of corn, soybeans, or wheat,
EY is the economic yield, and NPP is the net primary produc-
tion. Other variables are the same as in Eqn (1). The soil
organic carbon sequestration rate is used to depict the amount
of soil carbon accumulated in soil annually, calculated by
© 2011 Blackwell Publishing Ltd, GCB Bioenergy, 4, 277–288
280 Z. QIN et al.
assuming that additional SOC can be stored for a certain
sequestration time (West & Six, 2007; Qin & Huang, 2010).
Results
Net primary production as a measure of biofuel feedstocks
In general, land use change from food crops to biofuel
crops produce more NPP over the whole cropland in
the region (Fig. 2). The NPP is weighted by crop har-
vest area (Monfreda et al., 2008) for each grid cell. As
most food crops are distributed in the Midwest, NPP
patterns are similar to that of crop distribution (Fig. 1).
For food crops, corn has much higher annual NPP than
soybean and wheat, especially in regions with large
areas of corn production, inclduing most of Iowa, Illi-
nois, and Indiana. Most of the NPP from corn, soy-
beans, and wheat is intensively distributed in the
Midwest region around Lake Michigan (Fig. 2). The
model estimates are similar to the agricultural harvest
yield data (Prince et al., 2001; Monfreda et al., 2008).
Replacing food crops with the biofuel crops of switch-
grass and Miscanthus provides more NPP. Specifically,
switchgrass NPP is similar to that of corn, but higher
than that of soybeans and wheat. Miscanthus has the
highest NPP of all (Fig. 2), and produces about 2.5
times the NPP of switchgrass.
Nationally, biofuel crops also have higher average
NPP than food crops. TEM estimates the annual NPP to
be 462 g C m�2 yr�1, or 0.4 Pg C yr�1, for corn, soy-
beans, and wheat in total. This is close to the census
NPP data of about 500 g C m�2 yr�1 in the 1990s (Hicke
& Lobell, 2004). Among the food crop ecosystems, corn
has the highest NPP, either in the form of harvest area
averaged annual NPP, or the national total NPP,
whereas wheat has the lowest national total NPP, as it
has the lowest annual average NPP and smallest crop
area (Table 2). Switchgrass and Miscanthus have an esti-
mated average annual NPP of 620 and 1500 g C
m�2 yr�1, respectively. These values are in the range of
NPP determined from the site-level observed yield (He-
aton et al., 2004; Heaton et al., 2008; Fargione et al., 2010;
Schmer et al., 2010). Due to land use change, the
national total NPP increased by 0.14–0.88 Pg C yr�1
over all croplands. When switching from food crops to
switchgrass, the total NPP decreased by 14% in corn,
but increased by 82% and 100% in soybeans and wheat,
respectively. Converting from food crops to Miscanthus
increased the total NPP from 129% to 147% (Table 2).
Ecosystem carbon balance
Soybean and wheat ecosystems have relatively higher
NEP than corn ecosystems, and have larger areas acting
as C sinks. Over the food croplands, the NEP ranged
mostly from �10 to 10 g C m�2 yr�1 (Fig. 3a, d, g),
with a national average NEP of 0.5, 2.6, and �6.7 g
C m�2 yr�1 in soybean, wheat, and corn ecosystems,
respectively (Table 3). Spatially, soybean and wheat eco-
systems have about half the number of grid cells acting
as a C sinks, while this ratio falls to one-third for corn
ecosystems. For the three crops together, the croplands
act as a net C source, with a national total NEP of
�1.3 Tg C yr�1 (Fig. 3j, Table 3).
Under LULC changes, NEP went from positive to
negative for most regions. The NEP of switchgrass
(Fig. 3b, e, h) and Miscanthus ecosystems have higher
variations than those of food crop ecosystems (Fig. 3c,f,
i). The soybean regions shift from a mild C sink to a C
source with an annual C balance of �20 g C m�2 yr�1
in both switchgrass and Miscanthus ecosystems
(Table 3). The corn regions become a larger C source,
and the wheat regions become a net C source when
replaced with switchgrass and a smaller C sink with
Miscanthus (Table 3). Nationally, land use change causes
a net carbon loss of 1.0–6.3 Tg C yr�1 when cropland is
Fig. 1 Cropland distribution of corn, soybean, and wheat in
the conterminous United States. Maps show the harvested area
of each crop as the proportion of each grid cell. Data are
derived from Monfreda et al. (2008).
© 2011 Blackwell Publishing Ltd, GCB Bioenergy, 4, 277–288
LAND USE CHANGE AND BIOENERGY IN THE UNITED STATES 281
changed to switchgrass, and of 0.4–6.7 Tg C yr�1 if it is
changed to Miscanthus. The greatest carbon loss results
when soybeans are replaced with biofuel crops
(Table 3). High heterotrophic respiration in biofuel crop
ecosystems is the main contributor to the carbon loss
experienced under these land use change scenarios.
Corn ecosystems have much higher RH than soybean
and wheat ecosystems. Switchgrass has a similar
amount of national average RH as corn under all three
land use change scenarios. Miscanthus has the highest
RH among all crops (Table 3). The higher heterotrophic
respiration of biofuel crop ecosystems results in rela-
tively lower NEP than that for food crop ecosystems.
RH is higher than corresponding NPP in both switch-
grass and Miscanthus ecosystems, leading to these eco-
systems to become greater carbon sources (Table 3).
Previous studies also observed that biofuel crop ecosys-
tems have relatively higher soil respiration than food
crop ecosystems (Tufekcioglu et al., 1999; Raich & Tu-
fekcioglu, 2000), and that a greater RH than NPP value
results in a net C source for the biofuel crop ecosystems
(Yazaki et al., 2004).
Fig. 2 Mean annual net primary production under different land use change scenarios, as determined using Terrestrial Ecosystem
Model. Vegetation change from food crops (first column) to biofuel crops (Miscanthus and switchgrass); food crops (from top to bot-
tom) are (a) corn, (d) soybean, (g) wheat, and (j) above three crops together.
Table 2 Mean annual net primary production before and after vegetation changed from food crops to biofuel crops over the conter-
minous United States
Original crops
National average (g C m�2 yr�1) National total (Tg C yr�1)
Unchanged Switchgrass Miscanthus Unchanged Switchgrass Miscanthus
Corn 713.0 622.2 1513.4 220.3 192.3 467.6
Soybean 355.7 648.2 1567.5 110.9 202.1 488.6
Wheat 276.2 594.5 1354.9 65.7 141.4 322.3
All 462.3 624.0 1489.1 396.9 535.8 1278.6
© 2011 Blackwell Publishing Ltd, GCB Bioenergy, 4, 277–288
282 Z. QIN et al.
Carbon pools in vegetation and soils
Biofuel crops have much greater carbon storage in vege-
tation than food crops. Crops are harvested every year,
and the vegetation C pool size is almost the same as the
annual NPP in agroecosystems (Lu & Zhuang, 2010). For
biofuel crops, the C stored in vegetation is generally
much higher than that of food crops. Specifically, switch-
grass has 0.9, 1.8, and 2.1 times national average vegeta-
tion C when compared with corn, soybeans, and wheat,
respectively. Miscanthus has even larger vegetation C
pools, which are about twice that of corn, and about five
times that of soybeans or wheat (Fig. 4a).
The soil organic carbon content within 1 m soil
depth is 60 Mg C ha�1 in food crop ecosystems, with-
out significant differences among corn, soybeans, and
wheat, whereas the biofuel crop ecosystems of switch-
grass and Miscanthus accumulate above 100 Mg C ha�1
in soils (Fig. 4b), which is almost double that of food
crop ecosystems, and close to that of natural forest eco-
systems (Heath et al., 2002). As a result of land use
change from food crops to biofuel crops, the national
total soil organic carbon increases by 1.0–1.6 Pg C in
the conterminous United States, if food crops are all
replaced by biofuel crops. The soil carbon of biofuel
ecosystems is 13–18% of the total soil carbon storage in
(a)
(d)
(g)
(j)
(b) (c)
(e)
(h)
(k) (l)
(i)
(f)
Fig. 3 Mean annual net ecosystem production under different land use change scenarios, as determined using Terrestrial Ecosystem
Model. Vegetation distribution is same as in Fig. 1.
Table 3 Carbon fluxes before and after vegetation changed from food crops to biofuel crops over the conterminous United States
Original crops
National average (g C m�2 yr�1) National total (Tg C yr�1)
Unchanged Switchgrass Miscanthus Unchanged Switchgrass Miscanthus
Net ecosystem production
Corn �6.7 �15.3 �13.2 �2.1 �4.7 �4.1
Soybean 0.5 �19.6 �20.9 0.2 �6.1 �6.5
Wheat 2.6 �1.8 1.0 0.6 �0.4 0.2
Heterotrophic respiration (RH)
Corn 719.7 637.4 1526.5 222.4 197.0 471.7
Soybean 355.2 667.9 1588.4 110.7 208.2 495.1
Wheat 273.7 596.3 1353.9 65.1 141.9 322.1
© 2011 Blackwell Publishing Ltd, GCB Bioenergy, 4, 277–288
LAND USE CHANGE AND BIOENERGY IN THE UNITED STATES 283
forests of the conterminous United States (Turner et al.,
1995).
Discussion
Advantages of growing biofuel crops
Biofuel crops, especially Miscanthus, have much higher
potential biomass production than food crops, and
could provide a larger amount of feedstock for energy
use. One factor that contributes to the high productivity
of biofuel crops is high solar radiation interception and
conversion efficiencies. According to the field experi-
ments in Illinois, canopies of mature switchgrass and
Miscanthus could intercept about 70% of the photosyn-
thetically active radiation (PAR), and with PAR conver-
sion efficiencies of about 1% and 3%, respectively
(Heaton et al., 2008). Also, owing to their low-nutrient
requirements and high water use efficiencies (Stewart
et al., 2009; Fargione et al., 2010), switchgrass and Mi-
scanthus are capable of growing on sterile soils where
food crops cannot survive. There are numerous reports
suggesting that switchgrass and Miscanthus have no
response to N fertilization, or only to the first 50–
70 kg ha�1 (Lewandowski et al., 2003), whereas corn
responds to double or even triple the N demand
(Fargione et al., 2010). Water used for irrigating crops or
processing biomass is far less for switchgrass and Mi-
scanthus than for food crops (Fargione et al., 2010). Bio-
fuel crops are also advantageous because they can use
abandoned or degraded agricultural lands to produce
bioenergy, leaving more croplands available for food
crops (Fargione et al., 2010; Cai et al., 2011).
Implications to biofuel feedstocks and agricultural yield
Under different land use change scenarios, biofuel crops
produce relatively higher biomass than food crops
(Fig. 5). In particular, Miscanthus provides significantly
higher NPP than switchgrass, and even higher NPP
than food crops like soybean and wheat. However,
there is a net loss of food crop yield, because biofuel
crops provide nothing but biomass feedstocks (Fig. 5).
As determined by TEM, corn loses the highest amount
of yield of 820 g m�2, whereas wheat loses the lowest
yield of 220 g m�2 (Table 4). The estimated yield loss is
comparable with the FAO statistical data (Table 4).
Among the six land use change scenarios, food crops
changed to Miscanthus have a much greater net biomass
gain than land changed to switchgrass. Specifically, crop
switching from soybeans to Miscanthus gains the highest
biomass of 1200 g C m�2, whereas corn switching to
switchgrass gains the lowest at �90 g C m�2. Corn to
switchgrass is the only scenario that causes a net bio-
mass loss.
In terms of biomass production, wheat and soybeans
rather than corn should be preferred for biofuel crop
displacement. For the same amount of switchgrass or
0
400
800
1200
1600
2000
Corn Soybean Wheat
Veg
etat
ion
carb
on (g
C m
–2)
Unchanged
Switchgrass
Miscanthus
0
2000
4000
6000
8000
10 000
12 000
Corn Soybean Wheat
Soil
orga
nic
carb
on (g
C m
–2)
Unchanged
Switchgrass
Miscanthus
(a)
(b)
Fig. 4 Carbon pools in vegetation and soils for food crop and
biofuel crop ecosystems. Unchanged are food crops without
land use change. Values are harvested area weighted national
average C pool sizes in vegetation (a) and soil (b).
–2000 –1000 1000 20000
(b)
(c)
(d)
(e)
(f)
(a)
NPPBNPPFYLD
Fig. 5 Annual balance among biomass production and food
yield under land use change scenarios, as determined using
Terrestrial Ecosystem Model. NPPB, NPP of biofuel crops (g
C m�2 yr�1); NPPF, negative value of NPP of food crops (g
C m�2 yr�1); YLD, negative value of food crop yield
(g m�2 yr�1). Land-use change scenarios are from (a) corn to
switchgrass, (b) soybean to switchgrass, (c) wheat to switch-
grass, (d) corn to Miscanthus, (e) soybean to Miscanthus, and (f)
wheat to Miscanthus.
© 2011 Blackwell Publishing Ltd, GCB Bioenergy, 4, 277–288
284 Z. QIN et al.
Miscanthus biomass, there will be less food yield loss in
wheat and soybean than in corn (Fig. 5). The land use
change scenario of corn to switchgrass should be con-
sidered last for crop switching for biofuel feedstocks.
Implications to bioenergy and land use
Higher biomass production does not necessarily mean
higher energy production, as food crops have relatively
higher energy conversion efficiencies (Fargione et al.,
2010). Using aboveground-to-belowground biomass
ratios of 1.4 and 2.5 for switchgrass and Miscanthus,
respectively (Meyer et al., 2010), and assuming that 90%
aboveground biomass is harvested, or simply using 1.17
and 1.43 times NPP (in the form of carbon) as harvestable
biomass (in the form of biomass) for switchgrass and
Miscanthus, respectively, we estimated the biofuel crops’
harvestable biomass (Table 5). A unique value of 0.87 is
used as the dry proportion of the yield for both corn and
biofuel crops (Hicke & Lobell, 2004). The conversion effi-
ciency of dry mass to ethanol is 416 L Mg�1 (110 Gal
Mg�1) for corn, and 380 L Mg�1 (100 Gal Mg�1) for bio-
mass (DOE, 2006). Soybeans and wheat are not included
for ethanol production comparison, as they both produce
much lower biomass than corn, and offer no superior
energy conversion efficiencies.
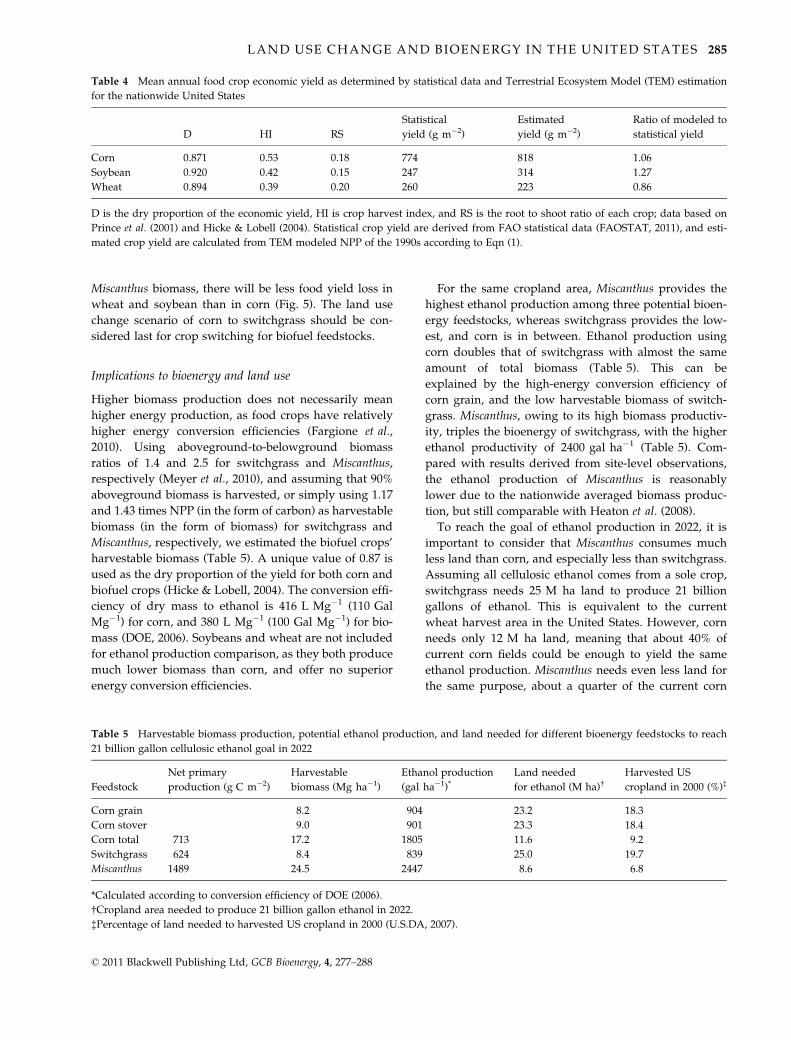
For the same cropland area, Miscanthus provides the
highest ethanol production among three potential bioen-
ergy feedstocks, whereas switchgrass provides the low-
est, and corn is in between. Ethanol production using
corn doubles that of switchgrass with almost the same
amount of total biomass (Table 5). This can be
explained by the high-energy conversion efficiency of
corn grain, and the low harvestable biomass of switch-
grass. Miscanthus, owing to its high biomass productiv-
ity, triples the bioenergy of switchgrass, with the higher
ethanol productivity of 2400 gal ha�1 (Table 5). Com-
pared with results derived from site-level observations,
the ethanol production of Miscanthus is reasonably
lower due to the nationwide averaged biomass produc-
tion, but still comparable with Heaton et al. (2008).
To reach the goal of ethanol production in 2022, it is
important to consider that Miscanthus consumes much
less land than corn, and especially less than switchgrass.
Assuming all cellulosic ethanol comes from a sole crop,
switchgrass needs 25 M ha land to produce 21 billion
gallons of ethanol. This is equivalent to the current
wheat harvest area in the United States. However, corn
needs only 12 M ha land, meaning that about 40% of
current corn fields could be enough to yield the same
ethanol production. Miscanthus needs even less land for
the same purpose, about a quarter of the current corn
Table 5 Harvestable biomass production, potential ethanol production, and land needed for different bioenergy feedstocks to reach
21 billion gallon cellulosic ethanol goal in 2022
Feedstock
Net primary
production (g C m�2)
Harvestable
biomass (Mg ha�1)
Ethanol production
(gal ha�1)*Land needed
for ethanol (M ha)†Harvested US
cropland in 2000 (%)‡
Corn grain 8.2 904 23.2 18.3
Corn stover 9.0 901 23.3 18.4
Corn total 713 17.2 1805 11.6 9.2
Switchgrass 624 8.4 839 25.0 19.7
Miscanthus 1489 24.5 2447 8.6 6.8
*Calculated according to conversion efficiency of DOE (2006).
†Cropland area needed to produce 21 billion gallon ethanol in 2022.
‡Percentage of land needed to harvested US cropland in 2000 (U.S.DA, 2007).
Table 4 Mean annual food crop economic yield as determined by statistical data and Terrestrial Ecosystem Model (TEM) estimation
for the nationwide United States
D HI RS
Statistical
yield (g m�2)
Estimated
yield (g m�2)
Ratio of modeled to
statistical yield
Corn 0.871 0.53 0.18 774 818 1.06
Soybean 0.920 0.42 0.15 247 314 1.27
Wheat 0.894 0.39 0.20 260 223 0.86
D is the dry proportion of the economic yield, HI is crop harvest index, and RS is the root to shoot ratio of each crop; data based on
Prince et al. (2001) and Hicke & Lobell (2004). Statistical crop yield are derived from FAO statistical data (FAOSTAT, 2011), and esti-
mated crop yield are calculated from TEM modeled NPP of the 1990s according to Eqn (1).
© 2011 Blackwell Publishing Ltd, GCB Bioenergy, 4, 277–288
LAND USE CHANGE AND BIOENERGY IN THE UNITED STATES 285
fields, a quarter of the current soybean fields, or one-
third of the current wheat fields (Table 5).
Studies show that bioethanol and biodiesel produc-
tion results in a positive net energy balance when taking
energy use efficiency into consideration (Farrell et al.,
2006; Hill et al., 2006). An energy output: input ratio of
8 : 51 was observed in cellulosic crop-based ethanol
production (Lewandowski & Schmidt, 2006; Scheffran &
BenDor, 2009), whereas only 4 : 14 was observed in cer-
eal crop-based ethanol production (Franzluebbers &
Francis, 1995; Mandal et al., 2002; Rathke et al., 2007).
Cellulosic crops, especially Miscanthus could maximize
energy use efficiency and land use efficiency by replac-
ing food crops.
Implications to carbon sequestration
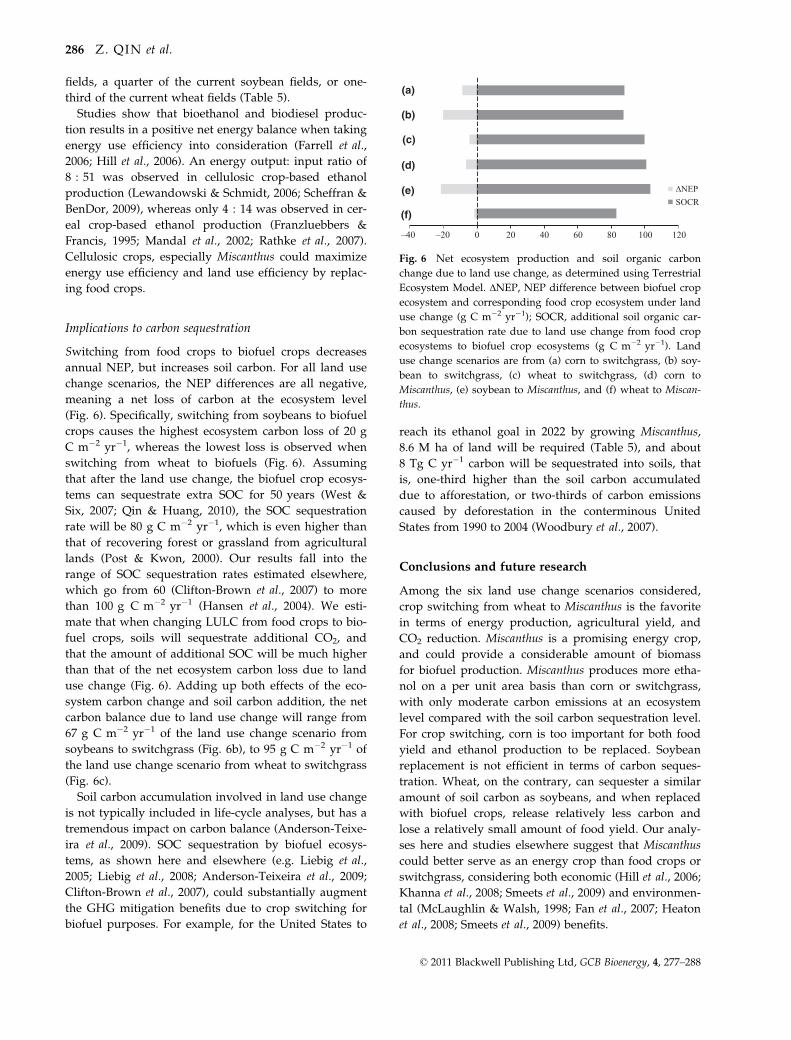
Switching from food crops to biofuel crops decreases
annual NEP, but increases soil carbon. For all land use
change scenarios, the NEP differences are all negative,
meaning a net loss of carbon at the ecosystem level
(Fig. 6). Specifically, switching from soybeans to biofuel
crops causes the highest ecosystem carbon loss of 20 g
C m�2 yr�1, whereas the lowest loss is observed when
switching from wheat to biofuels (Fig. 6). Assuming
that after the land use change, the biofuel crop ecosys-
tems can sequestrate extra SOC for 50 years (West &
Six, 2007; Qin & Huang, 2010), the SOC sequestration
rate will be 80 g C m�2 yr�1, which is even higher than
that of recovering forest or grassland from agricultural
lands (Post & Kwon, 2000). Our results fall into the
range of SOC sequestration rates estimated elsewhere,
which go from 60 (Clifton-Brown et al., 2007) to more
than 100 g C m�2 yr�1 (Hansen et al., 2004). We esti-
mate that when changing LULC from food crops to bio-
fuel crops, soils will sequestrate additional CO2, and
that the amount of additional SOC will be much higher
than that of the net ecosystem carbon loss due to land
use change (Fig. 6). Adding up both effects of the eco-
system carbon change and soil carbon addition, the net
carbon balance due to land use change will range from
67 g C m�2 yr�1 of the land use change scenario from
soybeans to switchgrass (Fig. 6b), to 95 g C m�2 yr�1 of
the land use change scenario from wheat to switchgrass
(Fig. 6c).
Soil carbon accumulation involved in land use change
is not typically included in life-cycle analyses, but has a
tremendous impact on carbon balance (Anderson-Teixe-
ira et al., 2009). SOC sequestration by biofuel ecosys-
tems, as shown here and elsewhere (e.g. Liebig et al.,
2005; Liebig et al., 2008; Anderson-Teixeira et al., 2009;
Clifton-Brown et al., 2007), could substantially augment
the GHG mitigation benefits due to crop switching for
biofuel purposes. For example, for the United States to
reach its ethanol goal in 2022 by growing Miscanthus,
8.6 M ha of land will be required (Table 5), and about
8 Tg C yr�1 carbon will be sequestrated into soils, that
is, one-third higher than the soil carbon accumulated
due to afforestation, or two-thirds of carbon emissions
caused by deforestation in the conterminous United
States from 1990 to 2004 (Woodbury et al., 2007).
Conclusions and future research
Among the six land use change scenarios considered,
crop switching from wheat to Miscanthus is the favorite
in terms of energy production, agricultural yield, and
CO2 reduction. Miscanthus is a promising energy crop,
and could provide a considerable amount of biomass
for biofuel production. Miscanthus produces more etha-
nol on a per unit area basis than corn or switchgrass,
with only moderate carbon emissions at an ecosystem
level compared with the soil carbon sequestration level.
For crop switching, corn is too important for both food
yield and ethanol production to be replaced. Soybean
replacement is not efficient in terms of carbon seques-
tration. Wheat, on the contrary, can sequester a similar
amount of soil carbon as soybeans, and when replaced
with biofuel crops, release relatively less carbon and
lose a relatively small amount of food yield. Our analy-
ses here and studies elsewhere suggest that Miscanthus
could better serve as an energy crop than food crops or
switchgrass, considering both economic (Hill et al., 2006;
Khanna et al., 2008; Smeets et al., 2009) and environmen-
tal (McLaughlin & Walsh, 1998; Fan et al., 2007; Heaton
et al., 2008; Smeets et al., 2009) benefits.
–40 –20 0 20 40 60 80 100 120
(c)
(d)
(e)
(f)
(b)
(a)
∆NEPSOCR
Fig. 6 Net ecosystem production and soil organic carbon
change due to land use change, as determined using Terrestrial
Ecosystem Model. ΔNEP, NEP difference between biofuel crop
ecosystem and corresponding food crop ecosystem under land
use change (g C m�2 yr�1); SOCR, additional soil organic car-
bon sequestration rate due to land use change from food crop
ecosystems to biofuel crop ecosystems (g C m�2 yr�1). Land
use change scenarios are from (a) corn to switchgrass, (b) soy-
bean to switchgrass, (c) wheat to switchgrass, (d) corn to
Miscanthus, (e) soybean to Miscanthus, and (f) wheat to Miscan-
thus.
© 2011 Blackwell Publishing Ltd, GCB Bioenergy, 4, 277–288
286 Z. QIN et al.
Other factors should also be considered for further
evaluation of bioenergy production, LULC conversion,
and GHG mitigation. For example, first, conversion
efficiency varies among different feedstocks. At pres-
ent, conversion technology for conventional biofuel is
relatively well established. In contrast, biomass conver-
sion to second-generation biofuel is still new and the
conversion efficiency is relatively low, but a potentially
higher efficiency is expectable (Fargione et al., 2010).
Second, food preference will decide the human diet
and therefore food crop types, which will influence
the land-use decision. Third, nitrogen oxides produced
from agroecosystems due to the use of nitrogen fertil-
izers will also contribute to GHG emissions (Melillo
et al., 2009). Furthermore, crop harvest should be
included to estimate carbon balance in life-cycle-assess-
ment (Davis et al., 2009; Fargione et al., 2010). Thus, a
more comprehensive analysis is needed to evaluate the
economic and environmental effects of land-use
change to meet the bioenergy demand in the United
States.
Acknowledgement
This study is supported through projects funded by the NASALand Use and Land Cover Change program (NASA-NNX09-AI26G), Department of Energy (DE-FG02-08ER64599), the NSFDivision of Information & Intelligent Systems (NSF-1028291),and the NSF Carbon and Water in the Earth Program (NSF-0630319). We thank Rosen Center for Advanced Computing(RCAC) at Purdue University for computing support, Dr NavinRamankutty for developing the crop distribution data, andJayne Piepenburg for proofreading and editing.
References
Anderson-Teixeira KJ, Davis SC, Masters MD, Delucia EH (2009) Changes in soil
organic carbon under biofuel crops. Global Change Biology Bioenergy, 1, 75–96.
Beringer T, Lucht W, Schaphoff S (2011) Bioenergy production potential of global
biomass plantations under environmental and agricultural constraints. Global
Change Biology Bioenergy, 3, 299–312.
Cai X, Zhang X, Wang D (2011) Land availability for biofuel production. Environmen-
tal Science and Technology, 45, 334–339.
Campbell JE, Lobell DB, Genova RC, Field CB (2008) The global potential of bioener-
gy on abandoned agriculture lands. Environmental Science and Technology, 42, 5791
–5794.
Carriquiry MA, Du X, Timilsina GR (2011) Second generation biofuels: economics
and policies. Energy Policy, 39, 4222–4234.
Clifton-Brown JC, Breuer J, Jones MB (2007) Carbon mitigation by the energy crop,
Miscanthus. Global Change Biology, 13, 2296–2307.
Davis SC, Anderson-Teixeira KJ, Delucia EH (2009) Life-cycle analysis and the ecol-
ogy of biofuels. Trends in Plant Science, 14, 140–146.
DOE (2006) Breaking the biological barriers to cellulosic ethanol: a joint research agenda.
Report from the December 2005 Workshop, DOE/SC-0095. U.S. Department of
Energy Office of Science. Available at: http://www.genomicscience.energy.gov/
biofuels/ (accessed May 2011).
Evans G (2007) International Biofuels Strategy Project: Liquid Transport Biofuels - Technol-
ogy Status Report. The National Non-Food Crops Centre. Available at: http://www.
nnfcc.co.uk/tools/international-biofuels-strategy-project-liquid-transport-biofuels
technology-status-report-nnfcc-08-017 (accessedMay 2011).
Fargione JE, Plevin RJ, Hill JD (2010) The ecological impact of biofuels. Annual
Review of Ecology, Evolution, and Systematics, 41, 351–377.
Fan S, Freedman B, Gao J (2007) Potential environmental benefits from increased use
of bioenergy in China. Environmental Management, 40, 504–515.
FAOSTAT (2011) FAOSTAT. Available at: http://www.faostat.fao.org/ (accessed
May 2011).
Fargione J, Hill J, Tilman D, Polasky S, Hawthorne P (2008) Land clearing and the
biofuel carbon debt. Science, 319, 1235–1238.
Farr TG, Rosen PA, Caro E et al. (2007) The shuttle radar topography mission.
Review of Geophysics, 45, RG2004.
Farrell AE, Plevin RJ, Turner BT, Jones AD, O’hare M, Kammen DM (2006) Ethanol
can contribute to energy and environmental goals. Science, 311, 506–508.
Franzluebbers AJ, Francis CA (1995) Energy output: input ratio of maize and sor-
ghum management systems in eastern Nebraska. Agriculture Ecosystems and Envi-
ronment, 53, 271–278.
Hansen EM, Christensen BT, Jensen LS, Kristensen K (2004) Carbon sequestration in
soil beneath long-term Miscanthus plantations as determined by 13C abundance.
Biomass and Bioenergy, 26, 97–105.
Heath LS, Birdsey RA, Williams DW (2002) Methodology for estimating soil carbon
for the forest carbon budget model of the United States, 2001. Environmental Pollu-
tion, 116, 373–380.
Heaton E, Voigt T, Long SP (2004) A quantitative review comparing the yields of
two candidate C4 perennial biomass crops in relation to nitrogen, temperature
and water. Biomass and Bioenergy, 27, 21–30.
Heaton EA, Dohleman FG, Long SP (2008) Meeting U.S. biofuel goals with less land:
the potential of Miscanthus. Global Change Biology, 14, 1–15.
Hicke JA, Lobell DB (2004) Spatiotemporal patterns of cropland area and net pri-
mary production in the central United States estimated from U.S.DA agricultural
information. Geophysical Research Letters, 31, L20502.
Hicke JA, Lobell DB, Asner GP (2004) Cropland area and net primary production
computed from 30 years of U.S.DA agricultural harvest data. Earth Interactions, 8,
1–20.
Hill J, Nelson E, Tilman D, Polasky S, Tiffany D (2006) Environmental, economic,
and energetic costs and benefits of biodiesel and ethanol biofuels. Proceedings of
the National Academy of Sciences of the United States of America, 103, 11206–11210.
Hoekman SK (2009) Biofuels in the U.S. – challenges and opportunities. Renewable
Energy, 34, 14–22.
Hurt C, Tyner W, Doering O (2006) Economics of Ethanol. Purdue Extension. Avail-
able at: http://www.extension.purdue.edu/extmedia/ID/ID-339.pdf (accessed
May 2011).
IEA bioenergy (2008) From 1st- to 2nd-Generation Biofuel Technologies: an Overview of
Current Industry and RD&D Activities (A Joint Task 39 and IEAHQ Report). IEA bio-
energy. Available at: http://www.ieabioenergy.com/MediaItem.aspx?id=6060
(accessed May 2011).
Jobbagy EG, Jackson RB (2000) The vertical distribution of soil organic carbon and
its relation to climate and vegetation. Ecological Applications, 10, 423–436.
Kahle P, Beuch S, Boelcke B, Leinweber P, Schulten H (2001) Cropping of Miscanthus
in Central Europe: biomass production and influence on nutrients and soil
organic matter. European Journal of Agronomy, 15, 171–184.
Khanna M, Dhungana B, Clifton-Brown J (2008) Costs of producing miscanthus and
switchgrass for bioenergy in Illinois. Biomass and Bioenergy, 32, 482–493.
Kim H, Kim S, Dale B (2009) Biofuels, land use change, and Greenhouse gas emis-
sions: some unexplored variables. Environmental Science and Technology, 43, 961–
967.
Lapola DM, Schaldach R, Alcamo J et al. (2010) Indirect land-use changes can over-
come carbon savings from biofuels in Brazil. Proceedings of the National Academy of
Sciences of the United States of America, 107, 3388–3393.
Lewandowski I, Schmidt U (2006) Nitrogen, energy and land use efficiencies of
miscanthus, reed canary grass and triticale as determined by the boundary line
approach. Agriculture, Ecosystems and Environment, 112, 335–346.
Lewandowski I, Scurlock JMO, Lindvall E, Christou M (2003) The development and
current status of perennial rhizomatous grasses as energy crops in the US and
Europe. Biomass and Bioenergy, 25, 335–361.
Liebig M, Johnson H, Hanson J, Frank A (2005) Soil carbon under switchgrass stands
and cultivated cropland. Biomass and Bioenergy, 28, 347–354.
Liebig M, Schmer M, Vogel K, Mitchell R (2008) Soil carbon storage by switchgrass
grown for bioenergy. BioEnergy Research, 1, 215–222.
Lu X, Zhuang Q (2010) Evaluating climate impacts on carbon balance of the terres-
trial ecosystems in the Midwest of the United States with a process-based ecosys-
tem model. Mitigation and Adaptation Strategies for Global Change, 15, 467–487.
Lu Y, Zhuang Q, Zhou G, Sirin A, Melillo J, Kicklighter D (2009) Possible decline of
the carbon sink in the Mongolian Plateau during the 21st century. Environmental
Research Letters, 4, 045023.
© 2011 Blackwell Publishing Ltd, GCB Bioenergy, 4, 277–288
LAND USE CHANGE AND BIOENERGY IN THE UNITED STATES 287
Lubowski RN, Vesterby M, Bucholtz S, Baez A, Roberts MJ (2006) Major uses of land
in the United States, 2002. Economic Information Bulletin, No. (EIB-14). Available
at: http://www.ers.usda.gov/Publications/EIB14/ (accessed May 2011).
Mandal KG, Saha KP, Ghosh PK, Hati KM, Bandyopadhyay KK (2002) Bioenergy
and economic analysis of soybean-based crop production systems in central
India. Biomass and Bioenergy, 23, 337–345.
McGuire AD, Melillo JM, Joyce LA, Kicklighter DW, Grace AL, Moore B III, Voro-
smarty CJ (1992) Interactions between carbon and nitrogen dynamics in estimat-
ing net primary productivity for potential vegetation in North America. Global
Biogeochemical Cycles, 6, 101–124.
McGuire AD, Sitch S, Clein JS et al. (2001) Carbon balance of the terrestrial bio-
sphere in the twentieth century: analyses of CO2, climate and land use effects
with four process-based ecosystem models. Global Biogeochemical Cycles, 15,
183–206.
McLaughlin SB, Kszos LA (2005) Development of switchgrass (Panicum virga-
tum) as a bioenergy feedstockin the United States. Biomass and Bioenergy, 28,
515–535.
McLaughlin SB, Walsh ME (1998) Evaluating environmental consequences of pro-
ducing herbaceous crops for bioenergy. Biomass and Bioenergy, 4, 317–324.
Melillo JM, McGuire AD, Kicklighter DW, Moore B, Vorosmarty CJ, Schloss AL
(1993) Global climate change and terrestrial net primary production. Nature, 363,
234–240.
Melillo JM, Reilly JM, Kicklighter DW et al. (2009) Indirect emissions from biofuels:
how important? Science, 326, 1397–1399.
Meyer MH, Paul J, Anderson NO (2010) Competive ability of invasive Miscanthus
biotypes with aggressive switchgrass. Biological Invasions, 12, 3809–3816.
Mitchell TD, Jones PD (2005) An improved method of constructing a database of
monthly climate observations and associated high-resolution grids. International
Journal of Climatology, 25, 693–712.
Monfreda C, Ramankutty N, Foley JA (2008) Farming the planet: 2. Geographic dis-
tribution of crop areas, yields, physiological types, and net primary production in
the year 2000. Global Biogeochemical Cycles, 22, GB1022.
Parrish DJ, Fike JH (2005) The biology and agronomy of switchgrass for biofuels.
Critical Reviews in Plant Sciences, 24, 423–459.
Pimentel D, Marklein A, Toth MA et al. (2010) Environmental and economic costs of
biofuels. Human Ecology, 4, 349–369.
Post WM, Kwon KC (2000) Soil carbon sequestration and land-use change: processes
and potential. Global Change Biology, 6, 317–327.
Prince SD, Haskett J, Steininger M, Strand H, Wright R (2001) Net primary produc-
tion of U.S. midwest croplands from agricultural harvest yield data. Ecological
Applications, 11, 1194–1205.
Qin Z, Huang Y (2010) Quantification of soil organic carbon sequestration potential
in cropland: a model approach. Science China Life Sciences, 53, 868–884.
Ragauskas AJ, Williams CK, Davison BH et al. (2006) The path forward for biofuels
and biomaterials. Science, 311, 484–489.
Raich JW, Tufekcioglu A (2000) Vegetation and soil respiration: correlations and con-
trols. Biogeochemistry, 48, 71–90.
Raich JW, Rastetter EB, Melillo JM et al. (1991) Potential net primary productivity in
South America: application of a global model. Ecological Applications, 1, 399–429.
Rathke GW, Wienhold BJ, Wilhelm WW, Diepenbrock W (2007) Tillage and rotation
effect on corn-soybean energy balances in eastern Nebraska. Soil & Tillage
Research, 97, 60–70.
Renewable Fuels Association (2011) Historic U.S. Fuel Ethanol Production. Renewable
Fuels Association. Available at: http://www.ethanolrfa.org/pages/statistics#E
(accessed May 2011).
Scheffran J, BenDor T (2009) Bioenergy and land use: a spatial-agent dynamic model
of energy crop production in Illinois. International Journal of Environment and Pol-
lution, 39, 4–27.
Schmer MR, Mitchell RB, Vogel KP, Schacht WH, Marx DB (2010) Spatial and tem-
poral effects on switchgrass stands and yield in the Great Plains. BioEnergy
Research, 3, 159–171.
Schmer MR, Liebig MA, Vogel KP, Mitchell RB (2011) Field-scale soil property
changes under switchgrass managed for bioenergy. Global Change Biology Bioener-
gy, doi: 10.1111/j.1757-1707.2011.01099.x.
Searchinger TD, Heimlich R, Dong F et al. (2008) Use of U.S. croplands for biofuels
increases greenhouse gases through emissions from land-use change. Science, 319,
1238–1540.
Smeets EMW, Lewandowski IM, Faaij APC (2009) The economical and environmen-
tal performance of miscanthus and switchgrass production and supply chains in
a European setting. Renewable and Sustainable Energy Reviews, 13, 1230–1245.
Stewart JR, Toma Y, Fernandez FG, Nishiwaki A, Yamada T, Bollero G (2009) The
ecology and agronomy of Miscanthus sinensis, a species important to bioenergy
crop development, in its native range in Japan: a review. Global Change Biology
Bioenergy, 1, 126–153.
The United States of America (2007) The Energy Independence and Security Act of
2007 (H.R. 6). Available at: http://energy.senate.gov/public/index.cfm?Fuse
Action=IssueItems.Detail&IssueItem_ID=f10ca3dd-fabd-4900-aa9d-c19de47df2da&
Month=12&Year=2007 (accessed May 2011).
Thomason WE, Raun WR, Johnson GV, Taliaferro CM, Freeman KW, Wynn KJ, Mul-
len RW (2004) Switchgrass response to harvest frequency and time and rate of
applied nitrogen. Journal of Plant Nutrition, 27, 1199–1226.
Tilman D, Hill J, Lehman C (2006) Carbon-negative biofuels from low-input high-
diversity grassland biomass. Science, 314, 1598–1600.
Tilman D, Socolow R, Foley JA et al. (2009) Beneficial biofuels- the food, energy, and
environment trilemma. Science, 17, 270–271.
Tufekcioglu A, Raich JW, Isenhart TM, Schultz RC (1999) Fine root dynamics, coarse
root biomass, root distribution, and soil respiration in a multispecies riparian buf-
fer in Central Iowa, U.S.A. Agroforestry Systems, 44, 163–174.
Turner DP, Koerper GJ, Harmon ME, Lee JJ (1995) A carbon budget for forests of
the conterminous United States. Ecological Applications, 5, 421–436.
U.S.DA (2007). Major Land Uses. U.S.DA. Available at: http://www.ers.usda.gov/
Data/MajorLandUses/ (accessed May 2011).
Wang S, Huang M, Shao X, Mickler RA, Li K, Ji J (2004) Vertical distribution of soil
organic carbon in China. Environmental Management, 33, S200–S209.
West TO, Six J (2007) Considering the influence of sequestration duration and car-
bon saturation on estimates of soil carbon capacity. Climatic Change, 80, 25–41.
Woodbury PB, Heath LS, Smith JE (2007) Effects of land use change on soil carbon
cycling in the conterminous United States from 1900 to 2050. Global Biogeochemical
Cycles, 21, GB3006.
Yazaki Y, Mariko S, Koizumi H (2004) Carbon dynamics and budget in a Miscanthus
sinensis grassland in Japan. Ecological Research, 19, 511–520.
Zhuang Q, McGuire AD, Melillo JM et al. (2003) Carbon cycling in extratropical ter-
restrial ecosystems of the Northern Hemisphere during the 20th century: a mod-
eling analysis of the influences of soil thermal dynamics. Tellus, 55B, 751–776.
© 2011 Blackwell Publishing Ltd, GCB Bioenergy, 4, 277–288
288 Z. QIN et al.