impact of sports arenas on land values cover...
TRANSCRIPT
Gabriel M. Ahlfeldt and Wolfgang Maennig Impact of sports arenas on land values: evidence from Berlin Article (Accepted version) (Refereed)
Original citation: Ahlfeldt, Gabriel M. and Maennig, Wolfgang (2008) Impact of sports arenas on land values: evidence from Berlin. Annals of regional science . ISSN 1432-0592 (Submitted) The original publication is available at http://www.springerlink.com/ DOI: 10.1007/s00168-008-0249-4 © 2008 Springer This version available at: http://eprints.lse.ac.uk/25512/ Available in LSE Research Online: October 2009 LSE has developed LSE Research Online so that users may access research output of the School. Copyright © and Moral Rights for the papers on this site are retained by the individual authors and/or other copyright owners. Users may download and/or print one copy of any article(s) in LSE Research Online to facilitate their private study or for non-commercial research. You may not engage in further distribution of the material or use it for any profit-making activities or any commercial gain. You may freely distribute the URL (http://eprints.lse.ac.uk) of the LSE Research Online website. This document is the author’s final manuscript accepted version of the journal article, incorporating any revisions agreed during the peer review process. Some differences between this version and the published version may remain. You are advised to consult the publisher’s version if you wish to cite from it.

Impact of Sports Arenas on Land Values: Evidence from Berlin P. Gabriel M. Ahlfeldt University of Hamburg Faculty Economics and Social Sciences Department of Economics and Business Administration Chair for Economic Policy Von-Melle-Park 5 20146 Hamburg Germany E-mail: [email protected] Phone: +49 (0)40 42838 – 5569 Fax: +49 (0)40 42838 – 6251 Wolfgang Maennig University of Hamburg Faculty Economics and Social Sciences Department of Economics and Business Administration Chair for Economic Policy Von-Melle-Park 5 20146 Hamburg Germany E-mail: [email protected] Phone: +49 (0)40 42838 - 4622 Fax +49 (0)40 42838 - 6251
Abstract: This paper develops a hedonic price model explaining standard land values in Berlin. The model assesses the impact of three multifunctional sports arenas situated in Berlin-Prenzlauer Berg which were designed to improve the attractiveness of their formerly deprived neighbourhoods. Empirical results confirm expectations about the impact of various attributes on land values. Sports arenas have significant positive impacts within a radius of about 3000 meters. The patterns of impact vary, indicating that the effective impact depends on how planning authorities address potential countervailing negative externalities.
Keywords: Stadium Impact, Land Gradient, Hedonic Regression, Spatial Autocorrelation, Berlin
JEL classification: R31, R53, R58

1
1
1 Introduction
Due to a stadium construction boom, the economic impact of new stadium
development has become a more controversial and discussed issue. Politicians who
address the citizens’ civic pride by spending large amounts of public money on
subsidizing major stadium projects usually have familiar arguments. They affirm that
the expenditures will be good investments, due to creation of construction jobs and
attracting businesses and tourists, leading to stimulation of spending in the
community and increased tax revenues. Critics maintain that high expectations are
based upon unrealistic assumptions about multiplier effects, underestimation of
substitution effects and by neglecting opportunity costs (Baade, 1996; Noll and
Zimbalist, 1997; Rosentraub, 1997; , 2000; Zaretsky, 2001). Econometric ex-post
evaluation has long supported scepticism regarding the economic benefits of new
stadium projects, since few positive and often negative impacts have been found on
income (Baade, 1988; Baade and Dye, 1990; Coates and Humphreys, 1999),
employment (Baade and Sanderson, 1997) and wages (Coates and Humphreys, 2003).
Relatively few studies have identified positive impacts on employment (Baim, 1990)
or rents (Carlino and Coulson, 2004) on a city or metropolitan statistical area (MSA)
level. Siegfried and Zimbalist (2006) provide a detailed discussion on why sports
facilities have failed to stimulate local economies.
This debate, however, might neglect a crucial aspect. Critics themselves emphasize
that stadiums and corresponding franchises are relatively small “businesses”
compared to major cities or metropolitan areas and that impacts are therefore limited
(Rosentraub, 1997). At the same time empirical studies usually use aggregated data
on a city or MSA level, instead of focusing on areas for which impact might be
2
2
expected. Sometimes neighbourhood activists tend to oppose new stadium
construction, arguing that they expect emerging traffic congestion and crowds to
lower property values nearby. Contrary to these expectations, Tu (2005), who was the
first to empirically analyse stadium construction from the homeowner perspective by
using transaction data on single-family properties, found a clear positive impact on
property prices when investigating the impact of FedEx Field in Prince Georges
County, Maryland, USA. Coates and Humphreys (2006) show that voters in close
proximity to facilities tend to favour subsidies more than voters living farther from
the facilities, indicating that benefits from stadia might exhibit an unequal spatial
distribution.
The present study investigates the impact of two sports complexes completed during
the 1990s in downtown Berlin, Germany, which were explicitly designed to improve
neighbourhood quality. Impact will be assessed by using highly disaggregated data
and a comprehensive hedonic model, which explains land value patterns for all of
Berlin and provides valuable insights on land gradient behaviour and impacts. Our
results show that sports arenas have an impact at the neighbourhood scale, although
this may vary for different arenas.
The remainder of this article is organized as follows. In section 2 two projects are
presented in detail. Section 3 and 4 discuss data, empirical strategy and
methodological issues. Section 5 contains the empirical results and an interpretation.
Section 6 concludes and gives an outlook.

3
3
2 Velodrom and Max-Schmeling-Arena
The two sports arenas investigated are the Max-Schmeling-Arena and
Velodrom/Swimming-Arena, both located in Prenzlauer Berg, a district within former
East Berlin.1 The arenas were originally designed to the standards of the International
Olympic Committee (IOC) as they played a role in the unsuccessful bid of Berlin for
the Olympics of 2000. To simplify matters from hereon we refer to
Velodrom/Swimming-Arena as Velodrom. As well as serving as Olympic venues for
boxing (Max-Schmeling-Arena), track cycling and aquatics (Velodrom), all arenas
were intended to be regarded as local amenities by neighbouring residents. Special
attention was paid to appealing architecture of visible buildings and their
incorporation into park landscapes, thereby providing recreational spaces in one of
the most densely populated areas of Berlin. These integrated concepts were honoured
with important architectural awards, including the German Architectural Award
(Velodrom in 1999) and the IOC/IAKS Gold medal2 (Max-Schmeling-Arena in
2001). As well as large arenas with capacities for 10000 spectators in the case of
Max-Schmeling-Arena and 11500 for Velodrom, they have additional facilities for
non-professional sports. The sites were chosen to connect well with local public
transportation networks. Although no subsequent improvements in public
infrastructure were necessary the project total expenditure, financed by land funds,
reached remarkable dimensions. Max-Schmeling-Arena cost about $118 Million (205
Million DM, current prices) and Velodrom over $295 Million (545 Million DM)
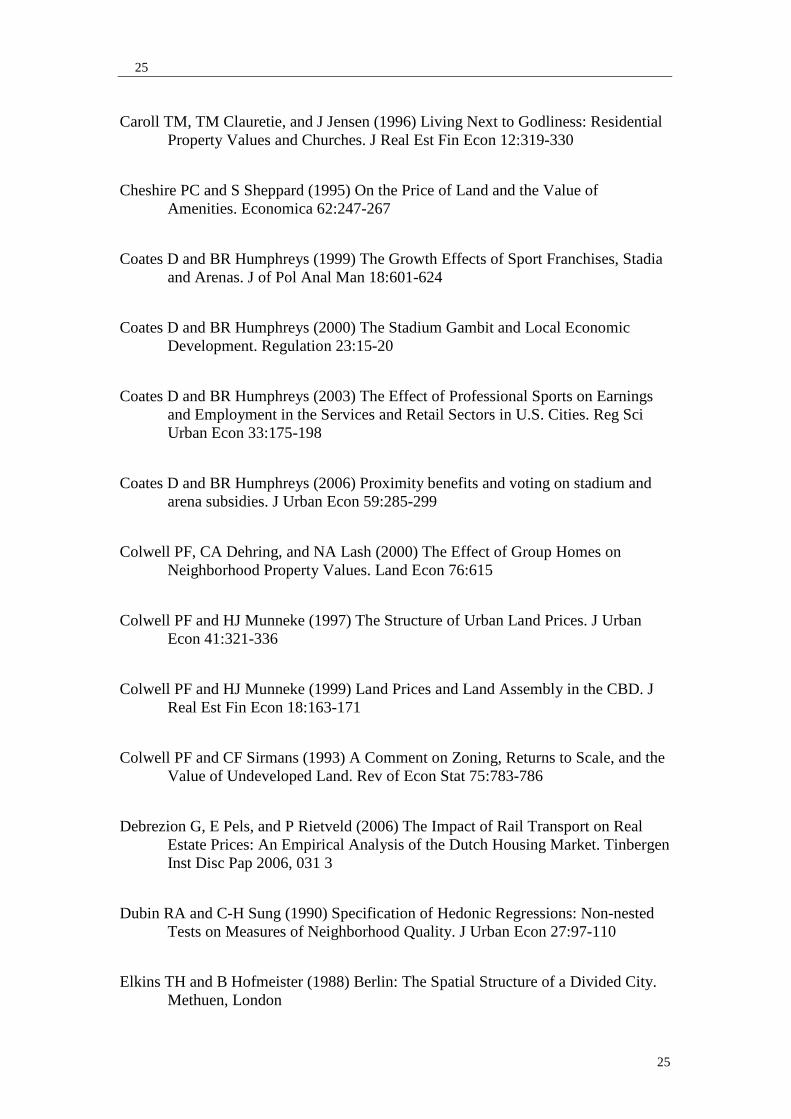
1 Exact location of arenas is shown in Figure 1 that also illustrates standard land value pattern for 2006. 2 This prize is sponsored by the IOC and the International Association for Sports and Leisure Facilities
(IAKS) and the only international prize awarded to sports and leisure facilities in operation.

4
4
(Myerson and Hudson, 2000; Perrault and Ferré, 2002).3 The projects were finished in
1997 (Max-Schmeling-Arena) and 1999 (Velodrom) leaving more than five years to
the time of this study.
<- INSERT FIGURE 1 ->
3 Data and Data Management
The study area covers the whole of Berlin, capital city of Germany, which on July 30,
2006 had 3,399,511 inhabitants and an area of approximately 892 km2. We use
standard land values per square meter (Bodenrichtwerte) from the local Committee of
Valuation Experts (Senatsverwaltung für Stadtentwicklung Berlin 2006a), which are
aggregated market values for properties lying within block boundaries and are
assessed on the basis of statistical evaluation of all transactions during the reporting
period. Data on legal density of development according to the zoning regulations is
provided in the form of typical floor space index (FSI) values for the zone.4 The FSI,
also called floor space ratio (FSR), is the ratio of building total floor area to the area
of the corresponding plot of land. Zoning regulations also determine whether
properties within a statistical block are to be used for business, industrial or
residential purposes.
The data refers to the official statistical block structure, the most disaggregated level
available at the Statistical Office of Berlin, as defined in December 2005. In this data
3 Dollar values have been calculated based on the average exchange rates during the years of
completion. For Max-Schmeling-Arena the average 1997 exchange rate of 1.7348 DM per dollar has been applied while values referring to the Velodrom complex rely to the average 1999 exchange rate of 1.0658 Euros per Dollar and 1.95583 DM per Euro.
4 More information on sources and the process of collection of standard land values is in the data appendix.
5
5
Berlin consists of 15,937 statistical blocks with a median surface area of less than
20,000 m2, approximately the size of a typical inner-city block of houses. The mean
population of the 12,314 populated blocks was 271 (median 135).5 To analyse this
highly disaggregated dataset we employ GIS tools and a projected GIS map of the
official block structure that brings a geographic dimension into our analysis. There is
GIS information available for public infrastructure such as schools, playgrounds and
railway stations enabling generation of impact variables that are discussed in more
detail in the section below.6 Information can be retrieved on location attributes, such
as proximity to water spaces or above ground railway tracks. Furthermore, we use
population data at block-level, including demographic characteristics from the
Statistical Office of Berlin. All data used in this paper strictly refers to the end of
2005.7
4 Empirical Strategy, Data and Methodological Discussion
Our empirical strategy consists of two steps. First, we develop a hedonic pricing
model explaining present land value pattern. In the second step we extend the basic
model by a set of dummy- and distance-variables, capturing impacts of the arenas on
land values. Hedonic models are commonly applied in real estate and urban
economics since they treat real estate commodities as bundles of attributes, whose
prices are estimated using multiple regression. Examples of hedonic pricing models in
urban economic literature include; construction of house indices (Mills and
Simenauer, 1996; Can and Megbolugbe, 1997; Munneke and Slade, 2001), impact
5 Especially in the outer areas of Berlin there are much larger blocks. These typically cover recreational
areas such as parks, forest and lakes which are undeveloped and unpopulated and are not included in the present study.
6 All GIS maps were provided by the Senate Department of Urban Development (Senatsverwaltung für Stadtentwicklung) and are based on “The City and Environment Information System” of the Senate Department (Senatsverwaltung für Stadtentwicklung Berlin, 2006b).
7 Standard land values of 2006 are assessed on the base of transactions from the reporting period year 2005.
6
6
assessment of of quality of public services (Gatzlaff and Smith, 1993; Bowes and
Ihlanfeldt, 2001), school quality (Mitchell, 2000), group homes (Colwell, Dehring
and Lash, 2000), churches (Caroll, Clauretie and Jensen, 1996) or even supportive
housing (Galster, Tatian and Pettit, 2004). However, with the exception of Tu (2005),
hedonic analysis of property values has not been applied to the impacts of sports
stadium construction.
We assume that the characteristics of real estate can be described by their structural
attributes [S], and a set of attributes capturing the effects of the neighbourhood [N]
and local public services [L], where [N] can be assumed to cover accessibility
attributes (Muellbauer, 1974; Rosen, 1974):
Following Tu (2005) the relationships in (1) and (2) can be formulated more precisely
in a regression equation
εδδγγββα ++++++++++= kkjjii L...LN...NS...S)Pln( 111111 (1)
where i, j and k represent the number of attributes, β, γ and δ are coefficients and ε is
an error term. When interpreting regression results in log-linear specifications, the
attribute coefficient gives the percentage impact of changes in attribute value on
property value. For coefficient values smaller than 10% this rule may also be applied
to dummy-variables (Ellen, Schill, Susin and Schwartz, 2001).8
Any hedonic model must take into account structural and location characteristics such
as floor space or accessibility to account for profitability and transport costs, theory
does not ultimately determine which variables are to be used in an appropriate
hedonic specification.. To compare property transactions it is necessary to correct all
transactions for a complete set of unit characteristics. Indeed, as noted by Heikkila, et
8 For larger coefficient values a simple formula is strongly recommended, providing a much better
approximation. For a parameter estimate b the percentage effect is equal to (eb – 1) (Halvorsen and Palmquist, 1980)
7
7
al. (1989), a feasible correction for unit characteristics gives the analysis a character
of referring to land values instead of property prices, while accessibility and other
location and neighbourhood attributes ideally isolate the effects of land value
components. As we directly focus on land values as the endogenous variable we can
largely abstract from unit characteristics and even the price-lot size relationship.9 We
capture land use by dummy-variables that identify blocks where considerable retail or
business activity takes place or where the main use is industrial,10 the remaining
blocks represent residential areas. We use a variable representing the typical block
FSI value, allowing for a quadratic term, since land value is expected to increase at a
declining rate with increased FSI.
Location characteristics are captured by a set of distance-variables reflecting
accessibility and proximity to amenities. Following Von Thünen and Alonso (1964),
the most important accessibility indicator is distance to CBD (Dubin and Sung, 1990;
Cheshire and Sheppard, 1995; Isakson, 1997; Jordaan, Drost and Makgata, 2004),
although Heikkila et al. (1989) find that distance to CBD prove to be an inferior
indicator of accessibility in the Los Angeles region.
In contrast to the usual assumption of one single CBD, Berlin is characterised by duo-
centricity. This characteristic emerged during the 1920s and was strengthened during
the period of division (Elkins and Hofmeister, 1988). Modelling Berlin as a typical
mono-centric city could lead to biased estimates (Dubin and Sung, 1990). The Senate
Department of Berlin considers CBD West and CBD East to be of equivalent
importance with regard to their functions as employment, retailing and cultural
centres (Senatsverwaltung für Wirtschaft Arbeit und Frauen, 2004). Picking up the
9 Lot size was typically found to have a concave functional impact on land values (Colwell and
Sirmans, 1993; Colwell and Munneke, 1997) later a convex structure was indicated within metropolitan area central business districts (CBD) (Colwell and Munneke, 1999).
10 The Committee of Valuation Experts provides information on land use for all land values. A detailed description of data sources is provided in the data appendix.
8
8
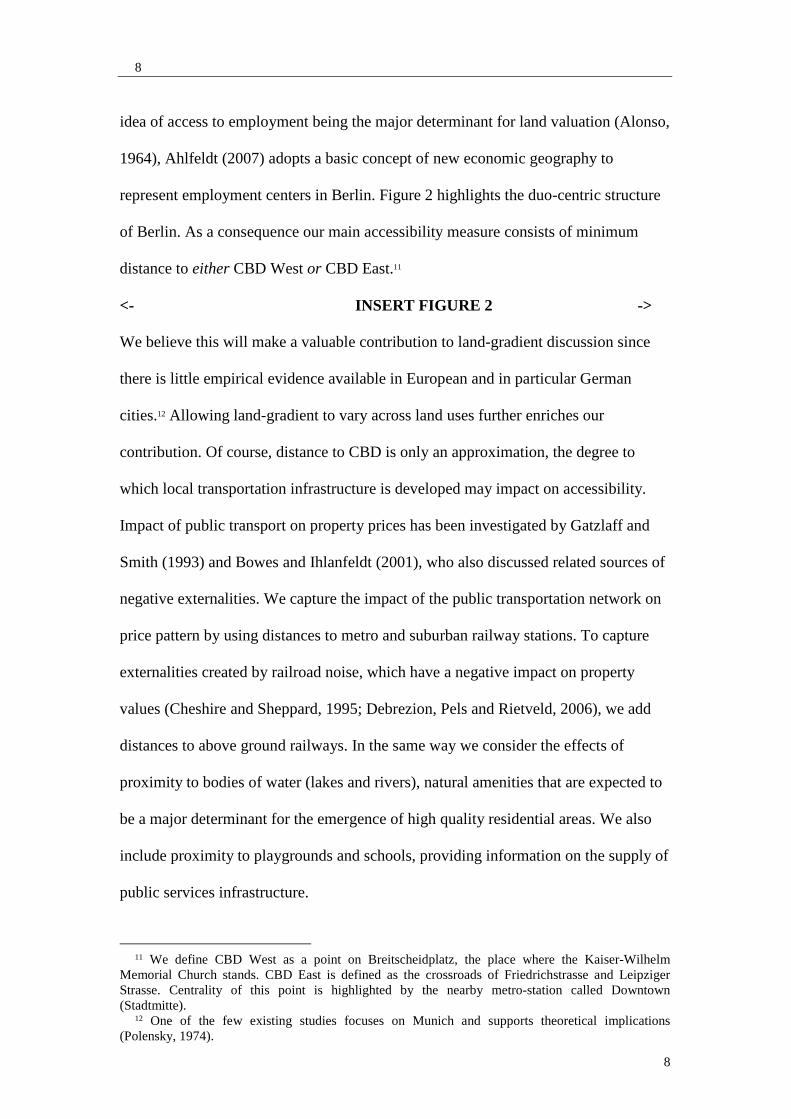
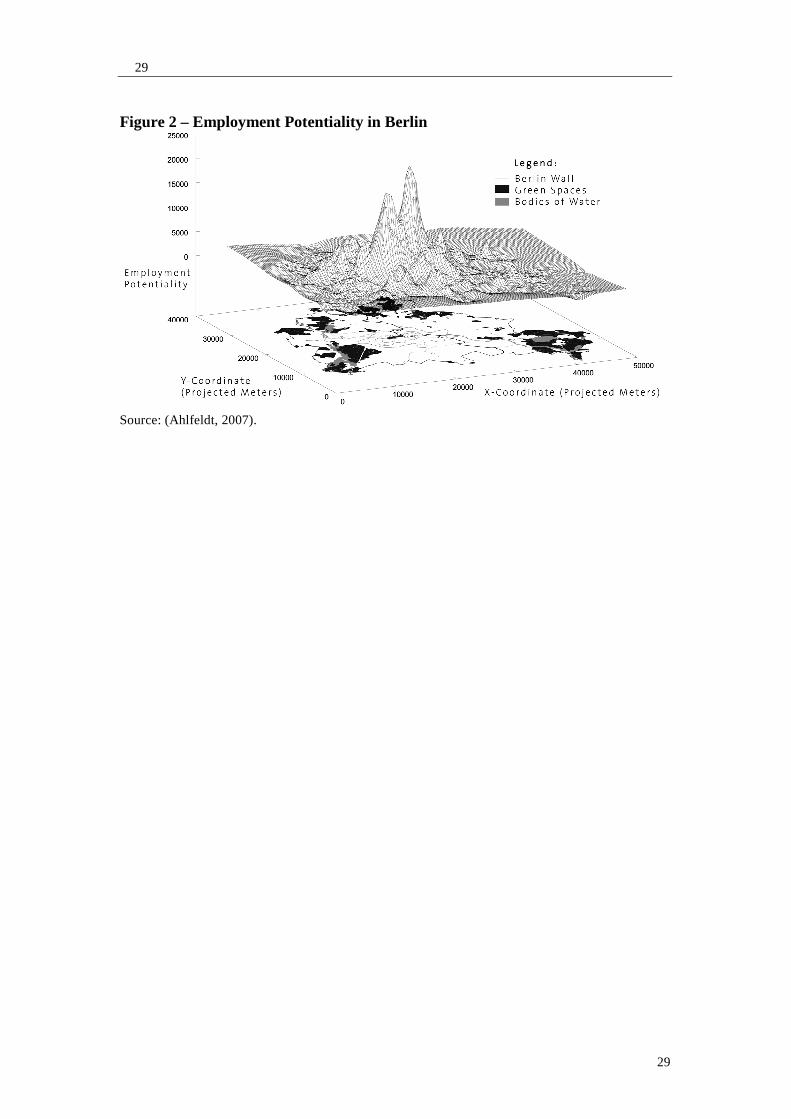
idea of access to employment being the major determinant for land valuation (Alonso,
1964), Ahlfeldt (2007) adopts a basic concept of new economic geography to
represent employment centers in Berlin. Figure 2 highlights the duo-centric structure
of Berlin. As a consequence our main accessibility measure consists of minimum
distance to either CBD West or CBD East.11
<- INSERT FIGURE 2 ->
We believe this will make a valuable contribution to land-gradient discussion since
there is little empirical evidence available in European and in particular German
cities.12 Allowing land-gradient to vary across land uses further enriches our
contribution. Of course, distance to CBD is only an approximation, the degree to
which local transportation infrastructure is developed may impact on accessibility.
Impact of public transport on property prices has been investigated by Gatzlaff and
Smith (1993) and Bowes and Ihlanfeldt (2001), who also discussed related sources of
negative externalities. We capture the impact of the public transportation network on
price pattern by using distances to metro and suburban railway stations. To capture
externalities created by railroad noise, which have a negative impact on property
values (Cheshire and Sheppard, 1995; Debrezion, Pels and Rietveld, 2006), we add
distances to above ground railways. In the same way we consider the effects of
proximity to bodies of water (lakes and rivers), natural amenities that are expected to
be a major determinant for the emergence of high quality residential areas. We also
include proximity to playgrounds and schools, providing information on the supply of
public services infrastructure.
11 We define CBD West as a point on Breitscheidplatz, the place where the Kaiser-Wilhelm
Memorial Church stands. CBD East is defined as the crossroads of Friedrichstrasse and Leipziger Strasse. Centrality of this point is highlighted by the nearby metro-station called Downtown (Stadtmitte).
12 One of the few existing studies focuses on Munich and supports theoretical implications (Polensky, 1974).

9
9
As indicators of neighbourhood quality we add population density and proportions of
foreign people (Dubin and Sung, 1990; Tu, 2005).13We also consider proportions of
other potential low-income groups such as people over the age of 65, and young
professionals and students between 18 and 27. Inclusion of the proportion of elder
population will also control for positive impacts such as peaceful atmosphere
(Andersson, 1994). To assess any impacts related to households with children we use
proxy-variables of proportions of the population in the age classes: below 6, from 6 to
15, and from 15 to 18.
We use this concept to account for potential East-West heterogeneity by introducing a
dummy-variable for West Berlin, which we allow to interact with all explanatory
variables to allow for heterogeneity of all implicit attribute prices.
Spatial dependence may lead to autocorrelation, which violates the assumption of
zero-correlation between residuals, leading to inefficient OLS estimates and biased
test-scores. Intuitively spatial dependence can be imagined to be the result of external
effects of surrounding areas. One explanation for spatial dependence in property
prices and rents is that the buyer and seller consider previous transactions that have
occurred in the immediate vicinity. To deal with spatial dependence, Can and
Megbolugbe (1997) used a spatial autoregressive explanatory variable that
represented a distance-weighted average of local sales prices that had occurred prior
to the transaction.14 The spatially lagged variable takes the following form for block
i:
jijjijji )]P(1/d)/1/dLagSpatial ∑∑= [(_ (2)
13 Inclusion of additional neighborhood characteristics such as income and education would have
only been possible at the expense of geographic precision, since no data is available at the level of statistical blocks.
14 Since assessed standard land values all refer to the same point in time we do not have to define any relevant pre-transaction period.
10
10
where Pj is the land value of neighbouring block j and (1/dij) represents the inverse
of distance between centroids of blocks i and j.
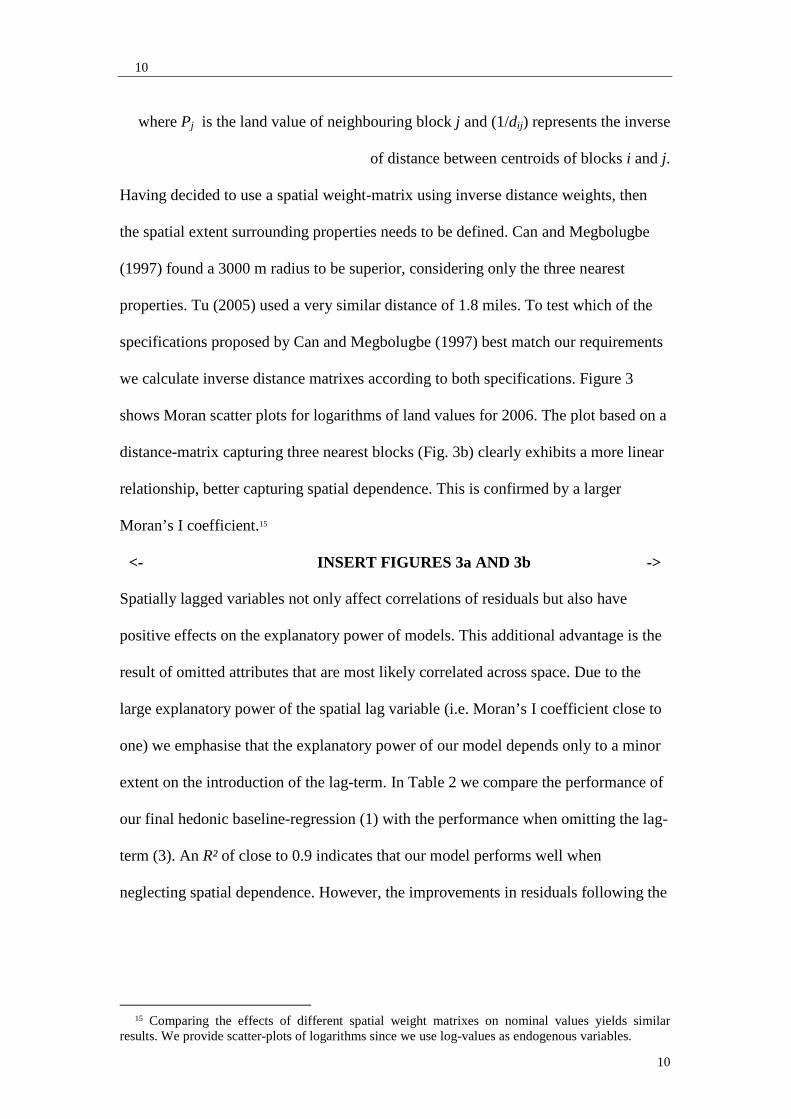
Having decided to use a spatial weight-matrix using inverse distance weights, then
the spatial extent surrounding properties needs to be defined. Can and Megbolugbe
(1997) found a 3000 m radius to be superior, considering only the three nearest
properties. Tu (2005) used a very similar distance of 1.8 miles. To test which of the
specifications proposed by Can and Megbolugbe (1997) best match our requirements
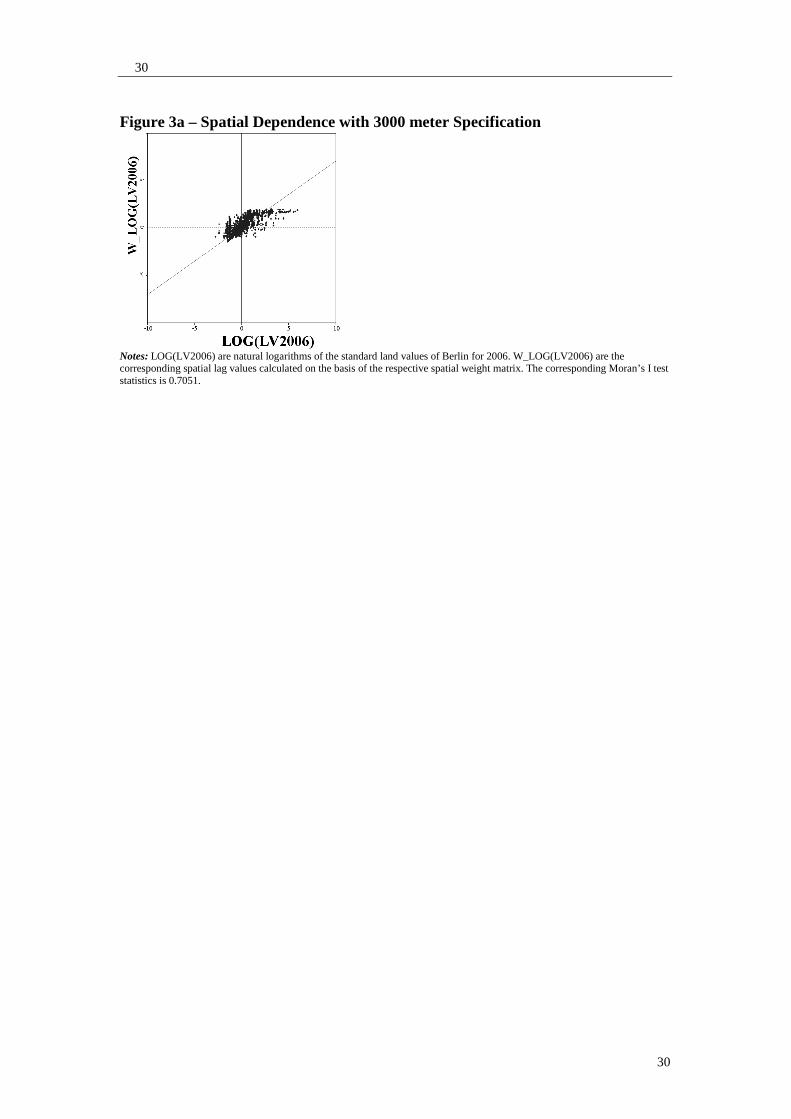
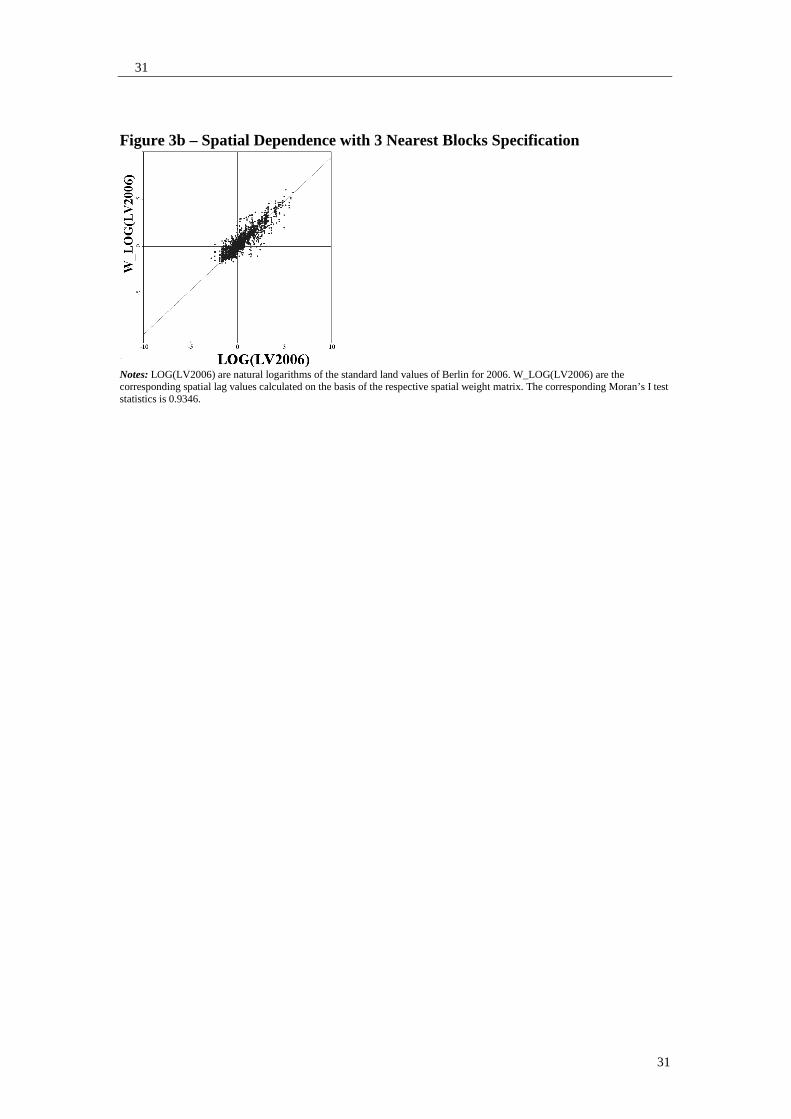
we calculate inverse distance matrixes according to both specifications. Figure 3
shows Moran scatter plots for logarithms of land values for 2006. The plot based on a
distance-matrix capturing three nearest blocks (Fig. 3b) clearly exhibits a more linear
relationship, better capturing spatial dependence. This is confirmed by a larger
Moran’s I coefficient.15
<- INSERT FIGURES 3a AND 3b ->
Spatially lagged variables not only affect correlations of residuals but also have
positive effects on the explanatory power of models. This additional advantage is the
result of omitted attributes that are most likely correlated across space. Due to the
large explanatory power of the spatial lag variable (i.e. Moran’s I coefficient close to
one) we emphasise that the explanatory power of our model depends only to a minor
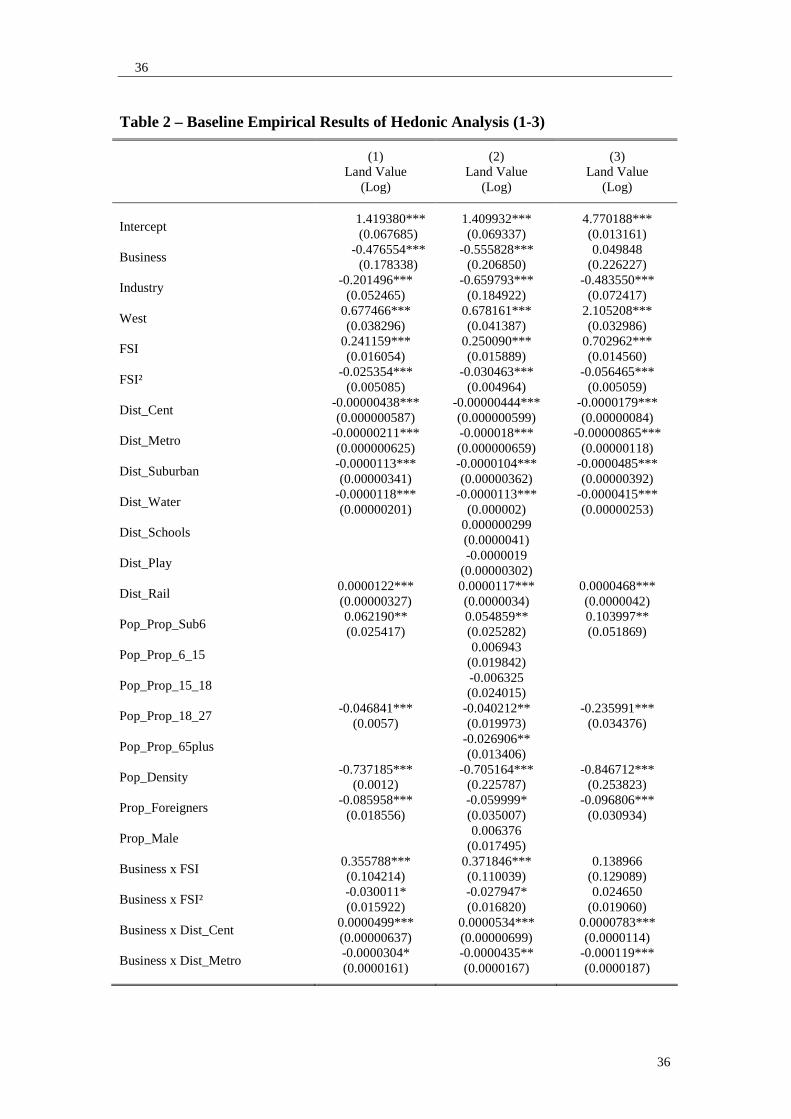
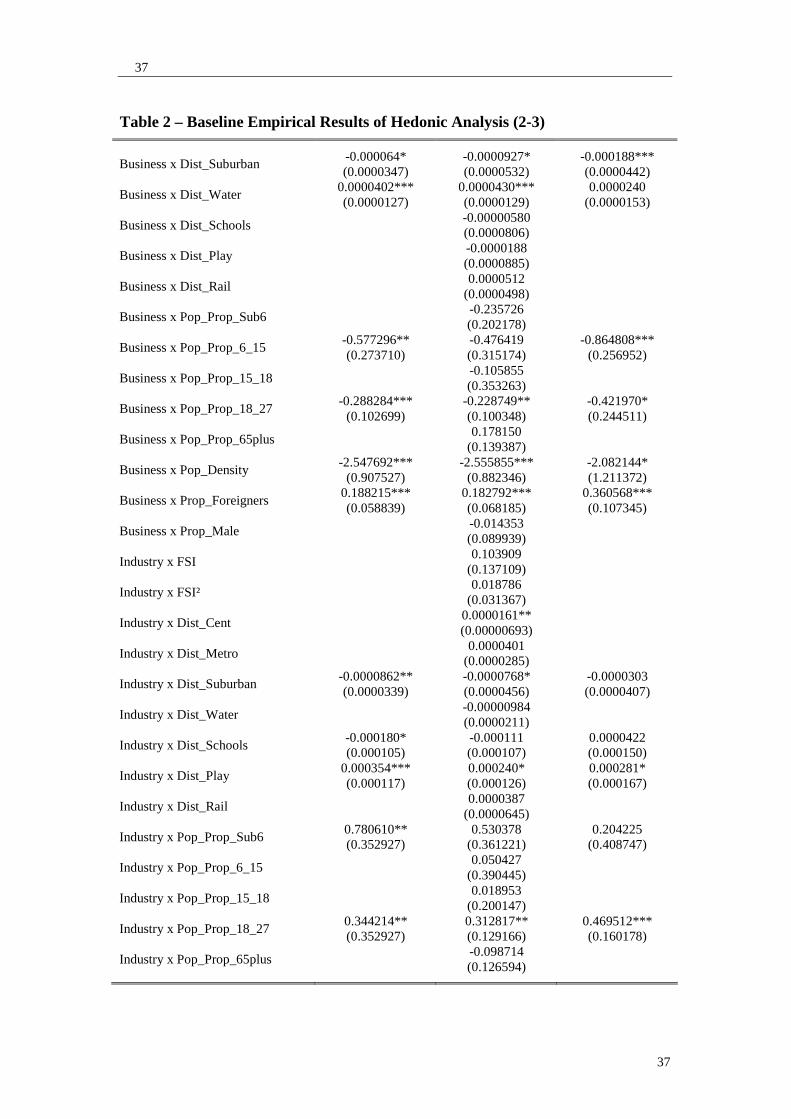
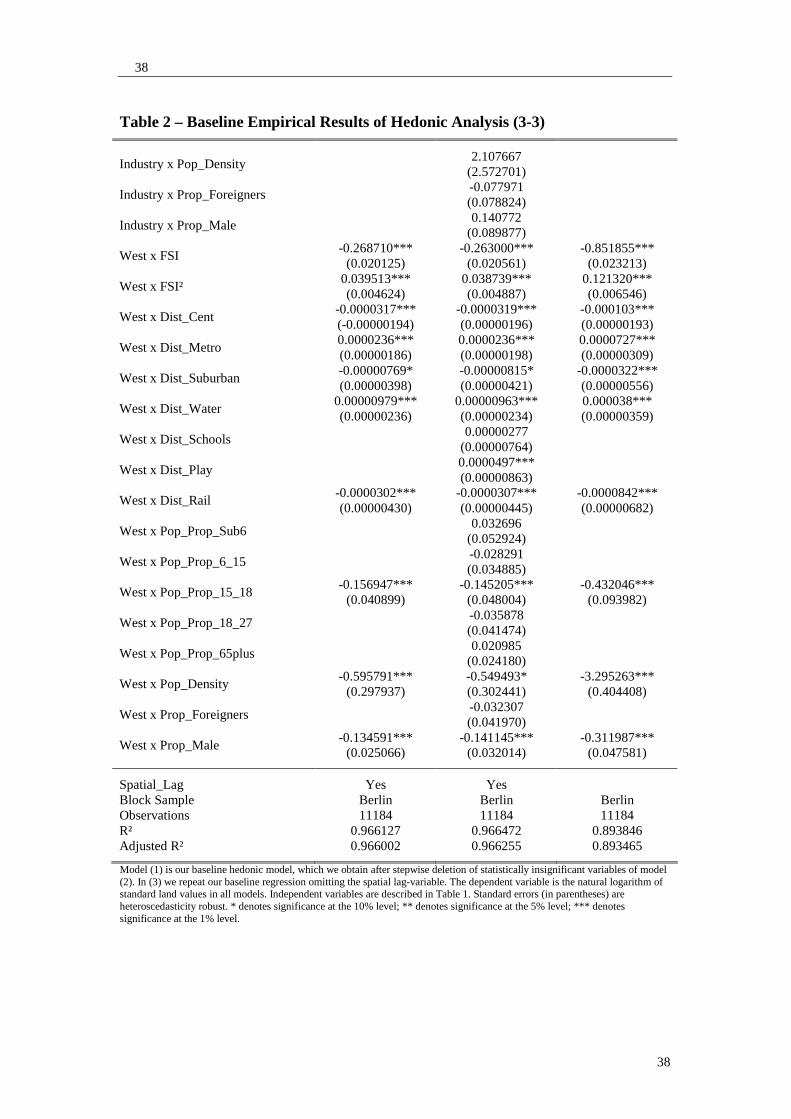
extent on the introduction of the lag-term. In Table 2 we compare the performance of
our final hedonic baseline-regression (1) with the performance when omitting the lag-
term (3). An R² of close to 0.9 indicates that our model performs well when
neglecting spatial dependence. However, the improvements in residuals following the
15 Comparing the effects of different spatial weight matrixes on nominal values yields similar
results. We provide scatter-plots of logarithms since we use log-values as endogenous variables.
11
11
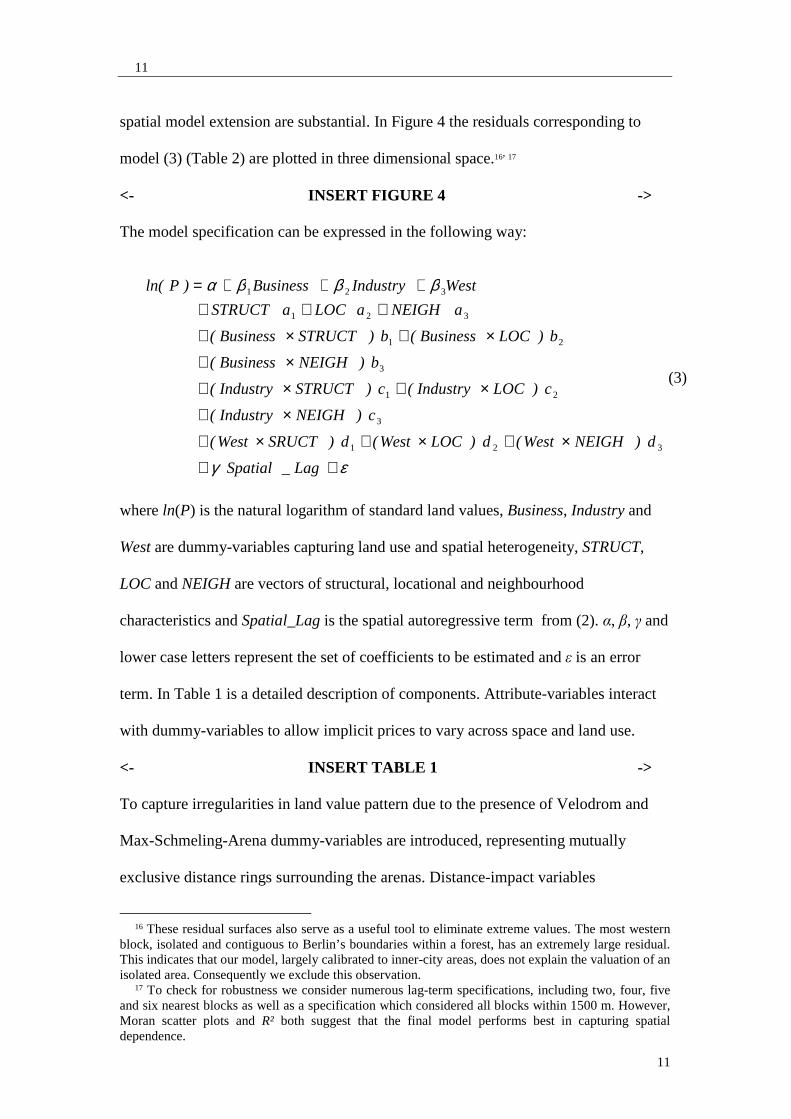
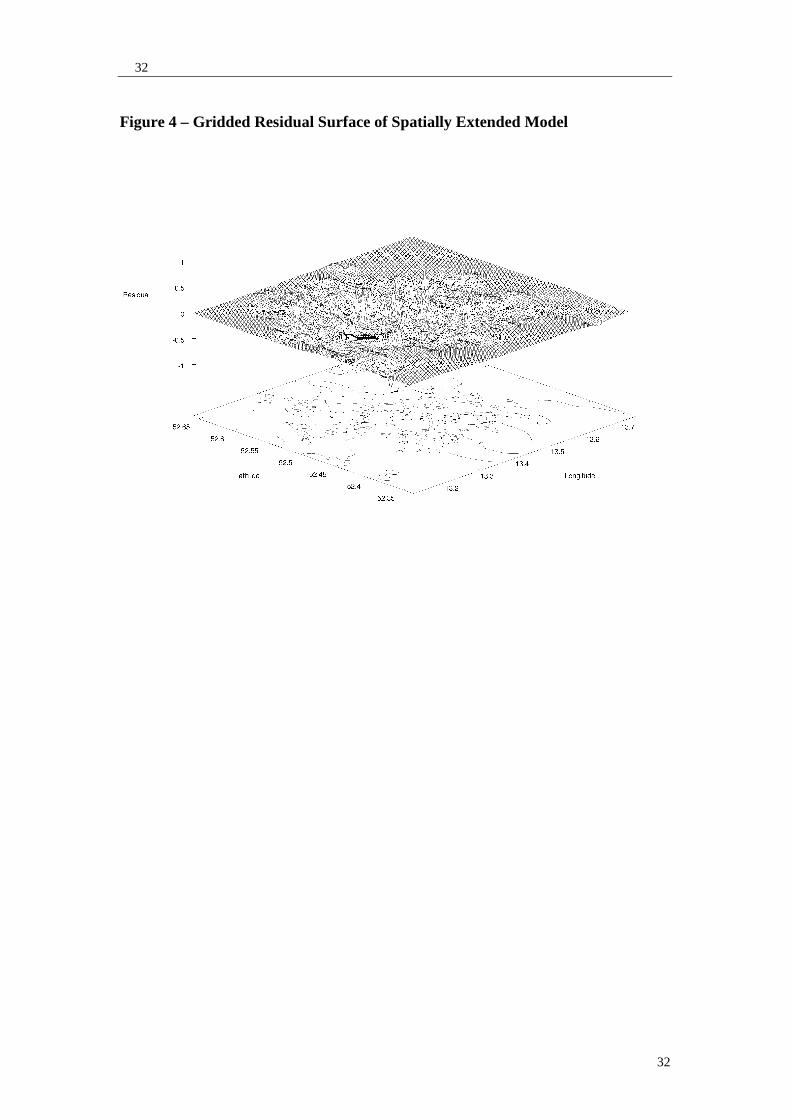
spatial model extension are substantial. In Figure 4 the residuals corresponding to
model (3) (Table 2) are plotted in three dimensional space.16, 17
<- INSERT FIGURE 4 ->
The model specification can be expressed in the following way:
εγ
βββα
++
×+×+×+
×+
×+×+
×+
×+×+
++++++=
Lag_Spatial
d)NEIGHWest(d)LOCWest(d)SRUCTWest(
c)NEIGHIndustry(
c)LOCIndustry(c)STRUCTIndustry(
b)NEIGHBusiness(
b)LOCBusiness(b)STRUCTBusiness(
aNEIGHaLOCaSTRUCT
WestIndustryBusiness)Pln(
321
3
21
3
21
321
321
(3)
where ln(P) is the natural logarithm of standard land values, Business, Industry and
West are dummy-variables capturing land use and spatial heterogeneity, STRUCT,
LOC and NEIGH are vectors of structural, locational and neighbourhood
characteristics and Spatial_Lag is the spatial autoregressive term from (2). α, β, γ and
lower case letters represent the set of coefficients to be estimated and ε is an error
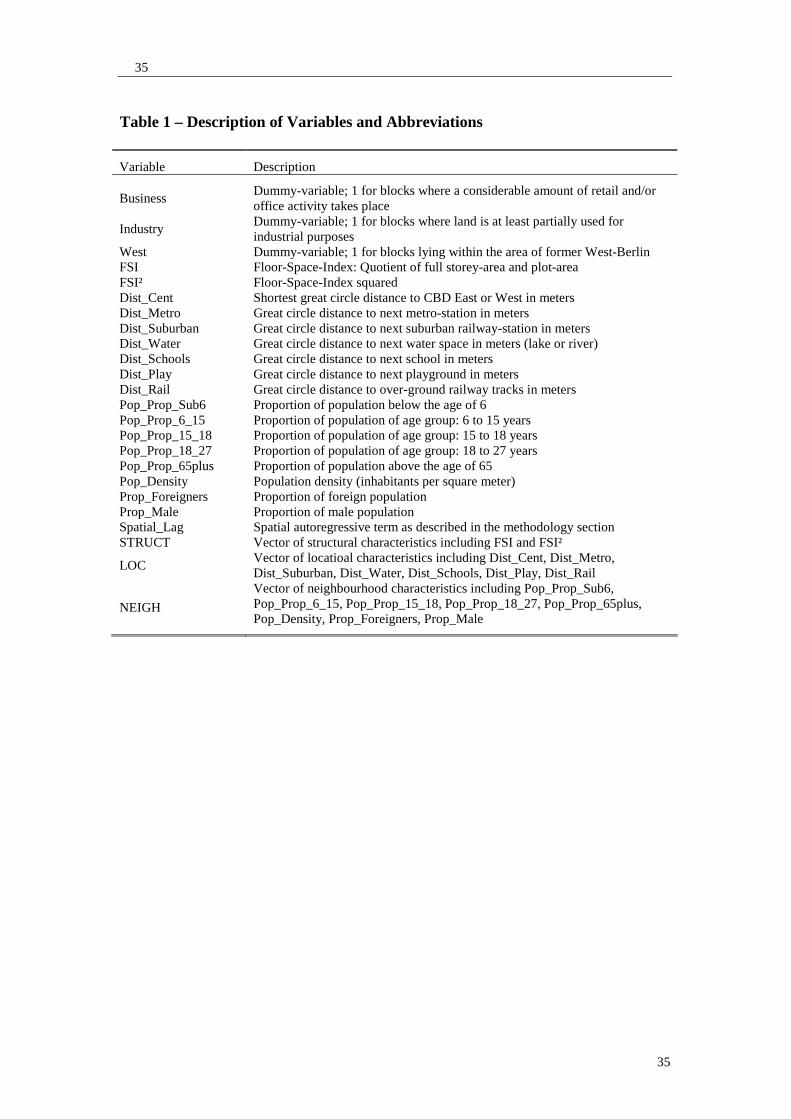
term. In Table 1 is a detailed description of components. Attribute-variables interact
with dummy-variables to allow implicit prices to vary across space and land use.
<- INSERT TABLE 1 ->
To capture irregularities in land value pattern due to the presence of Velodrom and
Max-Schmeling-Arena dummy-variables are introduced, representing mutually
exclusive distance rings surrounding the arenas. Distance-impact variables
16 These residual surfaces also serve as a useful tool to eliminate extreme values. The most western
block, isolated and contiguous to Berlin’s boundaries within a forest, has an extremely large residual. This indicates that our model, largely calibrated to inner-city areas, does not explain the valuation of an isolated area. Consequently we exclude this observation.
17 To check for robustness we consider numerous lag-term specifications, including two, four, five and six nearest blocks as well as a specification which considered all blocks within 1500 m. However, Moran scatter plots and R² both suggest that the final model performs best in capturing spatial dependence.
12
12
representing distance from block centroids to the subject arena are introduced
subsequently. We allow for quadratic terms in distances and interact dummy- with
distance-variables to identify the most appropriate function.
5 Empirical Results
5.1 Baseline Hedonic Model
The baseline hedonic model (Table 2, column 1) performs satisfactorily with all
coefficients showing the expected signs. The theoretically predicted negative
distance-price relationship is much larger for West Berlin. The significantly negative
coefficient on West x Dist_Cent can be interpreted as the persistence of different
spatial equilibriums that emerged during the time of division, which has already been
found for Germany on regional scale (Redding and Sturm, 2008). In East Berlin, no
free markets were allowed for decades, so there may be continuing market
segmentation between population segments with different preferences and/or budget
constraints..
<- INSERT TABLE 2 ->
Land gradient varies across space and land use. As expected, for residential and
industrial areas centrality is clearly important. However, the significant positive
coefficient on Business x Dist_Cent shows that the location premium that business
users are willing to pay is not linked strongly to distance from CBD. Apparently,
remoteness is less problematic for business use. This may be explained by business,
particularly retailers, having considerable market access in suburban areas. In
contrast, for residents there is no alternative to the CBD for various specialized
services. Proximity to metro and suburban railway stations has a significantly larger
impact on prices paid for business real estate than for other land uses. In West Berlin
the proximity to suburban railway stations appears to have a significantly larger
13
13
impact on property valuation than in East Berlin, while for metro stations the opposite
is true. This pattern might be partially attributable to the more developed metro
network of West Berlin, whereas in East Berlin the suburban railway system
dominates.18 The implication is that if a particular service is provided relatively
evenly across locations, residents then no longer recognize it as a local amenity. A
similar argument applies for schools and playgrounds that have virtually no impact on
land values.
Population density has a negative impact on area valuation and the effect is
significantly stronger within West Berlin. The coefficient on proportions of foreigners
is also significantly negative, indicating that foreign population indeed concentrates
in areas of lower valuation, most probably due to lower incomes. This impact is
similar in both parts of the city. The 18 to 27 year-olds also concentrate in areas of
relatively lower valuation, probably since this group largely consists of trainees and
students who have left home and are confronted with serious budget constraints. In
contrast, people over 65 show no major concentration in economically deprived
neighborhoods. The coefficient on the proportion of population below the age of six,
a proxy for families with young children, is significantly positive.
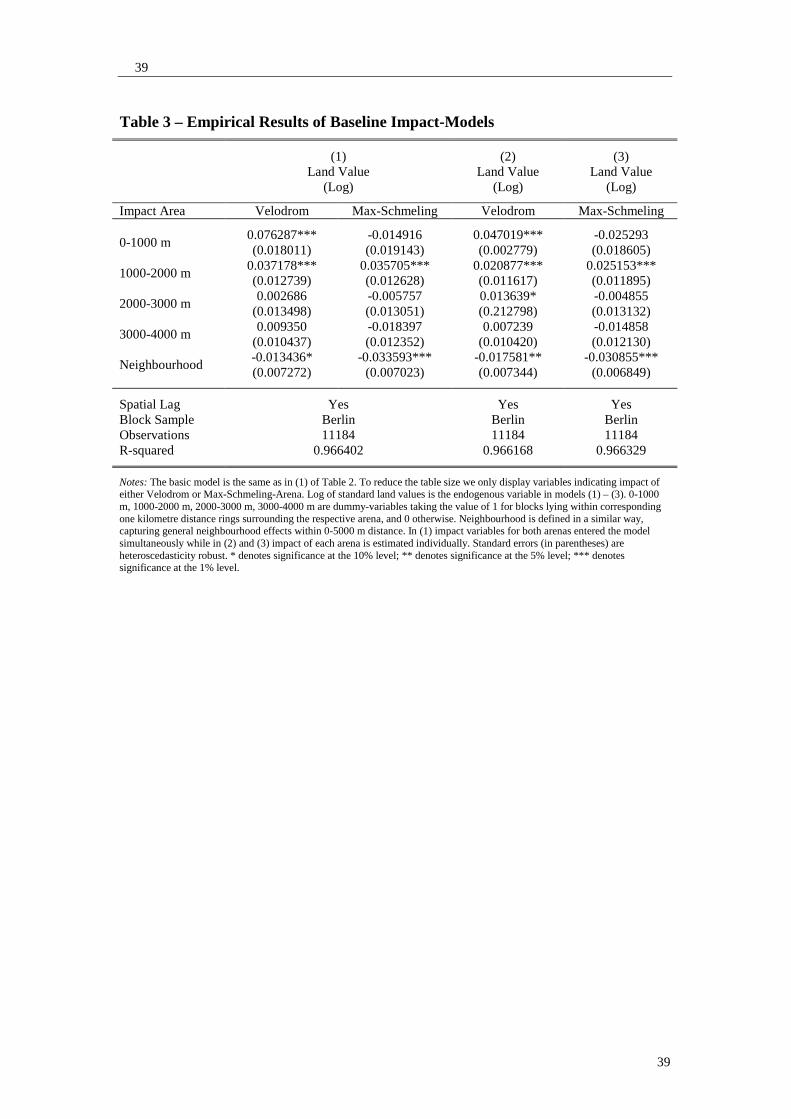
5.2 Impact of Sports Arenas
We consider the general neighbourhood of each arena to be the area within a 5000 m
radius, which had proved useful in the case of the larger FedEx Field (Tu, 2005). To
capture neighbourhood fixed-effects we create two dummy-variables denoting all
blocks lying within each of those impact-areas. In our first approach to assess arena
impact we introduce two sets of mutually exclusive distance rings surrounding both
18 Even before Berlin’s division the largest part of the metro network was within the western part of
the city. However, after separation this imbalance increased. Since the eastern Municipal Transport Services managed the suburban railway network, the western authorities focused on the improvement of metro infrastructure.

14
14
arenas, again represented by dummy-variables. For each arena, four 1000 m radius
rings, the first from 0-1000 m, the second 1000-2000 m, etc. are added to capture
effects across distance. The results of this basic impact model are presented in column
(1) of Table 3, with robustness checked by comparison with individual estimations of
each arena impact in columns (2) and (3).19
<- INSERT TABLE 3- >
Both neighbourhood effects show negative coefficient values, indicating that arenas
are located in relatively undervalued areas. Coefficients estimates for distance rings
2000-4000 m were not significant, indicating no systematic effect on the
neighbourhood. In contrast, coefficients for the 1000-2000 m distance ring have
positive values of similar size and are statistically significant at conventional levels.
These suggest a positive arena impact of around 3.5% within both areas. In the
immediate proximities, however, results differ substantially for Velodrom and Max-
Schmeling-Arena. In the case of Velodrom the impact in 0-1000 m is approximately
7.5% while for Max-Schmeling-Arena it is not significantly different from zero.
These results suggest a positive impact of Velodrom on land values, decreasing with
distance and disappearing within the 2000-3000 m ring. However, for Max-
Schmeling-Arena a positive impact was only found at 1000-2000 m, implying an
impact on land values that first increases and then decreases with distance and
disappears within the 2000-3000 m ring.
Although both arenas are situated in general neighbourhoods in which properties
appear to sell at a discount, this discount does not increase with proximity to the
arenas as for the FedEx Field (Tu, 2005).Within the general neighbourhood, the
arenas seem to have significant positive impacts. In immediate proximity to
19 Results for individual and simultaneous estimation show the same general pattern.
15
15
Velodrom, for instance, positive impacts outweigh the general neighbourhood
disadvantages.
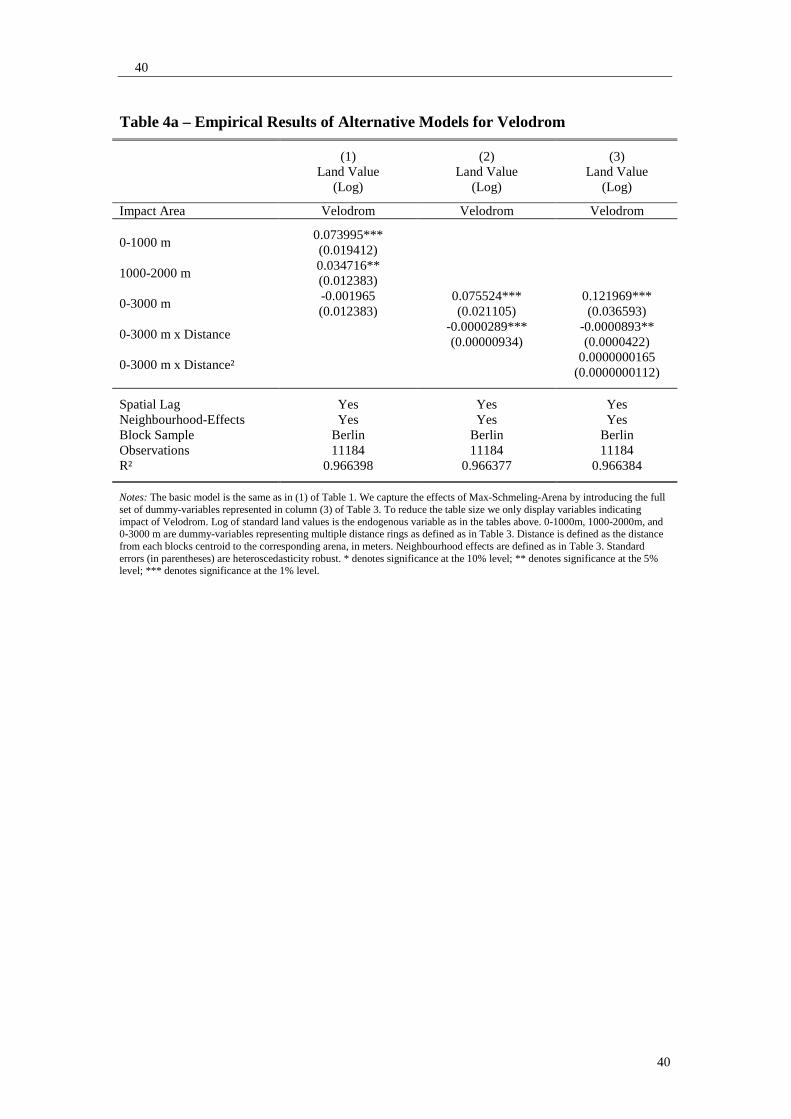
To confirm these results and to find the most appropriate functional form of arena-
impact, we introduce distance-based variables and set up two series of hedonic
models (Table 4). Our results suggest that impacts are limited to a distance of 3000
m. We consequently omit the 3000-4000 m dummy-variable in following models. As
suggested by Tu (2005), three distinct model specifications are tested. In column (1)
of Table 4 (a and b) the specification used in Table 3 is repeated, but omitting the
3000-4000 m dummy-variable. Column (2) tests for a linear impact of distance to
arena, therefore the 0-1000 m and 1000-2000 m dummy-variables are substituted with
an interactive term that consists of the 0-3000 m dummy interacted with distance to
arena. Column (3) specification allows for a quadratic term to account for non-linear
effects, in particular for the potentially parabolic form of impact of Max-Schmeling-
Arena.
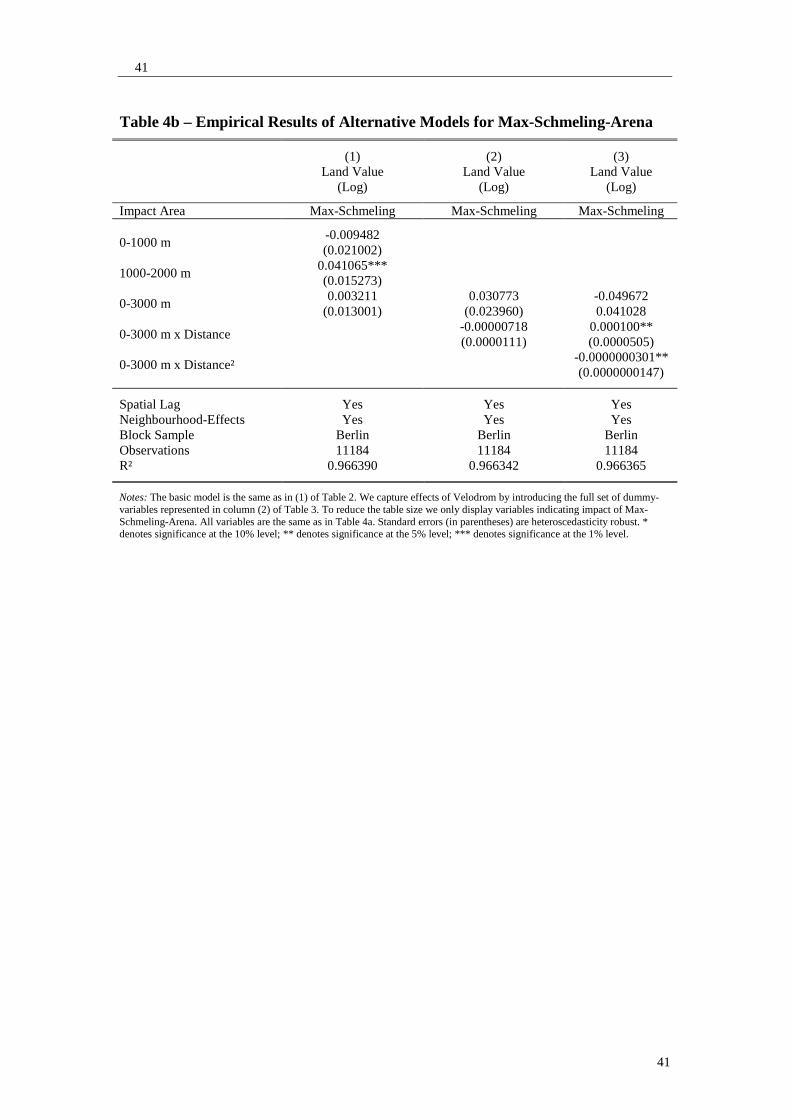
<- INSERT TABLES 4a AND 4b ->
The results in Table 4 are similar to those of Table 3. For Velodrom, we find a highly
significant linear distance-price relationship. The quadratic distance term is not
statistically significant. For Max-Schmeling-Arena, in contrast, specification (3)
clearly provides a better fit. Both interactive distance terms are significant, revealing
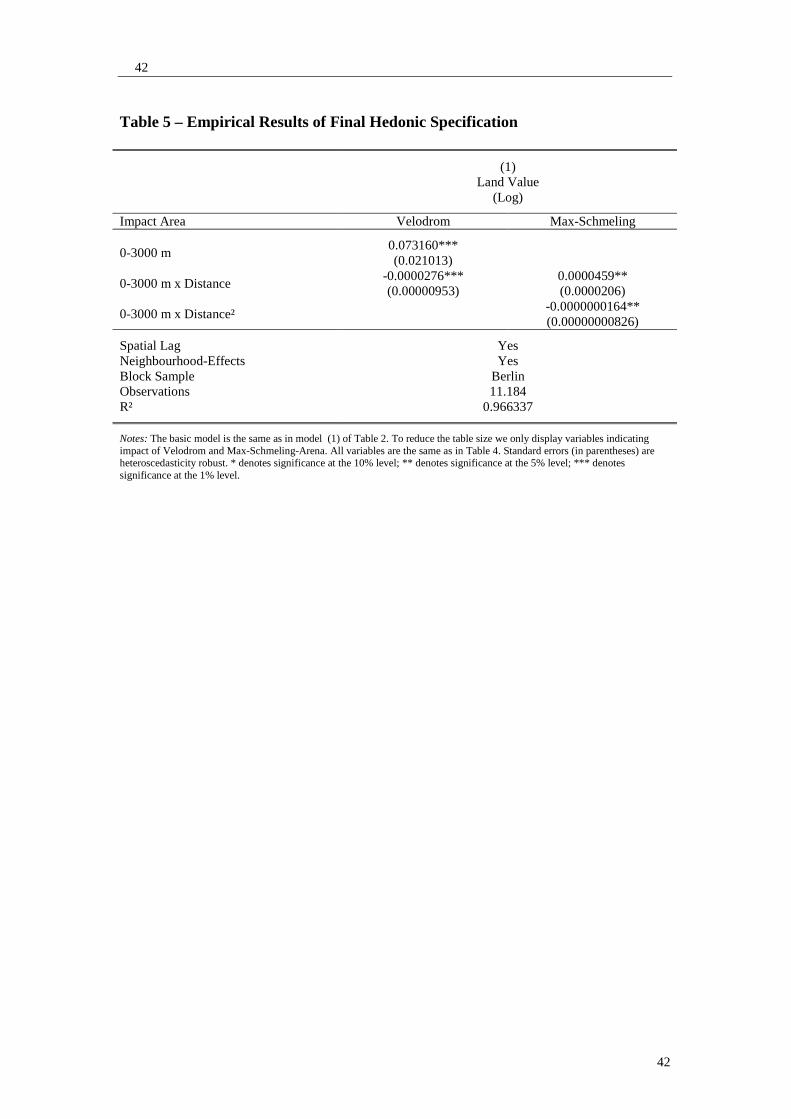
that the pattern of land value impact is in a parabolic form. Having identified the
appropriate functional form for each arena we finally estimate coefficients for both
arenas, assuming that the land value-distance relationship is linear for Velodrom and
quadratic for Max-Schmeling-Arena. Level-effects are now omitted for Max-
Schmeling-Arena since the corresponding dummy-variable was not statistically
16
16
significant in specification (3) of Table 4b.20 Estimations for our final hedonic
specification are presented in Table 5.
<- INSERT TABLE 5 ->
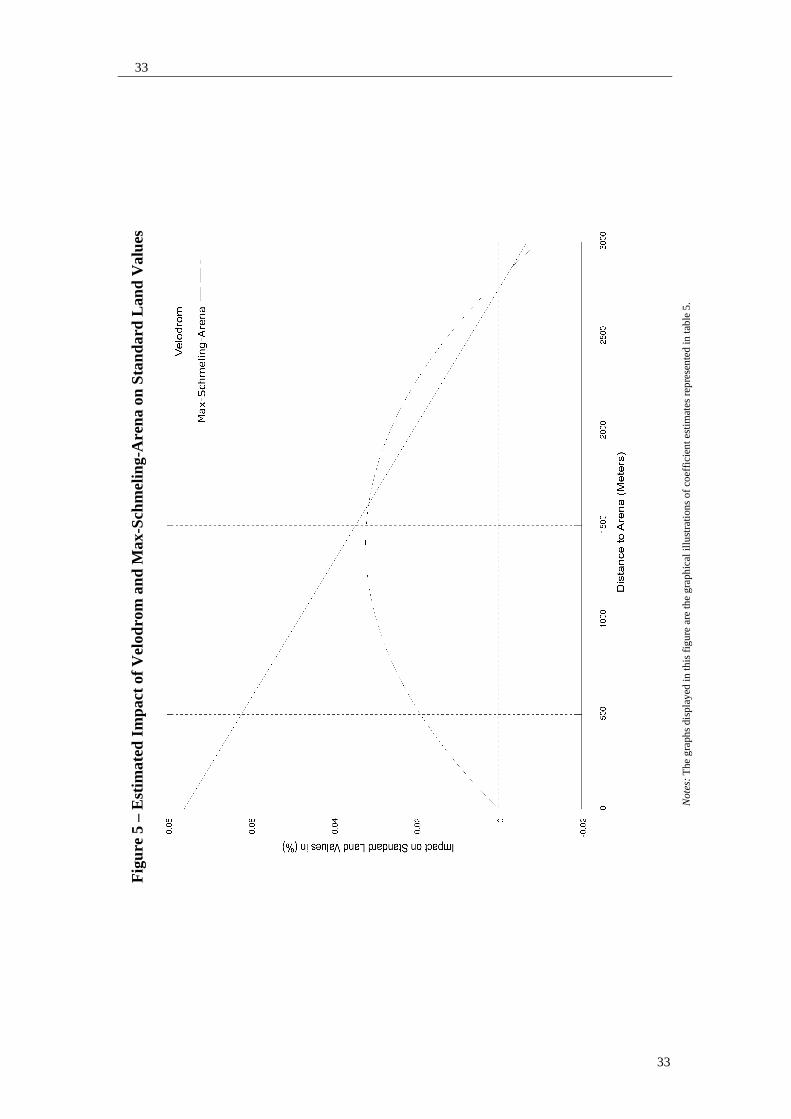
These results are presented graphically in Figure 5 where the relative land value
gradients are plotted, based on the corresponding coefficient estimates.
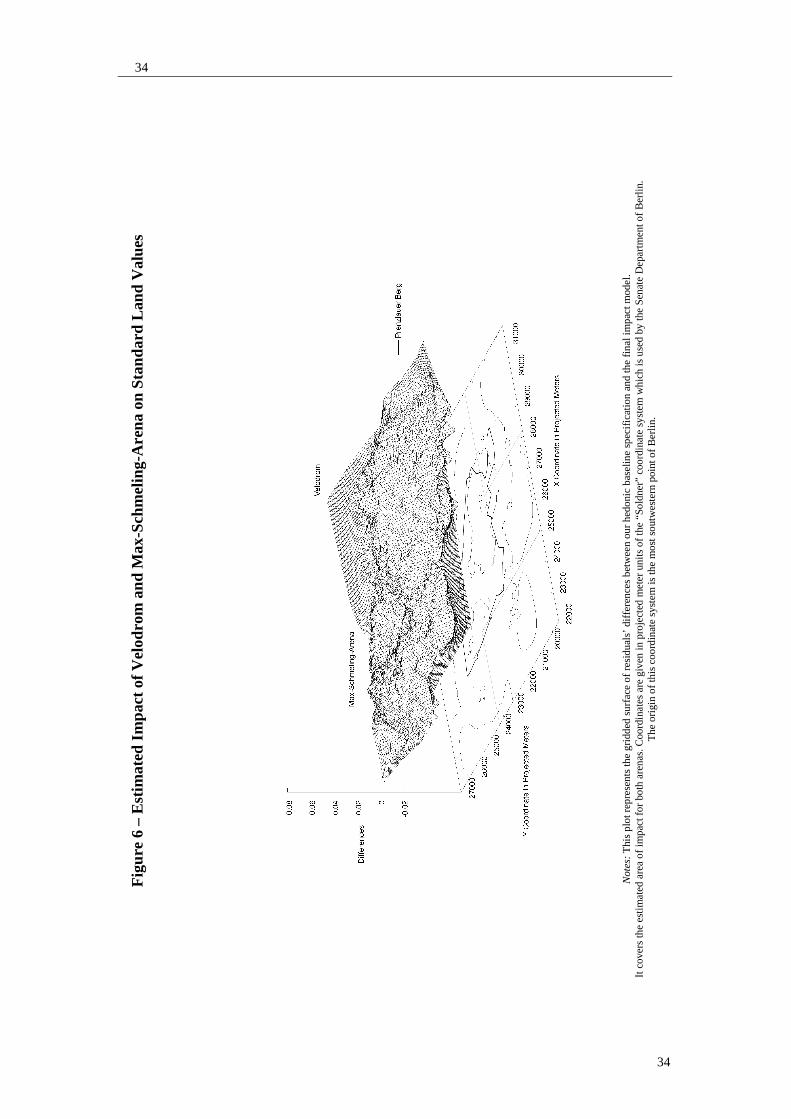
To provide a better spatial impression of both overlapping arena-impacts the
differences in residuals were plotted, between our final hedonic impact specification
(Table 5) and the hedonic baseline specification of column (1) Table 4 in three
dimensional space (Figure 6). It can be shown that these differences correspond to the
estimated arena impacts. Assuming that
εβα ++= BASE)Pln( (4)
represents our hedonic baseline specification and
µMSVELOBASE)Pln( ++++= δγβα (5)
is our final hedonic impact specification, where BASE is a vector of attribute variables
included in our baseline model, VELO is a vector of impact variables related to
Velodrom and MS is similar for Max-Schmeling-Arena. β, γ and δ represent sets of
coefficients to be estimated and ε and µ are error terms. Taking differences yields:
δγµε MSVELO +=− (6)
In our econometric specification this relationship corresponds to taking differences
between residuals in order to visualize the additional explanatory power provided by
the introduction of impact variables.
<- INSERT FIGURES 5 and 6 ->
20 We only omit the 0-3000 m dummy-variable for Max-Schmeling-Arena. Neighbourhood fixed
effects are still captured in two 0-5000 m area dummy-variables.
17
17
Figures 5 and 6 demonstrate how irregularities in land value pattern are attributable to
the locations of Max-Schmeling-Arena and Velodrom. For both arenas there is a
consistent pattern of impacts at distances ranging from 1500 to 3000 m. Impacts are
positive, decrease with distance and disappear after 3000 m. If these positive impacts
are attributable to the presence of the arenas, one would intuitively expect location
premium to be highest in the immediate proximity, since positive external effects
should lose intensity with increasing distance. While this story fits the results for
Velodrom, it conflicts with the estimations for the immediate vicinity of Max-
Schmeling-Arena.
However, the estimated pattern of impact becomes more conclusive when
countervailing externalities are considered (Galster, Tatian and Pettit, 2004). Instead
of assuming the existence of just one positive (or negative) externality, various
positive and negative externalities should be considered. Assuming that distinct
externalities differ in range, size and sign; externalities may cancel each other out
within a certain distance range, while at other distances one externality may
dominate. As previously discussed, Velodrom and Max-Schmeling-Arena are
comparable in terms of utilization, architectural quality, physical size and provision
of new recreational spaces, suggesting that positive externalities should be
comparable. The distinct impacts may be caused by negative externalities of limited
range that are associated with Max-Schmeling-Arena. Ahlfeldt and Maennig (2008)
provide a detailed discussion on how parking scarcity caused by a lack of additional
parking facilities adversely impacts on property prices in proximity to Max-
Schmeling-Arena.21 Moreover, in contrast to Velodrom, Max-Schmeling-Arena is the
21 The original plans for Max-Schmeling-Arena included an underground car park. These plans were
abandoned after Berlin’s bid for the 2000 Olympics was rejected by the IOC (Meyer, 1997).
18
18
home of two sports clubs of national importance.22 The regular presence of highly
involved fans may represent a source of noise and disturbances that might have an
additional price depreciating effect. This potentially affects land values by
particularly discouraging car-owning households. In the case of Velodrom an
adjoining empty lot was transformed into a car-park, whereas the absence of such
available space in the proximity of Max-Schmeling-Arena has meant that the problem
is still unsolved.
6 Conclusion
This paper contributes to the wider discussion on land value behaviour as well as to
the more specific debate on stadium impact. Application of GIS techniques and
highly disaggregated data allowed the development of a cross-sectional hedonic
model capturing the full range of structural and location attributes, as well as spatial
spill-over effects. While controlling for location and neighbourhood characteristics,
land values in Berlin show some peculiarities. One and a half decades after re-
unification the land gradient is significantly flatter for East Berlin, indicating that the
possible effects of four decades of centralized allocation of land are still persistent. At
least we find two segmented markets in disequilibrium that if at all, tend towards an
integrated equilibrium very slowly. This finding points to high transaction costs
associated to spatial arbitrage and is particularly striking in light of the ongoing
debate about the existence of multiple equilibria in spatial distribution of economic
activity. Allowing for variation of land gradient reveals that the location premium that
business is willing to pay is less sensitive to remoteness than that of residents. These
findings reflect the presence of numerous and relatively strong sub-centers in
suburban areas of Berlin where business finds considerable market access. The more
22 Resident teams are the basketball team of “Alba Berlin” and the handball team of “Füchse
Berlin”.
19
19
distinct relation of business land values and distance to public transportation
highlights the importance of market access for business. The results suggest that for
residents the specialized services of the CBD are less substitutable by those of sub-
centers.
The baseline hedonic model was extended by a set of geographic variables attributing
unexplained land value variation to the location of Velodrom and Max-Schmeling-
Arena. While the presence of Velodrom has a significantly positive impact on land
values, decreasing with distance, Max-Schmeling-Arena has more ambiguous effects;
there are no positive effects in close proximity, but relative land values increase in
more distant proximity. Since positive externalities emanated by arenas are expected
to be comparable, the distinct patterns of impact on land values can be explained by
the presence of countervailing negative externalities of limited range that surround
Max-Schmeling-Arena. Besides potential problems caused by fans, traffic
congestions following unrealistic assumptions about visitors’ travel customs prove to
be obvious explanation. Bearing in mind that arenas were suited with a sophisticated
design in order to contribute to an increase in location desirability of their
neighbourhoods, our results suggest that the relatively large investments, for which
the projects had been criticized, may be justifiable from ex-post perspective.
However, results do not allow for a precise separation of effects associated to the
original functions of sports facilities and those related to sophisticated architecture
and urban design.
Our results suggest that the arenas have an impact within a radius of approximately
3000 m. This result is to be compared with Tu (2005), who identified a three-mile
impact area for the much larger FedEx Field. Empirical results of studies using
aggregated data should be interpreted carefully in light of these findings. It confirms

20
20
the insights of Coates and Humphrey (2006) who – on the basis of analysing voting
behaviour in Stadia polls – argue that researchers should focus on the spatial aspects
of sport-related economic effects. Any impact that does not exceed a range of a few
miles may hardly be expected to significantly influence aggregated values for entire
metropolitan areas. Consequently, the absence of measurable effects at high levels of
aggregation does not imply an absence of impact at the neighbourhood scale.
21
21
Data Appendix
We collected data on standard land values, FSI values and land use as determined by
zoning regulations from atlases of standard land valuation (Bodenrichtwertatlanten)
(Senatsverwaltung für Stadtentwicklung Berlin, 2006a). The Committee of Valuation
Experts in Berlin have been publishing these atlases at intervals of one to four years,
since 1967.
Data collection was conducted by assigning values represented in atlases of standard
land valuation to the official block structure as defined in December 2005. If more
than one value was provided by an atlas of standard land valuation for one particular
block, then an average of the highest and lowest values was used. Price data has been
collected individually for blocks, which were not used for purely residential purposes.
In contrast, for pure residential areas data on land values at a lower level of
disaggregation (Statistische Gebiete) was used, since variation was typically much
smaller. Since Berlin consists of 195 statistical areas (Statistische Gebiete), this
ensured that price data for residential areas was sufficiently disaggregated to draw a
comprehensive picture. Aggregation to statistical area-level was by averaging the
highest and lowest standard land values within the respective area. To guarantee that
averages represented a feasible proxy of overall area valuation a threshold for the
ratio of maximum-to-minimum land value within a statistical area was introduced. If
this ratio was > 2, then the extreme values were entered individually and averages
were taken over the remaining blocks until the ratio had fallen below the threshold
value. This had to be done in only very few cases, since generally maximum and
minimum values were close. This short cut accelerated data entry enormously, with
limited losses in data quality. However, for the areas of potential arena impact

22
22
consisting of Prenzlauer Berg and the adjoining, land values were on block level for
all land uses.

23
23
Acknowledgements: We would like to thank the editors and two anonymous referees for valuable comments and suggestions. We acknowledge the support of the Berlin Senate Department for Urban Development for provision of Data and GIS content. We would also like to thank seminar participants at University of Hamburg, in particular Arne Feddersen, for valuable comments and suggestions.

24
24
References
Ahlfeldt GM (2007) If Alonso Was Right: Accessibility as Determinant for Attractiveness of Urban Location. Hamburg Contemp Econ Disc 12
Ahlfeldt GM and W Maennig (2008) The Role of Architecture on Urban Revitalisation: The Case of "Olympic Arenas" in Berlin-Prenzlauer Berg: Hamburg Contemp Econ Disc 01
Andersson DE (Households and Accessibility: an Empirical Study of Households’ Valuation to one or more Concentrations of Employment or Services. Disc Pap Urban Reg Econ 97, University of Reading
Alonso W (1964) Location Theory. M.I.T. Press, Cambridge, Mass
Baade RA (1988) An Analysis of the Economic Rationale for Public Subsidization of Sports Stadiums. Ann Reg Sci 22:37-47
Baade RA (1996) What Explains the Stadium Construction Boom? Real Est Iss 21:5-11
Baade RA and RF Dye (1990) The Impact of Stadiums and Professional Sports on Metropolitan Area Development. Growth Change 21:1-14
Baade RA and AR Sanderson (1997) The Employment Effect of Teams and Sports Facilities. The Brookings Institute, Washington, D.C
Baim DV (1990) Sports Stadiums as Wise Investments: An Evaluation. The Heartland Institute, Chicago
Bowes DR and KR Ihlanfeldt (2001) Identifying the Impacts of Rail Transit Stations on Residential Property Values. J Urban Econ 50:1
Can A and I Megbolugbe (1997) Spatial Dependence and House Price Index Construction. J Real Est Fin Econ 14:203-222
Carlino G and NE Coulson (2004) Compensating Differentials and the Social Benefits of the NFL. J Urban Econ 56:25-50
25
25
Caroll TM, TM Clauretie, and J Jensen (1996) Living Next to Godliness: Residential Property Values and Churches. J Real Est Fin Econ 12:319-330
Cheshire PC and S Sheppard (1995) On the Price of Land and the Value of Amenities. Economica 62:247-267
Coates D and BR Humphreys (1999) The Growth Effects of Sport Franchises, Stadia and Arenas. J of Pol Anal Man 18:601-624
Coates D and BR Humphreys (2000) The Stadium Gambit and Local Economic Development. Regulation 23:15-20
Coates D and BR Humphreys (2003) The Effect of Professional Sports on Earnings and Employment in the Services and Retail Sectors in U.S. Cities. Reg Sci Urban Econ 33:175-198
Coates D and BR Humphreys (2006) Proximity benefits and voting on stadium and arena subsidies. J Urban Econ 59:285-299
Colwell PF, CA Dehring, and NA Lash (2000) The Effect of Group Homes on Neighborhood Property Values. Land Econ 76:615
Colwell PF and HJ Munneke (1997) The Structure of Urban Land Prices. J Urban Econ 41:321-336
Colwell PF and HJ Munneke (1999) Land Prices and Land Assembly in the CBD. J Real Est Fin Econ 18:163-171
Colwell PF and CF Sirmans (1993) A Comment on Zoning, Returns to Scale, and the Value of Undeveloped Land. Rev of Econ Stat 75:783-786
Debrezion G, E Pels, and P Rietveld (2006) The Impact of Rail Transport on Real Estate Prices: An Empirical Analysis of the Dutch Housing Market. Tinbergen Inst Disc Pap 2006, 031 3
Dubin RA and C-H Sung (1990) Specification of Hedonic Regressions: Non-nested Tests on Measures of Neighborhood Quality. J Urban Econ 27:97-110
Elkins TH and B Hofmeister (1988) Berlin: The Spatial Structure of a Divided City. Methuen, London
26
26
Ellen IG, MH Schill, S Susin, and AE Schwartz (2001) Building Homes, Reviving Neighbourhoods: Spillovers from Subsidized Construction of Owner-Occupied Housing in New York City. J Housing Res 12:185-216
Galster G, P Tatian, and K Pettit (2004) Supportive Housing and Neighborhood Property Value Externalities. Land Econ 80:33-54
Gatzlaff DH and MT Smith (1993) The Impact of the Miami Metrorail on the Value of Residences Near Station Locations. Land Econ 69:54-66
Halvorsen R and R Palmquist (1980) The Interpretation of Dummy Variables in Semilogarithmic Equations. Am Econ Rev 70:474-475
Heikkila E, P Gordon, JI Kim, RB Peiser, HW Richardson, and D Dale-Johnson (1989) What Happened to the CBD-Distance Gradient?: Land Values in a Policentric City. Envir Plan 21:221–232
Isakson HR (1997) An Empirical Analysis of the Determinants of the Value of Vacant Land. J Real Est Res 13:103-114
Jordaan AC, BE Drost, and MA Makgata (2004) Land Value as a Function of Distance from the CBD : The Case of the Eastern Suburbs of Pretoria. South African J Econ Man Sci 7:532-541
Meyer U (1997) Betreten erbeten. Max-Schemeling-Arena in Berlin-Prenzlauer Berg. Bauwelt:1678-1684
Mills ES and R Simenauer (1996) New Hedonic Estimates of Regional Constant Quality House Prices. J Urban Econ 39:209-215
Mitchell DM (2000) School Quality and Housing Values. J Econ 26:53-68
Muellbauer J (1974) Household Production Theory, Quality, and the "Hedonic Technique". Am Econ Rev 64:977-994
Munneke HJ and BA Slade (2001) A Metropolitan Transaction-Based Commercial Price Index: A Time-Varying Parameter Approach. Real Est Econ 29:55-85
Myerson J and J Hudson (2000) International Interiors. Laurence King, London
27
27
Noll RG and A Zimbalist (1997) Sports, Jobs and Taxes: Are New Stadiums Worth the Cost? Brookings Rev 15:35-39
Perrault D and A Ferré (2002) Dominique Perrault - Nature-Architecture : Velodrom and Swimming Arena, Berlin. Actar, Barcelona
Polensky T (1974) Die Bodenpreise in Stadt und Region München : räumliche Strukturen und Prozessabläufe. Lassleben, Kallmünz
Redding SJ and DM Sturm (2008) The Cost of Remoteness: Evidence from German Division and Reunification. Am Econ Rev (in press)
Rosen S (1974) Hedonic Prices and Implicit Markets : Product Differentiation in Pure Competition. J Pol Econ 82:34-55
Rosentraub MS (1997) The Myth and the Reality of the Economic Development from Sports. Real Est Iss 22:24-29
Senatsverwaltung für Stadtentwicklung Berlin (2006a) Bodenrichtwertatlas 2006. Berlin
Senatsverwaltung für Stadtentwicklung Berlin, 2006b, Urban and Environmental Information System
Senatsverwaltung für Wirtschaft Arbeit und Frauen (2004) Zentrenatlas Wirtschaftsstandort Berlin (2. ed.). Regioverlag, Berlin
Siegfried J and A Zimbalist (2006) The Economic Impact of Sports Facilities, Teams and Mega-Events. Australian Econ Rev 39:420-427
Tu CC (2005) How Does a New Sports Stadium Affect Housing Values? The Case of FedEx Field. Land Econ 81:379-395
Zaretsky A, M. (2001) Should Cities Pay for Sports Facilities? Reg Economist 2001
28
28
s
Fig
ure
1 –
Sta
ndar
d La
nd V
alue
s 20
06
Not
es:
Map
wa
s cr
eat
ed o
n th
e b
ase
of t
he "
City
and
Env
iron
men
t In
form
atio
n S
yste
m”
of t
he S
ena
te D
epa
rtm
ent.
(K
art
eng
rund
lage
: In
form
atio
nss
yste
m S
tad
t und
Um
we
lt de
r S
enat
sve
rwal
tung
für
Sta
dten
twic
klun
g)
29
29
Figure 2 – Employment Potentiality in Berlin
Source: (Ahlfeldt, 2007).
30
30
Figure 3a – Spatial Dependence with 3000 meter Specification
Notes: LOG(LV2006) are natural logarithms of the standard land values of Berlin for 2006. W_LOG(LV2006) are the corresponding spatial lag values calculated on the basis of the respective spatial weight matrix. The corresponding Moran’s I test statistics is 0.7051.
31
31
Figure 3b – Spatial Dependence with 3 Nearest Blocks Specification
Notes: LOG(LV2006) are natural logarithms of the standard land values of Berlin for 2006. W_LOG(LV2006) are the corresponding spatial lag values calculated on the basis of the respective spatial weight matrix. The corresponding Moran’s I test statistics is 0.9346.
32
32
Figure 4 – Gridded Residual Surface of Spatially Extended Model
33
33
Fig
ure
5 –
Est
imat
ed Im
pact
of V
elod
rom
and
Max
-Schm
elin
g-A
rena
on
Sta
ndar
d La
nd V
alue
s
Not
es:
The
gra
phs
disp
laye
d in
this
fig
ure
are
the
gra
phi
cal i
llust
ratio
ns
of c
oe
ffici
ent e
stim
ate
s re
pre
sen
ted
in ta
ble
5.
34
34
Fig
ure
6 –
Est
imat
ed Im
pact
of V
elod
rom
and
Max
-Schm
elin
g-A
rena
on
Sta
ndar
d La
nd V
alue
s
Not
es:
Thi
s p
lot r
epre
sen
ts th
e g
ridd
ed s
urf
ace
of r
esi
dual
s’ d
iffe
ren
ces
bet
we
en
our
hed
oni
c b
ase
line
sp
eci
ficat
ion
and
the
fina
l im
pac
t mod
el.
It
cove
rs th
e e
stim
ate
d a
rea
of i
mp
act f
or
both
are
na
s. C
oord
ina
tes
are
giv
en in
pro
ject
ed m
ete
r un
its o
f the
“S
old
ner”
coo
rdin
ate
sys
tem
wh
ich
is u
sed
by
the
Sen
ate
De
part
me
nt o
f Be
rlin.
T
he
orig
in o
f th
is c
oo
rdin
ate
syst
em
is th
e m
ost
so
utw
est
ern
poi
nt o
f Be
rlin.
35
35
Table 1 – Description of Variables and Abbreviations
Variable Description
Business Dummy-variable; 1 for blocks where a considerable amount of retail and/or office activity takes place
Industry Dummy-variable; 1 for blocks where land is at least partially used for industrial purposes
West Dummy-variable; 1 for blocks lying within the area of former West-Berlin FSI Floor-Space-Index: Quotient of full storey-area and plot-area FSI² Floor-Space-Index squared Dist_Cent Shortest great circle distance to CBD East or West in meters Dist_Metro Great circle distance to next metro-station in meters Dist_Suburban Great circle distance to next suburban railway-station in meters Dist_Water Great circle distance to next water space in meters (lake or river) Dist_Schools Great circle distance to next school in meters Dist_Play Great circle distance to next playground in meters Dist_Rail Great circle distance to over-ground railway tracks in meters Pop_Prop_Sub6 Proportion of population below the age of 6 Pop_Prop_6_15 Proportion of population of age group: 6 to 15 years Pop_Prop_15_18 Proportion of population of age group: 15 to 18 years Pop_Prop_18_27 Proportion of population of age group: 18 to 27 years Pop_Prop_65plus Proportion of population above the age of 65 Pop_Density Population density (inhabitants per square meter) Prop_Foreigners Proportion of foreign population Prop_Male Proportion of male population Spatial_Lag Spatial autoregressive term as described in the methodology section STRUCT Vector of structural characteristics including FSI and FSI²
LOC Vector of locatioal characteristics including Dist_Cent, Dist_Metro, Dist_Suburban, Dist_Water, Dist_Schools, Dist_Play, Dist_Rail
NEIGH
Vector of neighbourhood characteristics including Pop_Prop_Sub6, Pop_Prop_6_15, Pop_Prop_15_18, Pop_Prop_18_27, Pop_Prop_65plus, Pop_Density, Prop_Foreigners, Prop_Male
36
36
Table 2 – Baseline Empirical Results of Hedonic Analysis (1-3)
(1) (2) (3) Land Value
(Log) Land Value
(Log) Land Value
(Log)
Intercept 1.419380*** (0.067685)
1.409932*** (0.069337)
4.770188*** (0.013161)
Business -0.476554***
(0.178338) -0.555828***
(0.206850) 0.049848
(0.226227)
Industry -0.201496***
(0.052465) -0.659793***
(0.184922) -0.483550***
(0.072417)
West 0.677466*** (0.038296)
0.678161*** (0.041387)
2.105208*** (0.032986)
FSI 0.241159*** (0.016054)
0.250090*** (0.015889)
0.702962*** (0.014560)
FSI² -0.025354***
(0.005085) -0.030463***
(0.004964) -0.056465***
(0.005059)
Dist_Cent -0.00000438*** (0.000000587)
-0.00000444*** (0.000000599)
-0.0000179*** (0.00000084)
Dist_Metro -0.00000211*** (0.000000625)
-0.000018*** (0.000000659)
-0.00000865*** (0.00000118)
Dist_Suburban -0.0000113*** (0.00000341)
-0.0000104*** (0.00000362)
-0.0000485*** (0.00000392)
Dist_Water -0.0000118*** (0.00000201)
-0.0000113*** (0.000002)
-0.0000415*** (0.00000253)
Dist_Schools 0.000000299
(0.0000041)
Dist_Play -0.0000019
(0.00000302)
Dist_Rail 0.0000122*** (0.00000327)
0.0000117*** (0.0000034)
0.0000468*** (0.0000042)
Pop_Prop_Sub6 0.062190** (0.025417)
0.054859** (0.025282)
0.103997** (0.051869)
Pop_Prop_6_15 0.006943
(0.019842)
Pop_Prop_15_18 -0.006325
(0.024015)
Pop_Prop_18_27 -0.046841***
(0.0057) -0.040212** (0.019973)
-0.235991*** (0.034376)
Pop_Prop_65plus -0.026906**
(0.013406)
Pop_Density -0.737185***
(0.0012) -0.705164***
(0.225787) -0.846712***
(0.253823)
Prop_Foreigners -0.085958***
(0.018556) -0.059999* (0.035007)
-0.096806*** (0.030934)
Prop_Male 0.006376
(0.017495)
Business x FSI 0.355788*** (0.104214)
0.371846*** (0.110039)
0.138966 (0.129089)
Business x FSI² -0.030011* (0.015922)
-0.027947* (0.016820)
0.024650 (0.019060)
Business x Dist_Cent 0.0000499*** (0.00000637)
0.0000534*** (0.00000699)
0.0000783*** (0.0000114)
Business x Dist_Metro -0.0000304* (0.0000161)
-0.0000435** (0.0000167)
-0.000119*** (0.0000187)
37
37
Table 2 – Baseline Empirical Results of Hedonic Analysis (2-3)
Business x Dist_Suburban -0.000064* (0.0000347)
-0.0000927* (0.0000532)
-0.000188*** (0.0000442)
Business x Dist_Water 0.0000402*** (0.0000127)
0.0000430*** (0.0000129)
0.0000240 (0.0000153)
Business x Dist_Schools -0.00000580
(0.0000806)
Business x Dist_Play -0.0000188
(0.0000885)
Business x Dist_Rail 0.0000512
(0.0000498)
Business x Pop_Prop_Sub6 -0.235726
(0.202178)
Business x Pop_Prop_6_15 -0.577296** (0.273710)
-0.476419 (0.315174)
-0.864808*** (0.256952)
Business x Pop_Prop_15_18 -0.105855
(0.353263)
Business x Pop_Prop_18_27 -0.288284***
(0.102699) -0.228749** (0.100348)
-0.421970* (0.244511)
Business x Pop_Prop_65plus 0.178150
(0.139387)
Business x Pop_Density -2.547692***
(0.907527) -2.555855***
(0.882346) -2.082144* (1.211372)
Business x Prop_Foreigners 0.188215*** (0.058839)
0.182792*** (0.068185)
0.360568*** (0.107345)
Business x Prop_Male -0.014353
(0.089939)
Industry x FSI 0.103909
(0.137109)
Industry x FSI² 0.018786
(0.031367)
Industry x Dist_Cent 0.0000161**
(0.00000693)
Industry x Dist_Metro 0.0000401
(0.0000285)
Industry x Dist_Suburban -0.0000862** (0.0000339)
-0.0000768* (0.0000456)
-0.0000303 (0.0000407)
Industry x Dist_Water -0.00000984
(0.0000211)
Industry x Dist_Schools -0.000180* (0.000105)
-0.000111 (0.000107)
0.0000422 (0.000150)
Industry x Dist_Play 0.000354*** (0.000117)
0.000240* (0.000126)
0.000281* (0.000167)
Industry x Dist_Rail 0.0000387
(0.0000645)
Industry x Pop_Prop_Sub6 0.780610** (0.352927)
0.530378 (0.361221)
0.204225 (0.408747)
Industry x Pop_Prop_6_15 0.050427
(0.390445)
Industry x Pop_Prop_15_18 0.018953
(0.200147)
Industry x Pop_Prop_18_27 0.344214** (0.352927)
0.312817** (0.129166)
0.469512*** (0.160178)
Industry x Pop_Prop_65plus -0.098714
(0.126594)
38
38
Table 2 – Baseline Empirical Results of Hedonic Analysis (3-3)
Industry x Pop_Density 2.107667
(2.572701)
Industry x Prop_Foreigners -0.077971
(0.078824)
Industry x Prop_Male 0.140772
(0.089877)
West x FSI -0.268710***
(0.020125) -0.263000***
(0.020561) -0.851855***
(0.023213)
West x FSI² 0.039513*** (0.004624)
0.038739*** (0.004887)
0.121320*** (0.006546)
West x Dist_Cent -0.0000317*** (-0.00000194)
-0.0000319*** (0.00000196)
-0.000103*** (0.00000193)
West x Dist_Metro 0.0000236*** (0.00000186)
0.0000236*** (0.00000198)
0.0000727*** (0.00000309)
West x Dist_Suburban -0.00000769* (0.00000398)
-0.00000815* (0.00000421)
-0.0000322*** (0.00000556)
West x Dist_Water 0.00000979*** (0.00000236)
0.00000963*** (0.00000234)
0.000038*** (0.00000359)
West x Dist_Schools 0.00000277
(0.00000764)
West x Dist_Play 0.0000497***
(0.00000863)
West x Dist_Rail -0.0000302*** (0.00000430)
-0.0000307*** (0.00000445)
-0.0000842*** (0.00000682)
West x Pop_Prop_Sub6 0.032696
(0.052924)
West x Pop_Prop_6_15 -0.028291
(0.034885)
West x Pop_Prop_15_18 -0.156947***
(0.040899) -0.145205***
(0.048004) -0.432046***
(0.093982)
West x Pop_Prop_18_27 -0.035878
(0.041474)
West x Pop_Prop_65plus 0.020985
(0.024180)
West x Pop_Density -0.595791***
(0.297937) -0.549493* (0.302441)
-3.295263*** (0.404408)
West x Prop_Foreigners -0.032307
(0.041970)
West x Prop_Male -0.134591***
(0.025066) -0.141145***
(0.032014) -0.311987***
(0.047581)
Spatial_Lag Yes Yes Block Sample Berlin Berlin Berlin Observations 11184 11184 11184 R² 0.966127 0.966472 0.893846 Adjusted R² 0.966002 0.966255 0.893465
Model (1) is our baseline hedonic model, which we obtain after stepwise deletion of statistically insignificant variables of model (2). In (3) we repeat our baseline regression omitting the spatial lag-variable. The dependent variable is the natural logarithm of standard land values in all models. Independent variables are described in Table 1. Standard errors (in parentheses) are heteroscedasticity robust. * denotes significance at the 10% level; ** denotes significance at the 5% level; *** denotes significance at the 1% level.
39
39
Table 3 – Empirical Results of Baseline Impact-Models
(1) (2) (3) Land Value
(Log) Land Value
(Log) Land Value
(Log)
Impact Area Velodrom Max-Schmeling Velodrom Max-Schmeling
0-1000 m 0.076287*** (0.018011)
-0.014916 (0.019143)
0.047019*** (0.002779)
-0.025293 (0.018605)
1000-2000 m 0.037178*** (0.012739)
0.035705*** (0.012628)
0.020877*** (0.011617)
0.025153*** (0.011895)
2000-3000 m 0.002686
(0.013498) -0.005757 (0.013051)
0.013639* (0.212798)
-0.004855 (0.013132)
3000-4000 m 0.009350
(0.010437) -0.018397 (0.012352)
0.007239 (0.010420)
-0.014858 (0.012130)
Neighbourhood -0.013436* (0.007272)
-0.033593*** (0.007023)
-0.017581** (0.007344)
-0.030855*** (0.006849)
Spatial Lag Yes Yes Yes Block Sample Berlin Berlin Berlin Observations 11184 11184 11184 R-squared 0.966402 0.966168 0.966329
Notes: The basic model is the same as in (1) of Table 2. To reduce the table size we only display variables indicating impact of either Velodrom or Max-Schmeling-Arena. Log of standard land values is the endogenous variable in models (1) – (3). 0-1000 m, 1000-2000 m, 2000-3000 m, 3000-4000 m are dummy-variables taking the value of 1 for blocks lying within corresponding one kilometre distance rings surrounding the respective arena, and 0 otherwise. Neighbourhood is defined in a similar way, capturing general neighbourhood effects within 0-5000 m distance. In (1) impact variables for both arenas entered the model simultaneously while in (2) and (3) impact of each arena is estimated individually. Standard errors (in parentheses) are heteroscedasticity robust. * denotes significance at the 10% level; ** denotes significance at the 5% level; *** denotes significance at the 1% level.
40
40
Table 4a – Empirical Results of Alternative Models for Velodrom
(1) (2) (3) Land Value
(Log) Land Value
(Log) Land Value
(Log)
Impact Area Velodrom Velodrom Velodrom
0-1000 m 0.073995*** (0.019412)
1000-2000 m 0.034716** (0.012383)
0-3000 m -0.001965 (0.012383)
0.075524*** (0.021105)
0.121969*** (0.036593)
0-3000 m x Distance -0.0000289***
(0.00000934) -0.0000893** (0.0000422)
0-3000 m x Distance² 0.0000000165
(0.0000000112)
Spatial Lag Yes Yes Yes Neighbourhood-Effects Yes Yes Yes Block Sample Berlin Berlin Berlin Observations 11184 11184 11184 R² 0.966398 0.966377 0.966384
Notes: The basic model is the same as in (1) of Table 1. We capture the effects of Max-Schmeling-Arena by introducing the full set of dummy-variables represented in column (3) of Table 3. To reduce the table size we only display variables indicating impact of Velodrom. Log of standard land values is the endogenous variable as in the tables above. 0-1000m, 1000-2000m, and 0-3000 m are dummy-variables representing multiple distance rings as defined as in Table 3. Distance is defined as the distance from each blocks centroid to the corresponding arena, in meters. Neighbourhood effects are defined as in Table 3. Standard errors (in parentheses) are heteroscedasticity robust. * denotes significance at the 10% level; ** denotes significance at the 5% level; *** denotes significance at the 1% level.
41
41
Table 4b – Empirical Results of Alternative Models for Max-Schmeling-Arena
(1) (2) (3) Land Value
(Log) Land Value
(Log) Land Value
(Log)
Impact Area Max-Schmeling Max-Schmeling Max-Schmeling
0-1000 m -0.009482 (0.021002)
1000-2000 m 0.041065*** (0.015273)
0-3000 m 0.003211
(0.013001) 0.030773
(0.023960) -0.049672 0.041028
0-3000 m x Distance -0.00000718
(0.0000111) 0.000100** (0.0000505)
0-3000 m x Distance² -0.0000000301**
(0.0000000147)
Spatial Lag Yes Yes Yes Neighbourhood-Effects Yes Yes Yes Block Sample Berlin Berlin Berlin Observations 11184 11184 11184 R² 0.966390 0.966342 0.966365
Notes: The basic model is the same as in (1) of Table 2. We capture effects of Velodrom by introducing the full set of dummy-variables represented in column (2) of Table 3. To reduce the table size we only display variables indicating impact of Max-Schmeling-Arena. All variables are the same as in Table 4a. Standard errors (in parentheses) are heteroscedasticity robust. * denotes significance at the 10% level; ** denotes significance at the 5% level; *** denotes significance at the 1% level.
42
42
Table 5 – Empirical Results of Final Hedonic Specification
(1) Land Value
(Log)
Impact Area Velodrom Max-Schmeling
0-3000 m 0.073160*** (0.021013)
0-3000 m x Distance -0.0000276*** (0.00000953)
0.0000459** (0.0000206)
0-3000 m x Distance² -0.0000000164**
(0.00000000826)
Spatial Lag Yes Neighbourhood-Effects Yes Block Sample Berlin Observations 11.184 R² 0.966337
Notes: The basic model is the same as in model (1) of Table 2. To reduce the table size we only display variables indicating impact of Velodrom and Max-Schmeling-Arena. All variables are the same as in Table 4. Standard errors (in parentheses) are heteroscedasticity robust. * denotes significance at the 10% level; ** denotes significance at the 5% level; *** denotes significance at the 1% level.