impact of oil price in gcc banking system 2016 - 2017
TRANSCRIPT
WP/16/161
The Impact of Oil Prices on the Banking System
in the GCC
by Padamja Khandelwal, Ken Miyajima, and Andre Santos
© 2016 International Monetary Fund WP/16/161
IMF Working Paper
Middle East and Central Asia Department
The Impact of Oil Prices on the Banking System in the GCC
Prepared by Padamja Khandelwal, Ken Miyajima, and Andre Santos1
Authorized for distribution by Tim Callen
August 2016
Abstract
This paper examines the links between global oil price movements and macroeconomic
and financial developments in the GCC. Using a range of multivariate panel approaches,
including a panel vector autoregression approach, it finds strong empirical evidence of
feedback loops between oil price movements, bank balance sheets, and asset prices.
Empirical evidence also suggests that bank capital and provisioning have behaved
countercyclically through the cycle.
JEL Classification Numbers: C63, E44, G21, G28
Keywords: Macro-financial linkages, nonperforming loans, panel vector autoregression
Author’s E-Mail Address: [email protected], [email protected], [email protected]
1 The authors thank Chikako Baba, Alberto Behar, Tim Callen, Sally Chen, Sean Craig, Phil De Imus, Mary
Goodman, Aasim Husain, Deniz Igan, Etibar Jafarov, Taline Koranchelian, Inutu Lukonga, Camelia Minoiu,
Erlend Nier, Marco Piñón, Ananthakrishnan Prasad, Damien Puy, Martin Sommer, James Walsh, and various
MCD seminar participants for helpful comments. All remaining errors and opinions expressed in this paper are
sole responsibility of the authors.
IMF Working Papers describe research in progress by the author(s) and are published to
elicit comments and to encourage debate. The views expressed in IMF Working Papers are
those of the author(s) and do not necessarily represent the views of the IMF, its Executive Board,
or IMF management.
Contents Page
Abstract ......................................................................................................................................2
I. Introduction ............................................................................................................................3
II. Econometric Analysis ...........................................................................................................6 A. Literature ......................................................................................................................6 B. Data ..............................................................................................................................7 C. A multivariate model of NPLs .....................................................................................8 D. A panel VAR model of oil-macro-financial linkages ................................................13
III. Movements in Bank capital and provisions in the GCC ....................................................16
IV. Concluding Remarks .........................................................................................................19
References ................................................................................................................................21
Tables
1. GCC: Dependence on Oil Revenues ......................................................................................4
2. GCC Size of the Financial System.........................................................................................4
3. Summary of Included GCC Banks ........................................................................................8
4. Determinants of Bank NPL Ratios in the GCC ...................................................................10
5. Determinants of Bank NPL Ratios in the GCC-Alternative Approach ...............................12
6. Determinants of Bank NPL Ratios in the GCC-Alternative Approach ...............................12
7. GCC: Estimated Panel VAR Coefficients and T-Statistics .................................................14
8. GCC: Response of Macro and Bank Level Variables .........................................................15
9. Correlation of NPL Provisions and Capital Ratios with Indicators of Business and
Financial Cycles: Country Level Analysis ..........................................................................17
10. Correlation of NPL Provisions and Capital Ratios with Indicators of Business and
Financial Cycles: Bank Level Analysis ...............................................................................18
Figures
1. WTI Oil Prices .......................................................................................................................3
2. Growth Rates of Bank Credit and Deposits in the GCC Countries .......................................5
3. Macroeconomic and Bank Level Variables ...........................................................................7
4. Distribution of NPL Ratios in GCC .......................................................................................9
5. Dynamics of NPL Ratios After a 50 Percent Decline in Oil Prices and 3 Percentage Point
Reduction in Nonoil GDP Growth in t=0 ............................................................................11
6. GCC: Response of Macro and Bank Level Variables .........................................................16
Annex
A1. GCC Banks Included Econometric Analyses ...................................................................20
3
I. INTRODUCTION
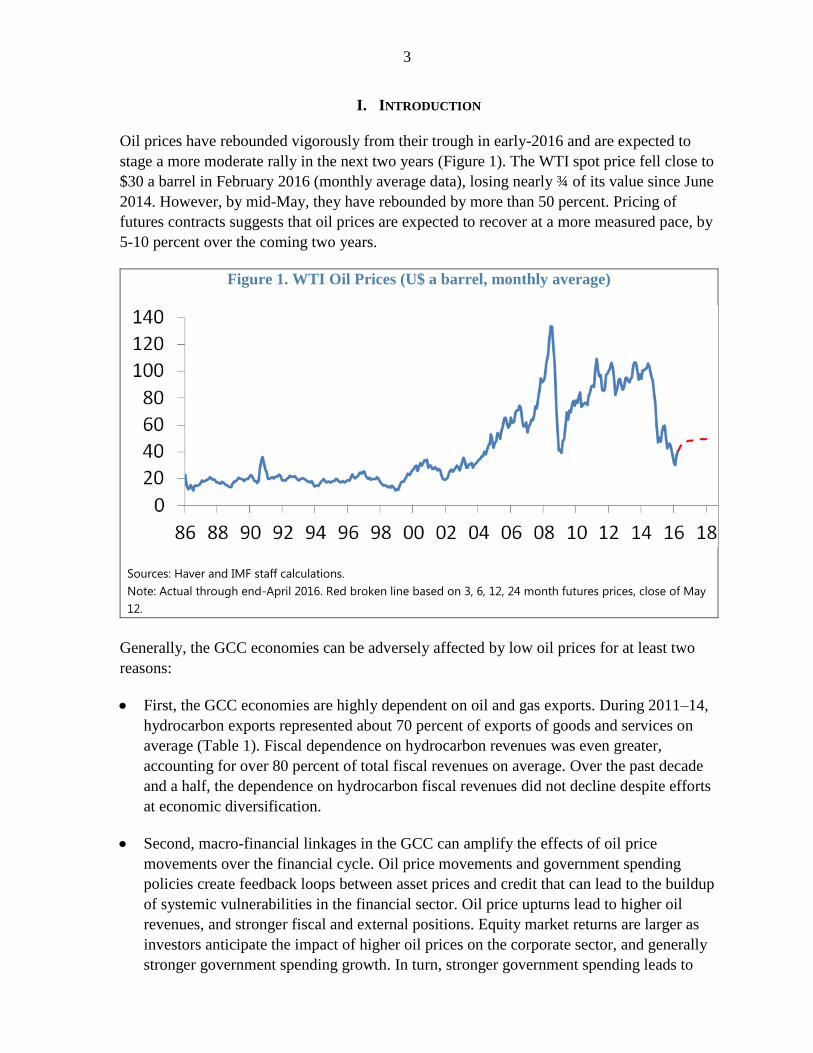
Oil prices have rebounded vigorously from their trough in early-2016 and are expected to
stage a more moderate rally in the next two years (Figure 1). The WTI spot price fell close to
$30 a barrel in February 2016 (monthly average data), losing nearly ¾ of its value since June
2014. However, by mid-May, they have rebounded by more than 50 percent. Pricing of
futures contracts suggests that oil prices are expected to recover at a more measured pace, by
5-10 percent over the coming two years.
Figure 1. WTI Oil Prices (U$ a barrel, monthly average)
Sources: Haver and IMF staff calculations.
Note: Actual through end-April 2016. Red broken line based on 3, 6, 12, 24 month futures prices, close of May
12.
Generally, the GCC economies can be adversely affected by low oil prices for at least two
reasons:
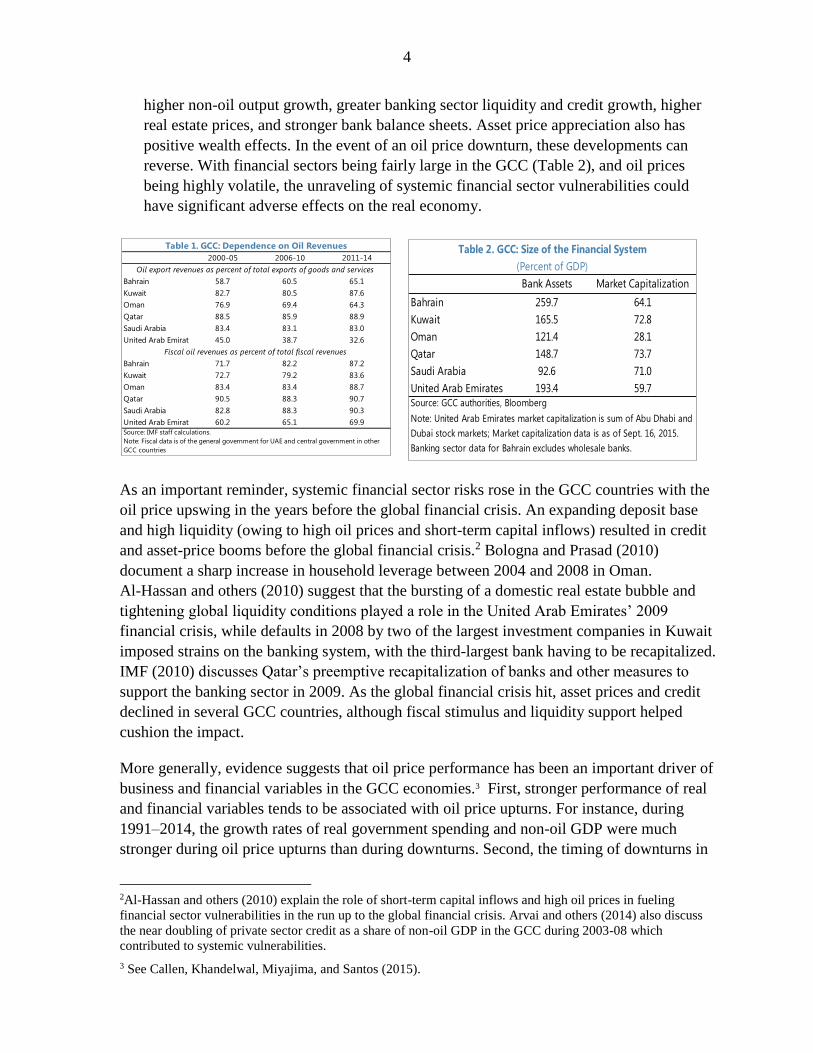
First, the GCC economies are highly dependent on oil and gas exports. During 2011–14,
hydrocarbon exports represented about 70 percent of exports of goods and services on
average (Table 1). Fiscal dependence on hydrocarbon revenues was even greater,
accounting for over 80 percent of total fiscal revenues on average. Over the past decade
and a half, the dependence on hydrocarbon fiscal revenues did not decline despite efforts
at economic diversification.
Second, macro-financial linkages in the GCC can amplify the effects of oil price
movements over the financial cycle. Oil price movements and government spending
policies create feedback loops between asset prices and credit that can lead to the buildup
of systemic vulnerabilities in the financial sector. Oil price upturns lead to higher oil
revenues, and stronger fiscal and external positions. Equity market returns are larger as
investors anticipate the impact of higher oil prices on the corporate sector, and generally
stronger government spending growth. In turn, stronger government spending leads to
4
higher non-oil output growth, greater banking sector liquidity and credit growth, higher
real estate prices, and stronger bank balance sheets. Asset price appreciation also has
positive wealth effects. In the event of an oil price downturn, these developments can
reverse. With financial sectors being fairly large in the GCC (Table 2), and oil prices
being highly volatile, the unraveling of systemic financial sector vulnerabilities could
have significant adverse effects on the real economy.
As an important reminder, systemic financial sector risks rose in the GCC countries with the
oil price upswing in the years before the global financial crisis. An expanding deposit base
and high liquidity (owing to high oil prices and short-term capital inflows) resulted in credit
and asset-price booms before the global financial crisis.2 Bologna and Prasad (2010)
document a sharp increase in household leverage between 2004 and 2008 in Oman.
Al-Hassan and others (2010) suggest that the bursting of a domestic real estate bubble and
tightening global liquidity conditions played a role in the United Arab Emirates’ 2009
financial crisis, while defaults in 2008 by two of the largest investment companies in Kuwait
imposed strains on the banking system, with the third-largest bank having to be recapitalized.
IMF (2010) discusses Qatar’s preemptive recapitalization of banks and other measures to
support the banking sector in 2009. As the global financial crisis hit, asset prices and credit
declined in several GCC countries, although fiscal stimulus and liquidity support helped
cushion the impact.
More generally, evidence suggests that oil price performance has been an important driver of
business and financial variables in the GCC economies.3 First, stronger performance of real
and financial variables tends to be associated with oil price upturns. For instance, during
1991–2014, the growth rates of real government spending and non-oil GDP were much
stronger during oil price upturns than during downturns. Second, the timing of downturns in
2Al-Hassan and others (2010) explain the role of short-term capital inflows and high oil prices in fueling
financial sector vulnerabilities in the run up to the global financial crisis. Arvai and others (2014) also discuss
the near doubling of private sector credit as a share of non-oil GDP in the GCC during 2003-08 which
contributed to systemic vulnerabilities.
3 See Callen, Khandelwal, Miyajima, and Santos (2015).
2000-05 2006-10 2011-14
Bahrain 58.7 60.5 65.1
Kuwait 82.7 80.5 87.6
Oman 76.9 69.4 64.3
Qatar 88.5 85.9 88.9
Saudi Arabia 83.4 83.1 83.0
United Arab Emirates 45.0 38.7 32.6
Bahrain 71.7 82.2 87.2
Kuwait 72.7 79.2 83.6
Oman 83.4 83.4 88.7
Qatar 90.5 88.3 90.7
Saudi Arabia 82.8 88.3 90.3
United Arab Emirates 60.2 65.1 69.9
Source: IMF staff calculations.
Oil export revenues as percent of total exports of goods and services
Table 1. GCC: Dependence on Oil Revenues
Fiscal oil revenues as percent of total fiscal revenues
Note: Fiscal data is of the general government for UAE and central government in other
GCC countries
Bank Assets Market Capitalization
Bahrain 259.7 64.1
Kuwait 165.5 72.8
Oman 121.4 28.1
Qatar 148.7 73.7
Saudi Arabia 92.6 71.0
United Arab Emirates 193.4 59.7
Source: GCC authorities, Bloomberg
Table 2. GCC: Size of the Financial System
Note: United Arab Emirates market capitalization is sum of Abu Dhabi and
Dubai stock markets; Market capitalization data is as of Sept. 16, 2015.
Banking sector data for Bahrain excludes wholesale banks.
(Percent of GDP)
5
business and financial variables in some cases coincides with that of oil prices. Contractions
in credit and equity markets reflected oil price movements, along with global financial
market developments and the underlying domestic vulnerabilities. Importantly, contractions
in real government spending occurred as often as real oil price downturns in the 1990s, but
less so since 2000, likely aided by greater fiscal buffers.
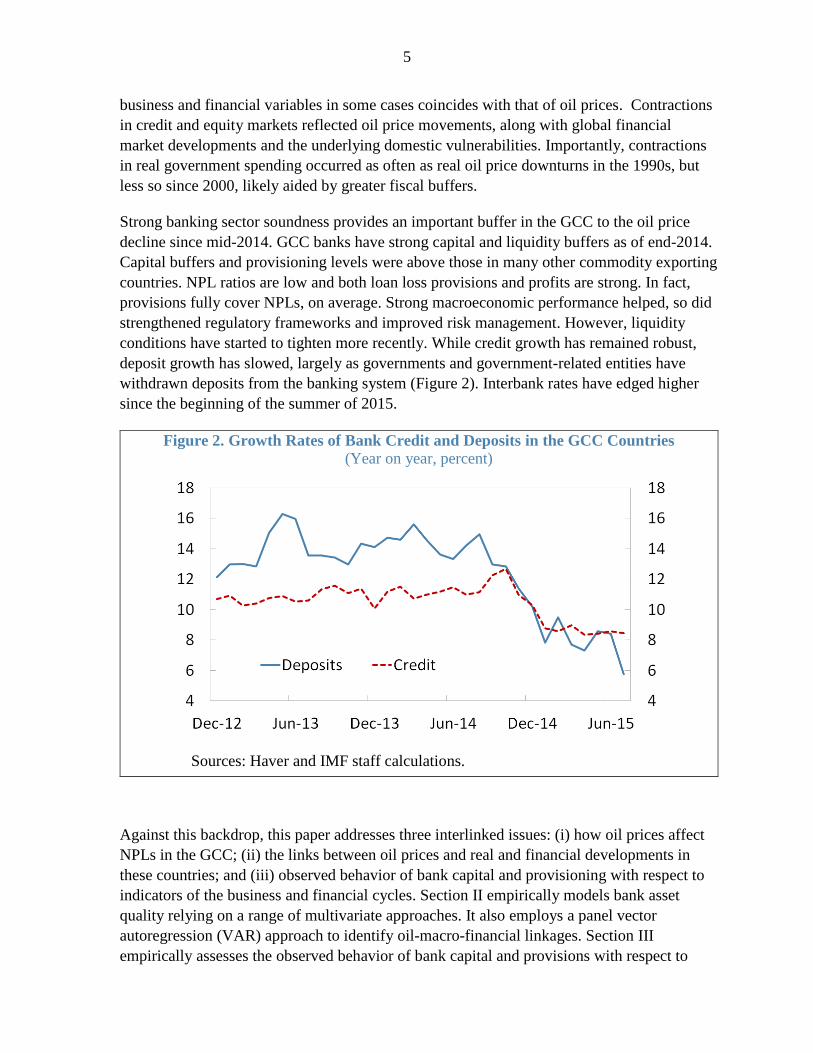
Strong banking sector soundness provides an important buffer in the GCC to the oil price
decline since mid-2014. GCC banks have strong capital and liquidity buffers as of end-2014.
Capital buffers and provisioning levels were above those in many other commodity exporting
countries. NPL ratios are low and both loan loss provisions and profits are strong. In fact,
provisions fully cover NPLs, on average. Strong macroeconomic performance helped, so did
strengthened regulatory frameworks and improved risk management. However, liquidity
conditions have started to tighten more recently. While credit growth has remained robust,
deposit growth has slowed, largely as governments and government-related entities have
withdrawn deposits from the banking system (Figure 2). Interbank rates have edged higher
since the beginning of the summer of 2015.
Figure 2. Growth Rates of Bank Credit and Deposits in the GCC Countries
(Year on year, percent)
Sources: Haver and IMF staff calculations.
Against this backdrop, this paper addresses three interlinked issues: (i) how oil prices affect
NPLs in the GCC; (ii) the links between oil prices and real and financial developments in
these countries; and (iii) observed behavior of bank capital and provisioning with respect to
indicators of the business and financial cycles. Section II empirically models bank asset
quality relying on a range of multivariate approaches. It also employs a panel vector
autoregression (VAR) approach to identify oil-macro-financial linkages. Section III
empirically assesses the observed behavior of bank capital and provisions with respect to
6
indicators of business and financial cycles. Section IV concludes and provides policy
recommendations. The analyses in this paper generally consider macroeconomic, banking,
and financial market data up to end-December 2014.
II. ECONOMETRIC ANALYSIS
Two related empirical models of oil-macro-financial linkages are estimated for the GCC
economies. A brief review of the literature and discussion of data are followed by estimation
of (i) a multivariate model to assess the impact of macroeconomic outcomes on bank asset
quality (NPLs), and (ii) a panel VAR model to investigate oil-macro-financial linkages.
A. Literature
Empirical studies on bank asset quality and macro-financial linkages have expanded to
include those of the Middle East and North Africa region. In the area of asset quality
assessment, Nkusu (2011) analyzes country-level data spanning 1998–2009 for 26 advanced
economies and confirms that adverse macroeconomic developments are associated with
rising NPLs. De Bock and Demyantes (2012) use country-level annual observations for
25 emerging markets during 1996–2010 and find that the NPL ratio increases when
economic growth declines, the exchange rate weakens, the terms of trade deteriorate and
debt-creating capital inflows decline. Klein (2013) uses data spanning 1998–2011 for the ten
largest banks in 16 countries (thus a total of 160 banks) in Central, Eastern and South-Eastern
Europe and finds that macroeconomic conditions are relatively more important than banks
specific factors in explaining NPLs.
Espinoza and Prasad (2010) represent the first attempt to model NPLs in the GCC countries
using both macroeconomic and bank-level data. Using data spanning 1995–2008 for about
80 banks in the GCC region, the authors find that the NPL ratio rises as economic growth
declines and both interest rates and risk aversion increase. Love and Ariss (2014) analyze a
panel of Egyptian banks over 1993–2010 and find that larger capital inflows and stronger
GDP growth improve bank loan portfolio quality. Many of the studies, but not all, also
investigate macro-financial linkages. Earlier work relies on macro-level data (Nkusu (2011),
De Bock and Demyantes (2012), Klein (2013)). Espinosa and Prasad (2010) study the GCC
economies and find a strong, albeit short-lived feedback effect from weaker bank balance
sheet conditions to economic activity. Studies applying a panel VAR approach to bank-level
data are emerging. Recent studies focusing on the Middle East and North Africa include
Love and Ariss (2014) for Egypt and Miyajima (2016) for Saudi Arabia.
7
B. Data
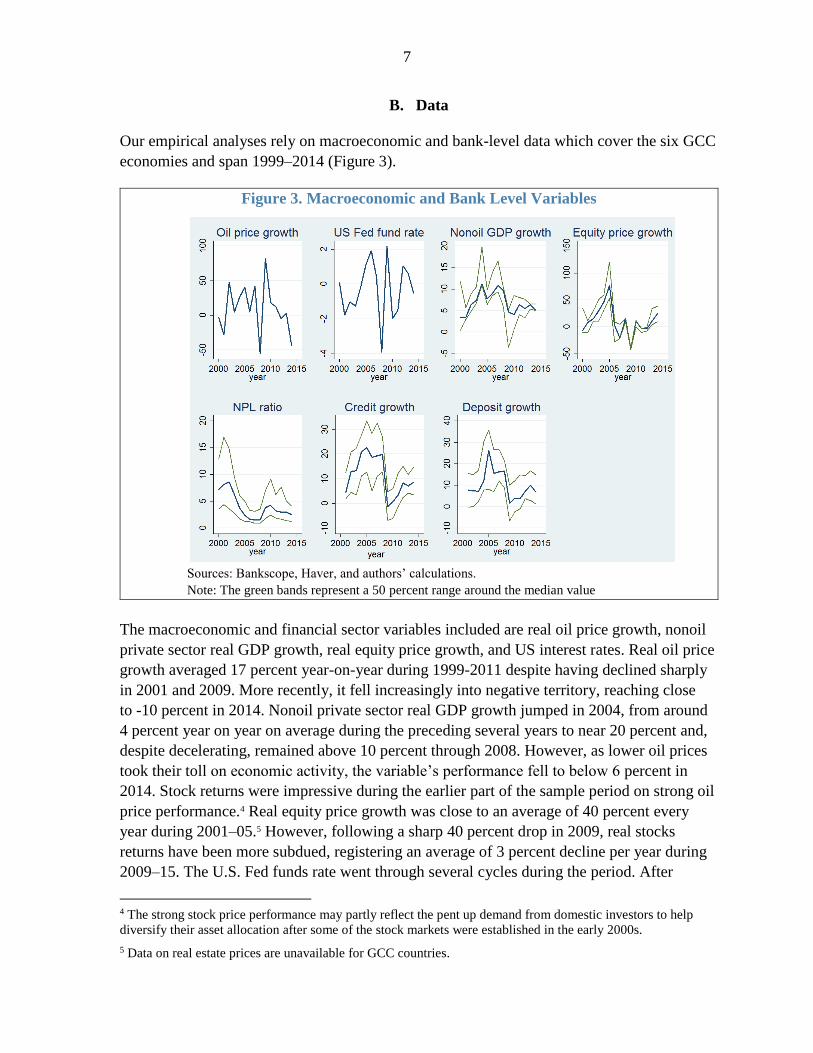
Our empirical analyses rely on macroeconomic and bank-level data which cover the six GCC
economies and span 1999–2014 (Figure 3).
Figure 3. Macroeconomic and Bank Level Variables
Sources: Bankscope, Haver, and authors’ calculations.
Note: The green bands represent a 50 percent range around the median value
The macroeconomic and financial sector variables included are real oil price growth, nonoil
private sector real GDP growth, real equity price growth, and US interest rates. Real oil price
growth averaged 17 percent year-on-year during 1999-2011 despite having declined sharply
in 2001 and 2009. More recently, it fell increasingly into negative territory, reaching close
to -10 percent in 2014. Nonoil private sector real GDP growth jumped in 2004, from around
4 percent year on year on average during the preceding several years to near 20 percent and,
despite decelerating, remained above 10 percent through 2008. However, as lower oil prices
took their toll on economic activity, the variable’s performance fell to below 6 percent in
2014. Stock returns were impressive during the earlier part of the sample period on strong oil
price performance.4 Real equity price growth was close to an average of 40 percent every
year during 2001–05.5 However, following a sharp 40 percent drop in 2009, real stocks
returns have been more subdued, registering an average of 3 percent decline per year during
2009–15. The U.S. Fed funds rate went through several cycles during the period. After
4 The strong stock price performance may partly reflect the pent up demand from domestic investors to help
diversify their asset allocation after some of the stock markets were established in the early 2000s.
5 Data on real estate prices are unavailable for GCC countries.
8
increasing through 2000, it declined sharply in 2001. It rose during 2004–06, and declined
sharply in 2008 and remained unchanged through 2014.
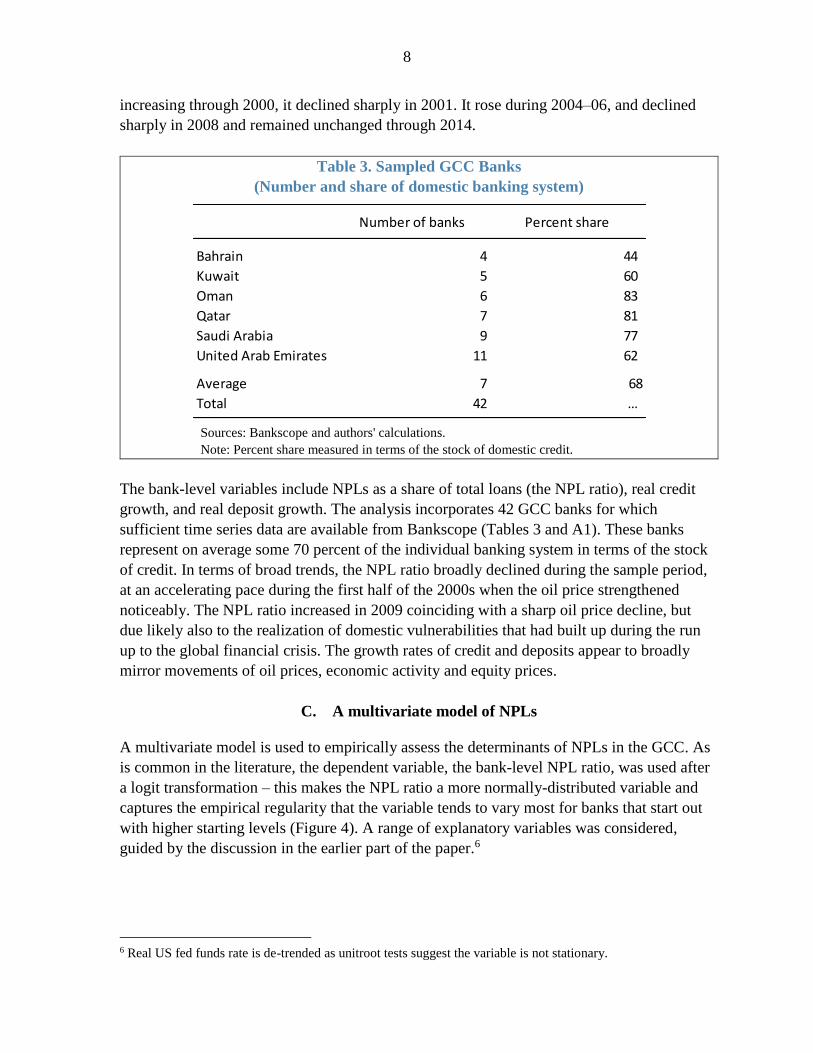
Table 3. Sampled GCC Banks
(Number and share of domestic banking system)
Sources: Bankscope and authors' calculations.
Note: Percent share measured in terms of the stock of domestic credit.
The bank-level variables include NPLs as a share of total loans (the NPL ratio), real credit
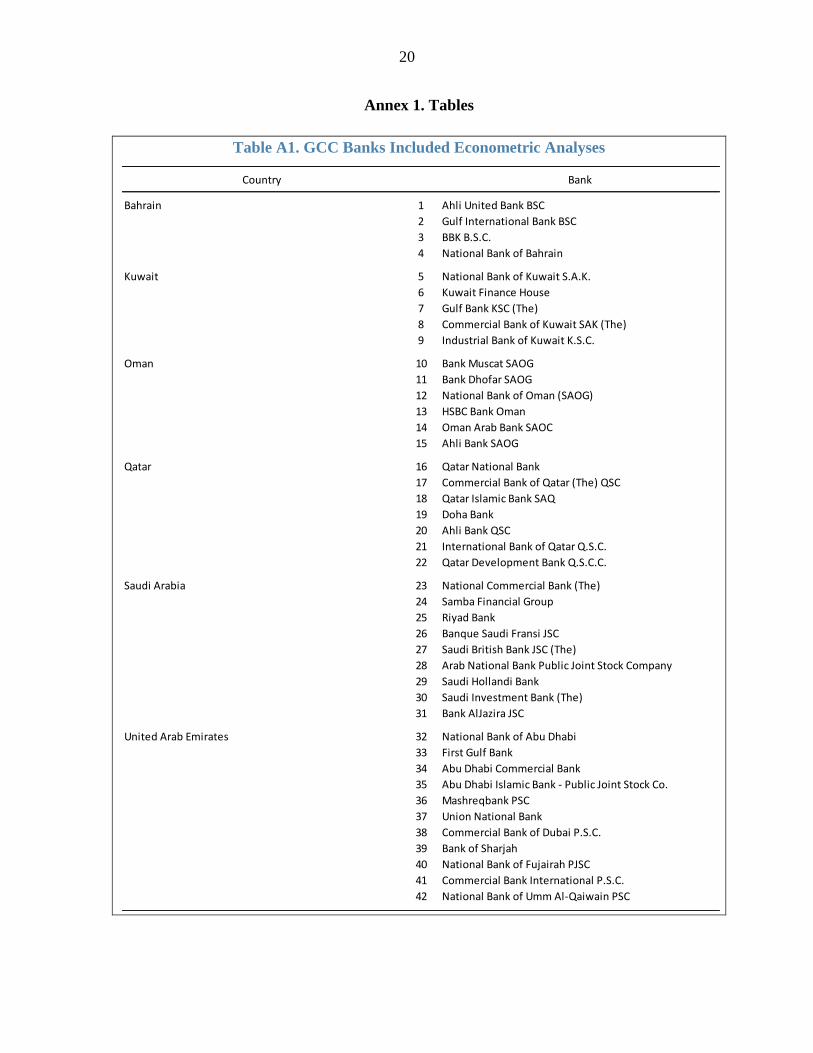
growth, and real deposit growth. The analysis incorporates 42 GCC banks for which
sufficient time series data are available from Bankscope (Tables 3 and A1). These banks
represent on average some 70 percent of the individual banking system in terms of the stock
of credit. In terms of broad trends, the NPL ratio broadly declined during the sample period,
at an accelerating pace during the first half of the 2000s when the oil price strengthened
noticeably. The NPL ratio increased in 2009 coinciding with a sharp oil price decline, but
due likely also to the realization of domestic vulnerabilities that had built up during the run
up to the global financial crisis. The growth rates of credit and deposits appear to broadly
mirror movements of oil prices, economic activity and equity prices.
C. A multivariate model of NPLs
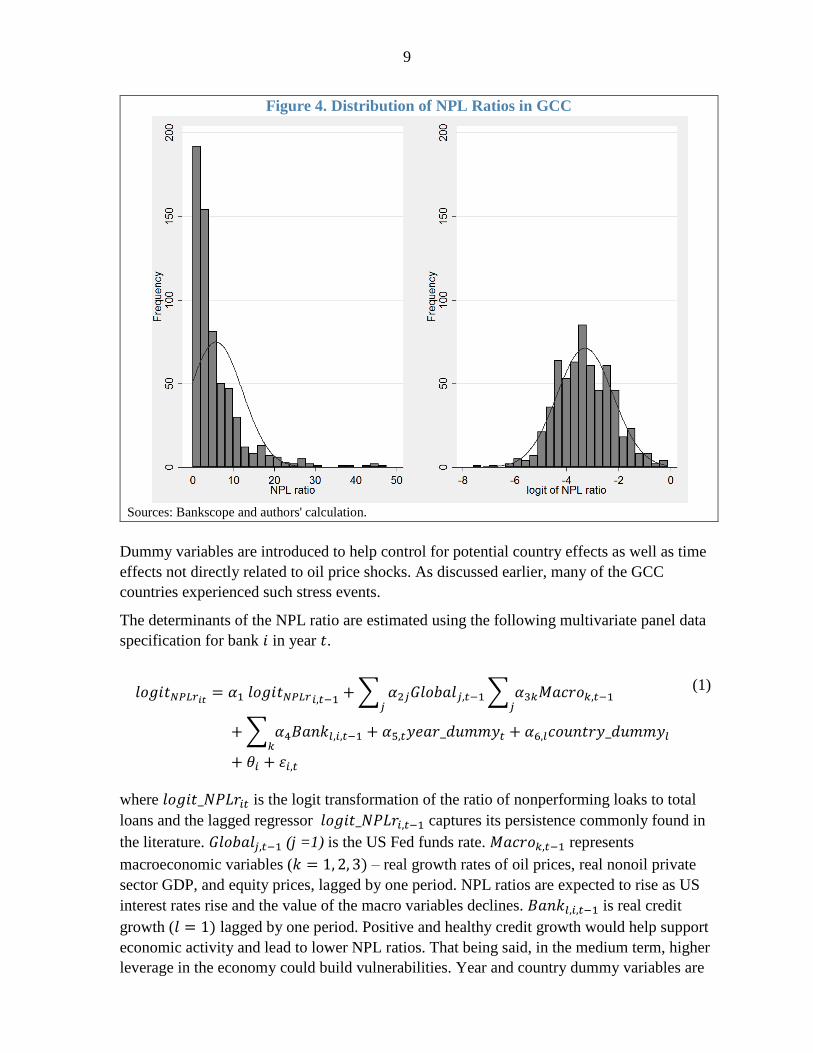
A multivariate model is used to empirically assess the determinants of NPLs in the GCC. As
is common in the literature, the dependent variable, the bank-level NPL ratio, was used after
a logit transformation – this makes the NPL ratio a more normally-distributed variable and
captures the empirical regularity that the variable tends to vary most for banks that start out
with higher starting levels (Figure 4). A range of explanatory variables was considered,
guided by the discussion in the earlier part of the paper.6
6 Real US fed funds rate is de-trended as unitroot tests suggest the variable is not stationary.
Number of banks Percent share
Bahrain 4 44
Kuwait 5 60
Oman 6 83
Qatar 7 81
Saudi Arabia 9 77
United Arab Emirates 11 62
Average 7 68
Total 42 …
9
Figure 4. Distribution of NPL Ratios in GCC
Sources: Bankscope and authors' calculation.
Dummy variables are introduced to help control for potential country effects as well as time
effects not directly related to oil price shocks. As discussed earlier, many of the GCC
countries experienced such stress events.
The determinants of the NPL ratio are estimated using the following multivariate panel data
specification for bank 𝑖 in year 𝑡.
𝑙𝑜𝑔𝑖𝑡𝑁𝑃𝐿𝑟𝑖𝑡= 𝛼1 𝑙𝑜𝑔𝑖𝑡𝑁𝑃𝐿𝑟𝑖,𝑡−1
+ ∑ 𝛼2𝑗𝐺𝑙𝑜𝑏𝑎𝑙𝑗,𝑡−1𝑗
∑ 𝛼3𝑘𝑀𝑎𝑐𝑟𝑜𝑘,𝑡−1𝑗
+ ∑ 𝛼4𝐵𝑎𝑛𝑘𝑙,𝑖,𝑡−1𝑘
+ 𝛼5,𝑡𝑦𝑒𝑎𝑟_𝑑𝑢𝑚𝑚𝑦𝑡 + 𝛼6,𝑙𝑐𝑜𝑢𝑛𝑡𝑟𝑦_𝑑𝑢𝑚𝑚𝑦𝑙
+ 𝜃𝑖 + 𝜀𝑖,𝑡
(1)
where 𝑙𝑜𝑔𝑖𝑡_𝑁𝑃𝐿𝑟𝑖𝑡 is the logit transformation of the ratio of nonperforming loaks to total
loans and the lagged regressor 𝑙𝑜𝑔𝑖𝑡_𝑁𝑃𝐿𝑟𝑖,𝑡−1 captures its persistence commonly found in
the literature. 𝐺𝑙𝑜𝑏𝑎𝑙𝑗,𝑡−1 (j =1) is the US Fed funds rate. 𝑀𝑎𝑐𝑟𝑜𝑘,𝑡−1 represents
macroeconomic variables (𝑘 = 1, 2, 3) – real growth rates of oil prices, real nonoil private
sector GDP, and equity prices, lagged by one period. NPL ratios are expected to rise as US
interest rates rise and the value of the macro variables declines. 𝐵𝑎𝑛𝑘𝑙,𝑖,𝑡−1 is real credit
growth (𝑙 = 1) lagged by one period. Positive and healthy credit growth would help support
economic activity and lead to lower NPL ratios. That being said, in the medium term, higher
leverage in the economy could build vulnerabilities. Year and country dummy variables are
10
introduced in the regressions to control for events other than oil price developments that
potentially led to an increase in NPL ratios and potential country effects. 𝜃𝑖 and 𝜀𝑖,𝑡 are bank
fixed effects and random errors.
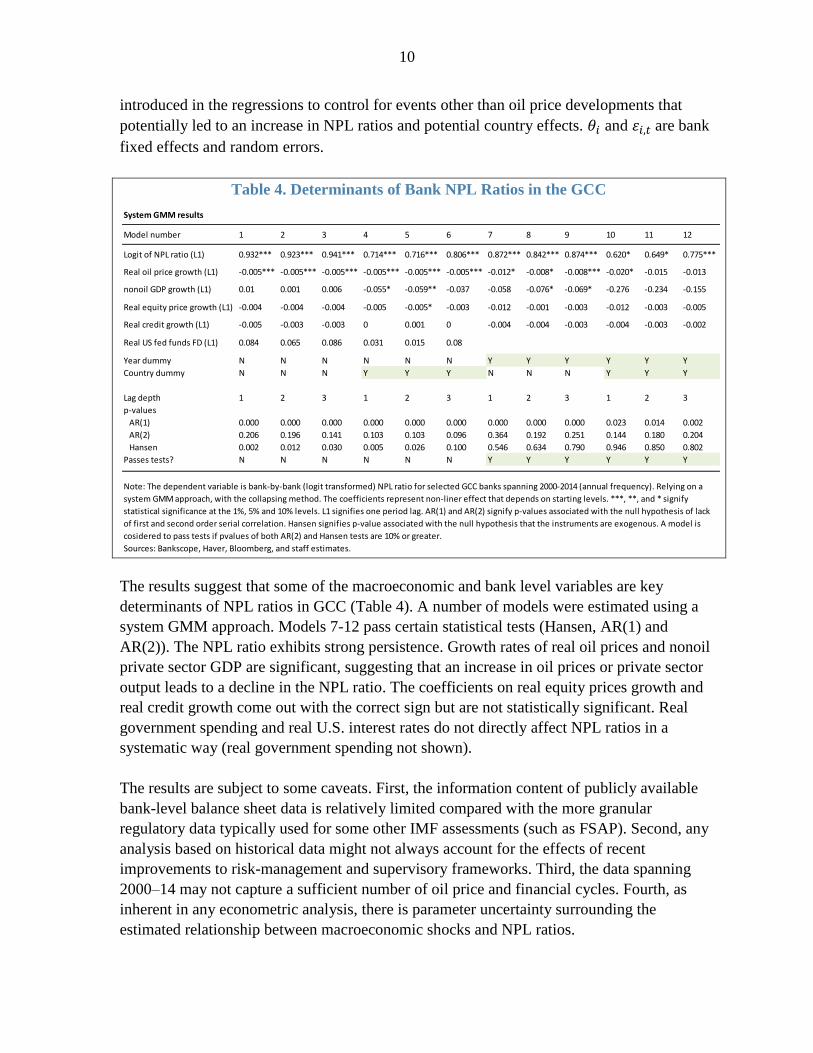
Table 4. Determinants of Bank NPL Ratios in the GCC
The results suggest that some of the macroeconomic and bank level variables are key
determinants of NPL ratios in GCC (Table 4). A number of models were estimated using a
system GMM approach. Models 7-12 pass certain statistical tests (Hansen, AR(1) and
AR(2)). The NPL ratio exhibits strong persistence. Growth rates of real oil prices and nonoil
private sector GDP are significant, suggesting that an increase in oil prices or private sector
output leads to a decline in the NPL ratio. The coefficients on real equity prices growth and
real credit growth come out with the correct sign but are not statistically significant. Real
government spending and real U.S. interest rates do not directly affect NPL ratios in a
systematic way (real government spending not shown).
The results are subject to some caveats. First, the information content of publicly available
bank-level balance sheet data is relatively limited compared with the more granular
regulatory data typically used for some other IMF assessments (such as FSAP). Second, any
analysis based on historical data might not always account for the effects of recent
improvements to risk-management and supervisory frameworks. Third, the data spanning
2000–14 may not capture a sufficient number of oil price and financial cycles. Fourth, as
inherent in any econometric analysis, there is parameter uncertainty surrounding the
estimated relationship between macroeconomic shocks and NPL ratios.
System GMM results
Model number 1 2 3 4 5 6 7 8 9 10 11 12
Logit of NPL ratio (L1) 0.932*** 0.923*** 0.941*** 0.714*** 0.716*** 0.806*** 0.872*** 0.842*** 0.874*** 0.620* 0.649* 0.775***
Real oil price growth (L1) -0.005*** -0.005*** -0.005*** -0.005*** -0.005*** -0.005*** -0.012* -0.008* -0.008*** -0.020* -0.015 -0.013
nonoil GDP growth (L1) 0.01 0.001 0.006 -0.055* -0.059** -0.037 -0.058 -0.076* -0.069* -0.276 -0.234 -0.155
Real equity price growth (L1) -0.004 -0.004 -0.004 -0.005 -0.005* -0.003 -0.012 -0.001 -0.003 -0.012 -0.003 -0.005
Real credit growth (L1) -0.005 -0.003 -0.003 0 0.001 0 -0.004 -0.004 -0.003 -0.004 -0.003 -0.002
Real US fed funds FD (L1) 0.084 0.065 0.086 0.031 0.015 0.08
Year dummy N N N N N N Y Y Y Y Y Y
Country dummy N N N Y Y Y N N N Y Y Y
Lag depth 1 2 3 1 2 3 1 2 3 1 2 3
p-values
AR(1) 0.000 0.000 0.000 0.000 0.000 0.000 0.000 0.000 0.000 0.023 0.014 0.002
AR(2) 0.206 0.196 0.141 0.103 0.103 0.096 0.364 0.192 0.251 0.144 0.180 0.204
Hansen 0.002 0.012 0.030 0.005 0.026 0.100 0.546 0.634 0.790 0.946 0.850 0.802
Passes tests? N N N N N N Y Y Y Y Y Y
Sources: Bankscope, Haver, Bloomberg, and staff estimates.
Note: The dependent variable is bank-by-bank (logit transformed) NPL ratio for selected GCC banks spanning 2000-2014 (annual frequency). Relying on a
system GMM approach, with the collapsing method. The coefficients represent non-liner effect that depends on starting levels. ***, **, and * signify
statistical significance at the 1%, 5% and 10% levels. L1 signifies one period lag. AR(1) and AR(2) signify p-values associated with the null hypothesis of lack
of first and second order serial correlation. Hansen signifies p-value associated with the null hypothesis that the instruments are exogenous. A model is
cosidered to pass tests if pvalues of both AR(2) and Hansen tests are 10% or greater.
11
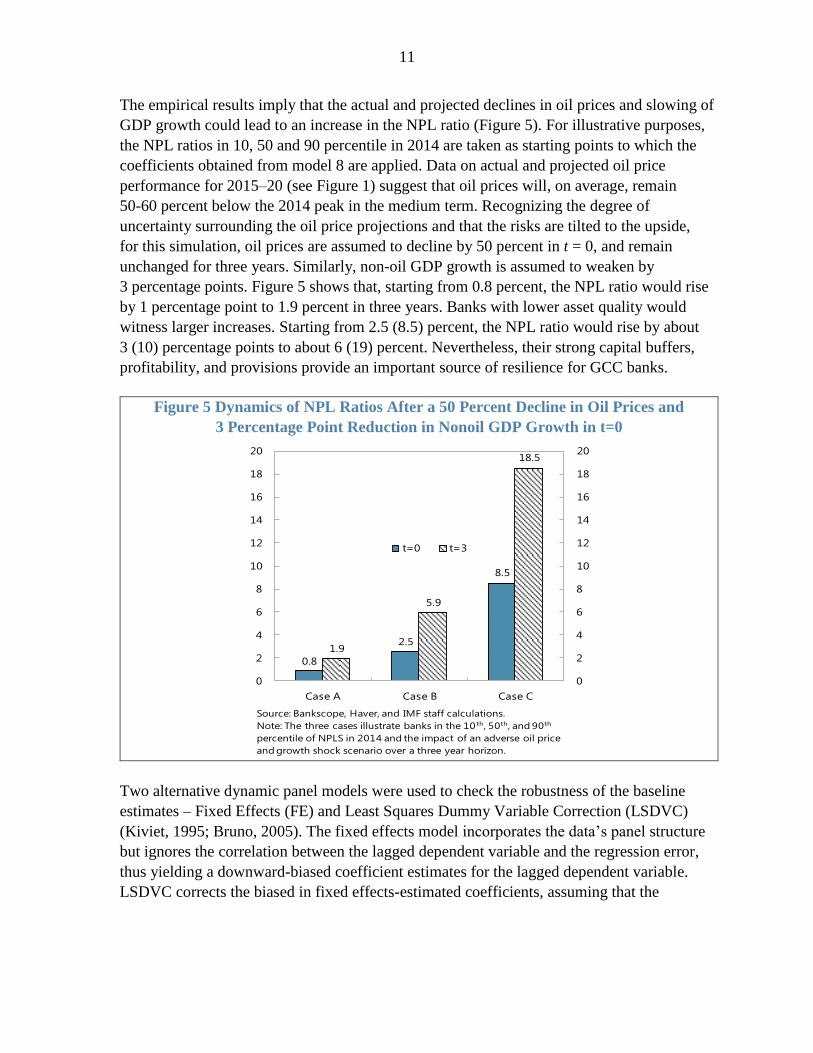
The empirical results imply that the actual and projected declines in oil prices and slowing of
GDP growth could lead to an increase in the NPL ratio (Figure 5). For illustrative purposes,
the NPL ratios in 10, 50 and 90 percentile in 2014 are taken as starting points to which the
coefficients obtained from model 8 are applied. Data on actual and projected oil price
performance for 2015–20 (see Figure 1) suggest that oil prices will, on average, remain
50-60 percent below the 2014 peak in the medium term. Recognizing the degree of
uncertainty surrounding the oil price projections and that the risks are tilted to the upside,
for this simulation, oil prices are assumed to decline by 50 percent in t = 0, and remain
unchanged for three years. Similarly, non-oil GDP growth is assumed to weaken by
3 percentage points. Figure 5 shows that, starting from 0.8 percent, the NPL ratio would rise
by 1 percentage point to 1.9 percent in three years. Banks with lower asset quality would
witness larger increases. Starting from 2.5 (8.5) percent, the NPL ratio would rise by about
3 (10) percentage points to about 6 (19) percent. Nevertheless, their strong capital buffers,
profitability, and provisions provide an important source of resilience for GCC banks.
Figure 5 Dynamics of NPL Ratios After a 50 Percent Decline in Oil Prices and
3 Percentage Point Reduction in Nonoil GDP Growth in t=0
Two alternative dynamic panel models were used to check the robustness of the baseline
estimates – Fixed Effects (FE) and Least Squares Dummy Variable Correction (LSDVC)
(Kiviet, 1995; Bruno, 2005). The fixed effects model incorporates the data’s panel structure
but ignores the correlation between the lagged dependent variable and the regression error,
thus yielding a downward-biased coefficient estimates for the lagged dependent variable.
LSDVC corrects the biased in fixed effects-estimated coefficients, assuming that the
0.8
2.5
8.5
1.9
5.9
18.5
0
2
4
6
8
10
12
14
16
18
20
0
2
4
6
8
10
12
14
16
18
20
Case A Case B Case C
t=0 t=3
Source: Bankscope, Haver, and IMF staff calculations.
Note: The three cases illustrate banks in the 10 th, 50th, and 90th
percentile of NPLS in 2014 and the impact of an adverse oil price
and growth shock scenario over a three year horizon.
12
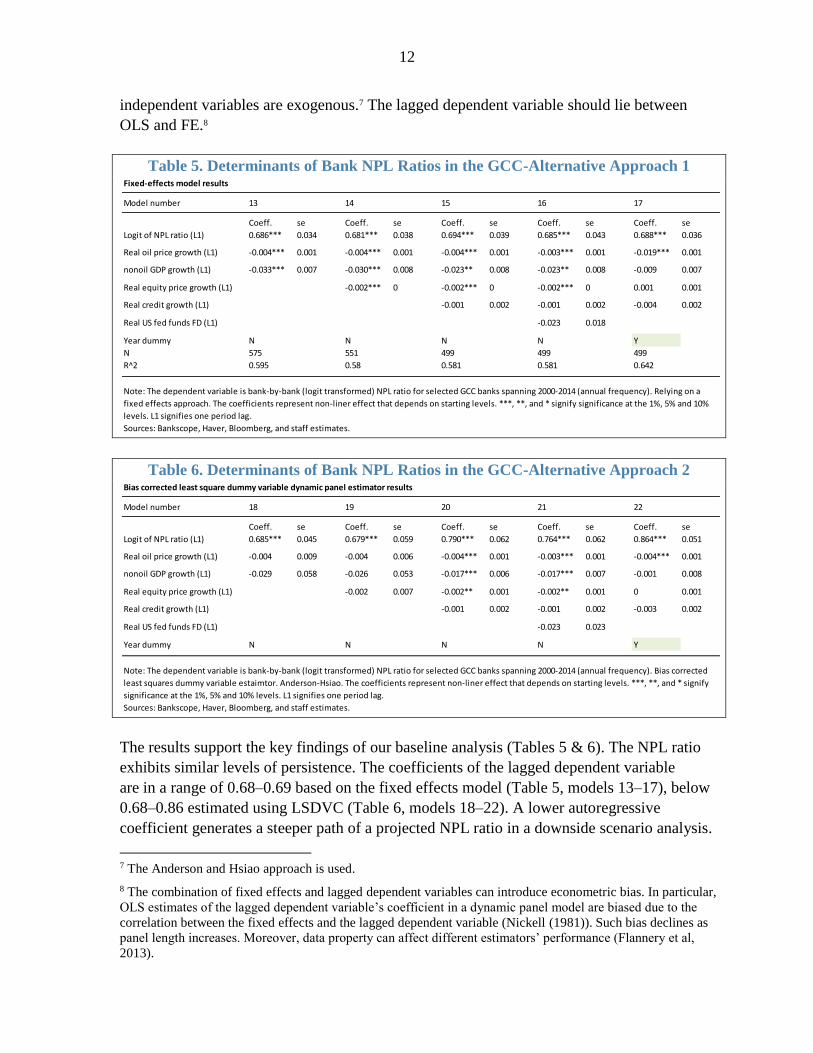
independent variables are exogenous.7 The lagged dependent variable should lie between
OLS and FE.8
Table 5. Determinants of Bank NPL Ratios in the GCC-Alternative Approach 1
Table 6. Determinants of Bank NPL Ratios in the GCC-Alternative Approach 2
The results support the key findings of our baseline analysis (Tables 5 & 6). The NPL ratio
exhibits similar levels of persistence. The coefficients of the lagged dependent variable
are in a range of 0.68–0.69 based on the fixed effects model (Table 5, models 13–17), below
0.68–0.86 estimated using LSDVC (Table 6, models 18–22). A lower autoregressive
coefficient generates a steeper path of a projected NPL ratio in a downside scenario analysis.
7 The Anderson and Hsiao approach is used.
8 The combination of fixed effects and lagged dependent variables can introduce econometric bias. In particular,
OLS estimates of the lagged dependent variable’s coefficient in a dynamic panel model are biased due to the
correlation between the fixed effects and the lagged dependent variable (Nickell (1981)). Such bias declines as
panel length increases. Moreover, data property can affect different estimators’ performance (Flannery et al,
2013).
Fixed-effects model results
Model number 13 14 15 16 17
Coeff. se Coeff. se Coeff. se Coeff. se Coeff. se
Logit of NPL ratio (L1) 0.686*** 0.034 0.681*** 0.038 0.694*** 0.039 0.685*** 0.043 0.688*** 0.036
Real oil price growth (L1) -0.004*** 0.001 -0.004*** 0.001 -0.004*** 0.001 -0.003*** 0.001 -0.019*** 0.001
nonoil GDP growth (L1) -0.033*** 0.007 -0.030*** 0.008 -0.023** 0.008 -0.023** 0.008 -0.009 0.007
Real equity price growth (L1) -0.002*** 0 -0.002*** 0 -0.002*** 0 0.001 0.001
Real credit growth (L1) -0.001 0.002 -0.001 0.002 -0.004 0.002
Real US fed funds FD (L1) -0.023 0.018
Year dummy N N N N Y
N 575 551 499 499 499
R^2 0.595 0.58 0.581 0.581 0.642
Sources: Bankscope, Haver, Bloomberg, and staff estimates.
Note: The dependent variable is bank-by-bank (logit transformed) NPL ratio for selected GCC banks spanning 2000-2014 (annual frequency). Relying on a
fixed effects approach. The coefficients represent non-liner effect that depends on starting levels. ***, **, and * signify significance at the 1%, 5% and 10%
levels. L1 signifies one period lag.
Bias corrected least square dummy variable dynamic panel estimator results
Model number 18 19 20 21 22
Coeff. se Coeff. se Coeff. se Coeff. se Coeff. se
Logit of NPL ratio (L1) 0.685*** 0.045 0.679*** 0.059 0.790*** 0.062 0.764*** 0.062 0.864*** 0.051
Real oil price growth (L1) -0.004 0.009 -0.004 0.006 -0.004*** 0.001 -0.003*** 0.001 -0.004*** 0.001
nonoil GDP growth (L1) -0.029 0.058 -0.026 0.053 -0.017*** 0.006 -0.017*** 0.007 -0.001 0.008
Real equity price growth (L1) -0.002 0.007 -0.002** 0.001 -0.002** 0.001 0 0.001
Real credit growth (L1) -0.001 0.002 -0.001 0.002 -0.003 0.002
Real US fed funds FD (L1) -0.023 0.023
Year dummy N N N N Y
Sources: Bankscope, Haver, Bloomberg, and staff estimates.
Note: The dependent variable is bank-by-bank (logit transformed) NPL ratio for selected GCC banks spanning 2000-2014 (annual frequency). Bias corrected
least squares dummy variable estaimtor. Anderson-Hsiao. The coefficients represent non-liner effect that depends on starting levels. ***, **, and * signify
significance at the 1%, 5% and 10% levels. L1 signifies one period lag.
13
Growth rates of real oil prices, nonoil private sector GDP and real equity prices remain key
determinants of NPL ratios in the GCC economies. The coefficients on real credit growth
come out with the correct sign but are not statistically significant. Real government spending
(not shown) and real U.S. interest rates do not directly affect NPL ratios in a systematic way.
D. A panel VAR model of oil-macro-financial linkages
To identify a positive feedback loop between the macroeconomic and bank-level balance
sheet variables, a panel vector autoregression (VAR) model, which accounts for bank-level
heterogeneity, was estimated. The multivariate model in the previous section considered the
uni-directional effects of macroeconomic shocks on the bank NPL ratio. A panel VAR model
employed in this section goes one step further and captures the spillback from the bank NPL
ratio and other balance sheet variables to the macroeconomy. :
𝑦𝑖,𝑡 = 𝐵0 + 𝐵1(𝐿)𝑦𝑖,𝑡 + 𝑢𝑖,𝑡 (1)
where 𝑦𝑖,𝑡 is a vector of macroeconomic and bank-level variables, 𝐵0 is the deterministic
component, (𝐿) is a lag operator and 𝑢𝑖,𝑡 is the residual. The model was estimated using a
panel VAR routine pvar developed by Love and Zicchino (2006), which exploits a System-
General Method of Moments (GMM) estimator as in Arellano and Bover (1995).9 The
number of lags is set at two in view of the short time series dimension (2000–14).
Five macroeconomic and bank level variables were included: macroeconomic variables
include real oil price growth and real equity price growth; bank level variables are NPL
ratios, real credit growth and real deposit growth for 42 GCC banks for which sufficient time
series data are available. The data spans the period 2000–14.
The identification of shocks is based on a Cholesky decomposition where the variables are
stacked to explore how macroeconomic shocks affect bank-level variables first, and how the
latter affect the former in the second round. In particular, one macroeconomic variables {real
oil price growth} was stacked at the top. The bank-level variables {NPL ratio, real credit
growth, real deposit growth} are stacked below the macro-level variables. Finally, real equity
price growth is stacked at the bottom as commonly done in the literature.
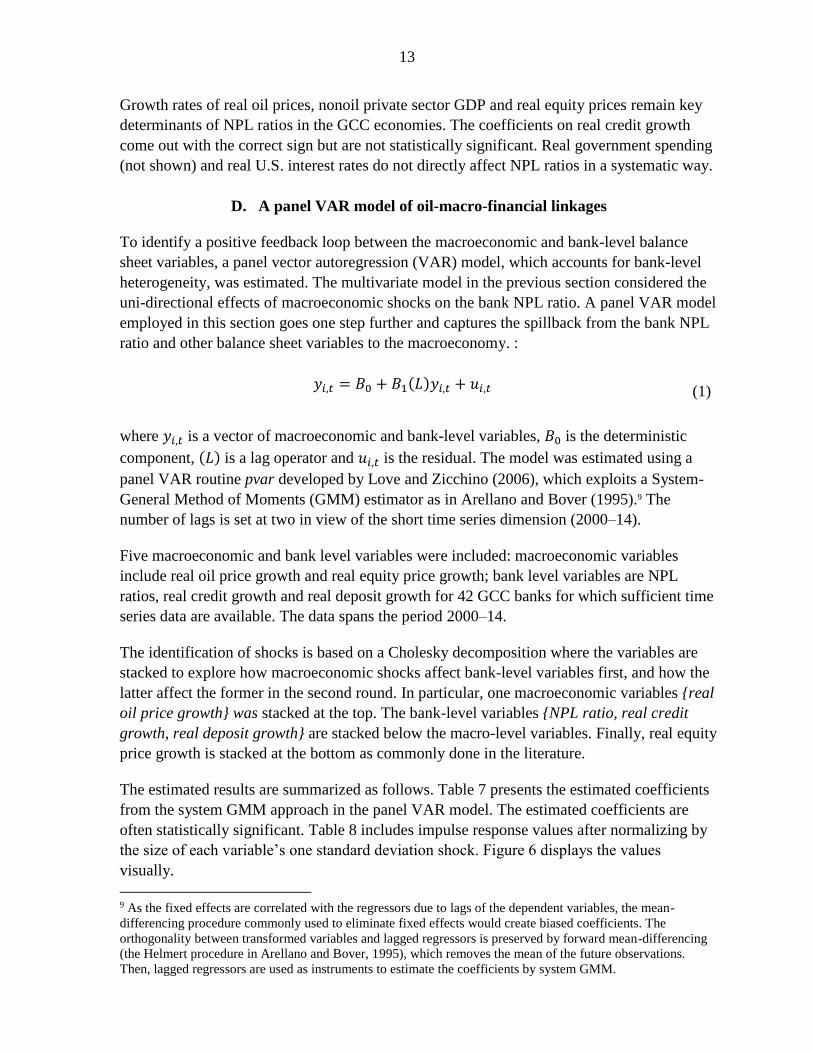
The estimated results are summarized as follows. Table 7 presents the estimated coefficients
from the system GMM approach in the panel VAR model. The estimated coefficients are
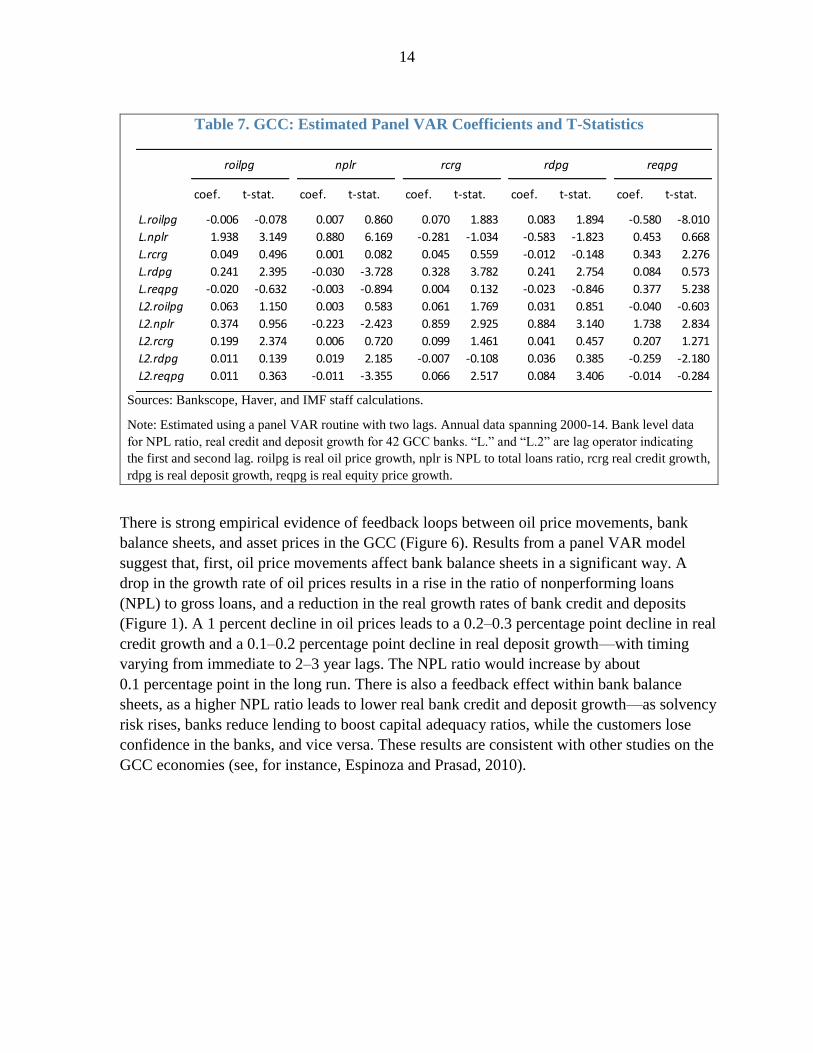
often statistically significant. Table 8 includes impulse response values after normalizing by
the size of each variable’s one standard deviation shock. Figure 6 displays the values
visually.
9 As the fixed effects are correlated with the regressors due to lags of the dependent variables, the mean-
differencing procedure commonly used to eliminate fixed effects would create biased coefficients. The
orthogonality between transformed variables and lagged regressors is preserved by forward mean-differencing
(the Helmert procedure in Arellano and Bover, 1995), which removes the mean of the future observations.
Then, lagged regressors are used as instruments to estimate the coefficients by system GMM.
14
Table 7. GCC: Estimated Panel VAR Coefficients and T-Statistics
Sources: Bankscope, Haver, and IMF staff calculations.
Note: Estimated using a panel VAR routine with two lags. Annual data spanning 2000-14. Bank level data
for NPL ratio, real credit and deposit growth for 42 GCC banks. “L.” and “L.2” are lag operator indicating
the first and second lag. roilpg is real oil price growth, nplr is NPL to total loans ratio, rcrg real credit growth,
rdpg is real deposit growth, reqpg is real equity price growth.
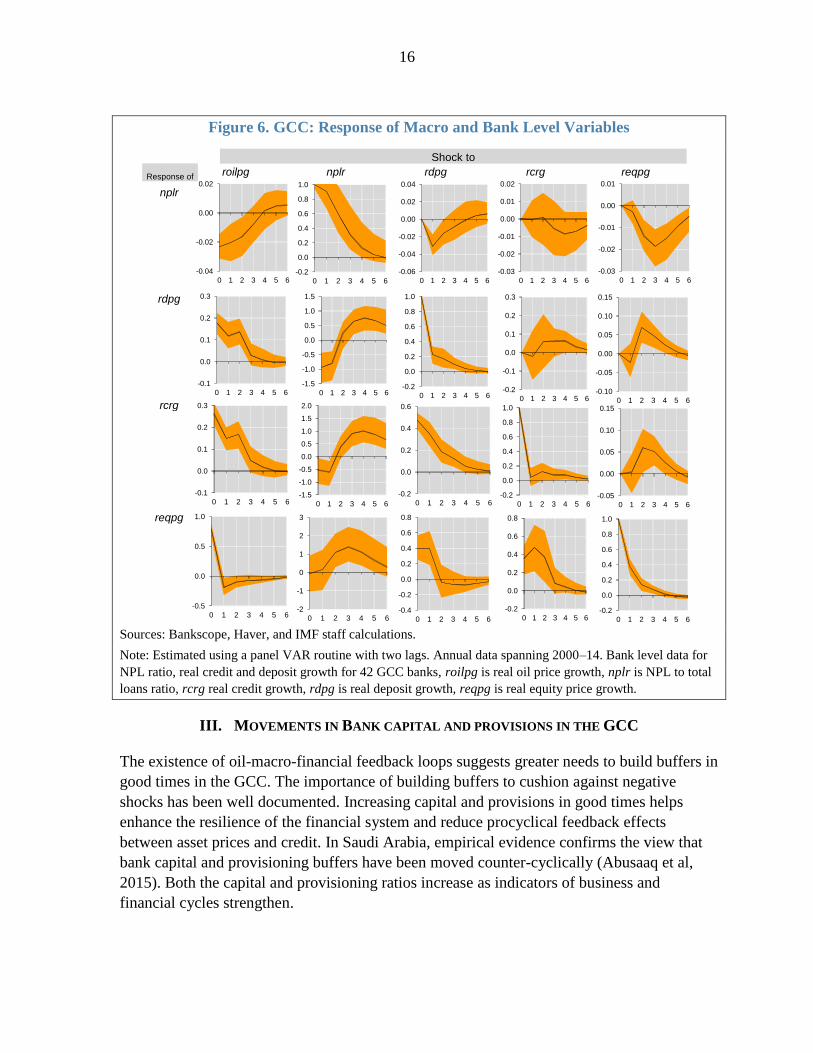
There is strong empirical evidence of feedback loops between oil price movements, bank
balance sheets, and asset prices in the GCC (Figure 6). Results from a panel VAR model
suggest that, first, oil price movements affect bank balance sheets in a significant way. A
drop in the growth rate of oil prices results in a rise in the ratio of nonperforming loans
(NPL) to gross loans, and a reduction in the real growth rates of bank credit and deposits
(Figure 1). A 1 percent decline in oil prices leads to a 0.2–0.3 percentage point decline in real
credit growth and a 0.1–0.2 percentage point decline in real deposit growth—with timing
varying from immediate to 2–3 year lags. The NPL ratio would increase by about
0.1 percentage point in the long run. There is also a feedback effect within bank balance
sheets, as a higher NPL ratio leads to lower real bank credit and deposit growth—as solvency
risk rises, banks reduce lending to boost capital adequacy ratios, while the customers lose
confidence in the banks, and vice versa. These results are consistent with other studies on the
GCC economies (see, for instance, Espinoza and Prasad, 2010).
coef. t-stat. coef. t-stat. coef. t-stat. coef. t-stat. coef. t-stat.
L.roilpg -0.006 -0.078 0.007 0.860 0.070 1.883 0.083 1.894 -0.580 -8.010
L.nplr 1.938 3.149 0.880 6.169 -0.281 -1.034 -0.583 -1.823 0.453 0.668
L.rcrg 0.049 0.496 0.001 0.082 0.045 0.559 -0.012 -0.148 0.343 2.276
L.rdpg 0.241 2.395 -0.030 -3.728 0.328 3.782 0.241 2.754 0.084 0.573
L.reqpg -0.020 -0.632 -0.003 -0.894 0.004 0.132 -0.023 -0.846 0.377 5.238
L2.roilpg 0.063 1.150 0.003 0.583 0.061 1.769 0.031 0.851 -0.040 -0.603
L2.nplr 0.374 0.956 -0.223 -2.423 0.859 2.925 0.884 3.140 1.738 2.834
L2.rcrg 0.199 2.374 0.006 0.720 0.099 1.461 0.041 0.457 0.207 1.271
L2.rdpg 0.011 0.139 0.019 2.185 -0.007 -0.108 0.036 0.385 -0.259 -2.180
L2.reqpg 0.011 0.363 -0.011 -3.355 0.066 2.517 0.084 3.406 -0.014 -0.284
nplrroilpg reqpgrdpgrcrg
15
Table 8. GCC: Response of Macro and Bank Level Variables
Source: IMF staff calculations.
Second, equity price developments are a channel for amplification of the bank liquidity
feedback loop stemming from an adverse oil price shock. A one percent reduction in oil price
growth leads to a 0.8 percent decline in the rate of equity price inflation, which in turn leads
to a reduction of bank credit and deposit growth by 0.1 percentage point, further depressing
equity price performance.
time roilpg nplr rcrg rdpg reqpg
0 roilpg 22.241 0.000 0.000 0.000 0.000
1 roilpg -0.240 3.784 2.219 2.907 -0.538
2 roilpg 2.611 4.001 2.728 0.277 -0.189
3 roilpg 0.697 3.393 1.013 1.059 -0.197
4 roilpg 0.686 2.662 0.856 0.367 -0.393
5 roilpg 0.330 1.938 0.461 0.376 -0.475
6 roilpg 0.327 1.338 0.306 0.261 -0.454
0 nplr -0.517 2.242 0.000 0.000 0.000
1 nplr -0.456 2.037 -0.221 -0.378 -0.075
2 nplr -0.365 1.331 -0.102 -0.204 -0.366
3 nplr -0.171 0.692 -0.116 -0.074 -0.492
4 nplr 0.032 0.288 -0.093 0.040 -0.393
5 nplr 0.109 0.078 -0.043 0.094 -0.249
6 nplr 0.120 -0.003 0.002 0.096 -0.128
0 rcrg 5.824 -1.161 13.562 0.000 0.000
1 rcrg 3.327 -1.372 2.918 4.041 0.100
2 rcrg 3.737 0.858 2.548 1.554 1.569
3 rcrg 1.067 2.017 1.666 1.082 1.351
4 rcrg 0.399 2.254 1.158 0.212 0.668
5 rcrg -0.004 1.970 0.576 0.062 0.138
6 rcrg -0.028 1.484 0.278 -0.005 -0.184
0 rdpg 3.967 -2.105 6.978 12.285 0.000
1 rdpg 2.632 -1.797 1.368 2.898 -0.610
2 rdpg 3.038 0.546 1.789 1.748 1.842
3 rdpg 0.635 1.450 1.296 0.812 1.274
4 rdpg 0.178 1.696 0.898 0.075 0.625
5 rdpg -0.094 1.494 0.408 -0.017 0.155
6 rdpg -0.082 1.120 0.180 -0.052 -0.127
0 reqpg 17.497 -0.159 6.447 2.852 26.333
1 reqpg -4.211 0.383 7.658 2.101 9.920
2 reqpg -2.158 2.459 3.519 -2.665 3.635
3 reqpg -1.677 3.115 0.390 -1.298 1.938
4 reqpg -1.421 2.486 -0.086 -1.157 0.359
5 reqpg -1.013 1.501 -0.340 -0.692 -0.460
6 reqpg -0.449 0.662 -0.372 -0.322 -0.647
(Responses)
(Shock variable)
16
Figure 6. GCC: Response of Macro and Bank Level Variables
Sources: Bankscope, Haver, and IMF staff calculations.
Note: Estimated using a panel VAR routine with two lags. Annual data spanning 2000–14. Bank level data for
NPL ratio, real credit and deposit growth for 42 GCC banks, roilpg is real oil price growth, nplr is NPL to total
loans ratio, rcrg real credit growth, rdpg is real deposit growth, reqpg is real equity price growth.
III. MOVEMENTS IN BANK CAPITAL AND PROVISIONS IN THE GCC
The existence of oil-macro-financial feedback loops suggests greater needs to build buffers in
good times in the GCC. The importance of building buffers to cushion against negative
shocks has been well documented. Increasing capital and provisions in good times helps
enhance the resilience of the financial system and reduce procyclical feedback effects
between asset prices and credit. In Saudi Arabia, empirical evidence confirms the view that
bank capital and provisioning buffers have been moved counter-cyclically (Abusaaq et al,
2015). Both the capital and provisioning ratios increase as indicators of business and
financial cycles strengthen.
rdpgnplr rcrg
Shock to
Response of
reqpg
rcrg
reqpg
nplr
rdpg
roilpg
-0.04
-0.02
0.00
0.02
0 1 2 3 4 5 6
-0.1
0.0
0.1
0.2
0.3
0 1 2 3 4 5 6
-0.2
0.0
0.2
0.4
0.6
0.8
1.0
0 1 2 3 4 5 6
-1.5
-1.0
-0.5
0.0
0.5
1.0
1.5
0 1 2 3 4 5 6
-0.06
-0.04
-0.02
0.00
0.02
0.04
0 1 2 3 4 5 6
-0.03
-0.02
-0.01
0.00
0.01
0.02
0 1 2 3 4 5 6
-0.03
-0.02
-0.01
0.00
0.01
0 1 2 3 4 5 6
-0.2
0.0
0.2
0.4
0.6
0.8
1.0
0 1 2 3 4 5 6-0.2
-0.1
0.0
0.1
0.2
0.3
0 1 2 3 4 5 6-0.10
-0.05
0.00
0.05
0.10
0.15
0 1 2 3 4 5 6
-0.1
0.0
0.1
0.2
0.3
0 1 2 3 4 5 6-1.5
-1.0
-0.5
0.0
0.5
1.0
1.5
2.0
0 1 2 3 4 5 6
-0.5
0.0
0.5
1.0
0 1 2 3 4 5 6-2
-1
0
1
2
3
0 1 2 3 4 5 6
-0.2
0.0
0.2
0.4
0.6
0 1 2 3 4 5 6
-0.4
-0.2
0.0
0.2
0.4
0.6
0.8
0 1 2 3 4 5 6
-0.2
0.0
0.2
0.4
0.6
0.8
1.0
0 1 2 3 4 5 6
-0.2
0.0
0.2
0.4
0.6
0.8
0 1 2 3 4 5 6
-0.05
0.00
0.05
0.10
0.15
0 1 2 3 4 5 6
-0.2
0.0
0.2
0.4
0.6
0.8
1.0
0 1 2 3 4 5 6
17
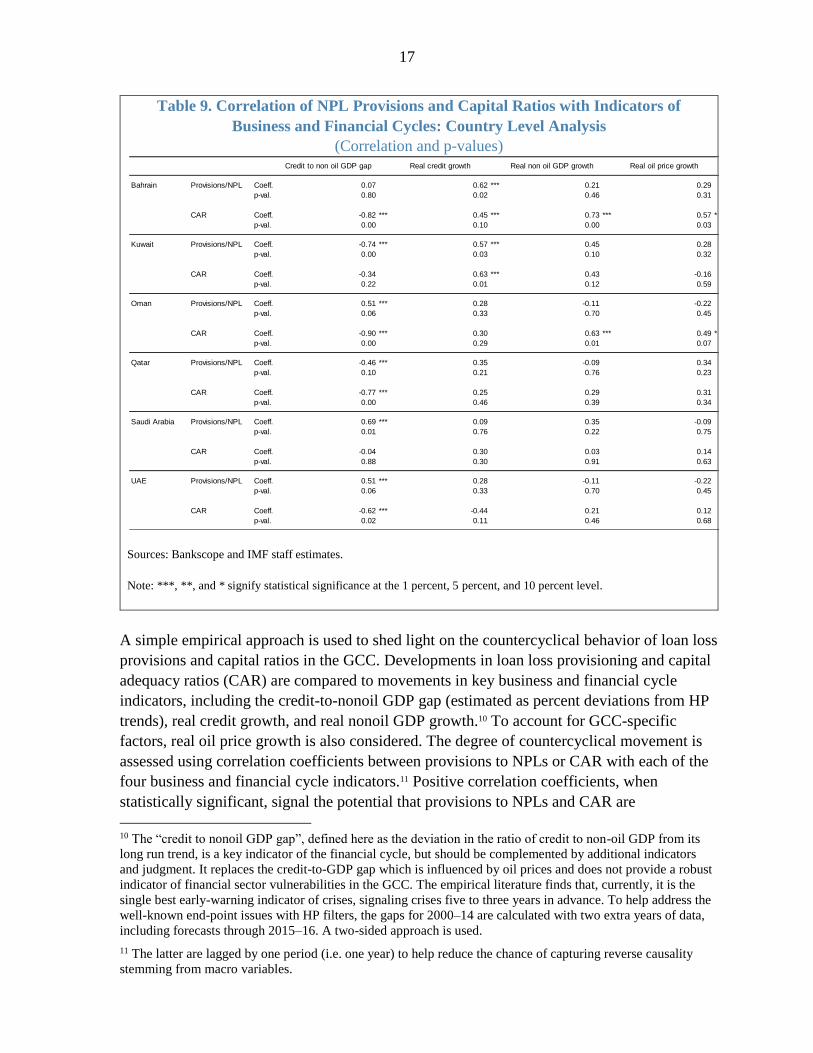
Table 9. Correlation of NPL Provisions and Capital Ratios with Indicators of
Business and Financial Cycles: Country Level Analysis
(Correlation and p-values)
Sources: Bankscope and IMF staff estimates.
Note: ***, **, and * signify statistical significance at the 1 percent, 5 percent, and 10 percent level.
A simple empirical approach is used to shed light on the countercyclical behavior of loan loss
provisions and capital ratios in the GCC. Developments in loan loss provisioning and capital
adequacy ratios (CAR) are compared to movements in key business and financial cycle
indicators, including the credit-to-nonoil GDP gap (estimated as percent deviations from HP
trends), real credit growth, and real nonoil GDP growth.10 To account for GCC-specific
factors, real oil price growth is also considered. The degree of countercyclical movement is
assessed using correlation coefficients between provisions to NPLs or CAR with each of the
four business and financial cycle indicators.11 Positive correlation coefficients, when
statistically significant, signal the potential that provisions to NPLs and CAR are
10 The “credit to nonoil GDP gap”, defined here as the deviation in the ratio of credit to non-oil GDP from its
long run trend, is a key indicator of the financial cycle, but should be complemented by additional indicators
and judgment. It replaces the credit-to-GDP gap which is influenced by oil prices and does not provide a robust
indicator of financial sector vulnerabilities in the GCC. The empirical literature finds that, currently, it is the
single best early-warning indicator of crises, signaling crises five to three years in advance. To help address the
well-known end-point issues with HP filters, the gaps for 2000–14 are calculated with two extra years of data,
including forecasts through 2015–16. A two-sided approach is used.
11 The latter are lagged by one period (i.e. one year) to help reduce the chance of capturing reverse causality
stemming from macro variables.
Credit to non oil GDP gap Real credit growth Real non oil GDP growth Real oil price growth
Bahrain Provisions/NPL Coeff. 0.07 0.62 *** 0.21 0.29
p-val. 0.80 0.02 0.46 0.31
CAR Coeff. -0.82 *** 0.45 *** 0.73 *** 0.57 ***
p-val. 0.00 0.10 0.00 0.03
Kuwait Provisions/NPL Coeff. -0.74 *** 0.57 *** 0.45 0.28
p-val. 0.00 0.03 0.10 0.32
CAR Coeff. -0.34 0.63 *** 0.43 -0.16
p-val. 0.22 0.01 0.12 0.59
Oman Provisions/NPL Coeff. 0.51 *** 0.28 -0.11 -0.22
p-val. 0.06 0.33 0.70 0.45
CAR Coeff. -0.90 *** 0.30 0.63 *** 0.49 ***
p-val. 0.00 0.29 0.01 0.07
Qatar Provisions/NPL Coeff. -0.46 *** 0.35 -0.09 0.34
p-val. 0.10 0.21 0.76 0.23
CAR Coeff. -0.77 *** 0.25 0.29 0.31
p-val. 0.00 0.46 0.39 0.34
Saudi Arabia Provisions/NPL Coeff. 0.69 *** 0.09 0.35 -0.09
p-val. 0.01 0.76 0.22 0.75
CAR Coeff. -0.04 0.30 0.03 0.14
p-val. 0.88 0.30 0.91 0.63
UAE Provisions/NPL Coeff. 0.51 *** 0.28 -0.11 -0.22
p-val. 0.06 0.33 0.70 0.45
CAR Coeff. -0.62 *** -0.44 0.21 0.12
p-val. 0.02 0.11 0.46 0.68
18
countercyclical – these ratios increase during good times. This exercise was conducted using
country level data and bank level data.
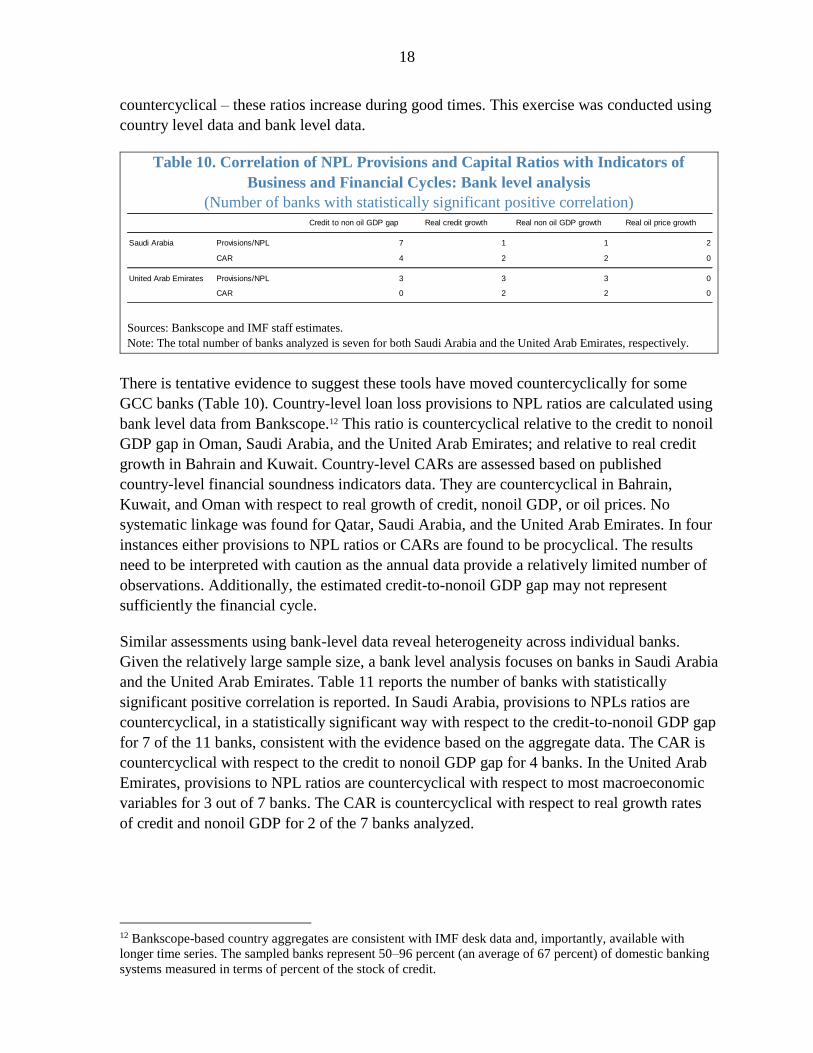
Table 10. Correlation of NPL Provisions and Capital Ratios with Indicators of
Business and Financial Cycles: Bank level analysis
(Number of banks with statistically significant positive correlation)
Sources: Bankscope and IMF staff estimates.
Note: The total number of banks analyzed is seven for both Saudi Arabia and the United Arab Emirates, respectively.
There is tentative evidence to suggest these tools have moved countercyclically for some
GCC banks (Table 10). Country-level loan loss provisions to NPL ratios are calculated using
bank level data from Bankscope.12 This ratio is countercyclical relative to the credit to nonoil
GDP gap in Oman, Saudi Arabia, and the United Arab Emirates; and relative to real credit
growth in Bahrain and Kuwait. Country-level CARs are assessed based on published
country-level financial soundness indicators data. They are countercyclical in Bahrain,
Kuwait, and Oman with respect to real growth of credit, nonoil GDP, or oil prices. No
systematic linkage was found for Qatar, Saudi Arabia, and the United Arab Emirates. In four
instances either provisions to NPL ratios or CARs are found to be procyclical. The results
need to be interpreted with caution as the annual data provide a relatively limited number of
observations. Additionally, the estimated credit-to-nonoil GDP gap may not represent
sufficiently the financial cycle.
Similar assessments using bank-level data reveal heterogeneity across individual banks.
Given the relatively large sample size, a bank level analysis focuses on banks in Saudi Arabia
and the United Arab Emirates. Table 11 reports the number of banks with statistically
significant positive correlation is reported. In Saudi Arabia, provisions to NPLs ratios are
countercyclical, in a statistically significant way with respect to the credit-to-nonoil GDP gap
for 7 of the 11 banks, consistent with the evidence based on the aggregate data. The CAR is
countercyclical with respect to the credit to nonoil GDP gap for 4 banks. In the United Arab
Emirates, provisions to NPL ratios are countercyclical with respect to most macroeconomic
variables for 3 out of 7 banks. The CAR is countercyclical with respect to real growth rates
of credit and nonoil GDP for 2 of the 7 banks analyzed.
12 Bankscope-based country aggregates are consistent with IMF desk data and, importantly, available with
longer time series. The sampled banks represent 50–96 percent (an average of 67 percent) of domestic banking
systems measured in terms of percent of the stock of credit.
Credit to non oil GDP gap Real credit growth Real non oil GDP growth Real oil price growth
Saudi Arabia Provisions/NPL 7 1 1 2
CAR 4 2 2 0
United Arab Emirates Provisions/NPL 3 3 3 0
CAR 0 2 2 0
19
IV. CONCLUDING REMARKS
The paper has demonstrated the existence of oil-macro-financial linkages in the GCC
countries. First, the performance of key indicators of business and financial cycles has
generally strengthened during oil price upturns. The timing of downturns in those variables
tends to coincide with oil price downturns, even though greater fiscal buffers have attenuated
the linkage. Second, this paper’s econometric analysis confirmed that oil prices and
economic activity significantly affect bank asset quality. It also identified feedback loops
between oil price movements, bank balance sheets, and asset prices in the GCC.
Tentative evidence suggests that banks in the GCC countries have been setting the capital
ratio and provisioning for NPLs countercyclically. A simple empirical analysis, using both
country- and bank-level data, shows that loan loss provisions and capital adequacy ratios are
positively correlated with indicators of business and financial cycles. This has helped
strengthen the resilience of the financial system to the oil price decline since mid-2014.
20
Annex 1. Tables
Table A1. GCC Banks Included Econometric Analyses
Country Bank
Bahrain 1 Ahli United Bank BSC
2 Gulf International Bank BSC
3 BBK B.S.C.
4 National Bank of Bahrain
Kuwait 5 National Bank of Kuwait S.A.K.
6 Kuwait Finance House
7 Gulf Bank KSC (The)
8 Commercial Bank of Kuwait SAK (The)
9 Industrial Bank of Kuwait K.S.C.
Oman 10 Bank Muscat SAOG
11 Bank Dhofar SAOG
12 National Bank of Oman (SAOG)
13 HSBC Bank Oman
14 Oman Arab Bank SAOC
15 Ahli Bank SAOG
Qatar 16 Qatar National Bank
17 Commercial Bank of Qatar (The) QSC
18 Qatar Islamic Bank SAQ
19 Doha Bank
20 Ahli Bank QSC
21 International Bank of Qatar Q.S.C.
22 Qatar Development Bank Q.S.C.C.
Saudi Arabia 23 National Commercial Bank (The)
24 Samba Financial Group
25 Riyad Bank
26 Banque Saudi Fransi JSC
27 Saudi British Bank JSC (The)
28 Arab National Bank Public Joint Stock Company
29 Saudi Hollandi Bank
30 Saudi Investment Bank (The)
31 Bank AlJazira JSC
United Arab Emirates 32 National Bank of Abu Dhabi
33 First Gulf Bank
34 Abu Dhabi Commercial Bank
35 Abu Dhabi Islamic Bank - Public Joint Stock Co.
36 Mashreqbank PSC
37 Union National Bank
38 Commercial Bank of Dubai P.S.C.
39 Bank of Sharjah
40 National Bank of Fujairah PJSC
41 Commercial Bank International P.S.C.
42 National Bank of Umm Al-Qaiwain PSC
21
REFERENCES
Abusaaq, H., A. Alfi, P. Khandelwal, K. Miyajima, and B. Piven, 2015, “Countercyclical
Macroprudential Policies in Saudi Arabia,” International Monetary Fund,
Washington DC.
Al-Hassan, A., M. Khamis, and N. Oulidi, 2010, “The GCC Banking Sector: Topography
and Analysis,” IMF Working Paper 10/87.
Arellano, M., and O. Bover (1995). “Another look at the instrumental variable estimation of
error-components models,” Journal of Econometrics, 68 (1), pp 29–51.
Arvai, Z., A. Prasad, and K. Ketayama, 2014, “Macroprudential Policy in the GCC
Countries,” IMF Staff Discussion Note 14/01.
Bologna, P. and A. Prasad, 2010, “Oman: Banking Sector Resilience” IMF Working
Paper 10/61.
Bruno, G. S. F. 2005. Approximating the bias of the LSDV estimator for dynamic
unbalanced panel data models. Economics Letters 87: 361–366
Callen, T., P. Khandelwal, K. Miyajima, and A. Santos, 2015, “Oil Prices, Financial
Stability, and the Use of Countercyclical Macroprudential Policies in the GCC,” Prepared
for the Annual Meeting of Ministers of Finance and Central Bank Governors.
De Bock, R., and A. Demyanets (2012). “Bank Asset Quality in Emerging Markets:
Determinants and Spillovers,” IMF Working Paper 12/71.
Espinoza, R., and A. Prasad, 2010, “Nonperforming Loans in the GCC Banking Systems and
their Macroeconomic Effects,” IMF Working Paper 10/224.
Flannery, M. and K. W. Hankins, 2013, “Estimating dynamic panel models in corporate
finance,” Journal of Corporate Finance No 19, 1–19.
IMF, 2010, “Qatar: 2009 Article IV Consultation-Staff Report,” Country Report No. 10/41.
Kiviet, J. F. 1995. On bias, inconsistency, and efficiency of various estimators in dynamic
panel data models. Journal of Econometrics 68: 53–78.
Klein, N. (2013). “Non-Performing Loans in CESEE: Determinants and Impact on
Macroeconomic Performance,” IMF Working Paper 13/72.
Love, I., and R. T. Ariss (2014). “Macro-financial linkages in Egypt: A panel analysis of
economic shocks and loan portfolio quality,” Journal of International Financial Markets,
Institutions and Money, 28 (C), pp 158–81.
22
Love, I., and L. Zicchino, 2006, “Financial development and dynamic investment behavior:
evidence from panel vector autoregression,” The Quarterly Review of Economics and
Finance, 46, pp 190-210.
Miyajima, K., 2016, “An Empirical Investigation of Oil-Macro-Financial Linkages in Saudi
Arabia,” IMF Working Paper 15/xxx
Nickell, S., 1981, “Biases in Dynamic Models with Fixed Effects,” Econometrica, Vol 49,
No 6, 1417–26.
Nkusu, M. (2011). “Nonperforming Loans and Macrofinancial Vulnerabilities in Advanced
Economies,” IMF Working Paper 11/161.