impact of land use and land cover changes on ecosystem...
TRANSCRIPT
Impact of Land Use and Land Cover Changes on Ecosystem Services in
Southwest China
Presented by
HU Huabin
• Introduction
• Methods
• Results
• Discussion
Ecosystem services refer to the conditions and processes provided by ecosystems and species for human to sustain.
OUTLINE
Introduction• Land use / land cover change
– Top 10 priority research topics for landscape ecology (Wu & Hobbs 2002)
• causes, processes, and consequences of land use and land cover change
• integrating humans and their activities into landscape ecology
• Ecosystem services & values– ‘free gifts of nature’ ? “Ecosystem are not fully ‘captured’ in
commercial markets or adequately quantified in terms of comparable with economic services and manufactured capital, they are often given too little weight in policy decision”(Costanza 1997). “ecosystems are poorly understood, scarcely monitored, and undergoing rapid degradation and depletion. Often the importance of ecosystem services is widely appreciated only upon their loss.”(Daily 2000)
– global biosphere values of 17 ecosystem services provided by 16 dominant global biomes. (Costanza et al. 1997)

1 gas regulation
2 climate regulation
3 disturbance regulation
4 water regulation
5 water supply
6 erosion control
7 soil formation
8 nutrient cycling
9 waste treatment
10 pollination11 biological control
12 habitat / refugia
13 food production
14 raw material
15 genetic resources
16 recreation17 cultural
Ecosystem
Services

(b)
Price=free(Costanza et al. 1997)
If there is a price to pay for,
the demand will decrease

ForestTropical forest
Grass/rangeland
CroplandUrban
Lakes / river
63% from marine ecosystems
37% from terrestrial ecosystems
Which ecosystems supply what services? How much?


• Methods of ecosystem service valuation– Classification
• Direct uses: goods• Indirect uses: services
– Valuation• Energy:• Material: • Monetary:
Methods
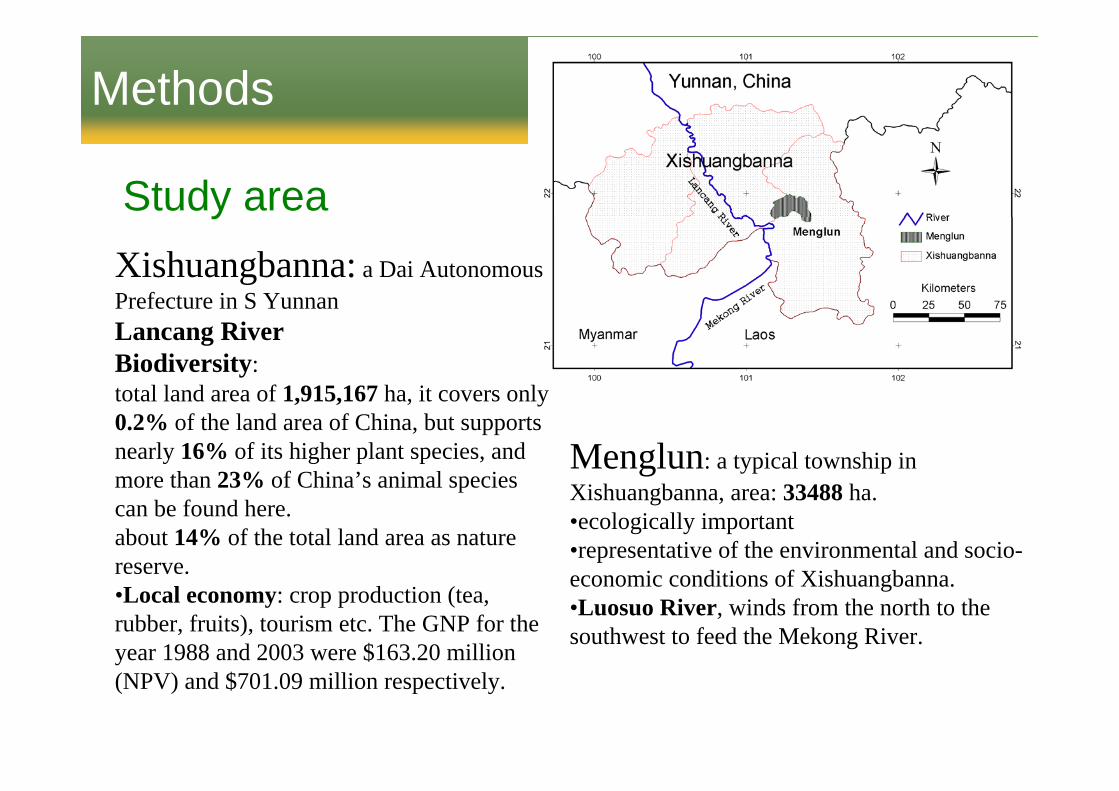
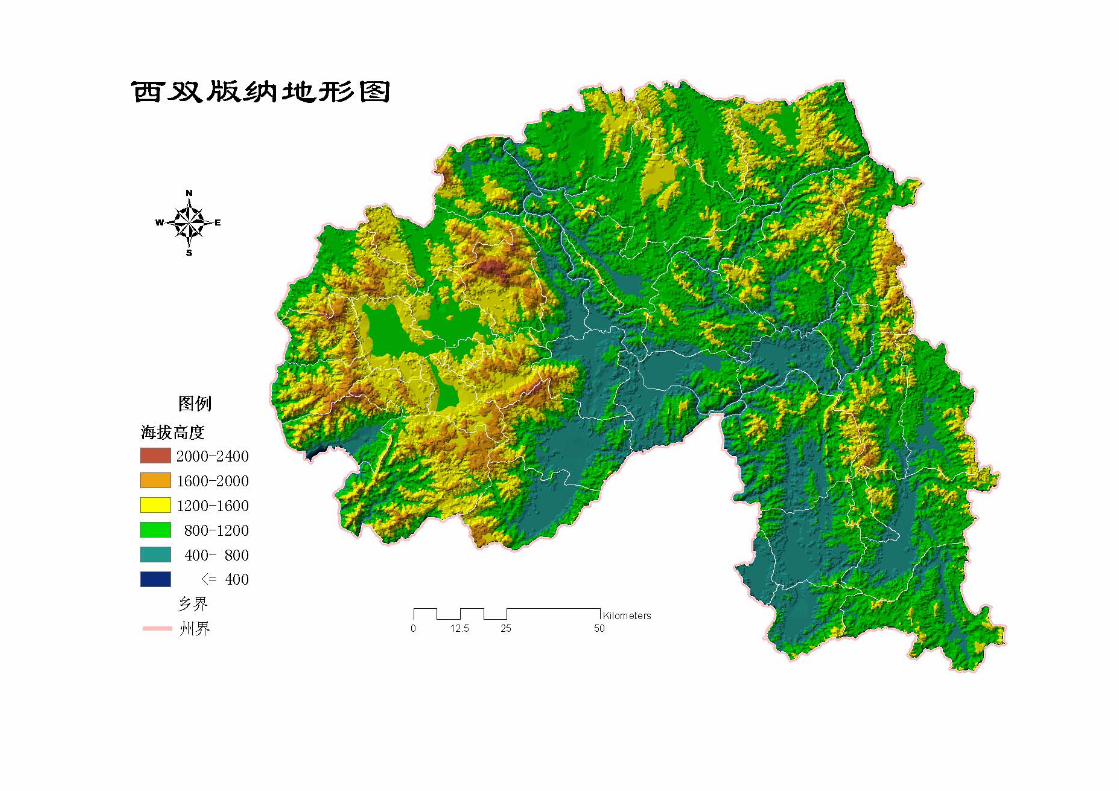
Xishuangbanna: a Dai Autonomous Prefecture in S YunnanLancang RiverBiodiversity: total land area of 1,915,167 ha, it covers only 0.2% of the land area of China, but supports nearly 16% of its higher plant species, and more than 23% of China’s animal species can be found here. about 14% of the total land area as nature reserve. •Local economy: crop production (tea, rubber, fruits), tourism etc. The GNP for the year 1988 and 2003 were $163.20 million(NPV) and $701.09 million respectively.
Menglun: a typical township in Xishuangbanna, area: 33488 ha. •ecologically important•representative of the environmental and socio-economic conditions of Xishuangbanna.•Luosuo River, winds from the north to the southwest to feed the Mekong River.
Study area
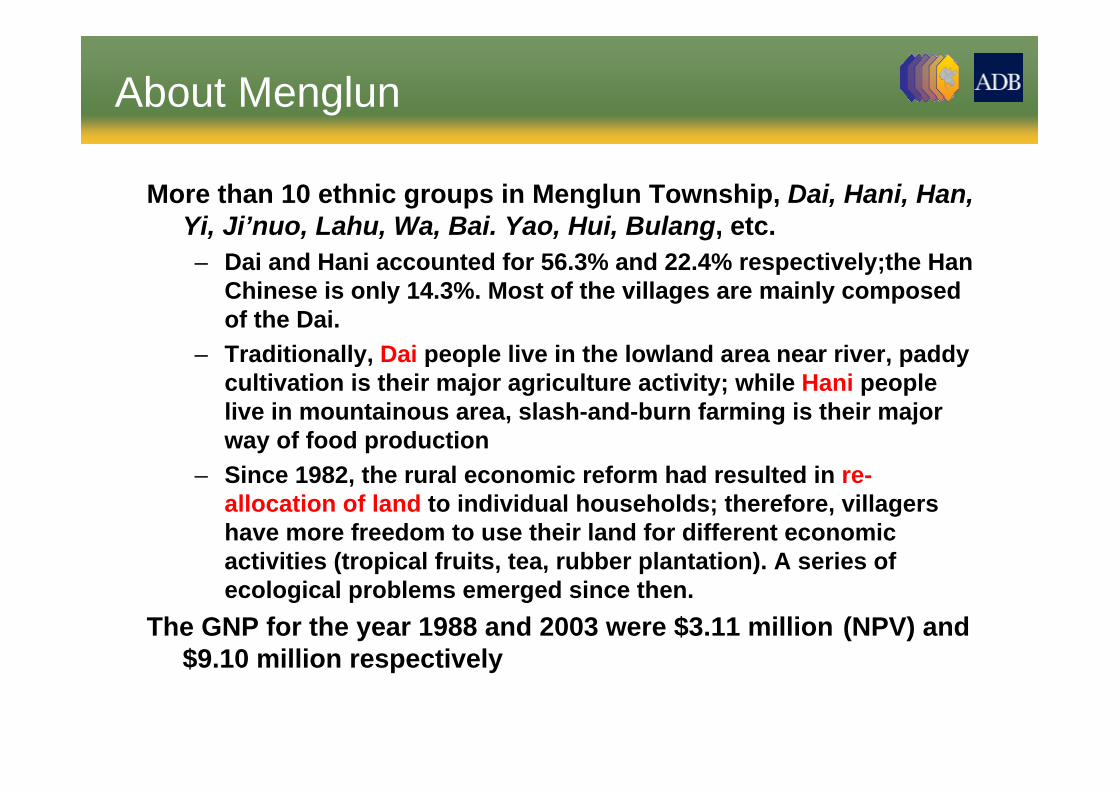
More than 10 ethnic groups in Menglun Township, Dai, Hani, Han, Yi, Ji’nuo, Lahu, Wa, Bai. Yao, Hui, Bulang, etc. – Dai and Hani accounted for 56.3% and 22.4% respectively;the Han
Chinese is only 14.3%. Most of the villages are mainly composed of the Dai.
– Traditionally, Dai people live in the lowland area near river, paddy cultivation is their major agriculture activity; while Hani people live in mountainous area, slash-and-burn farming is their major way of food production
– Since 1982, the rural economic reform had resulted in re-allocation of land to individual households; therefore, villagers have more freedom to use their land for different economic activities (tropical fruits, tea, rubber plantation). A series of ecological problems emerged since then.
The GNP for the year 1988 and 2003 were $3.11 million (NPV) and $9.10 million respectively
About Menglun

The data used to estimate the areas of different land use and land cover for Xishuangbanna and Menglun were extracted from:– cloud-free LANDSAT TM / ETM images obtained in February
1988 and March 2003. – The data sets were re-geo-referenced with the aids of 1:50,000
topographic maps, and GPS points using the ERDAS Imagine software, which incorporates functions for both image processing and the use of geographic information system (GIS).
– We used the RESAMPLING module to resample the data into a Universal Transverse Mercator (UTM) coordinate system. Average root mean square (RMS) error of less than 0.5 was achieved for both images and the pixel size were kept as 30 x 30 m.
Data collection and preparation
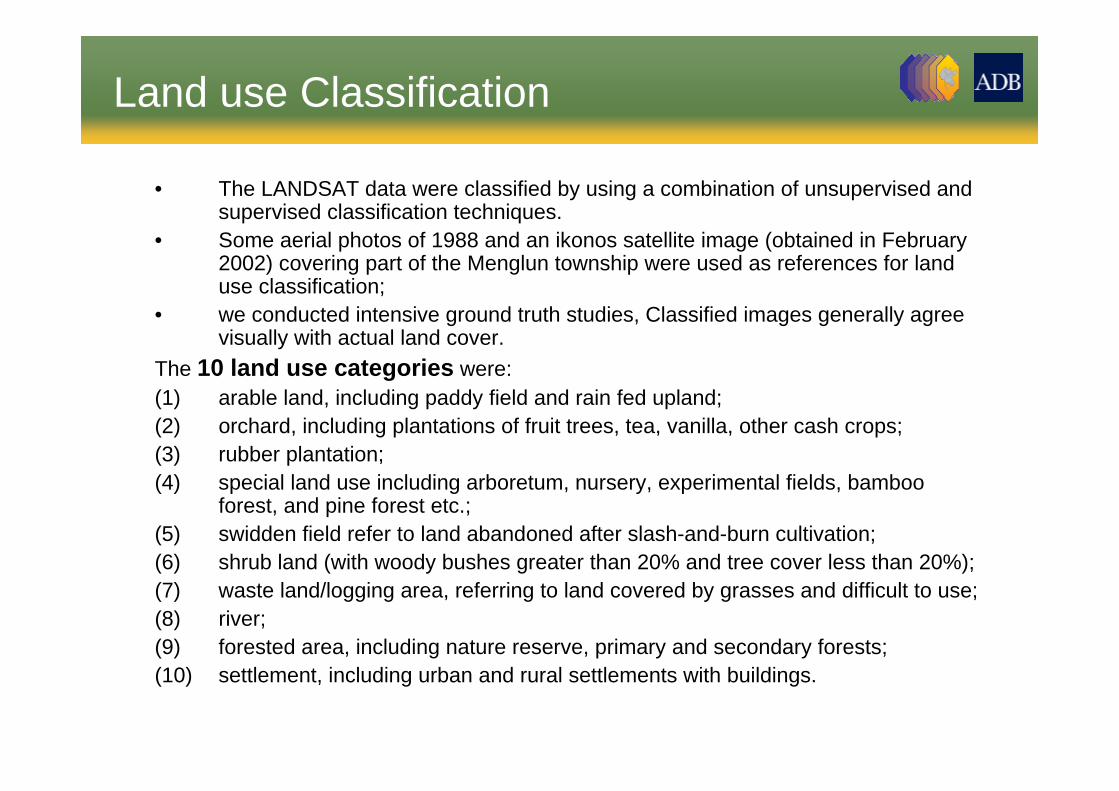
• The LANDSAT data were classified by using a combination of unsupervised and supervised classification techniques.
• Some aerial photos of 1988 and an ikonos satellite image (obtained in February 2002) covering part of the Menglun township were used as references for land use classification;
• we conducted intensive ground truth studies, Classified images generally agree visually with actual land cover.
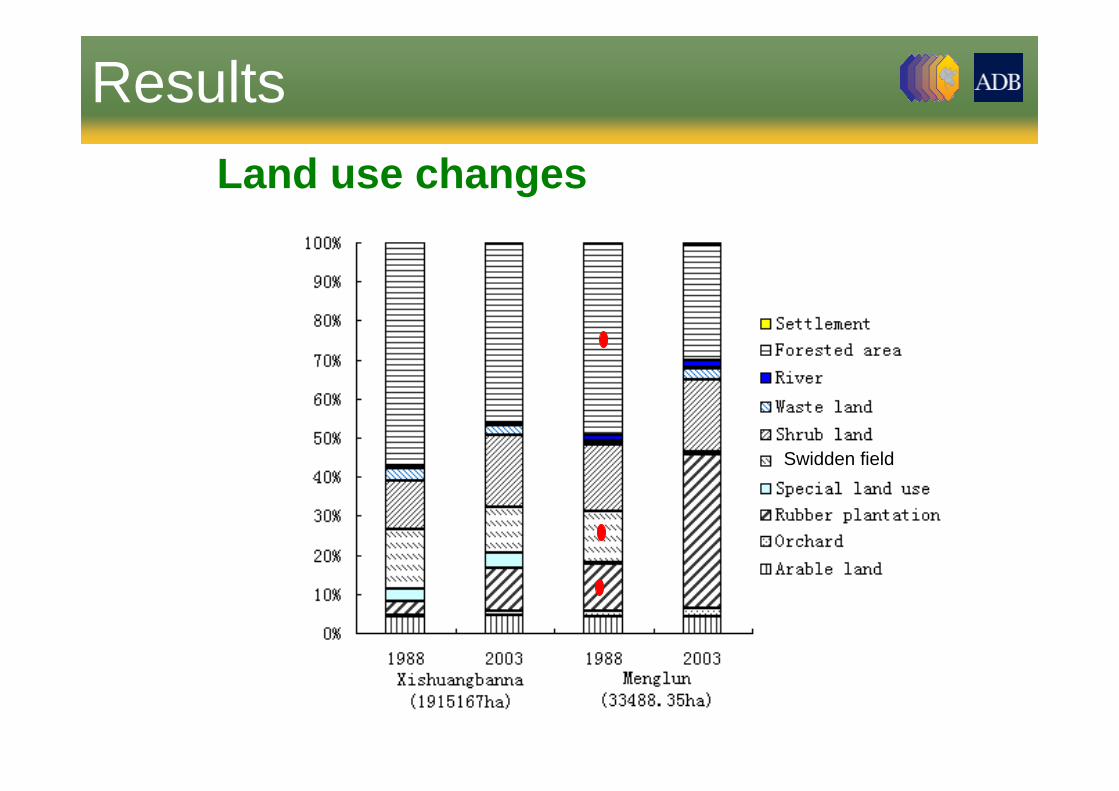
The 10 land use categories were: (1) arable land, including paddy field and rain fed upland; (2) orchard, including plantations of fruit trees, tea, vanilla, other cash crops; (3) rubber plantation;(4) special land use including arboretum, nursery, experimental fields, bamboo
forest, and pine forest etc.; (5) swidden field refer to land abandoned after slash-and-burn cultivation;(6) shrub land (with woody bushes greater than 20% and tree cover less than 20%);(7) waste land/logging area, referring to land covered by grasses and difficult to use;(8) river; (9) forested area, including nature reserve, primary and secondary forests; (10) settlement, including urban and rural settlements with buildings.
Land use Classification
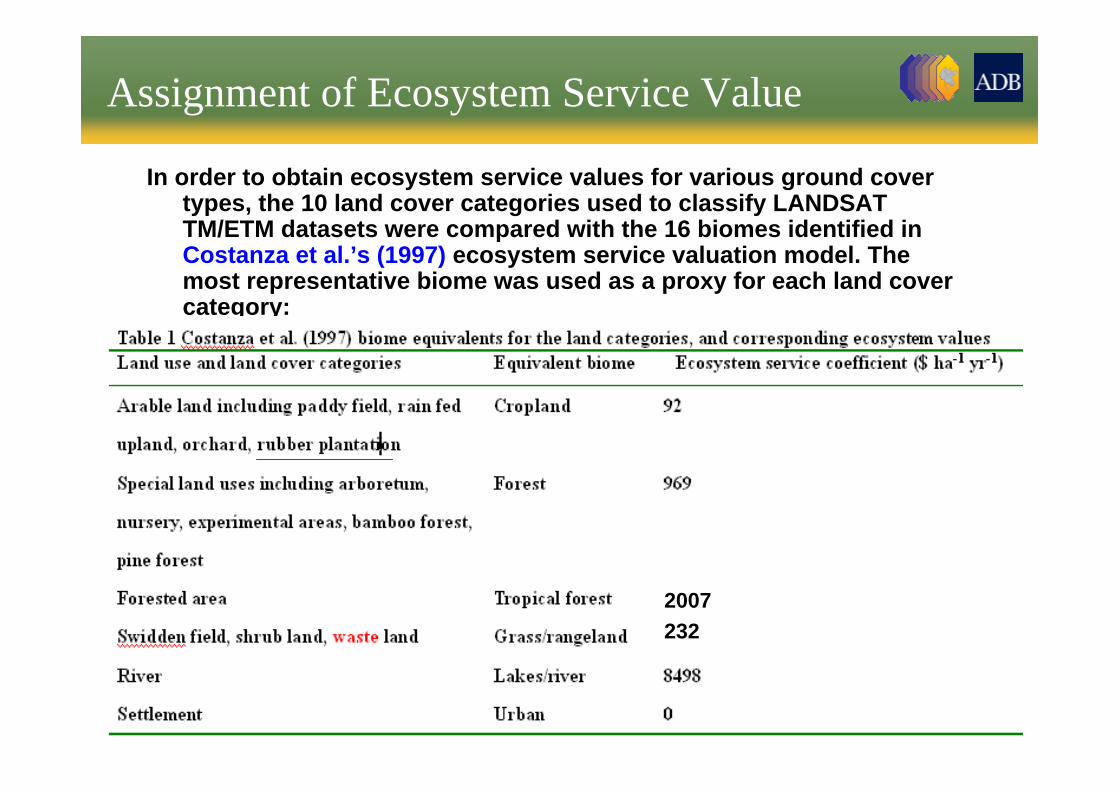
In order to obtain ecosystem service values for various ground cover types, the 10 land cover categories used to classify LANDSAT TM/ETM datasets were compared with the 16 biomes identified in Costanza et al.’s (1997) ecosystem service valuation model. The most representative biome was used as a proxy for each land cover category:
Assignment of Ecosystem Service Value
2007232

The total value of ecosystem service in the study area in 1988 and 2003 was obtained as follows:
ESV=∑(Ak x VCk)where ESV is the estimated ecosystem service value, Ak is the
area (ha) and VCk the value coefficient ($ ha-1 per year) for land use category ‘k’.
we also estimated the impacts of such changes on individual ecosystem functions within the study area. The values of services provided by individual ecosystem functions were calculated using the following equation:
ESVf = ∑(Ak x VCfk)where ESVf is the estimated ecosystem service value of function
‘f’, Ak is the area (ha) and VCfk the value coefficient of function f ($ha-1 yr-1) for land use category ‘k’.
Swidden field
ResultsLand use changes

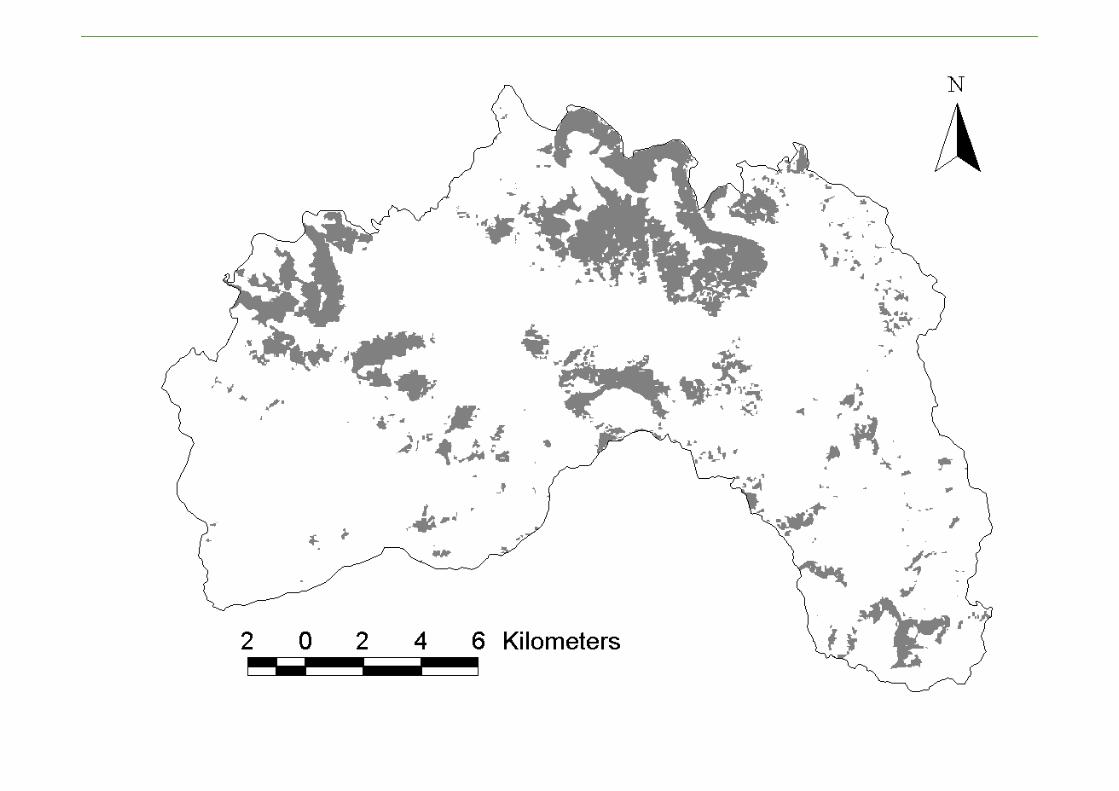

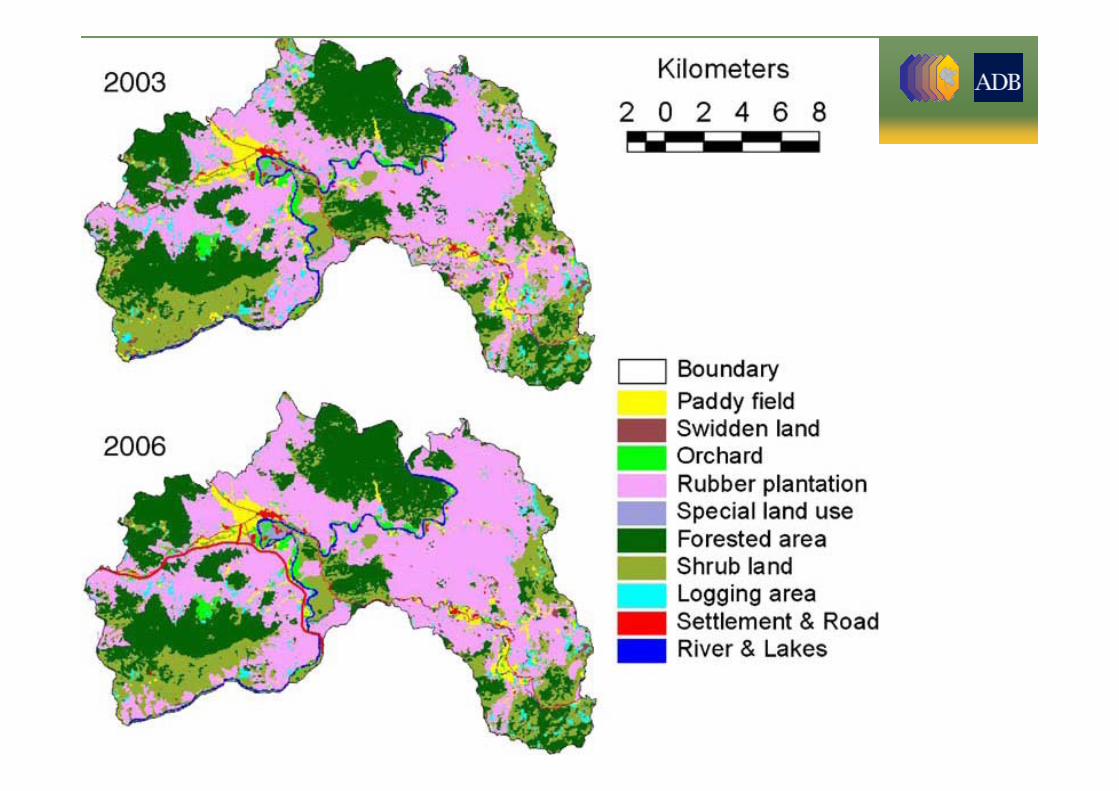
Land Use / land Cover Change: Menglun

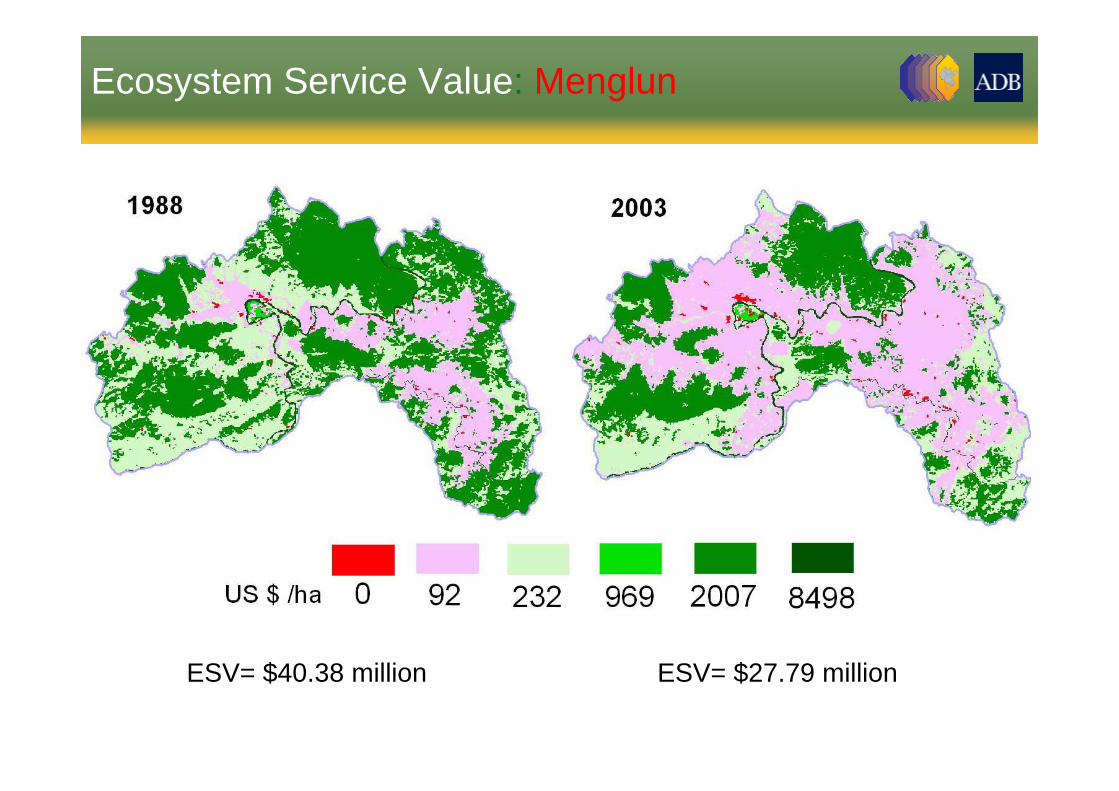
Ecosystem Service Value: Menglun
ESV= $40.38 million ESV= $27.79 million
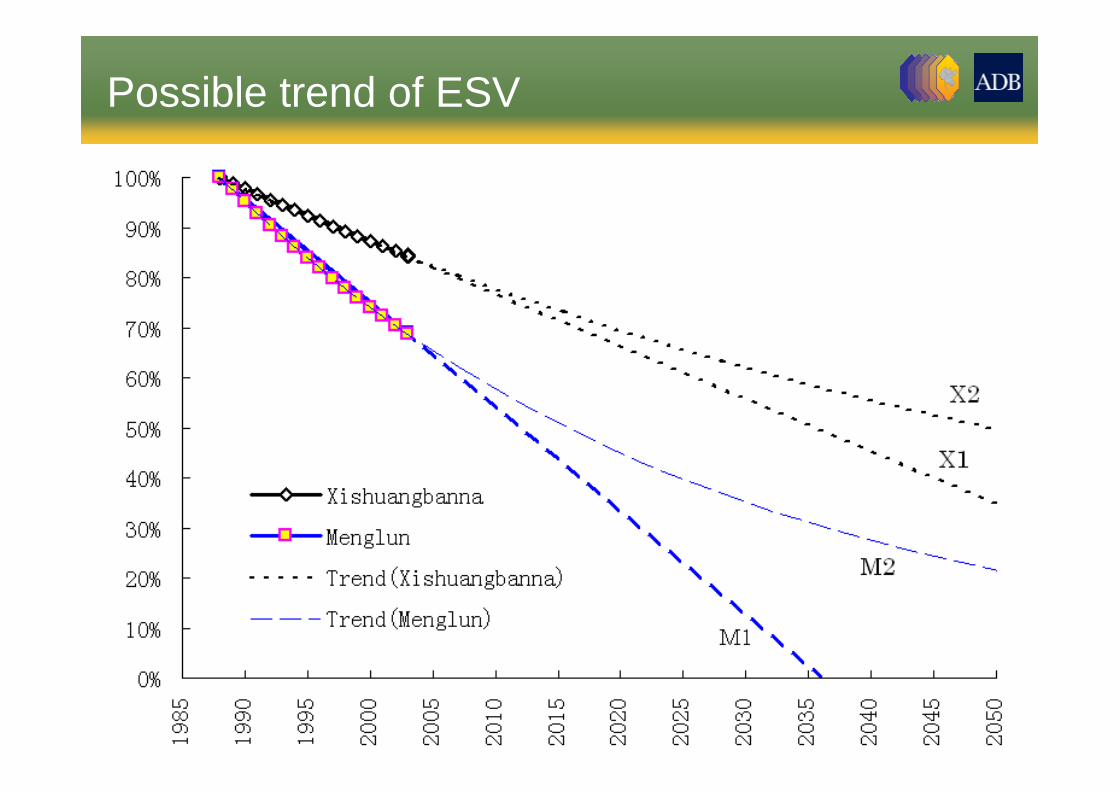
Possible trend of ESV


Change of landscape indices: Menglun
Number of patches
Mean patch size
Largest patch index
Patch density

Discussion• the land use and land cover in the study area experienced
significant changes. The increase of rubber plantation was at the expenses of ecologically important tropical forests and traditionally practiced swidden farming, especially, the mono-cultured rubber plantation in Menglun Township has become a dominant type of land use and land cover to support local economy;
• the estimated ecosystem service values (ESV) at both prefecture level and township level dropped by $389.55 million/year and $12.58 million/year respectively;
• The ESVs in 2003 were about 3 times as much as the values of local GNP, while they were 15 times and 13 times in Xishuangbanna and Menglun respectively in 1988 ;
• In the agriculture-based economy as Menglun Township, it can be assumed that a $1 increase in GNP was at the cost of at least $2decrease in ESV.
• Tropical forests play an important role in ecosystem services and processes in the study areas;
• the abrupt shift of land use has resulted in aggregate decline of ecosystem services;
• significant changes occurred in the ecological functions such as nutrient cycling, erosion control and climate regulation, provision of raw materials and habitat or refugia for wildlife.
The weakening of such services was convinced by a number of studies:– Li and Sha (2005) presented that the rubber plantation and upland rice
field were very low in nitrogen storage and mineralization rate and exhibited significant variation comparing with other land use patterns;
– Zhang et al. (1997) compared the runoff characteristics between tropical rainforest and rubber plantation;
– Liu et al. (2003) reported that rubber plantation is less capable of intercepting fog in dry season that compensates rainfall deficits in this area;
– Li (2001) described the climate changes in Menglun of Xishuangbanna for the last 40 years, and concluded that the climate becomes warmer and drier partly due to changes in tropical forest cover;
– Zhu et al. (2004) reported habitat change and biodiversity losses in Xishuangbanna due to forest fragmentation.
– Loss of traditional swidden field also resulted in loss of agro-biodiversity according to Guo et al. (2002)

• policy effects and market conditions;• effort for the conservation of tropical forest ecosystem should be
enhanced;• provision of alternative economic opportunities, particularly for
private rubber growers; ……• appropriate ecological compensation mechanisms should be
established on the basis of ESV;• “Green GNP” as performance indicator ?
Which ecosystems supply what services? How much?
Thank you
For recent publication:doi: 10.1007/s10661-007-0067-7