impact of land use and land cover change on environmental degradation in lake qinghai watershed,...
TRANSCRIPT

land degradation & development
Land Degrad. Develop. 20: 69–83 (2009)
Published online 26 November 2008 in Wiley InterScience (www.interscience.wiley.com) DOI: 10.1002/ldr.885
IMPACT OF LAND USE AND LAND COVER CHANGE ONENVIRONMENTAL DEGRADATION IN LAKE QINGHAI WATERSHED,
NORTHEAST QINGHAI-TIBET PLATEAU
X.-Y. LI1,2*, Y.-J. MA2, H.-Y. XU2, J.-H. WANG3 AND D.-S. ZHANG1
1State Key Laboratory of Earth Surface Processes and Resource Ecology, Beijing Normal University, Xinjiekouwai Street 19, Beijing 100875,China
2Institute of Land Resources, College of Resources Science and Technology, Beijing Normal University, Beijing 100875, China3Cold and Arid Regions Environmental and Engineering Research Institute, Chinese Academy of Sciences, Lanzhou 730000, China
Received 18 June 2008; Revised 21 September 2008; Accepted 3 October 2008
ABSTRACT
Lake Qinghai, the largest saline lake in China, covers 4234 km2 (2007) with a catchment area of 29 660 km2 on the northeasternmargin of the Qinghai-Tibet Plateau. The ecosystem of the lake is extremely vulnerable and sensitive to global climate changeand human interference. However, little information is available on land use/cover change (LUCC) in Lake Qinghai watershed.Using a geographical information system (GIS) and remote sensing (RS), this study analysed land use and land cover changepattern in Lake Qinghai watershed between 1977 and 2004 and discussed major environmental issues in this area. LUCCanalysis indicated that grassland (63 per cent) and water body (18 per cent) dominated in the watershed and the magnitude of theland use and land cover changewas generally low; the percentage of the change of various land types relative to the total area wasless than 1 per cent. From 1977 to 2004, cropland, sandy land, bare rock, salinized land, swampland and built-up areas increasedby 0�43, 0�35, 0�24, 0�06, 0�03 and 0�03 per cent of the total area, respectively; in contrast, water body, grassland and woodlanddecreased by 0�99, 0�22 and 0�05 per cent, respectively. Moreover, the area of LUCC tended to expand from places around thelake to the upper reaches of the watershed during the last three decades. The LUCC transition pattern was: woodland convertedto grassland, grassland converted to cropland and water body converted to sandy land. Lake level decline and grasslanddegradation are major ecological and environmental problems in Lake Qinghai watershed. The level and area of the lakedecreased at the rate of 6�7 cm a�1 and 6�4 km2 a�1, respectively, between 1959 and 2007, resulting in sandy land expansion andwater quality deterioration. Lake level decline and area shrinkage was mainly attributed to climate change, but grasslanddegradation was mainly resulted from anthropogenic activities (increasing population, overgrazing and policy). Copyright #2008 John Wiley & Sons, Ltd.
key words: land use/cover change; Lake Qinghai; lake level; grassland; P.R. China
INTRODUCTION
Land use/cover change (LUCC) has important impacts on the functioning of socio-economic and environmental
systems with important tradeoffs for sustainability, food security, biodiversity and the vulnerability of people and
ecosystems to global change impacts (Lesschen et al., 2005). Land cover change refers to the complete replacement
of one cover type by another, for example deforestation. Land use change includes the modification of land cover
types, for example intensification of agricultural management or other changes in the farming system. Land use and
land cover changes are the result of the interplay between socio-economic, institutional and environmental factors
*Correspondence to: X.-Y. Li, College of Resources Science and Technology, Beijing Normal University, Xinjiekouwai Street 19, Beijing100875, China.E-mail: [email protected]
Copyright # 2008 John Wiley & Sons, Ltd.

70 X.-Y. LI ET AL.
(Lesschen et al., 2005). LUCC has become a major area of research, especially since the International Geosphere
and Biosphere Programme (IGBP) and the International Human Dimensions Programme on Global Environmental
Change (IHDP) initiated their core project on land use and cover change in the mid-1990s (Turner et al., 1995;
Lambin et al., 1999).
China has experienced obvious land use change since last century. Regional land use changes in the eastern
developed regions of China have received great attention; comparatively, land use changes in its western
undeveloped regions have attracted little attention, especially on the frigid and arid Qinghai-Tibet Plateau, where
both economic development and arid environmental changes strongly affect land use change (Wang et al., 2008).
Lake Qinghai, the largest saline inland lake with an area of 4234 km2 (in 2007) at an elevation of 3193m, is located
in the northeastern Qinghai-Tibet plateau. The lake is extremely sensitive to climate changes because it lies in a
critical transitional zone, where the East Asian summer monsoon, Indian summer monsoon, winter monsoon and
the westerly jet stream prevail (Xu et al., 2006). In the recent decades, the lake has experienced severe declines in
water level and its watershed suffered from a series of environmental problems (grassland degradation, wetland
shrinkage, biodiversity reduction, desertification expansion and lake water deterioration) (Li et al., 2007). Thus the
lake has attracted much attention worldwide and it becomes a hot place for research of climate changes and
environmental issues (Hao, 2008). For example, Lake Qinghai Drilling Project of International Continental
Scientific Drilling Program is being in progress (An et al., 2006). Recently, a 10-year plan on environmental
restoration in Lake Qinghai watershed has been initiated (Hao, 2008).
The ecological issues affecting Lake Qinghai are complex, the driving forces are mainly resulted from natural
(climatic) and anthropogenic factors. However, information concerning human activities (e.g. LUCC) is scarce in this
area, therefore, it is necessary to know land use change and its possible effects on ecological degradation in the lake
watershed. The objectives of the study were to analyse land use and land cover changes in Lake Qinghai watershed
between 1977 and 2004 using geographical information system (GIS) and remote sensing (RS), and to discuss major
environmental issues in this area. This would help us to have a better understanding of the effect of human activity on
the processes of land degradation in the past and may enable the improvement of future planning strategies.
STUDY AREA
Lake Qinghai lies in a closed intermountain basin between 368320–378150N and 998360–1008470E (Figure 1), which
is situated in the semiarid, cold and high altitude climate zone. The mean annual temperature, precipitation and
evaporation are �0�78C, 250 and 800–1000mm, respectively (Shen et al., 2005). The climate of the lake is mainly
influenced by three air masses: East Asian monsoon, Indian monsoon and westerly atmospheric flow. There are
distinctive seasonal shifts associated with a monsoonal climate in Lake Qinghai basin (Qin and Huang, 1998). In
the winter, in the upper atmosphere westerlies prevail and in the lower atmosphere the polar cold air mass prevails.
Theweather is clear, dry, cold and windy. In the summer, the Asiatic depression is over the Qinghai-Tibetan Plateau
and the subtropical anticyclone (STA) is displaced northward to 308N with massive moisture precipitating in East
Asia. The condition is warm and wet. About 70–80 per cent of the annual rainfall occurs in the summer and early
autumn.
Lake Qinghai is a closed-catchment lake with no surface water outflow. Thewhole catchment area is 29 660 km2.
The lake is surrounded by a few mountains: Datong Mt., Riyue Mt. and South Qinghai Mt. (Figure 1). Vegetation is
dominated by montane shrub and alpine meadow in the catchment. There are virtually no forests in the basin, only a
limited area of desert, and some irrigated farmland to the north and northeast of the lake. The orography of the basin
runs from northwest to southeast. The highest part of the basin is located in the northwest and reaches more than
5000m above sea level. More than 40 rivers flow into Lake Qinghai, but most are intermittent. Five of the inflows
contribute 83 per cent of the total runoff. The longest and greatest river is Buha River, with a discharge of
7�85� 108m3 a�1, equal to almost half of the total runoff; the second river is Shaliu River with a discharge of
2�46� 108m3 a�1, 14�5 per cent of the total runoff to the lake.
Copyright # 2008 John Wiley & Sons, Ltd. LAND DEGRADATION & DEVELOPMENT, 20: 69–83 (2009)
DOI: 10.1002/ldr
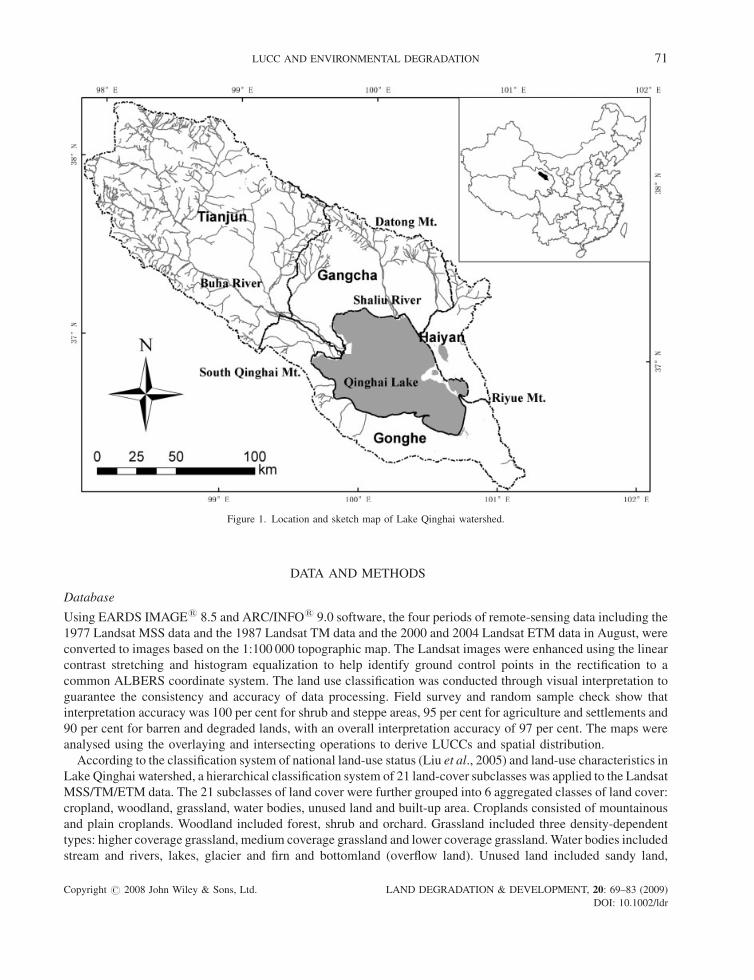
Figure 1. Location and sketch map of Lake Qinghai watershed.
LUCC AND ENVIRONMENTAL DEGRADATION 71
DATA AND METHODS
Database
Using EARDS IMAGE1 8.5 and ARC/INFO1 9.0 software, the four periods of remote-sensing data including the
1977 Landsat MSS data and the 1987 Landsat TM data and the 2000 and 2004 Landsat ETM data in August, were
converted to images based on the 1:100 000 topographic map. The Landsat images were enhanced using the linear
contrast stretching and histogram equalization to help identify ground control points in the rectification to a
common ALBERS coordinate system. The land use classification was conducted through visual interpretation to
guarantee the consistency and accuracy of data processing. Field survey and random sample check show that
interpretation accuracy was 100 per cent for shrub and steppe areas, 95 per cent for agriculture and settlements and
90 per cent for barren and degraded lands, with an overall interpretation accuracy of 97 per cent. The maps were
analysed using the overlaying and intersecting operations to derive LUCCs and spatial distribution.
According to the classification system of national land-use status (Liu et al., 2005) and land-use characteristics in
Lake Qinghai watershed, a hierarchical classification system of 21 land-cover subclasses was applied to the Landsat
MSS/TM/ETM data. The 21 subclasses of land cover were further grouped into 6 aggregated classes of land cover:
cropland, woodland, grassland, water bodies, unused land and built-up area. Croplands consisted of mountainous
and plain croplands. Woodland included forest, shrub and orchard. Grassland included three density-dependent
types: higher coverage grassland, medium coverage grassland and lower coverage grassland.Water bodies included
stream and rivers, lakes, glacier and firn and bottomland (overflow land). Unused land included sandy land,
Copyright # 2008 John Wiley & Sons, Ltd. LAND DEGRADATION & DEVELOPMENT, 20: 69–83 (2009)
DOI: 10.1002/ldr

Table I. Land use types and their descriptions in Lake Qinghai watershed
Land use types Description
Dry cropland Rainfed cropland without water supply and irrigating facilitiesDense forest Woodland with a crown density >30 per centScrubland Scrubland with a crown density >40 per cent and height less than 2mSparse forest Woodland with a crown density of 10–30 per centHigher coverage grassland Grassland with a coverage >50 per centMedium coverage grassland Grassland with a coverage between 20 and 50 per centLower coverage grassland Natural grassland with a coverage of 5–20 per centStream and rivers Lands covered by rivers including canalsLakes Lands covered by lakesGlacier and firn Lands covered by perennial snowfields and glaciersOverflow land Flood-affected land on riverside or lakesideBuilt-up land Residential area and land used for factories or mining sitesSandy land Land covered with sand, vegetation coverage <5 per centSalinized land Lands with salt accumulation and sparse vegetationSwampland Lands with a permanent mixture of water and herbaceous or woody
vegetation that cover extensive areasBare soil Bare exposed soil with less than 5 per cent vegetation coverBare rock Bare exposed rock with less than 5 per cent vegetation cover
72 X.-Y. LI ET AL.
salinized land, bare soil, bare rock, swampland and tundra. Built-up lands included roads as well as residential and
industrial areas, the detail descriptions of some land use types are listed in Table I (Liu et al., 2005; Wang et al.,
2008).
Methods
The patterns and processes of LUCC were described by land use change rate and transition rate in the study.
Land use change rate for a single land use type during different periods was assessed by the following formula
(Chen, 1998; Wang and Bao, 1999):
K ¼ Ub � Ua
Ua
� 1
T� 100%
where K is land use change rate for a single land use type (per cent), Ua and Ub are the areas of the land-use type at
the beginning and at the end for a period, respectively. T is time intervals (years).
Comprehensive land use change rate for the integrated all land use types during different periods was assessed by
the following formula (Chen, 1998; Wang and Bao, 1999):
LC ¼Pn
i¼l DLUi�j
2�Pn
i¼l LUi
� 1
T� 100%
where LC is comprehensive land use change rate (per cent), LUi is the area of the ith land-use type at the beginning,
DLUi–j is the area of the ith land-use type converted to the jth land-use type.
The matrixes of transition probabilities of land-use types in different periods were established and were then used
to analyse the transition rate from one land use type into another for the periods 1977–1987, 1987–2000 and 2000–
2004. Each matrix represents either the probability of persistence of each category of land use/cover from the first to
the last year of the period, or the probabilities of transition to another land-cover category during the same period.
Matrix values were standardized to obtain annualized change values. The procedure for standardization of matrices
Copyright # 2008 John Wiley & Sons, Ltd. LAND DEGRADATION & DEVELOPMENT, 20: 69–83 (2009)
DOI: 10.1002/ldr

LUCC AND ENVIRONMENTAL DEGRADATION 73
to assess land-cover change was proposed by Rovainen (1996) in order to make comparisons based on annual
values when the information derives from several different time intervals.
RESULTS AND DISCUSSION
Land Use and Land Cover Change
Based on the analysis of the three land use/cover maps for the periods of 1977–1987, 1987–2000 and 2000–2004
(Figure 2), the area of the main land use/cover classes for the four time periods was assessed (Table II). The
individual subclasses of the unused land class are listed in Table II because sandy land and bare rock had
experienced great changes. Table II indicates that land use/cover types were mainly dominated by grassland and
water body, which accounted for about 63 and 18 per cent of the total area, respectively. From 1977 to 2004,
cropland, sandy land, bare rock, salinized land, swampland and built-up areas increased by 0�43, 0�35, 0�24, 0�06,0�03 and 0�03 per cent of the total area, respectively; in contrast, water body, grassland and woodland decreased by0�99, 0�22 and 0�05 per cent, respectively. Although the variation amplitude of land use pattern for various classes
was not great, the results suggest that area of the land types for ecological use (water body, grassland and woodland)
Figure 2. Land use and land cover change in Lake Qinghai watershed during the period of 1977–1987, 1987–2000 and 2000–2004. This figure isavailable in colour online at www.interscience.wiley.com/journal/ldr.
Copyright # 2008 John Wiley & Sons, Ltd. LAND DEGRADATION & DEVELOPMENT, 20: 69–83 (2009)
DOI: 10.1002/ldr

Table
II.Landuse/cover
changein
LakeQinghai
watershed
asextractedfrom
Landsatim
ages
1977–2004
Year
Areaand
percentage
Cropland
Woodland
Grassland
Water
body
Built-up
areas
Sandy
land
Salinized
land
Swam
pland
Bare
soil
Bare
rock
Tundra
1977
km
2321�87
519�59
18995�15
5500�24
7�93
562�36
28�01
2327�07
0�15
189�47
1238�70
%1�08
1�75
63�98
18�53
0�03
1�89
0�09
7�84
0�00
0�64
4�17
1987
km
2414�50
510�83
18941�52
5393�68
14�41
619�37
41�85
2323�79
0�15
189�90
1240�55
%1�40
1�72
63�80
18�17
0�05
2�09
0�14
7�83
0�00
0�64
4�18
2000
km
2444�79
503�88
18896�99
5360�84
17�48
656�32
45�15
2330�35
0�15
189�54
1245�29
%1�50
1�70
63�65
18�06
0�06
2�21
0�15
7�85
0�00
0�64
4�19
2004
km
2448�54
503�64
18930�44
5207�47
18�56
665�17
45�31
2335�44
0�15
262�15
1273�92
%1�51
1�70
63�76
17�54
0�06
2�24
0�15
7�87
0�00
0�88
4�29
1977–2004
km
2change
126�67
�15�95
�64�71
�292�77
10�64
102�81
17�30
8�37
0�00
72�68
35�22
%change
0�43
�0�05
�0�22
�0�99
0�03
0�35
0�06
0�03
00�24
0�12
Copyright # 2008 John Wiley & Sons, Ltd. LAND DEGRADATION & DEVELOPMENT, 20: 69–83 (2009)
DOI: 10.1002/ldr
74 X.-Y. LI ET AL.

-300
-200
-100
0
100
SwamplandBuilt-up areas
Salinized landBare rock
Sandy landCropland
Woodland
Grassland
Water body
Cha
nge
of la
nd u
se/c
over
(km
2 )
Figure 3. Area changes of the different types of land use and land cover between 1977 and 2004.
LUCC AND ENVIRONMENTAL DEGRADATION 75
tended to decrease, but the area of the land types for agricultural production and human residence tended to increase
(Figure 3), indicating that anthropogenic influences on LUCC have being increasing during the recent three
decades. It is interesting to note that water body recorded the largest net decrease of 293 km2 from 5500 km2 in 1977
to 5207 km2 in 2004; of which the lake area deceased by 178�6 km2, and glacier and firn area by 128�6 km2. There is
no obvious change for river area but the bottomland area increased by 13�1 km2.
LUCC rate in Table III indicates that significant LUCC occurred between 1977 and 1987, particularly for
cropland, built-up areas and sandy land, and the intensity decreased in the two periods of 1987–2000 and 2000–
2004. However, the intensity of decreasing rate for water body increased with years. For the grassland, the area
decreased between 1977 and 2000; but it increased between 2000 and 2004. This was mainly because the
government launched the ‘grain to green’ programme to return croplands not suitable for agriculture to forests or
grasslands for environmental restoration (Hao, 2008). We also noted that the area of LUCC tended to expand from
the places around the lake to the upper reaches of the watershed during the last three decades; and the main land use
types with great changes were cropland, grassland and water body for the period of 1977–1987, 1987–2000 and
2000–2004, respectively (Figure 2).
LUCC Transition Matrices
The probabilities of change were obtained from the transition matrices corresponding to the periods 1977–1987,
1987–2000 and 2000–2004 (Table IV). During the first period between 1977 and 1987, the class water body showed
great transition as compared to the other classes. Most of the transformed water body was converted to sandy land
(60�85 km2, 1�1 per cent), 0�5 per cent converted to other unused land and 0�34 per cent converted to grassland.
Grassland also experienced great conversion between 1977 and 1987, 0�54 per cent (102�05 km2) was changed into
cropland, and the remainder were mainly converted to built-up areas (4�07 km2) and salinized land (4�22 km2).
Woodland showed minimal changes, only 8�76 km2 converted to grassland. The unused land keep great persistence
within the same class except only a small part of sandy land converted to salinized land. During the periods of
1987–2000 and 2000–2004, LUCC dynamics were weakened as compared to the period of 1977–1987. In general,
the LUCC transition pattern in Lake Qinghai watershed was: woodland converted to grassland, grassland converted
to cropland and water body converted to sandy land. However, during the period of 2000–2004, 50�40 km2 water
body, 8�88 km2 sandy land, 15�30 km2 swampland and 24�13 km2 tundra converted to grassland.
Effect of LUCC on Environmental Degradation
Lake level decline is the most important ecological and environmental issue in the region. During 1977–2004, water
body experienced noticeable shrinkage. Data analysis from hydrological stations indicated that the area of Lake
Qinghai has shrunk from 4401 km2 in 1977 to 4186 km2 in 2004, and correspondingly, the lake level decreased from
Copyright # 2008 John Wiley & Sons, Ltd. LAND DEGRADATION & DEVELOPMENT, 20: 69–83 (2009)
DOI: 10.1002/ldr

Table
III.
Landuse/cover
changerate
duringdifferentperiodsbetween1977and2004(per
cent)
Period
Landuse/cover
changerate
forasingle
landuse
type
Comprehensivelanduse
changerate
Cropland
Woodland
Grassland
Water
body
Built-up
area
Sandy
land
Salinized
land
Swam
pland
Bare
soil
Bare
rock
Tundra
1977–1987
2.88
�0.17
�0.03
�0.19
8.18
1.01
4.94
�0.01
0.00
0.02
0.01
0.05
1987–2000
0.56
�0.10
�0.02
�0.05
1.64
0.46
0.61
0.02
0.00
�0.01
0.03
0.02
2000–2004
0.21
�0.01
0.04
�0.72
1.54
0.34
0.09
0.05
0.00
9.58
0.57
0.12
Copyright # 2008 John Wiley & Sons, Ltd. LAND DEGRADATION & DEVELOPMENT, 20: 69–83 (2009)
DOI: 10.1002/ldr
76 X.-Y. LI ET AL.

Table
IV.Transitionmatrixoflanduse
changeprocesses
inLakeQinghai
watershed
from
1977to
2004(km
2)
Year
Cropland
Woodland
Grassland
Water
body
Built-up
area
Sandy
land
Salinized
land
Swam
pland
Bare
soil
Bare
rock
Tundra
Total
1977/1987
Cropland
312�46
0�00
7�09
0�00
2�31
0�00
0�00
0�00
0�00
0�00
0�00
321�87
Woodland
0�00
510�83
8�76
0�00
0�00
0�00
0�00
0�00
0�00
0�00
0�00
519�59
Grasslands
102�05
0�00
18878�78
0�17
4�07
1�81
4�22
2�20
0�00
0�42
1�43
18995�15
Water
body
0�00
0�00
18�59
5393�55
0�00
60�85
3�97
23�28
0�00
0�00
0�00
5500�24
built-upareas
0�00
0�00
0�00
0�00
7�93
0�00
0�00
0�00
0�00
0�00
0�00
7�93
Sandyland
0�00
0�00
0�00
0�00
0�00
556�70
5�65
0�00
0�00
0�00
0�00
562�36
Salinized
land
0�00
0�00
0�00
0�00
0�00
0�00
28�00
0�00
0�00
0�00
0�00
28�01
Swam
pland
0�00
0�00
28�32
0�00
0�10
0�00
0�00
2298�30
0�00
0�00
0�34
2327�07
Baresoil
0�00
0�00
0�00
0�00
0�00
0�00
0�00
0�00
0�15
0�00
0�00
0�15
Barerock
0�00
0�00
0�00
0�00
0�00
0�00
0�00
0�00
0�00
189�47
0�00
189�47
Tundra
0�00
0�00
0�00
0�00
0�00
0�00
0�00
0�00
0�00
0�00
1238�70
1238�70
Total
414�51
510�83
18941�55
5393�72
14�41
619�36
41�85
2323�78
0�15
189�89
1240�47
/1987/2000
Cropland
413�07
0�00
0�22
0�00
1�21
0�00
0�00
0�00
0�00
0�00
0�00
414�50
Woodland
0�00
503�88
5�15
0�00
0�07
0�00
0�00
1�73
0�00
0�00
0�00
510�83
Grasslands
31�72
0�00
18873�04
1�16
1�79
14�17
1�94
13�47
0�00
0�00
4�24
18941�52
Water
body
0�00
0�00
3�15
5359�66
0�00
23�80
0�91
6�15
0�00
0�00
0�00
5393�68
built-upareas
0�01
0�00
0�00
0�00
14�40
0�00
0�00
0�00
0�00
0�00
0�00
14�41
Sandyland
0�00
0�00
0�75
0�00
0�00
618�17
0�45
0�00
0�00
0�00
0�00
619�37
Salinized
land
0�00
0�00
0�00
0�00
0�00
0�00
41�85
0�00
0�00
0�00
0�00
41�85
Swam
pland
0�00
0�00
13�86
0�00
0�01
0�00
0�00
2309�00
0�00
0�92
0�00
2323�79
Baresoil
0�00
0�00
0�00
0�00
0�00
0�00
0�00
0�00
0�15
0�00
0�00
0�15
Barerock
0�00
0�00
0�37
0�00
0�00
0�00
0�00
0�00
0�00
189�53
0�00
189�90
Tundra
0�00
0�00
0�35
0�00
0�00
0�00
0�00
0�00
0�00
0�00
1240�20
1240�55
Total
444�79
503�88
18896�90
5360�82
17�48
656�14
45�15
2330�34
0�15
190�45
1244�44
/2000/2004
Cropland
443�89
0�00
0�22
0�00
0�68
0�00
0�00
0�00
0�00
0�00
0�00
444�79
Woodland
0�00
501�19
0�89
0�00
0�00
0�00
0�00
0�00
0�00
0�00
1�81
503�88
Grasslands
4�24
2�40
18829�28
0�38
0�80
1�55
0�00
0�87
0�00
6�00
51�48
18896�99
Water
body
0�00
0�00
50�40
5204�54
0�00
18�55
0�25
16�82
0�00
67�81
2�47
5360�84
built-upareas
0�41
0�00
0�00
0�00
17�08
0�00
0�00
0�00
0�00
0�00
0�00
17�48
Sandyland
0�00
0�00
8�88
2�38
0�00
645�06
0�00
0�00
0�00
0�00
0�00
656�32
Salinized
land
0�00
0�00
0�09
0�00
0�00
0�00
45�06
0�00
0�00
0�00
0�00
45�15
Swam
pland
0�00
0�01
15�30
0�01
0�00
0�00
0�00
2314�20
0�00
0�06
0�77
2330�35
Baresoil
0�00
0�00
0�00
0�00
0�00
0�00
0�00
0�00
0�15
0�00
0�00
0�15
Barerock
0�00
0�00
1�26
0�00
0�00
0�00
0�00
0�00
0�00
188�28
0�00
189�54
Tundra
0�00
0�04
24�13
0�17
0�00
0�00
0�00
3�55
0�00
0�00
1217�40
1245�29
Total
448�54
503�64
18930�44
5207�47
18�56
665�17
45�31
2335�44
0�15
262�15
1273�92
/
Copyright # 2008 John Wiley & Sons, Ltd. LAND DEGRADATION & DEVELOPMENT, 20: 69–83 (2009)
DOI: 10.1002/ldr
LUCC AND ENVIRONMENTAL DEGRADATION 77
78 X.-Y. LI ET AL.
3194�91m in 1977 to 3192�77m in 2004. Figure 4 shows variation of area and level of the lake between 1959 and
2007, the level and area of the lake decreased at the rate of 6�7 cm and 6�4 km2 per year, respectively. Qin and Huang
(1998) reported that, the area of Lake Qinghai was 4980 km2 in 1908, hence the area reduced by 746 km2 during the
recent 99 years. Moreover, the shape of the lake varied significantly and several small satellite lakes were isolated
from the parent lake (Figure 5), the shoreline had shrunk 4047, 2367 and 1311m on Sandy Island of the east bank,
Bird Island of the west bank and Shaliu River of the north bank, respectively, from 1977 to 2004, and the
corresponding average annual shrinking rate of the shorelines were 150, 88 and 49m a�1, respectively (Figure 5 and
Table V).
Decline in lake level exposed lake sediments to the air, and these sediments would be blown away by wind during
dry periods, resulting in serious wind erosion (Sun et al., 2008). Mean annual wind speed is 3�6m s�1 and
the highest wind speed is 26�7m s�1 in the lake area based on 30-year meteorological records; on average, there
were 16 strong wind (>17m s�1) days and 5 dust storm days in the area. Sandy land formed around the lake where
lake water shrunk (Figure 6). Table VI indicates that sandy land expanded 3765, 1858 and 1244m on Sandy Island
of the east bank, Bird Island of the west bank and Shaliu River of the north bank, respectively, from 1977 to 2004.
Zhang et al. (2003) estimated that about 8�87� 106 ton aeolian sand was blown into the lake annually. Decline in
lake level also led to deterioration of the water quality and decrease in water supplies, the salinity of lake water
increased from 12�49 to 15�33 per cent from 1960 to 2003, and pH increased from 9�0 to 9�2 (Li et al., 2007), Yu
(1996) reported that the degree of mineralization of Lake Qinghai was 14�45 g L�1 and increased as lake shrunk and
climate became dry. The chemical component concentration of Ca2þ, Mg2þ, CO2�3 and SO2�
4 tended to decrease
and of Naþ, Kþ and Cl� tended to increase. These would deteriorate surroundings of fish and bird, and therefore
biodiversity drops significantly (Liu et al., 2007a).
Grassland degradation was another important ecological and environmental issue in Lake Qinghai watershed.
Interpretation of RS images indicated that higher coverage grassland and medium coverage grassland decreased by
128 km2 (0�4 per cent) and 91 km2 (0�3 per cent), respectively, from 1977 to 2004, while lower coverage grassland
increased by 155 km2 (0�5 per cent). This suggests that although there were small changes in the quantity of the area
of grassland, the quality of the grassland substantially dropped. Fu et al. (2008) reported that grass yield was
6056 kg ha�1 in 1989, but it varied between 1747 and 2450 kg ha�1 at present; the annual decreasing rate was about
84 kg ha�1 a�1. Grassland degradation in this region is caused primarily by overgrazing by yaks and sheep and
together with locust- and rat-induced destruction. At present, the severely degraded grassland totals 182 600 ha in
the lake area (Zhang et al., 2006). Grazing-induced degradation is especially severe during early winter and late
spring (Liu et al., 2004).
Driving Forces of Land Use Change
LUCCs are resulted from natural (climatic) and anthropogenic factors. A growing body of evidence suggests that
climate change is more important than human activity in changing water levels (Fan and Shi, 1992; Ding and Liu,
1995; Ma, 1996; Qin and Huang, 1998; Li et al., 2007; Liu et al., 2007a, 2008; Hao, 2008; Shu et al., 2008). Liu
et al. (2007b) and Sun (2008) simulated the effects of climate change and LUCC on runoff of the Buha River and
Shaliu River in Lake Qinghai watershed using Soil and Water Assessment Tool (SWAT) model, and concluded that
more than 80 per cent of variation of the runoff in the watershed was attributed to climate change. Li et al. (2007)
analysed water balance of Lake Qinghai and found that mean annual evaporation from the lake was 924mm, while
water consumption by human accounts for only a very small part of the evaporation loss (1 per cent) of the lake,
suggesting that the change of lake level depends mainly on climatic factors. Qin and Huang (1998) reported that
water level of Lake Qinghai was sensitive to the climatic changes in both temperature and precipitation. However,
the effects of precipitation on lake level were always counteracted by the rise or fall in temperature. The lake level
trend was determined by the balance of precipitation and temperature because changes in precipitation affected the
surface runoff inflow to the lake whereas the changes in temperature affected evaporation through the out-flux of
lake water (Li et al., 2007). Statistics showed that the most dramatic decline in lake level occurred in the warm and
dry years, and moderate decline in the cold and dry years, and relatively slight decline in the warm and wet years; in
contrast, water storage in the lake tended to increase and lake level rose in the cold and wet years. Therefore, Li
Copyright # 2008 John Wiley & Sons, Ltd. LAND DEGRADATION & DEVELOPMENT, 20: 69–83 (2009)
DOI: 10.1002/ldr

Figure 5. Shrinkage of water body of Lake Qinghai between 1977 and 2004. This figure is available in colour online at www.interscience.wiley.com/journal/ldr.
1960 1964 1968 1972 1976 1980 1984 1988 1992 1996 2000 2004 20083192
3193
3194
3195
3196
3197
Lake
leve
l (m
)
1960 1964 1968 1972 1976 1980 1984 1988 1992 1996 2000 2004 20084150420042504300435044004450450045504600
Lake
are
a (k
m )2
Figure 4. Variation of water level and area of Lake Qinghai between 1959 and 2007.
Copyright # 2008 John Wiley & Sons, Ltd. LAND DEGRADATION & DEVELOPMENT, 20: 69–83 (2009)
DOI: 10.1002/ldr
LUCC AND ENVIRONMENTAL DEGRADATION 79

Table V. Distance of shoreline shrinkage around Lake Qinghai between 1977 and 2004 (m)
Period Sandy Island Shaliu River Bird Island Haiyan
1977–1987 1980.6 934.6 1457.7 479.91987–2000 1157.7 264.0 580.87 123.52000–2004 908.7 112.5 327.8 75.31977–2004 4047.0 1311.1 236.4 678.7
80 X.-Y. LI ET AL.
et al. (2007) pointed out the trend of warm and dry climate might be the main reasons for the decline in lake level in
the recent decades. According to studies of Fan and Shi (1992), lake level would increase by 8�7 cm when
precipitation increases by 10 per cent and temperature keep constant; in contrast, lake level would decrease by
16�4 cm when temperature increases by 18C and precipitation keeps constant. In Lake Qinghai watershed, mean
annual air temperature increased with a rate of 0�318C per decade from 1961 to 2007 (Figure 7), particularly the
ascending tendency of air temperature was remarkably in winter with an increasing rate of 0�538C per decade (Xu
et al., 2007). The increasing magnitude of air temperature is obviously greater than the global average
(0�13� 0�038C per decade) (Trenberth et al., 2007). There was a slight increasing trend for precipitation (4�2mm
per decade) but it was not statistically significant; the inter-annual variation of precipitation was significant, there
Figure 6. Sandy land expansions around Lake Qinghai between 1977 and 2004. This figure is available in colour online at www.interscience.wiley.com/journal/ldr.
Copyright # 2008 John Wiley & Sons, Ltd. LAND DEGRADATION & DEVELOPMENT, 20: 69–83 (2009)
DOI: 10.1002/ldr

Table VI. Advance distances of sandy land expansion around the lake between 1977 and 2004 (m)
Period Sandy Island Shaliu River Bird Island Haiyan
1977–1987 1877.8 895.3 870.3 624.01987–1000 1088.5 242.5 643.4 156.62000–2004 798.3 105.9 343.8 70.91977–2004 3764.6 1243.7 1857.5 851.5
LUCC AND ENVIRONMENTAL DEGRADATION 81
were ascending tendencies during the 1960s, 1980s and 1990s, while precipitation in the 1970s showed downward
trend (Figure 7). In recent 3 years, lake level rebounded due to increasing precipitation (Figure 4). Liu et al. (2008)
and Shu et al. (2008) modelled that lake levels likely will fluctuate from 2006 to about 2010 and then rebound in the
future 30 years.
Grassland degradation was mainly resulted from anthropogenic factors. In this predominantly grazing region,
excessive reliance on animal husbandry under a growing population has exerted great pressure on the land (Liu
et al., 2004). The total population in Lake Qinghai watershed was less than 20 000 in 1949, but it increased to
85 600 in 2004; more than fourfold increase in population in recent 50 years resulted in 20-fold increase in area of
croplands. Correspondingly, the total amount of animal husbandry was 4�22 million sheep units in 2004, which was
2�9 times of that in 1949. The maximum carrying capacity in theory was 2�13 million sheep units in the watershed,
so overgrazing rate amounted to 98 per cent, this would lead serious grassland degradation (Zhang et al., 2006; Liu
et al., 2008). Moreover, tourism developed quickly in recent years, there are about more than 0�8 million travellers
per year come to Lake Qinghai, this would not only disturb grassland but also affect biodiversity (Zhang et al.,
2006).
National policy strongly affected LUCCs in Lake Qinghai watershed. Most grassland was reclaimed to cropland
under the policy of ‘reclamation for food’ after the foundation of the People’s Republic of China in 1949. The area
of cropland increased to 130 000 ha in 1960, and since then some cropland was abandoned due to unsuitability.
Since 1999, grassland has being increased under the policy of ‘conversion of cultivated land to grassland or forest’
for environmental restoration. During the period from 2000 to 2006, about 24 320 ha croplands were converted to
grassland or shrubland in Lake Qinghai watershed.
The mix of driving forces of land-use change varies in time and space, across scales. Biophysical drivers may be
as important as human drivers (Lambin and Geist, 2001). Cui et al. (2006) simulated the impact of land use changes
Tem
pera
ture
(°C
)
1960 1964 1968 1972 1976 1980 1984 1988 1992 1996 2000 2004 2008-2
-1
0
1y=0.031x-61.06 R=0.72 P<0.0001
1960 1964 1968 1972 1976 1980 1984 1988 1992 1996 2000 2004 2008
250300350400450500550 y=0.42x-455.85 R=0.105 P=0.48
Pre
cipi
tatio
n (m
m)
Figure 7. Change of annual precipitation and temperature between 1961 and 2007 at Gangcha meteorological station 10 km northwards to LakeQinghai.
Copyright # 2008 John Wiley & Sons, Ltd. LAND DEGRADATION & DEVELOPMENT, 20: 69–83 (2009)
DOI: 10.1002/ldr

82 X.-Y. LI ET AL.
on the Tibetan Plateau on local and global climate and concluded that human-induced land use changes on the
Tibetan Plateau have had a significant impact on local to regional, and to a lesser extent global, climate. Therefore
Lake Qinghai may be an ideal place to track the signal of climate change due to LUCC. The complex mechanism of
interaction between climate, LUCC and environment need further deep investigation in this region.
CONCLUSIONS
LUCC analysis indicated that magnitude of the LUCC in Lake Qinghai watershed was generally low; the
percentage of the change of various land types relative to the total area was less than 1 per cent. However, lands used
for ecological purpose showed a decreasing trend, but lands for crop production and residence showed an increasing
trend, suggesting that anthropogenic influence on LUCC had being increasing during the recent decades. Grassland
degradation is worthy of note, although small changes in the area of grassland, the productivity was substantially
reduced. Grassland degradation was mainly resulted from anthropogenic factors (increasing population, grazing
and policy), but lake level decline and area shrinkage was mainly attributed to climate change.
acknowledgements
The authors thank two anonymous reviewers for their valuable comments on the improvement of this manuscript.
This study was financially co-supported by the National Key Projects for Basic Scientific Research (grant no.
2004CB720207), the National Key Technologies R&D Program (grant no. 2007BAC30B02) and the National
Science Foundation of China (NSFC 40599423 and 40761026).
references
An ZS, Ai L, Song YG, Steven MC, Li XQ. 2006. Lake Qinghai Scientific Drilling Project. Scientific Drilling 2: 20–22.Chen SP. 1998. Study on the Mechanism of Remote Sensing Information. Science Press: Beijing, China (In Chinese).Cui XF, Graf HF, Langmann B, Chen W, Huang RH. 2006. Climate impacts of anthropogenic land use changes on the Tibetan Plateau. Globaland Planetary Change 54: 33–56.
Ding YJ, Liu FJ. 1995. Effect of climatic change of water balance of Qinghai Lake Basin for recent thirty years and possible tendency. ScientiaGeographica Sinica 15: 128–135. (In Chinese with English Abstract).
Fan JH, Shi YF. 1992. Impact of climate on hydrology of Qinghai Lake. Science in China Series B 5: 537–542.Fu Y, Zhang GS, Li FX, Yang Q, Yan LD, Liu BK. 2008. Management approaches of ecological and environmental restoration in the regionsaround Qinghai Lake. Pratacul Tural Science 25: 4–10. (In Chinese with English Abstract).
Hao X. 2008. A green fervor sweeps the Qinghai-Tibetan Plateau. Science 321: 633–635.Lambin EF, Baulies X, Bockstael N, Fischer G, Krug T, Leemans R, Moran EF, Rindfuss RR, Sato Y, Skole D, Turner BL, Vogel C. 1999. Land-Use and Land-Cover Change (LUCC)-Implementation Strategy. IGBP Report 48 and IHDP Report No. 10. IGBP, Stockholm.
Lambin EF, Geist HJ. 2001. Global land-use and cover change: What have we learned so far? Global Change Newsletter 46: 27–30.Lesschen JP, Verburg PH, Staal SJ. 2005. Statistical Methods for Analysing the Spatial Dimension of Changes in Land Use and Farming Systems.LUCC Report Series 7. The International Livestock Research Institute, Nairobi, Kenya & LUCC Focus 3 Office, Wageningen University, TheNetherlands.
Li XY, Xu HY, Sun YL, Zhang DS, Yang ZP. 2007. Lake-level change and water balance analysis at lake Qinghai, west China during recentdecades. Water Resources Management 21: 1505–1516.
Liu JQ, Wang YB, Cheng HY. 2007a. The eco-environmental change and causes of Qinghai Lake Watershed. Journal of Arid Land Resourcesand Environmen 21: 32–37 (In Chinese with English Abstract).
Liu JF, Huo SQ, LI SJ, Du Y. 2007b. Application of SWATmodel to analysis of runoff variation of Buha River Basin of Qinghai Lake. Journal ofHohai University (Natural Sciences) 35: 159–163 (In Chinese with English Abstract).
Liu JF, Li SJ, Ding YG. 2008. Forecasting of water level of Qinghai lake based on statistics downscaling from climatic model. Advance in WaterScience 19: 184–191 (In Chinese with English Abstract).
Liu JY, LiuML, Tian HQ, Zhuang DF, Zhang ZX, ZhangW, Tang XM, Deng XZ. 2005. Spatial and temporal patterns of China’s cropland during1990–2000: An analysis based on Landsat TM data. Remote Sensing of Environment 98: 442–456.
Liu Y, Zha Y, Gao J, Ni S. 2004. Assessment of grassland degradation near Lake Qinghai, West China, using Landsat TM and in situ reflectancespectra data. International Journal of Remote Sensing 25: 4177–4189.
Ma Y. 1996. Correlations between modern climatic factors and lake level change in Qinghai Lake. Journal of Lake Sciences 8: 103–106(In Chinese with English Abstract).
Qin BQ, Huang Q. 1998. Evaluation of the climatic change impacts on the inland lake-a case study of lake Qinhai, China. Climatic Change 39:695–714.
Copyright # 2008 John Wiley & Sons, Ltd. LAND DEGRADATION & DEVELOPMENT, 20: 69–83 (2009)
DOI: 10.1002/ldr

LUCC AND ENVIRONMENTAL DEGRADATION 83
Rovainen E. 1996. Analysis and standardization of transition matrices. In FAO, Forest resources assessment 1990. Survey of tropical forest coverand study of change processes. FAO Forestry Paper 130 Annex 7, Rome, pp. 111–114.
Shen J, Liu XQ, Wang SM, Matsumoto R. 2005. Palaeoclimatic changes in the Qinghai Lake area during the last 18,000 years. QuaternaryInternational 136: 131–140.
ShuWX, Li SJ, Liu JF. 2008. Simulation of water change in Qinghai Lake and affecting factors. Arid Land Geography 31: 229–236 (In Chinesewith English Abstract).
Sun YL, Li XY, Liu LY, Xu HY, Zhang DS. 2008. Climate change and sandy land development in Qinghai Lake Watershed, China. Frontiers ofEnvironmental Science and Engineering in China 2: 340–348.
Sun YL. 2008. Effect of Climate and Land Use/Cover Change on Hydrological Features in Qinghai Lake Watershed. PhD Thesis. BeijingNormal University, Beijing, China (In Chinese with English Abstract).
Trenberth KE, Jones PD, Ambenje P, Bojariu R, Easterling D, Klein Tank A, Parker D, Rahimzadeh F, Renwick JA, Rusticucci M, Soden B, ZhaiP. 2007: Observations: surface and atmospheric climate change. In Climate Change 2007: The Physical Science Basis. Contribution ofWorking Group I to the Fourth Assessment Report of the Intergovernmental Panel on Climate Change, Solomon S, Qin D, Manning M, ChenZ, Marquis M, Averyt KB, Tignor M, Miller HL (eds). Cambridge University Press: Cambridge, UK and New York, NY.
Turner IIBL, Skole D, Sanderson S, Fischer G, Fresco L, Leemans R. 1995. Land-Use and Land-Cover Change Science/Research Plan. IGBPReport No. 35 and HDP Report No. 7. IGBP, Stockholm.
Wang XH, Zheng D, Shen YC. 2008. Land use change and its driving forces on the Tibetan Plateau during 1990–2000. Catena 72: 56–66.Wang XL, Bao YH. 1999. Study on the methods of land use dynamic change research. Progress in Geography 18: 81–87 (In Chinese with
English Abstract).Xu HY, Li XY, Sun YL. 2007. Climate change in the Lake Qinghai watershed in recent 47 years. Arid Meteorology 25: 50–54 (In Chinese with
English Abstract).Xu H, Ai L, Tan LC, An ZS. 2006. Stable isotopes in bulk carbonates and organic matter in recent sediments of Lake Qinghai and their climatic
implications. Chemical Geology 235: 262–275.Yu SS. 1996. Chemical changes of Qinghaihu lake and its river water system in the last 30 years.Oceanologia Et Limnologia Sinica 27: 125–131
(In Chinese with English Abstract).Zhang DS,Wu JW, Lu RJ, Zhao YZ, Chen Y. 2003. Study on planning of the synthetic control of land desertification in the peripheral area of the
Qinghai Lake. Arid Zone Research 20: 307–311 (In Chinese with English Abstract).Zhang HQ, Peng M, Wang B, Lu WZ, Gao YH, Du TY. 2006. Current status and cause analysis of the deterioration of Lake Qinghai. Qinghai
Environment 16: 51–56 (In Chinese with English Abstract).
Copyright # 2008 John Wiley & Sons, Ltd. LAND DEGRADATION & DEVELOPMENT, 20: 69–83 (2009)
DOI: 10.1002/ldr