immigration policies go local - wilson center · immigration policies go local ... () nationwide in...
TRANSCRIPT

Immigration Policies Go Local
Local Ordinances and Beyond
Karthick Ramakrishnan
Department of Political ScienceUniversity of California, Riverside

Since 2003… Immigration Politics Definitely Local
• Not DC
• Protests, Anti-immigrant groups
• Policies: Restrictionist as well as permissive
• Contrast with 2003

Local Government Policies and Practices
Language access Translated documents Interpreters
Knowledge about immigrant community Needs and issue priorities Community organizations
Leadership development Appointment to boards and commissions
Services and regulation Housing, law enforcement, education, health
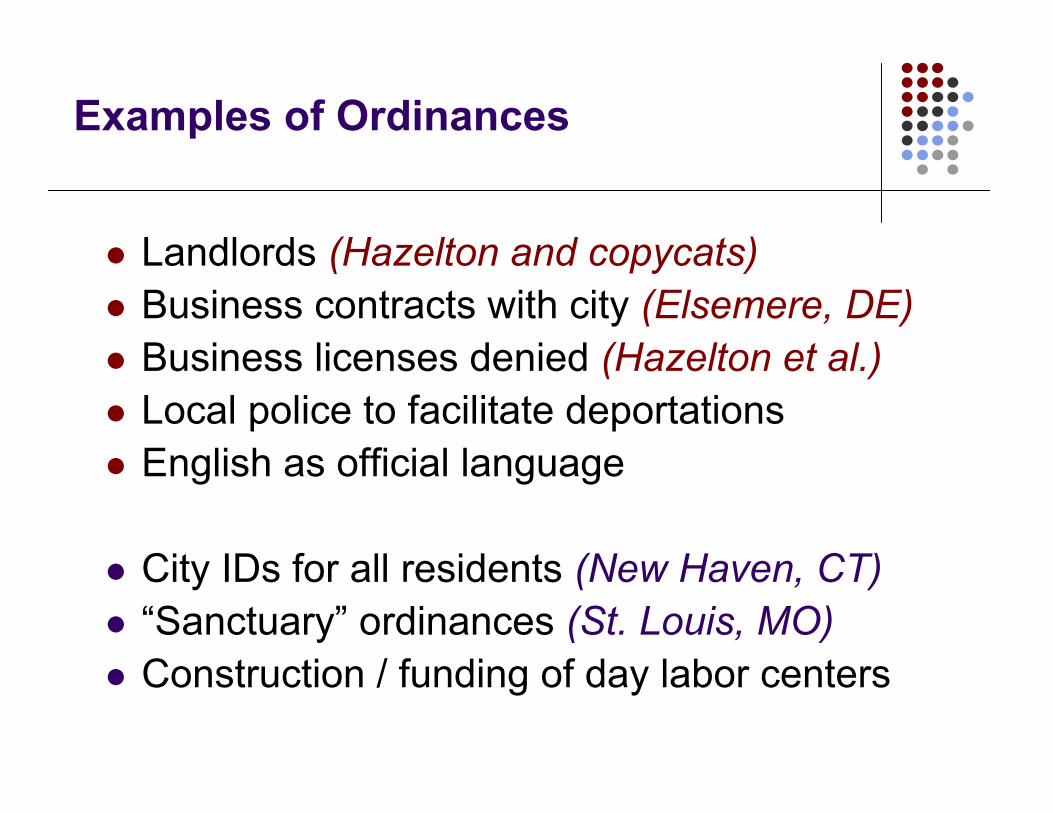
Landlords (Hazelton and copycats) Business contracts with city (Elsemere, DE) Business licenses denied (Hazelton et al.) Local police to facilitate deportations English as official language
City IDs for all residents (New Haven, CT) “Sanctuary” ordinances (St. Louis, MO) Construction / funding of day labor centers
Examples of Ordinances

Restrictionist Local Ordinances

Descriptive Findings: Pro or Con?

Descriptive Findings: Pro or Con?
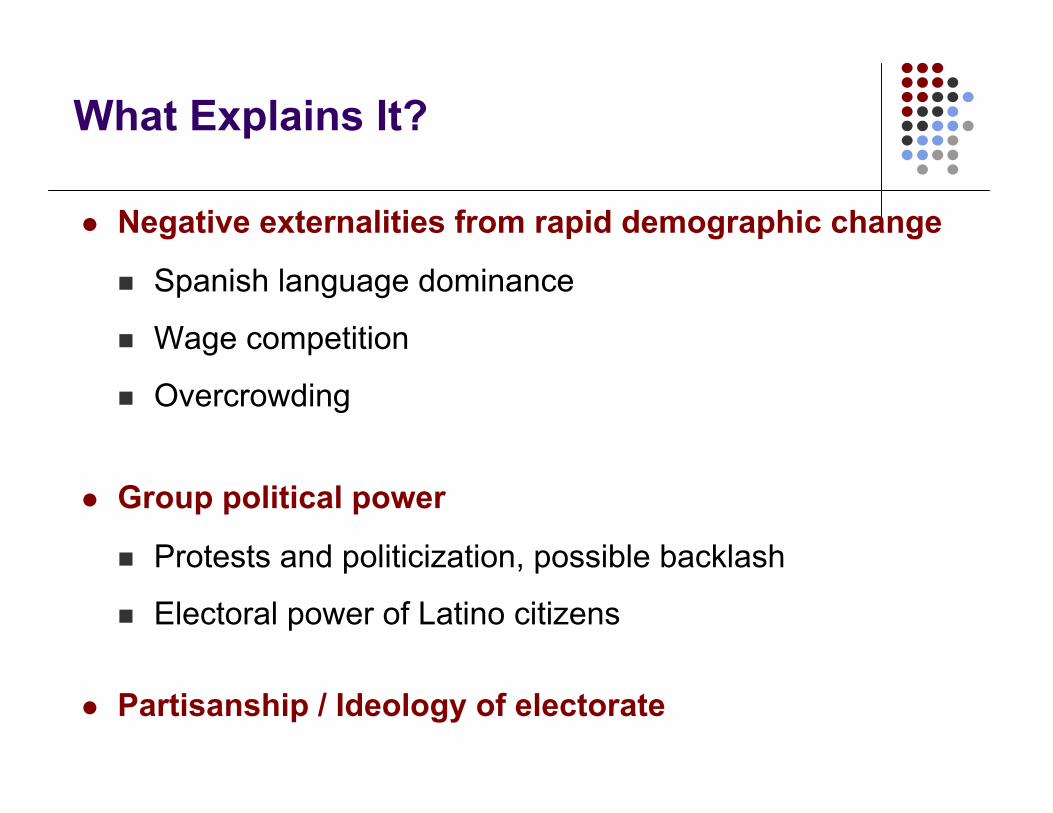
What Explains It?
Negative externalities from rapid demographic change
Spanish language dominance
Wage competition
Overcrowding
Group political power
Protests and politicization, possible backlash
Electoral power of Latino citizens
Partisanship / Ideology of electorate

Merging Data & Hypothesis Testing
Various databases, confirmation via phone calls
Immigrant Protests
Census data Recency of migration, growth of Latinos
Relative poverty rates
Linguistic isolation Overcrowded housing
Jobs in agriculture, construction
Presidential vote choice
State-level factors

Descriptive Stats: Politics and Power
0.9 3.1 0.9% employed in agriculture
54112Any pro-immigrationprotest*** (% likelihood)
18.05.77.9Latino share of citizens***
21.16.610.8Latino share ofpopulation***
267069% with Republican majorityin county***
“Pro”No ProposalRestrictionist

Demographic Disruptions
“Pro”No ProposalRestrictionist
5.9 1.6 2.0% of householdsovercrowded***
5.3 1.3 2.4% of Spanish linguistic-isolated households***
29.5 16.6 26.1% of immigrants arrivedsince 1995
59.4 177.7 258.2Growth in Latinopopulation (%), 1990-2000*

Poverty, Economic Competition
“Pro”No ProposalRestrictionist
807,151.7 7,015.5 71,939.3Population***
22.8 15.1 21.0Latino poverty rate
10.7 10.7 9.4White poverty rate
23.5 13.2 23.0Black poverty rate
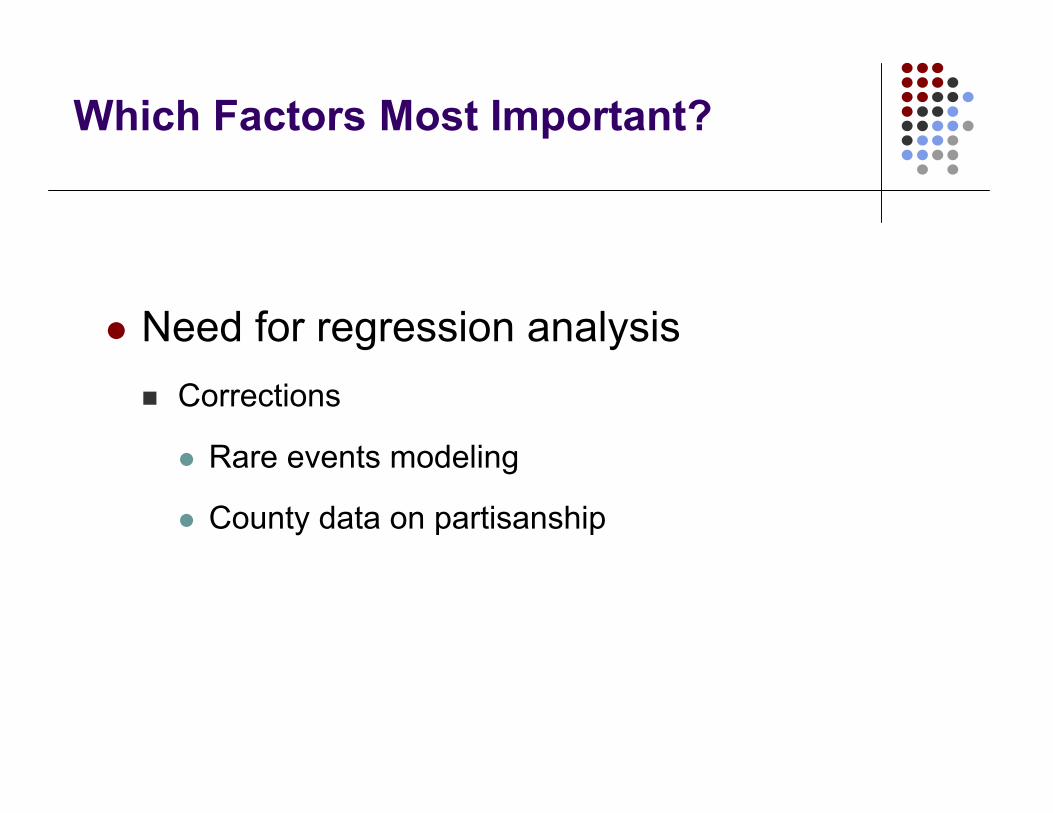
Which Factors Most Important?
Need for regression analysis Corrections
Rare events modeling
County data on partisanship

Predicting Restrictionist Proposals

Predicting Restrictionist Passage

Predicting Pro-Immigrant Proposals

Predicting Pro-Immigrant Passage

What Explains It?
Partisanship / Ideology of electorate
Group political power
Protests
Interest groups (agriculture)
Latino citizens
Local Demographic Change
Language/Culture
Economic Competition / Poverty

Caveats and Concerns
State policies controlled with dummy variables More systematic classification pending MPI report But, seems to hold even with particular states such
as Pennsylvania
How to model state policy process and localpolicy process?
What about city-level party data?

City level party data

Next Steps
In-depth studies of representative and
atypical cases
Beyond ordinances to daily practices
Survey of municipal governments
California in 2003 (www.ppic.org)
Nationwide in 2007 (500-1000 cities)