immigrant health steven p. wallace, ph.d. ucla school of public health & ucla center for health...
TRANSCRIPT

Immigrant HealthImmigrant Health
Steven P. Wallace, Ph.D.Steven P. Wallace, Ph.D.UCLA School of Public Health & UCLA Center for UCLA School of Public Health & UCLA Center for
Health Policy Research Health Policy Research
http://swallace.bol.ucla.eduhttp://swallace.bol.ucla.edu
OutlineOutline
Who are immigrants?Who are immigrants?What is their health status & risks?What is their health status & risks?What determinants of health vary for What determinants of health vary for
them?them?What are community health strategies?What are community health strategies?What are their health systems issues?What are their health systems issues?
1. Demographics of immigration1. Demographics of immigration
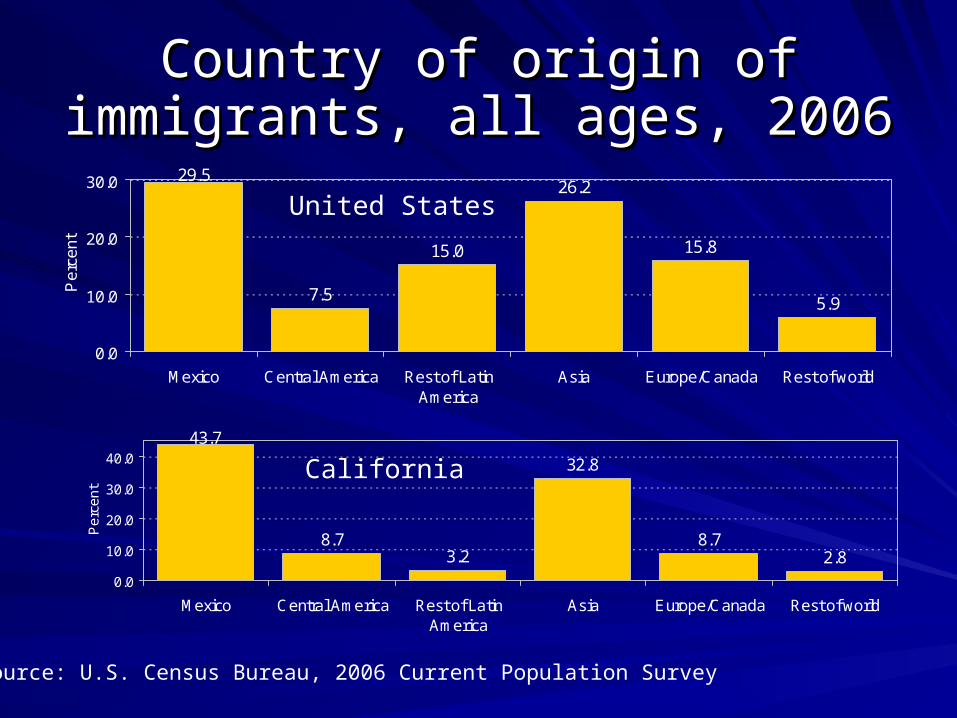
Country of origin of immigrants, all Country of origin of immigrants, all ages, 2006ages, 2006
29.5
7.5
15.0
26.2
15.8
5.9
0.0
10.0
20.0
30.0
Mexico Central America Rest of LatinAmerica
Asia Europe/Canada Rest of world
Pe
rce
nt
43.7
8.73.2
32.8
8.72.8
0.0
10.0
20.0
30.0
40.0
Mexico Central America Rest of LatinAmerica
Asia Europe/Canada Rest of world
Pe
rce
nt
United States
California
Source: U.S. Census Bureau, 2006 Current Population Survey
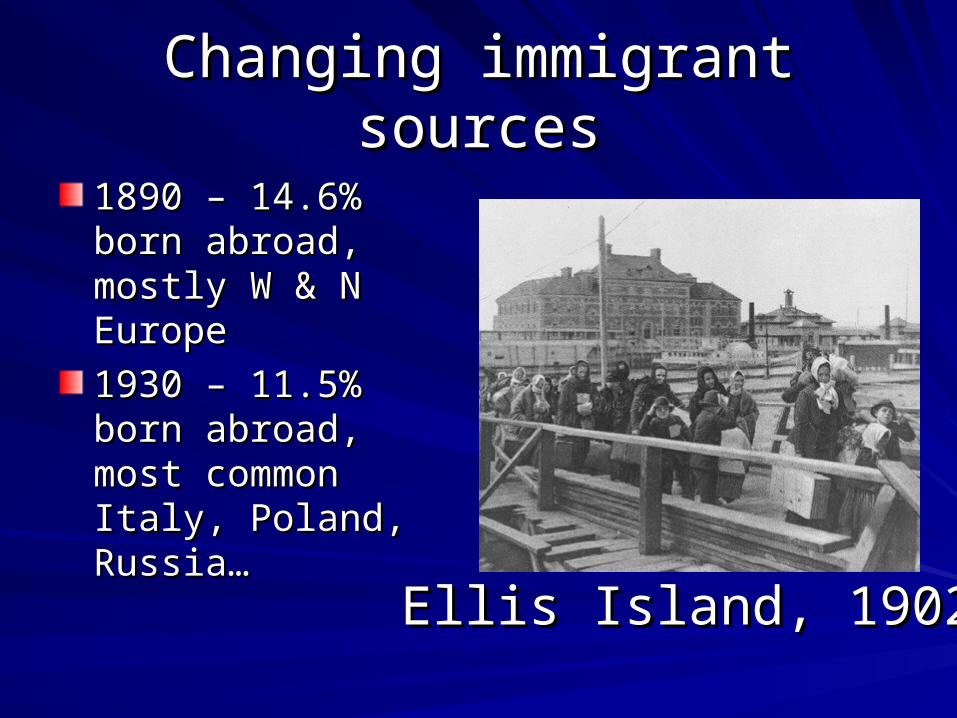
Changing immigrant sourcesChanging immigrant sources
1890 – 14.6% born 1890 – 14.6% born abroad, mostly W & N abroad, mostly W & N EuropeEurope
1930 – 11.5% born 1930 – 11.5% born abroad, most abroad, most common Italy, common Italy, Poland, Russia…Poland, Russia…
Ellis Island, 1902Ellis Island, 1902
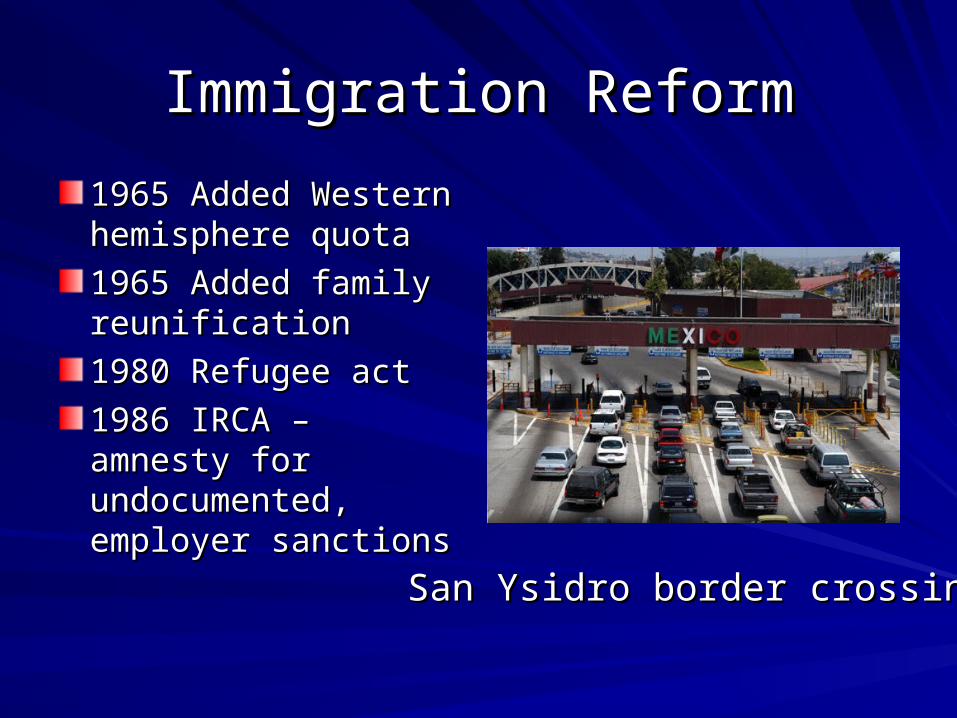
Immigration ReformImmigration Reform
1965 Added Western 1965 Added Western hemisphere quotahemisphere quota
1965 Added family 1965 Added family reunificationreunification
1980 Refugee act 1980 Refugee act
1986 IRCA – amnesty 1986 IRCA – amnesty for undocumented, for undocumented, employer sanctionsemployer sanctions
San Ysidro border crossingSan Ysidro border crossing

Country of origin of immigrants, all Country of origin of immigrants, all ages, 2006ages, 2006
29.5
7.5
15.0
26.2
15.8
5.9
0.0
10.0
20.0
30.0
Mexico Central America Rest of LatinAmerica
Asia Europe/Canada Rest of world
Pe
rce
nt
43.7
8.73.2
32.8
8.72.8
0.0
10.0
20.0
30.0
40.0
Mexico Central America Rest of LatinAmerica
Asia Europe/Canada Rest of world
Pe
rce
nt
United States
California
Source: U.S. Census Bureau, 2006 Current Population Survey
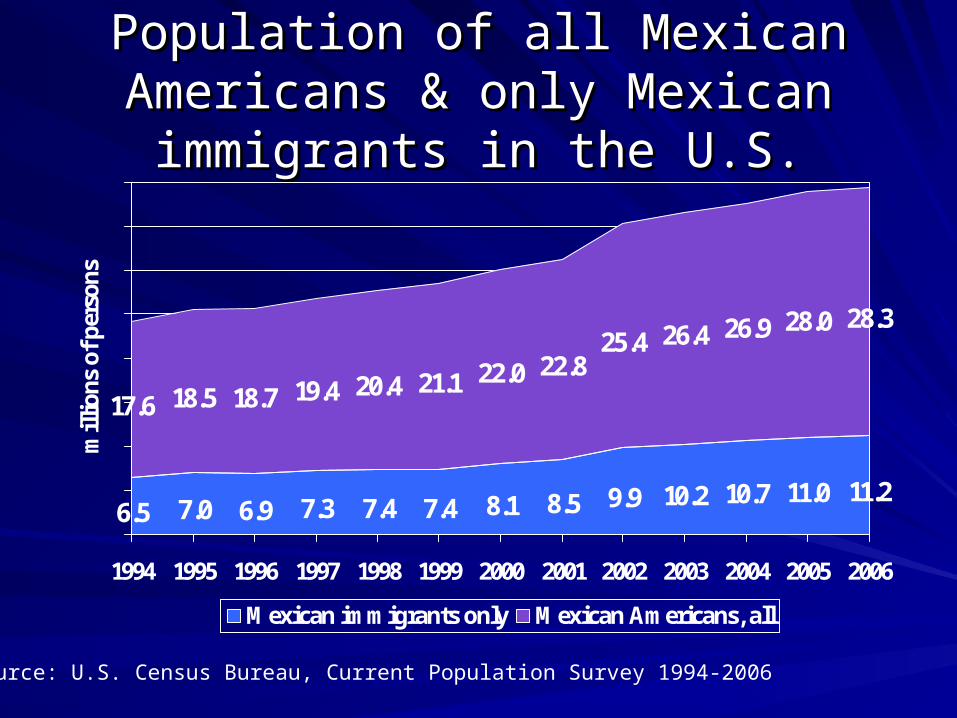
Population of all Mexican Americans & Population of all Mexican Americans & only Mexican immigrants in the U.S.only Mexican immigrants in the U.S.
6.5 7.0 6.9 7.3 7.4 7.4 8.5 9.9 10.2 10.7 11.0 11.2
17.6 18.5 18.7 19.4 20.4 21.1 22.0 22.825.4 26.4 26.9 28.0 28.3
8.1
1994 1995 1996 1997 1998 1999 2000 2001 2002 2003 2004 2005 2006
mill
ions
of p
erso
ns
Mexican immigrants only Mexican Americans, all
Source: U.S. Census Bureau, Current Population Survey 1994-2006
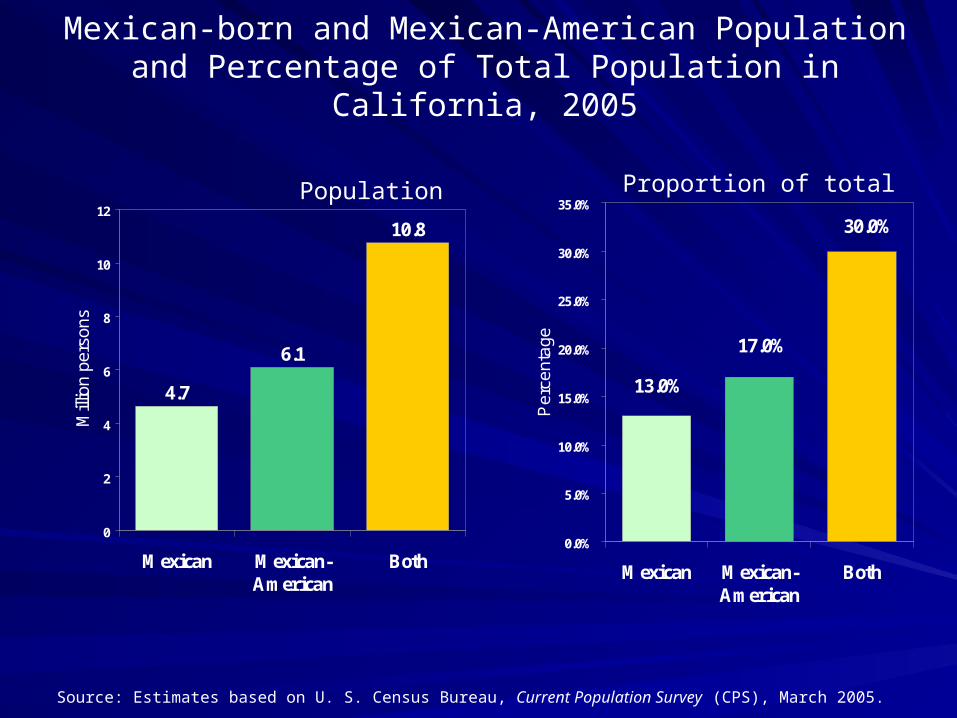
Mexican-born and Mexican-American Population and Percentage of Total Population in California, 2005
4.7
6.1
10.8
0
2
4
6
8
10
12
Mexican Mexican-American
Both
Mill
ion
pers
ons
13.0%
17.0%
30.0%
0.0%
5.0%
10.0%
15.0%
20.0%
25.0%
30.0%
35.0%
Mexican Mexican-American
Both
Pe
rce
nta
ge
Proportion of totalPopulation
Source: Estimates based on U. S. Census Bureau, Current Population Survey (CPS), March 2005.
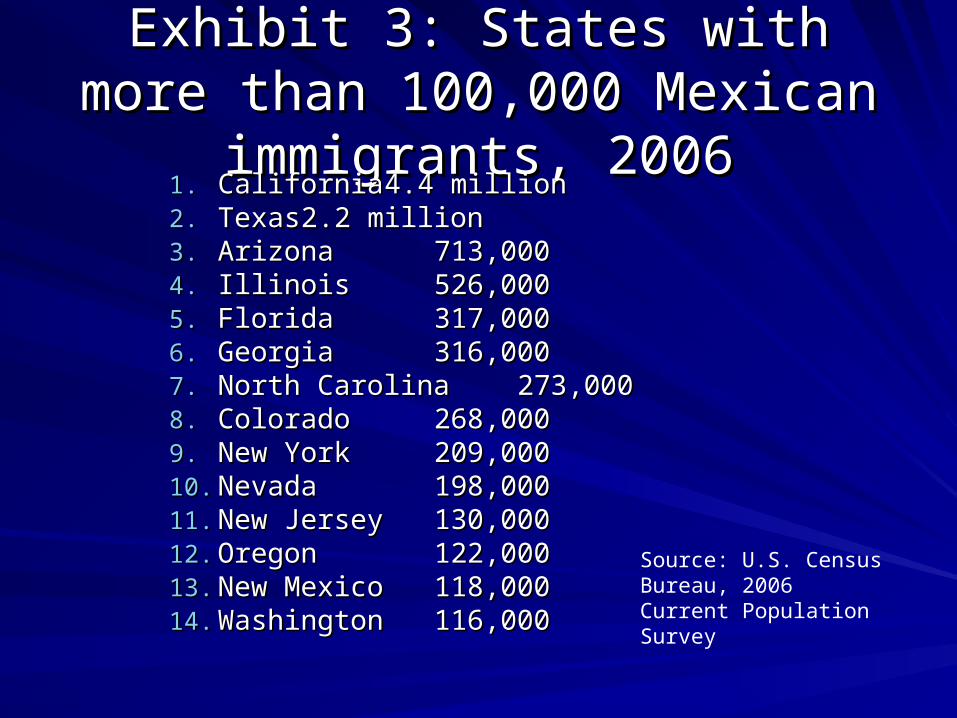
Exhibit 3: States with more than Exhibit 3: States with more than 100,000 Mexican immigrants, 2006100,000 Mexican immigrants, 2006
1.1. CaliforniaCalifornia 4.4 million4.4 million2.2. TexasTexas 2.2 million2.2 million3.3. ArizonaArizona 713,000 713,0004.4. IllinoisIllinois 526,000 526,0005.5. FloridaFlorida 317,000 317,0006.6. GeorgiaGeorgia 316,000 316,0007.7. North CarolinaNorth Carolina 273,000 273,0008.8. ColoradoColorado 268,000 268,0009.9. New YorkNew York 209,000 209,00010.10. NevadaNevada 198,000 198,00011.11. New JerseyNew Jersey 130,000 130,00012.12. OregonOregon 122,000 122,00013.13. New MexicoNew Mexico 118,000 118,00014.14. WashingtonWashington 116,000 116,000
Source: U.S. Census Bureau, 2006 Current Population Survey
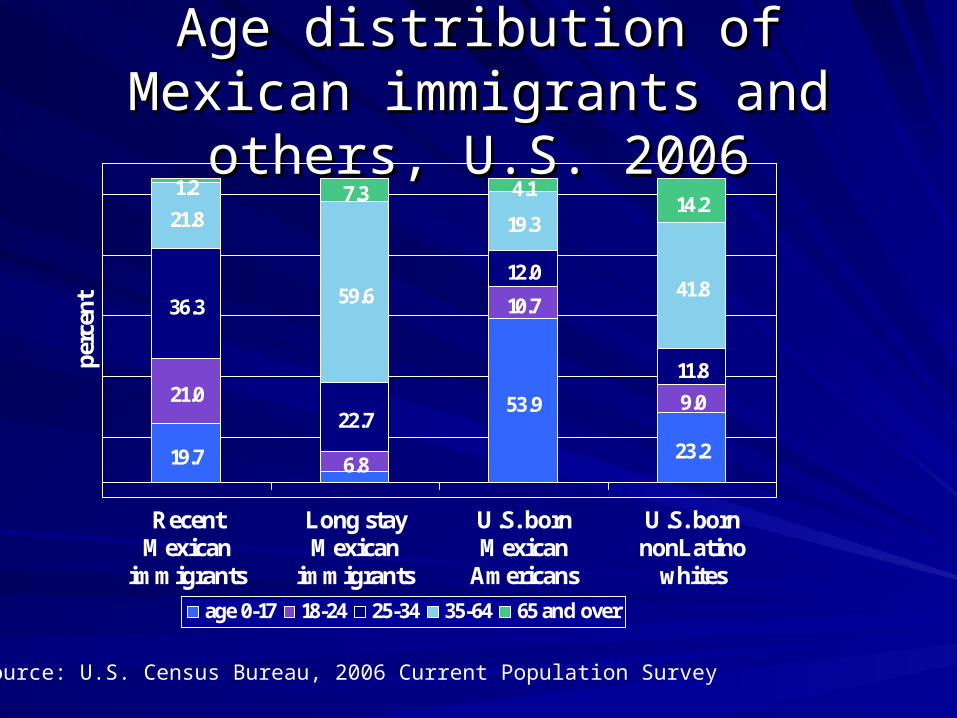
Age distribution of Mexican Age distribution of Mexican immigrants and others, U.S. 2006immigrants and others, U.S. 2006
19.7
53.9
23.2
21.0
10.7
9.0
36.3
22.7
12.0
11.8
21.8
59.6
19.3
41.8
6.8
4.114.2
1.2 7.3
RecentMexican
immigrants
Long stayMexican
immigrants
U.S. bornMexican
Americans
U.S. bornnonLatino
whites
perc
ent
age 0-17 18-24 25-34 35-64 65 and over
Source: U.S. Census Bureau, 2006 Current Population Survey

Contribution of Mexicans and Mexican-Americans to Population Growth in California ages 15 to 44 and 0 to 15, 1990-2000
119.7
60.1
8.7
62.8
020406080
100120140
Mexican Mexican-American
Mexican Mexican-American
% I
nc
rea
se
Increase in group ages 15-44 Increase in group ages 0-15
Source: Estimates based on U. S. Census Bureau, 15-percent sample 1970, 5-percent sample 1980, 5-percent sample 1990 and 5-percent sample 2000.
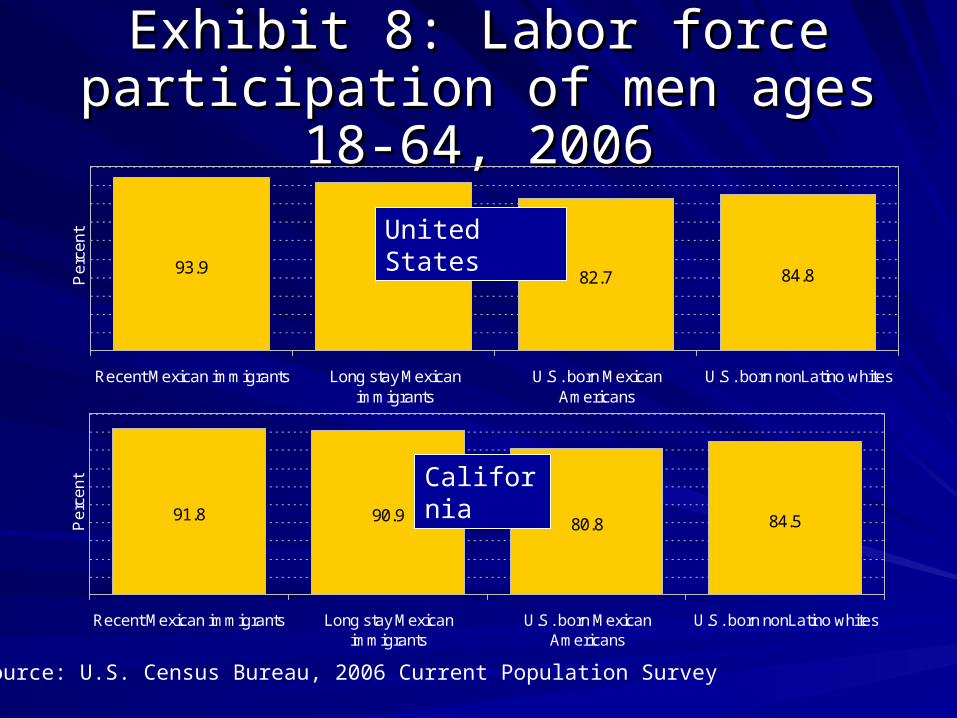
Exhibit 8: Labor force participation Exhibit 8: Labor force participation of men ages 18-64, 2006of men ages 18-64, 2006
93.9 91.1 82.7 84.8
Recent Mexican immigrants Long stay Mexicanimmigrants
U.S. born MexicanAmericans
U.S. born nonLatino whites
Pe
rce
nt
91.8 90.9 80.8 84.5
Recent Mexican immigrants Long stay Mexicanimmigrants
U.S. born MexicanAmericans
U.S. born nonLatino whites
Pe
rce
nt
United States
California
Source: U.S. Census Bureau, 2006 Current Population Survey
Why Why immigrantimmigrant health? health?contextcontext
Employed in segmented labor marketEmployed in segmented labor market– Especially manual & service occupationsEspecially manual & service occupations– Low incomes, benefits, difficult workLow incomes, benefits, difficult work
Live in segregated housingLive in segregated housing– Low income housing with more structural and Low income housing with more structural and
other problemsother problems– Concentrated in low performing schoolsConcentrated in low performing schools– Experience similar shortages of public space Experience similar shortages of public space
& other public services& other public services
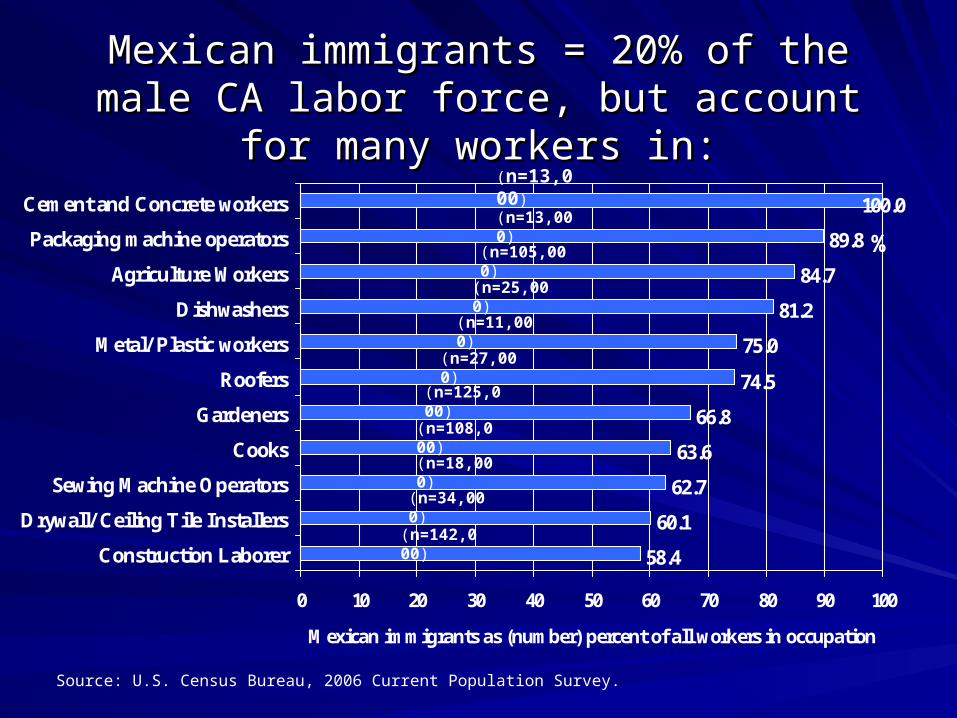
Mexican immigrants = 20% of the male CA Mexican immigrants = 20% of the male CA labor force, but account for many workers in:labor force, but account for many workers in:
Source: U.S. Census Bureau, 2006 Current Population Survey.
58.4
60.1
62.7
63.6
66.8
74.5
75.0
81.2
84.7
89.8
100.0
0 10 20 30 40 50 60 70 80 90 100
Construction Laborer
Drywall/ Ceiling Tile Installers
Sewing Machine Operators
Cooks
Gardeners
Roofers
Metal/ Plastic workers
Dishwashers
Agriculture Workers
Packaging machine operators
Cement and Concrete workers
Mexican immigrants as (number) percent of all workers in occupation
(n=13,000)(n=13,000)
(n=105,000)
(n=25,000)
(n=11,000)
(n=27,000)
(n=125,000)
(n=108,000)(n=18,000)
(n=34,000)
(n=142,000)
%

““Carwasheros”Carwasheros”
Difficult workDifficult workLargely Largely undocumentedundocumentedOften paid less than Often paid less than minimum wageminimum wageNo benefits, No benefits, insuranceinsuranceLiving wage could Living wage could easily be passed on easily be passed on in pricein price
Photo: LA Times March 27, 2008Photo: LA Times March 27, 2008

Why Why immigrantimmigrant health? health?Individual factorsIndividual factors
Knowledge – prior experience with health Knowledge – prior experience with health and healing systemsand healing systems
Culture – beliefs and values related to Culture – beliefs and values related to health and healinghealth and healing
Beliefs, rumors – about immigration status Beliefs, rumors – about immigration status and risksand risks
2. Immigrant health status & Risks2. Immigrant health status & Risks
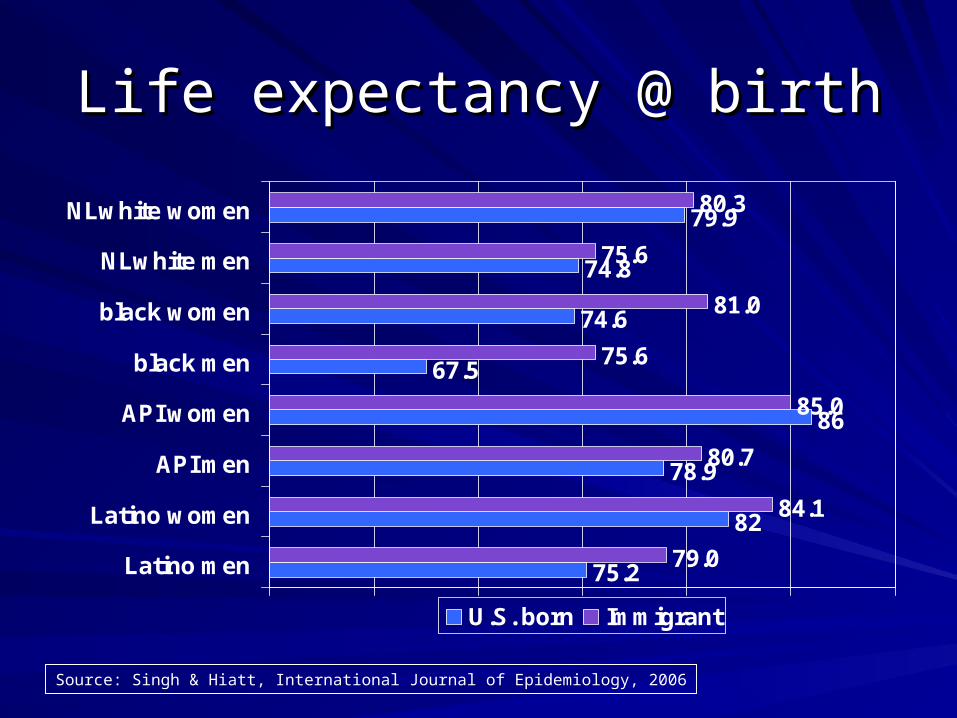
Life expectancy @ birthLife expectancy @ birth
75.2
82
78.9
86
67.5
74.6
74.8
79.9
79.0
84.1
80.7
85.0
75.6
81.0
75.6
80.3
Latino men
Latino women
API men
API women
black men
black women
NLwhite men
NLwhite women
U.S. born Immigrant
Source: Singh & Hiatt, International Journal of Epidemiology, 2006
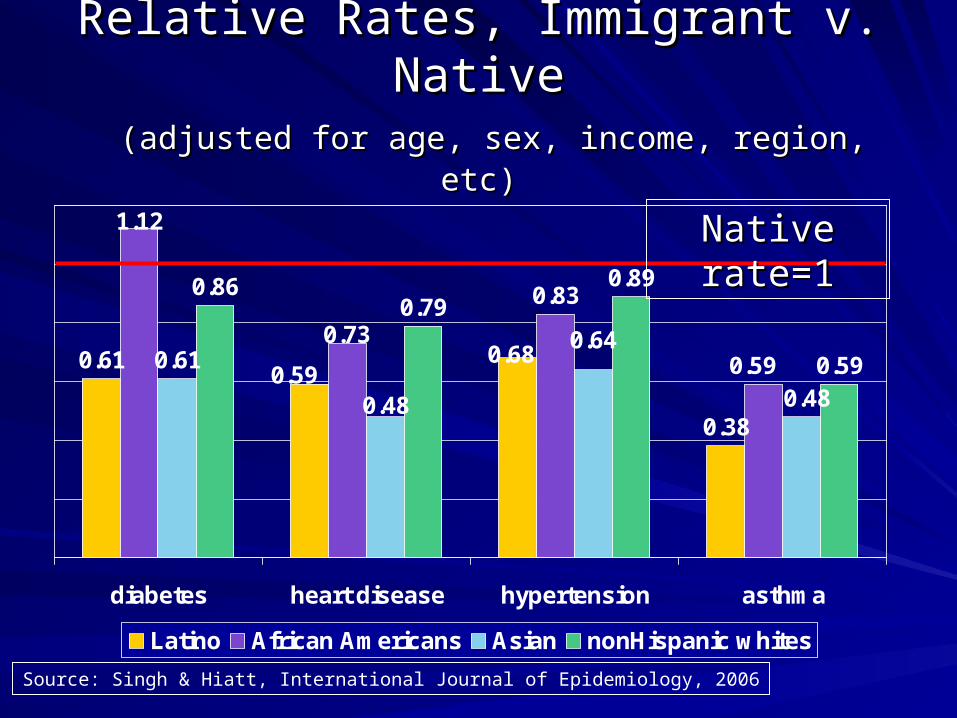
Relative Rates, Immigrant v. NativeRelative Rates, Immigrant v. Native (adjusted for age, sex, income, region, etc)(adjusted for age, sex, income, region, etc)
0.61
0.38
1.12
0.83
0.61
0.860.79
0.89
0.590.680.59
0.730.59
0.48
0.64
0.48
diabetes heart disease hypertension asthma
Latino African Americans Asian nonHispanic whites
Source: Singh & Hiatt, International Journal of Epidemiology, 2006
Native rate=1Native rate=1
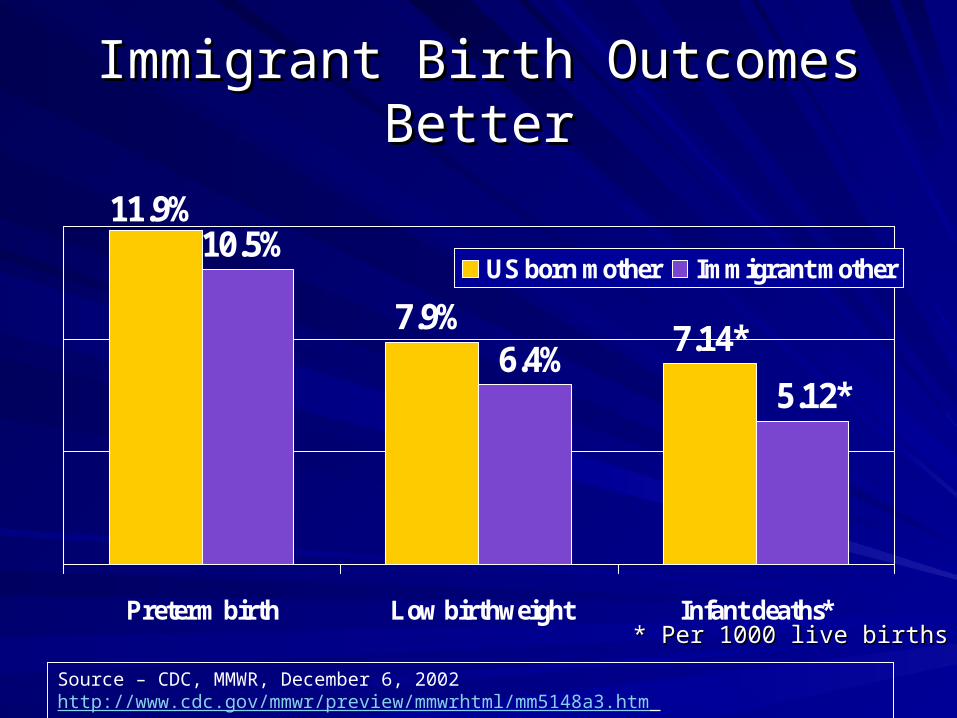
11.9%
7.9%
10.5%
7.14*
5.12*6.4%
Preterm birth Low birthweight Infant deaths*
US born mother Immigrant mother
Source – CDC, MMWR, December 6, 2002 http://www.cdc.gov/mmwr/preview/mmwrhtml/mm5148a3.htm
Immigrant Birth Outcomes BetterImmigrant Birth Outcomes Better
* Per 1000 live births* Per 1000 live births
Immigrant paradox:Immigrant paradox:High risk factorsHigh risk factors
Low incomeLow income
Low educationLow education
Poor working Poor working conditionsconditions
Overcrowded housingOvercrowded housing
Immigrant paradox:Immigrant paradox:BUT good outcomesBUT good outcomes
Mortality Mortality
Chronic conditions Chronic conditions like heart disease like heart disease (except diabetes)(except diabetes)
Birth outcomesBirth outcomes

3.3. Determinants of HealthDeterminants of Health
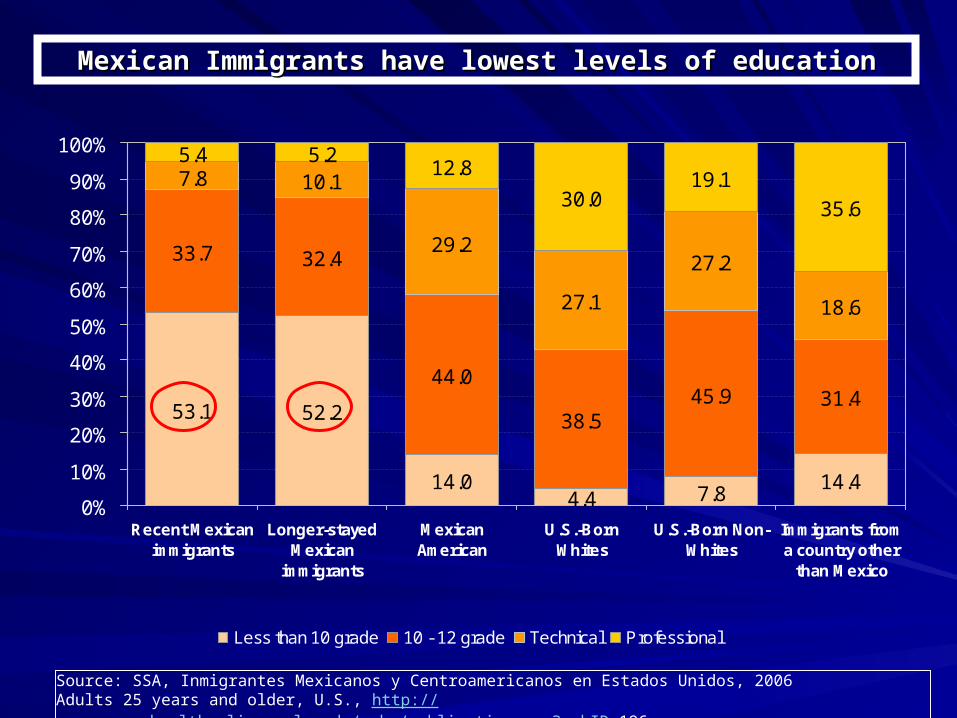
Mexican Immigrants have lowest levels of educationMexican Immigrants have lowest levels of education
53.1 52.2
14.04.4 7.8
14.4
33.7 32.4
44.0
38.545.9 31.4
27.1
27.2
18.6
5.4 5.212.8
30.019.1
35.6
29.2
10.17.8
0%
10%
20%
30%
40%
50%
60%
70%
80%
90%
100%
Recent Mexicanimmigrants
Longer-stayedMexican
immigrants
MexicanAmerican
U.S.-BornWhites
U.S.-Born Non-Whites
Immigrants froma country other
than Mexico
Less than 10 grade 10 - 12 grade Technical Professional
Source: SSA, Inmigrantes Mexicanos y Centroamericanos en Estados Unidos, 2006Adults 25 years and older, U.S., http://www.healthpolicy.ucla.edu/pubs/publication.asp?pubID=196
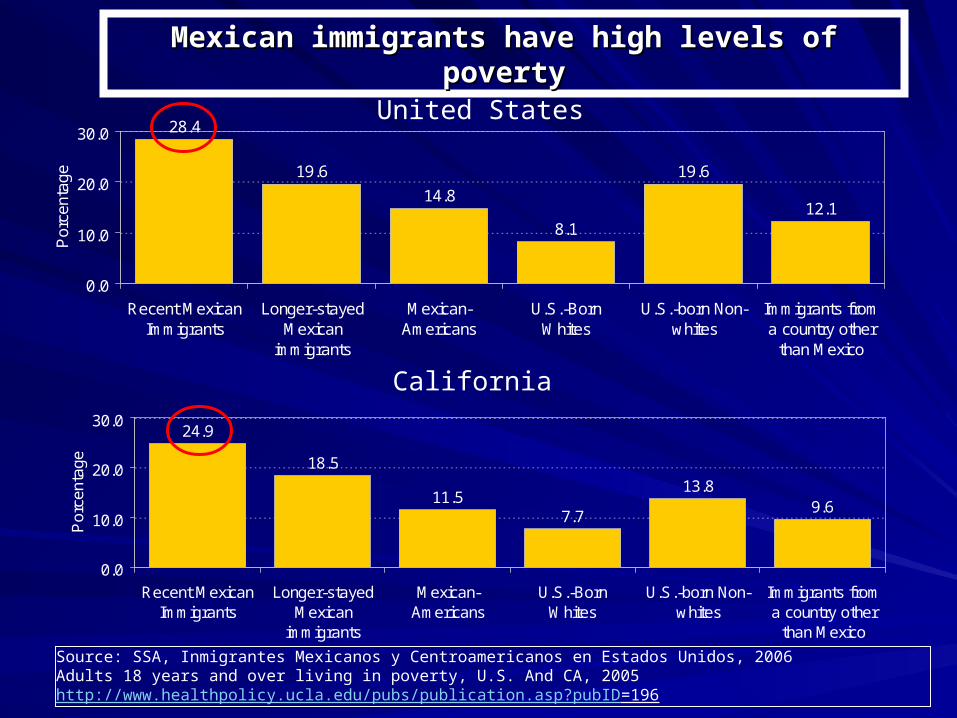
28.4
19.6
14.8
8.1
19.6
12.1
0.0
10.0
20.0
30.0
Recent MexicanImmigrants
Longer-stayedMexican
immigrants
Mexican-Americans
U.S.-BornWhites
U.S.-born Non-whites
Immigrants froma country other
than Mexico
Por
cent
age
Mexican immigrants have high levels of povertyMexican immigrants have high levels of poverty
24.9
18.5
11.57.7
13.89.6
0.0
10.0
20.0
30.0
Recent MexicanImmigrants
Longer-stayedMexican
immigrants
Mexican-Americans
U.S.-BornWhites
U.S.-born Non-whites
Immigrants froma country other
than Mexico
Por
cent
age
United States
California
Source: SSA, Inmigrantes Mexicanos y Centroamericanos en Estados Unidos, 2006Adults 18 years and over living in poverty, U.S. And CA, 2005http://www.healthpolicy.ucla.edu/pubs/publication.asp?pubID=196
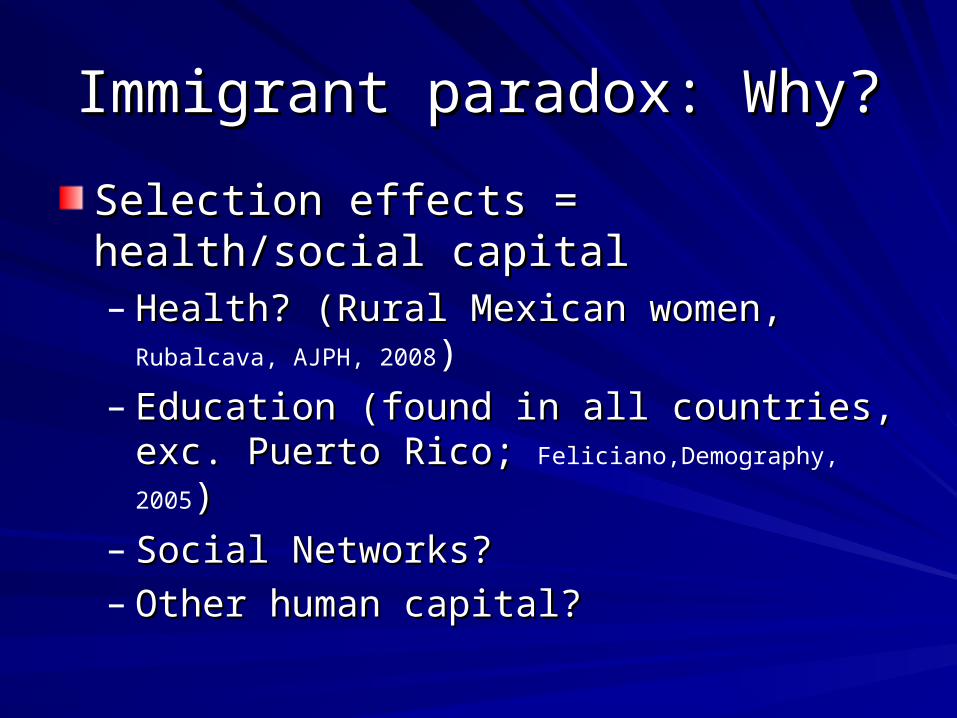
Immigrant paradox: Why?Immigrant paradox: Why?
Selection effects = health/social capitalSelection effects = health/social capital– Health? (Rural Mexican women, Health? (Rural Mexican women, Rubalcava, AJPH,
2008)– Education (found in all countries, exc. Puerto Education (found in all countries, exc. Puerto
Rico; Rico; Feliciano,Demography, 2005))– Social Networks?Social Networks?– Other human capital?Other human capital?
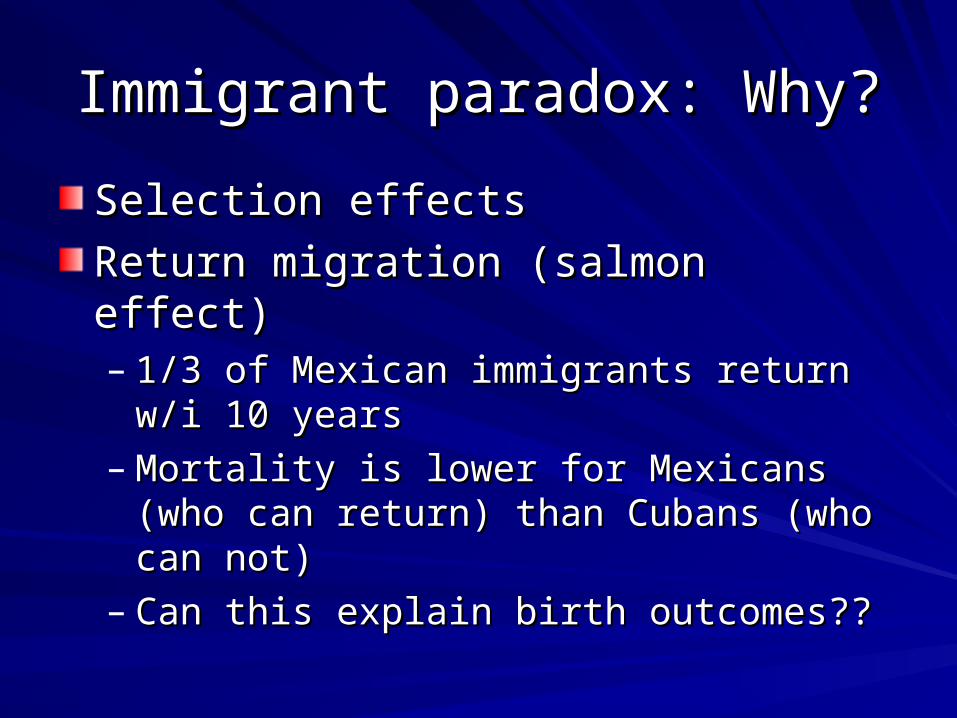
Immigrant paradox: Why?Immigrant paradox: Why?
Selection effectsSelection effects
Return migration (salmon effect)Return migration (salmon effect)– 1/3 of Mexican immigrants return w/i 10 years1/3 of Mexican immigrants return w/i 10 years– Mortality is lower for Mexicans (who can Mortality is lower for Mexicans (who can
return) than Cubans (who can not)return) than Cubans (who can not)– Can this explain birth outcomes??Can this explain birth outcomes??
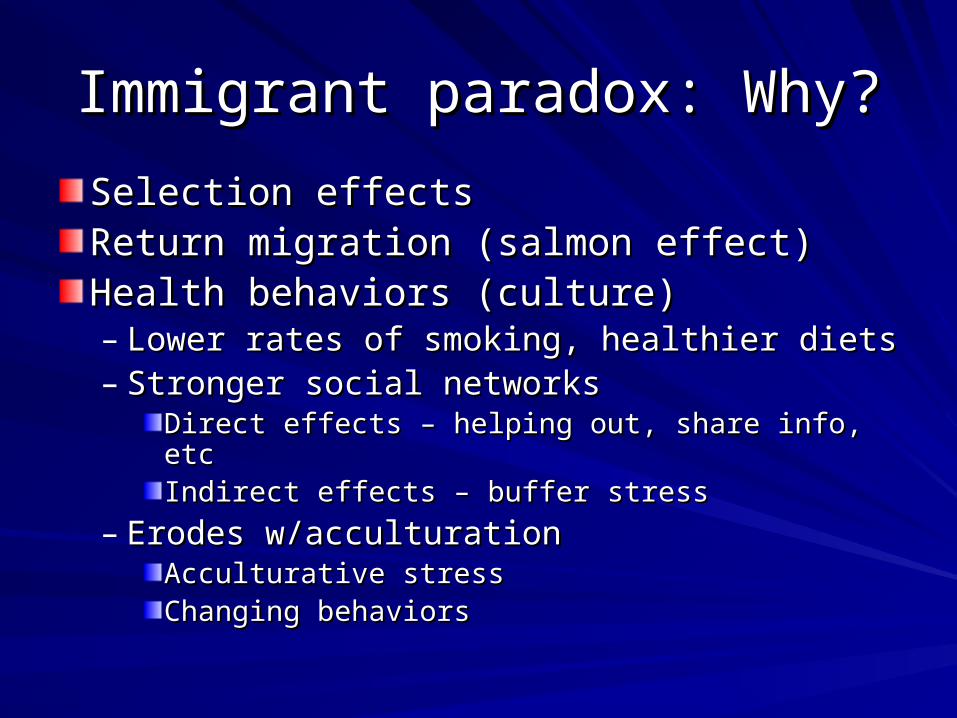
Immigrant paradox: Why?Immigrant paradox: Why?
Selection effectsSelection effectsReturn migration (salmon effect)Return migration (salmon effect)Health behaviors (culture)Health behaviors (culture)– Lower rates of smoking, healthier dietsLower rates of smoking, healthier diets– Stronger social networksStronger social networks
Direct effects – helping out, share info, etcDirect effects – helping out, share info, etcIndirect effects – buffer stressIndirect effects – buffer stress
– Erodes w/acculturationErodes w/acculturationAcculturative stressAcculturative stressChanging behaviorsChanging behaviors
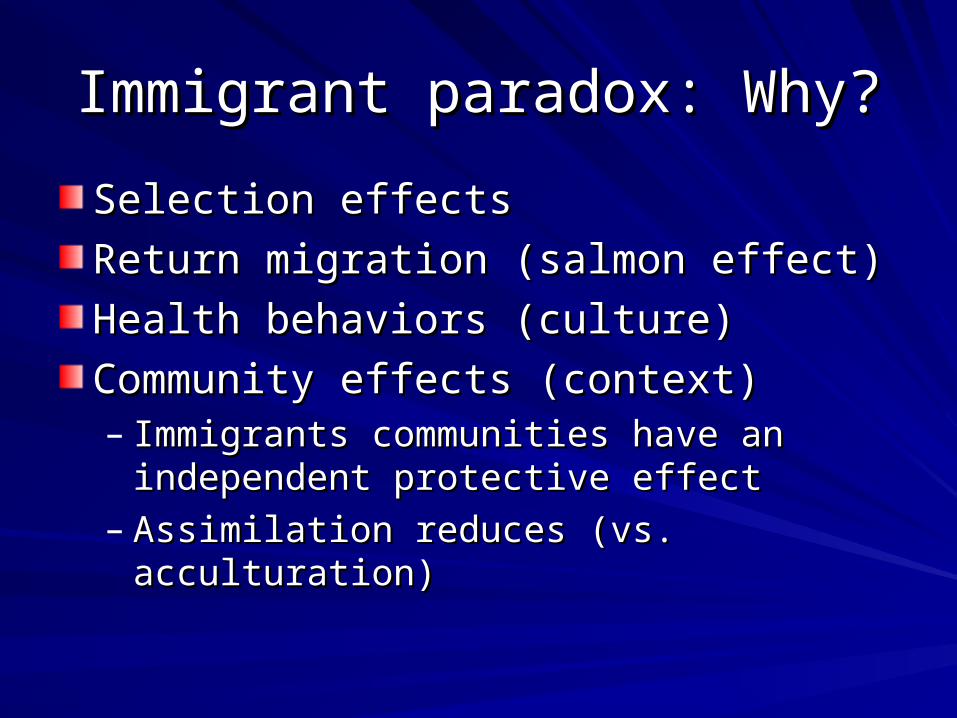
Immigrant paradox: Why?Immigrant paradox: Why?
Selection effectsSelection effects
Return migration (salmon effect)Return migration (salmon effect)
Health behaviors (culture)Health behaviors (culture)
Community effects (context)Community effects (context)– Immigrants communities have an independent Immigrants communities have an independent
protective effectprotective effect– Assimilation reduces (vs. acculturation)Assimilation reduces (vs. acculturation)
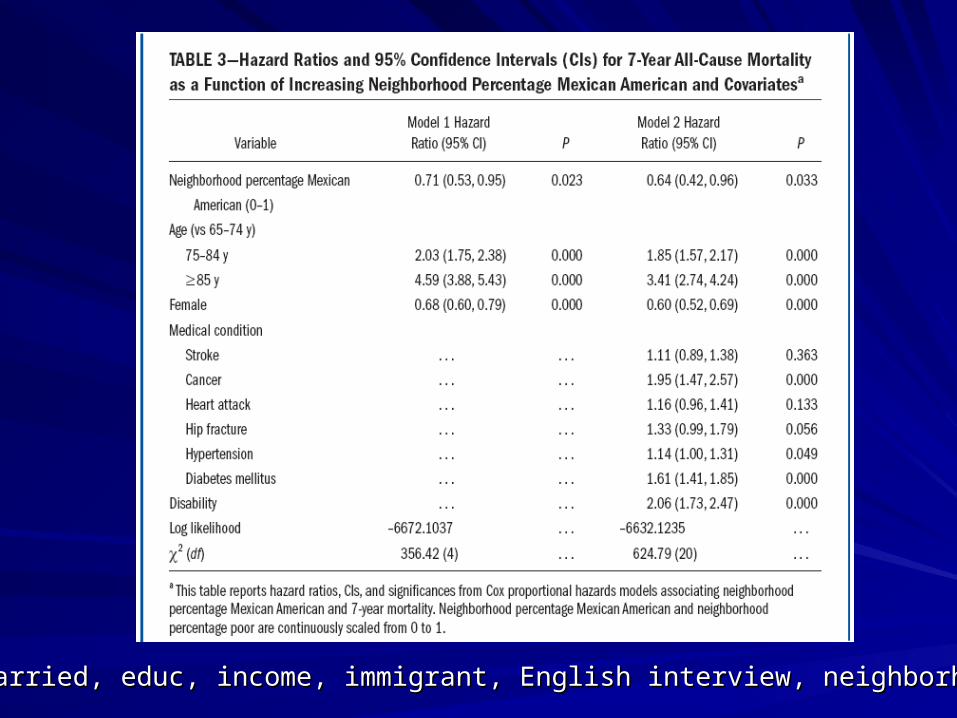
n.s.=married, educ, income, immigrant, English interview, neighborhood poorn.s.=married, educ, income, immigrant, English interview, neighborhood poor
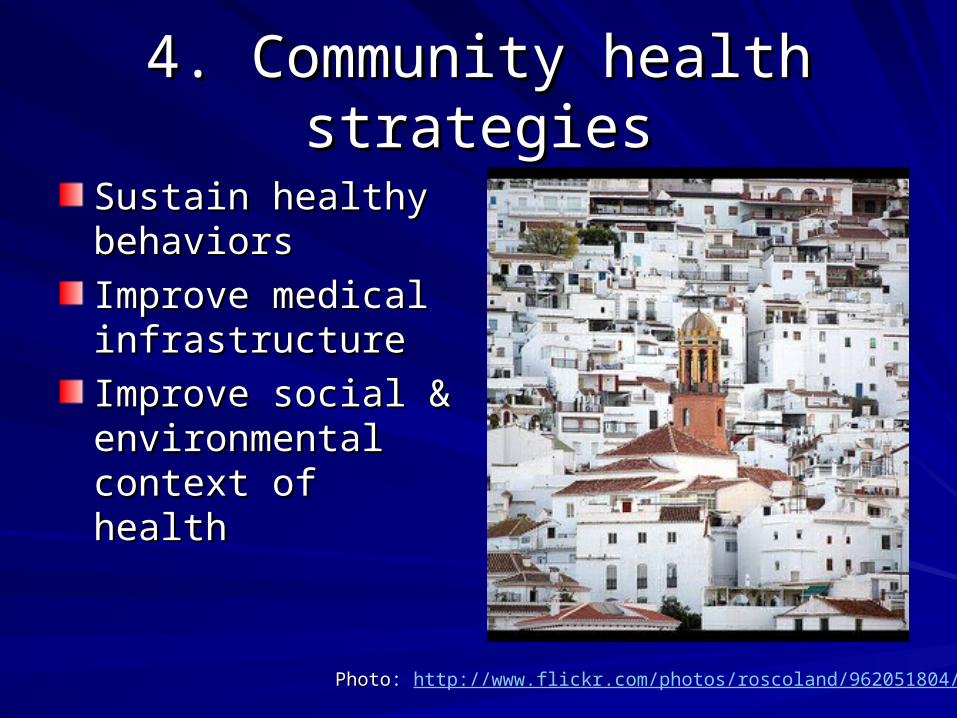
4. Community health strategies4. Community health strategies
Sustain healthy Sustain healthy behaviorsbehaviors
Improve medical Improve medical infrastructureinfrastructure
Improve social & Improve social & environmental context environmental context of healthof health
Photo: Photo: http://www.flickr.com/photos/roscoland/962051804/

Healthy BehaviorsHealthy Behaviors
Promote good nutrition: in schools, stores, Promote good nutrition: in schools, stores, food stampsfood stamps
Facilitate physical activities: via sports, Facilitate physical activities: via sports, parks school yardsparks school yards
Disseminate information via promotorasDisseminate information via promotoras
Sustain social networks via public spaceSustain social networks via public space

Improve medical infrastructureImprove medical infrastructure
Sustain/expand community clinics, school Sustain/expand community clinics, school based clinicsbased clinics
Increase bilingual, bicultural workforceIncrease bilingual, bicultural workforce
Better connect workers to workers Better connect workers to workers compensation systemcompensation system
Expand preventive & elder care, Expand preventive & elder care, screenings & treatmentscreenings & treatment

Improve context for healthImprove context for health
Improve housing, building enforcementImprove housing, building enforcement
Improve workplace health & safety, Improve workplace health & safety, CalOSHA, living wage and other CalOSHA, living wage and other enforcementenforcement
Improve air quality in immigrant Improve air quality in immigrant communitiescommunities
Summary, immigrant paradoxSummary, immigrant paradox
Better health outcomes despite many risk Better health outcomes despite many risk factorsfactors
Some health advantage due to selection, Some health advantage due to selection, other to health behaviors, other to social & other to health behaviors, other to social & community conditionscommunity conditions
To To maintain health capitalmaintain health capital, community , community health strategies are importanthealth strategies are important

5. Medical Care Issues5. Medical Care Issues
13.4
28.537.0 34.1
45.032.79.3
14.2
17.635.0
21.2
24.3
30.9 33.843.0
77.3
57.345.3
0%
20%
40%
60%
80%
100%
Recent Mexicanimmigrants
Longer-stayedMexican
immigrants
Mexican American U.S.-Born Whites U.S.-Born Non-Whites
Immigrants from acountry other than
Mexico
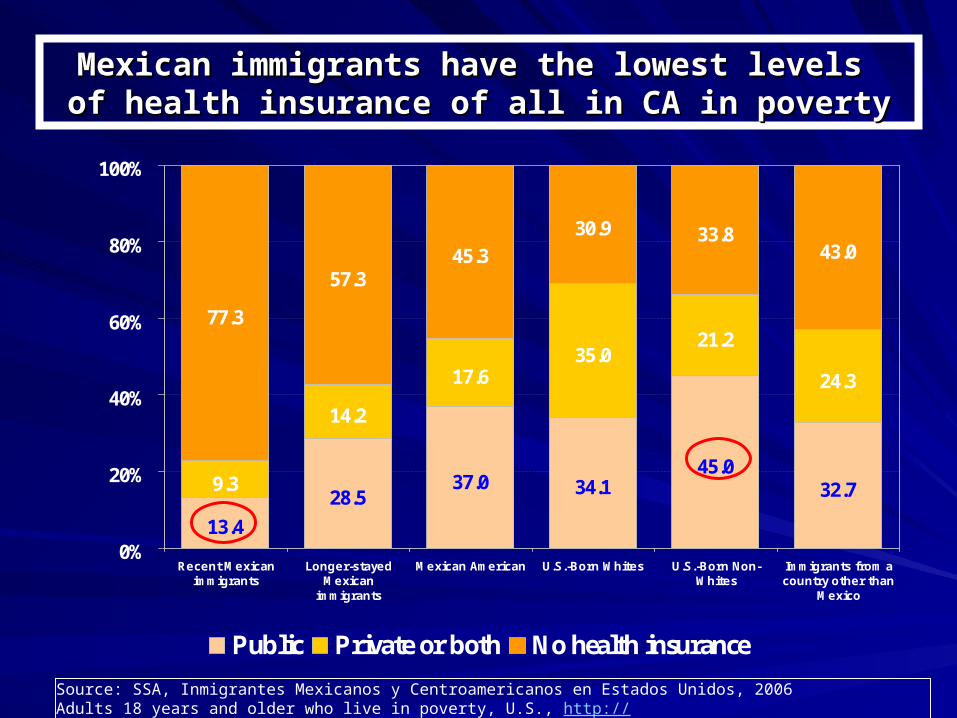
Public Private or both No health insurance
Source: SSA, Inmigrantes Mexicanos y Centroamericanos en Estados Unidos, 2006Adults 18 years and older who live in poverty, U.S., http://
www.healthpolicy.ucla.edu/pubs/publication.asp?pubID=196
Mexican immigrants have the lowest levels Mexican immigrants have the lowest levels of health insurance of all in CA in povertyof health insurance of all in CA in poverty
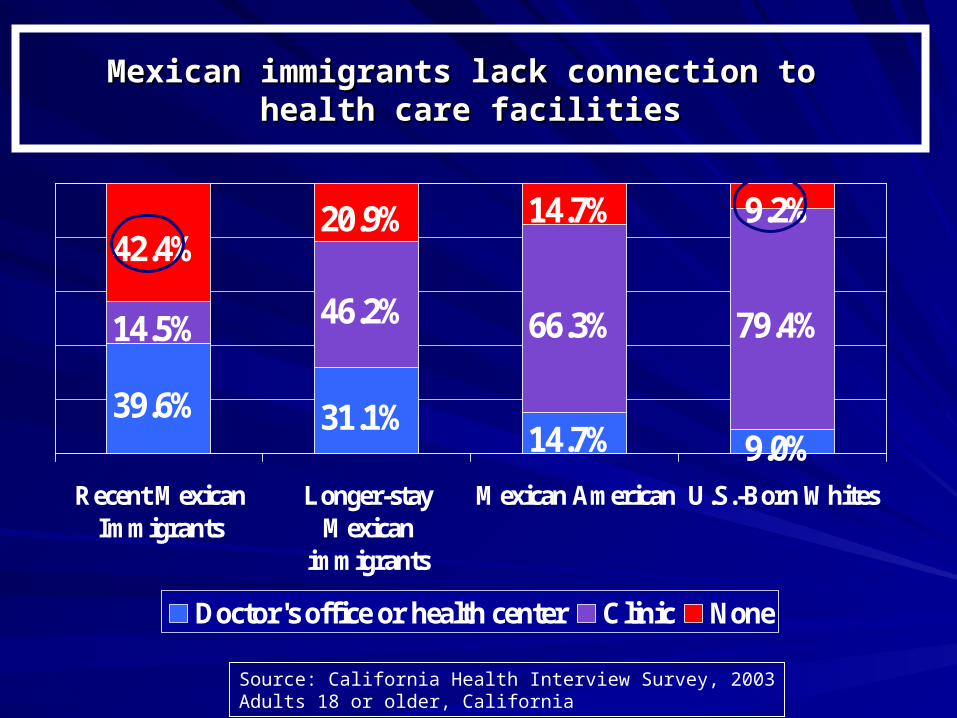
Mexican immigrants lack connection to Mexican immigrants lack connection to health care facilitieshealth care facilities
39.6% 31.1%14.7% 9.0%
46.2% 66.3%
42.4%20.9% 14.7% 9.2%
79.4%14.5%
Recent MexicanImmigrants
Longer-stayMexican
immigrants
Mexican American U.S.-Born Whites
Doctor's office or health center Clinic None
Source: California Health Interview Survey, 2003Adults 18 or older, California
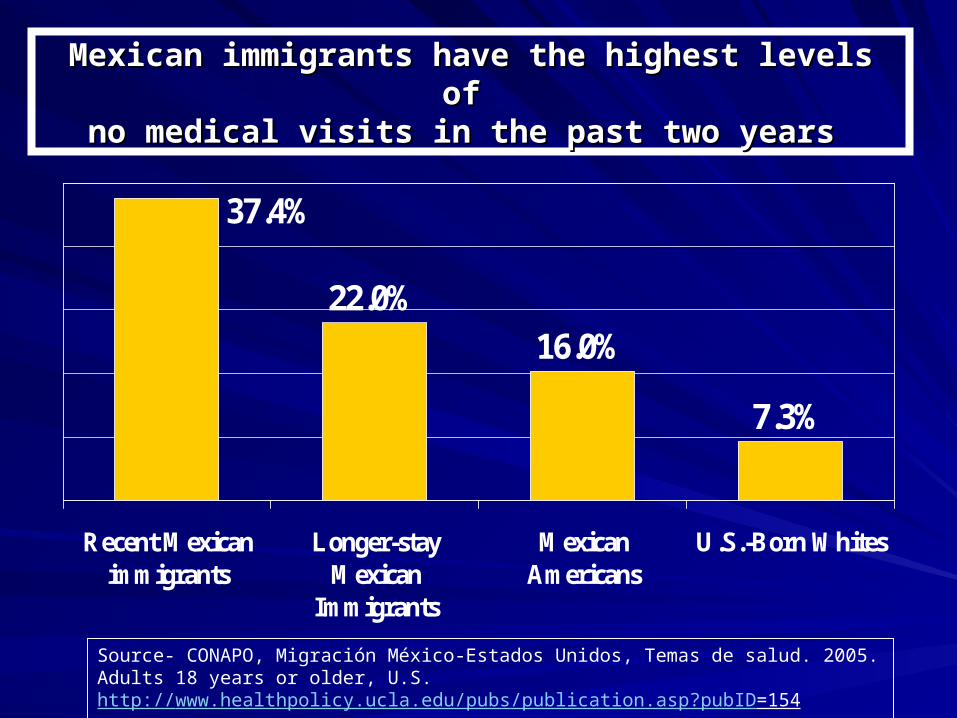
Mexican immigrants have the highest levels of Mexican immigrants have the highest levels of no medical visits in the past two years no medical visits in the past two years
22.0%16.0%
7.3%
37.4%
Recent Mexicanimmigrants
Longer-stayMexican
Immigrants
MexicanAmericans
U.S.-Born Whites
Source- CONAPO, Migración México-Estados Unidos, Temas de salud. 2005.Adults 18 years or older, U.S. http://www.healthpolicy.ucla.edu/pubs/publication.asp?pubID=154
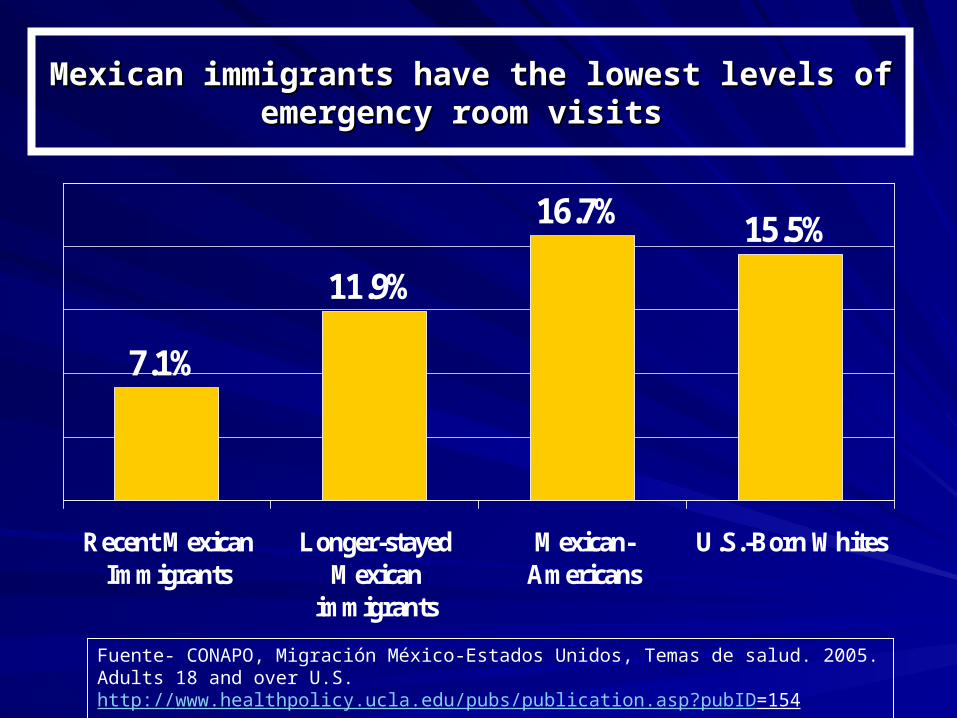
Mexican immigrants have the lowest levels of Mexican immigrants have the lowest levels of emergency room visits emergency room visits
7.1%
11.9%
16.7% 15.5%
Recent MexicanImmigrants
Longer-stayedMexican
immigrants
Mexican-Americans
U.S.-Born Whites
Fuente- CONAPO, Migración México-Estados Unidos, Temas de salud. 2005.Adults 18 and over U.S.http://www.healthpolicy.ucla.edu/pubs/publication.asp?pubID=154
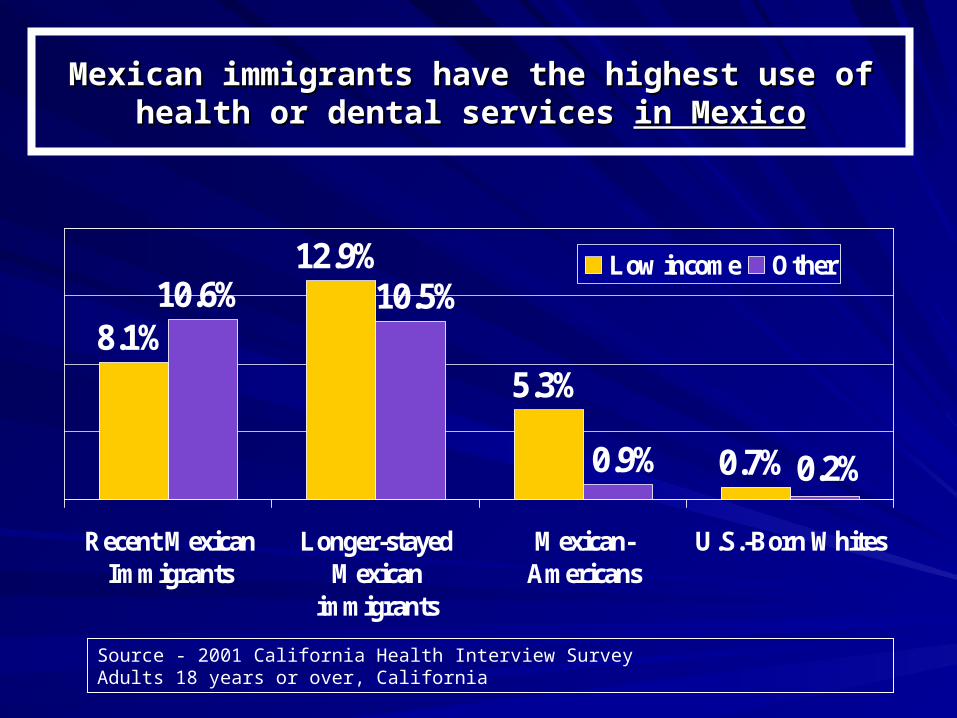
Mexican immigrants have the highest use of health or Mexican immigrants have the highest use of health or dental services dental services in Mexicoin Mexico
8.1%
12.9%
5.3%
0.7%
10.6%
0.2%0.9%
10.5%
Recent MexicanImmigrants
Longer-stayedMexican
immigrants
Mexican-Americans
U.S.-Born Whites
Low income Other
Source - 2001 California Health Interview SurveyAdults 18 years or over, California
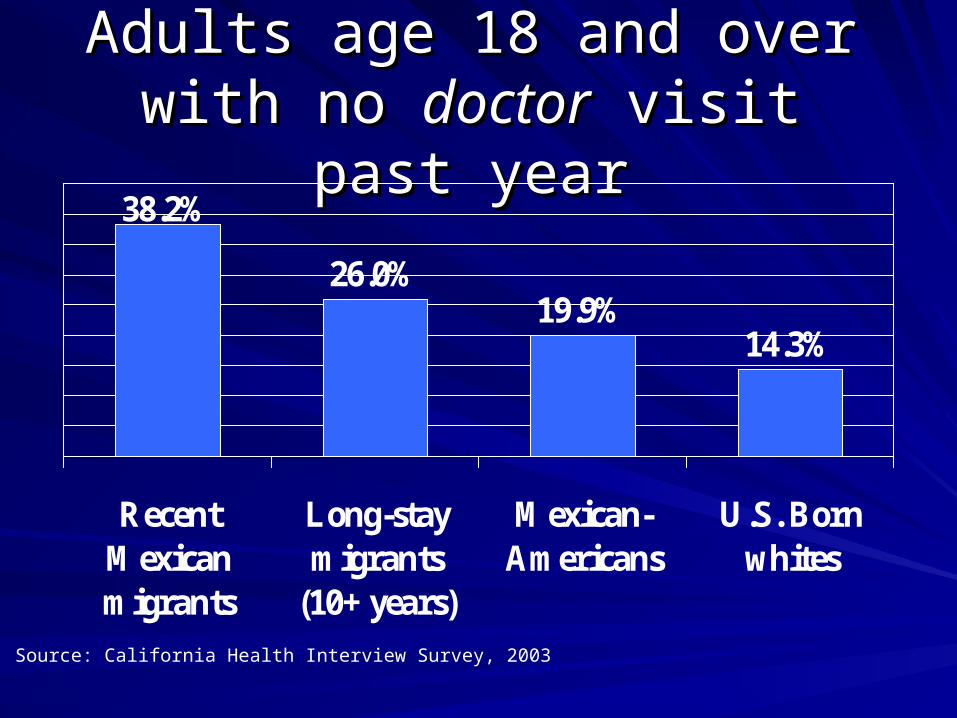
Adults age 18 and over with no Adults age 18 and over with no doctordoctor visit past year visit past year
38.2%
26.0%19.9%
14.3%
RecentMexicanmigrants
Long-staymigrants
(10+ years)
Mexican-Americans
U.S. Bornwhites
Source: California Health Interview Survey, 2003
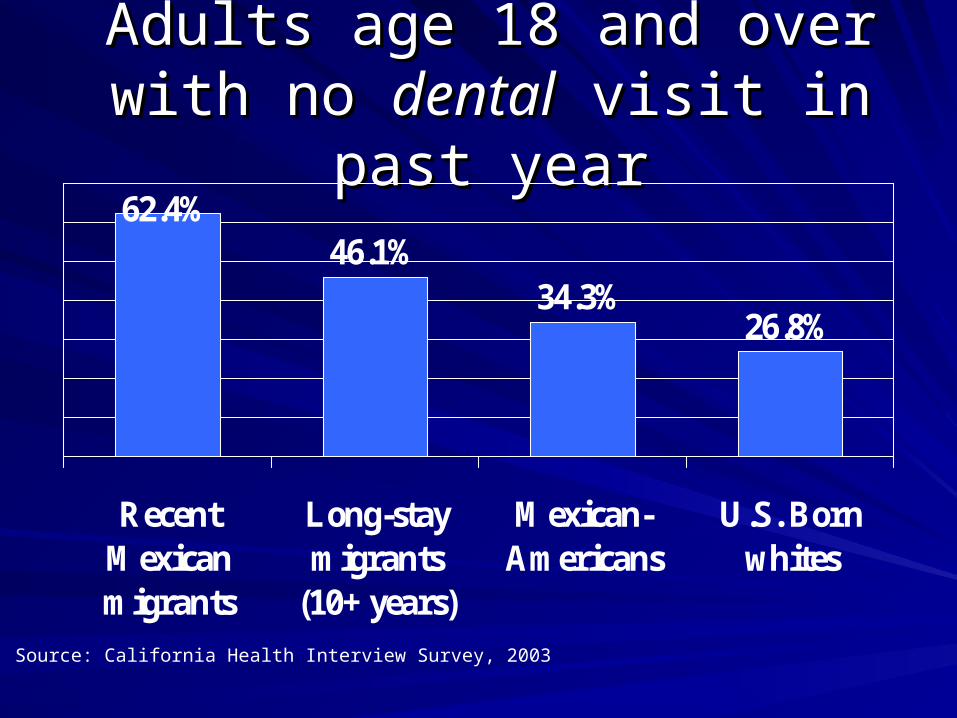
Adults age 18 and over with no Adults age 18 and over with no dentaldental visit in past year visit in past year
62.4%46.1%
34.3%26.8%
RecentMexicanmigrants
Long-staymigrants
(10+ years)
Mexican-Americans
U.S. Bornwhites
Source: California Health Interview Survey, 2003
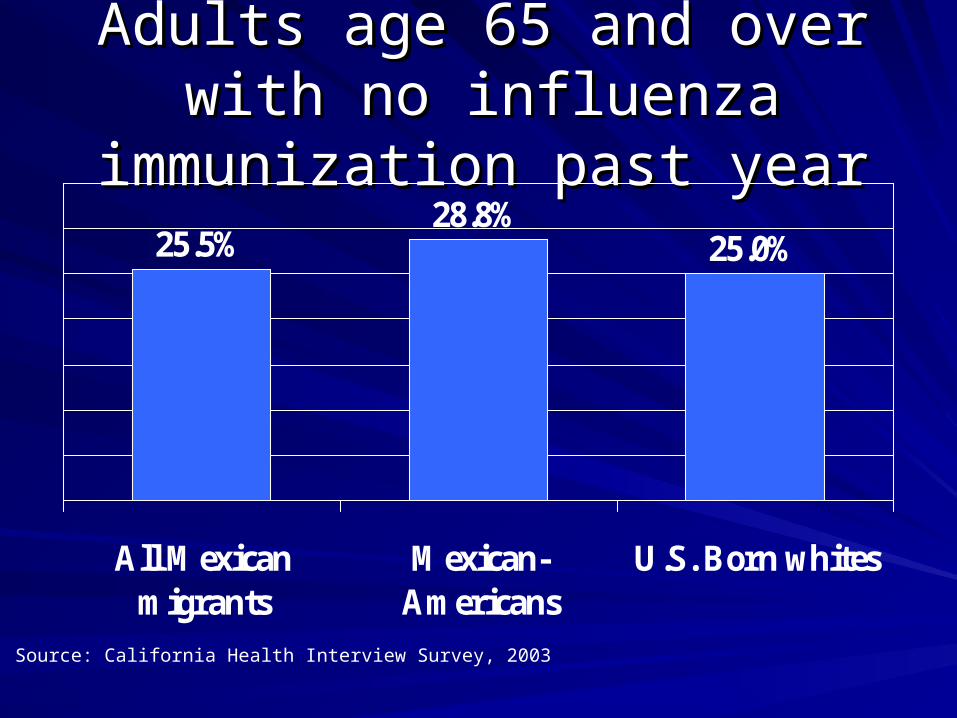
Adults age 65 and over with no Adults age 65 and over with no influenza immunization past yearinfluenza immunization past year
25.5%28.8%
25.0%
All Mexicanmigrants
Mexican-Americans
U.S. Born whites
Source: California Health Interview Survey, 2003
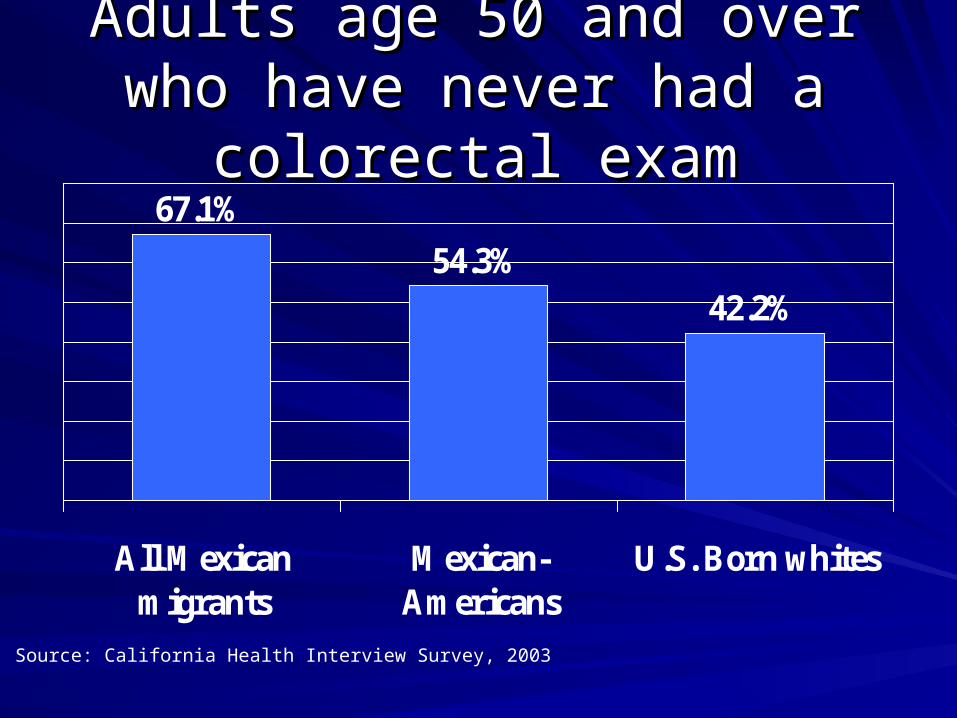
Adults age 50 and over who have Adults age 50 and over who have never had a colorectal examnever had a colorectal exam
67.1%
54.3%42.2%
All Mexicanmigrants
Mexican-Americans
U.S. Born whites
Source: California Health Interview Survey, 2003
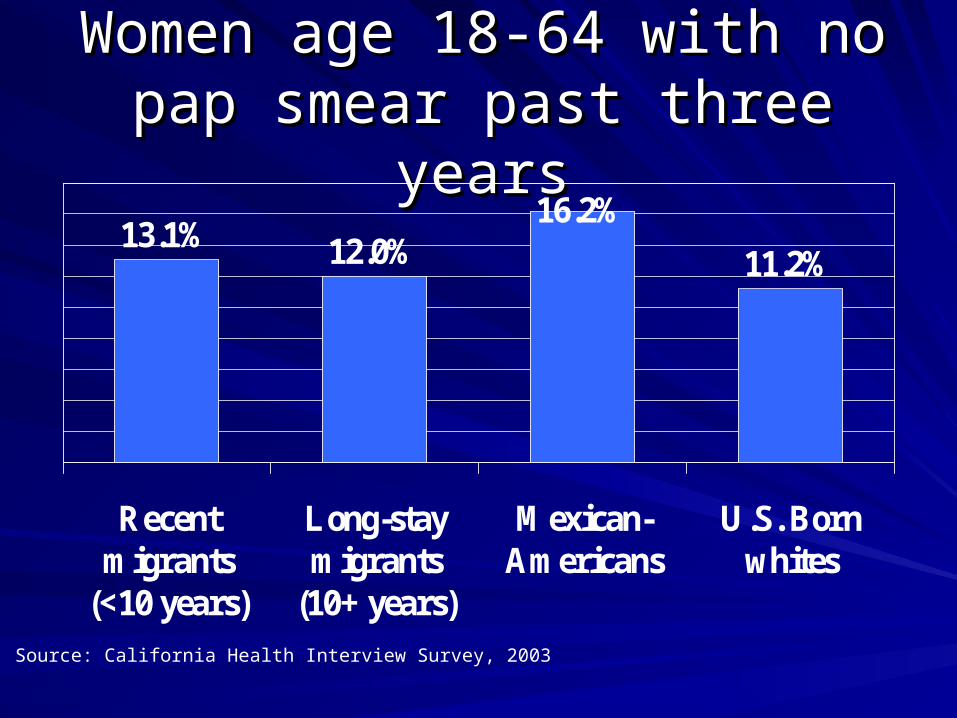
Women age 18-64 with no pap Women age 18-64 with no pap smear past three yearssmear past three years
13.1% 12.0%16.2%
11.2%
Recentmigrants
(<10 years)
Long-staymigrants
(10+ years)
Mexican-Americans
U.S. Bornwhites
Source: California Health Interview Survey, 2003

Summary, health careSummary, health care
Mexican and Central American immigrants Mexican and Central American immigrants are an important part of California’s are an important part of California’s populationpopulation
They face substantial access to care They face substantial access to care barriersbarriers
It is possible to provide adequate access It is possible to provide adequate access to care to these populationsto care to these populations

ConclusionConclusion
Immigrants are “here Immigrants are “here to stay”to stay”They face a number They face a number of special health, of special health, health behavior, and health behavior, and access to health care access to health care issuesissuesIt is critical to address It is critical to address those issues to those issues to maintain a health maintain a health CaliforniaCalifornia