imd world talent ranking · imd world talent ranking 2017 3 preface the imd world competitiveness...
TRANSCRIPT
IMD WORLD
TALENT
RANKING
2 0 17
November 2017IMD WORLD TALENT RANKING 2017
Copyright © 2017 IMD: Institute for Management Development23, Ch. de BelleriveP.O. Box 915CH-1001 LausanneSwitzerland
Tel : +41 21 618 02 51Fax : +41 21 618 02 04
e-mail : [email protected]: www.imd.org/wcc
IMD, IMD INTERNATIONAL REAL WORLD. REAL IMPACT, IMD BUSINESS SCHOOL and IMD WORLD COMPETITIVENESS YEARBOOK are trademarks of IMD – International Institute for Management Development
Choose the product that meets your needs
Visit our eShop www.wcceshop.org
All rights reserved. No part of this publication may be transmitted in any form or by any means, including photocopying and recording, or by any information storage and retrieval system. Nor may any part of this publication be included as a reference in any other work without authorization.
3IMD WORLD TALENT RANKING 2017
PrefaceThe IMD World Competitiveness Center is delighted to present its 2017 IMD World Talent Ranking. The objective of this publication is to assess the extent to which countries develop, attract and retain talent to sustain the pool that enterprises employ to create long-term value.
To assess how economies perform, the IMD World Talent Ranking studies three factors: Investment & Development, Appeal, and Readiness. This year two additional countries have been introduced in our rankings for the first time, Cyprus and Saudi Arabia, increasing the number of economies studied to 63.
As in the past, leaders of the 2017 IMD World Talent Ranking share some common characteristics: they have an outstanding educational system from primary to tertiary levels in which they invest significantly, offer a superior quality of life, and provide substantial opportunities for career advancement throughout the entire professional life span.
This year we are delighted to offer the complete dataset that generates the results for this ranking as part of the IMD World Competitiveness Online. This is a unique and comprehensive database on the competitiveness of countries for the use by academic researchers, practitioners and decision makers. It includes time series from the IMD World Competitiveness Yearbook since 1989, the IMD Digital Competitiveness Ranking since 2013 and the complete series of data employed for IMD World Talent Ranking from 2013 onwards.
In order to include the talent ranking in the online portfolio of datasets, we had to revisit the previous editions of the IMD World Talent Ranking to standardize both the data as well as the methodology employed throughout our publications. Thus, what one will find in the online data may be slightly different from the ranking positions published in previous editions because of the utilization of the most updated data series for the years 2013-2016. Looking forward, the data and ranking positions will be based on what is presented in this publication and the online dataset.
The IMD World Talent Ranking, as all our publications relies in the support and assistance we enjoy from many stakeholders. Our Partner Institutes, the IMD Alumni community and our Panel of Experts from all the countries provide data, and insights that are fundamental for the production of such an undertaking. We are most grateful for their support.
Professor Arturo BrisDirectorIMD World Competitiveness Center
Dr Christos CabolisChief Economist & Head of OperationsIMD World Competitiveness Center

IMD WORLD TALENT RANKING 20174
Table of Contents
The IMD World Talent Ranking 2017
Preface ����������������������������������������������������������������������������������������������������������������������������������������������������������������� 3Table of contents �������������������������������������������������������������������������������������������������������������������������������������������������� 4The IMD World Competitiveness Center �������������������������������������������������������������������������������������������������������������� 5Partner Institutes �������������������������������������������������������������������������������������������������������������������������������������������������� 6The 2017 IMD World Talent Ranking : overview of results ��������������������������������������������������������������������������������� 12World Talent Rankings 2017 ������������������������������������������������������������������������������������������������������������������������������� 23Overall Talent Ranking ��������������������������������������������������������������������������������������������������������������������������������������� 24Methodology in a Nutshell ���������������������������������������������������������������������������������������������������������������������������������� 26What is the IMD World Talent Ranking? ������������������������������������������������������������������������������������������������������������ 27IMD World Talent Rankings selected breakdowns ��������������������������������������������������������������������������������������������� 28Talent country profiles����������������������������������������������������������������������������������������������������������������������������������������� 35The IMD World Talent Ranking methodology ��������������������������������������������������������������������������������������������������� 100Notes and sources�������������������������������������������������������������������������������������������������������������������������������������������� 104
World Talent Country Profiles
Argentina ������������������������������������������������� 36Australia��������������������������������������������������� 37Austria ����������������������������������������������������� 38Belgium���������������������������������������������������� 39Brazil�������������������������������������������������������� 40Bulgaria ��������������������������������������������������� 41Canada ���������������������������������������������������� 42Chile �������������������������������������������������������� 43Hong Kong SAR �������������������������������������� 44China Mainland���������������������������������������� 45Colombia ������������������������������������������������� 46Croatia ����������������������������������������������������� 47Cyprus ����������������������������������������������������� 48Czech Republic ��������������������������������������� 49Denmark �������������������������������������������������� 50Estonia����������������������������������������������������� 51Finland ����������������������������������������������������� 52France ����������������������������������������������������� 53Germany �������������������������������������������������� 54Greece ����������������������������������������������������� 55Hungary ��������������������������������������������������� 56Iceland ����������������������������������������������������� 57India ��������������������������������������������������������� 58Indonesia ������������������������������������������������� 59Ireland������������������������������������������������������ 60Israel �������������������������������������������������������� 61Italy ���������������������������������������������������������� 62Japan ������������������������������������������������������� 63Jordan������������������������������������������������������ 64Kazakhstan ���������������������������������������������� 65Korea Republic ���������������������������������������� 66Latvia ������������������������������������������������������� 67
Lithuania �������������������������������������������������� 68Luxembourg��������������������������������������������� 69Malaysia �������������������������������������������������� 70Mexico ����������������������������������������������������� 71Mongolia �������������������������������������������������� 72Netherlands ��������������������������������������������� 73New Zealand ������������������������������������������� 74Norway ���������������������������������������������������� 75Peru ��������������������������������������������������������� 76Philippines ����������������������������������������������� 77Poland ����������������������������������������������������� 78Portugal ��������������������������������������������������� 79Qatar�������������������������������������������������������� 80Romania �������������������������������������������������� 81Russia������������������������������������������������������ 82Saudi Arabia �������������������������������������������� 83Singapore ������������������������������������������������ 84Slovak Republic ��������������������������������������� 85Slovenia ��������������������������������������������������� 86South Africa ��������������������������������������������� 87Spain ������������������������������������������������������� 88Sweden���������������������������������������������������� 89Switzerland ���������������������������������������������� 90Taiwan ����������������������������������������������������� 91Thailand ��������������������������������������������������� 92Turkey ������������������������������������������������������ 93UAE ��������������������������������������������������������� 94Ukraine ���������������������������������������������������� 95United Kingdom ��������������������������������������� 96USA ��������������������������������������������������������� 97Venezuela ������������������������������������������������ 98
5IMD WORLD TALENT RANKING 2017
The IMD World Competitiveness Center
For almost thirty years, the IMD World Competitiveness Center has pioneered research on how countries and companies compete to lay the foundations for sustainable value creation. The competitiveness of nations is probably one of the most significant developments in modern management and IMD is committed to leading the field. The World Competitiveness Center conducts its mission in cooperation with a network of 57 Partner Institutes worldwide to provide the government, business and academic communities with the following services:
• Competitiveness assessment and education• Workshops/Mega Dives on competitiveness• Special country/regional competitiveness reports• World Competitiveness Yearbook and Online• IMD World Talent Ranking
The IMD World Competitiveness Center team:
At IMD Professor Arturo Bris Director of The IMD World Competitiveness Center Christos Cabolis Chief Economist & Head of Operations José Caballero Senior Economist Maëlle Desard Marketing Specialist Madeleine Hediger Data Research and Online Services Specialist Catherine Jobin Order and Sales Administrator William Milner Research Projects Associate Manager Marco Pistis Research Specialist Maryam Zargari Research Specialist with the collaboration of IMD’s Information Center and Information Systems Department
At KAESCO Jean-François KaeserConsulting
We also have the privilege of collaborating with a unique network of Partner Institutes, and other organizations, which guarantees the relevance of the data gathered�
Contact:Tel: + 41 21/618 02 51E-mail : wccinfo@imd�orgInternet: www�imd�org/wcc
IMD WORLD TALENT RANKING 20176
Argentina Economic Development and Institutions Research Program Faculty of Economic SciencesCatholic University of Argentina, Buenos Aireshttp://www.uca.edu.ar
Australia CEDA - Committee for Economic Development of Australia, Melbournewww.ceda.com.au
Austria Federation of Austrian Industries, ViennaAustrian Institute of Economic Research, Viennahttp://www.iv-net.at
Belgium FEB - Federation of Enterprises in Belgium, Brusselswww.vbo-feb.be
Brazil Fundação Dom Cabral, Innovation and Entrepreneurship Centerwww.fdc.org.br
Bulgaria Center for the Study of Democracy, Sofiawww.csd.bg
Canada Intifin Group, Torontowww.intifin.com/
Chile Universidad de Chile, Facultad de Economía y Negocioswww.fen.uchile.cl
China Mainland China Institute for Development Planning, Tsinghua Universityhttp://www.tsinghua.edu.cn/
Dr. Alicia Caballero, DeanDr. Marcelo F. Resico, Senior EconomistMr. Ignacio Duran, Research Assistant
Professor the Hon. Stephen Martin, Chief Executive OfficerMs. Roxanne Punton, Director, External AffairsMs. Sarah-Jane Derby, Senior Economist
Dr. Christian Helmenstein, Chief EconomistMs. Helena ZwicklMr. Michael Oliver
Ms. Carole Dembour, Economist
Carlos Arruda, Professor and Director FDC Innovation and Entrepreneurship CenterAna Burcharth, ProfessorArthur Ramos, Researcher Mr. Ruslan Stefanov, Director, Economic ProgramMs. Daniela Mineva, Research Fellow, Economic ProgramMr. Martin Vladimirov, Analyst, Economic ProgramDr. Todor Galev, Senior Analyst, Economic Program Mr. Brett Berman, Managing Director
Dr. Enrique Manzur, Vice PresidentDr. Sergio Olavarrieta, Vice DeanMr. Pedro Hidalgo, Associate Professor
Prof. Yongheng Yang, Associate Dean (School of Public Policy & Management)Prof. Youqiang Wang, Executive Director Dr. Fangtao Liu, Research FellowDr. Jia Gao, Research FellowMr. Pu Gong, PhD CandidateMr. Dong Guo, PhD CandidateMiss Hongyu Lai, Research Assistant
We would like to express our deep appreciation for the contribution of our Partner Institutes, enabling an extensive coverage of competitiveness in their home countries. The following Institutes and people supplied data from national sources and helped distribute the survey questionnaires:
Partner Institutes
7IMD WORLD TALENT RANKING 2017
Colombia National Planning Department, Bogotawww.dnp.gov.co
Croatia National Competitiveness Council, Zagrebhttp://www.konkurentnost.hr/
Cyprus Economics Research CentreUniversity of Cyprus, Nicosiahttp://ucy.ac.cy/erc/en/
Czech Republic CERGE-EI, Praguewww.cerge-ei.cz
Denmark Confederation of Danish Industry (DI) http://di.dk/English/Pages/English.aspx
Estonia Estonian Institute of Economic Research, Tallinnwww.ki.ee
Enterprise Estonia, Tallinn
Finland ETLA, The Research Institute of the Finnish Economy, Helsinkiwww.etla.fi
France Business France, Parishttp://en.businessfrance.fr/
Greece Federation of Industries of Northern Greece, (FING), Thessaloniki
Foundation for Economic and Industrial Research (FEIR/IOBE), Athens
Hong Kong SAR Hong Kong Trade Development Councilwww.hktdc.com
Hungary ICEG European Center, Budapestwww.icegec.org
National University of Public Service,Competitiveness and Fiscal Stability Research Group, Budapesthttp://en.uni-nke.hu/
Iceland Icelandic Chamber of Commerce, Reykjavikwww.chamber.is
Santiago Matallana Mendez, Director of Enterprise DevelopmentSara Patricia Rivera, Research AnalystAdriana Quiñones, Project Manager Ms. Jadranka Gable, AdvisorMr. Kresimir Jurlin, PhD, Researcher
Sofronis Clerides, Professor of EconomicsNicoletta Pashourtidou, Assistant DirectorChristos Papamichael, Research Officer
Dr. Vilem SemerakDr. Lucia Štefánková
Mr. Allan Sorensen
Ms. Marje Josing, DirectorMs. Ingrid NiklusMr. Koit Nilson, Researcher
Mr Tanel Rebane, Director of Development Unit
Mr. Petri Rouvinen, Research DirectorMr. Markku Kotilainen, Head of the Forecasting GroupMr. Ville Kaitila, Researcher
Ms. Sylvie Montout, Economist
Dr. Christos Georgiou, Director, Research and Documentation Department Mr. Constantinos Styliaras, Economist, Research and Documentation Department
Aggelos Tsakanikas, Assistant Professor National Technical University of Athens - Scientific AdvisorSophia Stavraki, Research Associate Mr. Billy Wong, Principal Economist (Greater China)Ms. Doris Fung, Economist
Ms. Renata Anna Jaksa, DirectorDr. Oliver Kovacs, Research Fellow
Prof. Dr. Magdolna Csath, Research professor
Ms. Kristrun Frostadottir, Chief EconomistMr. Leifur Hreggvidsson, Economic Analyst
IMD WORLD TALENT RANKING 20178
India National Productivity Council, New Delhiwww.npcindia.gov.in
Indonesia Lembaga Management, Faculty of Economics, University of Indonesia, Jakartahttp://www.lmfeui.com/index.php
NuPMK Consulting, Jakartahttp://nupmk.co.id/
Ireland IDA Ireland, Investment and Development Agency, Dublinwww.idaireland.com
Israel The Federation of Israeli Chambers of Commerce, Tel-Avivwww.chamber.org.il
Italy CONFINDUSTRIA, Economic Research Department, Romewww.confindustria.it
Japan Mitsubishi Research Institute, Inc., TokyoResearch Center for Policy and Economywww.mri.co.jp
Jordan Ministry of Planning and International Cooperation, Ammanhttp://www.mop.gov.jo/
Kazakhstan JSC Economic Research Institute of the Ministry of National Economy, Astanawww.economy.kz
Korea, Rep. Korea Institute for International Economic Policy (KIEP)http://www.kiep.go.kr/eng/
Latvia University of Latvia Centre for European and Transition Studies, LU CETS, Rigahttp://www.lu.lv/cets
Jean Monnet Center of Excellence, Riga
Dr. K.P. Sunny, Director & Head (Economic Services)Mr. Rajesh Sund, Deputy Director (Economic Services)
Dr Toto Pranoto, Managing DirectorDr Willem Makaliwe, Associate Director of Research & ConsultingBayuadi Wibowo, Group Head of Research Division
Ms Tini Moeis, Managing DirectorMr Kiki Lekir Daud, Principal PartnerMs Devi Hamdani, Client Relation Manager
Ms. Israela Many, Deputy Managing Director of Economy and TaxMr. Aviad Toub, Economist Dr. Luca Paolazzi, Director Research CentreDr. Lorena Scaperrotta, Economist
Mr. Hirotsugu Sakai, Research Director
H.E Imad Najib Fakhour, MinisterDr. Saleh Al-Kharabsheh, Secretary GeneralBasem Kanan, Acting Director of Policies & Strategic Dept.Basma Suleiman Arabiyat, National Competitiveness TeamFarouq Drabseh, National Competitiveness Team
Serzhan Madiyev, Chairman of the BoardShakharbanu Zhakupova, Deputy Chairman of the BoardBakytgul Khambar, Director, Center for Regulatory Environment AnalysisAltyngul Utebayeva, Deputy Director, Center for Regulatory Environment Analysis;Kymbat Akhmetzhanova, Deputy Director, Center for Regulatory Environment AnalysisAssel Tasbauova, Deputy Director, Center for Regulatory Environment AnalysisKarlygash Bolat, Senior Expert, Center for Regulatory Environment Analysis Dr. Heungchong Kim, Senior Research FellowMs. Nayoun Park, Researcher
Dr. Tatjana Muravska, DirectorMrs. Zane Zeibote
9IMD WORLD TALENT RANKING 2017
Lithuania Enterprise Lithuania, Vilniuswww.enterpriselithuania.com
Luxembourg Chamber of Commerce of the Grand Duchy of Luxembourg www.cc.lu
Malaysia Malaysia Productivity Corporation (MPC), Petaling Jaya, Selangorwww.mpc.gov.my
Mexico Strategic Studies Center for Competitiveness, Saltillowww.ceec.edu.mx
Mongolia Economic Policy and Competitiveness Research Center, Ulaanbaatarwww.ecrc.mn
Netherlands Confederation of Netherlands Industry and Employers (VNO-NCW), The Haguewww.vno-ncw.nl
New Zealand Kerridge & Partners, Aucklandhttps://www.kerridgepartners.com/
Peru CENTRUM Católica Graduate Business School, Limahttp://centrum.pucp.edu.pe
Philippines Asian Institute of ManagementRizalino S. Navarro Policy Center for Competitiveness, Makati Cityhttp://beta.aim.edu/research-centers/rizalino-s-navarro-policy-center-competitiveness
Poland Warsaw School of Economics, Warsawhttp://www.sgh.waw.pl/en/
Portugal Porto Business School, University of Porto, Portohttps://www.pbs.up.pt/
Qatar Ministry of Development Planning and Statistics, Department of Environmental and Economic Development Planning, Dohawww.gsdp.gov.qa
Ms. Rasa Narusaityte, Senior Project Manager
Mr. Marc Wagener, Member of the Managing Board Ms. Laure Demezet, Economist Ms. Lynn Zoenen, Economist
Dato’ Mohd Razali Hussain, Director General Dato’ Abdul Latif Abu Seman, Deputy Director GeneralDatin Zainon Bakar, Director Productivity & Competitiveness Development M.C. Carlos Maroto Cabrera, General Director M.S. Carlos Maroto Espinosa, Project & Relationship Manager Mr. Boldbaatar Tserenpuntsag, FounderMr. Tsagaan Puntsag, Founder Ms. Lakshmi Boojoo, Director GeneralMs. Odonchimeg Ikhbayar, Deputy DirectorMr. Ganbat Chuluun, Research EconomistMs. Tungalag Erdenebat, Research EconomistMr. Zolbayar Enkhbaatar, Research EconomistMr. Otgon-Erdene Khandaa, Research EconomistMs. Yesunchuluu Khuderchuluu, Research Economist Mr. Paul van Kempen, Advisor Economic policy
Mr. Peter Kerridge, PartnerMs. Jasmine Glenister, Executive Assistant
Mr. Fernando D’Alessio, General Director Mr. Pablo Arana, Academic Projection Director
Jamil Paolo S. Francisco, PhD, Executive DirectorTristan A. Canare, Program Manager and Senior EconomistEmmanuel M. Garcia, EconomistChristopher Ed C. Caboverde, Research Associate
Dr. Bogdan A. Radomski, Associate Professor of FinanceDr. Marcin Nowakowski, Professor of International Business and Prorector Prof Álvaro AlmeidaProf Daniel BessaProf Ramon O’Callaghan Dr. Issa Ibrahim, Economic Expert (Project Manager)Hissa Al-Assiry, Economic Researcher Eman Ahmad Abbara, Senior economist

IMD WORLD TALENT RANKING 201710
Romania CIT-IRECSON Center of Technological Information, Bucharestwww.cit-irecson.ro
Russia Moscow Business Schoolhttp://mbschool.ru/
Saudi Arabia SAGIA, Saudi Arabian General Investment Authority, Riyadhhttps://www.sagia.gov.sa/en/
Singapore Singapore Business Federationwww.sbf.org.sg/
Economics Division, Ministry of Trade and Industry, Singaporewww.mti.gov.
Slovak Republic The F.A Hayek Foundation, Bratislavawww.hayek.skv
Slovenia Institute for Economic Research, Ljubljanahttp://www.ier.si/
University of Ljubljana, Faculty of Economicshttp://www.ef.uni-lj.si/en
South Africa Productivity SA, Midrandwww.productivitysa.co.za
Spain Spanish Confederation of Employers, Madridwww.ceoe.es
Taiwan National Development Council, Taipeiwww.ndc.gov.tw
Thailand Thailand Management Association (TMA), Bangkokwww.tma.or.th
Turkey TUSIAD, Turkish Industry and Business AssociationEconomic Research Departmenthttp://tusiad.org/en/
United Arab Emirates Federal Competitiveness & Statistics Authority (FCSA), Dubai
Mr. Bogdan Ciocanel, PhD, DirectorMr. Dan Grigore, Economist
Ms. Elina Pechonova
Fahdah Mohammed Al Rasheed, Investment Intelligence Senior Supervisor Nawaf Mohammed AlSalloum, Associate Specialist, Research and ReportsHatem Abdul-Mohsin Samman, Chief Economist Ms. Cheryl Kong, Assistant Executive Director
Mr. Martin Lindak, Analyst
Mr. Peter Stanovnik, PhD, Associate ProfessorMs. Sonja Ursic, M.A.
Ms. Mateja Drnovsek, PhD, Full Professor Mr. Ales Vahcic, PhD, Full Professor
Mothunye Mothiba, Chief Executive OfficerDr. Leroi Raputsoane, Chief EconomistJuliet Sebolelo Mashabela, Economist
Ms. Edita Pereira, Head of Economic Research UnitMs. Paloma Blanco, Economic Research Unit
Ms. Kao, Shienquey, Deputy Minister Ms. Wu, Ming Huei, Director of Economic Development Department Ms. Lee, Cho-Jin, Senior Economist Ms. Wanweera Rachdawong, Chief Executive Officer, TMAMs. Pornkanok Wipusanawan, Director, TMA Center for Competitiveness Zümrüt İmamoğlu, Chief EconomistElçin Tüzel, ExpertEzgi Kurt, Junior Expert
11IMD WORLD TALENT RANKING 2017
Ukraine International Management Institute (MIM-Kyiv)www.mim.kiev.ua
Venezuela National Council to Investment Promotion (CONAPRI)www.conapri.org
Dr. Iryna Tykhomyrova, PresidentDr. Volodymyr Danko, ProfessorMs. Oksana Kukuruza, External Relations Directorr Mr. Eduardo Porcarelli, Executive DirectorMs. Litsay Guerrero A, Economic Affairs & Investor Services Manager
IMD WORLD TALENT RANKING 201712
T he 2 017 IMD Wor ld Talent Rank ing
Dr. Christos CabolisChief Economist
Overview of results
The IMD World Competitiveness Center is delighted to present its 2017 IMD World Talent Ranking. The objective of this publication is to assess the extent to which countries develop, attract and retain talent to sustain the pool that enterprises employ to create sustainable value.
To assess how economies perform, the IMD World Talent Ranking studies three factors. First, the Investment and Development factor which measures the resources committed to cultivate home grown talent. Second, the Appeal factor that evaluates the ability to attract and retain talent. And third, the Readiness factor that quantifies the quality of the available skills in the talent pool.
The data employed are gathered from the Center’s extensive database. And this year we are introducing for the first time two economies: Cyprus and Saudi Arabia. Thus the total number of countries studied is 63.
A new feature that is introduced in 2017 is the availability of the dataset employed to generate the ranking results in the IMD World Competitiveness Online. This is a unique and comprehensive database on the competitiveness of countries for the use by academic researchers, practitioners and decision makers. It includes time series from the IMD World Competitiveness Yearbook since 1989, the Digital Competitiveness Ranking since 2013 and the complete series of data employed for IMD World Talent Ranking from 2013 onwards.
We are very happy to provide such an appealing portfolio of data to the research community. However, such an undertaking comes with a trade-off. In order to include the Talent Ranking in the online selection of datasets, we had to
revisit the previous editions of the IMD World Talent Ranking to standardize both the data as well as the methodology employed throughout our publications. Thus, what one will find in the online data may be slightly different from the ranking positions published in previous editions because of the utilization of the most updated data series for the years 2013-2016. Looking forward, the data and positions of the economies participating in our rankings will be based on what is presented in this publication as well as the online dataset.
The economies that performs the best in this edition of the IMD World Talent Ranking share similar attractive indicators. First, education. The leaders in our ranking offer an outstanding educational system from primary to tertiary levels. In addition, they invest significantly in education. Second, they offer substantial opportunities for career advancement throughout the entire professional life span. And third, they offer a superior quality of life.
In analyzing the 2017 Rankings, we begin by studying the regional trends. In the next section we present the regional results showing that Western Europe dominates the rankings while Latin America has many aspects that can be improved upon.
In the subsequent section we concentrate in the characteristics of the leading economies as well as the ones that are placed in the lowest segment of our ranking with respect to Talent Competitiveness. By doing so, this exercise brings forth the areas of strength and dimensions that can be improved upon in the above two groups of economies.
Dr. José CaballeroSenior Economist
Marco PistisResearch Specialist
I. Introduction
The results of the 2017 IMD World Talent Ranking confirm the long-term trends highlighted in the previous editions in terms of talent competitiveness, even if, at country level, remarkable shifts occurred in the ranking with respect to 2016 (see next section).
2. Regional trends
13IMD WORLD TALENT RANKING 2017
Figure 1: The IMD Talent Ranking results (score (0-100)) in 2017
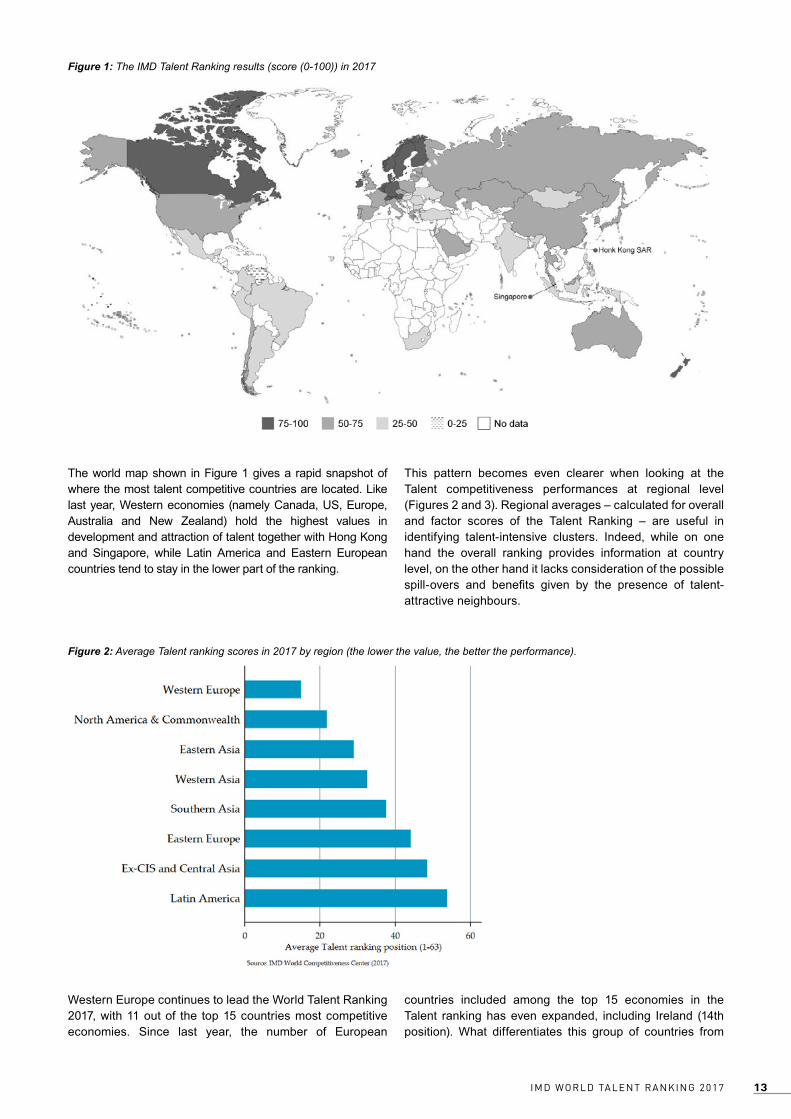
The world map shown in Figure 1 gives a rapid snapshot of where the most talent competitive countries are located. Like last year, Western economies (namely Canada, US, Europe, Australia and New Zealand) hold the highest values in development and attraction of talent together with Hong Kong and Singapore, while Latin America and Eastern European countries tend to stay in the lower part of the ranking.
This pattern becomes even clearer when looking at the Talent competitiveness performances at regional level (Figures 2 and 3). Regional averages – calculated for overall and factor scores of the Talent Ranking – are useful in identifying talent-intensive clusters. Indeed, while on one hand the overall ranking provides information at country level, on the other hand it lacks consideration of the possible spill-overs and benefits given by the presence of talent-attractive neighbours.
Figure 2: Average Talent ranking scores in 2017 by region (the lower the value, the better the performance).
Western Europe continues to lead the World Talent Ranking 2017, with 11 out of the top 15 countries most competitive economies. Since last year, the number of European
countries included among the top 15 economies in the Talent ranking has even expanded, including Ireland (14th position). What differentiates this group of countries from

IMD WORLD TALENT RANKING 201714
Figure 3: Average Talent factors’ scores in 2017 by region (the lower the value, the better the performance).
the rest of the sample are two main characteristics: first, a balanced performance in all three components of the Talent Ranking (i.e. Investment & Development, Appeal and Readiness factors), as in the case of Switzerland; second, on average, high investments in education accompanied by an superior quality of the educational system (from primary to tertiary levels), which allows them to develop local talent and to attract foreign highly-skilled professionals. When focusing on the sub-regional level, different trends emerge within the region. For instance, Nordic countries (Denmark, Finland, Norway and Sweden) perform significantly well in areas such as investment in education, while they slightly lag behind in terms of appeal for foreign workers. Other European countries instead (e.g. Germany, the Netherlands, Belgium and Luxembourg) build a consistent part of their competitive advantage precisely from a remarkable performance in the Appeal factor.
The North America and Commonwealth region (a geographically disperse, Anglophone cohort) constitutes the second most important hub for talent worldwide. Of this group Canada and New Zealand are the countries with the best performance in the Talent ranking, followed by the US in 16th position. As shown in Figure 3, this group presents a completely different approach to talent development and attraction. Indeed, contrary to Western Europe, governments from these countries on average invest considerably less in education and development of local talent. However, in terms of Appeal – which includes indicators assessing the quality of life in a country, opportunities for career advancement and the level of remunerations – these economies are able to outperform all the other regions in the sample. The performance in the Readiness factor is instead close to the average scores of the European countries, implying that the quality of the available talent pool is very high.
Also in Asia, various approaches coexist across regions. On the one hand, as in the case of Western Europe, Eastern Asia presents a balanced performance across the Talent factors. Indeed, most of the economies in the region (e.g. Japan, South Korea and China) tend to perform fairly well in all the areas of Talent competitiveness. On the other hand, Western Asia and Southern Asia, which share similar performances in the Overall Talent and Factor rankings, both exhibit inconsistent performance between factors. With the exception of Israel (Western Asia) – which ranks 18th in the Investment & Development factor – countries in these regions tend to invest less in public education, enhancing the quality of their talent pool by attracting highly-qualified foreign professionals. This approach is particularly successful for relatively small economies such as Singapore (13th in the Overall Talent Ranking), Qatar (22nd) and UAE (25th) but less effective for others e.g. Indonesia (47th) and Jordan (49th).
Eastern European and Ex-CIS & Central Asian countries typically invest a lot in education and development of local talent, but their performances in the Appeal and Readiness factors highlight an evident issue of brain drain for both regions (with the exception of Estonia). Interestingly, this year several countries from these areas (i.e. Romania, Croatia, and Ukraine) show a marked decline with respect to the past years, replacing a number of Latin American countries in the lower positions of the ranking.
Similarly, Latin America experiences some challenges in developing and retaining a highly-skilled workforce. In particular, developing domestic talent seems to be the main issue for talent competitiveness in Latin America. Performances in both the Investment & Development and the Readiness factor highlight a lack of investment in education and issues in retaining a qualified workforce in the region.
15IMD WORLD TALENT RANKING 2017
3. Overview of the World Talent Ranking
Top ranking economies
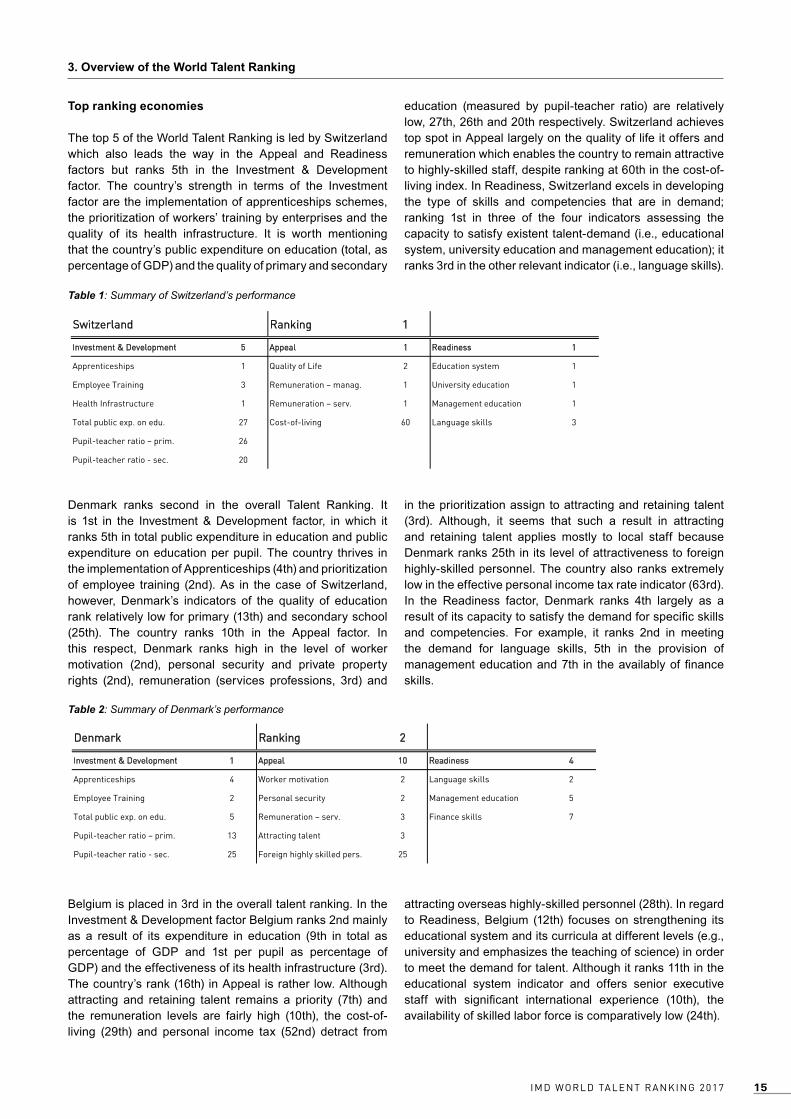
The top 5 of the World Talent Ranking is led by Switzerland which also leads the way in the Appeal and Readiness factors but ranks 5th in the Investment & Development factor. The country’s strength in terms of the Investment factor are the implementation of apprenticeships schemes, the prioritization of workers’ training by enterprises and the quality of its health infrastructure. It is worth mentioning that the country’s public expenditure on education (total, as percentage of GDP) and the quality of primary and secondary
education (measured by pupil-teacher ratio) are relatively low, 27th, 26th and 20th respectively. Switzerland achieves top spot in Appeal largely on the quality of life it offers and remuneration which enables the country to remain attractive to highly-skilled staff, despite ranking at 60th in the cost-of-living index. In Readiness, Switzerland excels in developing the type of skills and competencies that are in demand; ranking 1st in three of the four indicators assessing the capacity to satisfy existent talent-demand (i.e., educational system, university education and management education); it ranks 3rd in the other relevant indicator (i.e., language skills).
Denmark ranks second in the overall Talent Ranking. It is 1st in the Investment & Development factor, in which it ranks 5th in total public expenditure in education and public expenditure on education per pupil. The country thrives in the implementation of Apprenticeships (4th) and prioritization of employee training (2nd). As in the case of Switzerland, however, Denmark’s indicators of the quality of education rank relatively low for primary (13th) and secondary school (25th). The country ranks 10th in the Appeal factor. In this respect, Denmark ranks high in the level of worker motivation (2nd), personal security and private property rights (2nd), remuneration (services professions, 3rd) and
in the prioritization assign to attracting and retaining talent (3rd). Although, it seems that such a result in attracting and retaining talent applies mostly to local staff because Denmark ranks 25th in its level of attractiveness to foreign highly-skilled personnel. The country also ranks extremely low in the effective personal income tax rate indicator (63rd). In the Readiness factor, Denmark ranks 4th largely as a result of its capacity to satisfy the demand for specific skills and competencies. For example, it ranks 2nd in meeting the demand for language skills, 5th in the provision of management education and 7th in the availably of finance skills.
Switzerland Ranking 1
Investment & Development 5 Appeal 1 Readiness 1
Apprenticeships 1 Quality of Life 2 Education system 1
Employee Training 3 Remuneration – manag. 1 University education 1
Health Infrastructure 1 Remuneration – serv. 1 Management education 1
Total public exp. on edu. 27 Cost-of-living 60 Language skills 3
Pupil-teacher ratio – prim. 26
Pupil-teacher ratio - sec. 20
v
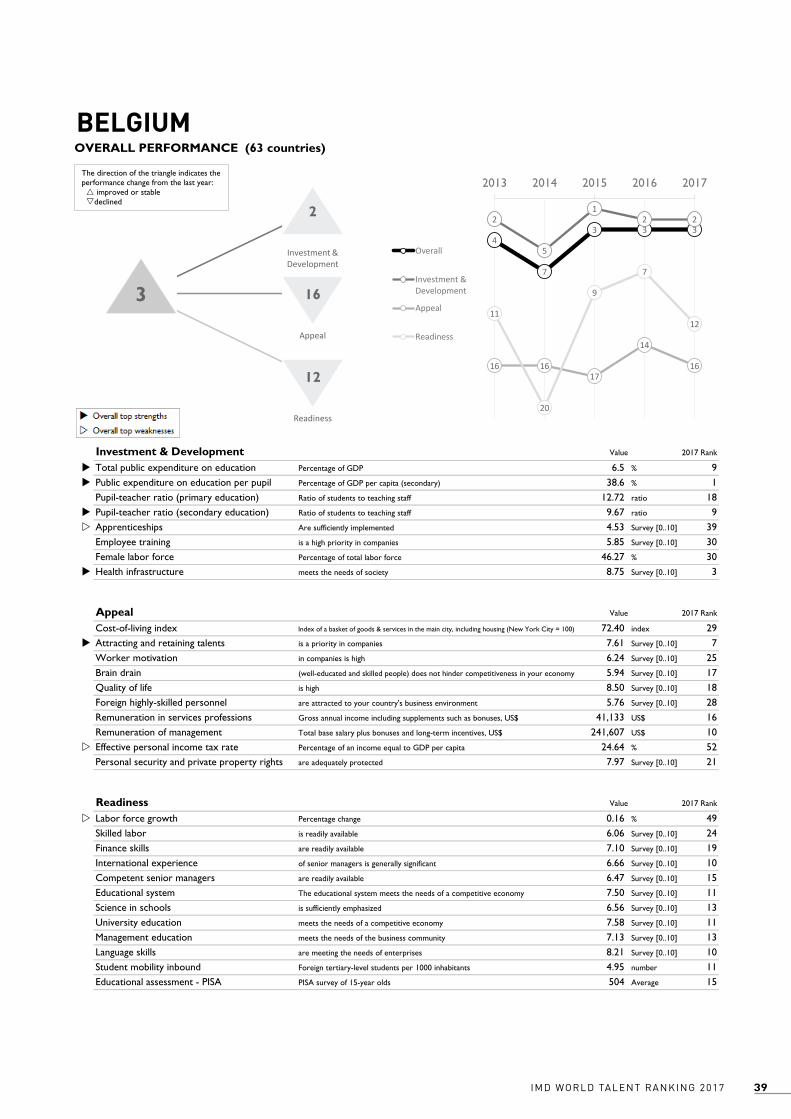
Belgium is placed in 3rd in the overall talent ranking. In the Investment & Development factor Belgium ranks 2nd mainly as a result of its expenditure in education (9th in total as percentage of GDP and 1st per pupil as percentage of GDP) and the effectiveness of its health infrastructure (3rd). The country’s rank (16th) in Appeal is rather low. Although attracting and retaining talent remains a priority (7th) and the remuneration levels are fairly high (10th), the cost-of-living (29th) and personal income tax (52nd) detract from
attracting overseas highly-skilled personnel (28th). In regard to Readiness, Belgium (12th) focuses on strengthening its educational system and its curricula at different levels (e.g., university and emphasizes the teaching of science) in order to meet the demand for talent. Although it ranks 11th in the educational system indicator and offers senior executive staff with significant international experience (10th), the availability of skilled labor force is comparatively low (24th).
Denmark Ranking 2
Investment & Development 1 Appeal 10 Readiness 4
Apprenticeships 4 Worker motivation 2 Language skills 2
Employee Training 2 Personal security 2 Management education 5
Total public exp. on edu. 5 Remuneration – serv. 3 Finance skills 7
Pupil-teacher ratio – prim. 13 Attracting talent 3
Pupil-teacher ratio - sec. 25 Foreign highly skilled pers. 25
Table 1: Summary of Switzerland’s performance
Table 2: Summary of Denmark’s performance
IMD WORLD TALENT RANKING 201716
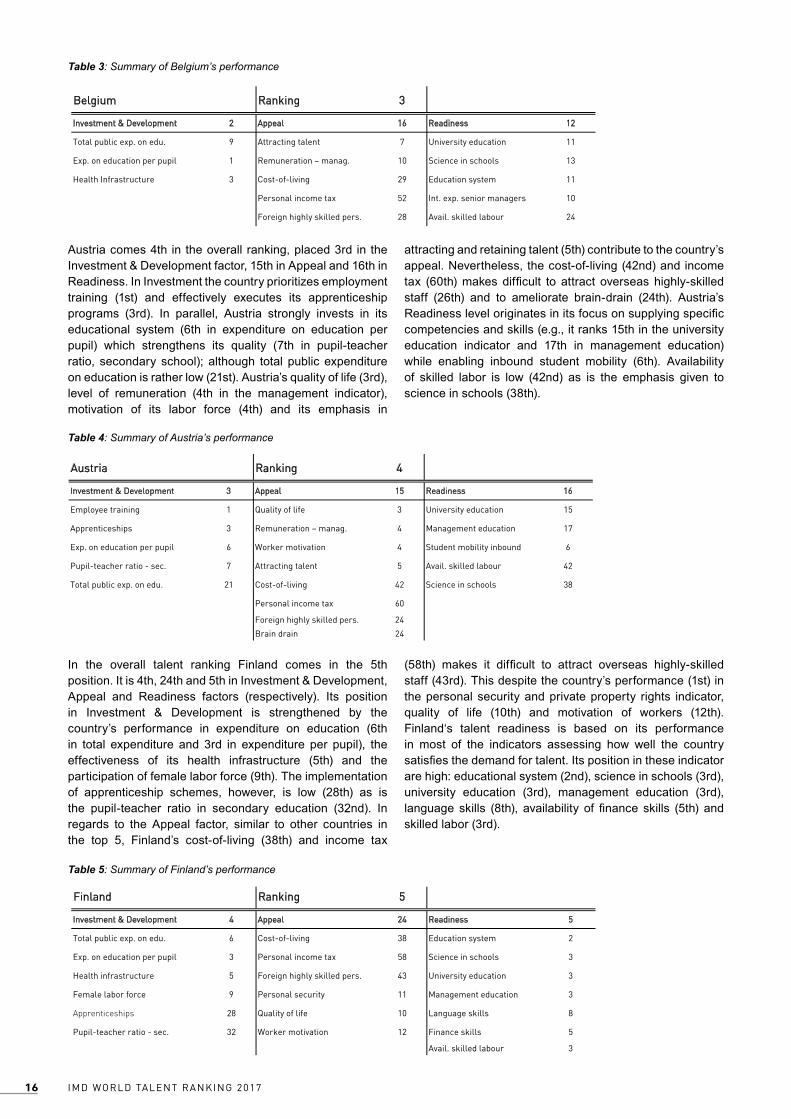
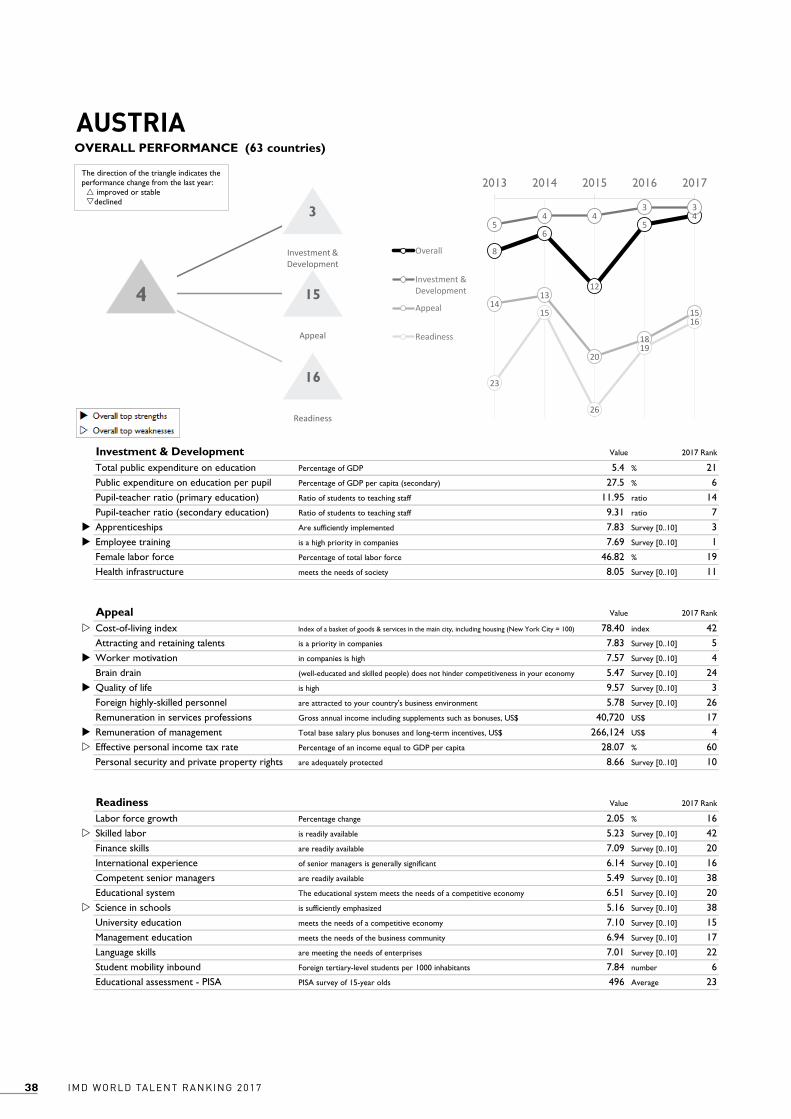
Austria comes 4th in the overall ranking, placed 3rd in the Investment & Development factor, 15th in Appeal and 16th in Readiness. In Investment the country prioritizes employment training (1st) and effectively executes its apprenticeship programs (3rd). In parallel, Austria strongly invests in its educational system (6th in expenditure on education per pupil) which strengthens its quality (7th in pupil-teacher ratio, secondary school); although total public expenditure on education is rather low (21st). Austria’s quality of life (3rd), level of remuneration (4th in the management indicator), motivation of its labor force (4th) and its emphasis in
attracting and retaining talent (5th) contribute to the country’s appeal. Nevertheless, the cost-of-living (42nd) and income tax (60th) makes difficult to attract overseas highly-skilled staff (26th) and to ameliorate brain-drain (24th). Austria’s Readiness level originates in its focus on supplying specific competencies and skills (e.g., it ranks 15th in the university education indicator and 17th in management education) while enabling inbound student mobility (6th). Availability of skilled labor is low (42nd) as is the emphasis given to science in schools (38th).
Belgium Ranking 3
Investment & Development 2 Appeal 16 Readiness 12
Total public exp. on edu. 9 Attracting talent 7 University education 11
Exp. on education per pupil 1 Remuneration – manag. 10 Science in schools 13
Health Infrastructure 3 Cost-of-living 29 Education system 11
Personal income tax 52 Int. exp. senior managers 10
Foreign highly skilled pers. 28 Avail. skilled labour 24
Austria Ranking 4
Investment & Development 3 Appeal 15 Readiness 16
Employee training 1 Quality of life 3 University education 15
Apprenticeships 3 Remuneration – manag. 4 Management education 17
Exp. on education per pupil 6 Worker motivation 4 Student mobility inbound 6
Pupil-teacher ratio - sec. 7 Attracting talent 5 Avail. skilled labour 42
Total public exp. on edu. 21 Cost-of-living 42 Science in schools 38
Personal income tax 60
Foreign highly skilled pers. 24
Brain drain 24
In the overall talent ranking Finland comes in the 5th position. It is 4th, 24th and 5th in Investment & Development, Appeal and Readiness factors (respectively). Its position in Investment & Development is strengthened by the country’s performance in expenditure on education (6th in total expenditure and 3rd in expenditure per pupil), the effectiveness of its health infrastructure (5th) and the participation of female labor force (9th). The implementation of apprenticeship schemes, however, is low (28th) as is the pupil-teacher ratio in secondary education (32nd). In regards to the Appeal factor, similar to other countries in the top 5, Finland’s cost-of-living (38th) and income tax
(58th) makes it difficult to attract overseas highly-skilled staff (43rd). This despite the country’s performance (1st) in the personal security and private property rights indicator, quality of life (10th) and motivation of workers (12th). Finland‘s talent readiness is based on its performance in most of the indicators assessing how well the country satisfies the demand for talent. Its position in these indicator are high: educational system (2nd), science in schools (3rd), university education (3rd), management education (3rd), language skills (8th), availability of finance skills (5th) and skilled labor (3rd).
Finland Ranking 5
Investment & Development 4 Appeal 24 Readiness 5
Total public exp. on edu. 6 Cost-of-living 38 Education system 2
Exp. on education per pupil 3 Personal income tax 58 Science in schools 3
Health infrastructure 5 Foreign highly skilled pers. 43 University education 3
Female labor force 9 Personal security 11 Management education 3
Apprenticeships 28 Quality of life 10 Language skills 8
Pupil-teacher ratio - sec. 32 Worker motivation 12 Finance skills 5
Avail. skilled labour 3
Table 3: Summary of Belgium’s performance
Table 4: Summary of Austria’s performance
Table 5: Summary of Finland’s performance
17IMD WORLD TALENT RANKING 2017
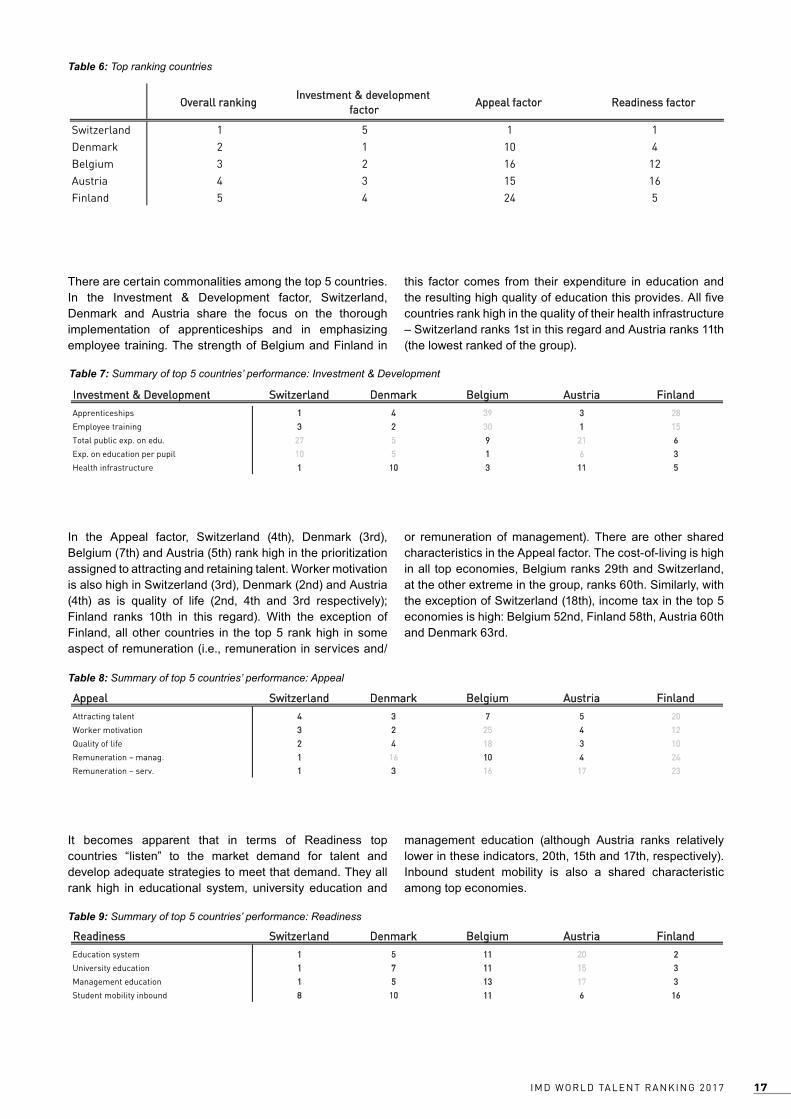
There are certain commonalities among the top 5 countries. In the Investment & Development factor, Switzerland, Denmark and Austria share the focus on the thorough implementation of apprenticeships and in emphasizing employee training. The strength of Belgium and Finland in
this factor comes from their expenditure in education and the resulting high quality of education this provides. All five countries rank high in the quality of their health infrastructure – Switzerland ranks 1st in this regard and Austria ranks 11th (the lowest ranked of the group).
Overall rankingInvestment & development
factorAppeal factor Readiness factor
Switzerland 1 5 1 1Denmark 2 1 10 4Belgium 3 2 16 12Austria 4 3 15 16Finland 5 4 24 5
Table 6: Top ranking countries
Investment & Development Switzerland Denmark Belgium Austria Finland
Apprenticeships 1 4 39 3 28
Employee training 3 2 30 1 15
Total public exp. on edu. 27 5 9 21 6
Exp. on education per pupil 10 5 1 6 3
Health infrastructure 1 10 3 11 5
Appeal Switzerland Denmark Belgium Austria Finland
Attracting talent 4 3 7 5 20
Worker motivation 3 2 25 4 12
Quality of life 2 4 18 3 10
Remuneration – manag. 1 16 10 4 24
Remuneration – serv. 1 3 16 17 23
Readiness Switzerland Denmark Belgium Austria Finland
Education system 1 5 11 20 2
University education 1 7 11 15 3
Management education 1 5 13 17 3
Student mobility inbound 8 10 11 6 16
In the Appeal factor, Switzerland (4th), Denmark (3rd), Belgium (7th) and Austria (5th) rank high in the prioritization assigned to attracting and retaining talent. Worker motivation is also high in Switzerland (3rd), Denmark (2nd) and Austria (4th) as is quality of life (2nd, 4th and 3rd respectively); Finland ranks 10th in this regard). With the exception of Finland, all other countries in the top 5 rank high in some aspect of remuneration (i.e., remuneration in services and/
or remuneration of management). There are other shared characteristics in the Appeal factor. The cost-of-living is high in all top economies, Belgium ranks 29th and Switzerland, at the other extreme in the group, ranks 60th. Similarly, with the exception of Switzerland (18th), income tax in the top 5 economies is high: Belgium 52nd, Finland 58th, Austria 60th and Denmark 63rd.
It becomes apparent that in terms of Readiness top countries “listen” to the market demand for talent and develop adequate strategies to meet that demand. They all rank high in educational system, university education and
management education (although Austria ranks relatively lower in these indicators, 20th, 15th and 17th, respectively). Inbound student mobility is also a shared characteristic among top economies.
Table 7: Summary of top 5 countries’ performance: Investment & Development
Table 8: Summary of top 5 countries’ performance: Appeal
Table 9: Summary of top 5 countries’ performance: Readiness
IMD WORLD TALENT RANKING 201718
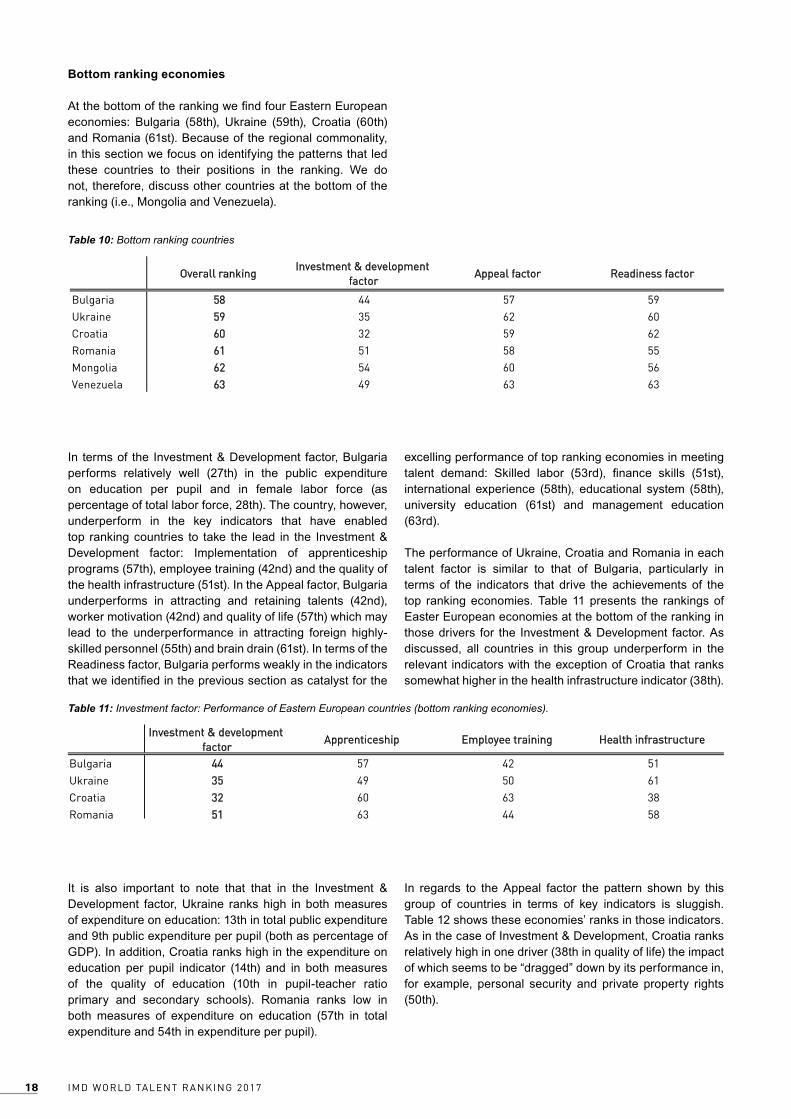
Bottom ranking economies
At the bottom of the ranking we find four Eastern European economies: Bulgaria (58th), Ukraine (59th), Croatia (60th) and Romania (61st). Because of the regional commonality, in this section we focus on identifying the patterns that led these countries to their positions in the ranking. We do not, therefore, discuss other countries at the bottom of the ranking (i.e., Mongolia and Venezuela).
Overall rankingInvestment & development
factorAppeal factor Readiness factor
Bulgaria 58 44 57 59Ukraine 59 35 62 60Croatia 60 32 59 62Romania 61 51 58 55Mongolia 62 54 60 56Venezuela 63 49 63 63
Table 10: Bottom ranking countries
In terms of the Investment & Development factor, Bulgaria performs relatively well (27th) in the public expenditure on education per pupil and in female labor force (as percentage of total labor force, 28th). The country, however, underperform in the key indicators that have enabled top ranking countries to take the lead in the Investment & Development factor: Implementation of apprenticeship programs (57th), employee training (42nd) and the quality of the health infrastructure (51st). In the Appeal factor, Bulgaria underperforms in attracting and retaining talents (42nd), worker motivation (42nd) and quality of life (57th) which may lead to the underperformance in attracting foreign highly-skilled personnel (55th) and brain drain (61st). In terms of the Readiness factor, Bulgaria performs weakly in the indicators that we identified in the previous section as catalyst for the
excelling performance of top ranking economies in meeting talent demand: Skilled labor (53rd), finance skills (51st), international experience (58th), educational system (58th), university education (61st) and management education (63rd).
The performance of Ukraine, Croatia and Romania in each talent factor is similar to that of Bulgaria, particularly in terms of the indicators that drive the achievements of the top ranking economies. Table 11 presents the rankings of Easter European economies at the bottom of the ranking in those drivers for the Investment & Development factor. As discussed, all countries in this group underperform in the relevant indicators with the exception of Croatia that ranks somewhat higher in the health infrastructure indicator (38th).
Investment & development factor
Apprenticeship Employee training Health infrastructure
Bulgaria 44 152475Ukraine 35 160594Croatia 32 833606Romania 51 854436
Table 11: Investment factor: Performance of Eastern European countries (bottom ranking economies).
It is also important to note that that in the Investment & Development factor, Ukraine ranks high in both measures of expenditure on education: 13th in total public expenditure and 9th public expenditure per pupil (both as percentage of GDP). In addition, Croatia ranks high in the expenditure on education per pupil indicator (14th) and in both measures of the quality of education (10th in pupil-teacher ratio primary and secondary schools). Romania ranks low in both measures of expenditure on education (57th in total expenditure and 54th in expenditure per pupil).
In regards to the Appeal factor the pattern shown by this group of countries in terms of key indicators is sluggish. Table 12 shows these economies’ ranks in those indicators. As in the case of Investment & Development, Croatia ranks relatively high in one driver (38th in quality of life) the impact of which seems to be “dragged” down by its performance in, for example, personal security and private property rights (50th).
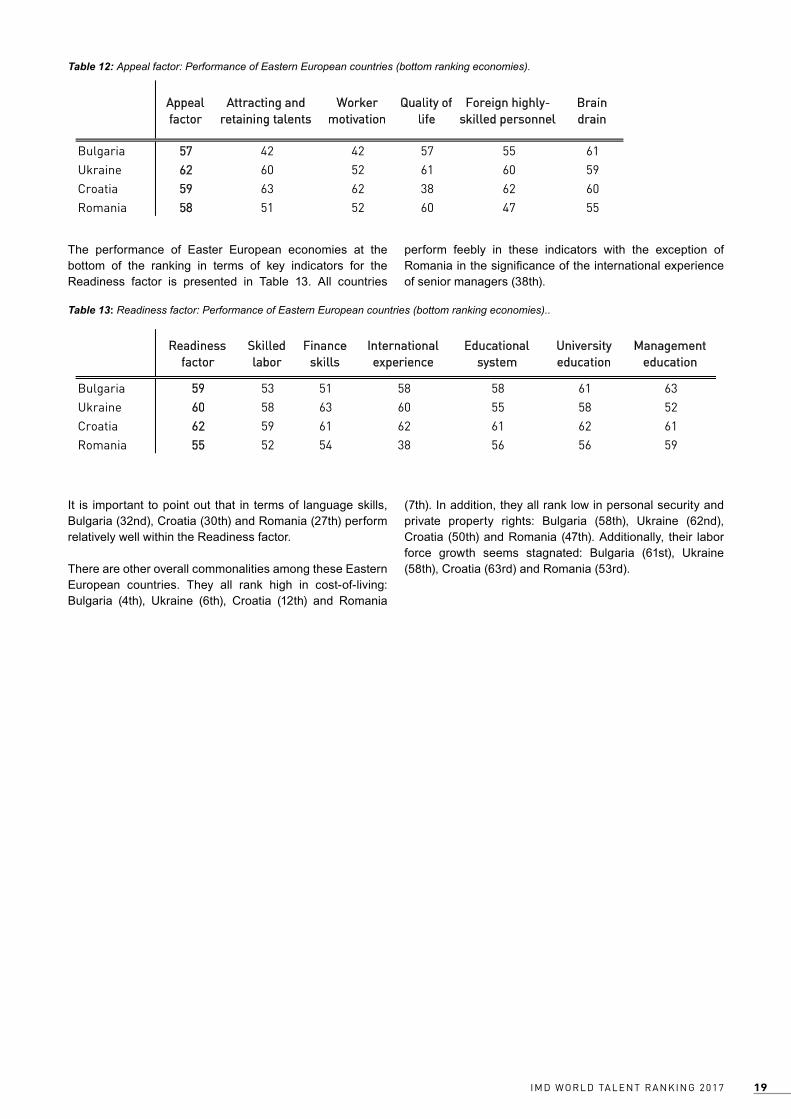
19IMD WORLD TALENT RANKING 2017
Appeal factor
Attracting and retaining talents
Worker motivation
Quality of life
Foreign highly-skilled personnel
Brain drain
Bulgaria 57 42 42 57 55 61Ukraine 62 60 52 61 60 59Croatia 59 63 62 38 62 60Romania 58 51 52 60 47 55
Readiness factor
Skilled labor
Finance skills
International experience
Educational system
University education
Management education
Bulgaria 59 53 51 58 58 61 63Ukraine 60 58 63 60 55 58 52Croatia 62 59 61 62 61 62 61Romania 55 52 54 38 56 56 59
Table 12: Appeal factor: Performance of Eastern European countries (bottom ranking economies).
The performance of Easter European economies at the bottom of the ranking in terms of key indicators for the Readiness factor is presented in Table 13. All countries
perform feebly in these indicators with the exception of Romania in the significance of the international experience of senior managers (38th).
Table 13: Readiness factor: Performance of Eastern European countries (bottom ranking economies)..
It is important to point out that in terms of language skills, Bulgaria (32nd), Croatia (30th) and Romania (27th) perform relatively well within the Readiness factor.
There are other overall commonalities among these Eastern European countries. They all rank high in cost-of-living: Bulgaria (4th), Ukraine (6th), Croatia (12th) and Romania
(7th). In addition, they all rank low in personal security and private property rights: Bulgaria (58th), Ukraine (62nd), Croatia (50th) and Romania (47th). Additionally, their labor force growth seems stagnated: Bulgaria (61st), Ukraine (58th), Croatia (63rd) and Romania (53rd).
IMD WORLD TALENT RANKING 201720
Appendix
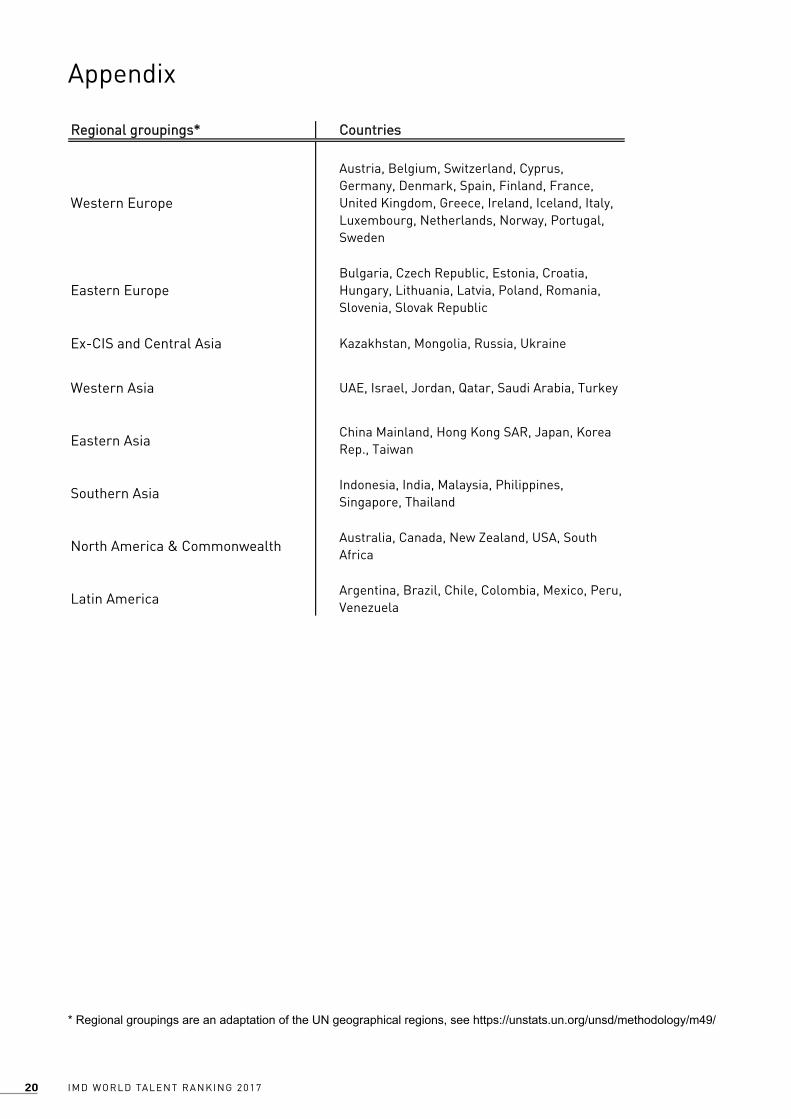
Regional groupings* Countries
Western Europe
Austria, Belgium, Switzerland, Cyprus, Germany, Denmark, Spain, Finland, France, United Kingdom, Greece, Ireland, Iceland, Italy, Luxembourg, Netherlands, Norway, Portugal, Sweden
Eastern EuropeBulgaria, Czech Republic, Estonia, Croatia, Hungary, Lithuania, Latvia, Poland, Romania, Slovenia, Slovak Republic
Ex-CIS and Central Asia Kazakhstan, Mongolia, Russia, Ukraine
Western Asia UAE, Israel, Jordan, Qatar, Saudi Arabia, Turkey
Eastern AsiaChina Mainland, Hong Kong SAR, Japan, Korea Rep., Taiwan
Southern AsiaIndonesia, India, Malaysia, Philippines, Singapore, Thailand
North America & CommonwealthAustralia, Canada, New Zealand, USA, South Africa
Latin AmericaArgentina, Brazil, Chile, Colombia, Mexico, Peru, Venezuela
* Regional groupings are an adaptation of the UN geographical regions, see https://unstats.un.org/unsd/methodology/m49/

21IMD WORLD TALENT RANKING 2017
The IMD Talent Ranking results (score (0-100)) in 2017: South-East Asia and Europe

IMD WORLD TALENT RANKING 201722

23IMD WORLD TALENT RANKING 2017
WORLD TALENT RANKINGS 2017
All data are available from theWorld Competitiveness Online.
Visit our eShopwww.wcceshop.org
IMD WORLD TALENT RANKING 201724
The 2017 IMD Wor ld
Overall
Rank Country1 yr +/-
1 Switzerland -
2 Denmark -
3 Belgium -
4 Austria +1
5 Finland +1
6 Netherlands +2
7 Norway -
8 Germany +2
9 Sweden -5
10 Luxembourg +1
11 Canada +1
12 Hong Kong SAR -3
13 Singapore +2
14 Ireland +3
15 New Zealand -1
16 USA -3
17 Cyprus -
18 Iceland -
19 Australia -3
20 Israel -1
21 United Kingdom -1
22 Qatar -
23 Taiwan -
24 Portugal +1
25 UAE +2
26 Saudi Arabia -
27 France +1
28 Malaysia -7
29 Estonia -3
30 Kazakhstan +14
31 Japan -
100.00
89.36
83.80
83.63
83.18
82.86
82.41
79.87
79.04
78.46
77.99
77.90
75.63
75.46
75.40
74.52
74.47
74.07
71.09
69.58
68.85
68.60
68.47
67.89
67.09
66.60
65.76
65.55
63.74
61.60
61.45
25IMD WORLD TALENT RANKING 2017
30 Kazakhstan +14
31 Japan -
32 Spain +2
33 Lithuania -9
34 Poland -5
35 Latvia -5
36 Italy -4
37 Slovenia -1
38 Czech Republic -5
39 Korea Rep. -1
40 China Mainland +2
41 Greece -6
42 Thailand -5
43 Russia -2
44 Chile +4
45 Philippines +10
46 Slovak Republic -7
47 Indonesia -
48 South Africa -5
49 Jordan -9
50 Argentina +2
51 India +3
52 Brazil -7
53 Turkey -7
54 Hungary -3
55 Colombia +2
56 Mexico -6
57 Peru +2
58 Bulgaria -
59 Ukraine -10
60 Croatia -7
61 Romania -5
62 Mongolia -2
63 Venezuela -2
61.60
61.45
60.70
60.03
59.73
59.20
58.38
56.89
56.04
55.82
53.00
52.33
52.23
50.87
50.37
48.74
48.58
47.28
44.50
44.27
43.49
42.20
42.00
41.40
40.78
40.09
39.40
39.09
38.98
38.74
37.84
36.14
33.59
24.19
Overall
Rank Country1 yr +/-
Talent Rank ing
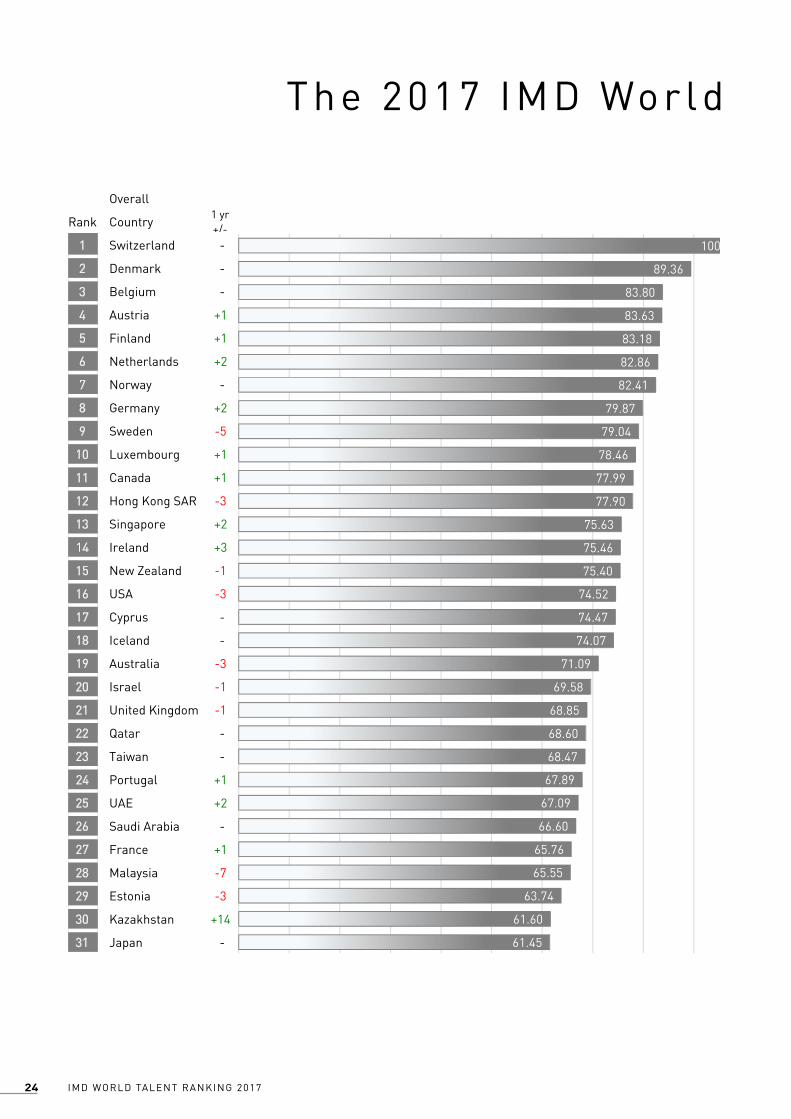
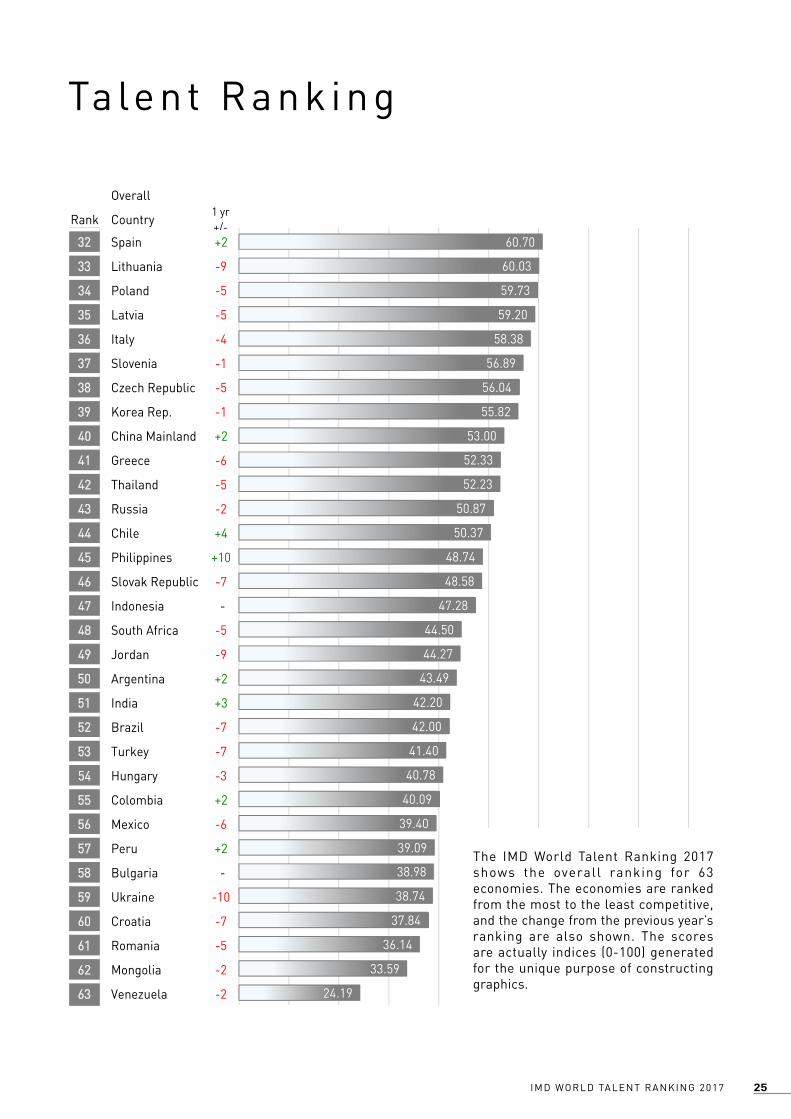
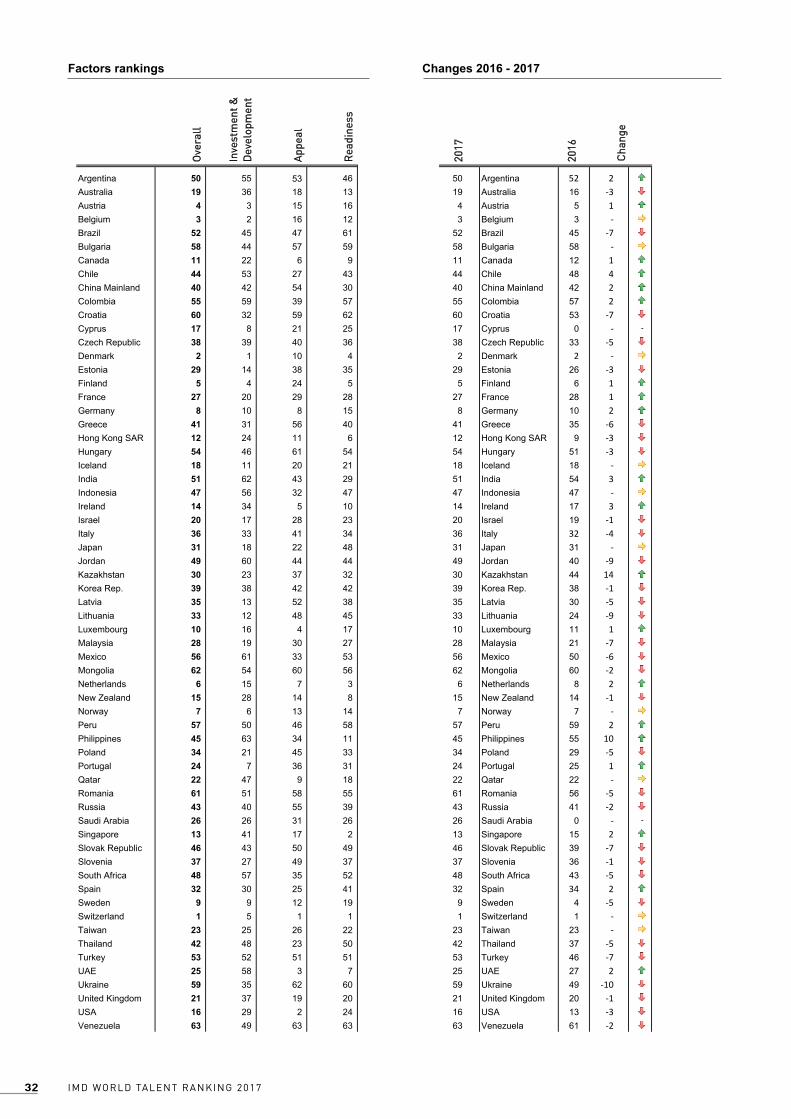
The IMD World Talent Ranking 2017 shows the overall ranking for 63 economies. The economies are ranked from the most to the least competitive, and the change from the previous year’s ranking are also shown. The scores are actually indices (0-100) generated for the unique purpose of constructing graphics.
IMD WORLD TALENT RANKING 201726
Methodology in a Nutshe l l
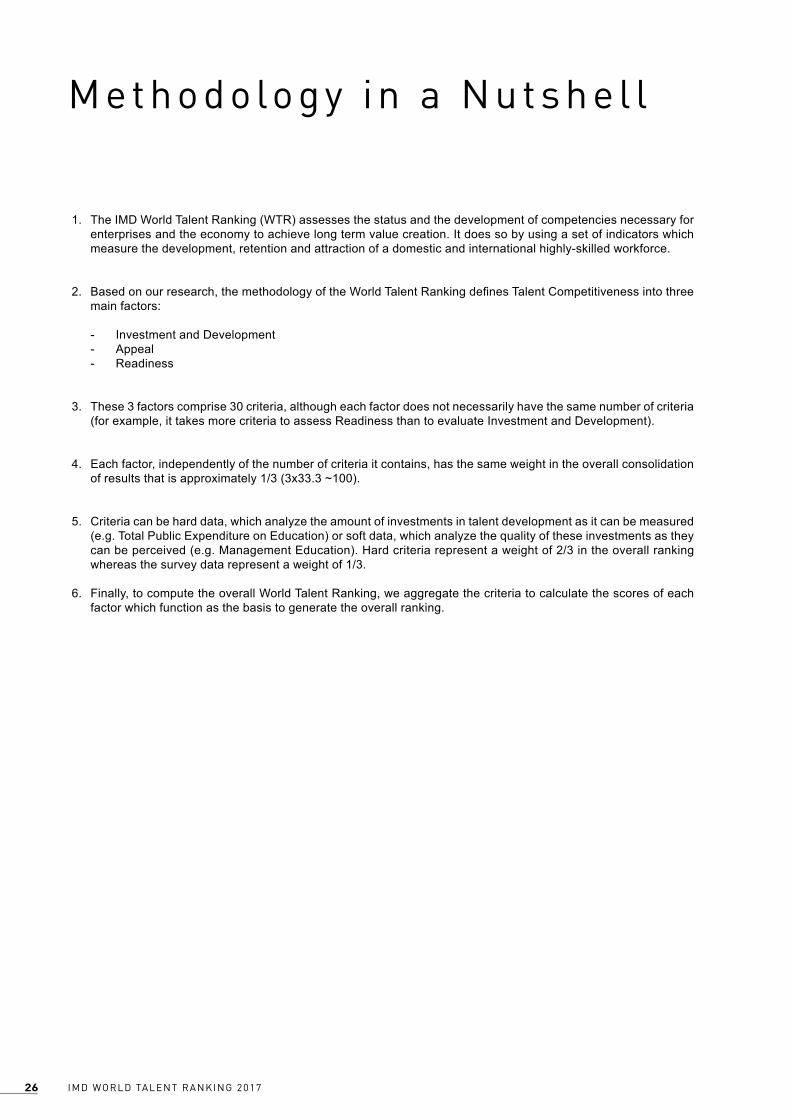
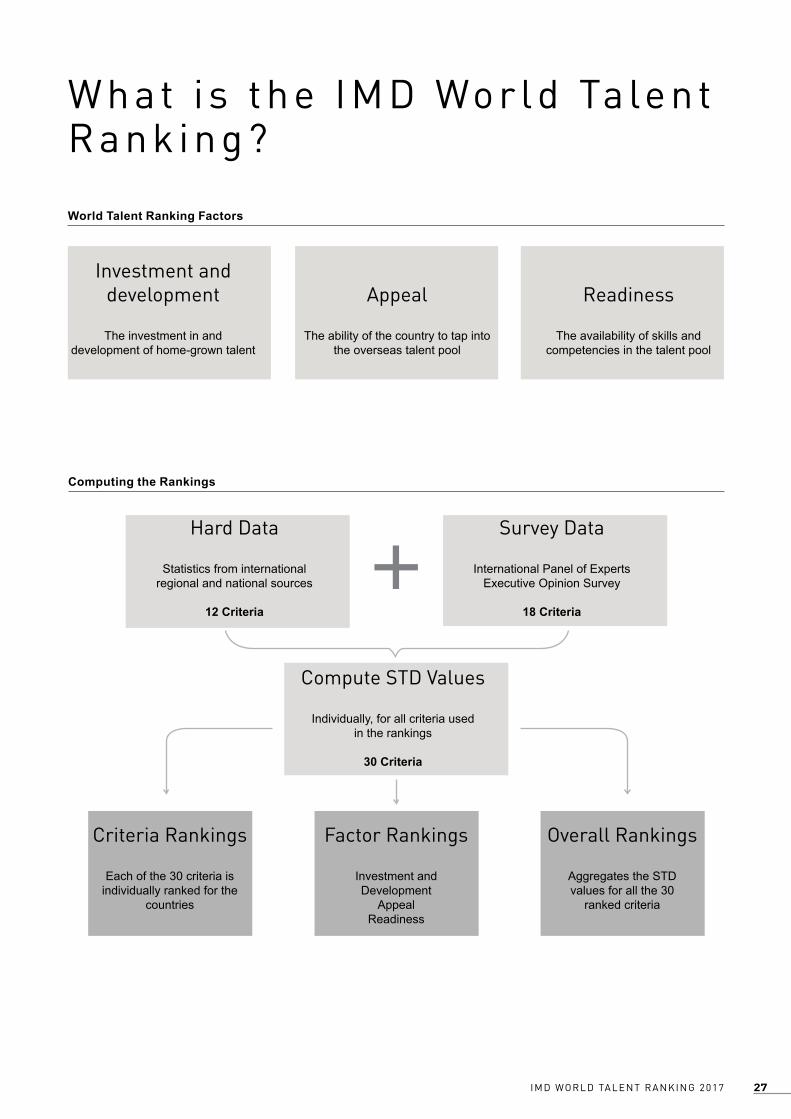
1. The IMD World Talent Ranking (WTR) assesses the status and the development of competencies necessary for enterprises and the economy to achieve long term value creation. It does so by using a set of indicators which measure the development, retention and attraction of a domestic and international highly-skilled workforce.
2. Basedonourresearch,themethodologyoftheWorldTalentRankingdefinesTalentCompetitivenessintothreemain factors:
- Investment and Development - Appeal - Readiness
3. These 3 factors comprise 30 criteria, although each factor does not necessarily have the same number of criteria (for example, it takes more criteria to assess Readiness than to evaluate Investment and Development).
4. Each factor, independently of the number of criteria it contains, has the same weight in the overall consolidation of results that is approximately 1/3 (3x33.3 ~100).
5. Criteriacanbeharddata,whichanalyzetheamountofinvestmentsintalentdevelopmentasitcanbemeasured(e.g.TotalPublicExpenditureonEducation)orsoftdata,whichanalyzethequalityoftheseinvestmentsastheycan be perceived (e.g. Management Education). Hard criteria represent a weight of 2/3 in the overall ranking whereas the survey data represent a weight of 1/3.
6. Finally, to compute the overall World Talent Ranking, we aggregate the criteria to calculate the scores of each factor which function as the basis to generate the overall ranking.
27IMD WORLD TALENT RANKING 2017
What i s the IMD Wor ld Ta lent Rank ing?
World Talent Ranking Factors
Computing the Rankings
Investment and development
The investment in and
development of home-grown talent
Appeal
The ability of the country to tap into
the overseas talent pool
Readiness
The availability of skills and competencies in the talent pool
Hard Data
Statistics from internationalregional and national sources
12 Criteria
Survey Data
International Panel of Experts Executive Opinion Survey
18 Criteria
Compute STD Values
Individually, for all criteria usedin the rankings
30 Criteria
Criteria Rankings
Each of the 30 criteria is individually ranked for the
countries
Factor Rankings
Investment and Development
Appeal Readiness
Overall Rankings
Aggregates the STD values for all the 30
ranked criteria
IMD WORLD TALENT RANKING 201728
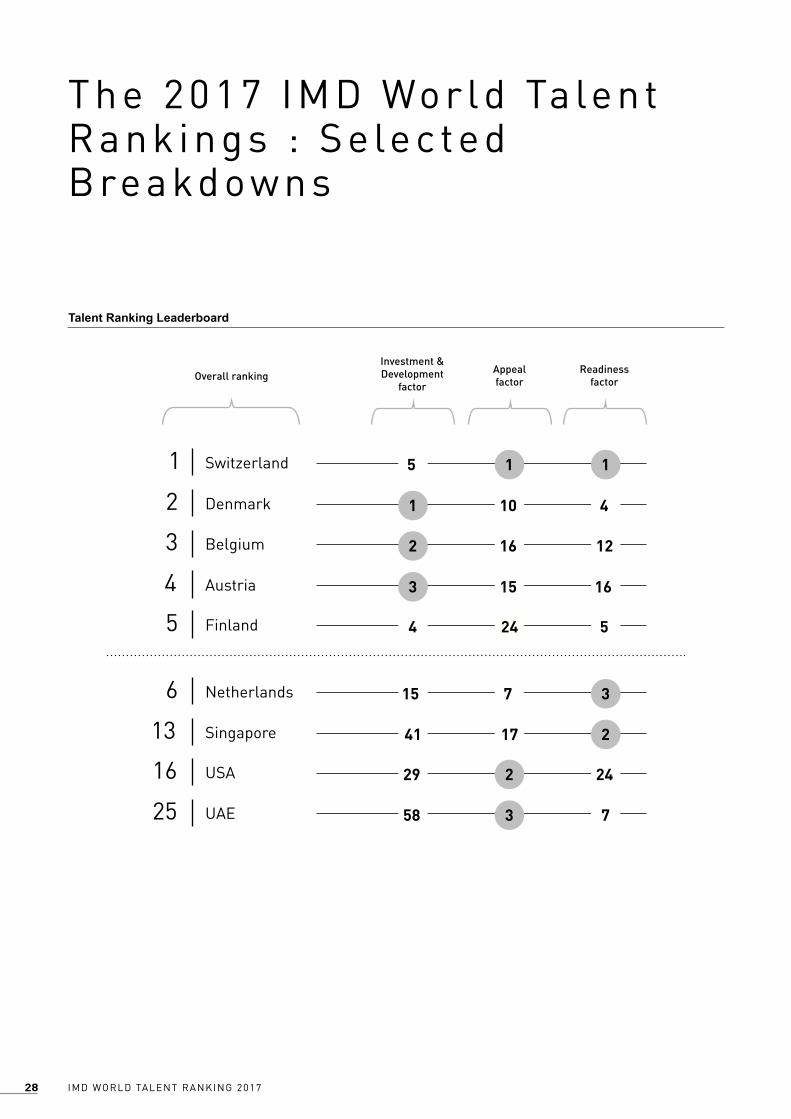
The 2017 IMD Wor ld Ta lent Rank ings : Se lec ted Brea kdowns
Talent Ranking Leaderboard
Switzerland1 5 1 1
Denmark2 1 10 4
Belgium3 2 16 12
Austria4 3 15 16
Finland5 4 24 5
Netherlands6 15 7 3
Singapore13 41 17 2
USA16 29 2 24
UAE25 58 3 7
Investment & Development
factor
Appeal factor
Readiness factorOverall ranking

29IMD WORLD TALENT RANKING 2017
Factor 1 : Investment and development
Investment
Rank Country1 yr +/-
1 Denmark -
2 Belgium -
3 Austria -
4 Finland -
5 Switzerland -
6 Norway -
7 Portugal +1
8 Cyprus -
9 Sweden -2
10 Germany +1
11 Iceland +1
12 Lithuania -2
13 Latvia -4
14 Estonia -1
15 Netherlands -1
16 Luxembourg -1
17 Israel +2
18 Japan +2
19 Malaysia -2
20 France +4
21 Poland -3
22 Canada -
23 Kazakhstan +11
24 Hong Kong SAR +3
25 Taiwan +3
26 Saudi Arabia -
27 Slovenia -6
28 New Zealand -3
29 USA -3
30 Spain +1
31 Greece -8
32 Croatia +6
33 Italy -1
34 Ireland -4
35 Ukraine -19
36 Australia -7
37 United Kingdom -1
38 Korea Rep. -5
39 Czech Republic -4
40 Russia +2
41 Singapore -1
42 China Mainland +3
43 Slovak Republic -6
44 Bulgaria -
45 Brazil -6
46 Hungary -5
47 Qatar +1
48 Thailand -5
49 Venezuela -3
50 Peru +4
51 Romania -4
52 Turkey -
53 Chile +6
54 Mongolia -5
55 Argentina -4
56 Indonesia -1
57 South Africa -7
58 UAE -5
59 Colombia -2
60 Jordan -4
61 Mexico -3
62 India -2
63 Philippines -2
91.16
89.36
88.83
86.86
84.02
81.71
76.77
76.27
76.24
73.80
71.89
71.43
70.51
69.48
68.89
67.17
64.82
62.25
61.78
61.55
61.25
60.67
60.45
60.44
60.42
59.98
59.77
56.89
56.45
55.95
55.28
55.21
54.68
54.29
54.12
53.54
53.52
52.96
50.18
49.31
48.73
46.46
45.17
44.81
44.70
44.15
41.69
37.18
34.52
28.97
27.55
27.22
26.82
26.70
26.58
25.26
24.45
24.08
23.47
21.82
11.55
2.47
0.00
IMD WORLD TALENT RANKING 201730
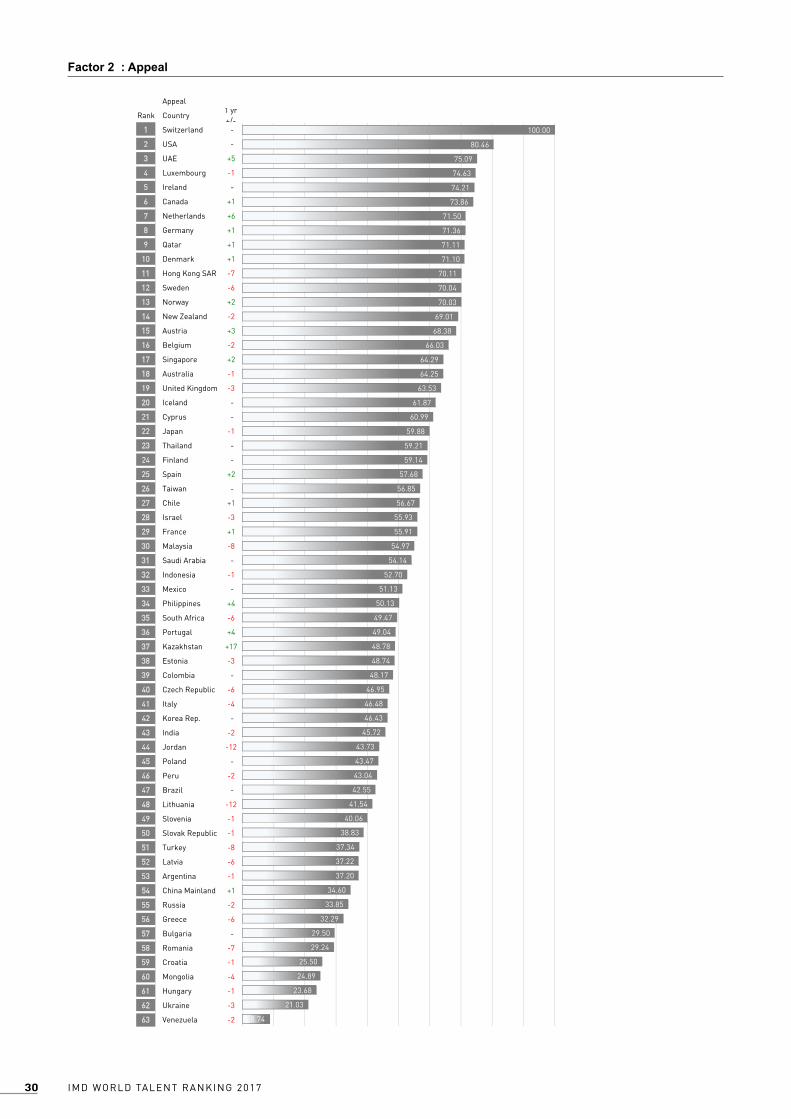
Factor 2 : Appeal
Appeal
Rank Country1 yr +/-
1 Switzerland -
2 USA -
3 UAE +5
4 Luxembourg -1
5 Ireland -
6 Canada +1
7 Netherlands +6
8 Germany +1
9 Qatar +1
10 Denmark +1
11 Hong Kong SAR -7
12 Sweden -6
13 Norway +2
14 New Zealand -2
15 Austria +3
16 Belgium -2
17 Singapore +2
18 Australia -1
19 United Kingdom -3
20 Iceland -
21 Cyprus -
22 Japan -1
23 Thailand -
24 Finland -
25 Spain +2
26 Taiwan -
27 Chile +1
28 Israel -3
29 France +1
30 Malaysia -8
31 Saudi Arabia -
32 Indonesia -1
33 Mexico -
34 Philippines +4
35 South Africa -6
36 Portugal +4
37 Kazakhstan +17
38 Estonia -3
39 Colombia -
40 Czech Republic -6
41 Italy -4
42 Korea Rep. -
43 India -2
44 Jordan -12
45 Poland -
46 Peru -2
47 Brazil -
48 Lithuania -12
49 Slovenia -1
50 Slovak Republic -1
51 Turkey -8
52 Latvia -6
53 Argentina -1
54 China Mainland +1
55 Russia -2
56 Greece -6
57 Bulgaria -
58 Romania -7
59 Croatia -1
60 Mongolia -4
61 Hungary -1
62 Ukraine -3
63 Venezuela -2
100.00
80.46
75.09
74.63
74.21
73.86
71.50
71.36
71.11
71.10
70.11
70.04
70.03
69.01
68.38
66.03
64.29
64.25
63.53
61.87
60.99
59.88
59.21
59.14
57.68
56.85
56.67
55.93
55.91
54.97
54.14
52.70
51.13
50.13
49.47
49.04
48.78
48.74
48.17
46.95
46.48
46.43
45.72
43.73
43.47
43.04
42.55
41.54
40.06
38.83
37.34
37.22
37.20
34.60
33.85
32.29
29.50
29.24
25.50
24.89
23.68
21.03
8.74
31IMD WORLD TALENT RANKING 2017
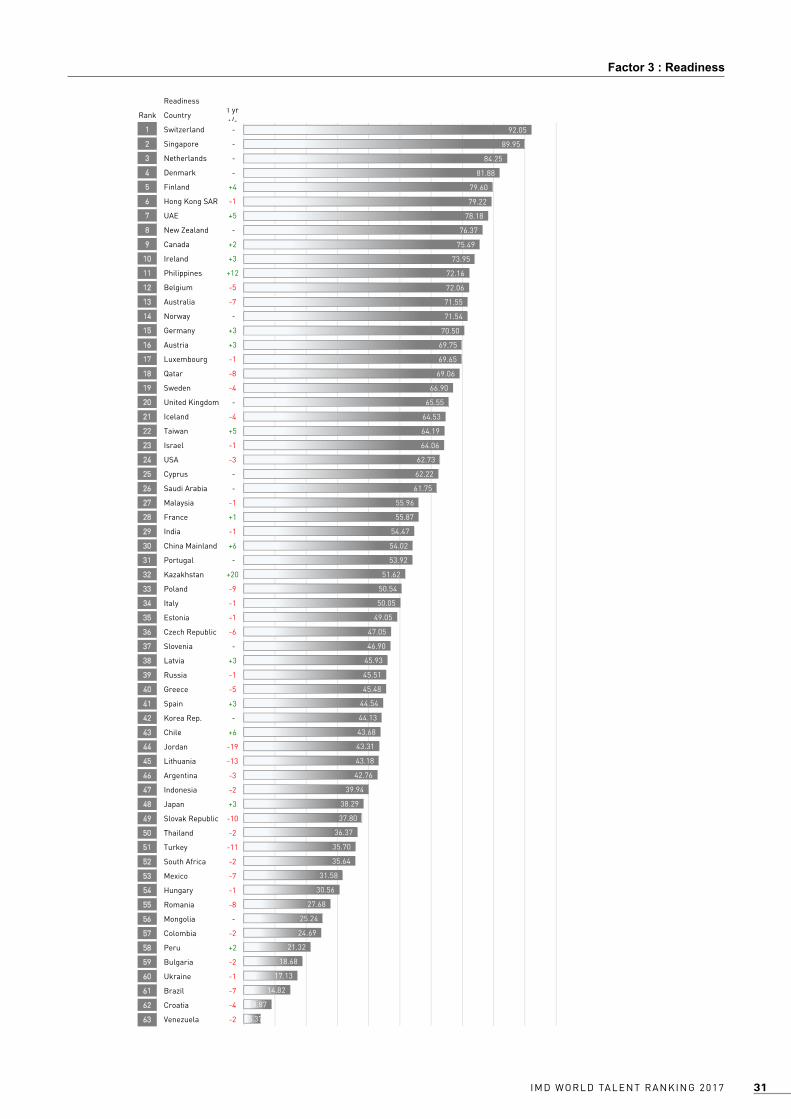
Factor 3 : Readiness
Readiness
Rank Country1 yr +/-
1 Switzerland -
2 Singapore -
3 Netherlands -
4 Denmark -
5 Finland +4
6 Hong Kong SAR -1
7 UAE +5
8 New Zealand -
9 Canada +2
10 Ireland +3
11 Philippines +12
12 Belgium -5
13 Australia -7
14 Norway -
15 Germany +3
16 Austria +3
17 Luxembourg -1
18 Qatar -8
19 Sweden -4
20 United Kingdom -
21 Iceland -4
22 Taiwan +5
23 Israel -1
24 USA -3
25 Cyprus -
26 Saudi Arabia -
27 Malaysia -1
28 France +1
29 India -1
30 China Mainland +6
31 Portugal -
32 Kazakhstan +20
33 Poland -9
34 Italy -1
35 Estonia -1
36 Czech Republic -6
37 Slovenia -
38 Latvia +3
39 Russia -1
40 Greece -5
41 Spain +3
42 Korea Rep. -
43 Chile +6
44 Jordan -19
45 Lithuania -13
46 Argentina -3
47 Indonesia -2
48 Japan +3
49 Slovak Republic -10
50 Thailand -2
51 Turkey -11
52 South Africa -2
53 Mexico -7
54 Hungary -1
55 Romania -8
56 Mongolia -
57 Colombia -2
58 Peru +2
59 Bulgaria -2
60 Ukraine -1
61 Brazil -7
62 Croatia -4
63 Venezuela -2
92.05
89.95
84.25
81.88
79.60
79.22
78.18
76.37
75.49
73.95
72.16
72.06
71.55
71.54
70.50
69.75
69.65
69.06
66.90
65.55
64.53
64.19
64.06
62.73
62.22
61.75
55.96
55.87
54.47
54.02
53.92
51.62
50.54
50.05
49.05
47.05
46.90
45.93
45.51
45.48
44.54
44.13
43.68
43.31
43.18
42.76
39.94
38.29
37.80
36.37
35.70
35.64
31.58
30.56
27.68
25.24
24.69
21.32
18.68
17.13
14.82
8.87
5.37
IMD WORLD TALENT RANKING 201732
Factors rankings Changes 2016 - 2017
Ove
ral l
Inve
stm
ent &
D
evel
opm
ent
App
eal
Rea
dine
ss
2 017
201 6
Argentina 50 55 53 46 05 Argentina 52 2Australia 19 36 18 13 91 Australia 16 -3Austria 4 3 15 16 4 Austria 5 1Belgium 3 2 16 12 3 Belgium 3 -Brazil 52 45 47 61 25 Brazil 45 -7 13Bulgaria 58 44 57 59 85 Bulgaria 58 - 16Canada 11 22 6 9 11 Canada 12 1 12Chile 44 53 27 43 44 Chile 48 4 61China Mainland 40 42 54 30 04 China Mainland 42 2 59Colombia 55 59 39 57 55 Colombia 57 2 9Croatia 60 32 59 62 06 Croatia 53 -7 43Cyprus 17 8 21 25 71 Cyprus 0 - - 30Czech Republic 38 39 40 36 83 Czech Republic 33 -5 57Denmark 2 1 10 4 2 Denmark 2 - 62Estonia 29 14 38 35 92 Estonia 26 -3 25Finland 5 4 24 5 5 Finland 6 1 36France 27 20 29 28 72 France 28 1Germany 8 10 8 15 8 Germany 10 2Greece 41 31 56 40 14 Greece 35 -6Hong Kong SAR 12 24 11 6 21 Hong Kong SAR 9 -3Hungary 54 46 61 54 45 Hungary 51 -3Iceland 18 11 20 21 81 Iceland 18 -India 51 62 43 29 15 India 54 3Indonesia 47 56 32 47 74 Indonesia 47 -Ireland 14 34 5 10 41 Ireland 17 3Israel 20 17 28 23 02 Israel 19 -1Italy 36 33 41 34 63 Italy 32 -4Japan 31 18 22 48 13 Japan 31 -Jordan 49 60 44 44 94 Jordan 40 -9Kazakhstan 30 23 37 32 03 Kazakhstan 44 14Korea Rep. 39 38 42 42 93 Korea Rep. 38 -1Latvia 35 13 52 38 53 Latvia 30 -5Lithuania 33 12 48 45 33 Lithuania 24 -9Luxembourg 10 16 4 17 01 Luxembourg 11 1Malaysia 28 19 30 27 82 Malaysia 21 -7Mexico 56 61 33 53 65 Mexico 50 -6Mongolia 62 54 60 56 26 Mongolia 60 -2Netherlands 6 15 7 3 6 Netherlands 8 2New Zealand 15 28 14 8 51 New Zealand 14 -1Norway 7 6 13 14 7 Norway 7 -Peru 57 50 46 58 75 Peru 59 2Philippines 45 63 34 11 54 Philippines 55 10Poland 34 21 45 33 43 Poland 29 -5Portugal 24 7 36 31 42 Portugal 25 1Qatar 22 47 9 18 22 Qatar 22 -Romania 61 51 58 55 16 Romania 56 -5Russia 43 40 55 39 34 Russia 41 -2Saudi Arabia 26 26 31 26 62 Saudi Arabia 0 - -
Singapore 13 41 17 2 31 Singapore 15 2Slovak Republic 46 43 50 49 64 Slovak Republic 39 -7Slovenia 37 27 49 37 73 Slovenia 36 -1South Africa 48 57 35 52 84 South Africa 43 -5Spain 32 30 25 41 23 Spain 34 2Sweden 9 9 12 19 9 Sweden 4 -5Switzerland 1 5 1 1 1 Switzerland 1 -Taiwan 23 25 26 22 32 Taiwan 23 -Thailand 42 48 23 50 24 Thailand 37 -5Turkey 53 52 51 51 35 Turkey 46 -7UAE 25 58 3 7 52 UAE 27 2Ukraine 59 35 62 60 95 Ukraine 49 -10United Kingdom 21 37 19 20 12 United Kingdom 20 -1USA 16 29 2 24 61 USA 13 -3Venezuela 63 49 63 63 36 Venezuela 61 -2
Ch a
nge

33IMD WORLD TALENT RANKING 2017

IMD WORLD TALENT RANKING 201734
35IMD WORLD TALENT RANKING 2017
TALENT COUNTRY PROFILES
All data are available from theWorld Competitiveness Online.
Visit our eShopwww.wcceshop.org
IMD WORLD TALENT RANKING 201736
Alpha AlphaLabel Beta BetaLabel Gamma GammaLabel1 2 2 2 2 2 24 4 4 2 2
Value
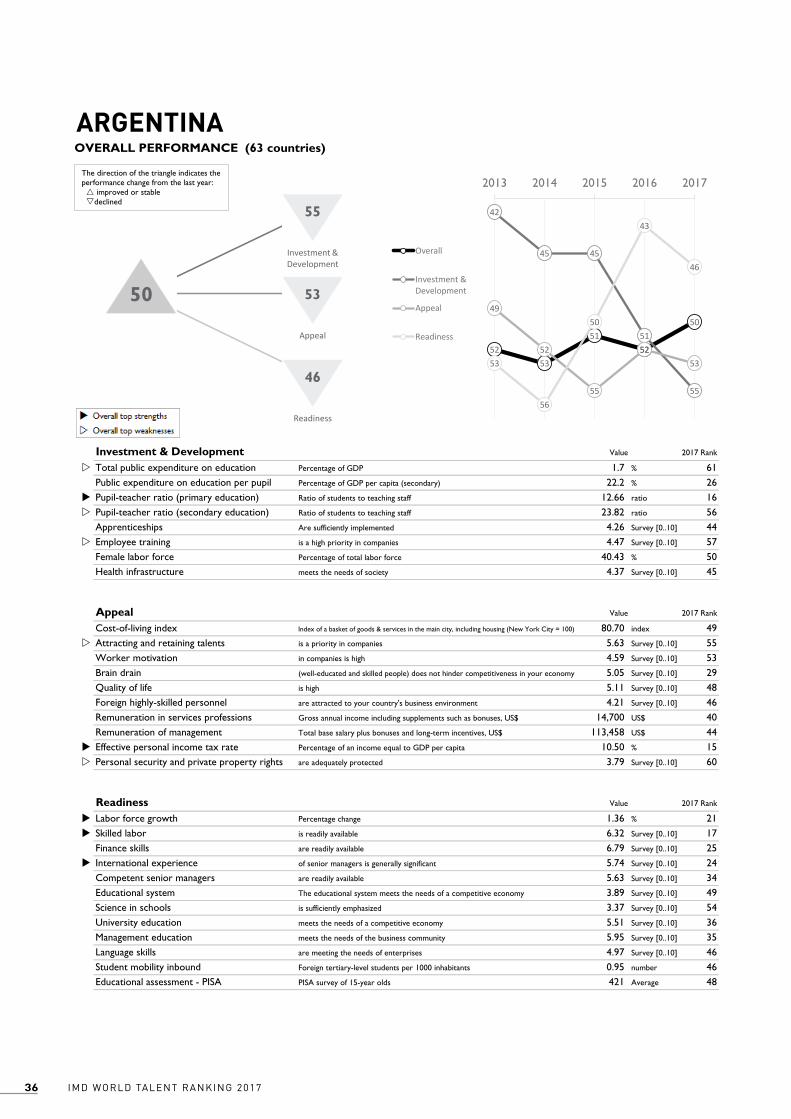
w 1.7 % 61 22.2 % 26u 12.66 ratio 16w 23.82 ratio 56 4.26 Survey [0..10] 44w 4.47 Survey [0..10] 57 40.43 % 50 4.37 Survey [0..10] 45
Value
80.70 index 49w 5.63 Survey [0..10] 55 4.59 Survey [0..10] 53 5.05 Survey [0..10] 29 5.11 Survey [0..10] 48 4.21 Survey [0..10] 46 14,700 US$ 40 113,458 US$ 44u 10.50 % 15w 3.79 Survey [0..10] 60
Value
u 1.36 % 21u 6.32 Survey [0..10] 17 6.79 Survey [0..10] 25u 5.74 Survey [0..10] 24 5.63 Survey [0..10] 34 3.89 Survey [0..10] 49 3.37 Survey [0..10] 54 5.51 Survey [0..10] 36 5.95 Survey [0..10] 35 4.97 Survey [0..10] 46 0.95 number 46 421 Average 48
Percentage change
Student mobility inbound Foreign tertiary-level students per 1000 inhabitants
Investment & Development 2017 Rank
Health infrastructure meets the needs of society
2017 Rank
Total public expenditure on education Percentage of GDP
ApprenticeshipsEmployee training is a high priority in companies
Labor force growth
University education meets the needs of a competitive economy
Management education meets the needs of the business community
Language skills are meeting the needs of enterprises
Competent senior managers are readily available
Educational system The educational system meets the needs of a competitive economy
Science in schools is sufficiently emphasized
Skilled labor is readily available
Finance skills are readily available
International experience of senior managers is generally significant
Remuneration of management Total base salary plus bonuses and long-term incentives, US$
Effective personal income tax rate Percentage of an income equal to GDP per capita
Quality of life is high
Foreign highly-skilled personnel are attracted to your country's business environment
Remuneration in services professions Gross annual income including supplements such as bonuses, US$
Attracting and retaining talents is a priority in companies
Worker motivation in companies is high
Brain drain (well-educated and skilled people) does not hinder competitiveness in your economy
Readiness 2017 Rank
Educational assessment - PISA PISA survey of 15-year olds
Public expenditure on education per pupil Percentage of GDP per capita (secondary)
Pupil-teacher ratio (primary education)
ARGENTINA
Ratio of students to teaching staff
Pupil-teacher ratio (secondary education) Ratio of students to teaching staff
Appeal
Are sufficiently implemented
Personal security and private property rights are adequately protected
Female labor force Percentage of total labor force
Cost-of-living index Index of a basket of goods & services in the main city, including housing (New York City = 100)
IMD World Talent Ranking 2017
OVERALL PERFORMANCE (63 countries)
5253
5152
50
42
45 45
51
55
49
52
55
525353
56
50
43
46
2013 2014 2015 2016 2017
Overall
Investment &Development
Appeal
Readiness
55
5350
46
Investment & Development
Appeal
Readiness
The direction of the triangle indicates the performance change from the last year: improved or stabledeclined
37IMD WORLD TALENT RANKING 2017
Alpha AlphaLabel Beta BetaLabel Gamma GammaLabel1 2 2 2 2 2 24 4 4 2 2
Value
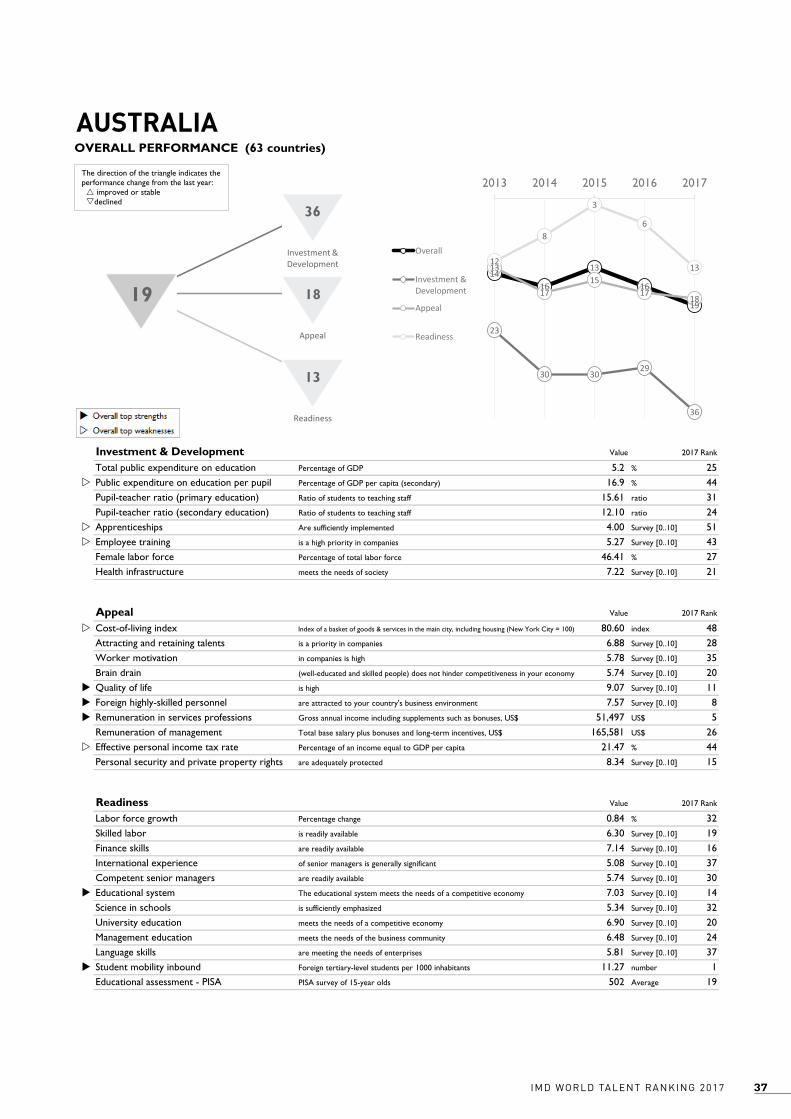
5.2 % 25w 16.9 % 44 15.61 ratio 31 12.10 ratio 24w 4.00 Survey [0..10] 51w 5.27 Survey [0..10] 43 46.41 % 27 7.22 Survey [0..10] 21
Value
w 80.60 index 48 6.88 Survey [0..10] 28 5.78 Survey [0..10] 35 5.74 Survey [0..10] 20u 9.07 Survey [0..10] 11u 7.57 Survey [0..10] 8u 51,497 US$ 5 165,581 US$ 26w 21.47 % 44 8.34 Survey [0..10] 15
Value
0.84 % 32 6.30 Survey [0..10] 19 7.14 Survey [0..10] 16 5.08 Survey [0..10] 37 5.74 Survey [0..10] 30u 7.03 Survey [0..10] 14 5.34 Survey [0..10] 32 6.90 Survey [0..10] 20 6.48 Survey [0..10] 24 5.81 Survey [0..10] 37u 11.27 number 1 502 Average 19
2017 Rank
Total public expenditure on education Percentage of GDP
ApprenticeshipsEmployee training is a high priority in companies
Investment & Development 2017 Rank
Health infrastructure meets the needs of society
Percentage change
Readiness 2017 Rank
Educational assessment - PISA PISA survey of 15-year olds
Appeal
Personal security and private property rights are adequately protected
Student mobility inbound Foreign tertiary-level students per 1000 inhabitants
Labor force growth
University education meets the needs of a competitive economy
Management education meets the needs of the business community
Language skills are meeting the needs of enterprises
Competent senior managers are readily available
Educational system The educational system meets the needs of a competitive economy
Science in schools is sufficiently emphasized
Skilled labor is readily available
Finance skills are readily available
International experience of senior managers is generally significant
Remuneration of management Total base salary plus bonuses and long-term incentives, US$
Effective personal income tax rate Percentage of an income equal to GDP per capita
Quality of life is high
Foreign highly-skilled personnel are attracted to your country's business environment
Remuneration in services professions Gross annual income including supplements such as bonuses, US$
Attracting and retaining talents is a priority in companies
Worker motivation in companies is high
Brain drain (well-educated and skilled people) does not hinder competitiveness in your economy
Public expenditure on education per pupil Percentage of GDP per capita (secondary)
Pupil-teacher ratio (primary education)
AUSTRALIA
Ratio of students to teaching staff
Pupil-teacher ratio (secondary education) Ratio of students to teaching staff
Are sufficiently implemented
Female labor force Percentage of total labor force
Cost-of-living index Index of a basket of goods & services in the main city, including housing (New York City = 100)
IMD World Talent Ranking 2017
OVERALL PERFORMANCE (63 countries)
1416
13
16
19
23
30 3029
36
13
1715
1718
12
8
3
6
13
2013 2014 2015 2016 2017
Overall
Investment &Development
Appeal
Readiness
36
1819
13
Investment & Development
Appeal
Readiness
The direction of the triangle indicates the performance change from the last year: improved or stabledeclined
IMD WORLD TALENT RANKING 201738
Alpha AlphaLabel Beta BetaLabel Gamma GammaLabel1 2 2 2 2 2 24 4 4 2 2
Value
5.4 % 21 27.5 % 6 11.95 ratio 14 9.31 ratio 7u 7.83 Survey [0..10] 3u 7.69 Survey [0..10] 1 46.82 % 19 8.05 Survey [0..10] 11
Value
w 78.40 index 42 7.83 Survey [0..10] 5u 7.57 Survey [0..10] 4 5.47 Survey [0..10] 24u 9.57 Survey [0..10] 3 5.78 Survey [0..10] 26 40,720 US$ 17u 266,124 US$ 4w 28.07 % 60 8.66 Survey [0..10] 10
Value
2.05 % 16w 5.23 Survey [0..10] 42 7.09 Survey [0..10] 20 6.14 Survey [0..10] 16 5.49 Survey [0..10] 38 6.51 Survey [0..10] 20w 5.16 Survey [0..10] 38 7.10 Survey [0..10] 15 6.94 Survey [0..10] 17 7.01 Survey [0..10] 22 7.84 number 6 496 Average 23
Percentage change
Investment & Development 2017 Rank
Health infrastructure meets the needs of society
2017 Rank
Total public expenditure on education Percentage of GDP
ApprenticeshipsEmployee training is a high priority in companies
Student mobility inbound Foreign tertiary-level students per 1000 inhabitants
Readiness 2017 Rank
Educational assessment - PISA PISA survey of 15-year olds
Appeal
Personal security and private property rights are adequately protected
Labor force growth
University education meets the needs of a competitive economy
Management education meets the needs of the business community
Language skills are meeting the needs of enterprises
Competent senior managers are readily available
Educational system The educational system meets the needs of a competitive economy
Science in schools is sufficiently emphasized
Skilled labor is readily available
Finance skills are readily available
International experience of senior managers is generally significant
Remuneration of management Total base salary plus bonuses and long-term incentives, US$
Effective personal income tax rate Percentage of an income equal to GDP per capita
Quality of life is high
Foreign highly-skilled personnel are attracted to your country's business environment
Remuneration in services professions Gross annual income including supplements such as bonuses, US$
Attracting and retaining talents is a priority in companies
Worker motivation in companies is high
Brain drain (well-educated and skilled people) does not hinder competitiveness in your economy
Public expenditure on education per pupil Percentage of GDP per capita (secondary)
Pupil-teacher ratio (primary education)
AUSTRIA
Ratio of students to teaching staff
Pupil-teacher ratio (secondary education) Ratio of students to teaching staff
Are sufficiently implemented
Female labor force Percentage of total labor force
Cost-of-living index Index of a basket of goods & services in the main city, including housing (New York City = 100)
IMD World Talent Ranking 2017
OVERALL PERFORMANCE (63 countries)
8
6
12
54
54 4
3 3
1413
20
18
15
23
15
26
19
16
2013 2014 2015 2016 2017
Overall
Investment &Development
Appeal
Readiness
3
154
16
Investment & Development
Appeal
Readiness
The direction of the triangle indicates the performance change from the last year: improved or stabledeclined
39IMD WORLD TALENT RANKING 2017
Alpha AlphaLabel Beta BetaLabel Gamma GammaLabel1 2 2 2 2 2 24 4 4 2 2
Value
u 6.5 % 9u 38.6 % 1 12.72 ratio 18u 9.67 ratio 9w 4.53 Survey [0..10] 39 5.85 Survey [0..10] 30 46.27 % 30u 8.75 Survey [0..10] 3
Value
72.40 index 29u 7.61 Survey [0..10] 7 6.24 Survey [0..10] 25 5.94 Survey [0..10] 17 8.50 Survey [0..10] 18 5.76 Survey [0..10] 28 41,133 US$ 16 241,607 US$ 10w 24.64 % 52 7.97 Survey [0..10] 21
Value
w 0.16 % 49 6.06 Survey [0..10] 24 7.10 Survey [0..10] 19 6.66 Survey [0..10] 10 6.47 Survey [0..10] 15 7.50 Survey [0..10] 11 6.56 Survey [0..10] 13 7.58 Survey [0..10] 11 7.13 Survey [0..10] 13 8.21 Survey [0..10] 10 4.95 number 11 504 Average 15
Investment & Development 2017 Rank
Health infrastructure meets the needs of society
2017 Rank
Total public expenditure on education Percentage of GDP
ApprenticeshipsEmployee training is a high priority in companies
Educational assessment - PISA PISA survey of 15-year olds
Appeal
Personal security and private property rights are adequately protected
Readiness 2017 Rank
Percentage change
Student mobility inbound Foreign tertiary-level students per 1000 inhabitants
Labor force growth
University education meets the needs of a competitive economy
Management education meets the needs of the business community
Language skills are meeting the needs of enterprises
Competent senior managers are readily available
Educational system The educational system meets the needs of a competitive economy
Science in schools is sufficiently emphasized
Skilled labor is readily available
Finance skills are readily available
International experience of senior managers is generally significant
Remuneration of management Total base salary plus bonuses and long-term incentives, US$
Effective personal income tax rate Percentage of an income equal to GDP per capita
Quality of life is high
Foreign highly-skilled personnel are attracted to your country's business environment
Remuneration in services professions Gross annual income including supplements such as bonuses, US$
Attracting and retaining talents is a priority in companies
Worker motivation in companies is high
Brain drain (well-educated and skilled people) does not hinder competitiveness in your economy
Public expenditure on education per pupil Percentage of GDP per capita (secondary)
Pupil-teacher ratio (primary education)
BELGIUM
Ratio of students to teaching staff
Pupil-teacher ratio (secondary education) Ratio of students to teaching staff
Are sufficiently implemented
Female labor force Percentage of total labor force
Cost-of-living index Index of a basket of goods & services in the main city, including housing (New York City = 100)
IMD World Talent Ranking 2017
OVERALL PERFORMANCE (63 countries)
4
7
3 3 32
5
12 2
16 1617
14
16
11
20
9
7
12
2013 2014 2015 2016 2017
Overall
Investment &Development
Appeal
Readiness
2
163
12
Investment & Development
Appeal
Readiness
The direction of the triangle indicates the performance change from the last year: improved or stabledeclined
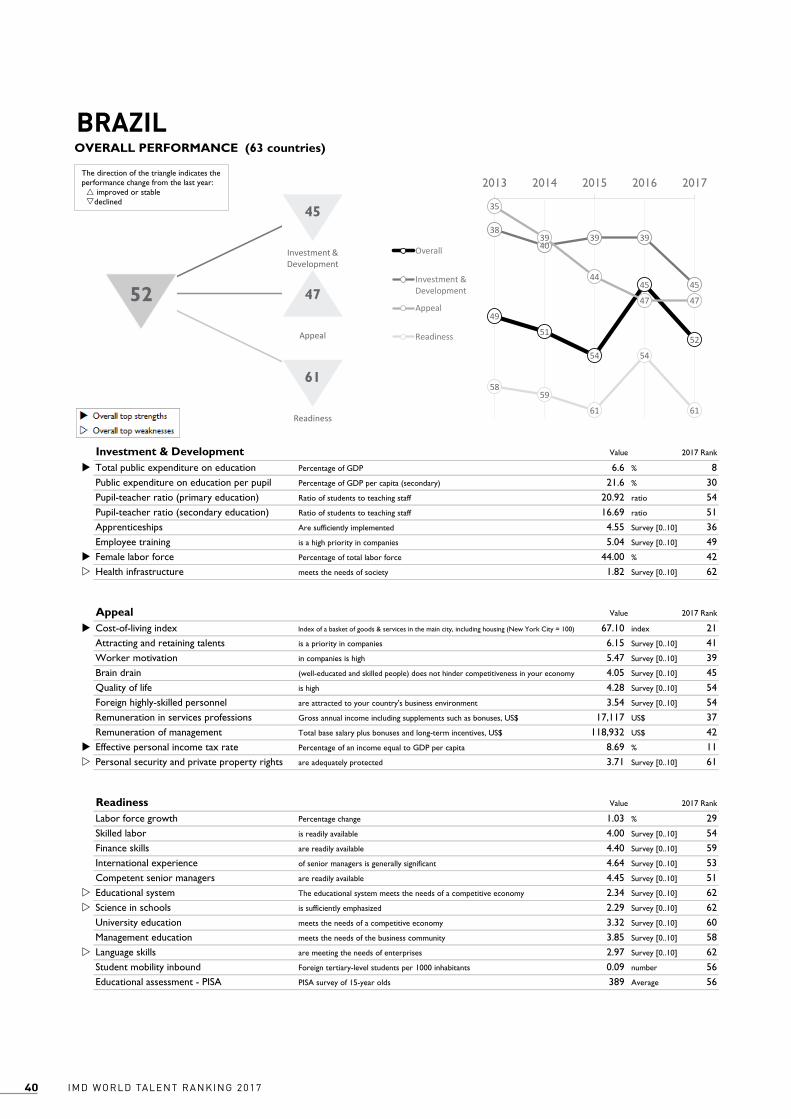
IMD WORLD TALENT RANKING 201740
Alpha AlphaLabel Beta BetaLabel Gamma GammaLabel1 2 2 2 2 2 24 4 4 2 2
Value
u 6.6 % 8 21.6 % 30 20.92 ratio 54 16.69 ratio 51 4.55 Survey [0..10] 36 5.04 Survey [0..10] 49u 44.00 % 42w 1.82 Survey [0..10] 62
Value
u 67.10 index 21 6.15 Survey [0..10] 41 5.47 Survey [0..10] 39 4.05 Survey [0..10] 45 4.28 Survey [0..10] 54 3.54 Survey [0..10] 54 17,117 US$ 37 118,932 US$ 42u 8.69 % 11w 3.71 Survey [0..10] 61
Value
1.03 % 29 4.00 Survey [0..10] 54 4.40 Survey [0..10] 59 4.64 Survey [0..10] 53 4.45 Survey [0..10] 51w 2.34 Survey [0..10] 62w 2.29 Survey [0..10] 62 3.32 Survey [0..10] 60 3.85 Survey [0..10] 58w 2.97 Survey [0..10] 62 0.09 number 56 389 Average 56
Investment & Development 2017 Rank
Health infrastructure meets the needs of society
2017 Rank
Total public expenditure on education Percentage of GDP
ApprenticeshipsEmployee training is a high priority in companies
Readiness 2017 Rank
Educational assessment - PISA PISA survey of 15-year olds
Appeal
Personal security and private property rights are adequately protected
Percentage change
Student mobility inbound Foreign tertiary-level students per 1000 inhabitants
Labor force growth
University education meets the needs of a competitive economy
Management education meets the needs of the business community
Language skills are meeting the needs of enterprises
Competent senior managers are readily available
Educational system The educational system meets the needs of a competitive economy
Science in schools is sufficiently emphasized
Skilled labor is readily available
Finance skills are readily available
International experience of senior managers is generally significant
Remuneration of management Total base salary plus bonuses and long-term incentives, US$
Effective personal income tax rate Percentage of an income equal to GDP per capita
Quality of life is high
Foreign highly-skilled personnel are attracted to your country's business environment
Remuneration in services professions Gross annual income including supplements such as bonuses, US$
Attracting and retaining talents is a priority in companies
Worker motivation in companies is high
Brain drain (well-educated and skilled people) does not hinder competitiveness in your economy
Public expenditure on education per pupil Percentage of GDP per capita (secondary)
Pupil-teacher ratio (primary education)
BRAZIL
Ratio of students to teaching staff
Pupil-teacher ratio (secondary education) Ratio of students to teaching staff
Are sufficiently implemented
Female labor force Percentage of total labor force
Cost-of-living index Index of a basket of goods & services in the main city, including housing (New York City = 100)
IMD World Talent Ranking 2017
OVERALL PERFORMANCE (63 countries)
49
51
54
45
52
38
4039 39
45
35
39
44
47 47
5859
61
54
61
2013 2014 2015 2016 2017
Overall
Investment &Development
Appeal
Readiness
45
4752
61
Investment & Development
Appeal
Readiness
The direction of the triangle indicates the performance change from the last year: improved or stabledeclined
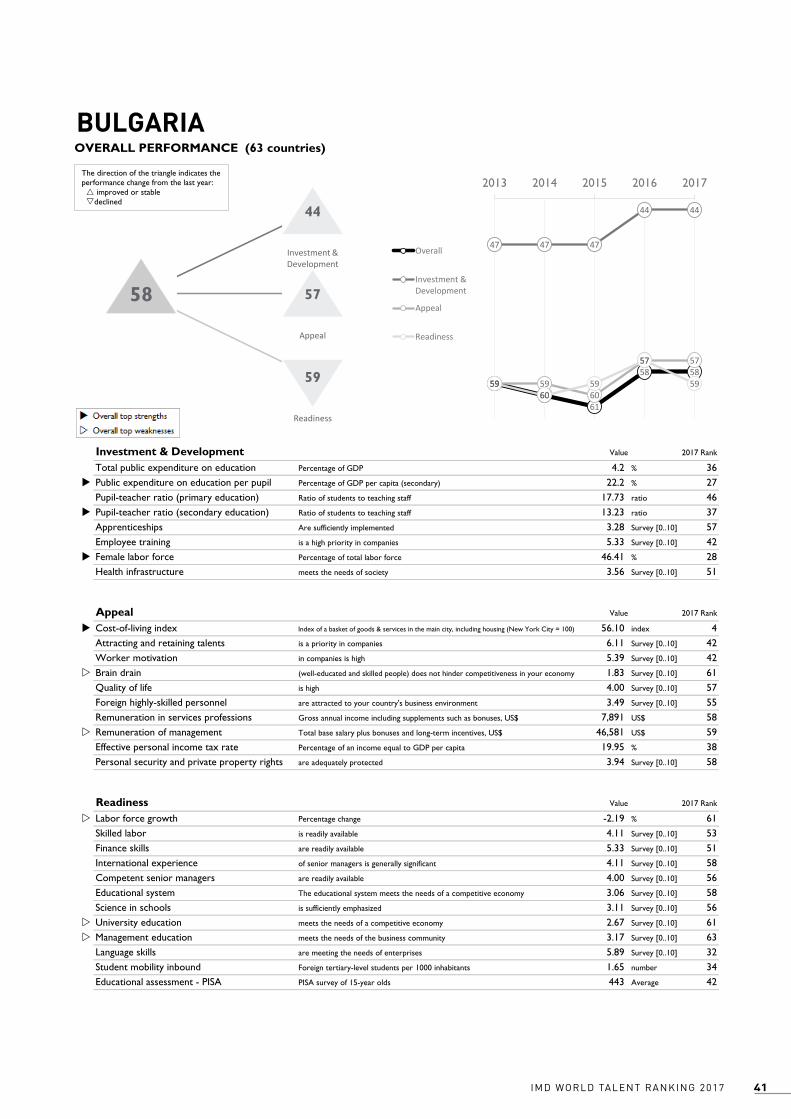
41IMD WORLD TALENT RANKING 2017
Alpha AlphaLabel Beta BetaLabel Gamma GammaLabel1 2 2 2 2 2 24 4 4 2 2
Value
4.2 % 36u 22.2 % 27 17.73 ratio 46u 13.23 ratio 37 3.28 Survey [0..10] 57 5.33 Survey [0..10] 42u 46.41 % 28 3.56 Survey [0..10] 51
Value
u 56.10 index 4 6.11 Survey [0..10] 42 5.39 Survey [0..10] 42w 1.83 Survey [0..10] 61 4.00 Survey [0..10] 57 3.49 Survey [0..10] 55 7,891 US$ 58w 46,581 US$ 59 19.95 % 38 3.94 Survey [0..10] 58
Value
w -2.19 % 61 4.11 Survey [0..10] 53 5.33 Survey [0..10] 51 4.11 Survey [0..10] 58 4.00 Survey [0..10] 56 3.06 Survey [0..10] 58 3.11 Survey [0..10] 56w 2.67 Survey [0..10] 61w 3.17 Survey [0..10] 63 5.89 Survey [0..10] 32 1.65 number 34 443 Average 42
Investment & Development 2017 Rank
Health infrastructure meets the needs of society
2017 Rank
Total public expenditure on education Percentage of GDP
ApprenticeshipsEmployee training is a high priority in companies
Readiness 2017 Rank
Educational assessment - PISA PISA survey of 15-year olds
Appeal
Personal security and private property rights are adequately protected
Percentage change
Student mobility inbound Foreign tertiary-level students per 1000 inhabitants
Labor force growth
University education meets the needs of a competitive economy
Management education meets the needs of the business community
Language skills are meeting the needs of enterprises
Competent senior managers are readily available
Educational system The educational system meets the needs of a competitive economy
Science in schools is sufficiently emphasized
Skilled labor is readily available
Finance skills are readily available
International experience of senior managers is generally significant
Remuneration of management Total base salary plus bonuses and long-term incentives, US$
Effective personal income tax rate Percentage of an income equal to GDP per capita
Quality of life is high
Foreign highly-skilled personnel are attracted to your country's business environment
Remuneration in services professions Gross annual income including supplements such as bonuses, US$
Attracting and retaining talents is a priority in companies
Worker motivation in companies is high
Brain drain (well-educated and skilled people) does not hinder competitiveness in your economy
Public expenditure on education per pupil Percentage of GDP per capita (secondary)
Pupil-teacher ratio (primary education)
BULGARIA
Ratio of students to teaching staff
Pupil-teacher ratio (secondary education) Ratio of students to teaching staff
Are sufficiently implemented
Female labor force Percentage of total labor force
Cost-of-living index Index of a basket of goods & services in the main city, including housing (New York City = 100)
IMD World Talent Ranking 2017
OVERALL PERFORMANCE (63 countries)
5960
61
58 58
47 47 47
44 44
59 5960
57 57
5960
59
57
59
2013 2014 2015 2016 2017
Overall
Investment &Development
Appeal
Readiness
44
5758
59
Investment & Development
Appeal
Readiness
The direction of the triangle indicates the performance change from the last year: improved or stabledeclined
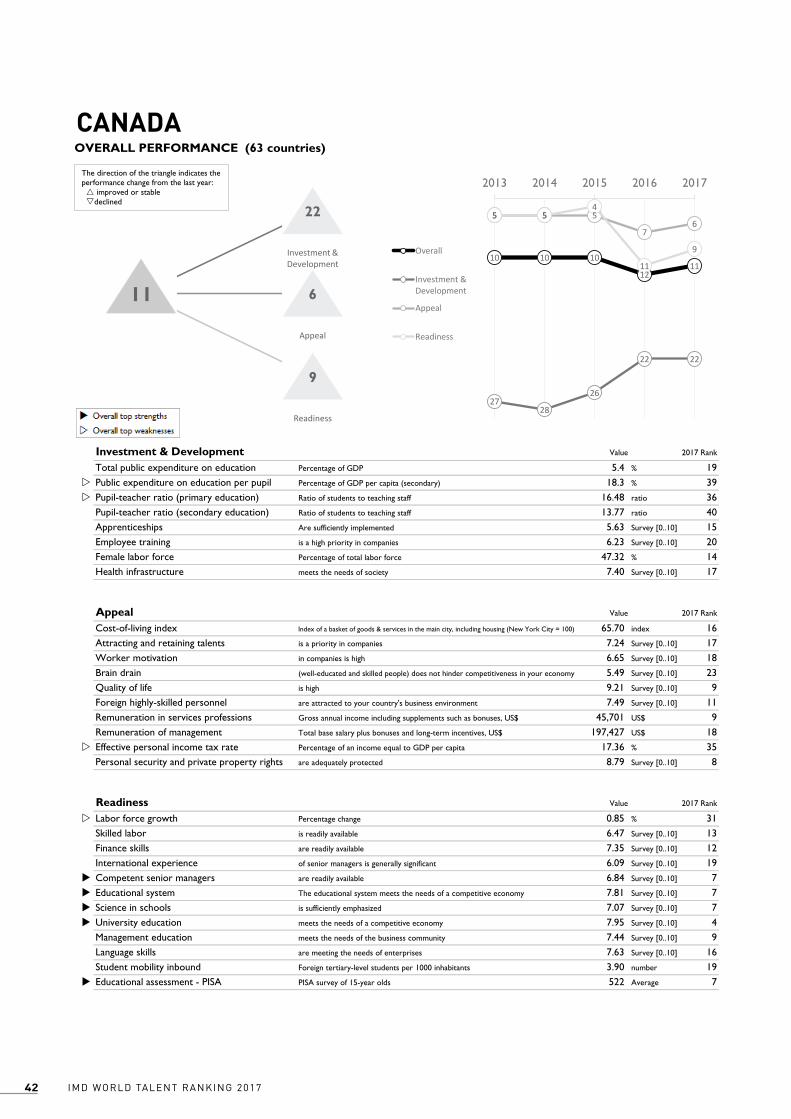
IMD WORLD TALENT RANKING 201742
Alpha AlphaLabel Beta BetaLabel Gamma GammaLabel1 2 2 2 2 2 24 4 4 2 2
Value
5.4 % 19w 18.3 % 39w 16.48 ratio 36 13.77 ratio 40 5.63 Survey [0..10] 15 6.23 Survey [0..10] 20 47.32 % 14 7.40 Survey [0..10] 17
Value
65.70 index 16 7.24 Survey [0..10] 17 6.65 Survey [0..10] 18 5.49 Survey [0..10] 23 9.21 Survey [0..10] 9 7.49 Survey [0..10] 11 45,701 US$ 9 197,427 US$ 18w 17.36 % 35 8.79 Survey [0..10] 8
Value
w 0.85 % 31 6.47 Survey [0..10] 13 7.35 Survey [0..10] 12 6.09 Survey [0..10] 19u 6.84 Survey [0..10] 7u 7.81 Survey [0..10] 7u 7.07 Survey [0..10] 7u 7.95 Survey [0..10] 4 7.44 Survey [0..10] 9 7.63 Survey [0..10] 16 3.90 number 19u 522 Average 7
Investment & Development 2017 Rank
Health infrastructure meets the needs of society
2017 Rank
Total public expenditure on education Percentage of GDP
ApprenticeshipsEmployee training is a high priority in companies
Readiness 2017 Rank
Educational assessment - PISA PISA survey of 15-year olds
Appeal
Personal security and private property rights are adequately protected
Percentage change
Student mobility inbound Foreign tertiary-level students per 1000 inhabitants
Labor force growth
University education meets the needs of a competitive economy
Management education meets the needs of the business community
Language skills are meeting the needs of enterprises
Competent senior managers are readily available
Educational system The educational system meets the needs of a competitive economy
Science in schools is sufficiently emphasized
Skilled labor is readily available
Finance skills are readily available
International experience of senior managers is generally significant
Remuneration of management Total base salary plus bonuses and long-term incentives, US$
Effective personal income tax rate Percentage of an income equal to GDP per capita
Quality of life is high
Foreign highly-skilled personnel are attracted to your country's business environment
Remuneration in services professions Gross annual income including supplements such as bonuses, US$
Attracting and retaining talents is a priority in companies
Worker motivation in companies is high
Brain drain (well-educated and skilled people) does not hinder competitiveness in your economy
Public expenditure on education per pupil Percentage of GDP per capita (secondary)
Pupil-teacher ratio (primary education)
CANADA
Ratio of students to teaching staff
Pupil-teacher ratio (secondary education) Ratio of students to teaching staff
Are sufficiently implemented
Female labor force Percentage of total labor force
Cost-of-living index Index of a basket of goods & services in the main city, including housing (New York City = 100)
IMD World Talent Ranking 2017
OVERALL PERFORMANCE (63 countries)
10 10 10
1211
2728
26
22 22
5 5 5
76
5 54
11
9
2013 2014 2015 2016 2017
Overall
Investment &Development
Appeal
Readiness
22
611
9
Investment & Development
Appeal
Readiness
The direction of the triangle indicates the performance change from the last year: improved or stabledeclined
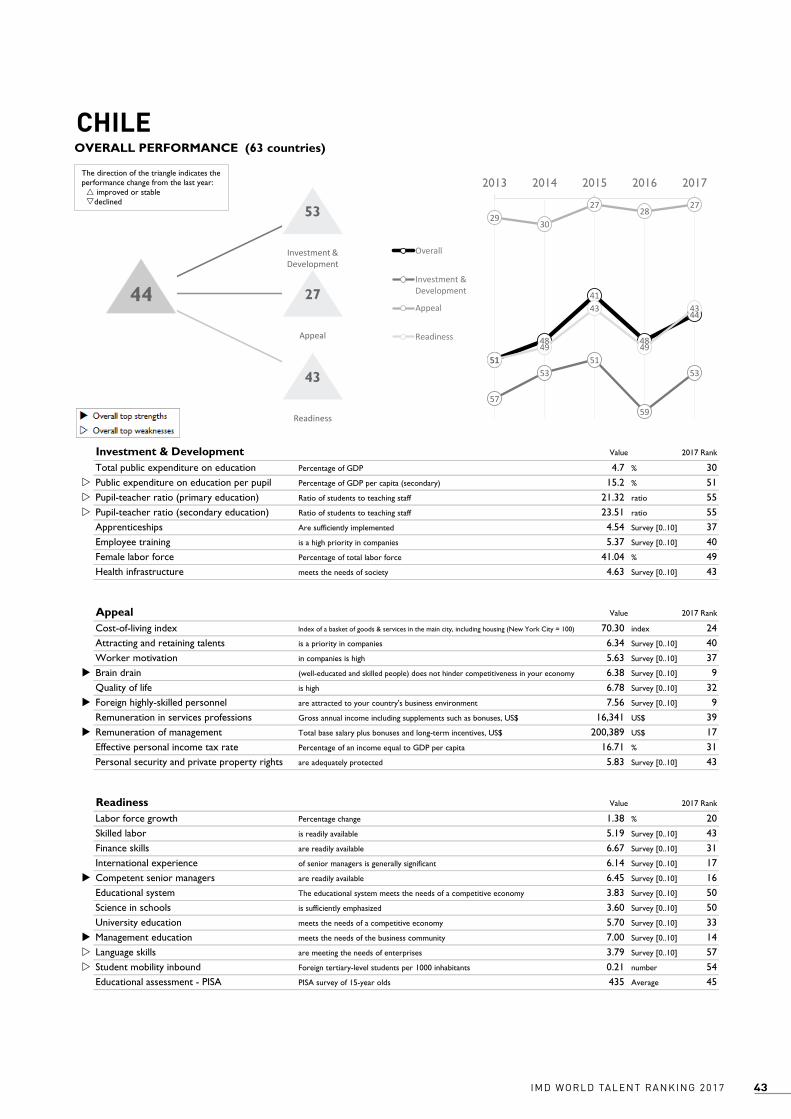
43IMD WORLD TALENT RANKING 2017
Alpha AlphaLabel Beta BetaLabel Gamma GammaLabel1 2 2 2 2 2 24 4 4 2 2
Value
4.7 % 30w 15.2 % 51w 21.32 ratio 55w 23.51 ratio 55 4.54 Survey [0..10] 37 5.37 Survey [0..10] 40 41.04 % 49 4.63 Survey [0..10] 43
Value
70.30 index 24 6.34 Survey [0..10] 40 5.63 Survey [0..10] 37u 6.38 Survey [0..10] 9 6.78 Survey [0..10] 32u 7.56 Survey [0..10] 9 16,341 US$ 39u 200,389 US$ 17 16.71 % 31 5.83 Survey [0..10] 43
Value
1.38 % 20 5.19 Survey [0..10] 43 6.67 Survey [0..10] 31 6.14 Survey [0..10] 17u 6.45 Survey [0..10] 16 3.83 Survey [0..10] 50 3.60 Survey [0..10] 50 5.70 Survey [0..10] 33u 7.00 Survey [0..10] 14w 3.79 Survey [0..10] 57w 0.21 number 54 435 Average 45
Investment & Development 2017 Rank
Health infrastructure meets the needs of society
2017 Rank
Total public expenditure on education Percentage of GDP
ApprenticeshipsEmployee training is a high priority in companies
Readiness 2017 Rank
Educational assessment - PISA PISA survey of 15-year olds
Appeal
Personal security and private property rights are adequately protected
Percentage change
Student mobility inbound Foreign tertiary-level students per 1000 inhabitants
Labor force growth
University education meets the needs of a competitive economy
Management education meets the needs of the business community
Language skills are meeting the needs of enterprises
Competent senior managers are readily available
Educational system The educational system meets the needs of a competitive economy
Science in schools is sufficiently emphasized
Skilled labor is readily available
Finance skills are readily available
International experience of senior managers is generally significant
Remuneration of management Total base salary plus bonuses and long-term incentives, US$
Effective personal income tax rate Percentage of an income equal to GDP per capita
Quality of life is high
Foreign highly-skilled personnel are attracted to your country's business environment
Remuneration in services professions Gross annual income including supplements such as bonuses, US$
Attracting and retaining talents is a priority in companies
Worker motivation in companies is high
Brain drain (well-educated and skilled people) does not hinder competitiveness in your economy
Public expenditure on education per pupil Percentage of GDP per capita (secondary)
Pupil-teacher ratio (primary education)
CHILE
Ratio of students to teaching staff
Pupil-teacher ratio (secondary education) Ratio of students to teaching staff
Are sufficiently implemented
Female labor force Percentage of total labor force
Cost-of-living index Index of a basket of goods & services in the main city, including housing (New York City = 100)
IMD World Talent Ranking 2017
OVERALL PERFORMANCE (63 countries)
51
48
41
48
44
57
5351
59
53
2930
2728
27
5149
43
49
43
2013 2014 2015 2016 2017
Overall
Investment &Development
Appeal
Readiness
53
2744
43
Investment & Development
Appeal
Readiness
The direction of the triangle indicates the performance change from the last year: improved or stabledeclined
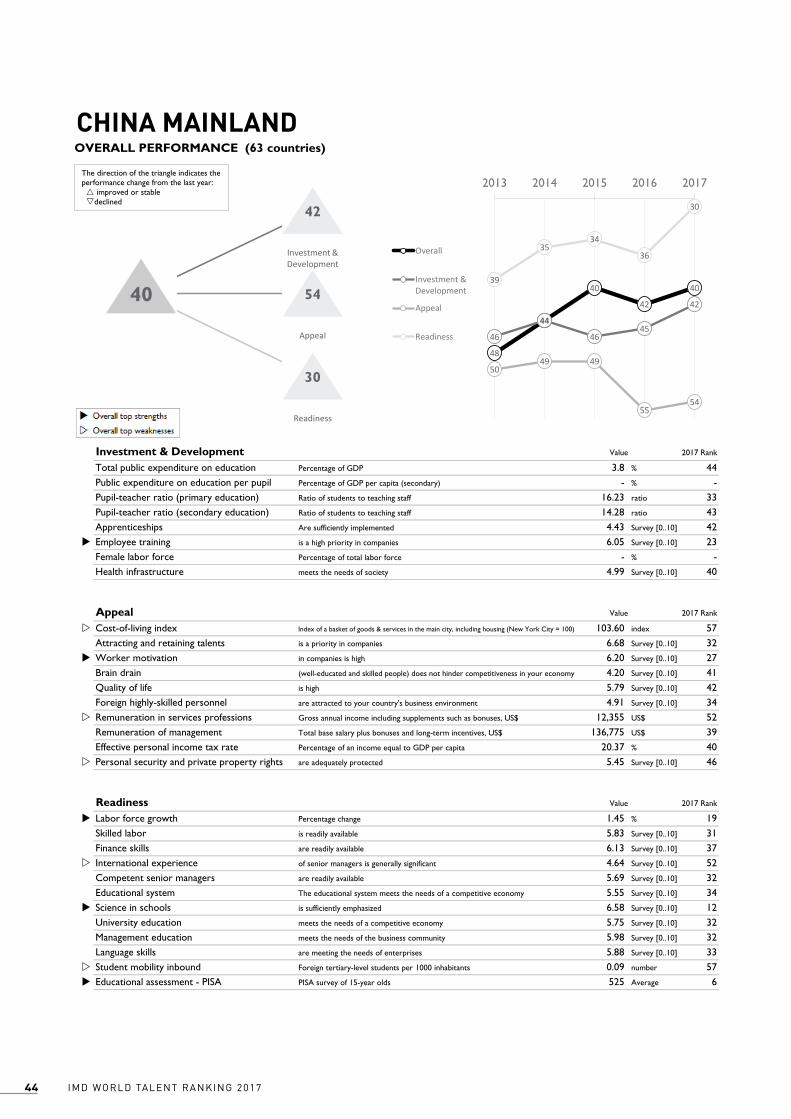
IMD WORLD TALENT RANKING 201744
Alpha AlphaLabel Beta BetaLabel Gamma GammaLabel1 2 2 2 2 2 24 4 4 2 2
Value
3.8 % 44 - % - 16.23 ratio 33 14.28 ratio 43 4.43 Survey [0..10] 42u 6.05 Survey [0..10] 23 - % - 4.99 Survey [0..10] 40
Value
w 103.60 index 57 6.68 Survey [0..10] 32u 6.20 Survey [0..10] 27 4.20 Survey [0..10] 41 5.79 Survey [0..10] 42 4.91 Survey [0..10] 34w 12,355 US$ 52 136,775 US$ 39 20.37 % 40w 5.45 Survey [0..10] 46
Value
u 1.45 % 19 5.83 Survey [0..10] 31 6.13 Survey [0..10] 37w 4.64 Survey [0..10] 52 5.69 Survey [0..10] 32 5.55 Survey [0..10] 34u 6.58 Survey [0..10] 12 5.75 Survey [0..10] 32 5.98 Survey [0..10] 32 5.88 Survey [0..10] 33w 0.09 number 57u 525 Average 6
Investment & Development 2017 Rank
Health infrastructure meets the needs of society
2017 Rank
Total public expenditure on education Percentage of GDP
ApprenticeshipsEmployee training is a high priority in companies
Readiness 2017 Rank
Educational assessment - PISA PISA survey of 15-year olds
Appeal
Personal security and private property rights are adequately protected
Percentage change
Student mobility inbound Foreign tertiary-level students per 1000 inhabitants
Labor force growth
University education meets the needs of a competitive economy
Management education meets the needs of the business community
Language skills are meeting the needs of enterprises
Competent senior managers are readily available
Educational system The educational system meets the needs of a competitive economy
Science in schools is sufficiently emphasized
Skilled labor is readily available
Finance skills are readily available
International experience of senior managers is generally significant
Remuneration of management Total base salary plus bonuses and long-term incentives, US$
Effective personal income tax rate Percentage of an income equal to GDP per capita
Quality of life is high
Foreign highly-skilled personnel are attracted to your country's business environment
Remuneration in services professions Gross annual income including supplements such as bonuses, US$
Attracting and retaining talents is a priority in companies
Worker motivation in companies is high
Brain drain (well-educated and skilled people) does not hinder competitiveness in your economy
Public expenditure on education per pupil Percentage of GDP per capita (secondary)
Pupil-teacher ratio (primary education)
CHINA MAINLAND
Ratio of students to teaching staff
Pupil-teacher ratio (secondary education) Ratio of students to teaching staff
Are sufficiently implemented
Female labor force Percentage of total labor force
Cost-of-living index Index of a basket of goods & services in the main city, including housing (New York City = 100)
IMD World Talent Ranking 2017
OVERALL PERFORMANCE (63 countries)
48
44
40
42
40
46
44
4645
42
5049 49
5554
39
3534
36
30
2013 2014 2015 2016 2017
Overall
Investment &Development
Appeal
Readiness
42
5440
30
Investment & Development
Appeal
Readiness
The direction of the triangle indicates the performance change from the last year: improved or stabledeclined
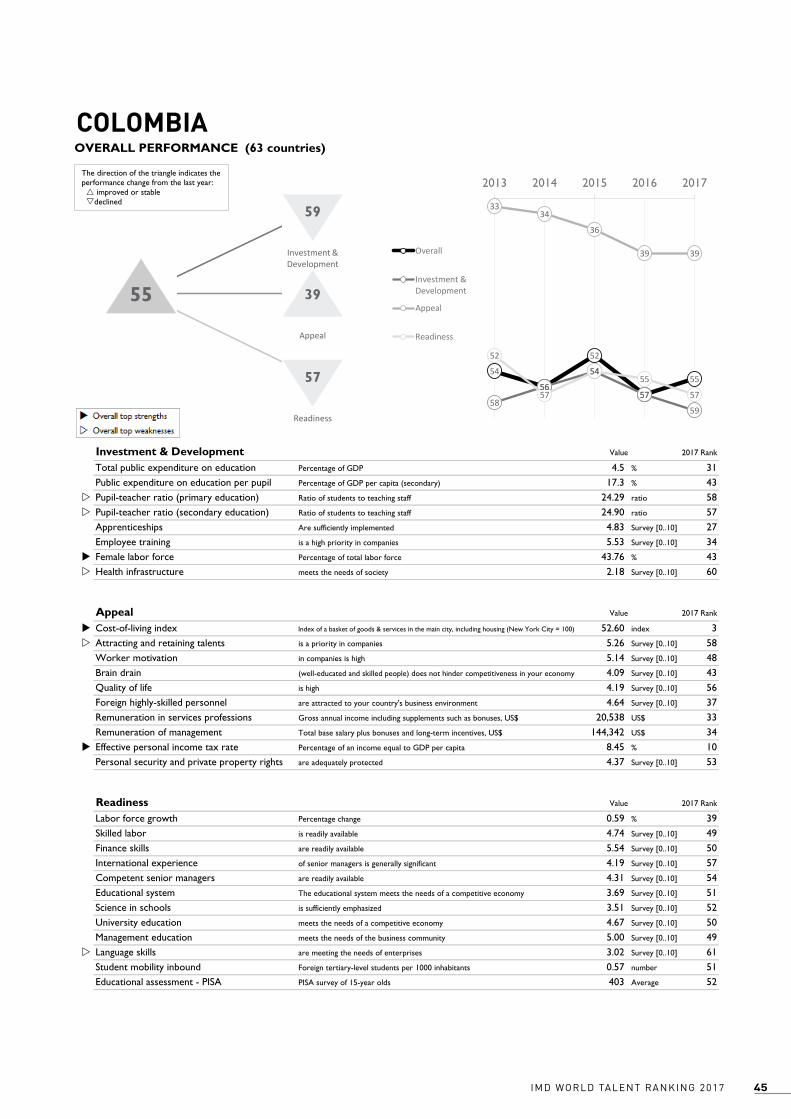
45IMD WORLD TALENT RANKING 2017
Alpha AlphaLabel Beta BetaLabel Gamma GammaLabel1 2 2 2 2 2 24 4 4 2 2
Value
4.5 % 31 17.3 % 43w 24.29 ratio 58w 24.90 ratio 57 4.83 Survey [0..10] 27 5.53 Survey [0..10] 34u 43.76 % 43w 2.18 Survey [0..10] 60
Value
u 52.60 index 3w 5.26 Survey [0..10] 58 5.14 Survey [0..10] 48 4.09 Survey [0..10] 43 4.19 Survey [0..10] 56 4.64 Survey [0..10] 37 20,538 US$ 33 144,342 US$ 34u 8.45 % 10 4.37 Survey [0..10] 53
Value
0.59 % 39 4.74 Survey [0..10] 49 5.54 Survey [0..10] 50 4.19 Survey [0..10] 57 4.31 Survey [0..10] 54 3.69 Survey [0..10] 51 3.51 Survey [0..10] 52 4.67 Survey [0..10] 50 5.00 Survey [0..10] 49w 3.02 Survey [0..10] 61 0.57 number 51 403 Average 52
Investment & Development 2017 Rank
Health infrastructure meets the needs of society
2017 Rank
Total public expenditure on education Percentage of GDP
ApprenticeshipsEmployee training is a high priority in companies
Readiness 2017 Rank
Educational assessment - PISA PISA survey of 15-year olds
Appeal
Personal security and private property rights are adequately protected
Percentage change
Student mobility inbound Foreign tertiary-level students per 1000 inhabitants
Labor force growth
University education meets the needs of a competitive economy
Management education meets the needs of the business community
Language skills are meeting the needs of enterprises
Competent senior managers are readily available
Educational system The educational system meets the needs of a competitive economy
Science in schools is sufficiently emphasized
Skilled labor is readily available
Finance skills are readily available
International experience of senior managers is generally significant
Remuneration of management Total base salary plus bonuses and long-term incentives, US$
Effective personal income tax rate Percentage of an income equal to GDP per capita
Quality of life is high
Foreign highly-skilled personnel are attracted to your country's business environment
Remuneration in services professions Gross annual income including supplements such as bonuses, US$
Attracting and retaining talents is a priority in companies
Worker motivation in companies is high
Brain drain (well-educated and skilled people) does not hinder competitiveness in your economy
Public expenditure on education per pupil Percentage of GDP per capita (secondary)
Pupil-teacher ratio (primary education)
COLOMBIA
Ratio of students to teaching staff
Pupil-teacher ratio (secondary education) Ratio of students to teaching staff
Are sufficiently implemented
Female labor force Percentage of total labor force
Cost-of-living index Index of a basket of goods & services in the main city, including housing (New York City = 100)
IMD World Talent Ranking 2017
OVERALL PERFORMANCE (63 countries)
54
56
52
57
55
58
56
54
57
59
3334
36
39 39
52
57
5455
57
2013 2014 2015 2016 2017
Overall
Investment &Development
Appeal
Readiness
59
3955
57
Investment & Development
Appeal
Readiness
The direction of the triangle indicates the performance change from the last year: improved or stabledeclined
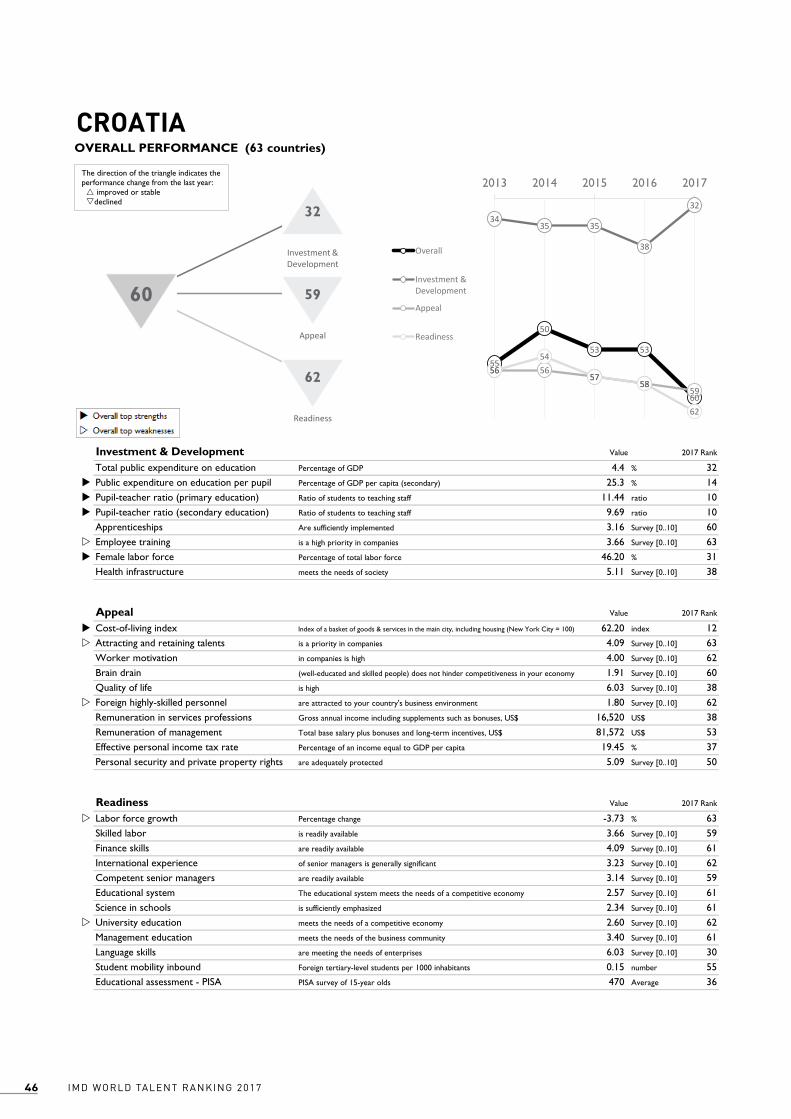
IMD WORLD TALENT RANKING 201746
Alpha AlphaLabel Beta BetaLabel Gamma GammaLabel1 2 2 2 2 2 24 4 4 2 2
Value
4.4 % 32u 25.3 % 14u 11.44 ratio 10u 9.69 ratio 10 3.16 Survey [0..10] 60w 3.66 Survey [0..10] 63u 46.20 % 31 5.11 Survey [0..10] 38
Value
u 62.20 index 12w 4.09 Survey [0..10] 63 4.00 Survey [0..10] 62 1.91 Survey [0..10] 60 6.03 Survey [0..10] 38w 1.80 Survey [0..10] 62 16,520 US$ 38 81,572 US$ 53 19.45 % 37 5.09 Survey [0..10] 50
Value
w -3.73 % 63 3.66 Survey [0..10] 59 4.09 Survey [0..10] 61 3.23 Survey [0..10] 62 3.14 Survey [0..10] 59 2.57 Survey [0..10] 61 2.34 Survey [0..10] 61w 2.60 Survey [0..10] 62 3.40 Survey [0..10] 61 6.03 Survey [0..10] 30 0.15 number 55 470 Average 36
Investment & Development 2017 Rank
Health infrastructure meets the needs of society
2017 Rank
Total public expenditure on education Percentage of GDP
ApprenticeshipsEmployee training is a high priority in companies
Readiness 2017 Rank
Educational assessment - PISA PISA survey of 15-year olds
Appeal
Personal security and private property rights are adequately protected
Percentage change
Student mobility inbound Foreign tertiary-level students per 1000 inhabitants
Labor force growth
University education meets the needs of a competitive economy
Management education meets the needs of the business community
Language skills are meeting the needs of enterprises
Competent senior managers are readily available
Educational system The educational system meets the needs of a competitive economy
Science in schools is sufficiently emphasized
Skilled labor is readily available
Finance skills are readily available
International experience of senior managers is generally significant
Remuneration of management Total base salary plus bonuses and long-term incentives, US$
Effective personal income tax rate Percentage of an income equal to GDP per capita
Quality of life is high
Foreign highly-skilled personnel are attracted to your country's business environment
Remuneration in services professions Gross annual income including supplements such as bonuses, US$
Attracting and retaining talents is a priority in companies
Worker motivation in companies is high
Brain drain (well-educated and skilled people) does not hinder competitiveness in your economy
Public expenditure on education per pupil Percentage of GDP per capita (secondary)
Pupil-teacher ratio (primary education)
CROATIA
Ratio of students to teaching staff
Pupil-teacher ratio (secondary education) Ratio of students to teaching staff
Are sufficiently implemented
Female labor force Percentage of total labor force
Cost-of-living index Index of a basket of goods & services in the main city, including housing (New York City = 100)
IMD World Talent Ranking 2017
OVERALL PERFORMANCE (63 countries)
55
50
53 53
60
3435 35
38
32
56 5657
5859
5654
5758
62
2013 2014 2015 2016 2017
Overall
Investment &Development
Appeal
Readiness
32
5960
62
Investment & Development
Appeal
Readiness
The direction of the triangle indicates the performance change from the last year: improved or stabledeclined
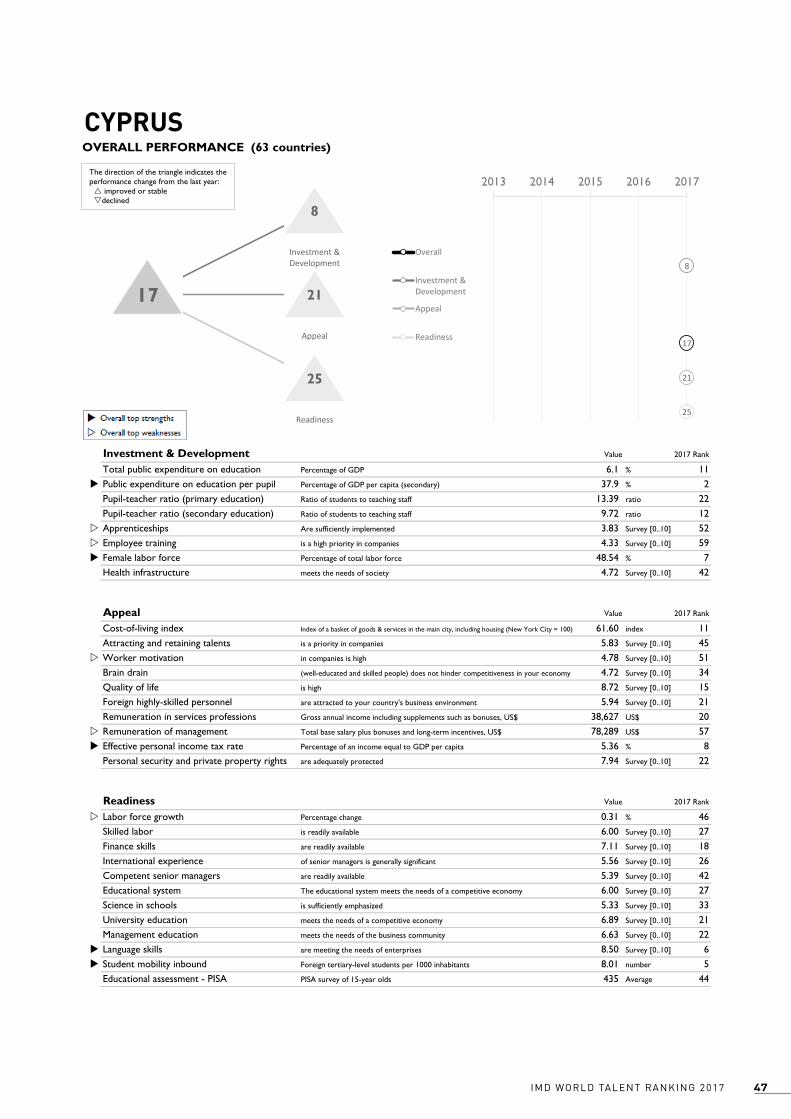
47IMD WORLD TALENT RANKING 2017
Alpha AlphaLabel Beta BetaLabel Gamma GammaLabel1 2 2 2 2 2 24 4 4 2 2
Value
6.1 % 11u 37.9 % 2 13.39 ratio 22 9.72 ratio 12w 3.83 Survey [0..10] 52w 4.33 Survey [0..10] 59u 48.54 % 7 4.72 Survey [0..10] 42
Value
61.60 index 11 5.83 Survey [0..10] 45w 4.78 Survey [0..10] 51 4.72 Survey [0..10] 34 8.72 Survey [0..10] 15 5.94 Survey [0..10] 21 38,627 US$ 20w 78,289 US$ 57u 5.36 % 8 7.94 Survey [0..10] 22
Value
w 0.31 % 46 6.00 Survey [0..10] 27 7.11 Survey [0..10] 18 5.56 Survey [0..10] 26 5.39 Survey [0..10] 42 6.00 Survey [0..10] 27 5.33 Survey [0..10] 33 6.89 Survey [0..10] 21 6.63 Survey [0..10] 22u 8.50 Survey [0..10] 6u 8.01 number 5 435 Average 44
Investment & Development 2017 Rank
Health infrastructure meets the needs of society
2017 Rank
Total public expenditure on education Percentage of GDP
ApprenticeshipsEmployee training is a high priority in companies
Readiness 2017 Rank
Educational assessment - PISA PISA survey of 15-year olds
Appeal
Personal security and private property rights are adequately protected
Percentage change
Student mobility inbound Foreign tertiary-level students per 1000 inhabitants
Labor force growth
University education meets the needs of a competitive economy
Management education meets the needs of the business community
Language skills are meeting the needs of enterprises
Competent senior managers are readily available
Educational system The educational system meets the needs of a competitive economy
Science in schools is sufficiently emphasized
Skilled labor is readily available
Finance skills are readily available
International experience of senior managers is generally significant
Remuneration of management Total base salary plus bonuses and long-term incentives, US$
Effective personal income tax rate Percentage of an income equal to GDP per capita
Quality of life is high
Foreign highly-skilled personnel are attracted to your country's business environment
Remuneration in services professions Gross annual income including supplements such as bonuses, US$
Attracting and retaining talents is a priority in companies
Worker motivation in companies is high
Brain drain (well-educated and skilled people) does not hinder competitiveness in your economy
Public expenditure on education per pupil Percentage of GDP per capita (secondary)
Pupil-teacher ratio (primary education)
CYPRUS
Ratio of students to teaching staff
Pupil-teacher ratio (secondary education) Ratio of students to teaching staff
Are sufficiently implemented
Female labor force Percentage of total labor force
Cost-of-living index Index of a basket of goods & services in the main city, including housing (New York City = 100)
IMD World Talent Ranking 2017
OVERALL PERFORMANCE (63 countries)
17
8
21
25
2013 2014 2015 2016 2017
Overall
Investment &Development
Appeal
Readiness
8
2117
25
Investment & Development
Appeal
Readiness
The direction of the triangle indicates the performance change from the last year: improved or stabledeclined
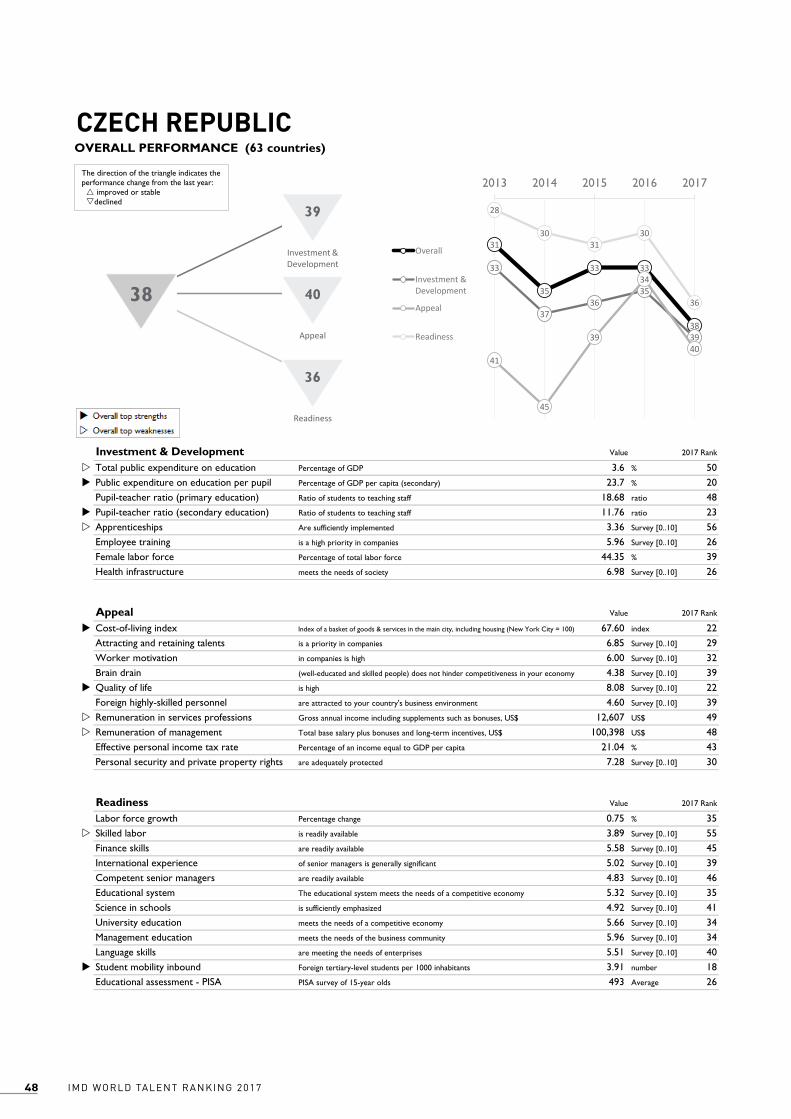
IMD WORLD TALENT RANKING 201748
Alpha AlphaLabel Beta BetaLabel Gamma GammaLabel1 2 2 2 2 2 24 4 4 2 2
Value
w 3.6 % 50u 23.7 % 20 18.68 ratio 48u 11.76 ratio 23w 3.36 Survey [0..10] 56 5.96 Survey [0..10] 26 44.35 % 39 6.98 Survey [0..10] 26
Value
u 67.60 index 22 6.85 Survey [0..10] 29 6.00 Survey [0..10] 32 4.38 Survey [0..10] 39u 8.08 Survey [0..10] 22 4.60 Survey [0..10] 39w 12,607 US$ 49w 100,398 US$ 48 21.04 % 43 7.28 Survey [0..10] 30
Value
0.75 % 35w 3.89 Survey [0..10] 55 5.58 Survey [0..10] 45 5.02 Survey [0..10] 39 4.83 Survey [0..10] 46 5.32 Survey [0..10] 35 4.92 Survey [0..10] 41 5.66 Survey [0..10] 34 5.96 Survey [0..10] 34 5.51 Survey [0..10] 40u 3.91 number 18 493 Average 26
Investment & Development 2017 Rank
Health infrastructure meets the needs of society
2017 Rank
Total public expenditure on education Percentage of GDP
ApprenticeshipsEmployee training is a high priority in companies
Readiness 2017 Rank
Educational assessment - PISA PISA survey of 15-year olds
Appeal
Personal security and private property rights are adequately protected
Percentage change
Student mobility inbound Foreign tertiary-level students per 1000 inhabitants
Labor force growth
University education meets the needs of a competitive economy
Management education meets the needs of the business community
Language skills are meeting the needs of enterprises
Competent senior managers are readily available
Educational system The educational system meets the needs of a competitive economy
Science in schools is sufficiently emphasized
Skilled labor is readily available
Finance skills are readily available
International experience of senior managers is generally significant
Remuneration of management Total base salary plus bonuses and long-term incentives, US$
Effective personal income tax rate Percentage of an income equal to GDP per capita
Quality of life is high
Foreign highly-skilled personnel are attracted to your country's business environment
Remuneration in services professions Gross annual income including supplements such as bonuses, US$
Attracting and retaining talents is a priority in companies
Worker motivation in companies is high
Brain drain (well-educated and skilled people) does not hinder competitiveness in your economy
Public expenditure on education per pupil Percentage of GDP per capita (secondary)
Pupil-teacher ratio (primary education)
CZECH REPUBLIC
Ratio of students to teaching staff
Pupil-teacher ratio (secondary education) Ratio of students to teaching staff
Are sufficiently implemented
Female labor force Percentage of total labor force
Cost-of-living index Index of a basket of goods & services in the main city, including housing (New York City = 100)
IMD World Talent Ranking 2017
OVERALL PERFORMANCE (63 countries)
31
35
33 33
38
33
3736
35
39
41
45
39
34
40
28
3031
30
36
2013 2014 2015 2016 2017
Overall
Investment &Development
Appeal
Readiness
39
4038
36
Investment & Development
Appeal
Readiness
The direction of the triangle indicates the performance change from the last year: improved or stabledeclined
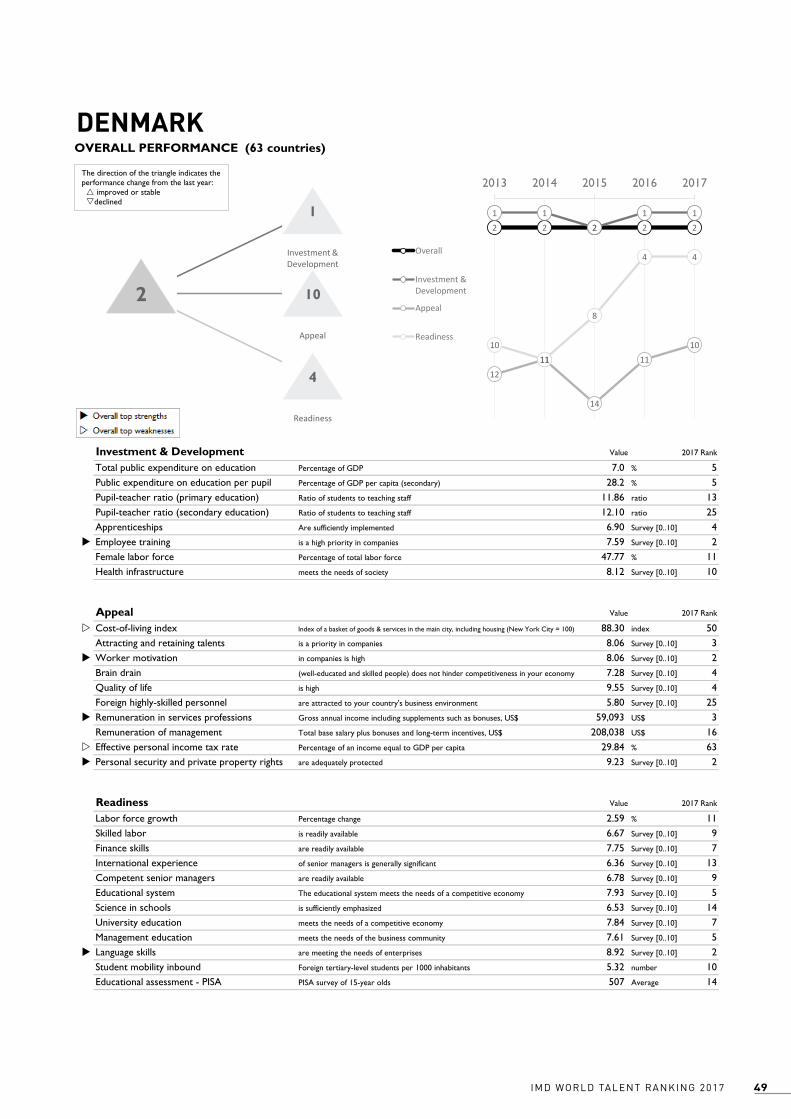
49IMD WORLD TALENT RANKING 2017
Alpha AlphaLabel Beta BetaLabel Gamma GammaLabel1 2 2 2 2 2 24 4 4 2 2
Value
7.0 % 5 28.2 % 5 11.86 ratio 13 12.10 ratio 25 6.90 Survey [0..10] 4u 7.59 Survey [0..10] 2 47.77 % 11 8.12 Survey [0..10] 10
Value
w 88.30 index 50 8.06 Survey [0..10] 3u 8.06 Survey [0..10] 2 7.28 Survey [0..10] 4 9.55 Survey [0..10] 4 5.80 Survey [0..10] 25u 59,093 US$ 3 208,038 US$ 16w 29.84 % 63u 9.23 Survey [0..10] 2
Value
2.59 % 11 6.67 Survey [0..10] 9 7.75 Survey [0..10] 7 6.36 Survey [0..10] 13 6.78 Survey [0..10] 9 7.93 Survey [0..10] 5 6.53 Survey [0..10] 14 7.84 Survey [0..10] 7 7.61 Survey [0..10] 5u 8.92 Survey [0..10] 2 5.32 number 10 507 Average 14
Investment & Development 2017 Rank
Health infrastructure meets the needs of society
2017 Rank
Total public expenditure on education Percentage of GDP
ApprenticeshipsEmployee training is a high priority in companies
Readiness 2017 Rank
Educational assessment - PISA PISA survey of 15-year olds
Appeal
Personal security and private property rights are adequately protected
Percentage change
Student mobility inbound Foreign tertiary-level students per 1000 inhabitants
Labor force growth
University education meets the needs of a competitive economy
Management education meets the needs of the business community
Language skills are meeting the needs of enterprises
Competent senior managers are readily available
Educational system The educational system meets the needs of a competitive economy
Science in schools is sufficiently emphasized
Skilled labor is readily available
Finance skills are readily available
International experience of senior managers is generally significant
Remuneration of management Total base salary plus bonuses and long-term incentives, US$
Effective personal income tax rate Percentage of an income equal to GDP per capita
Quality of life is high
Foreign highly-skilled personnel are attracted to your country's business environment
Remuneration in services professions Gross annual income including supplements such as bonuses, US$
Attracting and retaining talents is a priority in companies
Worker motivation in companies is high
Brain drain (well-educated and skilled people) does not hinder competitiveness in your economy
Public expenditure on education per pupil Percentage of GDP per capita (secondary)
Pupil-teacher ratio (primary education)
DENMARK
Ratio of students to teaching staff
Pupil-teacher ratio (secondary education) Ratio of students to teaching staff
Are sufficiently implemented
Female labor force Percentage of total labor force
Cost-of-living index Index of a basket of goods & services in the main city, including housing (New York City = 100)
IMD World Talent Ranking 2017
OVERALL PERFORMANCE (63 countries)
2 2 2 2 21 1
21 1
1211
14
111010
11
8
4 4
2013 2014 2015 2016 2017
Overall
Investment &Development
Appeal
Readiness
1
102
4
Investment & Development
Appeal
Readiness
The direction of the triangle indicates the performance change from the last year: improved or stabledeclined

IMD WORLD TALENT RANKING 201750
Alpha AlphaLabel Beta BetaLabel Gamma GammaLabel1 2 2 2 2 2 24 4 4 2 2
Value
5.6 % 15 23.1 % 23 12.89 ratio 20 12.18 ratio 27 4.85 Survey [0..10] 25u 6.92 Survey [0..10] 8u 48.57 % 6 5.28 Survey [0..10] 36
Value
u 63.60 index 15u 7.57 Survey [0..10] 9 5.87 Survey [0..10] 34w 3.67 Survey [0..10] 51 6.20 Survey [0..10] 36 4.26 Survey [0..10] 45 13,655 US$ 44w 91,060 US$ 50 15.75 % 26 7.34 Survey [0..10] 29
Value
1.16 % 24w 3.25 Survey [0..10] 62w 4.89 Survey [0..10] 58 4.66 Survey [0..10] 50w 3.64 Survey [0..10] 57 6.23 Survey [0..10] 24 6.37 Survey [0..10] 16 6.79 Survey [0..10] 22 6.10 Survey [0..10] 31 6.52 Survey [0..10] 29 2.18 number 30u 527 Average 5
Investment & Development 2017 Rank
Health infrastructure meets the needs of society
2017 Rank
Total public expenditure on education Percentage of GDP
ApprenticeshipsEmployee training is a high priority in companies
Readiness 2017 Rank
Educational assessment - PISA PISA survey of 15-year olds
Appeal
Personal security and private property rights are adequately protected
Percentage change
Student mobility inbound Foreign tertiary-level students per 1000 inhabitants
Labor force growth
University education meets the needs of a competitive economy
Management education meets the needs of the business community
Language skills are meeting the needs of enterprises
Competent senior managers are readily available
Educational system The educational system meets the needs of a competitive economy
Science in schools is sufficiently emphasized
Skilled labor is readily available
Finance skills are readily available
International experience of senior managers is generally significant
Remuneration of management Total base salary plus bonuses and long-term incentives, US$
Effective personal income tax rate Percentage of an income equal to GDP per capita
Quality of life is high
Foreign highly-skilled personnel are attracted to your country's business environment
Remuneration in services professions Gross annual income including supplements such as bonuses, US$
Attracting and retaining talents is a priority in companies
Worker motivation in companies is high
Brain drain (well-educated and skilled people) does not hinder competitiveness in your economy
Public expenditure on education per pupil Percentage of GDP per capita (secondary)
Pupil-teacher ratio (primary education)
ESTONIA
Ratio of students to teaching staff
Pupil-teacher ratio (secondary education) Ratio of students to teaching staff
Are sufficiently implemented
Female labor force Percentage of total labor force
Cost-of-living index Index of a basket of goods & services in the main city, including housing (New York City = 100)
IMD World Talent Ranking 2017
OVERALL PERFORMANCE (63 countries)
28 27 2826
29
9
12 12 13 14
43
40 40
35
38
50
39
42
34 35
2013 2014 2015 2016 2017
Overall
Investment &Development
Appeal
Readiness
14
3829
35
Investment & Development
Appeal
Readiness
The direction of the triangle indicates the performance change from the last year: improved or stabledeclined
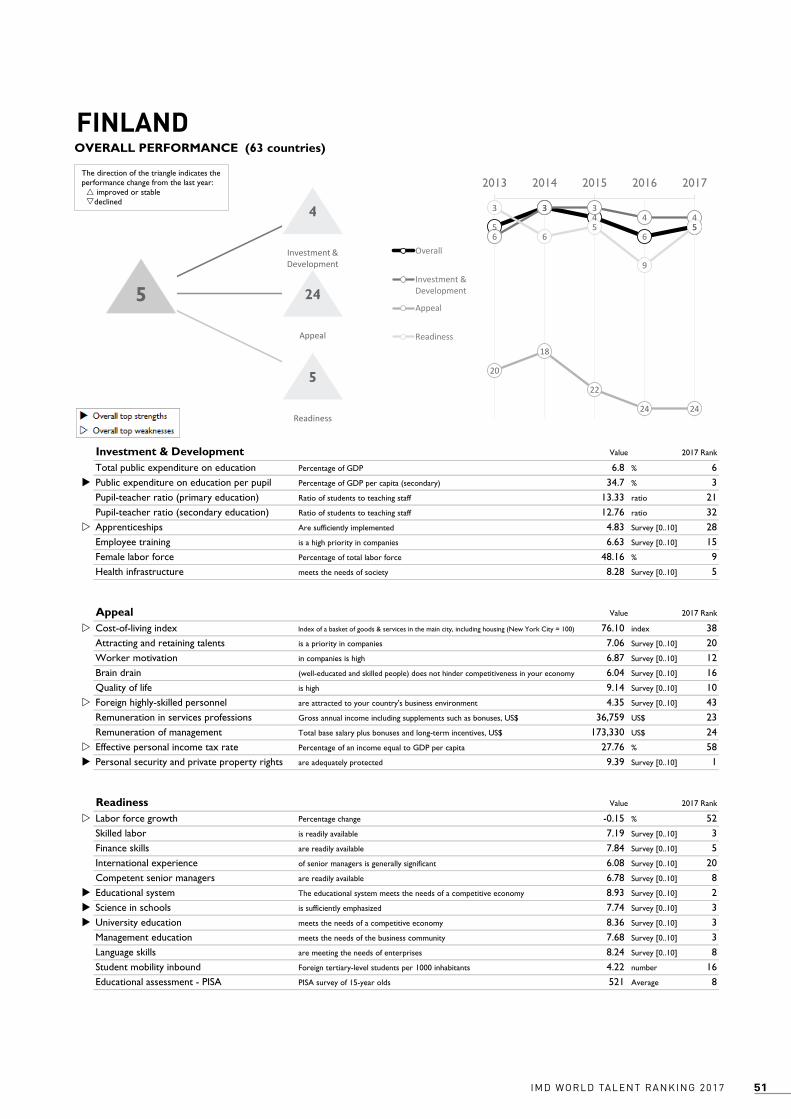
51IMD WORLD TALENT RANKING 2017
Alpha AlphaLabel Beta BetaLabel Gamma GammaLabel1 2 2 2 2 2 24 4 4 2 2
Value
6.8 % 6u 34.7 % 3 13.33 ratio 21 12.76 ratio 32w 4.83 Survey [0..10] 28 6.63 Survey [0..10] 15 48.16 % 9 8.28 Survey [0..10] 5
Value
w 76.10 index 38 7.06 Survey [0..10] 20 6.87 Survey [0..10] 12 6.04 Survey [0..10] 16 9.14 Survey [0..10] 10w 4.35 Survey [0..10] 43 36,759 US$ 23 173,330 US$ 24w 27.76 % 58u 9.39 Survey [0..10] 1
Value
w -0.15 % 52 7.19 Survey [0..10] 3 7.84 Survey [0..10] 5 6.08 Survey [0..10] 20 6.78 Survey [0..10] 8u 8.93 Survey [0..10] 2u 7.74 Survey [0..10] 3u 8.36 Survey [0..10] 3 7.68 Survey [0..10] 3 8.24 Survey [0..10] 8 4.22 number 16 521 Average 8
Investment & Development 2017 Rank
Health infrastructure meets the needs of society
2017 Rank
Total public expenditure on education Percentage of GDP
ApprenticeshipsEmployee training is a high priority in companies
Readiness 2017 Rank
Educational assessment - PISA PISA survey of 15-year olds
Appeal
Personal security and private property rights are adequately protected
Percentage change
Student mobility inbound Foreign tertiary-level students per 1000 inhabitants
Labor force growth
University education meets the needs of a competitive economy
Management education meets the needs of the business community
Language skills are meeting the needs of enterprises
Competent senior managers are readily available
Educational system The educational system meets the needs of a competitive economy
Science in schools is sufficiently emphasized
Skilled labor is readily available
Finance skills are readily available
International experience of senior managers is generally significant
Remuneration of management Total base salary plus bonuses and long-term incentives, US$
Effective personal income tax rate Percentage of an income equal to GDP per capita
Quality of life is high
Foreign highly-skilled personnel are attracted to your country's business environment
Remuneration in services professions Gross annual income including supplements such as bonuses, US$
Attracting and retaining talents is a priority in companies
Worker motivation in companies is high
Brain drain (well-educated and skilled people) does not hinder competitiveness in your economy
Public expenditure on education per pupil Percentage of GDP per capita (secondary)
Pupil-teacher ratio (primary education)
FINLAND
Ratio of students to teaching staff
Pupil-teacher ratio (secondary education) Ratio of students to teaching staff
Are sufficiently implemented
Female labor force Percentage of total labor force
Cost-of-living index Index of a basket of goods & services in the main city, including housing (New York City = 100)
IMD World Talent Ranking 2017
OVERALL PERFORMANCE (63 countries)
5
34
65
6
3 34 4
20
18
22
24 24
3
65
9
5
2013 2014 2015 2016 2017
Overall
Investment &Development
Appeal
Readiness
4
245
5
Investment & Development
Appeal
Readiness
The direction of the triangle indicates the performance change from the last year: improved or stabledeclined

IMD WORLD TALENT RANKING 201752
Alpha AlphaLabel Beta BetaLabel Gamma GammaLabel1 2 2 2 2 2 24 4 4 2 2
Value
5.5 % 16u 26.8 % 7w 19.42 ratio 51 12.90 ratio 34w 3.69 Survey [0..10] 53 5.39 Survey [0..10] 38u 48.13 % 10u 8.28 Survey [0..10] 6
Value
80.20 index 46 6.51 Survey [0..10] 39 5.00 Survey [0..10] 50 5.29 Survey [0..10] 27 8.25 Survey [0..10] 21 4.98 Survey [0..10] 33 38,787 US$ 19u 247,183 US$ 7w 24.20 % 50 7.78 Survey [0..10] 25
Value
0.26 % 48 6.30 Survey [0..10] 18 6.81 Survey [0..10] 24w 4.50 Survey [0..10] 54 5.76 Survey [0..10] 28 6.43 Survey [0..10] 22u 6.59 Survey [0..10] 11 6.41 Survey [0..10] 26 6.18 Survey [0..10] 30w 4.14 Survey [0..10] 52 3.56 number 21 494 Average 24
Investment & Development 2017 Rank
Health infrastructure meets the needs of society
2017 Rank
Total public expenditure on education Percentage of GDP
ApprenticeshipsEmployee training is a high priority in companies
Readiness 2017 Rank
Educational assessment - PISA PISA survey of 15-year olds
Appeal
Personal security and private property rights are adequately protected
Percentage change
Student mobility inbound Foreign tertiary-level students per 1000 inhabitants
Labor force growth
University education meets the needs of a competitive economy
Management education meets the needs of the business community
Language skills are meeting the needs of enterprises
Competent senior managers are readily available
Educational system The educational system meets the needs of a competitive economy
Science in schools is sufficiently emphasized
Skilled labor is readily available
Finance skills are readily available
International experience of senior managers is generally significant
Remuneration of management Total base salary plus bonuses and long-term incentives, US$
Effective personal income tax rate Percentage of an income equal to GDP per capita
Quality of life is high
Foreign highly-skilled personnel are attracted to your country's business environment
Remuneration in services professions Gross annual income including supplements such as bonuses, US$
Attracting and retaining talents is a priority in companies
Worker motivation in companies is high
Brain drain (well-educated and skilled people) does not hinder competitiveness in your economy
Public expenditure on education per pupil Percentage of GDP per capita (secondary)
Pupil-teacher ratio (primary education)
FRANCE
Ratio of students to teaching staff
Pupil-teacher ratio (secondary education) Ratio of students to teaching staff
Are sufficiently implemented
Female labor force Percentage of total labor force
Cost-of-living index Index of a basket of goods & services in the main city, including housing (New York City = 100)
IMD World Talent Ranking 2017
OVERALL PERFORMANCE (63 countries)
2120
25
2827
1817
22
24
20
25
22
30 3029
25 25 25
2928
2013 2014 2015 2016 2017
Overall
Investment &Development
Appeal
Readiness
20
2927
28
Investment & Development
Appeal
Readiness
The direction of the triangle indicates the performance change from the last year: improved or stabledeclined

53IMD WORLD TALENT RANKING 2017
Alpha AlphaLabel Beta BetaLabel Gamma GammaLabel1 2 2 2 2 2 24 4 4 2 2
Value
w 4.2 % 37 23.7 % 19 15.44 ratio 29 13.29 ratio 39u 8.48 Survey [0..10] 2u 7.44 Survey [0..10] 4 46.41 % 29u 8.26 Survey [0..10] 7
Value
74.10 index 34 7.48 Survey [0..10] 13 7.09 Survey [0..10] 10 6.28 Survey [0..10] 12u 9.22 Survey [0..10] 8 6.53 Survey [0..10] 16 42,280 US$ 15u 289,253 US$ 3w 27.12 % 55 8.37 Survey [0..10] 14
Value
2.32 % 13 5.97 Survey [0..10] 28 6.88 Survey [0..10] 23 6.62 Survey [0..10] 11 5.99 Survey [0..10] 22 7.71 Survey [0..10] 9 6.24 Survey [0..10] 17 7.72 Survey [0..10] 9 6.95 Survey [0..10] 16 6.95 Survey [0..10] 24w 2.81 number 24 508 Average 13
Investment & Development 2017 Rank
Health infrastructure meets the needs of society
2017 Rank
Total public expenditure on education Percentage of GDP
ApprenticeshipsEmployee training is a high priority in companies
Readiness 2017 Rank
Educational assessment - PISA PISA survey of 15-year olds
Appeal
Personal security and private property rights are adequately protected
Percentage change
Student mobility inbound Foreign tertiary-level students per 1000 inhabitants
Labor force growth
University education meets the needs of a competitive economy
Management education meets the needs of the business community
Language skills are meeting the needs of enterprises
Competent senior managers are readily available
Educational system The educational system meets the needs of a competitive economy
Science in schools is sufficiently emphasized
Skilled labor is readily available
Finance skills are readily available
International experience of senior managers is generally significant
Remuneration of management Total base salary plus bonuses and long-term incentives, US$
Effective personal income tax rate Percentage of an income equal to GDP per capita
Quality of life is high
Foreign highly-skilled personnel are attracted to your country's business environment
Remuneration in services professions Gross annual income including supplements such as bonuses, US$
Attracting and retaining talents is a priority in companies
Worker motivation in companies is high
Brain drain (well-educated and skilled people) does not hinder competitiveness in your economy
Public expenditure on education per pupil Percentage of GDP per capita (secondary)
Pupil-teacher ratio (primary education)
GERMANY
Ratio of students to teaching staff
Pupil-teacher ratio (secondary education) Ratio of students to teaching staff
Are sufficiently implemented
Female labor force Percentage of total labor force
Cost-of-living index Index of a basket of goods & services in the main city, including housing (New York City = 100)
IMD World Talent Ranking 2017
OVERALL PERFORMANCE (63 countries)
9
5
910
8
1314 14
1110
43
4
98
18
12
15
18
15
2013 2014 2015 2016 2017
Overall
Investment &Development
Appeal
Readiness
10
88
15
Investment & Development
Appeal
Readiness
The direction of the triangle indicates the performance change from the last year: improved or stabledeclined
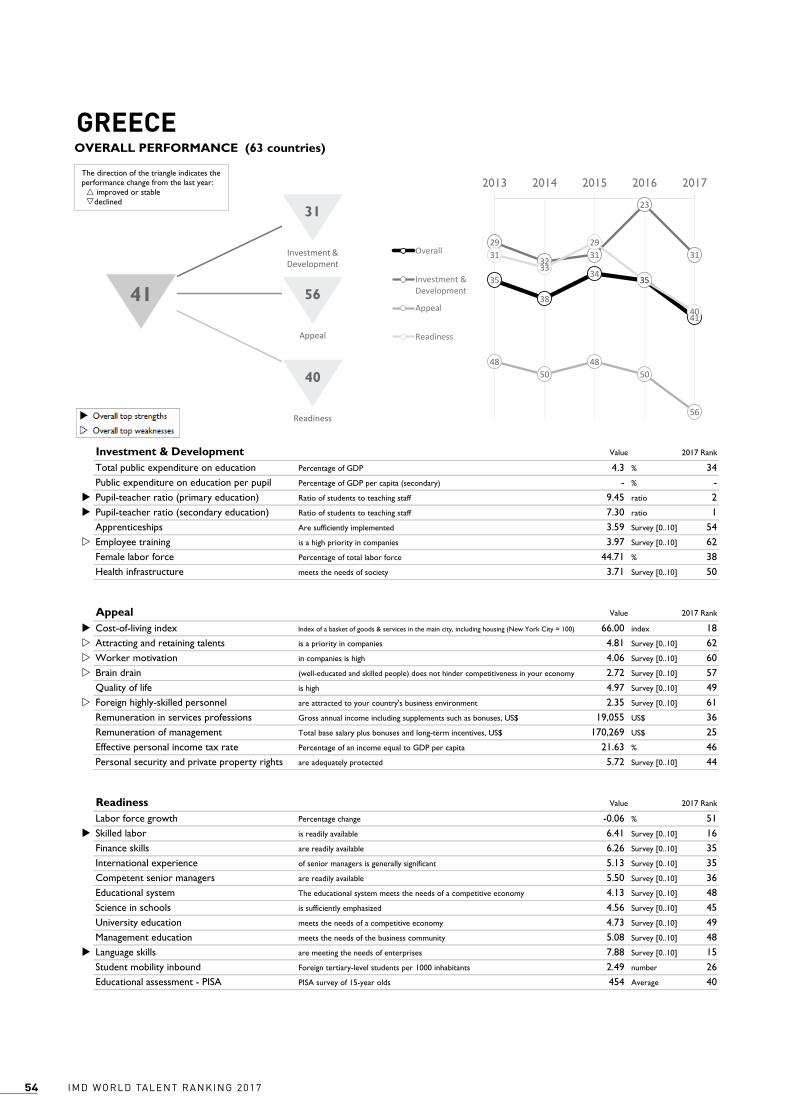
IMD WORLD TALENT RANKING 201754
Alpha AlphaLabel Beta BetaLabel Gamma GammaLabel1 2 2 2 2 2 24 4 4 2 2
Value
4.3 % 34 - % -u 9.45 ratio 2u 7.30 ratio 1 3.59 Survey [0..10] 54w 3.97 Survey [0..10] 62 44.71 % 38 3.71 Survey [0..10] 50
Value
u 66.00 index 18w 4.81 Survey [0..10] 62w 4.06 Survey [0..10] 60w 2.72 Survey [0..10] 57 4.97 Survey [0..10] 49w 2.35 Survey [0..10] 61 19,055 US$ 36 170,269 US$ 25 21.63 % 46 5.72 Survey [0..10] 44
Value
-0.06 % 51u 6.41 Survey [0..10] 16 6.26 Survey [0..10] 35 5.13 Survey [0..10] 35 5.50 Survey [0..10] 36 4.13 Survey [0..10] 48 4.56 Survey [0..10] 45 4.73 Survey [0..10] 49 5.08 Survey [0..10] 48u 7.88 Survey [0..10] 15 2.49 number 26 454 Average 40
Investment & Development 2017 Rank
Health infrastructure meets the needs of society
2017 Rank
Total public expenditure on education Percentage of GDP
ApprenticeshipsEmployee training is a high priority in companies
Readiness 2017 Rank
Educational assessment - PISA PISA survey of 15-year olds
Appeal
Personal security and private property rights are adequately protected
Percentage change
Student mobility inbound Foreign tertiary-level students per 1000 inhabitants
Labor force growth
University education meets the needs of a competitive economy
Management education meets the needs of the business community
Language skills are meeting the needs of enterprises
Competent senior managers are readily available
Educational system The educational system meets the needs of a competitive economy
Science in schools is sufficiently emphasized
Skilled labor is readily available
Finance skills are readily available
International experience of senior managers is generally significant
Remuneration of management Total base salary plus bonuses and long-term incentives, US$
Effective personal income tax rate Percentage of an income equal to GDP per capita
Quality of life is high
Foreign highly-skilled personnel are attracted to your country's business environment
Remuneration in services professions Gross annual income including supplements such as bonuses, US$
Attracting and retaining talents is a priority in companies
Worker motivation in companies is high
Brain drain (well-educated and skilled people) does not hinder competitiveness in your economy
Public expenditure on education per pupil Percentage of GDP per capita (secondary)
Pupil-teacher ratio (primary education)
GREECE
Ratio of students to teaching staff
Pupil-teacher ratio (secondary education) Ratio of students to teaching staff
Are sufficiently implemented
Female labor force Percentage of total labor force
Cost-of-living index Index of a basket of goods & services in the main city, including housing (New York City = 100)
IMD World Talent Ranking 2017
OVERALL PERFORMANCE (63 countries)
35
38
3435
41
29
3231
23
31
4850
4850
56
3133
29
35
40
2013 2014 2015 2016 2017
Overall
Investment &Development
Appeal
Readiness
31
5641
40
Investment & Development
Appeal
Readiness
The direction of the triangle indicates the performance change from the last year: improved or stabledeclined
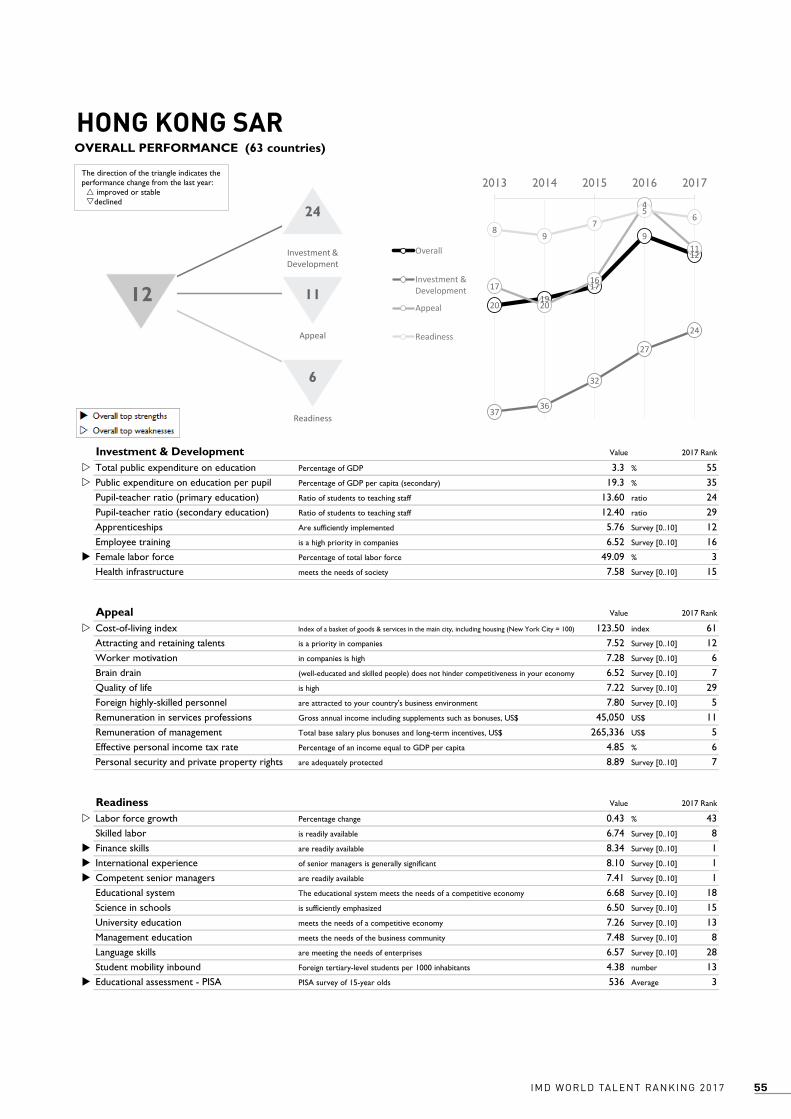
55IMD WORLD TALENT RANKING 2017
Alpha AlphaLabel Beta BetaLabel Gamma GammaLabel1 2 2 2 2 2 24 4 4 2 2
Value
w 3.3 % 55w 19.3 % 35 13.60 ratio 24 12.40 ratio 29 5.76 Survey [0..10] 12 6.52 Survey [0..10] 16u 49.09 % 3 7.58 Survey [0..10] 15
Value
w 123.50 index 61 7.52 Survey [0..10] 12 7.28 Survey [0..10] 6 6.52 Survey [0..10] 7 7.22 Survey [0..10] 29 7.80 Survey [0..10] 5 45,050 US$ 11 265,336 US$ 5 4.85 % 6 8.89 Survey [0..10] 7
Value
w 0.43 % 43 6.74 Survey [0..10] 8u 8.34 Survey [0..10] 1u 8.10 Survey [0..10] 1u 7.41 Survey [0..10] 1 6.68 Survey [0..10] 18 6.50 Survey [0..10] 15 7.26 Survey [0..10] 13 7.48 Survey [0..10] 8 6.57 Survey [0..10] 28 4.38 number 13u 536 Average 3
Investment & Development 2017 Rank
Health infrastructure meets the needs of society
2017 Rank
Total public expenditure on education Percentage of GDP
ApprenticeshipsEmployee training is a high priority in companies
Readiness 2017 Rank
Educational assessment - PISA PISA survey of 15-year olds
Appeal
Personal security and private property rights are adequately protected
Percentage change
Student mobility inbound Foreign tertiary-level students per 1000 inhabitants
Labor force growth
University education meets the needs of a competitive economy
Management education meets the needs of the business community
Language skills are meeting the needs of enterprises
Competent senior managers are readily available
Educational system The educational system meets the needs of a competitive economy
Science in schools is sufficiently emphasized
Skilled labor is readily available
Finance skills are readily available
International experience of senior managers is generally significant
Remuneration of management Total base salary plus bonuses and long-term incentives, US$
Effective personal income tax rate Percentage of an income equal to GDP per capita
Quality of life is high
Foreign highly-skilled personnel are attracted to your country's business environment
Remuneration in services professions Gross annual income including supplements such as bonuses, US$
Attracting and retaining talents is a priority in companies
Worker motivation in companies is high
Brain drain (well-educated and skilled people) does not hinder competitiveness in your economy
Public expenditure on education per pupil Percentage of GDP per capita (secondary)
Pupil-teacher ratio (primary education)
HONG KONG SAR
Ratio of students to teaching staff
Pupil-teacher ratio (secondary education) Ratio of students to teaching staff
Are sufficiently implemented
Female labor force Percentage of total labor force
Cost-of-living index Index of a basket of goods & services in the main city, including housing (New York City = 100)
IMD World Talent Ranking 2017
OVERALL PERFORMANCE (63 countries)
2019
17
9
12
3736
32
27
24
17
20
16
4
11
89
75
6
2013 2014 2015 2016 2017
Overall
Investment &Development
Appeal
Readiness
24
1112
6
Investment & Development
Appeal
Readiness
The direction of the triangle indicates the performance change from the last year: improved or stabledeclined
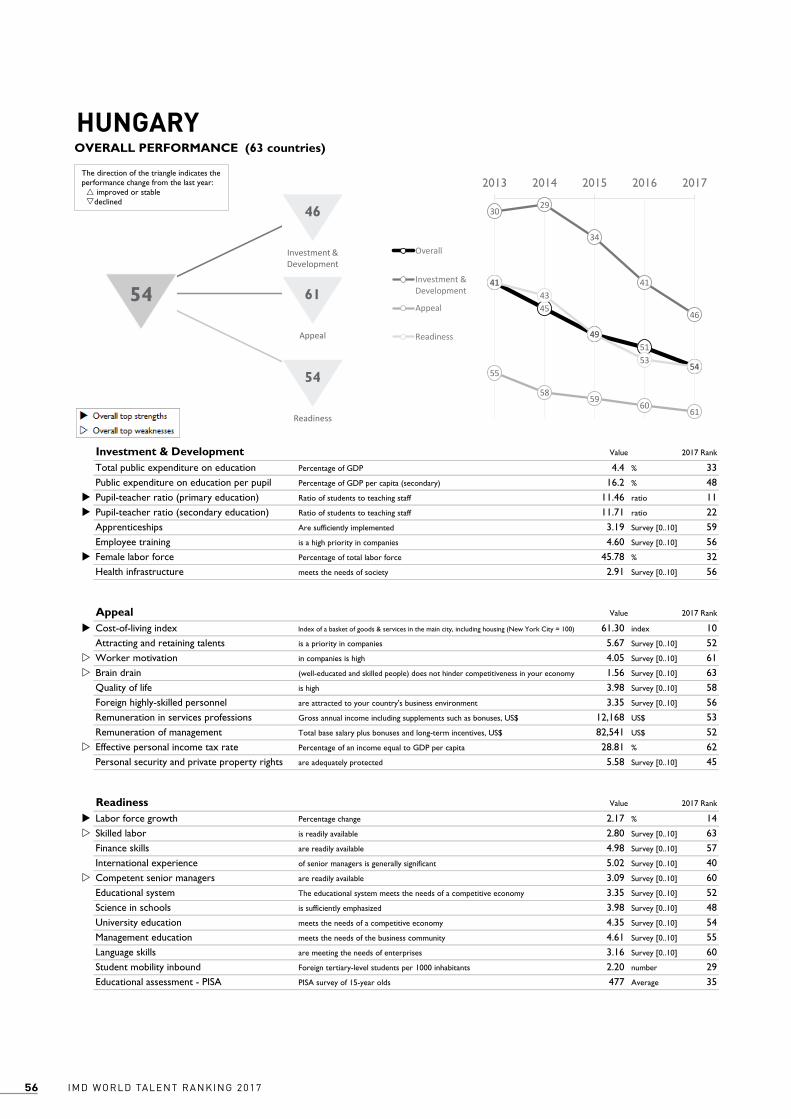
IMD WORLD TALENT RANKING 201756
Alpha AlphaLabel Beta BetaLabel Gamma GammaLabel1 2 2 2 2 2 24 4 4 2 2
Value
4.4 % 33 16.2 % 48u 11.46 ratio 11u 11.71 ratio 22 3.19 Survey [0..10] 59 4.60 Survey [0..10] 56u 45.78 % 32 2.91 Survey [0..10] 56
Value
u 61.30 index 10 5.67 Survey [0..10] 52w 4.05 Survey [0..10] 61w 1.56 Survey [0..10] 63 3.98 Survey [0..10] 58 3.35 Survey [0..10] 56 12,168 US$ 53 82,541 US$ 52w 28.81 % 62 5.58 Survey [0..10] 45
Value
u 2.17 % 14w 2.80 Survey [0..10] 63 4.98 Survey [0..10] 57 5.02 Survey [0..10] 40w 3.09 Survey [0..10] 60 3.35 Survey [0..10] 52 3.98 Survey [0..10] 48 4.35 Survey [0..10] 54 4.61 Survey [0..10] 55 3.16 Survey [0..10] 60 2.20 number 29 477 Average 35
Investment & Development 2017 Rank
Health infrastructure meets the needs of society
2017 Rank
Total public expenditure on education Percentage of GDP
ApprenticeshipsEmployee training is a high priority in companies
Readiness 2017 Rank
Educational assessment - PISA PISA survey of 15-year olds
Appeal
Personal security and private property rights are adequately protected
Percentage change
Student mobility inbound Foreign tertiary-level students per 1000 inhabitants
Labor force growth
University education meets the needs of a competitive economy
Management education meets the needs of the business community
Language skills are meeting the needs of enterprises
Competent senior managers are readily available
Educational system The educational system meets the needs of a competitive economy
Science in schools is sufficiently emphasized
Skilled labor is readily available
Finance skills are readily available
International experience of senior managers is generally significant
Remuneration of management Total base salary plus bonuses and long-term incentives, US$
Effective personal income tax rate Percentage of an income equal to GDP per capita
Quality of life is high
Foreign highly-skilled personnel are attracted to your country's business environment
Remuneration in services professions Gross annual income including supplements such as bonuses, US$
Attracting and retaining talents is a priority in companies
Worker motivation in companies is high
Brain drain (well-educated and skilled people) does not hinder competitiveness in your economy
Public expenditure on education per pupil Percentage of GDP per capita (secondary)
Pupil-teacher ratio (primary education)
HUNGARY
Ratio of students to teaching staff
Pupil-teacher ratio (secondary education) Ratio of students to teaching staff
Are sufficiently implemented
Female labor force Percentage of total labor force
Cost-of-living index Index of a basket of goods & services in the main city, including housing (New York City = 100)
IMD World Talent Ranking 2017
OVERALL PERFORMANCE (63 countries)
41
45
4951
54
3029
34
41
46
55
5859
6061
4143
49
5354
2013 2014 2015 2016 2017
Overall
Investment &Development
Appeal
Readiness
46
6154
54
Investment & Development
Appeal
Readiness
The direction of the triangle indicates the performance change from the last year: improved or stabledeclined

57IMD WORLD TALENT RANKING 2017
Alpha AlphaLabel Beta BetaLabel Gamma GammaLabel1 2 2 2 2 2 24 4 4 2 2
Value
u 7.6 % 2w 18.3 % 38u 10.43 ratio 5 11.10 ratio 18w 4.47 Survey [0..10] 40 5.62 Survey [0..10] 32 46.88 % 18 6.68 Survey [0..10] 27
Value
- index - 7.07 Survey [0..10] 19 6.86 Survey [0..10] 13 6.25 Survey [0..10] 13u 9.30 Survey [0..10] 6w 4.36 Survey [0..10] 42 43,467 US$ 14w 79,743 US$ 56 16.38 % 29 8.03 Survey [0..10] 18
Value
u 2.68 % 10 6.03 Survey [0..10] 26 6.77 Survey [0..10] 26w 4.49 Survey [0..10] 55 5.75 Survey [0..10] 29 7.00 Survey [0..10] 15 5.61 Survey [0..10] 27 6.65 Survey [0..10] 23 6.84 Survey [0..10] 20u 8.32 Survey [0..10] 7 3.84 number 20 481 Average 33
Investment & Development 2017 Rank
Health infrastructure meets the needs of society
2017 Rank
Total public expenditure on education Percentage of GDP
ApprenticeshipsEmployee training is a high priority in companies
Readiness 2017 Rank
Educational assessment - PISA PISA survey of 15-year olds
Appeal
Personal security and private property rights are adequately protected
Percentage change
Student mobility inbound Foreign tertiary-level students per 1000 inhabitants
Labor force growth
University education meets the needs of a competitive economy
Management education meets the needs of the business community
Language skills are meeting the needs of enterprises
Competent senior managers are readily available
Educational system The educational system meets the needs of a competitive economy
Science in schools is sufficiently emphasized
Skilled labor is readily available
Finance skills are readily available
International experience of senior managers is generally significant
Remuneration of management Total base salary plus bonuses and long-term incentives, US$
Effective personal income tax rate Percentage of an income equal to GDP per capita
Quality of life is high
Foreign highly-skilled personnel are attracted to your country's business environment
Remuneration in services professions Gross annual income including supplements such as bonuses, US$
Attracting and retaining talents is a priority in companies
Worker motivation in companies is high
Brain drain (well-educated and skilled people) does not hinder competitiveness in your economy
Public expenditure on education per pupil Percentage of GDP per capita (secondary)
Pupil-teacher ratio (primary education)
ICELAND
Ratio of students to teaching staff
Pupil-teacher ratio (secondary education) Ratio of students to teaching staff
Are sufficiently implemented
Female labor force Percentage of total labor force
Cost-of-living index Index of a basket of goods & services in the main city, including housing (New York City = 100)
IMD World Talent Ranking 2017
OVERALL PERFORMANCE (63 countries)
1615 15
18 18
8 8
1112
11
28
31
24
20 20
24
13
1817
21
2013 2014 2015 2016 2017
Overall
Investment &Development
Appeal
Readiness
11
2018
21
Investment & Development
Appeal
Readiness
The direction of the triangle indicates the performance change from the last year: improved or stabledeclined
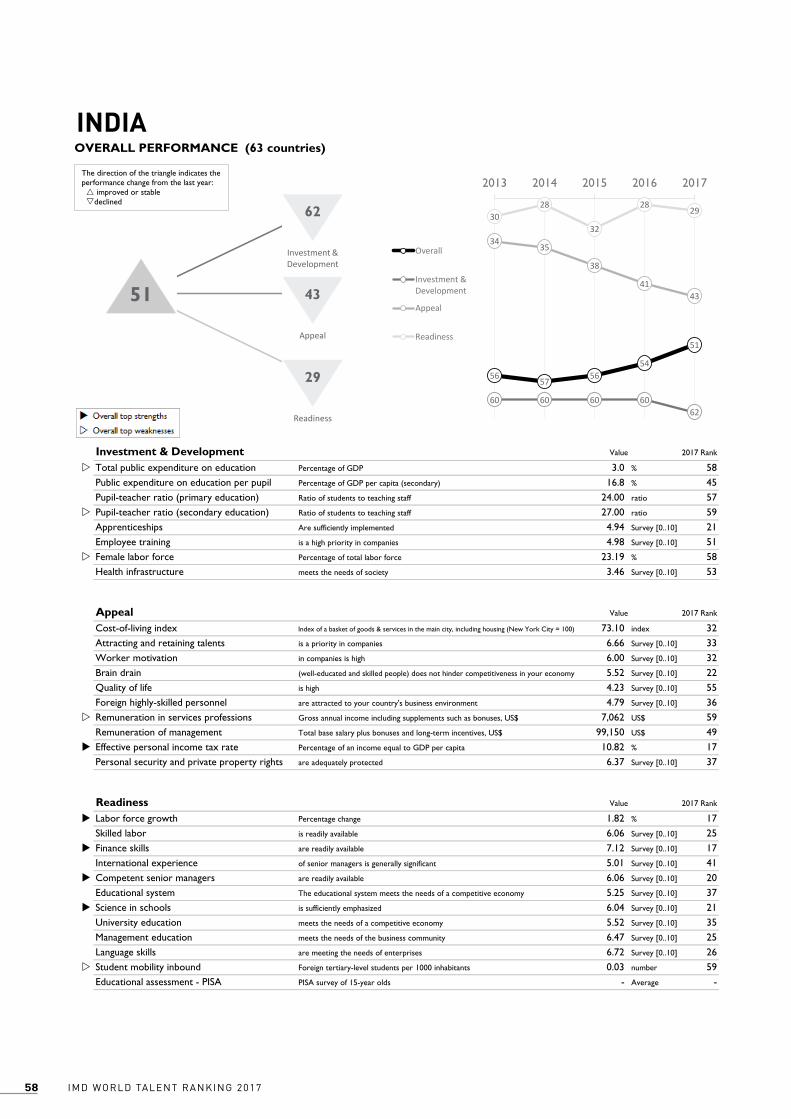
IMD WORLD TALENT RANKING 201758
Alpha AlphaLabel Beta BetaLabel Gamma GammaLabel1 2 2 2 2 2 24 4 4 2 2
Value
w 3.0 % 58 16.8 % 45 24.00 ratio 57w 27.00 ratio 59 4.94 Survey [0..10] 21 4.98 Survey [0..10] 51w 23.19 % 58 3.46 Survey [0..10] 53
Value
73.10 index 32 6.66 Survey [0..10] 33 6.00 Survey [0..10] 32 5.52 Survey [0..10] 22 4.23 Survey [0..10] 55 4.79 Survey [0..10] 36w 7,062 US$ 59 99,150 US$ 49u 10.82 % 17 6.37 Survey [0..10] 37
Value
u 1.82 % 17 6.06 Survey [0..10] 25u 7.12 Survey [0..10] 17 5.01 Survey [0..10] 41u 6.06 Survey [0..10] 20 5.25 Survey [0..10] 37u 6.04 Survey [0..10] 21 5.52 Survey [0..10] 35 6.47 Survey [0..10] 25 6.72 Survey [0..10] 26w 0.03 number 59 - Average -
Investment & Development 2017 Rank
Health infrastructure meets the needs of society
2017 Rank
Total public expenditure on education Percentage of GDP
ApprenticeshipsEmployee training is a high priority in companies
Readiness 2017 Rank
Educational assessment - PISA PISA survey of 15-year olds
Appeal
Personal security and private property rights are adequately protected
Percentage change
Student mobility inbound Foreign tertiary-level students per 1000 inhabitants
Labor force growth
University education meets the needs of a competitive economy
Management education meets the needs of the business community
Language skills are meeting the needs of enterprises
Competent senior managers are readily available
Educational system The educational system meets the needs of a competitive economy
Science in schools is sufficiently emphasized
Skilled labor is readily available
Finance skills are readily available
International experience of senior managers is generally significant
Remuneration of management Total base salary plus bonuses and long-term incentives, US$
Effective personal income tax rate Percentage of an income equal to GDP per capita
Quality of life is high
Foreign highly-skilled personnel are attracted to your country's business environment
Remuneration in services professions Gross annual income including supplements such as bonuses, US$
Attracting and retaining talents is a priority in companies
Worker motivation in companies is high
Brain drain (well-educated and skilled people) does not hinder competitiveness in your economy
Public expenditure on education per pupil Percentage of GDP per capita (secondary)
Pupil-teacher ratio (primary education)
INDIA
Ratio of students to teaching staff
Pupil-teacher ratio (secondary education) Ratio of students to teaching staff
Are sufficiently implemented
Female labor force Percentage of total labor force
Cost-of-living index Index of a basket of goods & services in the main city, including housing (New York City = 100)
IMD World Talent Ranking 2017
OVERALL PERFORMANCE (63 countries)
5657
5654
51
60 60 60 6062
3435
38
4143
3028
32
2829
2013 2014 2015 2016 2017
Overall
Investment &Development
Appeal
Readiness
62
4351
29
Investment & Development
Appeal
Readiness
The direction of the triangle indicates the performance change from the last year: improved or stabledeclined
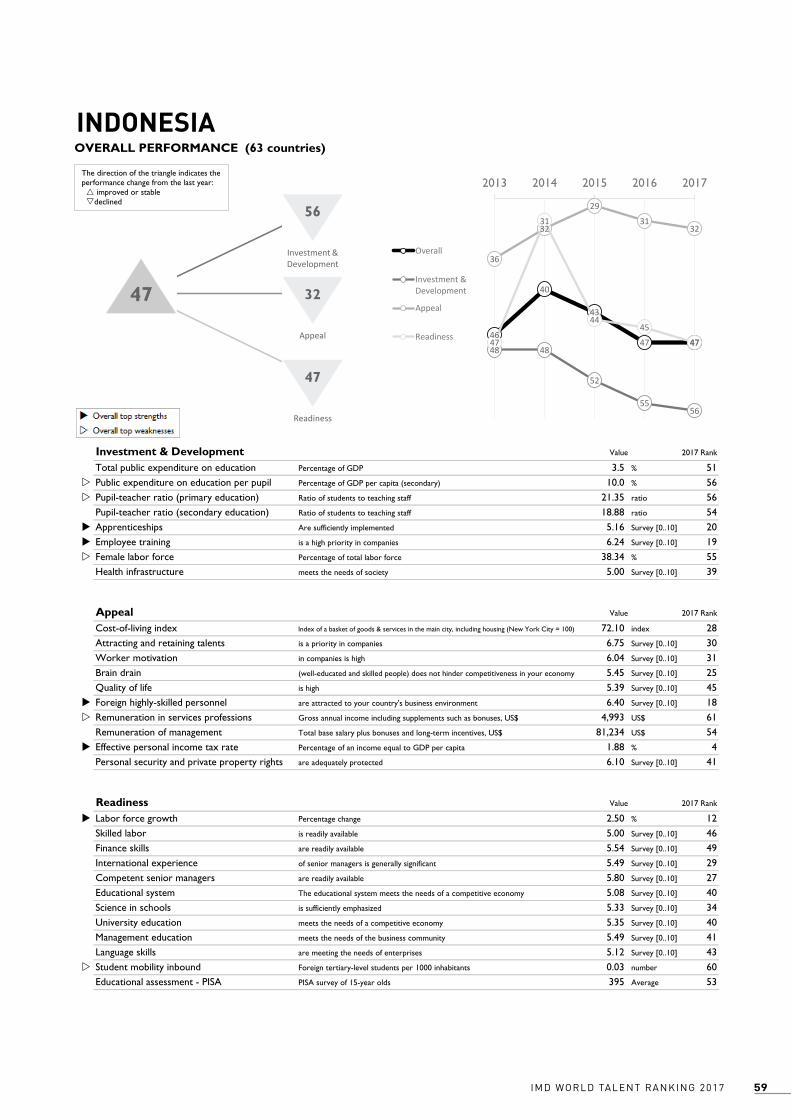
59IMD WORLD TALENT RANKING 2017
Alpha AlphaLabel Beta BetaLabel Gamma GammaLabel1 2 2 2 2 2 24 4 4 2 2
Value
3.5 % 51w 10.0 % 56w 21.35 ratio 56 18.88 ratio 54u 5.16 Survey [0..10] 20u 6.24 Survey [0..10] 19w 38.34 % 55 5.00 Survey [0..10] 39
Value
72.10 index 28 6.75 Survey [0..10] 30 6.04 Survey [0..10] 31 5.45 Survey [0..10] 25 5.39 Survey [0..10] 45u 6.40 Survey [0..10] 18w 4,993 US$ 61 81,234 US$ 54u 1.88 % 4 6.10 Survey [0..10] 41
Value
u 2.50 % 12 5.00 Survey [0..10] 46 5.54 Survey [0..10] 49 5.49 Survey [0..10] 29 5.80 Survey [0..10] 27 5.08 Survey [0..10] 40 5.33 Survey [0..10] 34 5.35 Survey [0..10] 40 5.49 Survey [0..10] 41 5.12 Survey [0..10] 43w 0.03 number 60 395 Average 53
Investment & Development 2017 Rank
Health infrastructure meets the needs of society
2017 Rank
Total public expenditure on education Percentage of GDP
ApprenticeshipsEmployee training is a high priority in companies
Readiness 2017 Rank
Educational assessment - PISA PISA survey of 15-year olds
Appeal
Personal security and private property rights are adequately protected
Percentage change
Student mobility inbound Foreign tertiary-level students per 1000 inhabitants
Labor force growth
University education meets the needs of a competitive economy
Management education meets the needs of the business community
Language skills are meeting the needs of enterprises
Competent senior managers are readily available
Educational system The educational system meets the needs of a competitive economy
Science in schools is sufficiently emphasized
Skilled labor is readily available
Finance skills are readily available
International experience of senior managers is generally significant
Remuneration of management Total base salary plus bonuses and long-term incentives, US$
Effective personal income tax rate Percentage of an income equal to GDP per capita
Quality of life is high
Foreign highly-skilled personnel are attracted to your country's business environment
Remuneration in services professions Gross annual income including supplements such as bonuses, US$
Attracting and retaining talents is a priority in companies
Worker motivation in companies is high
Brain drain (well-educated and skilled people) does not hinder competitiveness in your economy
Public expenditure on education per pupil Percentage of GDP per capita (secondary)
Pupil-teacher ratio (primary education)
INDONESIA
Ratio of students to teaching staff
Pupil-teacher ratio (secondary education) Ratio of students to teaching staff
Are sufficiently implemented
Female labor force Percentage of total labor force
Cost-of-living index Index of a basket of goods & services in the main city, including housing (New York City = 100)
IMD World Talent Ranking 2017
OVERALL PERFORMANCE (63 countries)
46
40
43
47 4748 48
52
5556
36
32
29
3132
47
31
4445
47
2013 2014 2015 2016 2017
Overall
Investment &Development
Appeal
Readiness
56
3247
47
Investment & Development
Appeal
Readiness
The direction of the triangle indicates the performance change from the last year: improved or stabledeclined
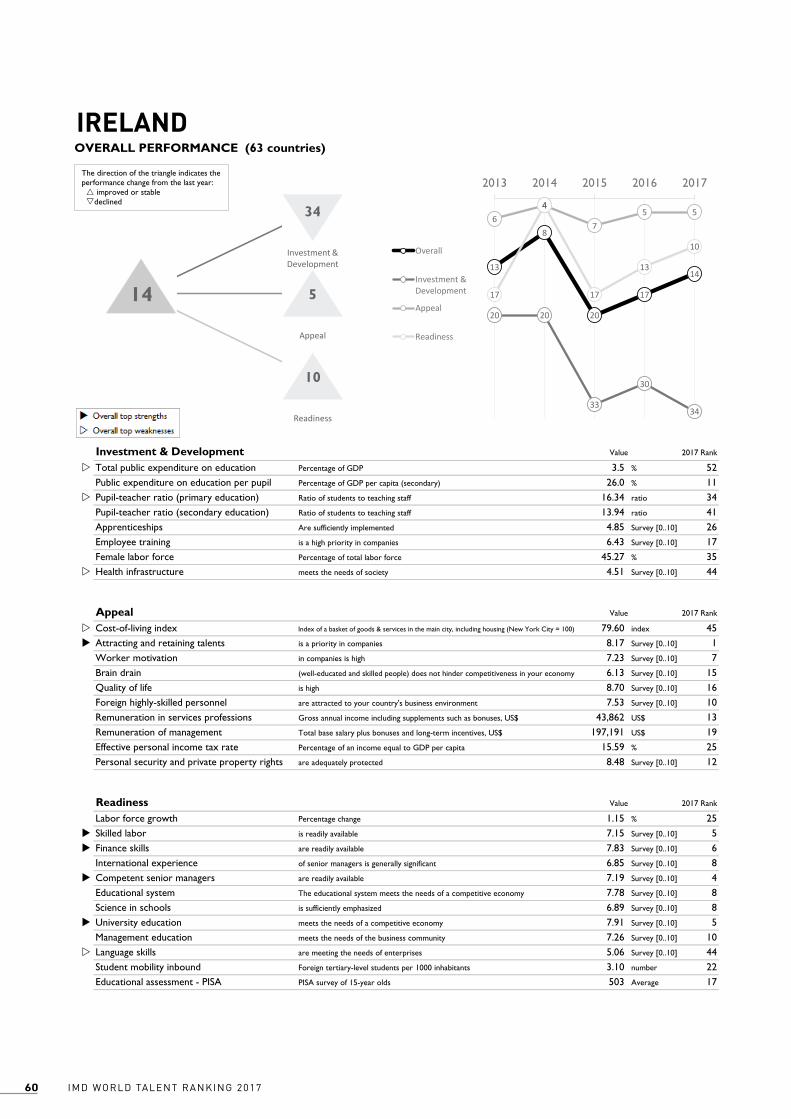
IMD WORLD TALENT RANKING 201760
Alpha AlphaLabel Beta BetaLabel Gamma GammaLabel1 2 2 2 2 2 24 4 4 2 2
Value
w 3.5 % 52 26.0 % 11w 16.34 ratio 34 13.94 ratio 41 4.85 Survey [0..10] 26 6.43 Survey [0..10] 17 45.27 % 35w 4.51 Survey [0..10] 44
Value
w 79.60 index 45u 8.17 Survey [0..10] 1 7.23 Survey [0..10] 7 6.13 Survey [0..10] 15 8.70 Survey [0..10] 16 7.53 Survey [0..10] 10 43,862 US$ 13 197,191 US$ 19 15.59 % 25 8.48 Survey [0..10] 12
Value
1.15 % 25u 7.15 Survey [0..10] 5u 7.83 Survey [0..10] 6 6.85 Survey [0..10] 8u 7.19 Survey [0..10] 4 7.78 Survey [0..10] 8 6.89 Survey [0..10] 8u 7.91 Survey [0..10] 5 7.26 Survey [0..10] 10w 5.06 Survey [0..10] 44 3.10 number 22 503 Average 17
Investment & Development 2017 Rank
Health infrastructure meets the needs of society
2017 Rank
Total public expenditure on education Percentage of GDP
ApprenticeshipsEmployee training is a high priority in companies
Readiness 2017 Rank
Educational assessment - PISA PISA survey of 15-year olds
Appeal
Personal security and private property rights are adequately protected
Percentage change
Student mobility inbound Foreign tertiary-level students per 1000 inhabitants
Labor force growth
University education meets the needs of a competitive economy
Management education meets the needs of the business community
Language skills are meeting the needs of enterprises
Competent senior managers are readily available
Educational system The educational system meets the needs of a competitive economy
Science in schools is sufficiently emphasized
Skilled labor is readily available
Finance skills are readily available
International experience of senior managers is generally significant
Remuneration of management Total base salary plus bonuses and long-term incentives, US$
Effective personal income tax rate Percentage of an income equal to GDP per capita
Quality of life is high
Foreign highly-skilled personnel are attracted to your country's business environment
Remuneration in services professions Gross annual income including supplements such as bonuses, US$
Attracting and retaining talents is a priority in companies
Worker motivation in companies is high
Brain drain (well-educated and skilled people) does not hinder competitiveness in your economy
Public expenditure on education per pupil Percentage of GDP per capita (secondary)
Pupil-teacher ratio (primary education)
IRELAND
Ratio of students to teaching staff
Pupil-teacher ratio (secondary education) Ratio of students to teaching staff
Are sufficiently implemented
Female labor force Percentage of total labor force
Cost-of-living index Index of a basket of goods & services in the main city, including housing (New York City = 100)
IMD World Talent Ranking 2017
OVERALL PERFORMANCE (63 countries)
13
8
20
17
14
20 20
33
30
34
64
75 5
17
4
17
13
10
2013 2014 2015 2016 2017
Overall
Investment &Development
Appeal
Readiness
34
514
10
Investment & Development
Appeal
Readiness
The direction of the triangle indicates the performance change from the last year: improved or stabledeclined
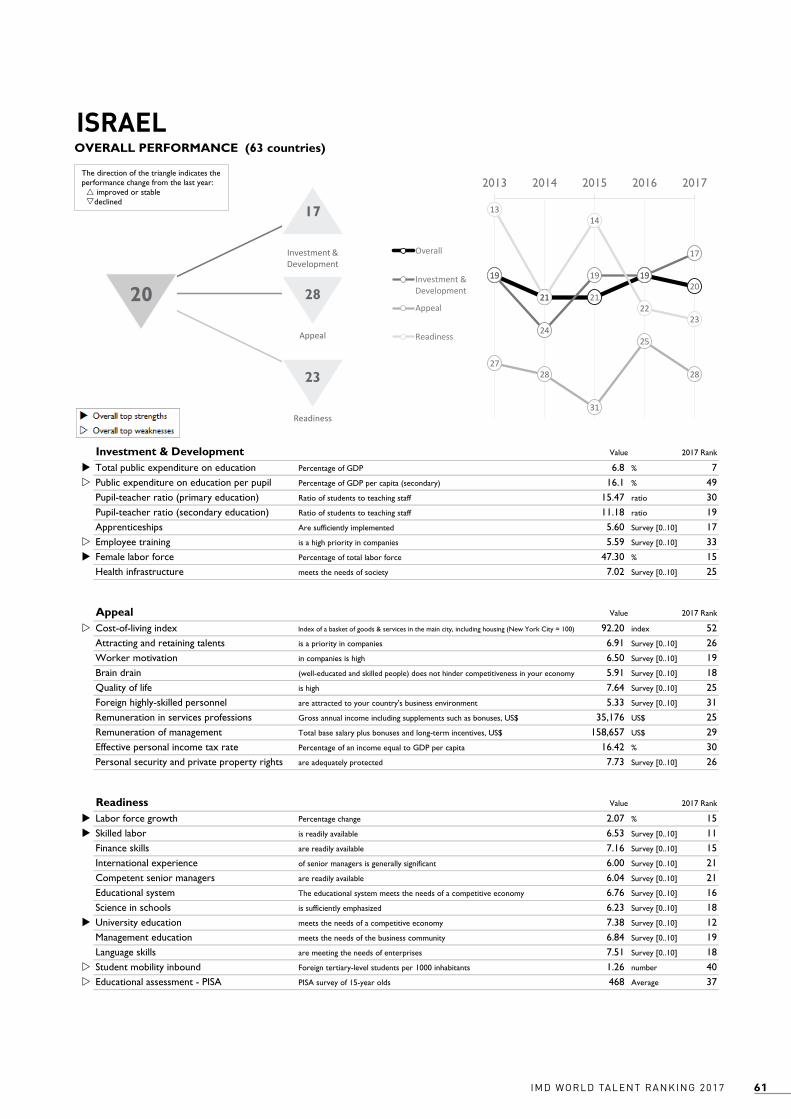
61IMD WORLD TALENT RANKING 2017
Alpha AlphaLabel Beta BetaLabel Gamma GammaLabel1 2 2 2 2 2 24 4 4 2 2
Value
u 6.8 % 7w 16.1 % 49 15.47 ratio 30 11.18 ratio 19 5.60 Survey [0..10] 17w 5.59 Survey [0..10] 33u 47.30 % 15 7.02 Survey [0..10] 25
Value
w 92.20 index 52 6.91 Survey [0..10] 26 6.50 Survey [0..10] 19 5.91 Survey [0..10] 18 7.64 Survey [0..10] 25 5.33 Survey [0..10] 31 35,176 US$ 25 158,657 US$ 29 16.42 % 30 7.73 Survey [0..10] 26
Value
u 2.07 % 15u 6.53 Survey [0..10] 11 7.16 Survey [0..10] 15 6.00 Survey [0..10] 21 6.04 Survey [0..10] 21 6.76 Survey [0..10] 16 6.23 Survey [0..10] 18u 7.38 Survey [0..10] 12 6.84 Survey [0..10] 19 7.51 Survey [0..10] 18w 1.26 number 40w 468 Average 37
Investment & Development 2017 Rank
Health infrastructure meets the needs of society
2017 Rank
Total public expenditure on education Percentage of GDP
ApprenticeshipsEmployee training is a high priority in companies
Readiness 2017 Rank
Educational assessment - PISA PISA survey of 15-year olds
Appeal
Personal security and private property rights are adequately protected
Percentage change
Student mobility inbound Foreign tertiary-level students per 1000 inhabitants
Labor force growth
University education meets the needs of a competitive economy
Management education meets the needs of the business community
Language skills are meeting the needs of enterprises
Competent senior managers are readily available
Educational system The educational system meets the needs of a competitive economy
Science in schools is sufficiently emphasized
Skilled labor is readily available
Finance skills are readily available
International experience of senior managers is generally significant
Remuneration of management Total base salary plus bonuses and long-term incentives, US$
Effective personal income tax rate Percentage of an income equal to GDP per capita
Quality of life is high
Foreign highly-skilled personnel are attracted to your country's business environment
Remuneration in services professions Gross annual income including supplements such as bonuses, US$
Attracting and retaining talents is a priority in companies
Worker motivation in companies is high
Brain drain (well-educated and skilled people) does not hinder competitiveness in your economy
Public expenditure on education per pupil Percentage of GDP per capita (secondary)
Pupil-teacher ratio (primary education)
ISRAEL
Ratio of students to teaching staff
Pupil-teacher ratio (secondary education) Ratio of students to teaching staff
Are sufficiently implemented
Female labor force Percentage of total labor force
Cost-of-living index Index of a basket of goods & services in the main city, including housing (New York City = 100)
IMD World Talent Ranking 2017
OVERALL PERFORMANCE (63 countries)
19
21 21
1920
19
24
19 19
17
2728
31
25
28
13
21
14
2223
2013 2014 2015 2016 2017
Overall
Investment &Development
Appeal
Readiness
17
2820
23
Investment & Development
Appeal
Readiness
The direction of the triangle indicates the performance change from the last year: improved or stabledeclined
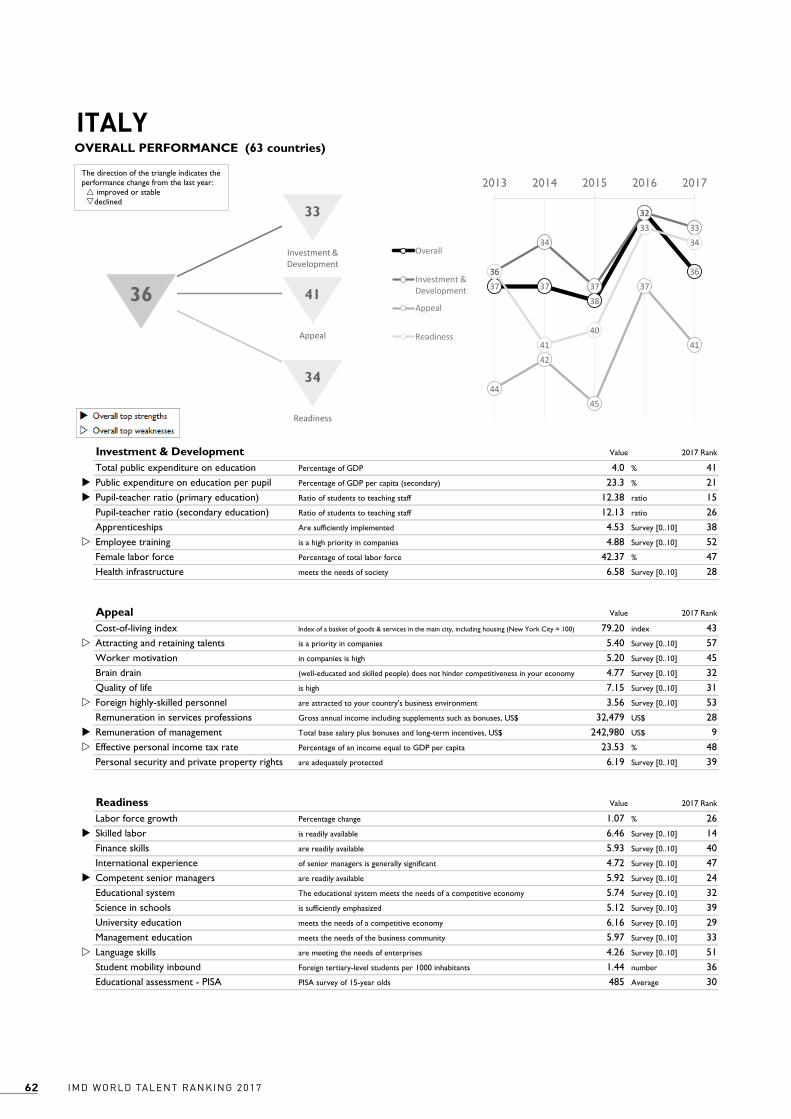
IMD WORLD TALENT RANKING 201762
Alpha AlphaLabel Beta BetaLabel Gamma GammaLabel1 2 2 2 2 2 24 4 4 2 2
Value
4.0 % 41u 23.3 % 21u 12.38 ratio 15 12.13 ratio 26 4.53 Survey [0..10] 38w 4.88 Survey [0..10] 52 42.37 % 47 6.58 Survey [0..10] 28
Value
79.20 index 43w 5.40 Survey [0..10] 57 5.20 Survey [0..10] 45 4.77 Survey [0..10] 32 7.15 Survey [0..10] 31w 3.56 Survey [0..10] 53 32,479 US$ 28u 242,980 US$ 9w 23.53 % 48 6.19 Survey [0..10] 39
Value
1.07 % 26u 6.46 Survey [0..10] 14 5.93 Survey [0..10] 40 4.72 Survey [0..10] 47u 5.92 Survey [0..10] 24 5.74 Survey [0..10] 32 5.12 Survey [0..10] 39 6.16 Survey [0..10] 29 5.97 Survey [0..10] 33w 4.26 Survey [0..10] 51 1.44 number 36 485 Average 30
Investment & Development 2017 Rank
Health infrastructure meets the needs of society
2017 Rank
Total public expenditure on education Percentage of GDP
ApprenticeshipsEmployee training is a high priority in companies
Readiness 2017 Rank
Educational assessment - PISA PISA survey of 15-year olds
Appeal
Personal security and private property rights are adequately protected
Percentage change
Student mobility inbound Foreign tertiary-level students per 1000 inhabitants
Labor force growth
University education meets the needs of a competitive economy
Management education meets the needs of the business community
Language skills are meeting the needs of enterprises
Competent senior managers are readily available
Educational system The educational system meets the needs of a competitive economy
Science in schools is sufficiently emphasized
Skilled labor is readily available
Finance skills are readily available
International experience of senior managers is generally significant
Remuneration of management Total base salary plus bonuses and long-term incentives, US$
Effective personal income tax rate Percentage of an income equal to GDP per capita
Quality of life is high
Foreign highly-skilled personnel are attracted to your country's business environment
Remuneration in services professions Gross annual income including supplements such as bonuses, US$
Attracting and retaining talents is a priority in companies
Worker motivation in companies is high
Brain drain (well-educated and skilled people) does not hinder competitiveness in your economy
Public expenditure on education per pupil Percentage of GDP per capita (secondary)
Pupil-teacher ratio (primary education)
ITALY
Ratio of students to teaching staff
Pupil-teacher ratio (secondary education) Ratio of students to teaching staff
Are sufficiently implemented
Female labor force Percentage of total labor force
Cost-of-living index Index of a basket of goods & services in the main city, including housing (New York City = 100)
IMD World Talent Ranking 2017
OVERALL PERFORMANCE (63 countries)
37 3738
32
3636
34
37
3233
44
42
45
37
41
36
4140
3334
2013 2014 2015 2016 2017
Overall
Investment &Development
Appeal
Readiness
33
4136
34
Investment & Development
Appeal
Readiness
The direction of the triangle indicates the performance change from the last year: improved or stabledeclined
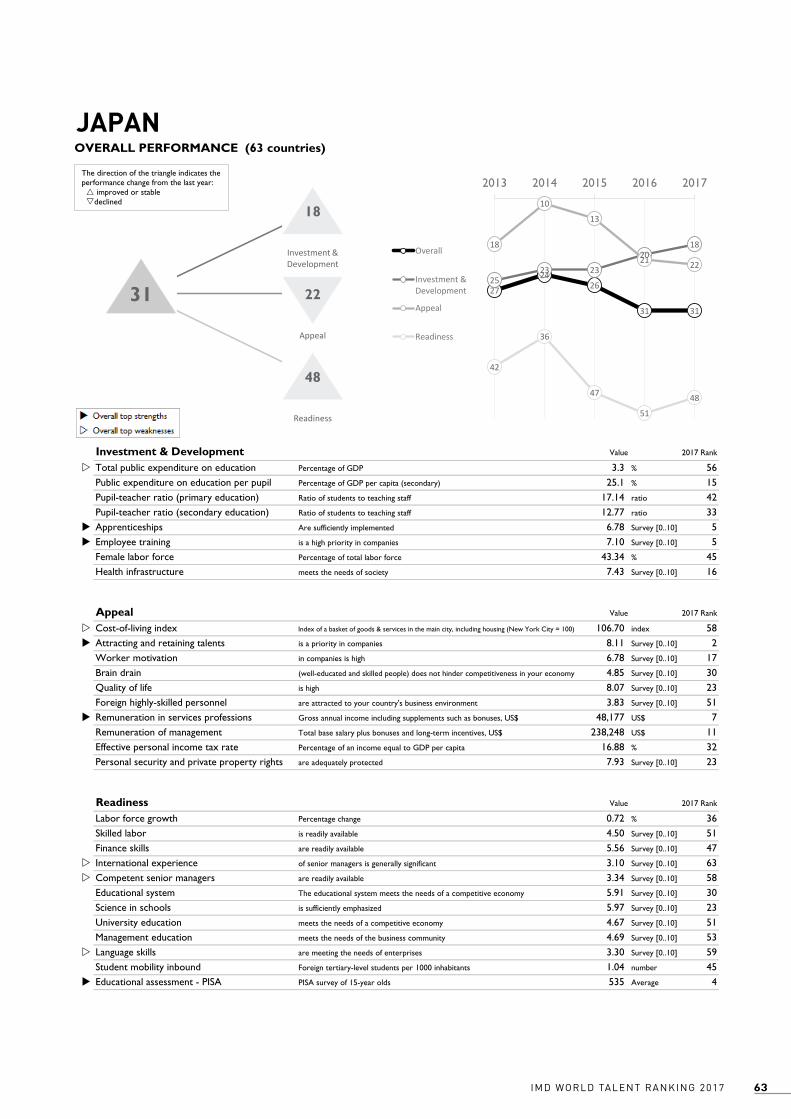
63IMD WORLD TALENT RANKING 2017
Alpha AlphaLabel Beta BetaLabel Gamma GammaLabel1 2 2 2 2 2 24 4 4 2 2
Value
w 3.3 % 56 25.1 % 15 17.14 ratio 42 12.77 ratio 33u 6.78 Survey [0..10] 5u 7.10 Survey [0..10] 5 43.34 % 45 7.43 Survey [0..10] 16
Value
w 106.70 index 58u 8.11 Survey [0..10] 2 6.78 Survey [0..10] 17 4.85 Survey [0..10] 30 8.07 Survey [0..10] 23 3.83 Survey [0..10] 51u 48,177 US$ 7 238,248 US$ 11 16.88 % 32 7.93 Survey [0..10] 23
Value
0.72 % 36 4.50 Survey [0..10] 51 5.56 Survey [0..10] 47w 3.10 Survey [0..10] 63w 3.34 Survey [0..10] 58 5.91 Survey [0..10] 30 5.97 Survey [0..10] 23 4.67 Survey [0..10] 51 4.69 Survey [0..10] 53w 3.30 Survey [0..10] 59 1.04 number 45u 535 Average 4
Investment & Development 2017 Rank
Health infrastructure meets the needs of society
2017 Rank
Total public expenditure on education Percentage of GDP
ApprenticeshipsEmployee training is a high priority in companies
Readiness 2017 Rank
Educational assessment - PISA PISA survey of 15-year olds
Appeal
Personal security and private property rights are adequately protected
Percentage change
Student mobility inbound Foreign tertiary-level students per 1000 inhabitants
Labor force growth
University education meets the needs of a competitive economy
Management education meets the needs of the business community
Language skills are meeting the needs of enterprises
Competent senior managers are readily available
Educational system The educational system meets the needs of a competitive economy
Science in schools is sufficiently emphasized
Skilled labor is readily available
Finance skills are readily available
International experience of senior managers is generally significant
Remuneration of management Total base salary plus bonuses and long-term incentives, US$
Effective personal income tax rate Percentage of an income equal to GDP per capita
Quality of life is high
Foreign highly-skilled personnel are attracted to your country's business environment
Remuneration in services professions Gross annual income including supplements such as bonuses, US$
Attracting and retaining talents is a priority in companies
Worker motivation in companies is high
Brain drain (well-educated and skilled people) does not hinder competitiveness in your economy
Public expenditure on education per pupil Percentage of GDP per capita (secondary)
Pupil-teacher ratio (primary education)
JAPAN
Ratio of students to teaching staff
Pupil-teacher ratio (secondary education) Ratio of students to teaching staff
Are sufficiently implemented
Female labor force Percentage of total labor force
Cost-of-living index Index of a basket of goods & services in the main city, including housing (New York City = 100)
IMD World Talent Ranking 2017
OVERALL PERFORMANCE (63 countries)
27
2426
31 31
2523 23
201818
10
13
21 22
42
36
47
51
48
2013 2014 2015 2016 2017
Overall
Investment &Development
Appeal
Readiness
18
2231
48
Investment & Development
Appeal
Readiness
The direction of the triangle indicates the performance change from the last year: improved or stabledeclined

IMD WORLD TALENT RANKING 201764
Alpha AlphaLabel Beta BetaLabel Gamma GammaLabel1 2 2 2 2 2 24 4 4 2 2
Value
3.9 % 42w 15.1 % 52 17.80 ratio 47 14.59 ratio 44 4.55 Survey [0..10] 35w 4.84 Survey [0..10] 55w 18.21 % 59 5.57 Survey [0..10] 33
Value
79.20 index 43 5.80 Survey [0..10] 47w 4.46 Survey [0..10] 55 4.64 Survey [0..10] 35 4.87 Survey [0..10] 51 4.62 Survey [0..10] 38 - US$ - 114,020 US$ 43u 9.98 % 14u 6.75 Survey [0..10] 34
Value
u 3.28 % 6 4.92 Survey [0..10] 47 5.71 Survey [0..10] 43 5.19 Survey [0..10] 34 5.42 Survey [0..10] 41 4.57 Survey [0..10] 44 4.65 Survey [0..10] 44 4.84 Survey [0..10] 47 4.81 Survey [0..10] 50 5.32 Survey [0..10] 41u 4.38 number 14w 394 Average 54
Investment & Development 2017 Rank
Health infrastructure meets the needs of society
2017 Rank
Total public expenditure on education Percentage of GDP
ApprenticeshipsEmployee training is a high priority in companies
Readiness 2017 Rank
Educational assessment - PISA PISA survey of 15-year olds
Appeal
Personal security and private property rights are adequately protected
Percentage change
Student mobility inbound Foreign tertiary-level students per 1000 inhabitants
Labor force growth
University education meets the needs of a competitive economy
Management education meets the needs of the business community
Language skills are meeting the needs of enterprises
Competent senior managers are readily available
Educational system The educational system meets the needs of a competitive economy
Science in schools is sufficiently emphasized
Skilled labor is readily available
Finance skills are readily available
International experience of senior managers is generally significant
Remuneration of management Total base salary plus bonuses and long-term incentives, US$
Effective personal income tax rate Percentage of an income equal to GDP per capita
Quality of life is high
Foreign highly-skilled personnel are attracted to your country's business environment
Remuneration in services professions Gross annual income including supplements such as bonuses, US$
Attracting and retaining talents is a priority in companies
Worker motivation in companies is high
Brain drain (well-educated and skilled people) does not hinder competitiveness in your economy
Public expenditure on education per pupil Percentage of GDP per capita (secondary)
Pupil-teacher ratio (primary education)
JORDAN
Ratio of students to teaching staff
Pupil-teacher ratio (secondary education) Ratio of students to teaching staff
Are sufficiently implemented
Female labor force Percentage of total labor force
Cost-of-living index Index of a basket of goods & services in the main city, including housing (New York City = 100)
IMD World Talent Ranking 2017
OVERALL PERFORMANCE (63 countries)
4342 42
40
49
53 52
55 56
60
38
2928
32
44
34 3436
25
44
2013 2014 2015 2016 2017
Overall
Investment &Development
Appeal
Readiness
60
4449
44
Investment & Development
Appeal
Readiness
The direction of the triangle indicates the performance change from the last year: improved or stabledeclined

65IMD WORLD TALENT RANKING 2017
Alpha AlphaLabel Beta BetaLabel Gamma GammaLabel1 2 2 2 2 2 24 4 4 2 2
Value
w 3.7 % 47 19.0 % 36 16.86 ratio 39u 8.66 ratio 4u 6.31 Survey [0..10] 8 6.63 Survey [0..10] 14u 48.39 % 8 5.34 Survey [0..10] 35
Value
u 50.70 index 2 6.61 Survey [0..10] 36 6.25 Survey [0..10] 24 4.64 Survey [0..10] 36 5.52 Survey [0..10] 44 6.51 Survey [0..10] 17w 13,130 US$ 45w 20,448 US$ 62 15.91 % 27 6.08 Survey [0..10] 42
Value
w -0.84 % 59u 6.58 Survey [0..10] 10 7.36 Survey [0..10] 11 6.23 Survey [0..10] 15 6.48 Survey [0..10] 14 5.95 Survey [0..10] 29 5.98 Survey [0..10] 22 5.87 Survey [0..10] 30 5.79 Survey [0..10] 39 5.83 Survey [0..10] 35w 0.56 number 52 458 Average 39
Investment & Development 2017 Rank
Health infrastructure meets the needs of society
2017 Rank
Total public expenditure on education Percentage of GDP
ApprenticeshipsEmployee training is a high priority in companies
Readiness 2017 Rank
Educational assessment - PISA PISA survey of 15-year olds
Appeal
Personal security and private property rights are adequately protected
Percentage change
Student mobility inbound Foreign tertiary-level students per 1000 inhabitants
Labor force growth
University education meets the needs of a competitive economy
Management education meets the needs of the business community
Language skills are meeting the needs of enterprises
Competent senior managers are readily available
Educational system The educational system meets the needs of a competitive economy
Science in schools is sufficiently emphasized
Skilled labor is readily available
Finance skills are readily available
International experience of senior managers is generally significant
Remuneration of management Total base salary plus bonuses and long-term incentives, US$
Effective personal income tax rate Percentage of an income equal to GDP per capita
Quality of life is high
Foreign highly-skilled personnel are attracted to your country's business environment
Remuneration in services professions Gross annual income including supplements such as bonuses, US$
Attracting and retaining talents is a priority in companies
Worker motivation in companies is high
Brain drain (well-educated and skilled people) does not hinder competitiveness in your economy
Public expenditure on education per pupil Percentage of GDP per capita (secondary)
Pupil-teacher ratio (primary education)
KAZAKHSTAN
Ratio of students to teaching staff
Pupil-teacher ratio (secondary education) Ratio of students to teaching staff
Are sufficiently implemented
Female labor force Percentage of total labor force
Cost-of-living index Index of a basket of goods & services in the main city, including housing (New York City = 100)
IMD World Talent Ranking 2017
OVERALL PERFORMANCE (63 countries)
39
36 36
44
3032
2524
34
23
51
4846
54
3737 3739
52
32
2013 2014 2015 2016 2017
Overall
Investment &Development
Appeal
Readiness
23
3730
32
Investment & Development
Appeal
Readiness
The direction of the triangle indicates the performance change from the last year: improved or stabledeclined
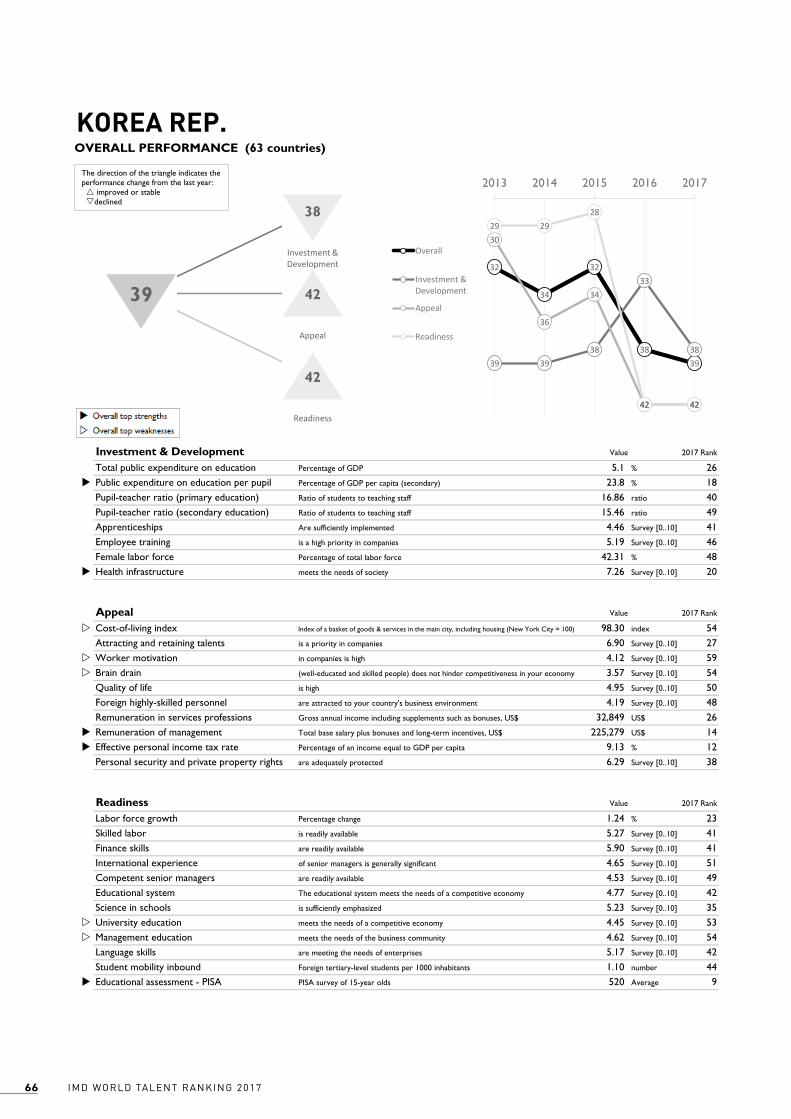
IMD WORLD TALENT RANKING 201766
Alpha AlphaLabel Beta BetaLabel Gamma GammaLabel1 2 2 2 2 2 24 4 4 2 2
Value
5.1 % 26u 23.8 % 18 16.86 ratio 40 15.46 ratio 49 4.46 Survey [0..10] 41 5.19 Survey [0..10] 46 42.31 % 48u 7.26 Survey [0..10] 20
Value
w 98.30 index 54 6.90 Survey [0..10] 27w 4.12 Survey [0..10] 59w 3.57 Survey [0..10] 54 4.95 Survey [0..10] 50 4.19 Survey [0..10] 48 32,849 US$ 26u 225,279 US$ 14u 9.13 % 12 6.29 Survey [0..10] 38
Value
1.24 % 23 5.27 Survey [0..10] 41 5.90 Survey [0..10] 41 4.65 Survey [0..10] 51 4.53 Survey [0..10] 49 4.77 Survey [0..10] 42 5.23 Survey [0..10] 35w 4.45 Survey [0..10] 53w 4.62 Survey [0..10] 54 5.17 Survey [0..10] 42 1.10 number 44u 520 Average 9
Investment & Development 2017 Rank
Health infrastructure meets the needs of society
2017 Rank
Total public expenditure on education Percentage of GDP
ApprenticeshipsEmployee training is a high priority in companies
Readiness 2017 Rank
Educational assessment - PISA PISA survey of 15-year olds
Appeal
Personal security and private property rights are adequately protected
Percentage change
Student mobility inbound Foreign tertiary-level students per 1000 inhabitants
Labor force growth
University education meets the needs of a competitive economy
Management education meets the needs of the business community
Language skills are meeting the needs of enterprises
Competent senior managers are readily available
Educational system The educational system meets the needs of a competitive economy
Science in schools is sufficiently emphasized
Skilled labor is readily available
Finance skills are readily available
International experience of senior managers is generally significant
Remuneration of management Total base salary plus bonuses and long-term incentives, US$
Effective personal income tax rate Percentage of an income equal to GDP per capita
Quality of life is high
Foreign highly-skilled personnel are attracted to your country's business environment
Remuneration in services professions Gross annual income including supplements such as bonuses, US$
Attracting and retaining talents is a priority in companies
Worker motivation in companies is high
Brain drain (well-educated and skilled people) does not hinder competitiveness in your economy
Public expenditure on education per pupil Percentage of GDP per capita (secondary)
Pupil-teacher ratio (primary education)
KOREA REP.
Ratio of students to teaching staff
Pupil-teacher ratio (secondary education) Ratio of students to teaching staff
Are sufficiently implemented
Female labor force Percentage of total labor force
Cost-of-living index Index of a basket of goods & services in the main city, including housing (New York City = 100)
IMD World Talent Ranking 2017
OVERALL PERFORMANCE (63 countries)
32
34
32
383939 39
38
33
38
30
36
34
42 42
29 2928
42 42
2013 2014 2015 2016 2017
Overall
Investment &Development
Appeal
Readiness
38
4239
42
Investment & Development
Appeal
Readiness
The direction of the triangle indicates the performance change from the last year: improved or stabledeclined

67IMD WORLD TALENT RANKING 2017
Alpha AlphaLabel Beta BetaLabel Gamma GammaLabel1 2 2 2 2 2 24 4 4 2 2
Value
5.3 % 23u 25.5 % 13u 11.00 ratio 8u 8.78 ratio 5 4.79 Survey [0..10] 29 5.44 Survey [0..10] 37u 50.23 % 2 4.10 Survey [0..10] 46
Value
69.40 index 23w 5.74 Survey [0..10] 50 5.44 Survey [0..10] 40 4.05 Survey [0..10] 46 6.00 Survey [0..10] 39 5.18 Survey [0..10] 32w 12,788 US$ 48 102,029 US$ 45w 24.60 % 51 6.15 Survey [0..10] 40
Value
w -0.52 % 56 5.38 Survey [0..10] 37 6.41 Survey [0..10] 34 5.28 Survey [0..10] 32 5.13 Survey [0..10] 44 5.23 Survey [0..10] 38w 3.95 Survey [0..10] 49 5.23 Survey [0..10] 41 5.16 Survey [0..10] 46u 7.54 Survey [0..10] 17 2.24 number 28 486 Average 29
Investment & Development 2017 Rank
Health infrastructure meets the needs of society
2017 Rank
Total public expenditure on education Percentage of GDP
ApprenticeshipsEmployee training is a high priority in companies
Readiness 2017 Rank
Educational assessment - PISA PISA survey of 15-year olds
Appeal
Personal security and private property rights are adequately protected
Percentage change
Student mobility inbound Foreign tertiary-level students per 1000 inhabitants
Labor force growth
University education meets the needs of a competitive economy
Management education meets the needs of the business community
Language skills are meeting the needs of enterprises
Competent senior managers are readily available
Educational system The educational system meets the needs of a competitive economy
Science in schools is sufficiently emphasized
Skilled labor is readily available
Finance skills are readily available
International experience of senior managers is generally significant
Remuneration of management Total base salary plus bonuses and long-term incentives, US$
Effective personal income tax rate Percentage of an income equal to GDP per capita
Quality of life is high
Foreign highly-skilled personnel are attracted to your country's business environment
Remuneration in services professions Gross annual income including supplements such as bonuses, US$
Attracting and retaining talents is a priority in companies
Worker motivation in companies is high
Brain drain (well-educated and skilled people) does not hinder competitiveness in your economy
Public expenditure on education per pupil Percentage of GDP per capita (secondary)
Pupil-teacher ratio (primary education)
LATVIA
Ratio of students to teaching staff
Pupil-teacher ratio (secondary education) Ratio of students to teaching staff
Are sufficiently implemented
Female labor force Percentage of total labor force
Cost-of-living index Index of a basket of goods & services in the main city, including housing (New York City = 100)
IMD World Talent Ranking 2017
OVERALL PERFORMANCE (63 countries)
3028 27
30
35
12 119 9
13
4644
50
46
52
38 38 37
4138
2013 2014 2015 2016 2017
Overall
Investment &Development
Appeal
Readiness
13
5235
38
Investment & Development
Appeal
Readiness
The direction of the triangle indicates the performance change from the last year: improved or stabledeclined
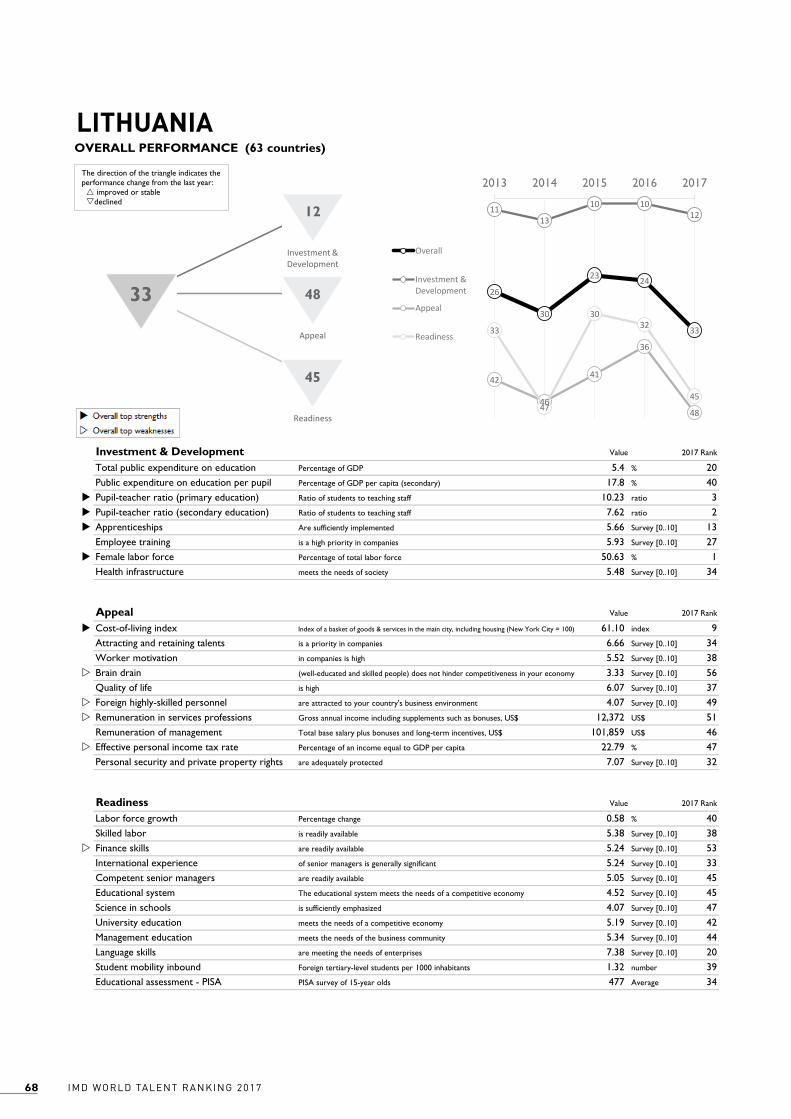
IMD WORLD TALENT RANKING 201768
Alpha AlphaLabel Beta BetaLabel Gamma GammaLabel1 2 2 2 2 2 24 4 4 2 2
Value
5.4 % 20 17.8 % 40u 10.23 ratio 3u 7.62 ratio 2u 5.66 Survey [0..10] 13 5.93 Survey [0..10] 27u 50.63 % 1 5.48 Survey [0..10] 34
Value
u 61.10 index 9 6.66 Survey [0..10] 34 5.52 Survey [0..10] 38w 3.33 Survey [0..10] 56 6.07 Survey [0..10] 37w 4.07 Survey [0..10] 49w 12,372 US$ 51 101,859 US$ 46w 22.79 % 47 7.07 Survey [0..10] 32
Value
0.58 % 40 5.38 Survey [0..10] 38w 5.24 Survey [0..10] 53 5.24 Survey [0..10] 33 5.05 Survey [0..10] 45 4.52 Survey [0..10] 45 4.07 Survey [0..10] 47 5.19 Survey [0..10] 42 5.34 Survey [0..10] 44 7.38 Survey [0..10] 20 1.32 number 39 477 Average 34
Investment & Development 2017 Rank
Health infrastructure meets the needs of society
2017 Rank
Total public expenditure on education Percentage of GDP
ApprenticeshipsEmployee training is a high priority in companies
Readiness 2017 Rank
Educational assessment - PISA PISA survey of 15-year olds
Appeal
Personal security and private property rights are adequately protected
Percentage change
Student mobility inbound Foreign tertiary-level students per 1000 inhabitants
Labor force growth
University education meets the needs of a competitive economy
Management education meets the needs of the business community
Language skills are meeting the needs of enterprises
Competent senior managers are readily available
Educational system The educational system meets the needs of a competitive economy
Science in schools is sufficiently emphasized
Skilled labor is readily available
Finance skills are readily available
International experience of senior managers is generally significant
Remuneration of management Total base salary plus bonuses and long-term incentives, US$
Effective personal income tax rate Percentage of an income equal to GDP per capita
Quality of life is high
Foreign highly-skilled personnel are attracted to your country's business environment
Remuneration in services professions Gross annual income including supplements such as bonuses, US$
Attracting and retaining talents is a priority in companies
Worker motivation in companies is high
Brain drain (well-educated and skilled people) does not hinder competitiveness in your economy
Public expenditure on education per pupil Percentage of GDP per capita (secondary)
Pupil-teacher ratio (primary education)
LITHUANIA
Ratio of students to teaching staff
Pupil-teacher ratio (secondary education) Ratio of students to teaching staff
Are sufficiently implemented
Female labor force Percentage of total labor force
Cost-of-living index Index of a basket of goods & services in the main city, including housing (New York City = 100)
IMD World Talent Ranking 2017
OVERALL PERFORMANCE (63 countries)
26
30
23 24
33
1113
10 1012
42
46
41
36
48
33
47
3032
45
2013 2014 2015 2016 2017
Overall
Investment &Development
Appeal
Readiness
12
4833
45
Investment & Development
Appeal
Readiness
The direction of the triangle indicates the performance change from the last year: improved or stabledeclined
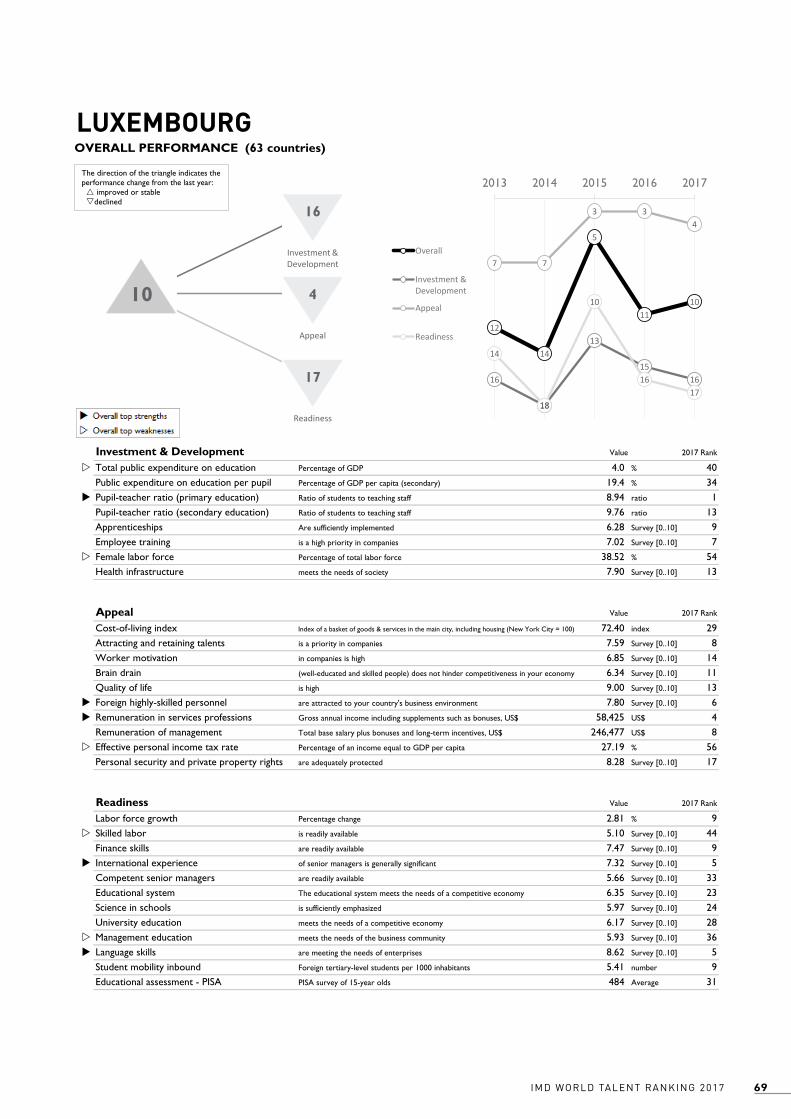
69IMD WORLD TALENT RANKING 2017
Alpha AlphaLabel Beta BetaLabel Gamma GammaLabel1 2 2 2 2 2 24 4 4 2 2
Value
w 4.0 % 40 19.4 % 34u 8.94 ratio 1 9.76 ratio 13 6.28 Survey [0..10] 9 7.02 Survey [0..10] 7w 38.52 % 54 7.90 Survey [0..10] 13
Value
72.40 index 29 7.59 Survey [0..10] 8 6.85 Survey [0..10] 14 6.34 Survey [0..10] 11 9.00 Survey [0..10] 13u 7.80 Survey [0..10] 6u 58,425 US$ 4 246,477 US$ 8w 27.19 % 56 8.28 Survey [0..10] 17
Value
2.81 % 9w 5.10 Survey [0..10] 44 7.47 Survey [0..10] 9u 7.32 Survey [0..10] 5 5.66 Survey [0..10] 33 6.35 Survey [0..10] 23 5.97 Survey [0..10] 24 6.17 Survey [0..10] 28w 5.93 Survey [0..10] 36u 8.62 Survey [0..10] 5 5.41 number 9 484 Average 31
Investment & Development 2017 Rank
Health infrastructure meets the needs of society
2017 Rank
Total public expenditure on education Percentage of GDP
ApprenticeshipsEmployee training is a high priority in companies
Readiness 2017 Rank
Educational assessment - PISA PISA survey of 15-year olds
Appeal
Personal security and private property rights are adequately protected
Percentage change
Student mobility inbound Foreign tertiary-level students per 1000 inhabitants
Labor force growth
University education meets the needs of a competitive economy
Management education meets the needs of the business community
Language skills are meeting the needs of enterprises
Competent senior managers are readily available
Educational system The educational system meets the needs of a competitive economy
Science in schools is sufficiently emphasized
Skilled labor is readily available
Finance skills are readily available
International experience of senior managers is generally significant
Remuneration of management Total base salary plus bonuses and long-term incentives, US$
Effective personal income tax rate Percentage of an income equal to GDP per capita
Quality of life is high
Foreign highly-skilled personnel are attracted to your country's business environment
Remuneration in services professions Gross annual income including supplements such as bonuses, US$
Attracting and retaining talents is a priority in companies
Worker motivation in companies is high
Brain drain (well-educated and skilled people) does not hinder competitiveness in your economy
Public expenditure on education per pupil Percentage of GDP per capita (secondary)
Pupil-teacher ratio (primary education)
LUXEMBOURG
Ratio of students to teaching staff
Pupil-teacher ratio (secondary education) Ratio of students to teaching staff
Are sufficiently implemented
Female labor force Percentage of total labor force
Cost-of-living index Index of a basket of goods & services in the main city, including housing (New York City = 100)
IMD World Talent Ranking 2017
OVERALL PERFORMANCE (63 countries)
12
14
5
1110
16
18
13
1516
7 7
3 34
14
18
10
1617
2013 2014 2015 2016 2017
Overall
Investment &Development
Appeal
Readiness
16
410
17
Investment & Development
Appeal
Readiness
The direction of the triangle indicates the performance change from the last year: improved or stabledeclined

IMD WORLD TALENT RANKING 201770
Alpha AlphaLabel Beta BetaLabel Gamma GammaLabel1 2 2 2 2 2 24 4 4 2 2
Value
4.9 % 29w 18.9 % 37u 11.67 ratio 12 12.53 ratio 31u 5.80 Survey [0..10] 11u 6.71 Survey [0..10] 13w 38.56 % 53 7.39 Survey [0..10] 18
Value
u 63.40 index 14 7.05 Survey [0..10] 21 6.15 Survey [0..10] 29 5.17 Survey [0..10] 28 6.65 Survey [0..10] 33 5.93 Survey [0..10] 23w 11,436 US$ 55w 100,815 US$ 47u 10.58 % 16 6.63 Survey [0..10] 36
Value
1.03 % 27 6.19 Survey [0..10] 22 6.74 Survey [0..10] 28 6.13 Survey [0..10] 18 6.09 Survey [0..10] 19 6.00 Survey [0..10] 27 6.11 Survey [0..10] 19 6.20 Survey [0..10] 27 6.37 Survey [0..10] 26 6.80 Survey [0..10] 25 1.93 number 32w 445 Average 41
Investment & Development 2017 Rank
Health infrastructure meets the needs of society
2017 Rank
Total public expenditure on education Percentage of GDP
ApprenticeshipsEmployee training is a high priority in companies
Readiness 2017 Rank
Educational assessment - PISA PISA survey of 15-year olds
Appeal
Personal security and private property rights are adequately protected
Percentage change
Student mobility inbound Foreign tertiary-level students per 1000 inhabitants
Labor force growth
University education meets the needs of a competitive economy
Management education meets the needs of the business community
Language skills are meeting the needs of enterprises
Competent senior managers are readily available
Educational system The educational system meets the needs of a competitive economy
Science in schools is sufficiently emphasized
Skilled labor is readily available
Finance skills are readily available
International experience of senior managers is generally significant
Remuneration of management Total base salary plus bonuses and long-term incentives, US$
Effective personal income tax rate Percentage of an income equal to GDP per capita
Quality of life is high
Foreign highly-skilled personnel are attracted to your country's business environment
Remuneration in services professions Gross annual income including supplements such as bonuses, US$
Attracting and retaining talents is a priority in companies
Worker motivation in companies is high
Brain drain (well-educated and skilled people) does not hinder competitiveness in your economy
Public expenditure on education per pupil Percentage of GDP per capita (secondary)
Pupil-teacher ratio (primary education)
MALAYSIA
Ratio of students to teaching staff
Pupil-teacher ratio (secondary education) Ratio of students to teaching staff
Are sufficiently implemented
Female labor force Percentage of total labor force
Cost-of-living index Index of a basket of goods & services in the main city, including housing (New York City = 100)
IMD World Talent Ranking 2017
OVERALL PERFORMANCE (63 countries)
15
13
19
21
28
21
15
17 17
19
21
19 19
22
30
7
10
20
2627
2013 2014 2015 2016 2017
Overall
Investment &Development
Appeal
Readiness
19
3028
27
Investment & Development
Appeal
Readiness
The direction of the triangle indicates the performance change from the last year: improved or stabledeclined
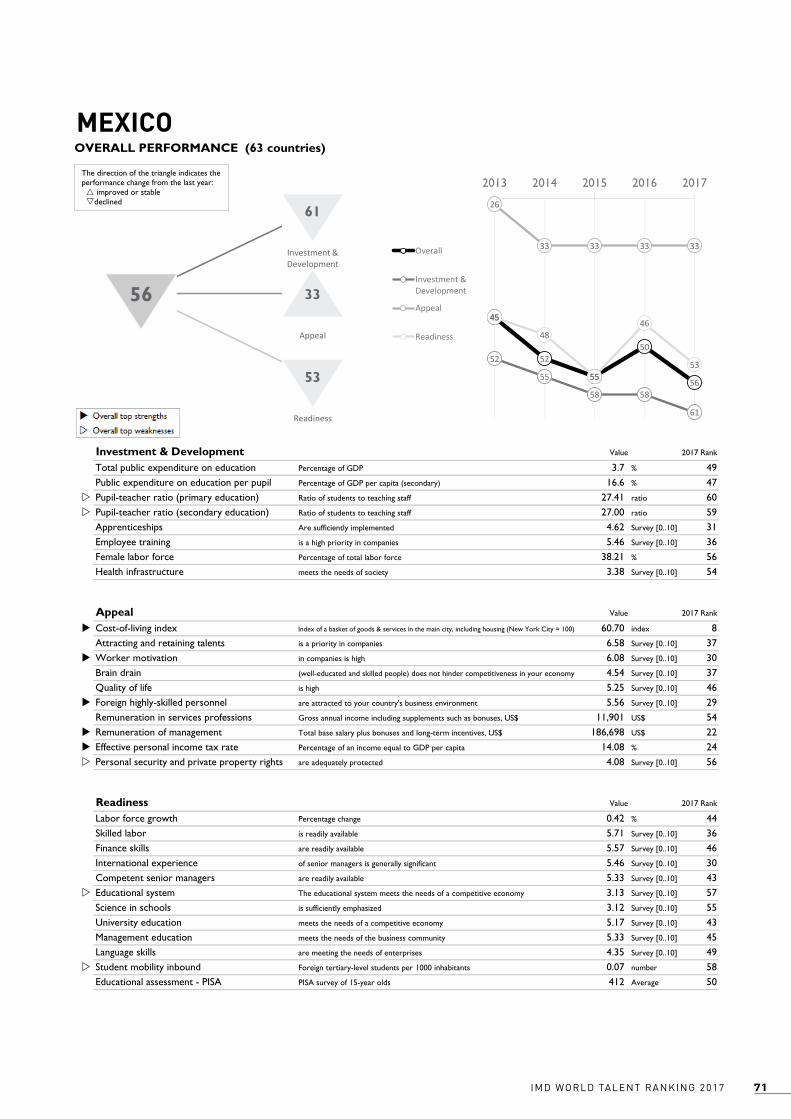
71IMD WORLD TALENT RANKING 2017
Alpha AlphaLabel Beta BetaLabel Gamma GammaLabel1 2 2 2 2 2 24 4 4 2 2
Value
3.7 % 49 16.6 % 47w 27.41 ratio 60w 27.00 ratio 59 4.62 Survey [0..10] 31 5.46 Survey [0..10] 36 38.21 % 56 3.38 Survey [0..10] 54
Value
u 60.70 index 8 6.58 Survey [0..10] 37u 6.08 Survey [0..10] 30 4.54 Survey [0..10] 37 5.25 Survey [0..10] 46u 5.56 Survey [0..10] 29 11,901 US$ 54u 186,698 US$ 22u 14.08 % 24w 4.08 Survey [0..10] 56
Value
0.42 % 44 5.71 Survey [0..10] 36 5.57 Survey [0..10] 46 5.46 Survey [0..10] 30 5.33 Survey [0..10] 43w 3.13 Survey [0..10] 57 3.12 Survey [0..10] 55 5.17 Survey [0..10] 43 5.33 Survey [0..10] 45 4.35 Survey [0..10] 49w 0.07 number 58 412 Average 50
Investment & Development 2017 Rank
Health infrastructure meets the needs of society
2017 Rank
Total public expenditure on education Percentage of GDP
ApprenticeshipsEmployee training is a high priority in companies
Readiness 2017 Rank
Educational assessment - PISA PISA survey of 15-year olds
Appeal
Personal security and private property rights are adequately protected
Percentage change
Student mobility inbound Foreign tertiary-level students per 1000 inhabitants
Labor force growth
University education meets the needs of a competitive economy
Management education meets the needs of the business community
Language skills are meeting the needs of enterprises
Competent senior managers are readily available
Educational system The educational system meets the needs of a competitive economy
Science in schools is sufficiently emphasized
Skilled labor is readily available
Finance skills are readily available
International experience of senior managers is generally significant
Remuneration of management Total base salary plus bonuses and long-term incentives, US$
Effective personal income tax rate Percentage of an income equal to GDP per capita
Quality of life is high
Foreign highly-skilled personnel are attracted to your country's business environment
Remuneration in services professions Gross annual income including supplements such as bonuses, US$
Attracting and retaining talents is a priority in companies
Worker motivation in companies is high
Brain drain (well-educated and skilled people) does not hinder competitiveness in your economy
Public expenditure on education per pupil Percentage of GDP per capita (secondary)
Pupil-teacher ratio (primary education)
MEXICO
Ratio of students to teaching staff
Pupil-teacher ratio (secondary education) Ratio of students to teaching staff
Are sufficiently implemented
Female labor force Percentage of total labor force
Cost-of-living index Index of a basket of goods & services in the main city, including housing (New York City = 100)
IMD World Talent Ranking 2017
OVERALL PERFORMANCE (63 countries)
45
52
55
50
56
52
55
58 58
61
26
33 33 33 33
45
48
55
46
53
2013 2014 2015 2016 2017
Overall
Investment &Development
Appeal
Readiness
61
3356
53
Investment & Development
Appeal
Readiness
The direction of the triangle indicates the performance change from the last year: improved or stabledeclined
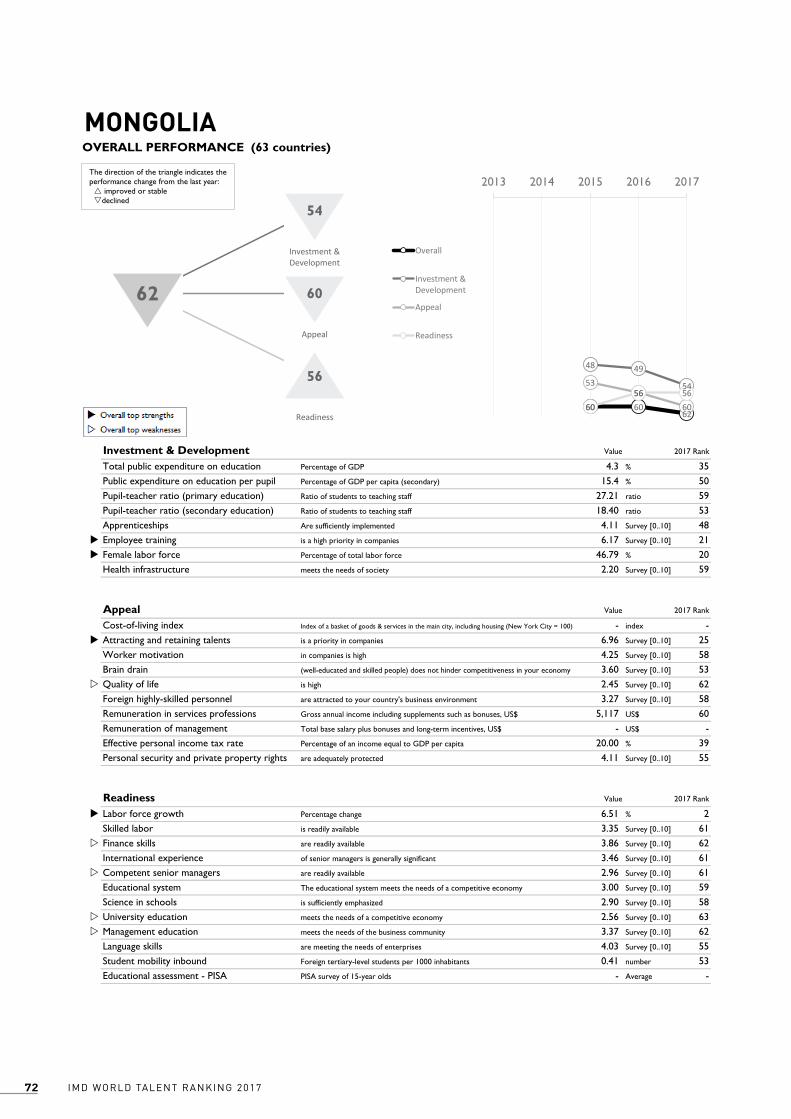
IMD WORLD TALENT RANKING 201772
Alpha AlphaLabel Beta BetaLabel Gamma GammaLabel1 2 2 2 2 2 24 4 4 2 2
Value
4.3 % 35 15.4 % 50 27.21 ratio 59 18.40 ratio 53 4.11 Survey [0..10] 48u 6.17 Survey [0..10] 21u 46.79 % 20 2.20 Survey [0..10] 59
Value
- index -u 6.96 Survey [0..10] 25 4.25 Survey [0..10] 58 3.60 Survey [0..10] 53w 2.45 Survey [0..10] 62 3.27 Survey [0..10] 58 5,117 US$ 60 - US$ - 20.00 % 39 4.11 Survey [0..10] 55
Value
u 6.51 % 2 3.35 Survey [0..10] 61w 3.86 Survey [0..10] 62 3.46 Survey [0..10] 61w 2.96 Survey [0..10] 61 3.00 Survey [0..10] 59 2.90 Survey [0..10] 58w 2.56 Survey [0..10] 63w 3.37 Survey [0..10] 62 4.03 Survey [0..10] 55 0.41 number 53 - Average -
Investment & Development 2017 Rank
Health infrastructure meets the needs of society
2017 Rank
Total public expenditure on education Percentage of GDP
ApprenticeshipsEmployee training is a high priority in companies
Readiness 2017 Rank
Educational assessment - PISA PISA survey of 15-year olds
Appeal
Personal security and private property rights are adequately protected
Percentage change
Student mobility inbound Foreign tertiary-level students per 1000 inhabitants
Labor force growth
University education meets the needs of a competitive economy
Management education meets the needs of the business community
Language skills are meeting the needs of enterprises
Competent senior managers are readily available
Educational system The educational system meets the needs of a competitive economy
Science in schools is sufficiently emphasized
Skilled labor is readily available
Finance skills are readily available
International experience of senior managers is generally significant
Remuneration of management Total base salary plus bonuses and long-term incentives, US$
Effective personal income tax rate Percentage of an income equal to GDP per capita
Quality of life is high
Foreign highly-skilled personnel are attracted to your country's business environment
Remuneration in services professions Gross annual income including supplements such as bonuses, US$
Attracting and retaining talents is a priority in companies
Worker motivation in companies is high
Brain drain (well-educated and skilled people) does not hinder competitiveness in your economy
Public expenditure on education per pupil Percentage of GDP per capita (secondary)
Pupil-teacher ratio (primary education)
MONGOLIA
Ratio of students to teaching staff
Pupil-teacher ratio (secondary education) Ratio of students to teaching staff
Are sufficiently implemented
Female labor force Percentage of total labor force
Cost-of-living index Index of a basket of goods & services in the main city, including housing (New York City = 100)
IMD World Talent Ranking 2017
OVERALL PERFORMANCE (63 countries)
60 6062
48 49
545356
606056 56
2013 2014 2015 2016 2017
Overall
Investment &Development
Appeal
Readiness
54
6062
56
Investment & Development
Appeal
Readiness
The direction of the triangle indicates the performance change from the last year: improved or stabledeclined
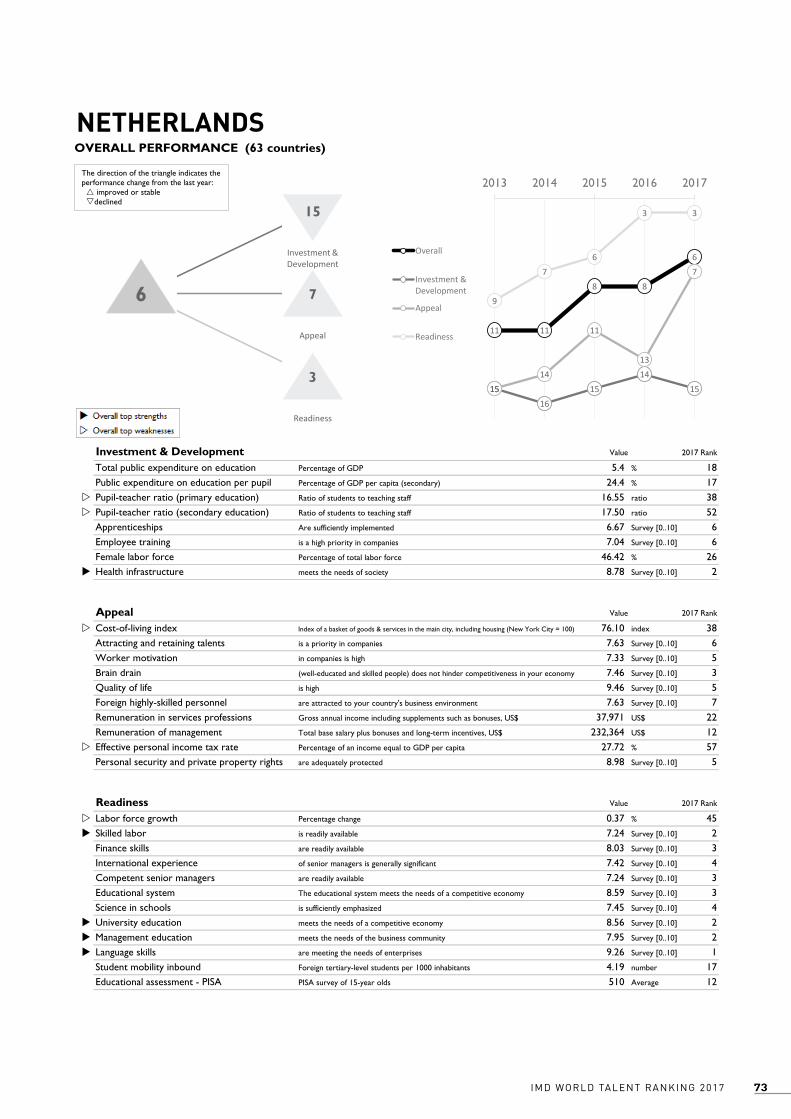
73IMD WORLD TALENT RANKING 2017
Alpha AlphaLabel Beta BetaLabel Gamma GammaLabel1 2 2 2 2 2 24 4 4 2 2
Value
5.4 % 18 24.4 % 17w 16.55 ratio 38w 17.50 ratio 52 6.67 Survey [0..10] 6 7.04 Survey [0..10] 6 46.42 % 26u 8.78 Survey [0..10] 2
Value
w 76.10 index 38 7.63 Survey [0..10] 6 7.33 Survey [0..10] 5 7.46 Survey [0..10] 3 9.46 Survey [0..10] 5 7.63 Survey [0..10] 7 37,971 US$ 22 232,364 US$ 12w 27.72 % 57 8.98 Survey [0..10] 5
Value
w 0.37 % 45u 7.24 Survey [0..10] 2 8.03 Survey [0..10] 3 7.42 Survey [0..10] 4 7.24 Survey [0..10] 3 8.59 Survey [0..10] 3 7.45 Survey [0..10] 4u 8.56 Survey [0..10] 2u 7.95 Survey [0..10] 2u 9.26 Survey [0..10] 1 4.19 number 17 510 Average 12
Investment & Development 2017 Rank
Health infrastructure meets the needs of society
2017 Rank
Total public expenditure on education Percentage of GDP
ApprenticeshipsEmployee training is a high priority in companies
Readiness 2017 Rank
Educational assessment - PISA PISA survey of 15-year olds
Appeal
Personal security and private property rights are adequately protected
Percentage change
Student mobility inbound Foreign tertiary-level students per 1000 inhabitants
Labor force growth
University education meets the needs of a competitive economy
Management education meets the needs of the business community
Language skills are meeting the needs of enterprises
Competent senior managers are readily available
Educational system The educational system meets the needs of a competitive economy
Science in schools is sufficiently emphasized
Skilled labor is readily available
Finance skills are readily available
International experience of senior managers is generally significant
Remuneration of management Total base salary plus bonuses and long-term incentives, US$
Effective personal income tax rate Percentage of an income equal to GDP per capita
Quality of life is high
Foreign highly-skilled personnel are attracted to your country's business environment
Remuneration in services professions Gross annual income including supplements such as bonuses, US$
Attracting and retaining talents is a priority in companies
Worker motivation in companies is high
Brain drain (well-educated and skilled people) does not hinder competitiveness in your economy
Public expenditure on education per pupil Percentage of GDP per capita (secondary)
Pupil-teacher ratio (primary education)
NETHERLANDS
Ratio of students to teaching staff
Pupil-teacher ratio (secondary education) Ratio of students to teaching staff
Are sufficiently implemented
Female labor force Percentage of total labor force
Cost-of-living index Index of a basket of goods & services in the main city, including housing (New York City = 100)
IMD World Talent Ranking 2017
OVERALL PERFORMANCE (63 countries)
11 11
8 8
6
1516
1514
151514
11
13
7
9
76
3 3
2013 2014 2015 2016 2017
Overall
Investment &Development
Appeal
Readiness
15
76
3
Investment & Development
Appeal
Readiness
The direction of the triangle indicates the performance change from the last year: improved or stabledeclined
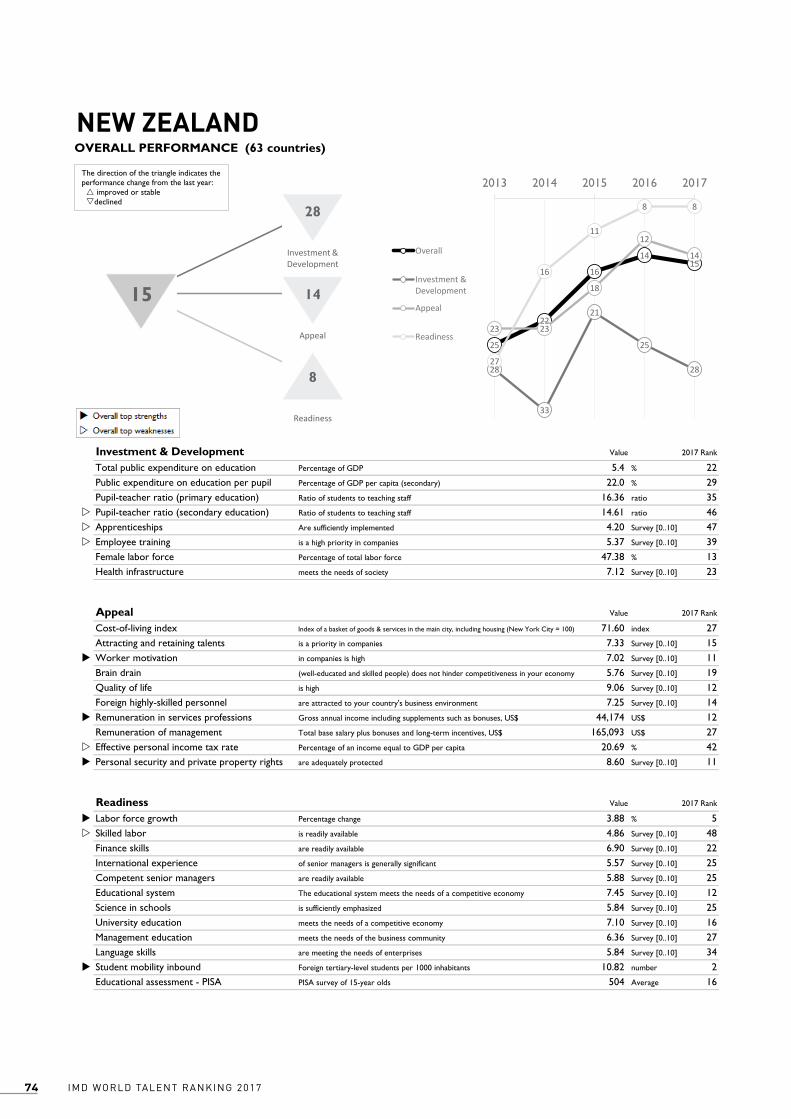
IMD WORLD TALENT RANKING 201774
Alpha AlphaLabel Beta BetaLabel Gamma GammaLabel1 2 2 2 2 2 24 4 4 2 2
Value
5.4 % 22 22.0 % 29 16.36 ratio 35w 14.61 ratio 46w 4.20 Survey [0..10] 47w 5.37 Survey [0..10] 39 47.38 % 13 7.12 Survey [0..10] 23
Value
71.60 index 27 7.33 Survey [0..10] 15u 7.02 Survey [0..10] 11 5.76 Survey [0..10] 19 9.06 Survey [0..10] 12 7.25 Survey [0..10] 14u 44,174 US$ 12 165,093 US$ 27w 20.69 % 42u 8.60 Survey [0..10] 11
Value
u 3.88 % 5w 4.86 Survey [0..10] 48 6.90 Survey [0..10] 22 5.57 Survey [0..10] 25 5.88 Survey [0..10] 25 7.45 Survey [0..10] 12 5.84 Survey [0..10] 25 7.10 Survey [0..10] 16 6.36 Survey [0..10] 27 5.84 Survey [0..10] 34u 10.82 number 2 504 Average 16
Investment & Development 2017 Rank
Health infrastructure meets the needs of society
2017 Rank
Total public expenditure on education Percentage of GDP
ApprenticeshipsEmployee training is a high priority in companies
Readiness 2017 Rank
Educational assessment - PISA PISA survey of 15-year olds
Appeal
Personal security and private property rights are adequately protected
Percentage change
Student mobility inbound Foreign tertiary-level students per 1000 inhabitants
Labor force growth
University education meets the needs of a competitive economy
Management education meets the needs of the business community
Language skills are meeting the needs of enterprises
Competent senior managers are readily available
Educational system The educational system meets the needs of a competitive economy
Science in schools is sufficiently emphasized
Skilled labor is readily available
Finance skills are readily available
International experience of senior managers is generally significant
Remuneration of management Total base salary plus bonuses and long-term incentives, US$
Effective personal income tax rate Percentage of an income equal to GDP per capita
Quality of life is high
Foreign highly-skilled personnel are attracted to your country's business environment
Remuneration in services professions Gross annual income including supplements such as bonuses, US$
Attracting and retaining talents is a priority in companies
Worker motivation in companies is high
Brain drain (well-educated and skilled people) does not hinder competitiveness in your economy
Public expenditure on education per pupil Percentage of GDP per capita (secondary)
Pupil-teacher ratio (primary education)
NEW ZEALAND
Ratio of students to teaching staff
Pupil-teacher ratio (secondary education) Ratio of students to teaching staff
Are sufficiently implemented
Female labor force Percentage of total labor force
Cost-of-living index Index of a basket of goods & services in the main city, including housing (New York City = 100)
IMD World Talent Ranking 2017
OVERALL PERFORMANCE (63 countries)
25
22
16
1415
28
33
21
25
28
23 23
18
12
14
27
16
11
8 8
2013 2014 2015 2016 2017
Overall
Investment &Development
Appeal
Readiness
28
1415
8
Investment & Development
Appeal
Readiness
The direction of the triangle indicates the performance change from the last year: improved or stabledeclined

75IMD WORLD TALENT RANKING 2017
Alpha AlphaLabel Beta BetaLabel Gamma GammaLabel1 2 2 2 2 2 24 4 4 2 2
Value
5.5 % 17 25.8 % 12u 10.29 ratio 4 10.33 ratio 14 5.87 Survey [0..10] 10 6.87 Survey [0..10] 9 47.04 % 17 8.56 Survey [0..10] 4
Value
w 77.40 index 40 7.54 Survey [0..10] 11u 8.07 Survey [0..10] 1u 8.36 Survey [0..10] 1u 9.80 Survey [0..10] 1 6.07 Survey [0..10] 19 50,635 US$ 6w 142,220 US$ 36w 28.43 % 61 9.07 Survey [0..10] 4
Value
w 0.29 % 47u 7.73 Survey [0..10] 1 8.00 Survey [0..10] 4w 4.92 Survey [0..10] 43 6.52 Survey [0..10] 13 8.43 Survey [0..10] 4 6.86 Survey [0..10] 9 7.80 Survey [0..10] 8 7.54 Survey [0..10] 7 8.13 Survey [0..10] 12 1.83 number 33 500 Average 21
Investment & Development 2017 Rank
Health infrastructure meets the needs of society
2017 Rank
Total public expenditure on education Percentage of GDP
ApprenticeshipsEmployee training is a high priority in companies
Readiness 2017 Rank
Educational assessment - PISA PISA survey of 15-year olds
Appeal
Personal security and private property rights are adequately protected
Percentage change
Student mobility inbound Foreign tertiary-level students per 1000 inhabitants
Labor force growth
University education meets the needs of a competitive economy
Management education meets the needs of the business community
Language skills are meeting the needs of enterprises
Competent senior managers are readily available
Educational system The educational system meets the needs of a competitive economy
Science in schools is sufficiently emphasized
Skilled labor is readily available
Finance skills are readily available
International experience of senior managers is generally significant
Remuneration of management Total base salary plus bonuses and long-term incentives, US$
Effective personal income tax rate Percentage of an income equal to GDP per capita
Quality of life is high
Foreign highly-skilled personnel are attracted to your country's business environment
Remuneration in services professions Gross annual income including supplements such as bonuses, US$
Attracting and retaining talents is a priority in companies
Worker motivation in companies is high
Brain drain (well-educated and skilled people) does not hinder competitiveness in your economy
Public expenditure on education per pupil Percentage of GDP per capita (secondary)
Pupil-teacher ratio (primary education)
NORWAY
Ratio of students to teaching staff
Pupil-teacher ratio (secondary education) Ratio of students to teaching staff
Are sufficiently implemented
Female labor force Percentage of total labor force
Cost-of-living index Index of a basket of goods & services in the main city, including housing (New York City = 100)
IMD World Talent Ranking 2017
OVERALL PERFORMANCE (63 countries)
7
12
67 7
109
8
6 6
10
15
9
15
13
15
19
12
14 14
2013 2014 2015 2016 2017
Overall
Investment &Development
Appeal
Readiness
6
137
14
Investment & Development
Appeal
Readiness
The direction of the triangle indicates the performance change from the last year: improved or stabledeclined
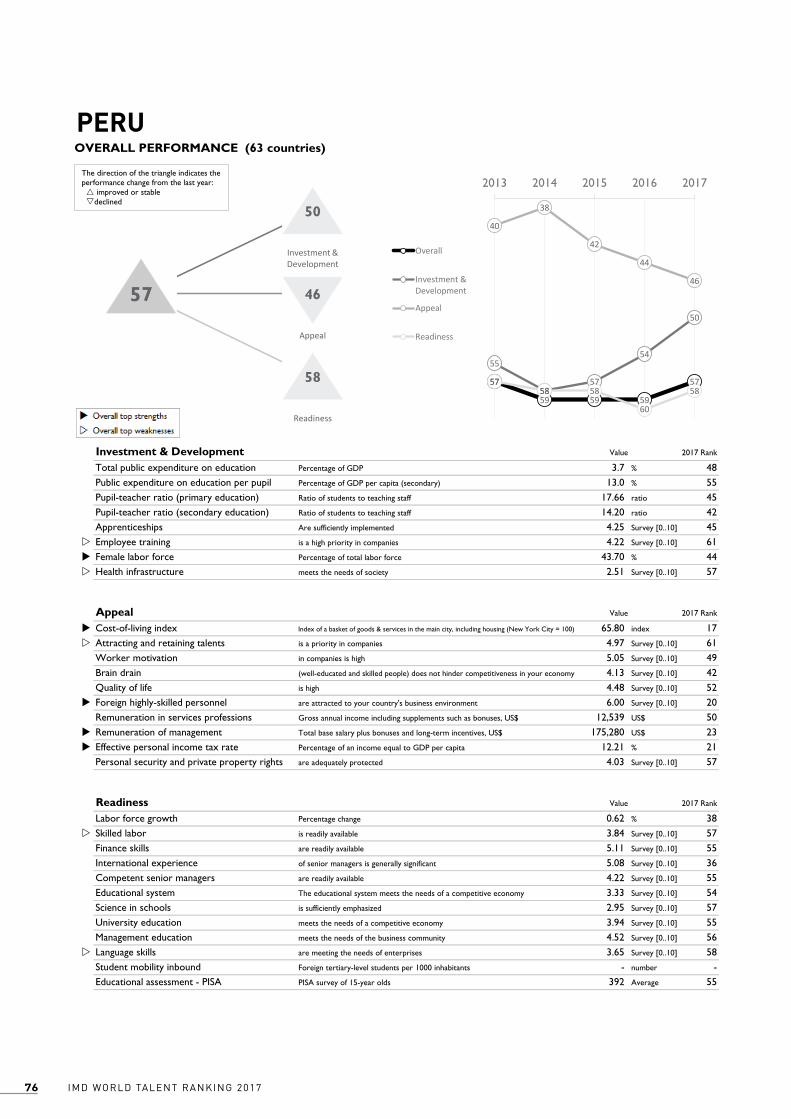
IMD WORLD TALENT RANKING 201776
Alpha AlphaLabel Beta BetaLabel Gamma GammaLabel1 2 2 2 2 2 24 4 4 2 2
Value
3.7 % 48 13.0 % 55 17.66 ratio 45 14.20 ratio 42 4.25 Survey [0..10] 45w 4.22 Survey [0..10] 61u 43.70 % 44w 2.51 Survey [0..10] 57
Value
u 65.80 index 17w 4.97 Survey [0..10] 61 5.05 Survey [0..10] 49 4.13 Survey [0..10] 42 4.48 Survey [0..10] 52u 6.00 Survey [0..10] 20 12,539 US$ 50u 175,280 US$ 23u 12.21 % 21 4.03 Survey [0..10] 57
Value
0.62 % 38w 3.84 Survey [0..10] 57 5.11 Survey [0..10] 55 5.08 Survey [0..10] 36 4.22 Survey [0..10] 55 3.33 Survey [0..10] 54 2.95 Survey [0..10] 57 3.94 Survey [0..10] 55 4.52 Survey [0..10] 56w 3.65 Survey [0..10] 58 - number - 392 Average 55
Investment & Development 2017 Rank
Health infrastructure meets the needs of society
2017 Rank
Total public expenditure on education Percentage of GDP
ApprenticeshipsEmployee training is a high priority in companies
Readiness 2017 Rank
Educational assessment - PISA PISA survey of 15-year olds
Appeal
Personal security and private property rights are adequately protected
Percentage change
Student mobility inbound Foreign tertiary-level students per 1000 inhabitants
Labor force growth
University education meets the needs of a competitive economy
Management education meets the needs of the business community
Language skills are meeting the needs of enterprises
Competent senior managers are readily available
Educational system The educational system meets the needs of a competitive economy
Science in schools is sufficiently emphasized
Skilled labor is readily available
Finance skills are readily available
International experience of senior managers is generally significant
Remuneration of management Total base salary plus bonuses and long-term incentives, US$
Effective personal income tax rate Percentage of an income equal to GDP per capita
Quality of life is high
Foreign highly-skilled personnel are attracted to your country's business environment
Remuneration in services professions Gross annual income including supplements such as bonuses, US$
Attracting and retaining talents is a priority in companies
Worker motivation in companies is high
Brain drain (well-educated and skilled people) does not hinder competitiveness in your economy
Public expenditure on education per pupil Percentage of GDP per capita (secondary)
Pupil-teacher ratio (primary education)
PERU
Ratio of students to teaching staff
Pupil-teacher ratio (secondary education) Ratio of students to teaching staff
Are sufficiently implemented
Female labor force Percentage of total labor force
Cost-of-living index Index of a basket of goods & services in the main city, including housing (New York City = 100)
IMD World Talent Ranking 2017
OVERALL PERFORMANCE (63 countries)
57
59 59 59
57
55
5857
54
50
40
38
42
44
46
5758 58
60
58
2013 2014 2015 2016 2017
Overall
Investment &Development
Appeal
Readiness
50
4657
58
Investment & Development
Appeal
Readiness
The direction of the triangle indicates the performance change from the last year: improved or stabledeclined
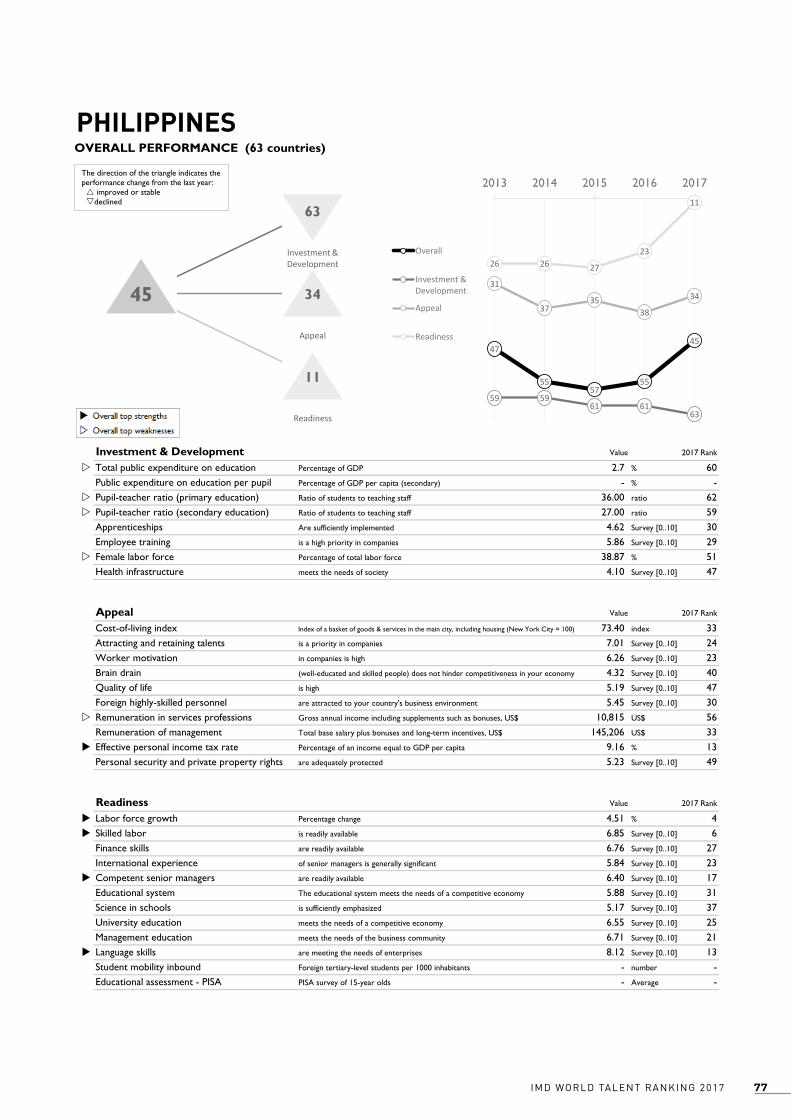
77IMD WORLD TALENT RANKING 2017
Alpha AlphaLabel Beta BetaLabel Gamma GammaLabel1 2 2 2 2 2 24 4 4 2 2
Value
w 2.7 % 60 - % -w 36.00 ratio 62w 27.00 ratio 59 4.62 Survey [0..10] 30 5.86 Survey [0..10] 29w 38.87 % 51 4.10 Survey [0..10] 47
Value
73.40 index 33 7.01 Survey [0..10] 24 6.26 Survey [0..10] 23 4.32 Survey [0..10] 40 5.19 Survey [0..10] 47 5.45 Survey [0..10] 30w 10,815 US$ 56 145,206 US$ 33u 9.16 % 13 5.23 Survey [0..10] 49
Value
u 4.51 % 4u 6.85 Survey [0..10] 6 6.76 Survey [0..10] 27 5.84 Survey [0..10] 23u 6.40 Survey [0..10] 17 5.88 Survey [0..10] 31 5.17 Survey [0..10] 37 6.55 Survey [0..10] 25 6.71 Survey [0..10] 21u 8.12 Survey [0..10] 13 - number - - Average -
Investment & Development 2017 Rank
Health infrastructure meets the needs of society
2017 Rank
Total public expenditure on education Percentage of GDP
ApprenticeshipsEmployee training is a high priority in companies
Readiness 2017 Rank
Educational assessment - PISA PISA survey of 15-year olds
Appeal
Personal security and private property rights are adequately protected
Percentage change
Student mobility inbound Foreign tertiary-level students per 1000 inhabitants
Labor force growth
University education meets the needs of a competitive economy
Management education meets the needs of the business community
Language skills are meeting the needs of enterprises
Competent senior managers are readily available
Educational system The educational system meets the needs of a competitive economy
Science in schools is sufficiently emphasized
Skilled labor is readily available
Finance skills are readily available
International experience of senior managers is generally significant
Remuneration of management Total base salary plus bonuses and long-term incentives, US$
Effective personal income tax rate Percentage of an income equal to GDP per capita
Quality of life is high
Foreign highly-skilled personnel are attracted to your country's business environment
Remuneration in services professions Gross annual income including supplements such as bonuses, US$
Attracting and retaining talents is a priority in companies
Worker motivation in companies is high
Brain drain (well-educated and skilled people) does not hinder competitiveness in your economy
Public expenditure on education per pupil Percentage of GDP per capita (secondary)
Pupil-teacher ratio (primary education)
PHILIPPINES
Ratio of students to teaching staff
Pupil-teacher ratio (secondary education) Ratio of students to teaching staff
Are sufficiently implemented
Female labor force Percentage of total labor force
Cost-of-living index Index of a basket of goods & services in the main city, including housing (New York City = 100)
IMD World Talent Ranking 2017
OVERALL PERFORMANCE (63 countries)
47
5557
55
45
59 5961 61
63
31
3735
38
34
26 26 27
23
11
2013 2014 2015 2016 2017
Overall
Investment &Development
Appeal
Readiness
63
3445
11
Investment & Development
Appeal
Readiness
The direction of the triangle indicates the performance change from the last year: improved or stabledeclined

IMD WORLD TALENT RANKING 201778
Alpha AlphaLabel Beta BetaLabel Gamma GammaLabel1 2 2 2 2 2 24 4 4 2 2
Value
5.3 % 24 22.1 % 28u 10.99 ratio 7u 10.64 ratio 15 4.60 Survey [0..10] 33 5.93 Survey [0..10] 28 44.09 % 41w 3.16 Survey [0..10] 55
Value
u 57.50 index 5 6.00 Survey [0..10] 43 6.21 Survey [0..10] 26 4.39 Survey [0..10] 38 5.89 Survey [0..10] 41 4.42 Survey [0..10] 41w 14,303 US$ 43 143,479 US$ 35w 25.32 % 53w 5.37 Survey [0..10] 48
Value
0.55 % 41 5.79 Survey [0..10] 32 6.07 Survey [0..10] 38 5.51 Survey [0..10] 28 5.44 Survey [0..10] 39 4.95 Survey [0..10] 41 5.19 Survey [0..10] 36 5.47 Survey [0..10] 37 5.93 Survey [0..10] 37u 6.98 Survey [0..10] 23w 0.72 number 49u 503 Average 18
Investment & Development 2017 Rank
Health infrastructure meets the needs of society
2017 Rank
Total public expenditure on education Percentage of GDP
ApprenticeshipsEmployee training is a high priority in companies
Readiness 2017 Rank
Educational assessment - PISA PISA survey of 15-year olds
Appeal
Personal security and private property rights are adequately protected
Percentage change
Student mobility inbound Foreign tertiary-level students per 1000 inhabitants
Labor force growth
University education meets the needs of a competitive economy
Management education meets the needs of the business community
Language skills are meeting the needs of enterprises
Competent senior managers are readily available
Educational system The educational system meets the needs of a competitive economy
Science in schools is sufficiently emphasized
Skilled labor is readily available
Finance skills are readily available
International experience of senior managers is generally significant
Remuneration of management Total base salary plus bonuses and long-term incentives, US$
Effective personal income tax rate Percentage of an income equal to GDP per capita
Quality of life is high
Foreign highly-skilled personnel are attracted to your country's business environment
Remuneration in services professions Gross annual income including supplements such as bonuses, US$
Attracting and retaining talents is a priority in companies
Worker motivation in companies is high
Brain drain (well-educated and skilled people) does not hinder competitiveness in your economy
Public expenditure on education per pupil Percentage of GDP per capita (secondary)
Pupil-teacher ratio (primary education)
POLAND
Ratio of students to teaching staff
Pupil-teacher ratio (secondary education) Ratio of students to teaching staff
Are sufficiently implemented
Female labor force Percentage of total labor force
Cost-of-living index Index of a basket of goods & services in the main city, including housing (New York City = 100)
IMD World Talent Ranking 2017
OVERALL PERFORMANCE (63 countries)
33 32
29 29
34
31
21
18 18
21
53 54
51
45 45
20
27
24 24
33
2013 2014 2015 2016 2017
Overall
Investment &Development
Appeal
Readiness
21
4534
33
Investment & Development
Appeal
Readiness
The direction of the triangle indicates the performance change from the last year: improved or stabledeclined
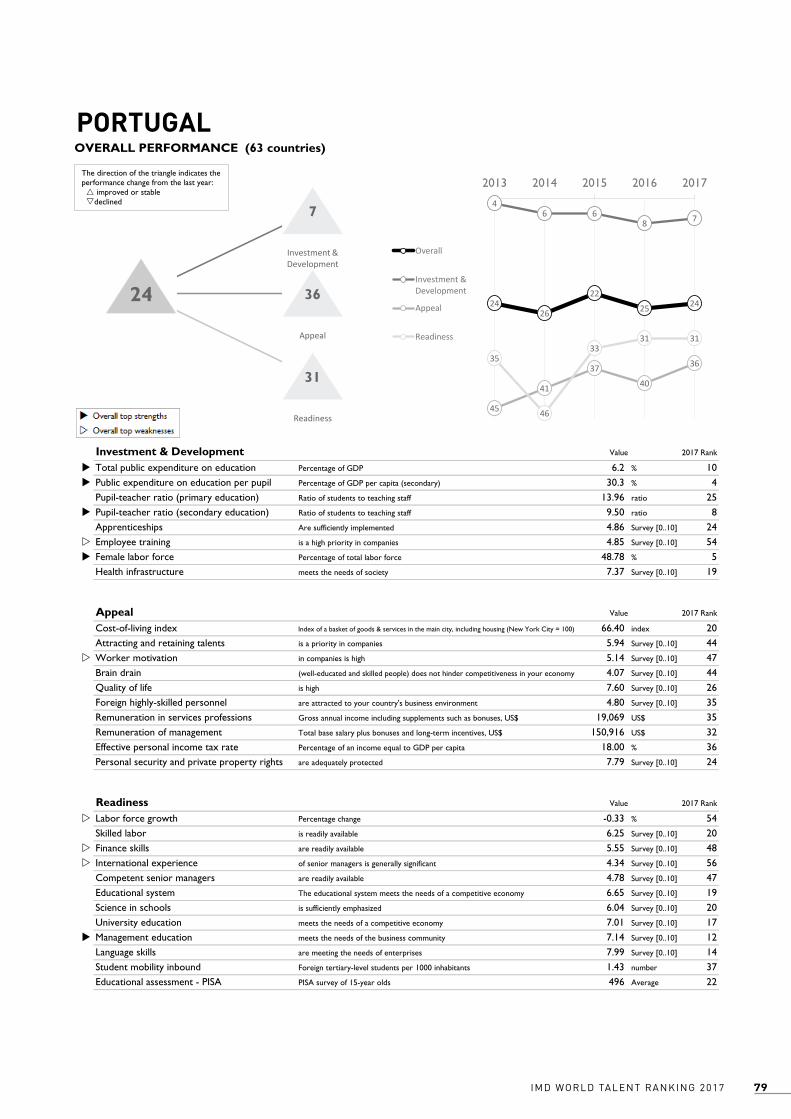
79IMD WORLD TALENT RANKING 2017
Alpha AlphaLabel Beta BetaLabel Gamma GammaLabel1 2 2 2 2 2 24 4 4 2 2
Value
u 6.2 % 10u 30.3 % 4 13.96 ratio 25u 9.50 ratio 8 4.86 Survey [0..10] 24w 4.85 Survey [0..10] 54u 48.78 % 5 7.37 Survey [0..10] 19
Value
66.40 index 20 5.94 Survey [0..10] 44w 5.14 Survey [0..10] 47 4.07 Survey [0..10] 44 7.60 Survey [0..10] 26 4.80 Survey [0..10] 35 19,069 US$ 35 150,916 US$ 32 18.00 % 36 7.79 Survey [0..10] 24
Value
w -0.33 % 54 6.25 Survey [0..10] 20w 5.55 Survey [0..10] 48w 4.34 Survey [0..10] 56 4.78 Survey [0..10] 47 6.65 Survey [0..10] 19 6.04 Survey [0..10] 20 7.01 Survey [0..10] 17u 7.14 Survey [0..10] 12 7.99 Survey [0..10] 14 1.43 number 37 496 Average 22
Investment & Development 2017 Rank
Health infrastructure meets the needs of society
2017 Rank
Total public expenditure on education Percentage of GDP
ApprenticeshipsEmployee training is a high priority in companies
Readiness 2017 Rank
Educational assessment - PISA PISA survey of 15-year olds
Appeal
Personal security and private property rights are adequately protected
Percentage change
Student mobility inbound Foreign tertiary-level students per 1000 inhabitants
Labor force growth
University education meets the needs of a competitive economy
Management education meets the needs of the business community
Language skills are meeting the needs of enterprises
Competent senior managers are readily available
Educational system The educational system meets the needs of a competitive economy
Science in schools is sufficiently emphasized
Skilled labor is readily available
Finance skills are readily available
International experience of senior managers is generally significant
Remuneration of management Total base salary plus bonuses and long-term incentives, US$
Effective personal income tax rate Percentage of an income equal to GDP per capita
Quality of life is high
Foreign highly-skilled personnel are attracted to your country's business environment
Remuneration in services professions Gross annual income including supplements such as bonuses, US$
Attracting and retaining talents is a priority in companies
Worker motivation in companies is high
Brain drain (well-educated and skilled people) does not hinder competitiveness in your economy
Public expenditure on education per pupil Percentage of GDP per capita (secondary)
Pupil-teacher ratio (primary education)
PORTUGAL
Ratio of students to teaching staff
Pupil-teacher ratio (secondary education) Ratio of students to teaching staff
Are sufficiently implemented
Female labor force Percentage of total labor force
Cost-of-living index Index of a basket of goods & services in the main city, including housing (New York City = 100)
IMD World Talent Ranking 2017
OVERALL PERFORMANCE (63 countries)
2426
22
25 24
46 6
8 7
45
41
37
40
3635
46
3331 31
2013 2014 2015 2016 2017
Overall
Investment &Development
Appeal
Readiness
7
3624
31
Investment & Development
Appeal
Readiness
The direction of the triangle indicates the performance change from the last year: improved or stabledeclined
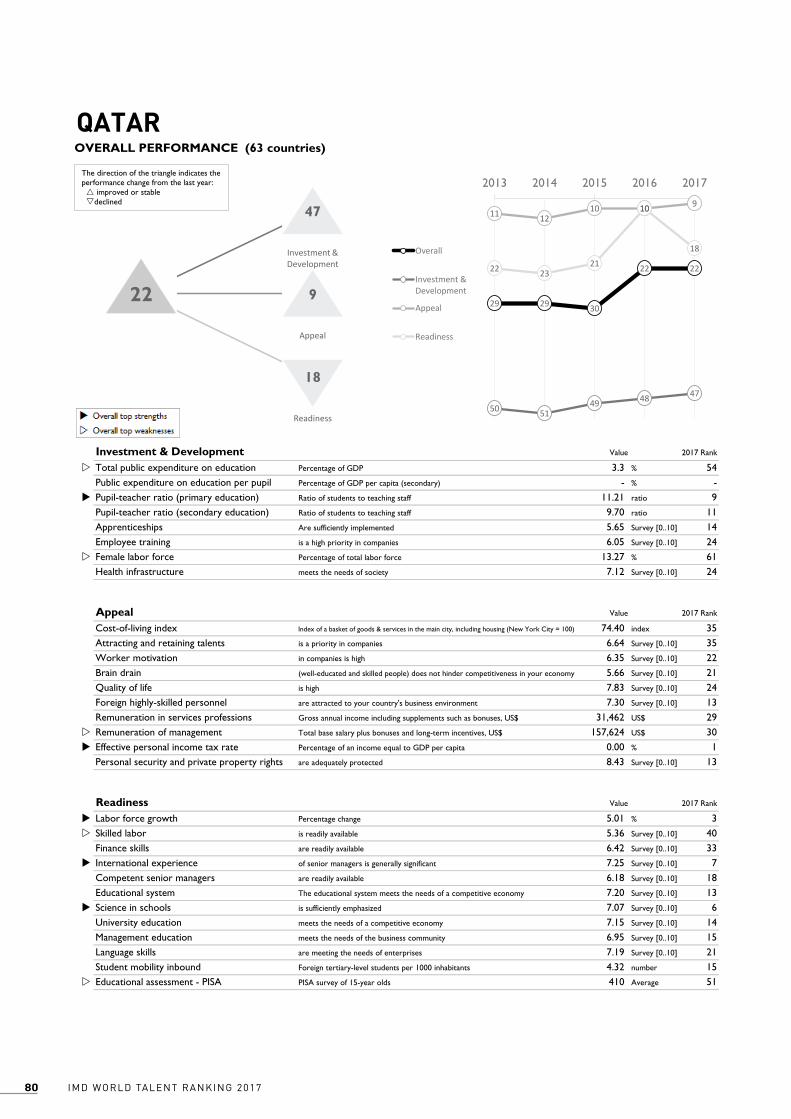
IMD WORLD TALENT RANKING 201780
Alpha AlphaLabel Beta BetaLabel Gamma GammaLabel1 2 2 2 2 2 24 4 4 2 2
Value
w 3.3 % 54 - % -u 11.21 ratio 9 9.70 ratio 11 5.65 Survey [0..10] 14 6.05 Survey [0..10] 24w 13.27 % 61 7.12 Survey [0..10] 24
Value
74.40 index 35 6.64 Survey [0..10] 35 6.35 Survey [0..10] 22 5.66 Survey [0..10] 21 7.83 Survey [0..10] 24 7.30 Survey [0..10] 13 31,462 US$ 29w 157,624 US$ 30u 0.00 % 1 8.43 Survey [0..10] 13
Value
u 5.01 % 3w 5.36 Survey [0..10] 40 6.42 Survey [0..10] 33u 7.25 Survey [0..10] 7 6.18 Survey [0..10] 18 7.20 Survey [0..10] 13u 7.07 Survey [0..10] 6 7.15 Survey [0..10] 14 6.95 Survey [0..10] 15 7.19 Survey [0..10] 21 4.32 number 15w 410 Average 51
Investment & Development 2017 Rank
Health infrastructure meets the needs of society
2017 Rank
Total public expenditure on education Percentage of GDP
ApprenticeshipsEmployee training is a high priority in companies
Readiness 2017 Rank
Educational assessment - PISA PISA survey of 15-year olds
Appeal
Personal security and private property rights are adequately protected
Percentage change
Student mobility inbound Foreign tertiary-level students per 1000 inhabitants
Labor force growth
University education meets the needs of a competitive economy
Management education meets the needs of the business community
Language skills are meeting the needs of enterprises
Competent senior managers are readily available
Educational system The educational system meets the needs of a competitive economy
Science in schools is sufficiently emphasized
Skilled labor is readily available
Finance skills are readily available
International experience of senior managers is generally significant
Remuneration of management Total base salary plus bonuses and long-term incentives, US$
Effective personal income tax rate Percentage of an income equal to GDP per capita
Quality of life is high
Foreign highly-skilled personnel are attracted to your country's business environment
Remuneration in services professions Gross annual income including supplements such as bonuses, US$
Attracting and retaining talents is a priority in companies
Worker motivation in companies is high
Brain drain (well-educated and skilled people) does not hinder competitiveness in your economy
Public expenditure on education per pupil Percentage of GDP per capita (secondary)
Pupil-teacher ratio (primary education)
QATAR
Ratio of students to teaching staff
Pupil-teacher ratio (secondary education) Ratio of students to teaching staff
Are sufficiently implemented
Female labor force Percentage of total labor force
Cost-of-living index Index of a basket of goods & services in the main city, including housing (New York City = 100)
IMD World Talent Ranking 2017
OVERALL PERFORMANCE (63 countries)
29 29 30
22 22
50 5149 48 47
11 1210 10 9
22 2321
10
18
2013 2014 2015 2016 2017
Overall
Investment &Development
Appeal
Readiness
47
922
18
Investment & Development
Appeal
Readiness
The direction of the triangle indicates the performance change from the last year: improved or stabledeclined
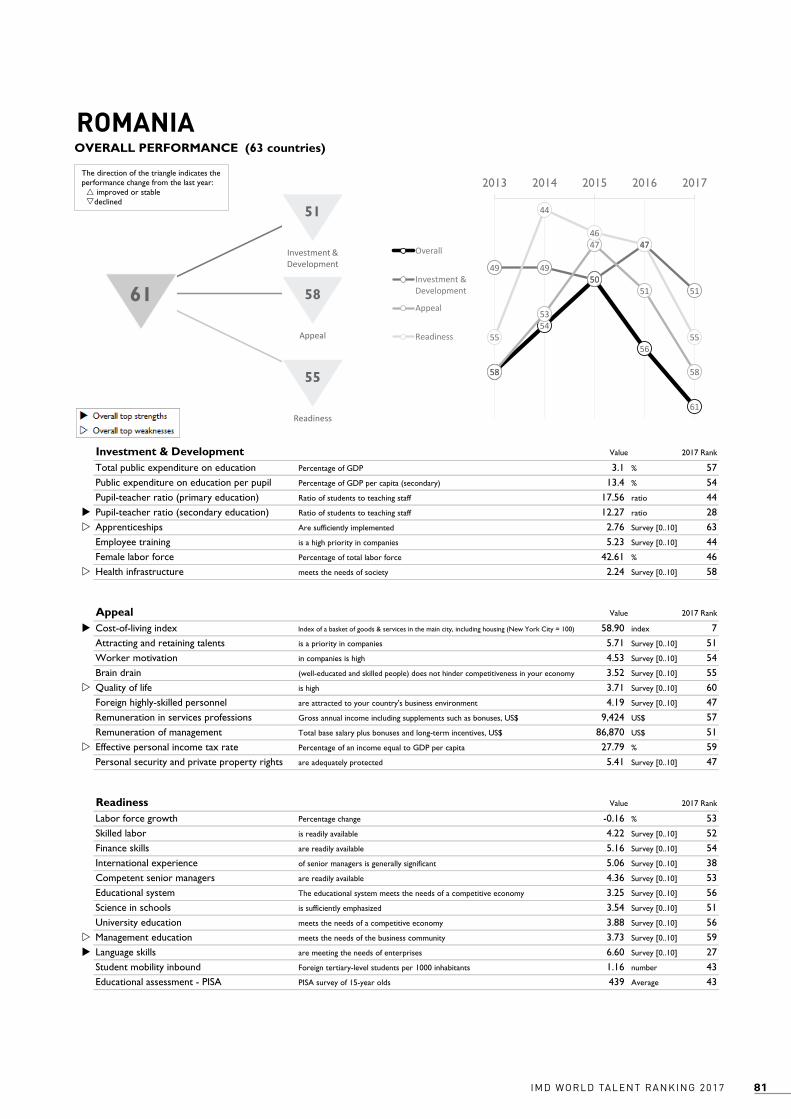
81IMD WORLD TALENT RANKING 2017
Alpha AlphaLabel Beta BetaLabel Gamma GammaLabel1 2 2 2 2 2 24 4 4 2 2
Value
3.1 % 57 13.4 % 54 17.56 ratio 44u 12.27 ratio 28w 2.76 Survey [0..10] 63 5.23 Survey [0..10] 44 42.61 % 46w 2.24 Survey [0..10] 58
Value
u 58.90 index 7 5.71 Survey [0..10] 51 4.53 Survey [0..10] 54 3.52 Survey [0..10] 55w 3.71 Survey [0..10] 60 4.19 Survey [0..10] 47 9,424 US$ 57 86,870 US$ 51w 27.79 % 59 5.41 Survey [0..10] 47
Value
-0.16 % 53 4.22 Survey [0..10] 52 5.16 Survey [0..10] 54 5.06 Survey [0..10] 38 4.36 Survey [0..10] 53 3.25 Survey [0..10] 56 3.54 Survey [0..10] 51 3.88 Survey [0..10] 56w 3.73 Survey [0..10] 59u 6.60 Survey [0..10] 27 1.16 number 43 439 Average 43
Investment & Development 2017 Rank
Health infrastructure meets the needs of society
2017 Rank
Total public expenditure on education Percentage of GDP
ApprenticeshipsEmployee training is a high priority in companies
Readiness 2017 Rank
Educational assessment - PISA PISA survey of 15-year olds
Appeal
Personal security and private property rights are adequately protected
Percentage change
Student mobility inbound Foreign tertiary-level students per 1000 inhabitants
Labor force growth
University education meets the needs of a competitive economy
Management education meets the needs of the business community
Language skills are meeting the needs of enterprises
Competent senior managers are readily available
Educational system The educational system meets the needs of a competitive economy
Science in schools is sufficiently emphasized
Skilled labor is readily available
Finance skills are readily available
International experience of senior managers is generally significant
Remuneration of management Total base salary plus bonuses and long-term incentives, US$
Effective personal income tax rate Percentage of an income equal to GDP per capita
Quality of life is high
Foreign highly-skilled personnel are attracted to your country's business environment
Remuneration in services professions Gross annual income including supplements such as bonuses, US$
Attracting and retaining talents is a priority in companies
Worker motivation in companies is high
Brain drain (well-educated and skilled people) does not hinder competitiveness in your economy
Public expenditure on education per pupil Percentage of GDP per capita (secondary)
Pupil-teacher ratio (primary education)
ROMANIA
Ratio of students to teaching staff
Pupil-teacher ratio (secondary education) Ratio of students to teaching staff
Are sufficiently implemented
Female labor force Percentage of total labor force
Cost-of-living index Index of a basket of goods & services in the main city, including housing (New York City = 100)
IMD World Talent Ranking 2017
OVERALL PERFORMANCE (63 countries)
58
54
50
56
61
49 4950
47
51
58
53
47
51
58
55
44
4647
55
2013 2014 2015 2016 2017
Overall
Investment &Development
Appeal
Readiness
51
5861
55
Investment & Development
Appeal
Readiness
The direction of the triangle indicates the performance change from the last year: improved or stabledeclined
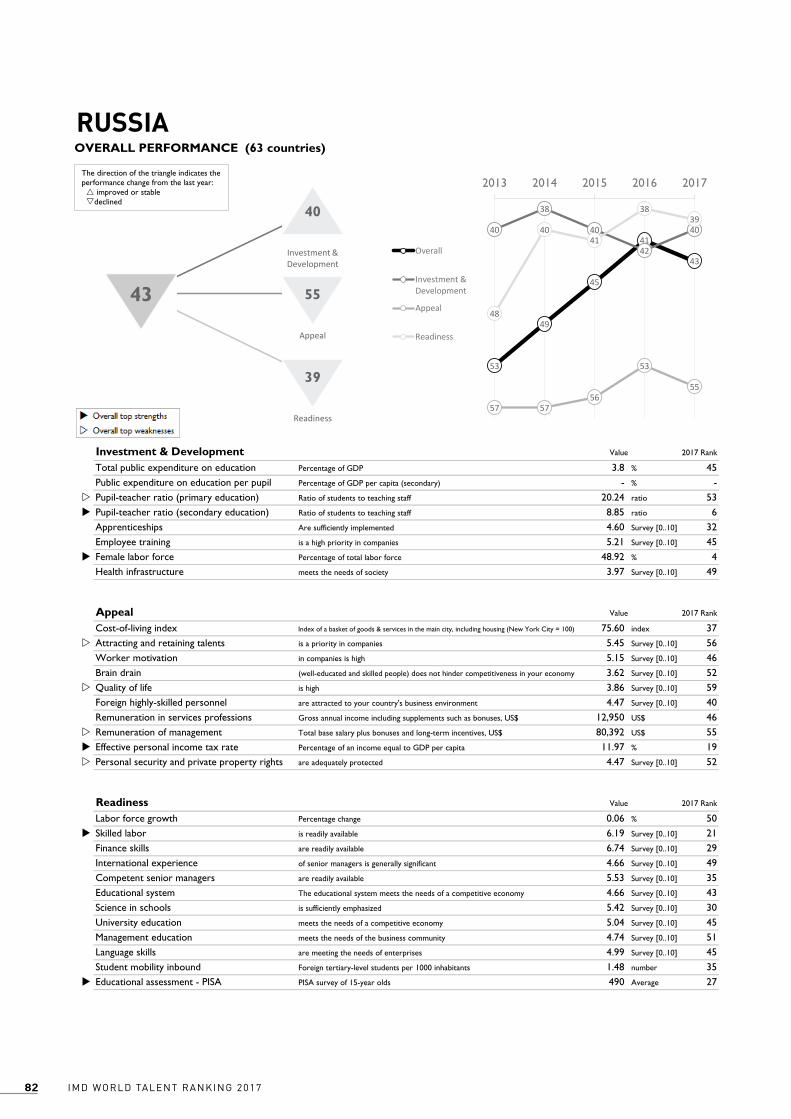
IMD WORLD TALENT RANKING 201782
Alpha AlphaLabel Beta BetaLabel Gamma GammaLabel1 2 2 2 2 2 24 4 4 2 2
Value
3.8 % 45 - % -w 20.24 ratio 53u 8.85 ratio 6 4.60 Survey [0..10] 32 5.21 Survey [0..10] 45u 48.92 % 4 3.97 Survey [0..10] 49
Value
75.60 index 37w 5.45 Survey [0..10] 56 5.15 Survey [0..10] 46 3.62 Survey [0..10] 52w 3.86 Survey [0..10] 59 4.47 Survey [0..10] 40 12,950 US$ 46w 80,392 US$ 55u 11.97 % 19w 4.47 Survey [0..10] 52
Value
0.06 % 50u 6.19 Survey [0..10] 21 6.74 Survey [0..10] 29 4.66 Survey [0..10] 49 5.53 Survey [0..10] 35 4.66 Survey [0..10] 43 5.42 Survey [0..10] 30 5.04 Survey [0..10] 45 4.74 Survey [0..10] 51 4.99 Survey [0..10] 45 1.48 number 35u 490 Average 27
Investment & Development 2017 Rank
Health infrastructure meets the needs of society
2017 Rank
Total public expenditure on education Percentage of GDP
ApprenticeshipsEmployee training is a high priority in companies
Readiness 2017 Rank
Educational assessment - PISA PISA survey of 15-year olds
Appeal
Personal security and private property rights are adequately protected
Percentage change
Student mobility inbound Foreign tertiary-level students per 1000 inhabitants
Labor force growth
University education meets the needs of a competitive economy
Management education meets the needs of the business community
Language skills are meeting the needs of enterprises
Competent senior managers are readily available
Educational system The educational system meets the needs of a competitive economy
Science in schools is sufficiently emphasized
Skilled labor is readily available
Finance skills are readily available
International experience of senior managers is generally significant
Remuneration of management Total base salary plus bonuses and long-term incentives, US$
Effective personal income tax rate Percentage of an income equal to GDP per capita
Quality of life is high
Foreign highly-skilled personnel are attracted to your country's business environment
Remuneration in services professions Gross annual income including supplements such as bonuses, US$
Attracting and retaining talents is a priority in companies
Worker motivation in companies is high
Brain drain (well-educated and skilled people) does not hinder competitiveness in your economy
Public expenditure on education per pupil Percentage of GDP per capita (secondary)
Pupil-teacher ratio (primary education)
RUSSIA
Ratio of students to teaching staff
Pupil-teacher ratio (secondary education) Ratio of students to teaching staff
Are sufficiently implemented
Female labor force Percentage of total labor force
Cost-of-living index Index of a basket of goods & services in the main city, including housing (New York City = 100)
IMD World Talent Ranking 2017
OVERALL PERFORMANCE (63 countries)
53
49
45
41
43
40
38
40
42
40
57 5756
53
55
48
4041
3839
2013 2014 2015 2016 2017
Overall
Investment &Development
Appeal
Readiness
40
5543
39
Investment & Development
Appeal
Readiness
The direction of the triangle indicates the performance change from the last year: improved or stabledeclined
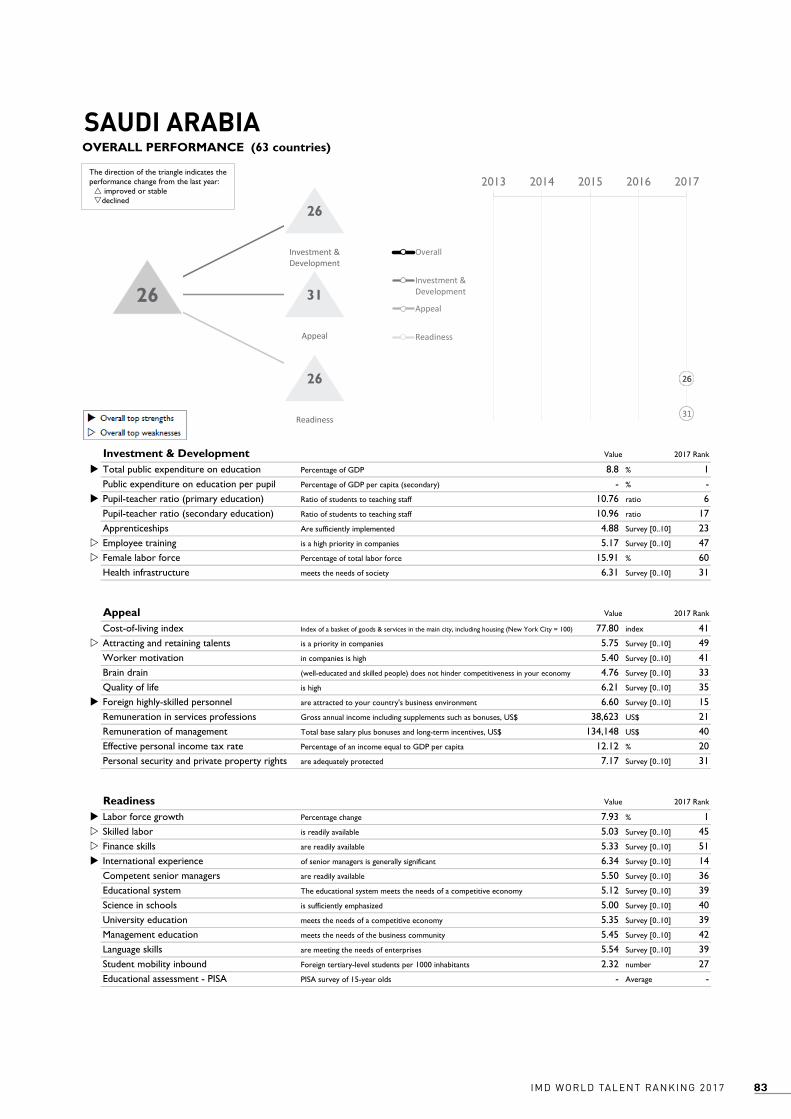
83IMD WORLD TALENT RANKING 2017
Alpha AlphaLabel Beta BetaLabel Gamma GammaLabel1 2 2 2 2 2 24 4 4 2 2
Value
u 8.8 % 1 - % -u 10.76 ratio 6 10.96 ratio 17 4.88 Survey [0..10] 23w 5.17 Survey [0..10] 47w 15.91 % 60 6.31 Survey [0..10] 31
Value
77.80 index 41w 5.75 Survey [0..10] 49 5.40 Survey [0..10] 41 4.76 Survey [0..10] 33 6.21 Survey [0..10] 35u 6.60 Survey [0..10] 15 38,623 US$ 21 134,148 US$ 40 12.12 % 20 7.17 Survey [0..10] 31
Value
u 7.93 % 1w 5.03 Survey [0..10] 45w 5.33 Survey [0..10] 51u 6.34 Survey [0..10] 14 5.50 Survey [0..10] 36 5.12 Survey [0..10] 39 5.00 Survey [0..10] 40 5.35 Survey [0..10] 39 5.45 Survey [0..10] 42 5.54 Survey [0..10] 39 2.32 number 27 - Average -
Investment & Development 2017 Rank
Health infrastructure meets the needs of society
2017 Rank
Total public expenditure on education Percentage of GDP
ApprenticeshipsEmployee training is a high priority in companies
Readiness 2017 Rank
Educational assessment - PISA PISA survey of 15-year olds
Appeal
Personal security and private property rights are adequately protected
Percentage change
Student mobility inbound Foreign tertiary-level students per 1000 inhabitants
Labor force growth
University education meets the needs of a competitive economy
Management education meets the needs of the business community
Language skills are meeting the needs of enterprises
Competent senior managers are readily available
Educational system The educational system meets the needs of a competitive economy
Science in schools is sufficiently emphasized
Skilled labor is readily available
Finance skills are readily available
International experience of senior managers is generally significant
Remuneration of management Total base salary plus bonuses and long-term incentives, US$
Effective personal income tax rate Percentage of an income equal to GDP per capita
Quality of life is high
Foreign highly-skilled personnel are attracted to your country's business environment
Remuneration in services professions Gross annual income including supplements such as bonuses, US$
Attracting and retaining talents is a priority in companies
Worker motivation in companies is high
Brain drain (well-educated and skilled people) does not hinder competitiveness in your economy
Public expenditure on education per pupil Percentage of GDP per capita (secondary)
Pupil-teacher ratio (primary education)
SAUDI ARABIA
Ratio of students to teaching staff
Pupil-teacher ratio (secondary education) Ratio of students to teaching staff
Are sufficiently implemented
Female labor force Percentage of total labor force
Cost-of-living index Index of a basket of goods & services in the main city, including housing (New York City = 100)
IMD World Talent Ranking 2017
OVERALL PERFORMANCE (63 countries)
2626
31
26
2013 2014 2015 2016 2017
Overall
Investment &Development
Appeal
Readiness
26
3126
26
Investment & Development
Appeal
Readiness
The direction of the triangle indicates the performance change from the last year: improved or stabledeclined

IMD WORLD TALENT RANKING 201784
Alpha AlphaLabel Beta BetaLabel Gamma GammaLabel1 2 2 2 2 2 24 4 4 2 2
Value
w 2.9 % 59w 16.7 % 46 16.50 ratio 37 12.50 ratio 30 5.25 Survey [0..10] 19 6.00 Survey [0..10] 25 44.80 % 37 8.15 Survey [0..10] 8
Value
w 106.80 index 59 7.24 Survey [0..10] 16 6.84 Survey [0..10] 15 6.36 Survey [0..10] 10 8.56 Survey [0..10] 17u 8.22 Survey [0..10] 3 39,280 US$ 18 261,509 US$ 6w 21.51 % 45 8.92 Survey [0..10] 6
Value
w 0.67 % 37 6.53 Survey [0..10] 12 7.28 Survey [0..10] 13 7.30 Survey [0..10] 6 6.94 Survey [0..10] 6 7.88 Survey [0..10] 6u 8.29 Survey [0..10] 1 7.85 Survey [0..10] 6u 7.66 Survey [0..10] 4 8.14 Survey [0..10] 11u 9.06 number 3u 560 Average 1
Investment & Development 2017 Rank
Health infrastructure meets the needs of society
2017 Rank
Total public expenditure on education Percentage of GDP
ApprenticeshipsEmployee training is a high priority in companies
Readiness 2017 Rank
Educational assessment - PISA PISA survey of 15-year olds
Appeal
Personal security and private property rights are adequately protected
Percentage change
Student mobility inbound Foreign tertiary-level students per 1000 inhabitants
Labor force growth
University education meets the needs of a competitive economy
Management education meets the needs of the business community
Language skills are meeting the needs of enterprises
Competent senior managers are readily available
Educational system The educational system meets the needs of a competitive economy
Science in schools is sufficiently emphasized
Skilled labor is readily available
Finance skills are readily available
International experience of senior managers is generally significant
Remuneration of management Total base salary plus bonuses and long-term incentives, US$
Effective personal income tax rate Percentage of an income equal to GDP per capita
Quality of life is high
Foreign highly-skilled personnel are attracted to your country's business environment
Remuneration in services professions Gross annual income including supplements such as bonuses, US$
Attracting and retaining talents is a priority in companies
Worker motivation in companies is high
Brain drain (well-educated and skilled people) does not hinder competitiveness in your economy
Public expenditure on education per pupil Percentage of GDP per capita (secondary)
Pupil-teacher ratio (primary education)
SINGAPORE
Ratio of students to teaching staff
Pupil-teacher ratio (secondary education) Ratio of students to teaching staff
Are sufficiently implemented
Female labor force Percentage of total labor force
Cost-of-living index Index of a basket of goods & services in the main city, including housing (New York City = 100)
IMD World Talent Ranking 2017
OVERALL PERFORMANCE (63 countries)
18 18
14 1513
4143 42
40 41
22 21 2119
17
1 1 1 2 2
2013 2014 2015 2016 2017
Overall
Investment &Development
Appeal
Readiness
41
1713
2
Investment & Development
Appeal
Readiness
The direction of the triangle indicates the performance change from the last year: improved or stabledeclined
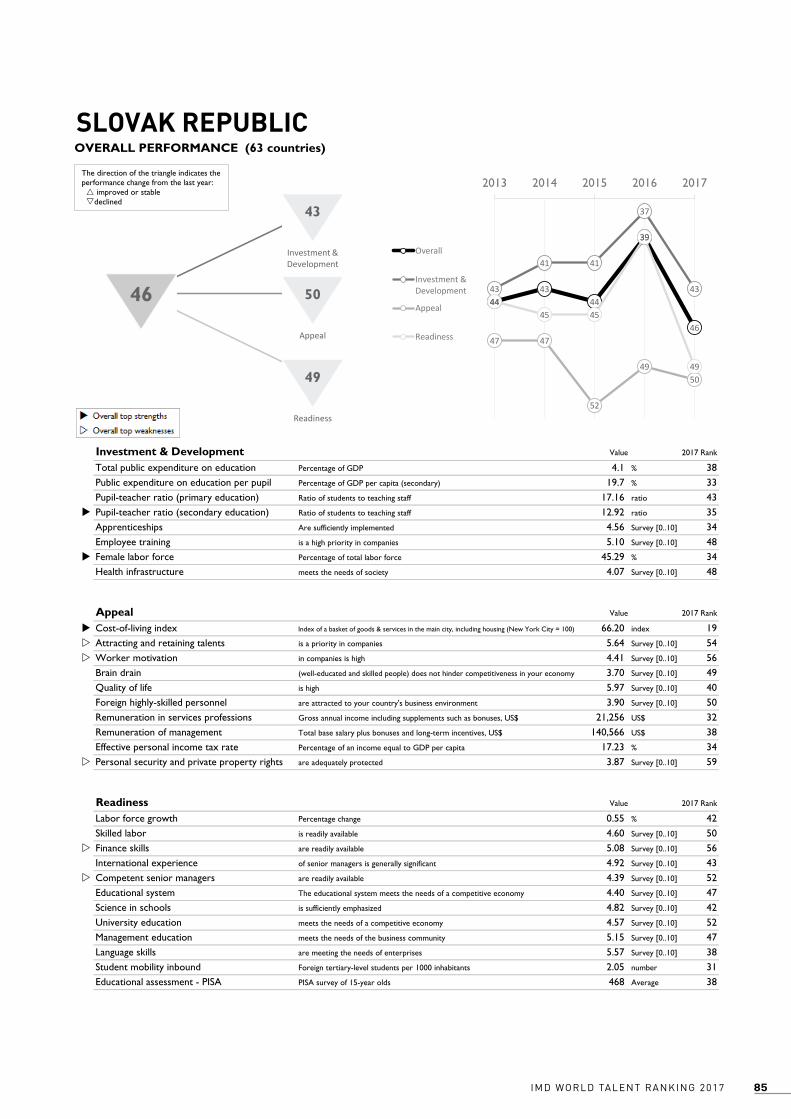
85IMD WORLD TALENT RANKING 2017
Alpha AlphaLabel Beta BetaLabel Gamma GammaLabel1 2 2 2 2 2 24 4 4 2 2
Value
4.1 % 38 19.7 % 33 17.16 ratio 43u 12.92 ratio 35 4.56 Survey [0..10] 34 5.10 Survey [0..10] 48u 45.29 % 34 4.07 Survey [0..10] 48
Value
u 66.20 index 19w 5.64 Survey [0..10] 54w 4.41 Survey [0..10] 56 3.70 Survey [0..10] 49 5.97 Survey [0..10] 40 3.90 Survey [0..10] 50 21,256 US$ 32 140,566 US$ 38 17.23 % 34w 3.87 Survey [0..10] 59
Value
0.55 % 42 4.60 Survey [0..10] 50w 5.08 Survey [0..10] 56 4.92 Survey [0..10] 43w 4.39 Survey [0..10] 52 4.40 Survey [0..10] 47 4.82 Survey [0..10] 42 4.57 Survey [0..10] 52 5.15 Survey [0..10] 47 5.57 Survey [0..10] 38 2.05 number 31 468 Average 38
Investment & Development 2017 Rank
Health infrastructure meets the needs of society
2017 Rank
Total public expenditure on education Percentage of GDP
ApprenticeshipsEmployee training is a high priority in companies
Readiness 2017 Rank
Educational assessment - PISA PISA survey of 15-year olds
Appeal
Personal security and private property rights are adequately protected
Percentage change
Student mobility inbound Foreign tertiary-level students per 1000 inhabitants
Labor force growth
University education meets the needs of a competitive economy
Management education meets the needs of the business community
Language skills are meeting the needs of enterprises
Competent senior managers are readily available
Educational system The educational system meets the needs of a competitive economy
Science in schools is sufficiently emphasized
Skilled labor is readily available
Finance skills are readily available
International experience of senior managers is generally significant
Remuneration of management Total base salary plus bonuses and long-term incentives, US$
Effective personal income tax rate Percentage of an income equal to GDP per capita
Quality of life is high
Foreign highly-skilled personnel are attracted to your country's business environment
Remuneration in services professions Gross annual income including supplements such as bonuses, US$
Attracting and retaining talents is a priority in companies
Worker motivation in companies is high
Brain drain (well-educated and skilled people) does not hinder competitiveness in your economy
Public expenditure on education per pupil Percentage of GDP per capita (secondary)
Pupil-teacher ratio (primary education)
SLOVAK REPUBLIC
Ratio of students to teaching staff
Pupil-teacher ratio (secondary education) Ratio of students to teaching staff
Are sufficiently implemented
Female labor force Percentage of total labor force
Cost-of-living index Index of a basket of goods & services in the main city, including housing (New York City = 100)
IMD World Talent Ranking 2017
OVERALL PERFORMANCE (63 countries)
4443
44
39
46
43
41 41
37
43
47 47
52
4950
4445 45
39
49
2013 2014 2015 2016 2017
Overall
Investment &Development
Appeal
Readiness
43
5046
49
Investment & Development
Appeal
Readiness
The direction of the triangle indicates the performance change from the last year: improved or stabledeclined

IMD WORLD TALENT RANKING 201786
Alpha AlphaLabel Beta BetaLabel Gamma GammaLabel1 2 2 2 2 2 24 4 4 2 2
Value
4.9 % 28u 26.8 % 8 15.86 ratio 32u 10.89 ratio 16w 2.90 Survey [0..10] 62 6.16 Survey [0..10] 22 46.62 % 24 4.76 Survey [0..10] 41
Value
u 63.00 index 13 5.78 Survey [0..10] 48 5.30 Survey [0..10] 43w 3.67 Survey [0..10] 50 7.56 Survey [0..10] 28w 2.92 Survey [0..10] 59 23,308 US$ 31 120,727 US$ 41w 26.73 % 54 6.72 Survey [0..10] 35
Value
w -1.31 % 60 5.38 Survey [0..10] 39 6.18 Survey [0..10] 36 4.86 Survey [0..10] 45 4.62 Survey [0..10] 48 5.57 Survey [0..10] 33 5.54 Survey [0..10] 28 5.42 Survey [0..10] 38 5.90 Survey [0..10] 38u 7.50 Survey [0..10] 19 1.21 number 41u 511 Average 11
Investment & Development 2017 Rank
Health infrastructure meets the needs of society
2017 Rank
Total public expenditure on education Percentage of GDP
ApprenticeshipsEmployee training is a high priority in companies
Readiness 2017 Rank
Educational assessment - PISA PISA survey of 15-year olds
Appeal
Personal security and private property rights are adequately protected
Percentage change
Student mobility inbound Foreign tertiary-level students per 1000 inhabitants
Labor force growth
University education meets the needs of a competitive economy
Management education meets the needs of the business community
Language skills are meeting the needs of enterprises
Competent senior managers are readily available
Educational system The educational system meets the needs of a competitive economy
Science in schools is sufficiently emphasized
Skilled labor is readily available
Finance skills are readily available
International experience of senior managers is generally significant
Remuneration of management Total base salary plus bonuses and long-term incentives, US$
Effective personal income tax rate Percentage of an income equal to GDP per capita
Quality of life is high
Foreign highly-skilled personnel are attracted to your country's business environment
Remuneration in services professions Gross annual income including supplements such as bonuses, US$
Attracting and retaining talents is a priority in companies
Worker motivation in companies is high
Brain drain (well-educated and skilled people) does not hinder competitiveness in your economy
Public expenditure on education per pupil Percentage of GDP per capita (secondary)
Pupil-teacher ratio (primary education)
SLOVENIA
Ratio of students to teaching staff
Pupil-teacher ratio (secondary education) Ratio of students to teaching staff
Are sufficiently implemented
Female labor force Percentage of total labor force
Cost-of-living index Index of a basket of goods & services in the main city, including housing (New York City = 100)
IMD World Talent Ranking 2017
OVERALL PERFORMANCE (63 countries)
3839
3736
37
2422
25
21
27
52
5554
4849
4342
3837 37
2013 2014 2015 2016 2017
Overall
Investment &Development
Appeal
Readiness
27
4937
37
Investment & Development
Appeal
Readiness
The direction of the triangle indicates the performance change from the last year: improved or stabledeclined
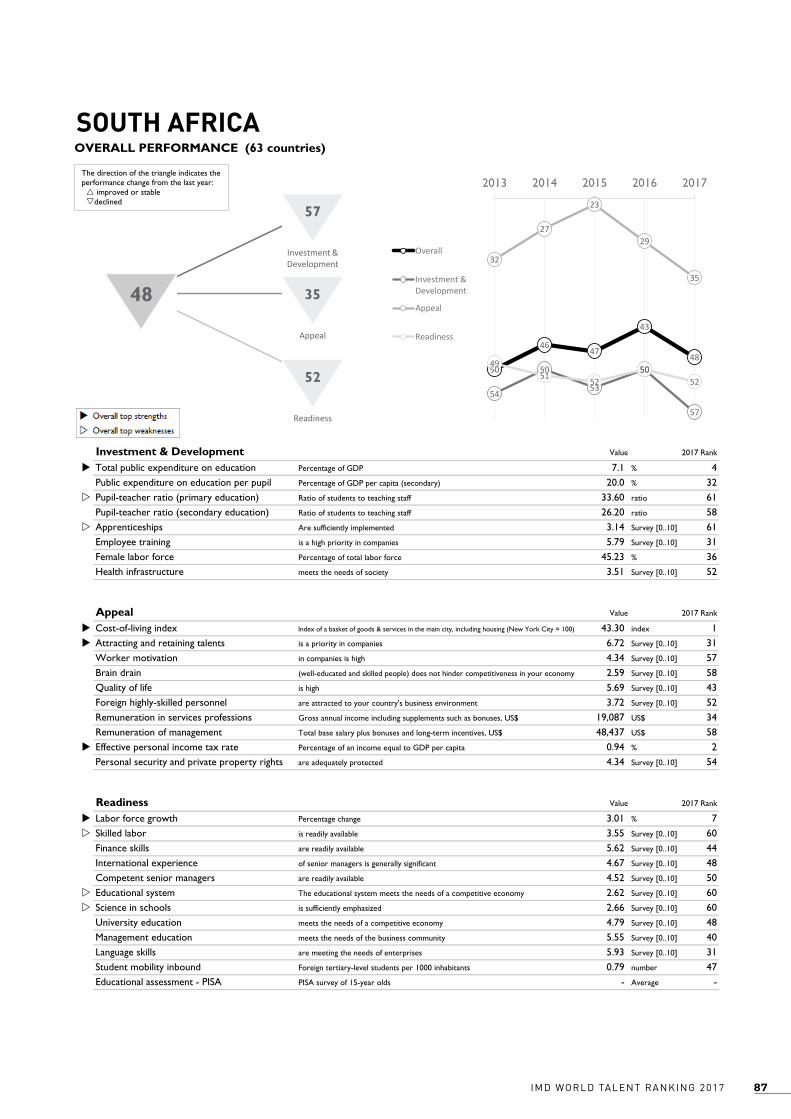
87IMD WORLD TALENT RANKING 2017
Alpha AlphaLabel Beta BetaLabel Gamma GammaLabel1 2 2 2 2 2 24 4 4 2 2
Value
u 7.1 % 4 20.0 % 32w 33.60 ratio 61 26.20 ratio 58w 3.14 Survey [0..10] 61 5.79 Survey [0..10] 31 45.23 % 36 3.51 Survey [0..10] 52
Value
u 43.30 index 1u 6.72 Survey [0..10] 31 4.34 Survey [0..10] 57 2.59 Survey [0..10] 58 5.69 Survey [0..10] 43 3.72 Survey [0..10] 52 19,087 US$ 34 48,437 US$ 58u 0.94 % 2 4.34 Survey [0..10] 54
Value
u 3.01 % 7w 3.55 Survey [0..10] 60 5.62 Survey [0..10] 44 4.67 Survey [0..10] 48 4.52 Survey [0..10] 50w 2.62 Survey [0..10] 60w 2.66 Survey [0..10] 60 4.79 Survey [0..10] 48 5.55 Survey [0..10] 40 5.93 Survey [0..10] 31 0.79 number 47 - Average -
Investment & Development 2017 Rank
Health infrastructure meets the needs of society
2017 Rank
Total public expenditure on education Percentage of GDP
ApprenticeshipsEmployee training is a high priority in companies
Readiness 2017 Rank
Educational assessment - PISA PISA survey of 15-year olds
Appeal
Personal security and private property rights are adequately protected
Percentage change
Student mobility inbound Foreign tertiary-level students per 1000 inhabitants
Labor force growth
University education meets the needs of a competitive economy
Management education meets the needs of the business community
Language skills are meeting the needs of enterprises
Competent senior managers are readily available
Educational system The educational system meets the needs of a competitive economy
Science in schools is sufficiently emphasized
Skilled labor is readily available
Finance skills are readily available
International experience of senior managers is generally significant
Remuneration of management Total base salary plus bonuses and long-term incentives, US$
Effective personal income tax rate Percentage of an income equal to GDP per capita
Quality of life is high
Foreign highly-skilled personnel are attracted to your country's business environment
Remuneration in services professions Gross annual income including supplements such as bonuses, US$
Attracting and retaining talents is a priority in companies
Worker motivation in companies is high
Brain drain (well-educated and skilled people) does not hinder competitiveness in your economy
Public expenditure on education per pupil Percentage of GDP per capita (secondary)
Pupil-teacher ratio (primary education)
SOUTH AFRICA
Ratio of students to teaching staff
Pupil-teacher ratio (secondary education) Ratio of students to teaching staff
Are sufficiently implemented
Female labor force Percentage of total labor force
Cost-of-living index Index of a basket of goods & services in the main city, including housing (New York City = 100)
IMD World Talent Ranking 2017
OVERALL PERFORMANCE (63 countries)
50
4647
43
48
54
50
53
50
57
32
27
23
29
35
4951
5250
52
2013 2014 2015 2016 2017
Overall
Investment &Development
Appeal
Readiness
57
3548
52
Investment & Development
Appeal
Readiness
The direction of the triangle indicates the performance change from the last year: improved or stabledeclined

IMD WORLD TALENT RANKING 201788
Alpha AlphaLabel Beta BetaLabel Gamma GammaLabel1 2 2 2 2 2 24 4 4 2 2
Value
4.1 % 39 22.5 % 25 13.54 ratio 23u 11.53 ratio 21w 4.03 Survey [0..10] 50w 4.46 Survey [0..10] 58 46.48 % 25u 8.14 Survey [0..10] 9
Value
70.80 index 25w 5.24 Survey [0..10] 59 5.23 Survey [0..10] 44 4.85 Survey [0..10] 31u 8.46 Survey [0..10] 19 5.94 Survey [0..10] 22 32,662 US$ 27u 193,092 US$ 21 13.70 % 22 7.68 Survey [0..10] 27
Value
w -0.43 % 55u 6.42 Survey [0..10] 15 6.00 Survey [0..10] 39 4.82 Survey [0..10] 46 5.44 Survey [0..10] 40 5.30 Survey [0..10] 36 4.79 Survey [0..10] 43 5.15 Survey [0..10] 44 6.35 Survey [0..10] 28w 3.83 Survey [0..10] 56 1.21 number 42 489 Average 28
Investment & Development 2017 Rank
Health infrastructure meets the needs of society
2017 Rank
Total public expenditure on education Percentage of GDP
ApprenticeshipsEmployee training is a high priority in companies
Readiness 2017 Rank
Educational assessment - PISA PISA survey of 15-year olds
Appeal
Personal security and private property rights are adequately protected
Percentage change
Student mobility inbound Foreign tertiary-level students per 1000 inhabitants
Labor force growth
University education meets the needs of a competitive economy
Management education meets the needs of the business community
Language skills are meeting the needs of enterprises
Competent senior managers are readily available
Educational system The educational system meets the needs of a competitive economy
Science in schools is sufficiently emphasized
Skilled labor is readily available
Finance skills are readily available
International experience of senior managers is generally significant
Remuneration of management Total base salary plus bonuses and long-term incentives, US$
Effective personal income tax rate Percentage of an income equal to GDP per capita
Quality of life is high
Foreign highly-skilled personnel are attracted to your country's business environment
Remuneration in services professions Gross annual income including supplements such as bonuses, US$
Attracting and retaining talents is a priority in companies
Worker motivation in companies is high
Brain drain (well-educated and skilled people) does not hinder competitiveness in your economy
Public expenditure on education per pupil Percentage of GDP per capita (secondary)
Pupil-teacher ratio (primary education)
SPAIN
Ratio of students to teaching staff
Pupil-teacher ratio (secondary education) Ratio of students to teaching staff
Are sufficiently implemented
Female labor force Percentage of total labor force
Cost-of-living index Index of a basket of goods & services in the main city, including housing (New York City = 100)
IMD World Talent Ranking 2017
OVERALL PERFORMANCE (63 countries)
34
31
3534
32
26 26
29
3130
37
26
32
27
25
46
50
48
44
41
2013 2014 2015 2016 2017
Overall
Investment &Development
Appeal
Readiness
30
2532
41
Investment & Development
Appeal
Readiness
The direction of the triangle indicates the performance change from the last year: improved or stabledeclined

89IMD WORLD TALENT RANKING 2017
Alpha AlphaLabel Beta BetaLabel Gamma GammaLabel1 2 2 2 2 2 24 4 4 2 2
Value
u 7.1 % 3 24.6 % 16 12.74 ratio 19 13.09 ratio 36w 4.36 Survey [0..10] 43 6.75 Survey [0..10] 12 47.62 % 12 7.21 Survey [0..10] 22
Value
72.70 index 31 7.56 Survey [0..10] 10 7.15 Survey [0..10] 9u 6.42 Survey [0..10] 8u 9.23 Survey [0..10] 7 5.78 Survey [0..10] 27u 47,831 US$ 8 216,928 US$ 15w 23.82 % 49 7.97 Survey [0..10] 20
Value
w 1.03 % 28 5.97 Survey [0..10] 29 6.93 Survey [0..10] 21 6.71 Survey [0..10] 9 6.63 Survey [0..10] 10 6.68 Survey [0..10] 17 5.73 Survey [0..10] 26 6.93 Survey [0..10] 19 6.90 Survey [0..10] 18u 8.63 Survey [0..10] 4w 2.60 number 25 494 Average 25
Investment & Development 2017 Rank
Health infrastructure meets the needs of society
2017 Rank
Total public expenditure on education Percentage of GDP
ApprenticeshipsEmployee training is a high priority in companies
Readiness 2017 Rank
Educational assessment - PISA PISA survey of 15-year olds
Appeal
Personal security and private property rights are adequately protected
Percentage change
Student mobility inbound Foreign tertiary-level students per 1000 inhabitants
Labor force growth
University education meets the needs of a competitive economy
Management education meets the needs of the business community
Language skills are meeting the needs of enterprises
Competent senior managers are readily available
Educational system The educational system meets the needs of a competitive economy
Science in schools is sufficiently emphasized
Skilled labor is readily available
Finance skills are readily available
International experience of senior managers is generally significant
Remuneration of management Total base salary plus bonuses and long-term incentives, US$
Effective personal income tax rate Percentage of an income equal to GDP per capita
Quality of life is high
Foreign highly-skilled personnel are attracted to your country's business environment
Remuneration in services professions Gross annual income including supplements such as bonuses, US$
Attracting and retaining talents is a priority in companies
Worker motivation in companies is high
Brain drain (well-educated and skilled people) does not hinder competitiveness in your economy
Public expenditure on education per pupil Percentage of GDP per capita (secondary)
Pupil-teacher ratio (primary education)
SWEDEN
Ratio of students to teaching staff
Pupil-teacher ratio (secondary education) Ratio of students to teaching staff
Are sufficiently implemented
Female labor force Percentage of total labor force
Cost-of-living index Index of a basket of goods & services in the main city, including housing (New York City = 100)
IMD World Talent Ranking 2017
OVERALL PERFORMANCE (63 countries)
34
7
4
9
32
5
7
98
9
12
6
12
6
14
1615
19
2013 2014 2015 2016 2017
Overall
Investment &Development
Appeal
Readiness
9
129
19
Investment & Development
Appeal
Readiness
The direction of the triangle indicates the performance change from the last year: improved or stabledeclined

IMD WORLD TALENT RANKING 201790
Alpha AlphaLabel Beta BetaLabel Gamma GammaLabel1 2 2 2 2 2 24 4 4 2 2
Value
5.0 % 27 26.1 % 10 14.81 ratio 26 11.40 ratio 20u 8.81 Survey [0..10] 1 7.46 Survey [0..10] 3 46.71 % 22 9.20 Survey [0..10] 1
Value
w 107.40 index 60 7.84 Survey [0..10] 4 7.83 Survey [0..10] 3 7.61 Survey [0..10] 2 9.69 Survey [0..10] 2u 8.84 Survey [0..10] 1u 92,625 US$ 1u 431,603 US$ 1 10.91 % 18 9.11 Survey [0..10] 3
Value
1.76 % 18 6.81 Survey [0..10] 7 8.11 Survey [0..10] 2 8.04 Survey [0..10] 2 7.06 Survey [0..10] 5 8.94 Survey [0..10] 1 8.10 Survey [0..10] 2 8.88 Survey [0..10] 1u 8.65 Survey [0..10] 1 8.77 Survey [0..10] 3 6.09 number 8 513 Average 10
Investment & Development 2017 Rank
Health infrastructure meets the needs of society
2017 Rank
Total public expenditure on education Percentage of GDP
ApprenticeshipsEmployee training is a high priority in companies
Readiness 2017 Rank
Educational assessment - PISA PISA survey of 15-year olds
Appeal
Personal security and private property rights are adequately protected
Percentage change
Student mobility inbound Foreign tertiary-level students per 1000 inhabitants
Labor force growth
University education meets the needs of a competitive economy
Management education meets the needs of the business community
Language skills are meeting the needs of enterprises
Competent senior managers are readily available
Educational system The educational system meets the needs of a competitive economy
Science in schools is sufficiently emphasized
Skilled labor is readily available
Finance skills are readily available
International experience of senior managers is generally significant
Remuneration of management Total base salary plus bonuses and long-term incentives, US$
Effective personal income tax rate Percentage of an income equal to GDP per capita
Quality of life is high
Foreign highly-skilled personnel are attracted to your country's business environment
Remuneration in services professions Gross annual income including supplements such as bonuses, US$
Attracting and retaining talents is a priority in companies
Worker motivation in companies is high
Brain drain (well-educated and skilled people) does not hinder competitiveness in your economy
Public expenditure on education per pupil Percentage of GDP per capita (secondary)
Pupil-teacher ratio (primary education)
SWITZERLAND
Ratio of students to teaching staff
Pupil-teacher ratio (secondary education) Ratio of students to teaching staff
Are sufficiently implemented
Female labor force Percentage of total labor force
Cost-of-living index Index of a basket of goods & services in the main city, including housing (New York City = 100)
IMD World Talent Ranking 2017
OVERALL PERFORMANCE (63 countries)
1 1 1 1 1
7 7 7
5 5
1 1 1 1 1
2 2 2
1 1
2013 2014 2015 2016 2017
Overall
Investment &Development
Appeal
Readiness
5
11
1
Investment & Development
Appeal
Readiness
The direction of the triangle indicates the performance change from the last year: improved or stabledeclined

91IMD WORLD TALENT RANKING 2017
Alpha AlphaLabel Beta BetaLabel Gamma GammaLabel1 2 2 2 2 2 24 4 4 2 2
Value
w 3.8 % 46 21.1 % 31 12.70 ratio 17w 14.60 ratio 45 5.47 Survey [0..10] 18u 6.80 Survey [0..10] 10 44.22 % 40 8.03 Survey [0..10] 12
Value
w 80.30 index 47 6.54 Survey [0..10] 38 6.82 Survey [0..10] 16w 3.96 Survey [0..10] 47 7.18 Survey [0..10] 30w 4.33 Survey [0..10] 44 26,313 US$ 30 157,405 US$ 31u 6.79 % 9 7.54 Survey [0..10] 28
Value
0.76 % 34 5.92 Survey [0..10] 30 6.69 Survey [0..10] 30 5.36 Survey [0..10] 31 5.86 Survey [0..10] 26 6.45 Survey [0..10] 21u 6.62 Survey [0..10] 10 5.85 Survey [0..10] 31 6.24 Survey [0..10] 29 5.82 Survey [0..10] 36u 4.74 number 12u 537 Average 2
Investment & Development 2017 Rank
Health infrastructure meets the needs of society
2017 Rank
Total public expenditure on education Percentage of GDP
ApprenticeshipsEmployee training is a high priority in companies
Readiness 2017 Rank
Educational assessment - PISA PISA survey of 15-year olds
Appeal
Personal security and private property rights are adequately protected
Percentage change
Student mobility inbound Foreign tertiary-level students per 1000 inhabitants
Labor force growth
University education meets the needs of a competitive economy
Management education meets the needs of the business community
Language skills are meeting the needs of enterprises
Competent senior managers are readily available
Educational system The educational system meets the needs of a competitive economy
Science in schools is sufficiently emphasized
Skilled labor is readily available
Finance skills are readily available
International experience of senior managers is generally significant
Remuneration of management Total base salary plus bonuses and long-term incentives, US$
Effective personal income tax rate Percentage of an income equal to GDP per capita
Quality of life is high
Foreign highly-skilled personnel are attracted to your country's business environment
Remuneration in services professions Gross annual income including supplements such as bonuses, US$
Attracting and retaining talents is a priority in companies
Worker motivation in companies is high
Brain drain (well-educated and skilled people) does not hinder competitiveness in your economy
Public expenditure on education per pupil Percentage of GDP per capita (secondary)
Pupil-teacher ratio (primary education)
TAIWAN
Ratio of students to teaching staff
Pupil-teacher ratio (secondary education) Ratio of students to teaching staff
Are sufficiently implemented
Female labor force Percentage of total labor force
Cost-of-living index Index of a basket of goods & services in the main city, including housing (New York City = 100)
IMD World Talent Ranking 2017
OVERALL PERFORMANCE (63 countries)
23
2524
23 23
35
31
28 28
2524
2526 26 26
16
2423
27
22
2013 2014 2015 2016 2017
Overall
Investment &Development
Appeal
Readiness
25
2623
22
Investment & Development
Appeal
Readiness
The direction of the triangle indicates the performance change from the last year: improved or stabledeclined
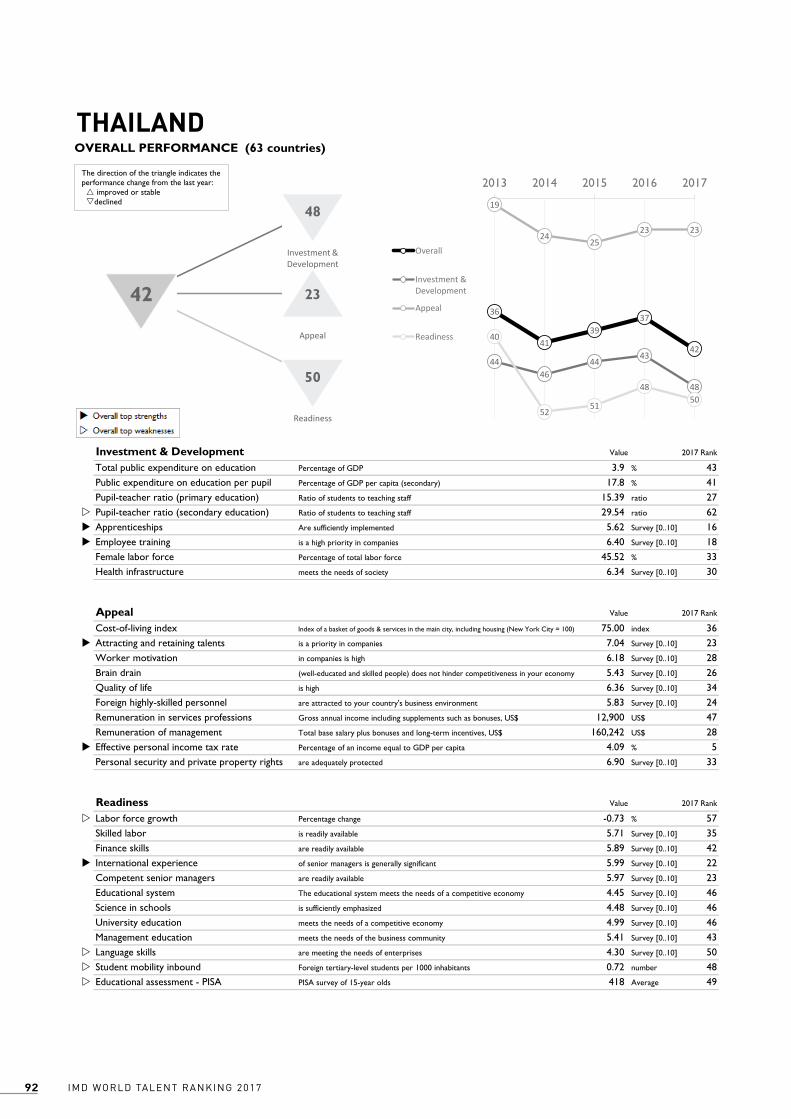
IMD WORLD TALENT RANKING 201792
Alpha AlphaLabel Beta BetaLabel Gamma GammaLabel1 2 2 2 2 2 24 4 4 2 2
Value
3.9 % 43 17.8 % 41 15.39 ratio 27w 29.54 ratio 62u 5.62 Survey [0..10] 16u 6.40 Survey [0..10] 18 45.52 % 33 6.34 Survey [0..10] 30
Value
75.00 index 36u 7.04 Survey [0..10] 23 6.18 Survey [0..10] 28 5.43 Survey [0..10] 26 6.36 Survey [0..10] 34 5.83 Survey [0..10] 24 12,900 US$ 47 160,242 US$ 28u 4.09 % 5 6.90 Survey [0..10] 33
Value
w -0.73 % 57 5.71 Survey [0..10] 35 5.89 Survey [0..10] 42u 5.99 Survey [0..10] 22 5.97 Survey [0..10] 23 4.45 Survey [0..10] 46 4.48 Survey [0..10] 46 4.99 Survey [0..10] 46 5.41 Survey [0..10] 43w 4.30 Survey [0..10] 50w 0.72 number 48w 418 Average 49
Investment & Development 2017 Rank
Health infrastructure meets the needs of society
2017 Rank
Total public expenditure on education Percentage of GDP
ApprenticeshipsEmployee training is a high priority in companies
Readiness 2017 Rank
Educational assessment - PISA PISA survey of 15-year olds
Appeal
Personal security and private property rights are adequately protected
Percentage change
Student mobility inbound Foreign tertiary-level students per 1000 inhabitants
Labor force growth
University education meets the needs of a competitive economy
Management education meets the needs of the business community
Language skills are meeting the needs of enterprises
Competent senior managers are readily available
Educational system The educational system meets the needs of a competitive economy
Science in schools is sufficiently emphasized
Skilled labor is readily available
Finance skills are readily available
International experience of senior managers is generally significant
Remuneration of management Total base salary plus bonuses and long-term incentives, US$
Effective personal income tax rate Percentage of an income equal to GDP per capita
Quality of life is high
Foreign highly-skilled personnel are attracted to your country's business environment
Remuneration in services professions Gross annual income including supplements such as bonuses, US$
Attracting and retaining talents is a priority in companies
Worker motivation in companies is high
Brain drain (well-educated and skilled people) does not hinder competitiveness in your economy
Public expenditure on education per pupil Percentage of GDP per capita (secondary)
Pupil-teacher ratio (primary education)
THAILAND
Ratio of students to teaching staff
Pupil-teacher ratio (secondary education) Ratio of students to teaching staff
Are sufficiently implemented
Female labor force Percentage of total labor force
Cost-of-living index Index of a basket of goods & services in the main city, including housing (New York City = 100)
IMD World Talent Ranking 2017
OVERALL PERFORMANCE (63 countries)
36
4139
37
4244
4644
43
48
19
2425
23 23
40
5251
4850
2013 2014 2015 2016 2017
Overall
Investment &Development
Appeal
Readiness
48
2342
50
Investment & Development
Appeal
Readiness
The direction of the triangle indicates the performance change from the last year: improved or stabledeclined
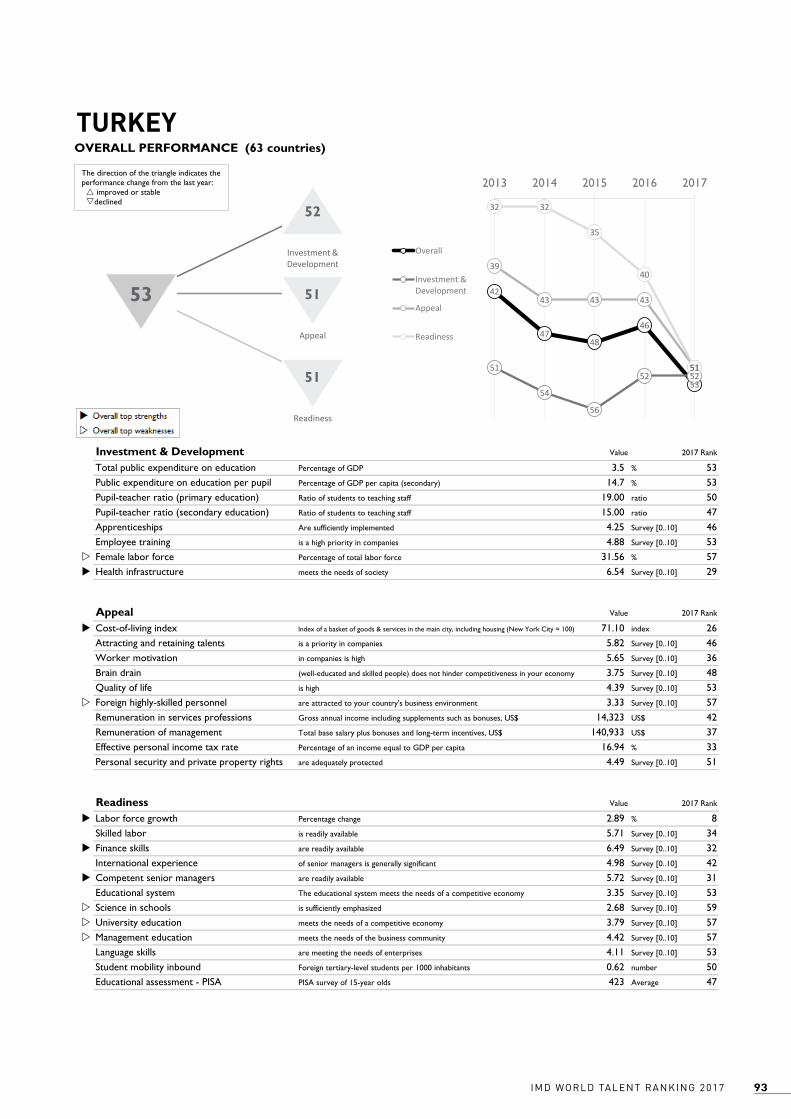
93IMD WORLD TALENT RANKING 2017
Alpha AlphaLabel Beta BetaLabel Gamma GammaLabel1 2 2 2 2 2 24 4 4 2 2
Value
3.5 % 53 14.7 % 53 19.00 ratio 50 15.00 ratio 47 4.25 Survey [0..10] 46 4.88 Survey [0..10] 53w 31.56 % 57u 6.54 Survey [0..10] 29
Value
u 71.10 index 26 5.82 Survey [0..10] 46 5.65 Survey [0..10] 36 3.75 Survey [0..10] 48 4.39 Survey [0..10] 53w 3.33 Survey [0..10] 57 14,323 US$ 42 140,933 US$ 37 16.94 % 33 4.49 Survey [0..10] 51
Value
u 2.89 % 8 5.71 Survey [0..10] 34u 6.49 Survey [0..10] 32 4.98 Survey [0..10] 42u 5.72 Survey [0..10] 31 3.35 Survey [0..10] 53w 2.68 Survey [0..10] 59w 3.79 Survey [0..10] 57w 4.42 Survey [0..10] 57 4.11 Survey [0..10] 53 0.62 number 50 423 Average 47
Investment & Development 2017 Rank
Health infrastructure meets the needs of society
2017 Rank
Total public expenditure on education Percentage of GDP
ApprenticeshipsEmployee training is a high priority in companies
Readiness 2017 Rank
Educational assessment - PISA PISA survey of 15-year olds
Appeal
Personal security and private property rights are adequately protected
Percentage change
Student mobility inbound Foreign tertiary-level students per 1000 inhabitants
Labor force growth
University education meets the needs of a competitive economy
Management education meets the needs of the business community
Language skills are meeting the needs of enterprises
Competent senior managers are readily available
Educational system The educational system meets the needs of a competitive economy
Science in schools is sufficiently emphasized
Skilled labor is readily available
Finance skills are readily available
International experience of senior managers is generally significant
Remuneration of management Total base salary plus bonuses and long-term incentives, US$
Effective personal income tax rate Percentage of an income equal to GDP per capita
Quality of life is high
Foreign highly-skilled personnel are attracted to your country's business environment
Remuneration in services professions Gross annual income including supplements such as bonuses, US$
Attracting and retaining talents is a priority in companies
Worker motivation in companies is high
Brain drain (well-educated and skilled people) does not hinder competitiveness in your economy
Public expenditure on education per pupil Percentage of GDP per capita (secondary)
Pupil-teacher ratio (primary education)
TURKEY
Ratio of students to teaching staff
Pupil-teacher ratio (secondary education) Ratio of students to teaching staff
Are sufficiently implemented
Female labor force Percentage of total labor force
Cost-of-living index Index of a basket of goods & services in the main city, including housing (New York City = 100)
IMD World Talent Ranking 2017
OVERALL PERFORMANCE (63 countries)
42
4748
46
53
51
54
56
52 52
39
43 43 43
51
32 32
35
40
51
2013 2014 2015 2016 2017
Overall
Investment &Development
Appeal
Readiness
52
5153
51
Investment & Development
Appeal
Readiness
The direction of the triangle indicates the performance change from the last year: improved or stabledeclined
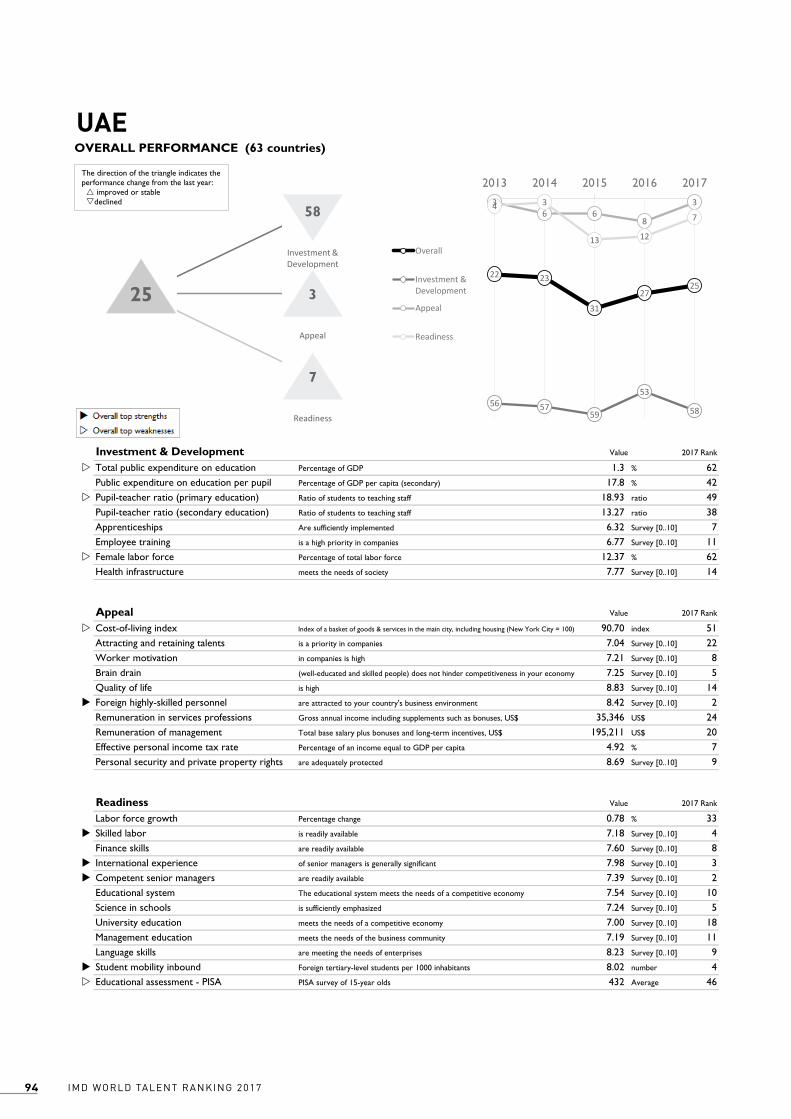
IMD WORLD TALENT RANKING 201794
Alpha AlphaLabel Beta BetaLabel Gamma GammaLabel1 2 2 2 2 2 24 4 4 2 2
Value
w 1.3 % 62 17.8 % 42w 18.93 ratio 49 13.27 ratio 38 6.32 Survey [0..10] 7 6.77 Survey [0..10] 11w 12.37 % 62 7.77 Survey [0..10] 14
Value
w 90.70 index 51 7.04 Survey [0..10] 22 7.21 Survey [0..10] 8 7.25 Survey [0..10] 5 8.83 Survey [0..10] 14u 8.42 Survey [0..10] 2 35,346 US$ 24 195,211 US$ 20 4.92 % 7 8.69 Survey [0..10] 9
Value
0.78 % 33u 7.18 Survey [0..10] 4 7.60 Survey [0..10] 8u 7.98 Survey [0..10] 3u 7.39 Survey [0..10] 2 7.54 Survey [0..10] 10 7.24 Survey [0..10] 5 7.00 Survey [0..10] 18 7.19 Survey [0..10] 11 8.23 Survey [0..10] 9u 8.02 number 4w 432 Average 46
Student mobility inbound Foreign tertiary-level students per 1000 inhabitants
University education meets the needs of a competitive economy
Management education meets the needs of the business community
Language skills are meeting the needs of enterprises
Competent senior managers are readily available
Educational system The educational system meets the needs of a competitive economy
Science in schools is sufficiently emphasized
Skilled labor is readily available
Finance skills are readily available
International experience of senior managers is generally significant
Remuneration of management Total base salary plus bonuses and long-term incentives, US$
Effective personal income tax rate Percentage of an income equal to GDP per capita
Labor force growth Percentage change
Quality of life is high
Foreign highly-skilled personnel are attracted to your country's business environment
Remuneration in services professions Gross annual income including supplements such as bonuses, US$
Attracting and retaining talents is a priority in companies
Worker motivation in companies is high
Brain drain (well-educated and skilled people) does not hinder competitiveness in your economy
Investment & Development 2017 Rank
Health infrastructure meets the needs of society
Appeal 2017 Rank
Personal security and private property rights are adequately protected
Total public expenditure on education Percentage of GDP
Public expenditure on education per pupil Percentage of GDP per capita (secondary)
Pupil-teacher ratio (primary education)
2017 Rank
Educational assessment - PISA PISA survey of 15-year olds
UAE
Ratio of students to teaching staff
Pupil-teacher ratio (secondary education) Ratio of students to teaching staff
Apprenticeships Are sufficiently implemented
Employee training is a high priority in companies
Female labor force Percentage of total labor force
Cost-of-living index Index of a basket of goods & services in the main city, including housing (New York City = 100)
IMD World Talent Ranking 2017
OVERALL PERFORMANCE (63 countries)
Readiness
22 23
31
2725
56 5759
53
58
36 6
8
34 3
13 12
7
2013 2014 2015 2016 2017
Overall
Investment &Development
Appeal
Readiness
58
325
7
Investment & Development
Appeal
Readiness
The direction of the triangle indicates the performance change from the last year: improved or stabledeclined
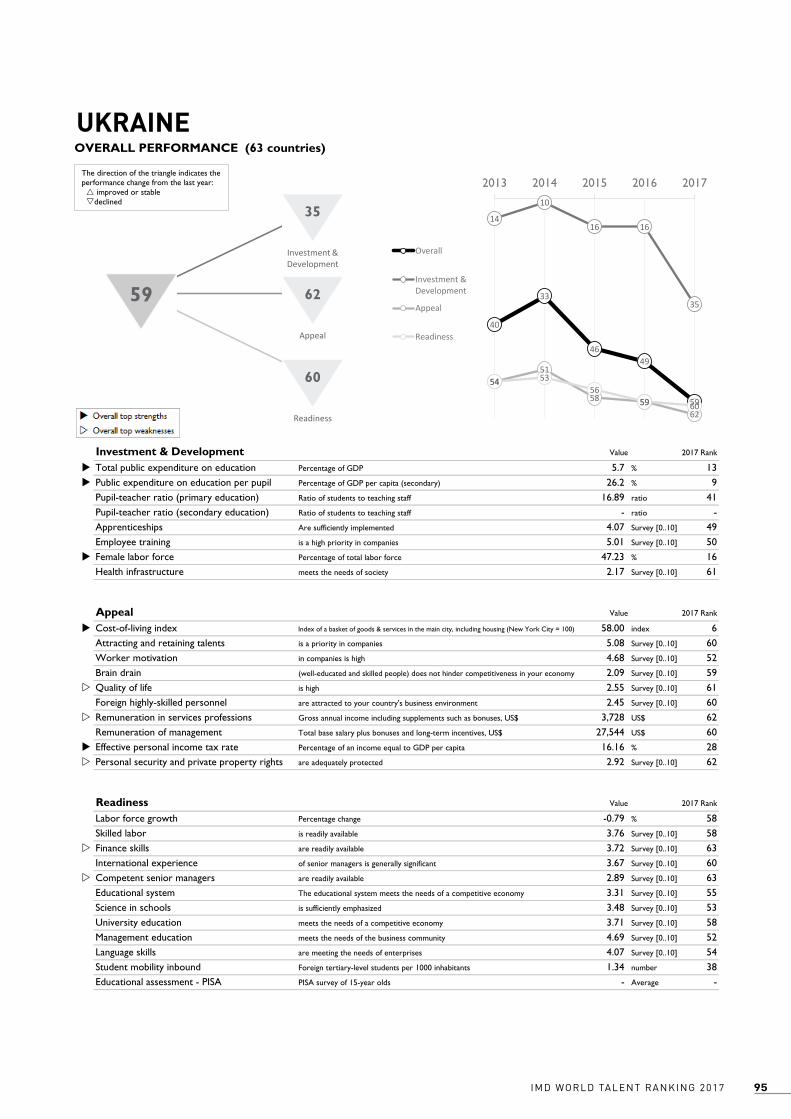
95IMD WORLD TALENT RANKING 2017
Alpha AlphaLabel Beta BetaLabel Gamma GammaLabel1 2 2 2 2 2 24 4 4 2 2
Value
u 5.7 % 13u 26.2 % 9 16.89 ratio 41 - ratio - 4.07 Survey [0..10] 49 5.01 Survey [0..10] 50u 47.23 % 16 2.17 Survey [0..10] 61
Value
u 58.00 index 6 5.08 Survey [0..10] 60 4.68 Survey [0..10] 52 2.09 Survey [0..10] 59w 2.55 Survey [0..10] 61 2.45 Survey [0..10] 60w 3,728 US$ 62 27,544 US$ 60u 16.16 % 28w 2.92 Survey [0..10] 62
Value
-0.79 % 58 3.76 Survey [0..10] 58w 3.72 Survey [0..10] 63 3.67 Survey [0..10] 60w 2.89 Survey [0..10] 63 3.31 Survey [0..10] 55 3.48 Survey [0..10] 53 3.71 Survey [0..10] 58 4.69 Survey [0..10] 52 4.07 Survey [0..10] 54 1.34 number 38 - Average -
Investment & Development 2017 Rank
Health infrastructure meets the needs of society
2017 Rank
Total public expenditure on education Percentage of GDP
ApprenticeshipsEmployee training is a high priority in companies
Readiness 2017 Rank
Educational assessment - PISA PISA survey of 15-year olds
Appeal
Personal security and private property rights are adequately protected
Percentage change
Student mobility inbound Foreign tertiary-level students per 1000 inhabitants
Labor force growth
University education meets the needs of a competitive economy
Management education meets the needs of the business community
Language skills are meeting the needs of enterprises
Competent senior managers are readily available
Educational system The educational system meets the needs of a competitive economy
Science in schools is sufficiently emphasized
Skilled labor is readily available
Finance skills are readily available
International experience of senior managers is generally significant
Remuneration of management Total base salary plus bonuses and long-term incentives, US$
Effective personal income tax rate Percentage of an income equal to GDP per capita
Quality of life is high
Foreign highly-skilled personnel are attracted to your country's business environment
Remuneration in services professions Gross annual income including supplements such as bonuses, US$
Attracting and retaining talents is a priority in companies
Worker motivation in companies is high
Brain drain (well-educated and skilled people) does not hinder competitiveness in your economy
Public expenditure on education per pupil Percentage of GDP per capita (secondary)
Pupil-teacher ratio (primary education)
UKRAINE
Ratio of students to teaching staff
Pupil-teacher ratio (secondary education) Ratio of students to teaching staff
Are sufficiently implemented
Female labor force Percentage of total labor force
Cost-of-living index Index of a basket of goods & services in the main city, including housing (New York City = 100)
IMD World Talent Ranking 2017
OVERALL PERFORMANCE (63 countries)
40
33
4649
59
14
10
16 16
35
5451
58 5962
54 5356
59 60
2013 2014 2015 2016 2017
Overall
Investment &Development
Appeal
Readiness
35
6259
60
Investment & Development
Appeal
Readiness
The direction of the triangle indicates the performance change from the last year: improved or stabledeclined

IMD WORLD TALENT RANKING 201796
Alpha AlphaLabel Beta BetaLabel Gamma GammaLabel1 2 2 2 2 2 24 4 4 2 2
Value
5.6 % 14 23.1 % 22w 19.62 ratio 52w 15.77 ratio 50 4.88 Survey [0..10] 22 5.53 Survey [0..10] 35 46.69 % 23 5.27 Survey [0..10] 37
Value
w 96.70 index 53 7.44 Survey [0..10] 14 6.36 Survey [0..10] 21 6.25 Survey [0..10] 13 7.58 Survey [0..10] 27u 7.40 Survey [0..10] 12u 45,691 US$ 10 230,721 US$ 13w 20.62 % 41 8.02 Survey [0..10] 19
Value
0.87 % 30 5.78 Survey [0..10] 33 7.26 Survey [0..10] 14u 6.38 Survey [0..10] 12u 6.63 Survey [0..10] 11 6.04 Survey [0..10] 26 5.38 Survey [0..10] 31 6.62 Survey [0..10] 24 6.51 Survey [0..10] 23w 4.47 Survey [0..10] 48u 6.67 number 7 501 Average 20
Investment & Development 2017 Rank
Health infrastructure meets the needs of society
2017 Rank
Total public expenditure on education Percentage of GDP
ApprenticeshipsEmployee training is a high priority in companies
Readiness 2017 Rank
Educational assessment - PISA PISA survey of 15-year olds
Appeal
Personal security and private property rights are adequately protected
Percentage change
Student mobility inbound Foreign tertiary-level students per 1000 inhabitants
Labor force growth
University education meets the needs of a competitive economy
Management education meets the needs of the business community
Language skills are meeting the needs of enterprises
Competent senior managers are readily available
Educational system The educational system meets the needs of a competitive economy
Science in schools is sufficiently emphasized
Skilled labor is readily available
Finance skills are readily available
International experience of senior managers is generally significant
Remuneration of management Total base salary plus bonuses and long-term incentives, US$
Effective personal income tax rate Percentage of an income equal to GDP per capita
Quality of life is high
Foreign highly-skilled personnel are attracted to your country's business environment
Remuneration in services professions Gross annual income including supplements such as bonuses, US$
Attracting and retaining talents is a priority in companies
Worker motivation in companies is high
Brain drain (well-educated and skilled people) does not hinder competitiveness in your economy
Public expenditure on education per pupil Percentage of GDP per capita (secondary)
Pupil-teacher ratio (primary education)
UNITED KINGDOM
Ratio of students to teaching staff
Pupil-teacher ratio (secondary education) Ratio of students to teaching staff
Are sufficiently implemented
Female labor force Percentage of total labor force
Cost-of-living index Index of a basket of goods & services in the main city, including housing (New York City = 100)
IMD World Talent Ranking 2017
OVERALL PERFORMANCE (63 countries)
17 1718
2021
22
27 27
3637
98 8
16
1921
1719
20 20
2013 2014 2015 2016 2017
Overall
Investment &Development
Appeal
Readiness
37
1921
20
Investment & Development
Appeal
Readiness
The direction of the triangle indicates the performance change from the last year: improved or stabledeclined
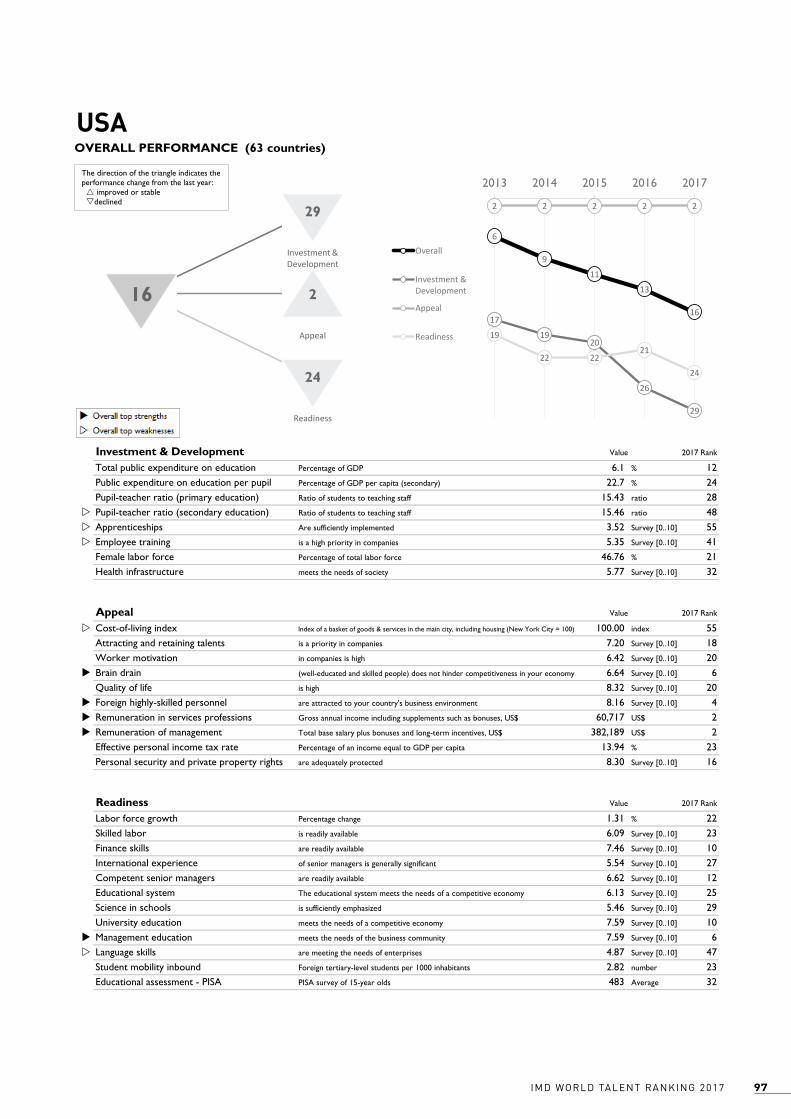
97IMD WORLD TALENT RANKING 2017
Alpha AlphaLabel Beta BetaLabel Gamma GammaLabel1 2 2 2 2 2 24 4 4 2 2
Value
6.1 % 12 22.7 % 24 15.43 ratio 28w 15.46 ratio 48w 3.52 Survey [0..10] 55w 5.35 Survey [0..10] 41 46.76 % 21 5.77 Survey [0..10] 32
Value
w 100.00 index 55 7.20 Survey [0..10] 18 6.42 Survey [0..10] 20u 6.64 Survey [0..10] 6 8.32 Survey [0..10] 20u 8.16 Survey [0..10] 4u 60,717 US$ 2u 382,189 US$ 2 13.94 % 23 8.30 Survey [0..10] 16
Value
1.31 % 22 6.09 Survey [0..10] 23 7.46 Survey [0..10] 10 5.54 Survey [0..10] 27 6.62 Survey [0..10] 12 6.13 Survey [0..10] 25 5.46 Survey [0..10] 29 7.59 Survey [0..10] 10u 7.59 Survey [0..10] 6w 4.87 Survey [0..10] 47 2.82 number 23 483 Average 32
Investment & Development 2017 Rank
Health infrastructure meets the needs of society
2017 Rank
Total public expenditure on education Percentage of GDP
ApprenticeshipsEmployee training is a high priority in companies
Readiness 2017 Rank
Educational assessment - PISA PISA survey of 15-year olds
Appeal
Personal security and private property rights are adequately protected
Percentage change
Student mobility inbound Foreign tertiary-level students per 1000 inhabitants
Labor force growth
University education meets the needs of a competitive economy
Management education meets the needs of the business community
Language skills are meeting the needs of enterprises
Competent senior managers are readily available
Educational system The educational system meets the needs of a competitive economy
Science in schools is sufficiently emphasized
Skilled labor is readily available
Finance skills are readily available
International experience of senior managers is generally significant
Remuneration of management Total base salary plus bonuses and long-term incentives, US$
Effective personal income tax rate Percentage of an income equal to GDP per capita
Quality of life is high
Foreign highly-skilled personnel are attracted to your country's business environment
Remuneration in services professions Gross annual income including supplements such as bonuses, US$
Attracting and retaining talents is a priority in companies
Worker motivation in companies is high
Brain drain (well-educated and skilled people) does not hinder competitiveness in your economy
Public expenditure on education per pupil Percentage of GDP per capita (secondary)
Pupil-teacher ratio (primary education)
USA
Ratio of students to teaching staff
Pupil-teacher ratio (secondary education) Ratio of students to teaching staff
Are sufficiently implemented
Female labor force Percentage of total labor force
Cost-of-living index Index of a basket of goods & services in the main city, including housing (New York City = 100)
IMD World Talent Ranking 2017
OVERALL PERFORMANCE (63 countries)
6
9
11
13
1617
1920
26
29
2 2 2 2 2
19
22 2221
24
2013 2014 2015 2016 2017
Overall
Investment &Development
Appeal
Readiness
29
216
24
Investment & Development
Appeal
Readiness
The direction of the triangle indicates the performance change from the last year: improved or stabledeclined
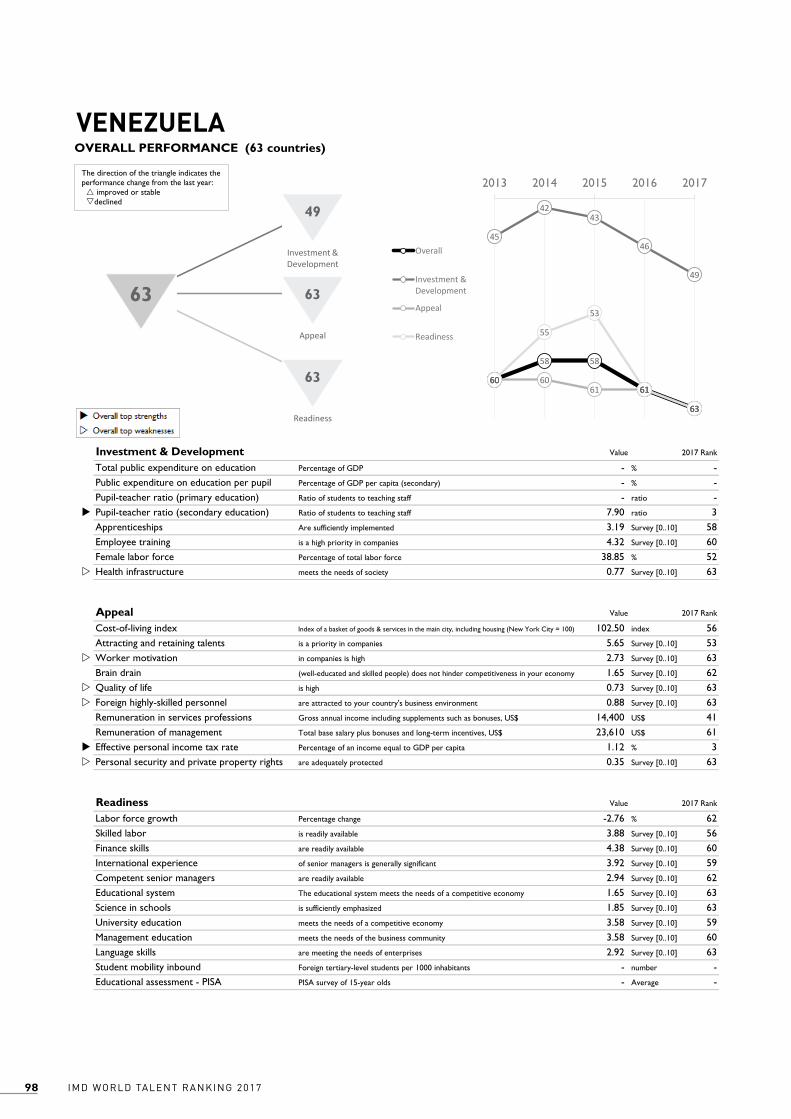
IMD WORLD TALENT RANKING 201798
Alpha AlphaLabel Beta BetaLabel Gamma GammaLabel1 2 2 2 2 2 24 4 4 2 2
Value
- % - - % - - ratio -u 7.90 ratio 3 3.19 Survey [0..10] 58 4.32 Survey [0..10] 60 38.85 % 52w 0.77 Survey [0..10] 63
Value
102.50 index 56 5.65 Survey [0..10] 53w 2.73 Survey [0..10] 63 1.65 Survey [0..10] 62w 0.73 Survey [0..10] 63w 0.88 Survey [0..10] 63 14,400 US$ 41 23,610 US$ 61u 1.12 % 3w 0.35 Survey [0..10] 63
Value
-2.76 % 62 3.88 Survey [0..10] 56 4.38 Survey [0..10] 60 3.92 Survey [0..10] 59 2.94 Survey [0..10] 62 1.65 Survey [0..10] 63 1.85 Survey [0..10] 63 3.58 Survey [0..10] 59 3.58 Survey [0..10] 60 2.92 Survey [0..10] 63 - number - - Average -
Investment & Development 2017 Rank
Health infrastructure meets the needs of society
2017 Rank
Total public expenditure on education Percentage of GDP
ApprenticeshipsEmployee training is a high priority in companies
Readiness 2017 Rank
Educational assessment - PISA PISA survey of 15-year olds
Appeal
Personal security and private property rights are adequately protected
Percentage change
Student mobility inbound Foreign tertiary-level students per 1000 inhabitants
Labor force growth
University education meets the needs of a competitive economy
Management education meets the needs of the business community
Language skills are meeting the needs of enterprises
Competent senior managers are readily available
Educational system The educational system meets the needs of a competitive economy
Science in schools is sufficiently emphasized
Skilled labor is readily available
Finance skills are readily available
International experience of senior managers is generally significant
Remuneration of management Total base salary plus bonuses and long-term incentives, US$
Effective personal income tax rate Percentage of an income equal to GDP per capita
Quality of life is high
Foreign highly-skilled personnel are attracted to your country's business environment
Remuneration in services professions Gross annual income including supplements such as bonuses, US$
Attracting and retaining talents is a priority in companies
Worker motivation in companies is high
Brain drain (well-educated and skilled people) does not hinder competitiveness in your economy
Public expenditure on education per pupil Percentage of GDP per capita (secondary)
Pupil-teacher ratio (primary education)
VENEZUELA
Ratio of students to teaching staff
Pupil-teacher ratio (secondary education) Ratio of students to teaching staff
Are sufficiently implemented
Female labor force Percentage of total labor force
Cost-of-living index Index of a basket of goods & services in the main city, including housing (New York City = 100)
IMD World Talent Ranking 2017
OVERALL PERFORMANCE (63 countries)
60
58 58
61
63
45
4243
46
49
60 6061 61
63
60
55
53
61
63
2013 2014 2015 2016 2017
Overall
Investment &Development
Appeal
Readiness
49
6363
63
Investment & Development
Appeal
Readiness
The direction of the triangle indicates the performance change from the last year: improved or stabledeclined

99IMD WORLD TALENT RANKING 2017
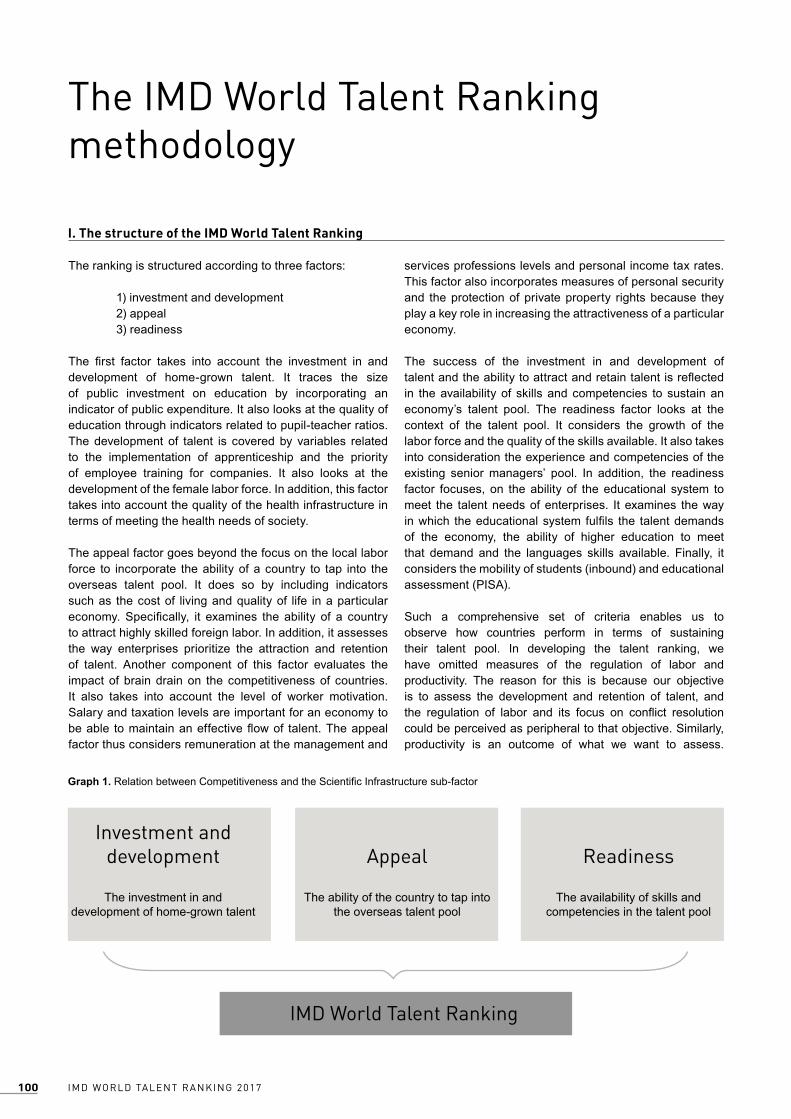
IMD WORLD TALENT RANKING 2017100
The IMD World Talent Ranking methodology
services professions levels and personal income tax rates. This factor also incorporates measures of personal security and the protection of private property rights because they play a key role in increasing the attractiveness of a particular economy.
The success of the investment in and development of talent and the ability to attract and retain talent is reflected in the availability of skills and competencies to sustain an economy’s talent pool. The readiness factor looks at the context of the talent pool. It considers the growth of the labor force and the quality of the skills available. It also takes into consideration the experience and competencies of the existing senior managers’ pool. In addition, the readiness factor focuses, on the ability of the educational system to meet the talent needs of enterprises. It examines the way in which the educational system fulfils the talent demands of the economy, the ability of higher education to meet that demand and the languages skills available. Finally, it considers the mobility of students (inbound) and educational assessment (PISA).
Such a comprehensive set of criteria enables us to observe how countries perform in terms of sustaining their talent pool. In developing the talent ranking, we have omitted measures of the regulation of labor and productivity. The reason for this is because our objective is to assess the development and retention of talent, and the regulation of labor and its focus on conflict resolution could be perceived as peripheral to that objective. Similarly, productivity is an outcome of what we want to assess.
The ranking is structured according to three factors:
1) investment and development 2) appeal 3) readiness
The first factor takes into account the investment in and development of home-grown talent. It traces the size of public investment on education by incorporating an indicator of public expenditure. It also looks at the quality of education through indicators related to pupil-teacher ratios. The development of talent is covered by variables related to the implementation of apprenticeship and the priority of employee training for companies. It also looks at the development of the female labor force. In addition, this factor takes into account the quality of the health infrastructure in terms of meeting the health needs of society.
The appeal factor goes beyond the focus on the local labor force to incorporate the ability of a country to tap into the overseas talent pool. It does so by including indicators such as the cost of living and quality of life in a particular economy. Specifically, it examines the ability of a country to attract highly skilled foreign labor. In addition, it assesses the way enterprises prioritize the attraction and retention of talent. Another component of this factor evaluates the impact of brain drain on the competitiveness of countries. It also takes into account the level of worker motivation. Salary and taxation levels are important for an economy to be able to maintain an effective flow of talent. The appeal factor thus considers remuneration at the management and
I. The structure of the IMD World Talent Ranking
Graph 1. Relation between Competitiveness and the Scientific Infrastructure sub-factor
Year: 2013 2014 2015 2016 2017
# Countries: 60 60 61 61 63 Investment and development
The investment in and
development of home-grown talent
Appeal
The ability of the country to tap into
the overseas talent pool
Readiness
The availability of skills and competencies in the talent pool
IMD World Talent Ranking
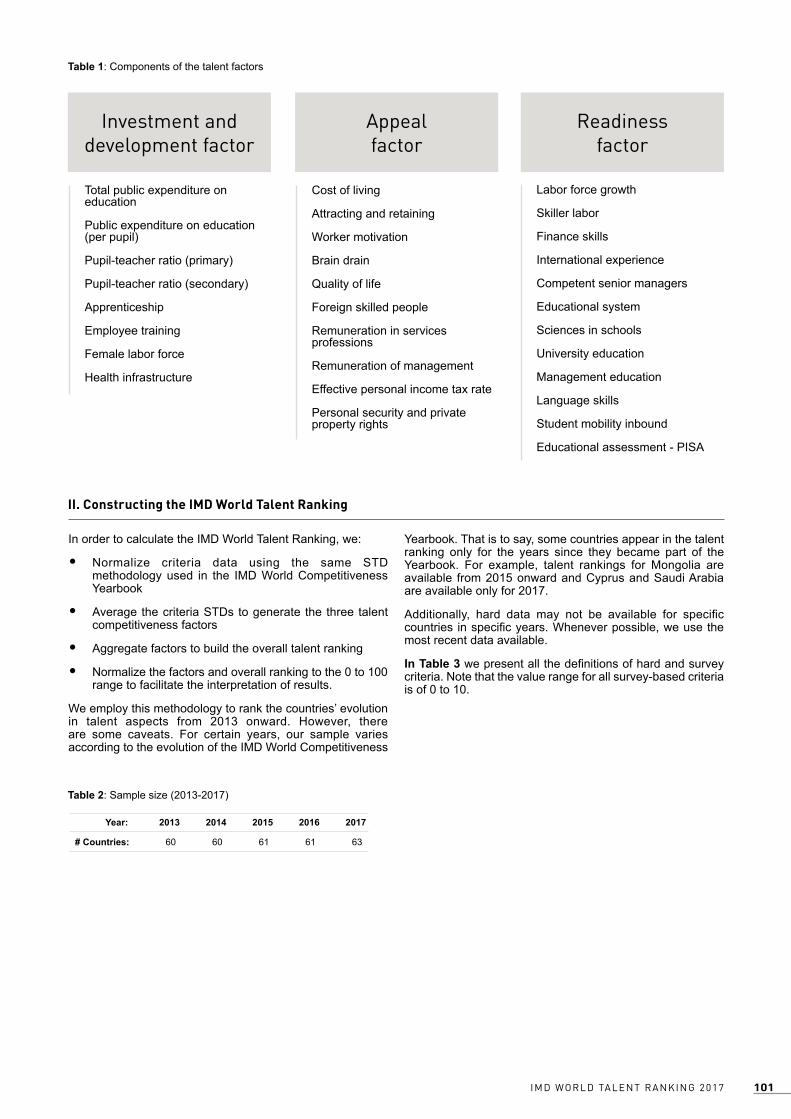
101IMD WORLD TALENT RANKING 2017
Investment and development factor
Appealfactor
Readinessfactor
Table 1: Components of the talent factors
Total public expenditure on education
Public expenditure on education (per pupil)
Pupil-teacher ratio (primary)
Pupil-teacher ratio (secondary)
Apprenticeship
Employee training
Female labor force
Health infrastructure
Yearbook. That is to say, some countries appear in the talent ranking only for the years since they became part of the Yearbook. For example, talent rankings for Mongolia are available from 2015 onward and Cyprus and Saudi Arabia are available only for 2017.
Additionally, hard data may not be available for specific countries in specific years. Whenever possible, we use the most recent data available.
In Table 3 we present all the definitions of hard and survey criteria. Note that the value range for all survey-based criteria is of 0 to 10.
In order to calculate the IMD World Talent Ranking, we:
• Normalize criteria data using the same STD methodology used in the IMD World Competitiveness Yearbook
• Average the criteria STDs to generate the three talent competitiveness factors
• Aggregate factors to build the overall talent ranking
• Normalize the factors and overall ranking to the 0 to 100 range to facilitate the interpretation of results.
We employ this methodology to rank the countries’ evolution in talent aspects from 2013 onward. However, there are some caveats. For certain years, our sample varies according to the evolution of the IMD World Competitiveness
II. Constructing the IMD World Talent Ranking
Year: 2013 2014 2015 2016 2017
# Countries: 60 60 61 61 63
Table 2: Sample size (2013-2017)
Cost of living
Attracting and retaining
Worker motivation
Brain drain
Quality of life
Foreign skilled people
Remuneration in services professions
Remuneration of management
Effective personal income tax rate
Personal security and private property rights
Labor force growth
Skiller labor
Finance skills
International experience
Competent senior managers
Educational system
Sciences in schools
University education
Management education
Language skills
Student mobility inbound
Educational assessment - PISA
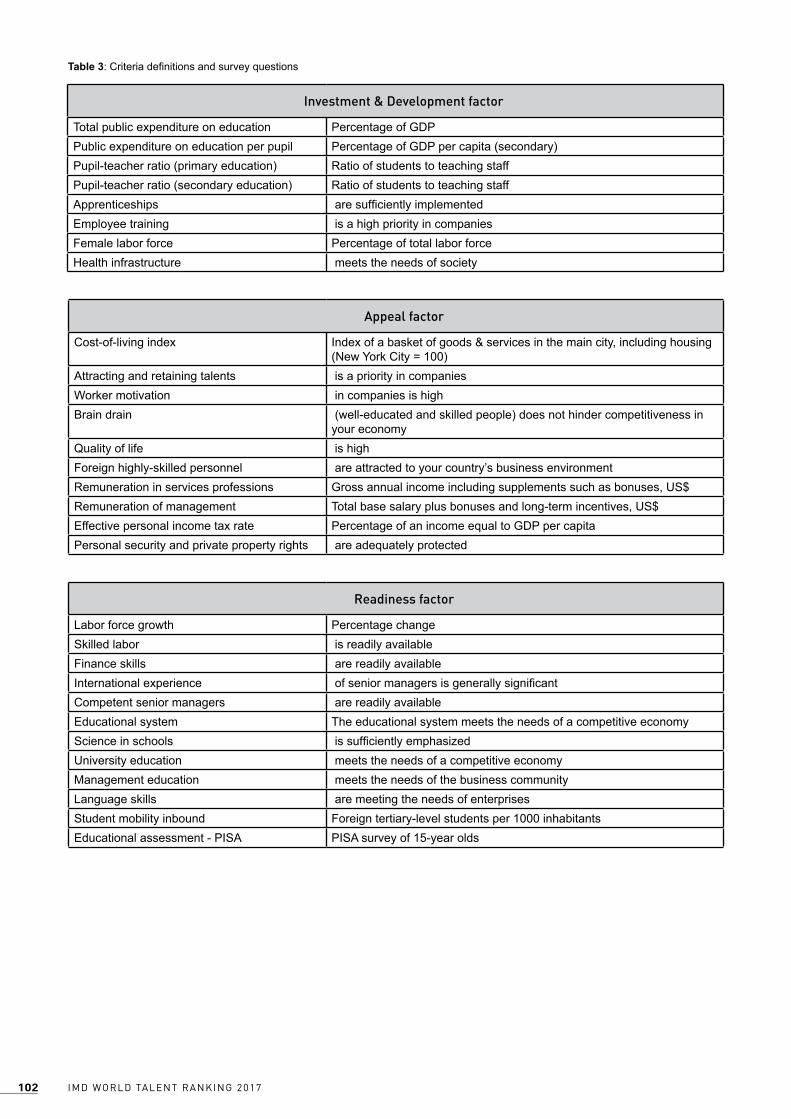
IMD WORLD TALENT RANKING 2017102
Investment & Development factor
Total public expenditure on education Percentage of GDPPublic expenditure on education per pupil Percentage of GDP per capita (secondary)Pupil-teacher ratio (primary education) Ratio of students to teaching staffPupil-teacher ratio (secondary education) Ratio of students to teaching staffApprenticeships are sufficiently implementedEmployee training is a high priority in companiesFemale labor force Percentage of total labor forceHealth infrastructure meets the needs of society
Appeal factor
Cost-of-living index Index of a basket of goods & services in the main city, including housing (New York City = 100)
Attracting and retaining talents is a priority in companiesWorker motivation in companies is highBrain drain (well-educated and skilled people) does not hinder competitiveness in
your economyQuality of life is highForeign highly-skilled personnel are attracted to your country’s business environmentRemuneration in services professions Gross annual income including supplements such as bonuses, US$Remuneration of management Total base salary plus bonuses and long-term incentives, US$Effective personal income tax rate Percentage of an income equal to GDP per capitaPersonal security and private property rights are adequately protected
Readiness factor
Labor force growth Percentage changeSkilled labor is readily availableFinance skills are readily availableInternational experience of senior managers is generally significantCompetent senior managers are readily availableEducational system The educational system meets the needs of a competitive economyScience in schools is sufficiently emphasizedUniversity education meets the needs of a competitive economyManagement education meets the needs of the business communityLanguage skills are meeting the needs of enterprisesStudent mobility inbound Foreign tertiary-level students per 1000 inhabitantsEducational assessment - PISA PISA survey of 15-year olds
Table 3: Criteria definitions and survey questions

103IMD WORLD TALENT RANKING 2017
IMD WORLD TALENT RANKING 2017104
Notes and Sources
Government Finance Statistics Yearbook Eurostat National sources
Jordan, Chile and Luxembourg: Budgetary central government.
UNESCO http://stats.uis.unesco.org National sources
Total public expenditure per pupil or student in the secondary level, expressed as a percentage of GDP per capita. Taiwan: including elementary and secondary schools.
Total public expenditure on education (%) Public expenditure on education per pupil
Pupil-teacher ratio (primary education)
UNESCO http://stats.uis.unesco.org OECD Education at a Glance National sources
For public and private institutions, based on full-time equivalent. Primary education (ISCED level 1): level of which the main function is to provide the basic elements of education at such establishments as elementary schools, primary schools. The ratio of students to teaching staff is calculated as the total number of full-time equivalent students divided by the total number of full-time equivalent educational personal. Teaching staff refers to professional personnel directly involved in teaching students. The classification includes classroom teachers; special education teacher; and other teachers who work with students as a whole class
in a classroom, in small groups in a resource room, or in one-to-one teaching inside a regular classroom. Teaching staff also includes chairpersons of departments whose duties include some amount of teaching, but it does not include non-professional personnel who support teachers in providing instructions to students, such as teacher’s aides and other paraprofessional personnel. Data are UNESCO or OECD estimates and from national statistics. Australia, Israel, Italy, Norway, and Russia: public institutions only. Hong Kong: figures refer to the position as at mid-September of the respective years (i.e. the beginning of an academic year spanning two calendar years). Teaching staff includes teachers as well as principles; figures cover local schools, special and international schools.
Pupil-teacher ratio (secondary education)
UNESCO http://stats.uis.unesco.org OECD Education at a Glance National sources
For public and private institutions, based on full-time equivalent. Secondary education (ISCED levels 2 and 3): level providing general and/or specialized instruction at middle schools, secondary schools, high schools, teacher training schools and schools of a vocational or technical nature. The ratio of students to teaching staff is calculated as the total number of full-time equivalent students divided by the total number of full-time equivalent educational personal. Teaching staff refers to professional personnel directly involved in teaching students. The classification includes classroom teachers; special education teacher; and other teachers who work with students as a whole class
in a classroom, in small groups in a resource room, or in one-to-one teaching inside a regular classroom. Teaching staff also includes chairpersons of departments whose duties include some amount of teaching, but it does not include non-professional personnel who support teachers in providing instructions to students, such as teacher’s aides and other paraprofessional personnel. Data are UNESCO or OECD estimates and from national statistics. Australia, Canada, Ireland, Israel, Italy, Jordan, Norway and Russia: public institutions only. Australia: includes only programs in upper secondary education. Belgium: excludes independent private institutions. Hong Kong: figures refer to the position as at mid-September of the respective years (i.e. the beginning of an academic year spanning two calendar years). Teaching staff includes teachers as well as principles; figures cover local schools, special and international schools.
105IMD WORLD TALENT RANKING 2017
Female labor force (%)
OECD Main Economic Indicators National sources
Estimate for latest year. Austria: break in series in 2008. Denmark: break in series in 2009. Indonesia: as of August for 2010. Malaysia: break in series in 2010. Portugal: methodological change in 2011. Romania: break in series in 2002, third quarter for 2013. Spain: break in series in 2005.
Cost-of-living index
MERCER Cost of Living survey www.mercer.com
Break in series in 2015: In the main city as of 2015, average of main cities in large countries (made by IMD WCC) or in the capital in smaller ones up to 2014. The Mercer survey covers 214 cities across five continents and measures the comparative cost of over 200 items in each location, including housing, transport, food, clothing, household goods and entertainment. It is the world’s most comprehensive cost of living survey and is used to help multinational companies
and governments determine compensation allowance for their expatriate employees. New York is used as the base city (=100) for the index and all cities are compared against New York. Currency movements are measured against the US dollar. The cost of housing - often the biggest expense for expats - plays an important part in determining where cities are ranked.
Data is not always comparable over years (money fluctuations in 2010 and 2011).
Effective personal income tax rate
PricewaterhouseCoopers, Resource Tax Manager
This criterion is based on the latest GDP per capita figures. Amount of personal income tax (including social security paid by the employee) that an individual married + 1 child with this level of earnings would expect to pay. The taxes for Canada, Switzerland and the US are an average for the respective provinces, cantons and states. India: in case, where the number of employees in the establishment exceeds 20 and an employee’s monthly salary is less than INR 6,500.--, he
would have to contribute to Provident Fund 12% of basic salary. The employer also contributes to an equal amount to Provident Fund. As a consequence, if we assume that the number of employees is less than 20, no social security contributions would be due. The differences against last year’s data can generally be explained by differences in base GDP/capita, and the changes in legislation for some countries.
Remuneration in services professions
UBS Prices and Earnings National sources
Figures are estimates remuneration paid in major cities. Gross annual income including possible supplements such as profit sharing, performance bonuses, vacation pay, additional monthly salaries and family allowances. Bank Credit Officer: completed bank training and around 10 years’ experience in a bank; about 35 years old, married, two children. Product Manager: employed in the pharmaceuticals, chemicals or food industry, middle-management position, university or
technical college graduate with at least 5 years’ experience in the field; about 35 years old, married, no children. Primary school teacher: teaching in the state school system (not private schools) for around 10 years; about 35 years old, married, two children. Personal Assistant: to a department head in an industrial or service company, around 5 years’ experience (PC skills, 1 foreign language); about 25 years old, single. Call center agent: trained agent at an inbound call/service center, e.g. in the telecommunications or technology sector; age about 25, single.
IMD WORLD TALENT RANKING 2017106
Remuneration of management
HCM Compensation Insights & Technology AG (CCT-ProSurvey) National sources
Total remuneration: including annual base salary, annual short-term incentive bonus and long term incentive. Based on companies having a minimal turnover of US$ 250 million.
Engineer: co-ordinates the engineering/ technical aspects of production operations; typically manages functions such as process engineering, plant specifications and development; is responsible for planning, calculating and budgeting any item necessary to achieve a project; monitors the entire development of a project; holds an University degree. Estonia: break in series in 2011 (change of source, data for earlier years are not comparable). Slovenia: break in series in 2007, estimates, not entirely corresponding to definition.
Director manufacturing: directs the manufacturing side of the operations, including production, engineering, production and material control and quality assurance; manages the output process, production control and quality assurance; is responsible for manufacturing, engineering, maintenance purchasing, shipping and receiving as well as quality control; ensures the return on investment. Estonia: break in series in 2011 (change of source, data for earlier years are not comparable). Slovenia: break in series in 2007, estimates, not entirely corresponding to definition.
Director of Human Resources: develops and implements Human Resources policies and programs; advises and assist the General Manager in the management of the Human Resources, is responsible for all matters concerning personnel management, including planning, recruitment, selection, training and development, hygiene and security, remuneration, benefits and personnel services, is responsible for the development and implementation of personnel policies and training, co-ordinates the company’s internal communication policies. Estonia: break in series in 2011 (change of source, data for earlier years are not comparable). Slovenia: break in series in 2007, estimates, not entirely corresponding to definition.
Chief Executive Officer: directs all company’s operations, including sales, marketing, manufacturing and support function; coordinates and provides guidance for the development and implementation of business strategies; optimizes market potential; provides long-term vision and leadership; identifies growth opportunities; assures organizational efficiency of the operations; builds long-term partnership with key accounts. Estonia: break in series in 2011 (change of source, data for earlier years are not comparable). Slovenia: break in series in 2007, estimates, not entirely corresponding to definition.
Labor force growth
OECD Main Economic Indicators National sources
Estimates for latest year. Austria: break in series in 2008. Denmark: break in series in 2009. Lithuania: break in series 2011 - census revised labor force figure downwards by 10% (emigration to EU over past decade). Latvia: break in
series in 2012. Malaysia: break in series in 2010. Romania: break in series in 2002, third quarter for 2013. Portugal: methodological change in 2011. Spain: break in series in 2005. Lithuania: break in series 2011 - census revised labor force figure downwards by 10% (emigration to EU over past decade).
Student Mobility inbound
Global Education Digest UNESCO http://stats.uis.unesco.org
International mobile students (men and women) from abroad studying in a given country (in tertiary education). Data can refer to the school or financial year prior or after the reference year.
107IMD WORLD TALENT RANKING 2017
Educational assessment - PISA
PISA (OECD)
The OECD’s Programme for International Student Assessment (PISA) is a regular survey of 15-year olds which assesses aspects of their preparedness for adult life. Mathematical literacy: an individual’s capacity to identify and understand the role that mathematics plays in the world, to make well-founded judgments and to use and engage with mathematics in ways that meet the needs of that individual’s life as a constructive, concerned and reflective citizen. Scientific literacy: an individual’s scientific knowledge and
use of that knowledge to identify questions, to acquire new knowledge, to explain scientific phenomena, and to draw evidence based conclusions about science-related issues, understanding of the characteristic features of science as a form of human knowledge and enquiry, awareness of how science and technology shape our material, intellectual, and cultural environments, and willingness to engage in science-related issues, and with the ideas of science, as a reflective citizen. Cyprus: relates to the southern part of the Island. Argentina, Kazakhstan and Malaysia: Coverage is too small to ensure comparability.
Executive Opinion Survey
Every year, for our flagship publication, The IMD World Competitiveness Yearbook, we conduct an Executive Opinion Survey in order to complement the statistics that we use from international, national and regional sources. Whereas the Hard Data shows how competitiveness is measured over a specific period of time, the Survey Data measures competitiveness as it is perceived. The survey was designed to quantify issues that are not easily measured, for example: management practices, labor relations, corruption, environmental concerns or quality of life. The survey responses reflect present and future perceptions of competitiveness by business executives who are dealing with international business situations. Their responses are more recent and closer to reality since there is no time lag, which is often a problem with Hard Data that shows a “picture of the past”.
The Executive Opinion Survey is sent to executives in top- and middle management in all of the economies covered by the WCY. In order to be statistically representative, we select a sample size which is proportional to the GDP of each
economy. The sample of respondents are representative of the entire economy, covering a cross-section of the business community in each economic sector: primary, manufacturing and services, based on their contribution to the GDP of the economy. The survey respondents are nationals or expatriates, located in local and foreign enterprises in the economy and which, in general, have an international dimension. They are asked to evaluate the present and expected competitiveness conditions of the economy in which they work and have resided during the past year, drawing from the wealth of their international experience, thereby ensuring that the evaluations portray an in-depth knowledge of their particular environment. We try to contact most IMD alumni and all responses returned to IMD are treated as confidential. The surveys are sent in January and are returned in April; in 2015, we received 6,200 responses from the 61 economies worldwide. The respondents assess the competitiveness issues by answering the questions on a scale of 1 to 6. The average value for each economy is then calculated and converted into a 0 to 10 scale.