imbalanced profit margins of urban online car-hailing
TRANSCRIPT
1136 Technical Gazette 26, 4(2019), 1136-1144
ISSN 1330-3651 (Print), ISSN 1848-6339 (Online) https://doi.org/10.17559/TV-20190709042326 Original scientific paper
Imbalanced Profit Margins of Urban Online Car-hailing Services: A Case from Didi Service Platform of China
Xujun MA
Abstract: Online car-hailing services are driven by the emergence and development of network technology and information sharing, which breaks the traditional balance of Chinese taxi market and reconstitutes profit allocation, bringing new opportunities and challenges to the development and management of traditional taxi industry. To improve the operation efficiency of taxi and promote the effective utilization of resources, this study presented a calculation method for the capacity utilization rate and constructed a taxi service profit rate model. Taking Beijing and Shanghai of China as examples, the profit margins of ride-hailing and online taxi services using the Didi trajectory data from December 22 to December 24, 2017 were compared and analyzed. Results demonstrate that the profits of different car-hailing services in China are imbalanced in terms of time and space dimensions. The search costs for drivers and passengers are high, especially during morning and evening rush hours. The low capacity utilization rates for taxis and ride-hailing services resulted in a conflict between low supply and high demand. The profit margins of taxis are much higher than those of car-hailing services. Moreover, profits on weekends are higher than those on workdays. Long distance orders (>15 km) and relatively short ones (<3km) generate higher profits. Relevant departments should rationally plan the holding volume of online car-hailing services and coordinate the service profit margins in different service modes to realize the sustainable development of the new and old taxi industry.
Keywords: capacity utilization rate; profit margin; ride-hailing service; taxi; trajectory data
1 INTRODUCTION
With the development of network technology and information sharing, online car-hailing services, such as Didi and Uber, entered the passenger transport market. Such services also prospered in the taxi industry. As a new service under "Internet plus", online car-hailing services establish a new employment relationship between passengers and taxis/ride-hailing cars and change the traditional taxi service mode of patrolling and squatting [1]. In addition, car-hailing service creates new job opportunities, satisfies consumers’ different travel needs, and promotes the supply and demand balance in the market. In 2016, Ministry of Transport of the People's Republic of China issued a series of measures and regulations to make online ride-hailing service legal.
Online ride-hailing services bring tremendous opportunities and challenges to the development and management of traditional taxi industry [2-4]. On the one hand, compared with the traditional taxi service industry, online ride-hailing services provide personalized and diverse options through information and resource sharing, which promoted the balance between supply and demand and improved the overall market efficiency [5-7]. On the other hand, the new service mode disrupts the traditional taxi industry [8], leading to a series of management problems. The outbreak of vicious competition between online ride-hailing and traditional taxis led to many social problems, such as traditional taxi market shrinking, pay cut [9, 10], strikes, and violence. The new emerging business in the taxi industry changes the original market structure and reconstructs the pattern of market interest, which exerts a great impact on social and economic development. Therefore, related topics regarding online car-hailing service are important in academic research.
2 LITERATURE REVIEW
Previous studies on online ride-hailing service mainly focus on the analysis of business model characteristics [11], the evolution of taxi market, and the regulations of the government [12, 13]. With the aim to develop online
ride-hailing service, market mechanism plays a major role in the resource distribution. Scholars explore the correlation between the capacity utilization rate and the market supply of online ride-hailing and traditional taxi services, respectively [14]. They also analyze diverse service modes, service functions, price differences, and service profits in different forms of business [15-18]. Others investigate the effect of market mechanism on resource distribution [19]. On the other hand, online ride-hailing service can monopolize public goods, and market failure is pervasive in requiring governmental regulations. People are concerned about the regulatory and normative effects of management measures, such as price, access, quantitative, and service standard control on the online car-hailing market [20]. For instance, building a taxi traffic plan model to determine the optimal number of city taxis, optimizing taxi drivers' loading rate and operating income on the basis of access control measures [21], promoting the optimal distribution of taxi operation profits by coordinating passengers' consumption and drivers' revenue and making a reasonable price [22], increasing drivers' long-distance service income and improving their enthusiasm in carrying passengers during rush hours on the basis of the transfer payment methods of mileage and the subsidy of heavy-traffic roads [23], and coordinating conflicts and optimizing the competition and development environment of online ride-hailing services.
All kinds of conflicts and contradictions caused by the emergence of online ride-hailing service are driven by the profit. Previous research investigated the development characteristics, mechanisms, and paths of online ride-hailing service in two aspects, namely, market mechanisms and government restrictions [24, 25]. However, only few accurate quantitative analyses on the profit distribution of market entities were available [26]. As different market entities, traditional taxi and online ride-hailing services showed obviously differences in service profits. With the development of the new emerging business, the profit margins of taxis cannot be accurately calculated on the basis of the traditional model [27] because a series of
Xujun MA: Imbalanced Profit Margins of Urban Online Car-hailing Services: A Case from Didi Service Platform of China
Tehnički vjesnik 26, 4(2019), 1136-1144 1137
parameters in the taxi service model, such as the initiation rate, the capacity utilization rate, taxi fare, and fuel cost, must be reset. In this study, a quantitative method is employed to build new taxi and car-hailing service models. The profit differences between taxis and car-hailing services are compared and analyzed on the basis of the trajectory data of Didi and traditional taxi, respectively. Taking Beijing and Shanghai of China as examples, the profit distribution of taxi drivers in the emerging business is explored to provide theoretical basis and political suggestions for the sustainable development of urban taxi market.
The remainder of the study is organized as follows. Section 3 describes the capacity utilization rate and the construction of taxi and car-hailing service models, Section 4 provides the results and discussion. Section 5 summarizes the conclusions and corresponding policy implications
3 METHODOLOGY 3.1 Capacity Utilization Rate and Construction of Taxi
Service Model
The capacity utilization rate of online car-hailing service directly affects the profit margin, which is an important factor affecting drivers' revenue. Such rate was generally affected by service time and distance [12]. A complete trip for online car-hailing service includes three processes, such as looking for passengers, waiting for passengers, and delivering passengers. The time spent on finding and waiting for passengers for a long trip occupies a relatively lower proportion than that for a short trip. Thus, the capacity utilization rate increases as service distance increases, that is, ε0 ∝ Sij, where ε0 denotes the capacity utilization rate, and represents the distance of a trip (i → j) when carrying passengers.
The capacity utilization rate is also affected by people’s travel demands. For instance, the capacity utilization rate of taxis during morning and evening rush hours is higher than in other periods [18]. The average travel speed on different roads can be used to assess peoples’ travel demands. High travel demands often indicate a congested traffic and a low average speed on roads, resulting in a long service time for a certain distance. Therefore, the more congested the roads are, the lower the average speed on roads and the higher the capacity utilization rate, that is, , where represents the average speed on roads from t to t + 1. As a result, the equation of the capacity utilization rate is defined as shown in Eq. (1).
0 1ij
tt
SA
Vε
+= , (1)
where A is a constant, , . Referring to the standard
that urban taxis’ capacity utilization is approximately 60% throughout the day, let , then
, where N denotes the total number
of orders for a day.
Next is the empty return (no passenger in return trip) in long and short service distance. An empty return can lead to the decrease of the capacity utilization rate, thus adding a penalty factor. The capacity utilization rate that comes from Eq. (1) is too low due to the short service mileage, which can add a reverse penalty factor. In terms of the pricing standard of taxi service (online car-hailing service), the capacity utilization rate of different service mileages can be defined as presented in Eq. (2).
1
0
1
0 '
'
ijijt
t ij
ij ijijt
t
S nA B S sV S
S SA B S s
V m
ε+
+
+ < ≤
=
− >
, (2)
where s' refers to the distance after which an empty driving cost is charged. m, n are constants.
{ }(1 )
(1 )
(1 ) 0 ', 0,1
(1 ) '
k kij
k kij
q q S sP B k k
p p S s
−
−
− < ≤= = =− >
The empty return of online car-hailing service may occur when Sij is greater than s'. Let P{B = 0} = p denote the probability of no empty return, where p follows a power-law distribution, that is, . Let the event of empty return be a certainty (p = 0) when the service distance is long enough. That is, under the condition of Sij → ∞, p → 0. By contrast, let the probability of empty return be 0 when a relatively short trip exists, that is, when Sij → s', p → 1. Let c = s', p ~ s'/Sij.
Under the condition of 0 < Sij ≤ s', p{B = 0} = q. Similarly, let q follow a power-law distribution, that is,
where c → 0 and c ≠ 0. Therefore, q → 1 if Sij → 0, whereas q → 0 if Sij → s'. Thus, as service distance increases, B may become 0. In this case, the continuity of Eq. (2) in its domain of definition can be guaranteed.
3.2 Construction of Taxi and Car-hailing Service Models
The taxi service model takes the road network, the set of places of departure , and the set of destinations as its basis. The model also considers the entire trip from (places of departure) to (destinations). The complete service includes looking for passengers, waiting for passengers, and delivering passengers from the place of departure to the destination. Suppose Fij is the taxi fare from area to j , thus the taxis’ expected revenue for an order (i → j) is as follows:
,
,
vij ij
i I j Jij v
iji I j J
N FF
N∈ ∈
∈ ∈
=∑∑
, (3)
where denotes the number of vehicles carrying passengers from area i to j per unit of time. Taxis calculate their fare as follows: Fij = Fa + pb(Sij – s) + Flow-speed + Fempty,
ijS
10 1 t
tVε +∝ 1ttV +
12
α = 1β =
( )0,
= =60%ij ti I j J
A S V Nε∈ ∈∑
( ),
60% ij ti I j J
A N S V∈ ∈
= ∑
1ijp cS −∼
1ijq cS −∼
I Ji I∈
j J∈
i
vijN
Xujun MA: Imbalanced Profit Margins of Urban Online Car-hailing Services: A Case from Didi Service Platform of China
1138 Technical Gazette 26, 4(2019), 1136-1144
where Fa and pb represent the initiate rate and unit mileage price, Flow-speed and Fempty indicate the low speed and long distance fees, respectively. S denotes the service mileage within the initiate rate. Therefore, the expected revenue for an order O − D(i → j) is as follows:
low speed empty
low speed empty
[ ( ) + ]
( )
vij ij
i I , j Jij v
iji I , j J
vij a b ij
i I , j Jvij
i I , j J
a b ij
N FF
N
N F p S s F F
N
F F F p S s
∈ ∈
∈ ∈
−∈ ∈
∈ ∈
−
= =
+ − +
= =
= + + + −
∑
∑
∑
∑, (4)
where low-speed empty, F F and ijS denote the average low speed fee, average long distance fee, and average travel
distance, respectively. low-speed empty, F F and ijS are expressed as follows:
low-speed low-speed low-speed
empty empty ( )ij
vij ij
i I , j Jij v
iji I , j J
F p t
F p S s'
N SS
N∈ ∈
∈ ∈
= ⋅
= ⋅ −
=∑
∑
, (5)
where plow-speed, low-speedt and pempty refer to the low speed fee per unit, the average duration of low-speed driving in service, and long distance fee per unit, respectively. Disregarding the difference in fuel cost between empty return and travelling with passengers, the expected profit margin when completing a service (i → j) is:
low-speed low-speed0 1 0 1
low-speed low-speed0 1 0 1
low-speed low-speed empty0
(1 )
(1 ) '
'
a wij M ij
ij
a b wi j b ij M ij
ij
a bb empty ij
ij
F p tV S s
S
F p s p tp V s S s
S
F p s p t p sp p V
S
ε φ ε φ ε φ
π ε φ ε φ ε φ
ε
→
+ ⋅⋅ − − − − ≤
− ⋅ + ⋅= + ⋅ − − − − < ≤
− ⋅ + ⋅ − ⋅
+ + ⋅
1 0 1(1 ) 'wM ijS sφ ε φ ε φ
− − − − >
, (6)
where represent fuel cost per unit time, monthly rent, the average speed, the capacity utilization rate, and the proportion of the waiting time during the whole period, respectively. can be expressed as follows:
oil0 0 10 0, , ,
100ij ij i
ij ij i ij ij i ij
L S p h wh h w h h w h
φ ε ε⋅ ⋅
= = =+ + + +
(7)
Here, L and poil represent the fuel usage per 100 km and the fuel price, respectively. /100ijL S⋅ denotes the fuel usage from i to j, so oil /100ijL S p⋅ ⋅ refers to the
fuel cost when completing a trip (i → j).denote the average empty return time from i to j, the service duration when carrying passengers from i to j, and the average waiting time at location i, respectively.
Similarly, the pricing method of car-hailing service is empty ( ),ij b ij c ij ijF p S p h p S s'= ⋅ + ⋅ + ⋅ − where pb and pc
correspondingly refer to the fare per unit of distance and the service fee per unit of time. hij denotes the service duration when carrying passengers from i to j. The expected revenue of the car-hailing service for an order (i → j) can be expressed as follows:
empty
empty
( )
( )
vij ij
i I , j Ji j v
iji I , j J
vij b ij c ij ij
i I , j Jvij
i I , j J
b ij c ij ij
N FF
N
N p S p h p S s'
N
p S p h p S s'
∈ ∈→
∈ ∈
∈ ∈
∈ ∈
= =
⋅ + ⋅ + ⋅ − = =
= ⋅ + ⋅ + ⋅ −
∑
∑
∑
∑, (8)
The difference in fuel cost between empty return and travelling with passengers is ignored. For different trip lengths, the following is the expected profit margins for an order (i → j) [18].
min0 1 0 1 min
0 0 1 0 1 min
emptyempty 0 0 1 0 1 min
(1 )
(1 ) , 0
(1 ) ,
wMij ij
ij
wMi j b ij c ij ij
ij
M wb ij c ij ij
ij
F F V F FS
Fp V p F F S s'S
p s' Fp p V p F F S s'
S
ε φ ε φ ε
π ε ε φ ε φ ε
ε ε φ ε φ ε
→
− ⋅ − − − ≤
= − ⋅ ⋅ + ⋅ − − − > < ≤
⋅ + + − ⋅ ⋅ + ⋅ − − − > >
, (9)
0 0 1, , , ,M ijVφ φ ε ε
0 0 1, ,φ ε ε
0 , ,ij ij ih h w
Xujun MA: Imbalanced Profit Margins of Urban Online Car-hailing Services: A Case from Didi Service Platform of China
where FM and Fmin denote the information fee charged by the online ride-hailing platform and the lowest revenue for online car-hailing service, respectively.
4 RESUITS AND DISCUSSION 4.1 The Empirical Data
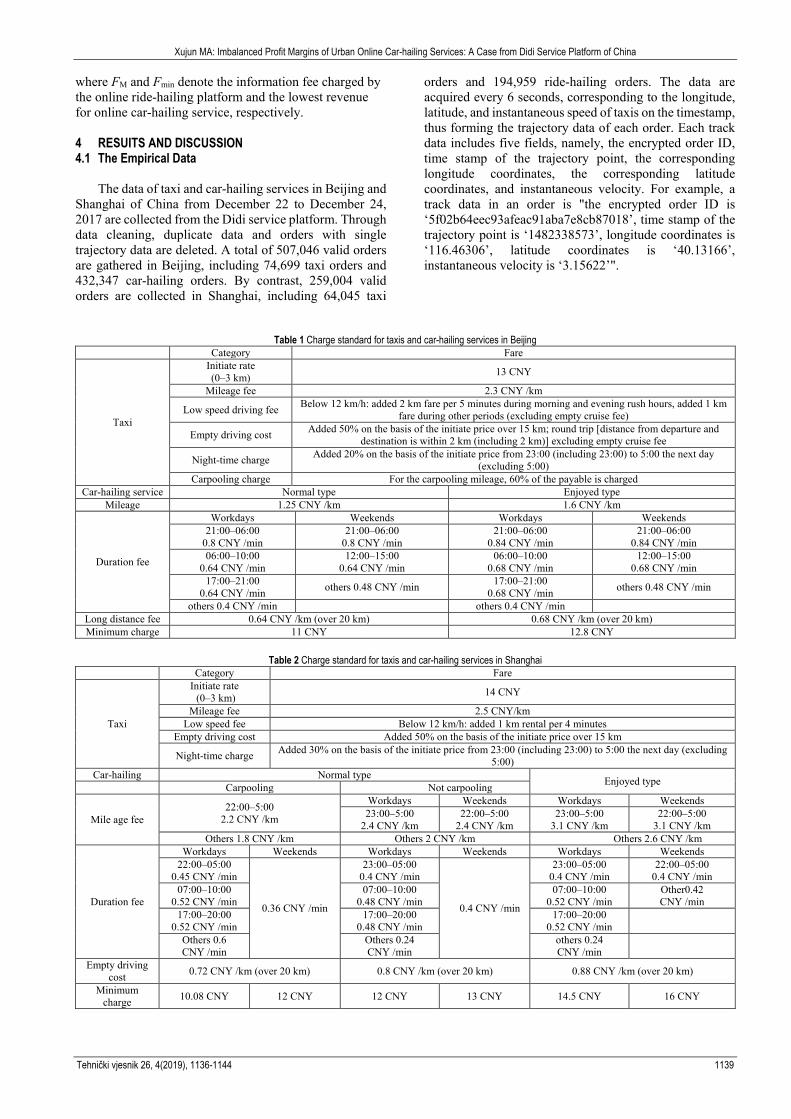
The data of taxi and car-hailing services in Beijing and Shanghai of China from December 22 to December 24, 2017 are collected from the Didi service platform. Through data cleaning, duplicate data and orders with single trajectory data are deleted. A total of 507,046 valid orders are gathered in Beijing, including 74,699 taxi orders and 432,347 car-hailing orders. By contrast, 259,004 valid orders are collected in Shanghai, including 64,045 taxi
orders and 194,959 ride-hailing orders. The data are acquired every 6 seconds, corresponding to the longitude, latitude, and instantaneous speed of taxis on the timestamp, thus forming the trajectory data of each order. Each track data includes five fields, namely, the encrypted order ID, time stamp of the trajectory point, the corresponding longitude coordinates, the corresponding latitude coordinates, and instantaneous velocity. For example, a track data in an order is "the encrypted order ID is ‘5f02b64eec93afeac91aba7e8cb87018’, time stamp of the trajectory point is ‘1482338573’, longitude coordinates is ‘116.46306’, latitude coordinates is ‘40.13166’, instantaneous velocity is ‘3.15622’".
Table 1 Charge standard for taxis and car-hailing services in Beijing Category Fare
Taxi
Initiate rate (0–3 km) 13 CNY
Mileage fee 2.3 CNY /km
Low speed driving fee Below 12 km/h: added 2 km fare per 5 minutes during morning and evening rush hours, added 1 km fare during other periods (excluding empty cruise fee)
Empty driving cost Added 50% on the basis of the initiate price over 15 km; round trip [distance from departure and destination is within 2 km (including 2 km)] excluding empty cruise fee
Night-time charge Added 20% on the basis of the initiate price from 23:00 (including 23:00) to 5:00 the next day (excluding 5:00)
Carpooling charge For the carpooling mileage, 60% of the payable is charged Car-hailing service Normal type Enjoyed type
Mileage 1.25 CNY /km 1.6 CNY /km
Duration fee
Workdays Weekends Workdays Weekends 21:00–06:00
0.8 CNY /min 21:00–06:00
0.8 CNY /min 21:00–06:00
0.84 CNY /min 21:00–06:00
0.84 CNY /min 06:00–10:00
0.64 CNY /min 12:00–15:00
0.64 CNY /min 06:00–10:00
0.68 CNY /min 12:00–15:00
0.68 CNY /min 17:00–21:00
0.64 CNY /min others 0.48 CNY /min 17:00–21:00 0.68 CNY /min others 0.48 CNY /min
others 0.4 CNY /min others 0.4 CNY /min Long distance fee 0.64 CNY /km (over 20 km) 0.68 CNY /km (over 20 km) Minimum charge 11 CNY 12.8 CNY
Table 2 Charge standard for taxis and car-hailing services in Shanghai Category Fare
Taxi
Initiate rate (0–3 km) 14 CNY
Mileage fee 2.5 CNY/km Low speed fee Below 12 km/h: added 1 km rental per 4 minutes
Empty driving cost Added 50% on the basis of the initiate price over 15 km
Night-time charge Added 30% on the basis of the initiate price from 23:00 (including 23:00) to 5:00 the next day (excluding 5:00)
Car-hailing Normal type Enjoyed type Carpooling Not carpooling
Mile age fee 22:00–5:00
2.2 CNY /km
Workdays Weekends Workdays Weekends 23:00–5:00
2.4 CNY /km 22:00–5:00
2.4 CNY /km 23:00–5:00
3.1 CNY /km 22:00–5:00
3.1 CNY /km Others 1.8 CNY /km Others 2 CNY /km Others 2.6 CNY /km
Duration fee
Workdays Weekends Workdays Weekends Workdays Weekends 22:00–05:00
0.45 CNY /min
0.36 CNY /min
23:00–05:00 0.4 CNY /min
0.4 CNY /min
23:00–05:00 0.4 CNY /min
22:00–05:00 0.4 CNY /min
07:00–10:00 0.52 CNY /min
07:00–10:00 0.48 CNY /min
07:00–10:00 0.52 CNY /min
Other0.42 CNY /min
17:00–20:00 0.52 CNY /min
17:00–20:00 0.48 CNY /min
17:00–20:00 0.52 CNY /min
Others 0.6 CNY /min
Others 0.24 CNY /min
others 0.24 CNY /min
Empty driving cost 0.72 CNY /km (over 20 km) 0.8 CNY /km (over 20 km) 0.88 CNY /km (over 20 km)
Minimum charge 10.08 CNY 12 CNY 12 CNY 13 CNY 14.5 CNY 16 CNY
Tehnički vjesnik 26, 4(2019), 1136-1144 1139
Xujun MA: Imbalanced Profit Margins of Urban Online Car-hailing Services: A Case from Didi Service Platform of China
1140 Technical Gazette 26, 4(2019), 1136-1144
Subsequently, the service time, service distance, average instantaneous speed, and low speed time (instantaneous speed less than 12 km/h) of each order can be calculated on the basis of the trajectory data. The calculation process is as follows: let represent the k trajectory data of order from beginning to end; and letrepresent the nth trajectory data of order m, where
, and are the five field values of the nth trajectory data, respectively. The total service time, service distance, and average speed of order can be respectively indicated as 1
2 2 ,km m mt T T= −
and , where and
represent the time stamps of the first and last trajectory of order m, respectively. Moreover, represents the instantaneous speed, which corresponds to the nth trajectory data of order m.
In accordance with the Price Standards of Taxi issued by Beijing Municipal Commission of Development & Reform of China on January 22, 2017, Reply Regarding Adjustments to the Price of Taxi in Shanghai issued by Shanghai Municipal Development & Reform Commission of China on September 30, 2015, and User Manual and Driver Manual issued by the Didi service platform, the price calculation standards for taxi and ride-hailing
services in Beijing and Shanghai are presented in Tabs. 1 and 2.
4.2 Comparative Analysis of Capacity Utilization Rate
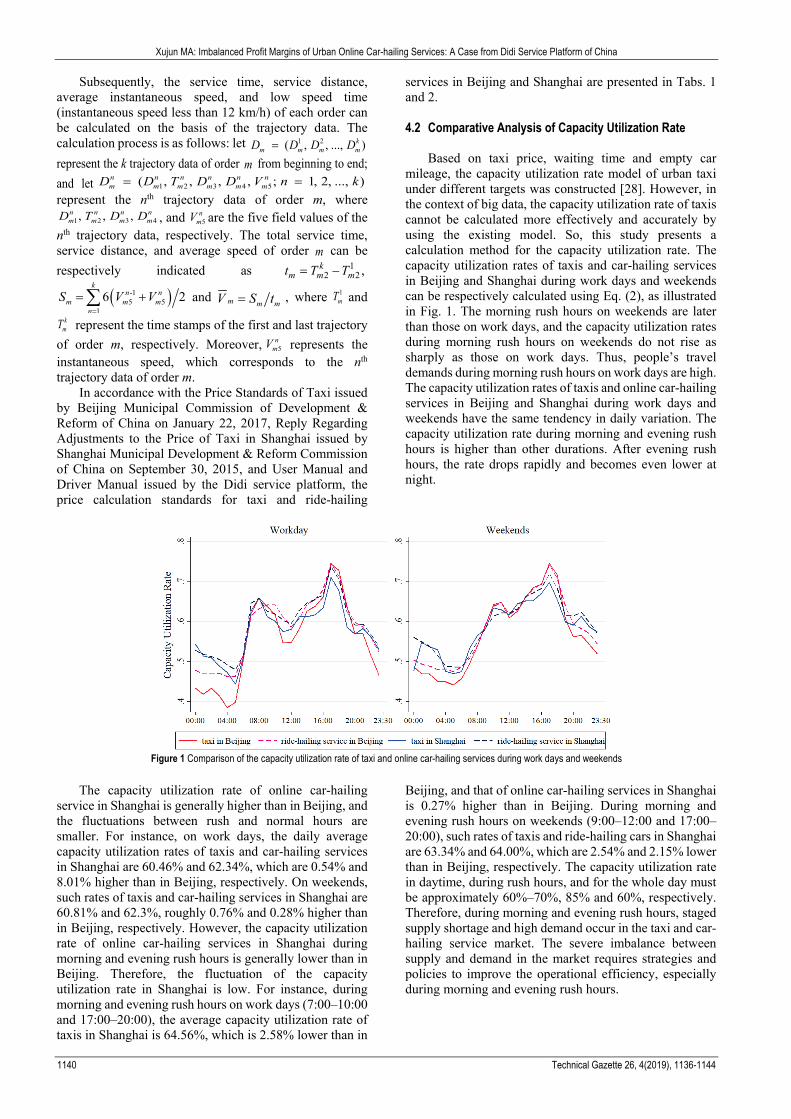
Based on taxi price, waiting time and empty car mileage, the capacity utilization rate model of urban taxi under different targets was constructed [28]. However, in the context of big data, the capacity utilization rate of taxis cannot be calculated more effectively and accurately by using the existing model. So, this study presents a calculation method for the capacity utilization rate. The capacity utilization rates of taxis and car-hailing services in Beijing and Shanghai during work days and weekends can be respectively calculated using Eq. (2), as illustrated in Fig. 1. The morning rush hours on weekends are later than those on work days, and the capacity utilization rates during morning rush hours on weekends do not rise as sharply as those on work days. Thus, people’s travel demands during morning rush hours on work days are high. The capacity utilization rates of taxis and online car-hailing services in Beijing and Shanghai during work days and weekends have the same tendency in daily variation. The capacity utilization rate during morning and evening rush hours is higher than other durations. After evening rush hours, the rate drops rapidly and becomes even lower at night.
Figure 1 Comparison of the capacity utilization rate of taxi and online car-hailing services during work days and weekends
The capacity utilization rate of online car-hailing service in Shanghai is generally higher than in Beijing, and the fluctuations between rush and normal hours are smaller. For instance, on work days, the daily average capacity utilization rates of taxis and car-hailing services in Shanghai are 60.46% and 62.34%, which are 0.54% and 8.01% higher than in Beijing, respectively. On weekends, such rates of taxis and car-hailing services in Shanghai are 60.81% and 62.3%, roughly 0.76% and 0.28% higher than in Beijing, respectively. However, the capacity utilization rate of online car-hailing services in Shanghai during morning and evening rush hours is generally lower than in Beijing. Therefore, the fluctuation of the capacity utilization rate in Shanghai is low. For instance, during morning and evening rush hours on work days (7:00–10:00 and 17:00–20:00), the average capacity utilization rate of taxis in Shanghai is 64.56%, which is 2.58% lower than in
Beijing, and that of online car-hailing services in Shanghai is 0.27% higher than in Beijing. During morning and evening rush hours on weekends (9:00–12:00 and 17:00–20:00), such rates of taxis and ride-hailing cars in Shanghai are 63.34% and 64.00%, which are 2.54% and 2.15% lower than in Beijing, respectively. The capacity utilization rate in daytime, during rush hours, and for the whole day must be approximately 60%–70%, 85% and 60%, respectively. Therefore, during morning and evening rush hours, staged supply shortage and high demand occur in the taxi and car-hailing service market. The severe imbalance between supply and demand in the market requires strategies and policies to improve the operational efficiency, especially during morning and evening rush hours.
1 2( , , ..., )km m m mD D D D=
m1 2 3 4 5( , , , , ; 1, 2, ..., )n n n n n n
m m m m m mD D T D D V n k= =
1 2 3 4, , ,n n n nm m m mD T D D 5
nmV
m
( )-15 5
16 2
kn n
m m mn
S V V=
= +∑ m m mV S t= 1mT
kmT
5n
mV
Xujun MA: Imbalanced Profit Margins of Urban Online Car-hailing Services: A Case from Didi Service Platform of China
Tehnički vjesnik 26, 4(2019), 1136-1144 1141
4.3 Comparative Analysis of Profit Margins
Based on the operation management, operation safety, operation efficiency and operation service quality of taxi enterprises, the operation performance of taxi enterprises is evaluated by constructing the taxi performance evaluation index system [29]. In the taxi market, profit margin is an important indicator to measure drivers' revenue, which has a significant effect on market demand and supply. A high profit margin can encourage drivers to accept many orders, which can increase market supply but cause traffic jam. By contrast, a low profit margin can entail the shortage of market supply but make catching rides difficult for people. Therefore, balancing profit margins indifferent service modes is necessary. This study compares and analyzes the imbalanced features of profit margins for taxi and online car-hailing services in Beijing and Shanghai in different dimensions.
4.3.1 Regional Differences on the Profit Margins of Online Car-hailing Service
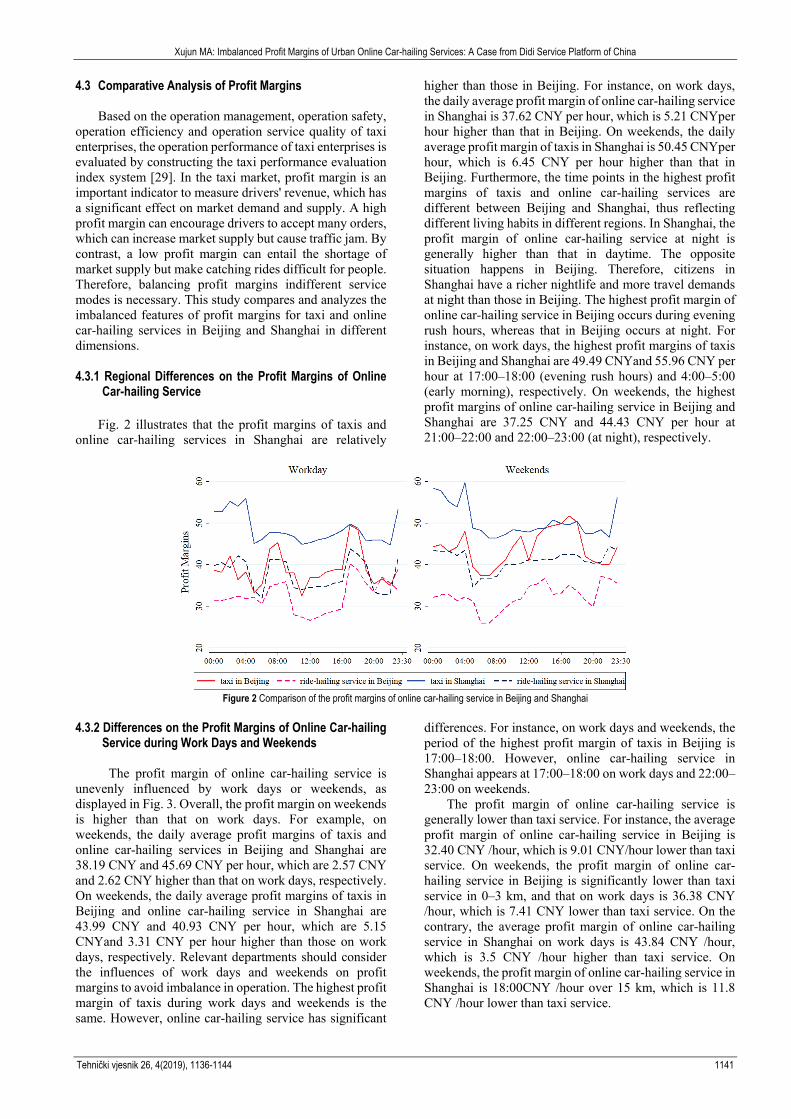
Fig. 2 illustrates that the profit margins of taxis and online car-hailing services in Shanghai are relatively
higher than those in Beijing. For instance, on work days, the daily average profit margin of online car-hailing service in Shanghai is 37.62 CNY per hour, which is 5.21 CNYper hour higher than that in Beijing. On weekends, the daily average profit margin of taxis in Shanghai is 50.45 CNYper hour, which is 6.45 CNY per hour higher than that in Beijing. Furthermore, the time points in the highest profit margins of taxis and online car-hailing services are different between Beijing and Shanghai, thus reflecting different living habits in different regions. In Shanghai, the profit margin of online car-hailing service at night is generally higher than that in daytime. The opposite situation happens in Beijing. Therefore, citizens in Shanghai have a richer nightlife and more travel demands at night than those in Beijing. The highest profit margin of online car-hailing service in Beijing occurs during evening rush hours, whereas that in Beijing occurs at night. For instance, on work days, the highest profit margins of taxis in Beijing and Shanghai are 49.49 CNYand 55.96 CNY per hour at 17:00–18:00 (evening rush hours) and 4:00–5:00 (early morning), respectively. On weekends, the highest profit margins of online car-hailing service in Beijing and Shanghai are 37.25 CNY and 44.43 CNY per hour at 21:00–22:00 and 22:00–23:00 (at night), respectively.
Figure 2 Comparison of the profit margins of online car-hailing service in Beijing and Shanghai
4.3.2 Differences on the Profit Margins of Online Car-hailing Service during Work Days and Weekends
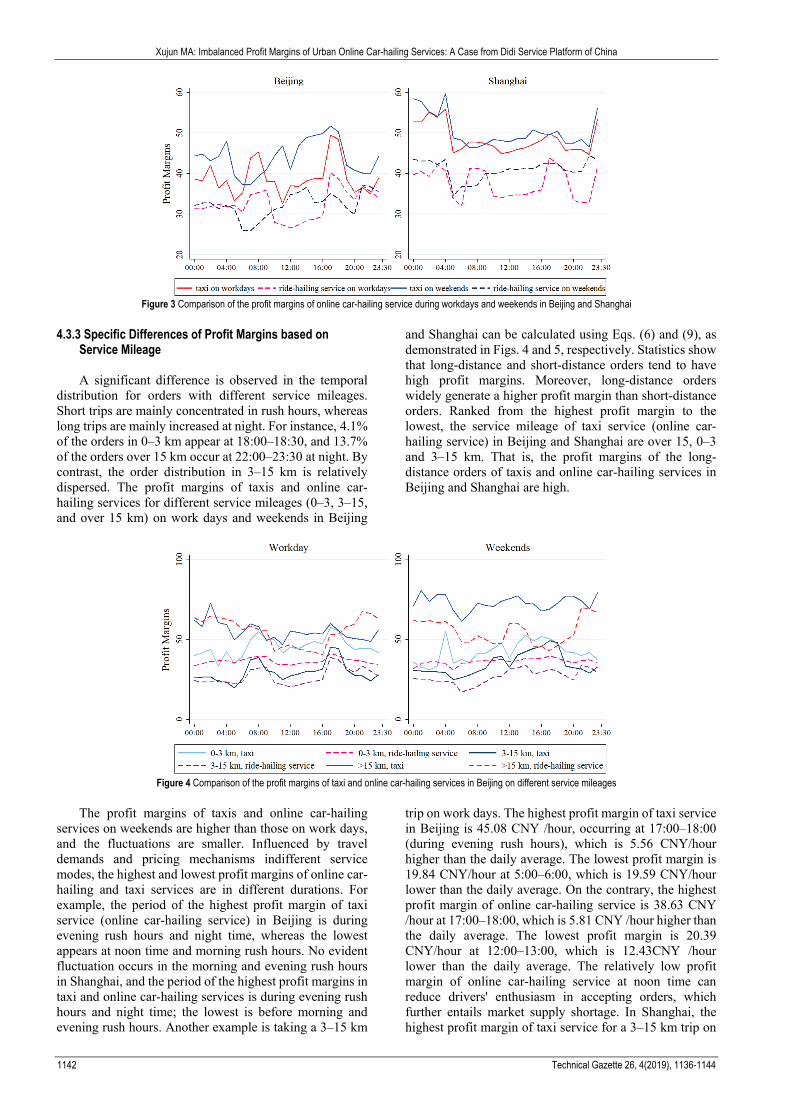
The profit margin of online car-hailing service is unevenly influenced by work days or weekends, as displayed in Fig. 3. Overall, the profit margin on weekends is higher than that on work days. For example, on weekends, the daily average profit margins of taxis and online car-hailing services in Beijing and Shanghai are 38.19 CNY and 45.69 CNY per hour, which are 2.57 CNY and 2.62 CNY higher than that on work days, respectively. On weekends, the daily average profit margins of taxis in Beijing and online car-hailing service in Shanghai are 43.99 CNY and 40.93 CNY per hour, which are 5.15 CNYand 3.31 CNY per hour higher than those on work days, respectively. Relevant departments should consider the influences of work days and weekends on profit margins to avoid imbalance in operation. The highest profit margin of taxis during work days and weekends is the same. However, online car-hailing service has significant
differences. For instance, on work days and weekends, the period of the highest profit margin of taxis in Beijing is 17:00–18:00. However, online car-hailing service in Shanghai appears at 17:00–18:00 on work days and 22:00–23:00 on weekends.
The profit margin of online car-hailing service is generally lower than taxi service. For instance, the average profit margin of online car-hailing service in Beijing is 32.40 CNY /hour, which is 9.01 CNY/hour lower than taxi service. On weekends, the profit margin of online car-hailing service in Beijing is significantly lower than taxi service in 0–3 km, and that on work days is 36.38 CNY /hour, which is 7.41 CNY lower than taxi service. On the contrary, the average profit margin of online car-hailing service in Shanghai on work days is 43.84 CNY /hour, which is 3.5 CNY /hour higher than taxi service. On weekends, the profit margin of online car-hailing service in Shanghai is 18:00CNY /hour over 15 km, which is 11.8 CNY /hour lower than taxi service.
Xujun MA: Imbalanced Profit Margins of Urban Online Car-hailing Services: A Case from Didi Service Platform of China
1142 Technical Gazette 26, 4(2019), 1136-1144
Figure 3 Comparison of the profit margins of online car-hailing service during workdays and weekends in Beijing and Shanghai
4.3.3 Specific Differences of Profit Margins based on Service Mileage
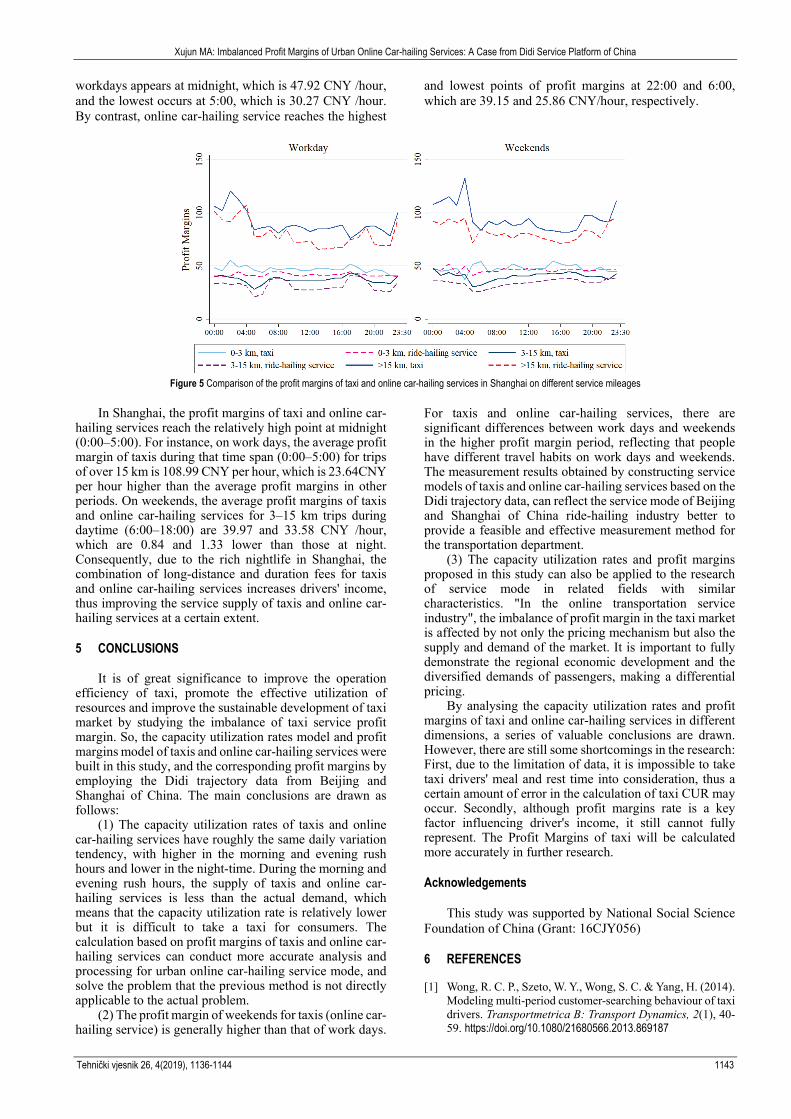
A significant difference is observed in the temporal distribution for orders with different service mileages. Short trips are mainly concentrated in rush hours, whereas long trips are mainly increased at night. For instance, 4.1% of the orders in 0–3 km appear at 18:00–18:30, and 13.7% of the orders over 15 km occur at 22:00–23:30 at night. By contrast, the order distribution in 3–15 km is relatively dispersed. The profit margins of taxis and online car-hailing services for different service mileages (0–3, 3–15, and over 15 km) on work days and weekends in Beijing
and Shanghai can be calculated using Eqs. (6) and (9), as demonstrated in Figs. 4 and 5, respectively. Statistics show that long-distance and short-distance orders tend to have high profit margins. Moreover, long-distance orders widely generate a higher profit margin than short-distance orders. Ranked from the highest profit margin to the lowest, the service mileage of taxi service (online car-hailing service) in Beijing and Shanghai are over 15, 0–3 and 3–15 km. That is, the profit margins of the long-distance orders of taxis and online car-hailing services in Beijing and Shanghai are high.
Figure 4 Comparison of the profit margins of taxi and online car-hailing services in Beijing on different service mileages
The profit margins of taxis and online car-hailing services on weekends are higher than those on work days, and the fluctuations are smaller. Influenced by travel demands and pricing mechanisms indifferent service modes, the highest and lowest profit margins of online car-hailing and taxi services are in different durations. For example, the period of the highest profit margin of taxi service (online car-hailing service) in Beijing is during evening rush hours and night time, whereas the lowest appears at noon time and morning rush hours. No evident fluctuation occurs in the morning and evening rush hours in Shanghai, and the period of the highest profit margins in taxi and online car-hailing services is during evening rush hours and night time; the lowest is before morning and evening rush hours. Another example is taking a 3–15 km
trip on work days. The highest profit margin of taxi service in Beijing is 45.08 CNY /hour, occurring at 17:00–18:00 (during evening rush hours), which is 5.56 CNY/hour higher than the daily average. The lowest profit margin is 19.84 CNY/hour at 5:00–6:00, which is 19.59 CNY/hour lower than the daily average. On the contrary, the highest profit margin of online car-hailing service is 38.63 CNY /hour at 17:00–18:00, which is 5.81 CNY /hour higher than the daily average. The lowest profit margin is 20.39 CNY/hour at 12:00–13:00, which is 12.43CNY /hour lower than the daily average. The relatively low profit margin of online car-hailing service at noon time can reduce drivers' enthusiasm in accepting orders, which further entails market supply shortage. In Shanghai, the highest profit margin of taxi service for a 3–15 km trip on
Xujun MA: Imbalanced Profit Margins of Urban Online Car-hailing Services: A Case from Didi Service Platform of China
Tehnički vjesnik 26, 4(2019), 1136-1144 1143
workdays appears at midnight, which is 47.92 CNY /hour, and the lowest occurs at 5:00, which is 30.27 CNY /hour. By contrast, online car-hailing service reaches the highest
and lowest points of profit margins at 22:00 and 6:00, which are 39.15 and 25.86 CNY/hour, respectively.
Figure 5 Comparison of the profit margins of taxi and online car-hailing services in Shanghai on different service mileages
In Shanghai, the profit margins of taxi and online car-hailing services reach the relatively high point at midnight (0:00–5:00). For instance, on work days, the average profit margin of taxis during that time span (0:00–5:00) for trips of over 15 km is 108.99 CNY per hour, which is 23.64CNY per hour higher than the average profit margins in other periods. On weekends, the average profit margins of taxis and online car-hailing services for 3–15 km trips during daytime (6:00–18:00) are 39.97 and 33.58 CNY /hour, which are 0.84 and 1.33 lower than those at night. Consequently, due to the rich nightlife in Shanghai, the combination of long-distance and duration fees for taxis and online car-hailing services increases drivers' income, thus improving the service supply of taxis and online car-hailing services at a certain extent.
5 CONCLUSIONS
It is of great significance to improve the operation efficiency of taxi, promote the effective utilization of resources and improve the sustainable development of taxi market by studying the imbalance of taxi service profit margin. So, the capacity utilization rates model and profit margins model of taxis and online car-hailing services were built in this study, and the corresponding profit margins by employing the Didi trajectory data from Beijing and Shanghai of China. The main conclusions are drawn as follows:
(1) The capacity utilization rates of taxis and online car-hailing services have roughly the same daily variation tendency, with higher in the morning and evening rush hours and lower in the night-time. During the morning and evening rush hours, the supply of taxis and online car-hailing services is less than the actual demand, which means that the capacity utilization rate is relatively lower but it is difficult to take a taxi for consumers. The calculation based on profit margins of taxis and online car-hailing services can conduct more accurate analysis and processing for urban online car-hailing service mode, and solve the problem that the previous method is not directly applicable to the actual problem.
(2) The profit margin of weekends for taxis (online car-hailing service) is generally higher than that of work days.
For taxis and online car-hailing services, there are significant differences between work days and weekends in the higher profit margin period, reflecting that people have different travel habits on work days and weekends. The measurement results obtained by constructing service models of taxis and online car-hailing services based on the Didi trajectory data, can reflect the service mode of Beijing and Shanghai of China ride-hailing industry better to provide a feasible and effective measurement method for the transportation department.
(3) The capacity utilization rates and profit margins proposed in this study can also be applied to the research of service mode in related fields with similar characteristics. "In the online transportation service industry", the imbalance of profit margin in the taxi market is affected by not only the pricing mechanism but also the supply and demand of the market. It is important to fully demonstrate the regional economic development and the diversified demands of passengers, making a differential pricing.
By analysing the capacity utilization rates and profit margins of taxi and online car-hailing services in different dimensions, a series of valuable conclusions are drawn. However, there are still some shortcomings in the research: First, due to the limitation of data, it is impossible to take taxi drivers' meal and rest time into consideration, thus a certain amount of error in the calculation of taxi CUR may occur. Secondly, although profit margins rate is a key factor influencing driver's income, it still cannot fully represent. The Profit Margins of taxi will be calculated more accurately in further research.
Acknowledgements
This study was supported by National Social Science Foundation of China (Grant: 16CJY056)
6 REFERENCES
[1] Wong, R. C. P., Szeto, W. Y., Wong, S. C. & Yang, H. (2014). Modeling multi-period customer-searching behaviour of taxi drivers. Transportmetrica B: Transport Dynamics, 2(1), 40-59. https://doi.org/10.1080/21680566.2013.869187
Xujun MA: Imbalanced Profit Margins of Urban Online Car-hailing Services: A Case from Didi Service Platform of China
1144 Technical Gazette 26, 4(2019), 1136-1144
[2] Badger, E. (2014, June 20). Taxi medallions have been the best investment in America for years. Now uber may be changing that. The Washington Post, 1-11. Retrieved from: http://www.washingtonpost.com/blogs/wonkblog/wp/ 2014/06/20/
[3] Chen, W. (2014, June). Technical improvements on mobile app based taxi dispatching system. Paper presented at the 3rd International Conference on Computer Science and Service System. Retrieved from: https://ieeexplore.ieee.org/ abstract/document/6544843
[4] Harding, S., Kandlikar, M., & Gulati, S. (2016). Taxi apps, regulation,and the market for taxi journeys. Transportation Research Part A:Policy and Practice, 88, 15-25. https://doi.org/10.1016/j.tra.2016.03.009
[5] Harris, B. (2017). Uber, lyft, and regulating the sharing economy. Seattle University Law Review, 41(1), 269-285. https://digitalcommons.law.seattleu.edu/sulr/vol41/iss1/8/
[6] Kuemmel, M., Busch, F., & Wang, D. Z. W. (2015, January). Taxi driver’s dilemma: which passenger-Selection strategy maximizes profit? Paper presented at the Transportation Research Board 94th Annual Meeting, Washington DC, United States. Retrieved from: http://amonline.trb.org/
[7] Ma, S., Zheng, Y., & Wolfson, O. (2013, June 25). T-Share: A large-scale dynamic taxi ridesharing service. Paper presented at 2013 IEEE 29th International Conference on Data Engineering, Brisbane, QLD, Australia.Retrieved from: https://ieeexplore.ieee.org/abstract/document/654484
[8] Zhang, Z. X., Qin, Q., & Zhang, Y. (2015). The Discussion of taxis' management reform direction under "internet plus". Price: Theory & Practice, 7, 17-20.
[9] Jiang, J. Y., Wang, L. L., & Liu, Y. L. (2014). Analysis of the taxi industry regulation and relaxation regulation. Technology & Economy in Areas of Communications, 16(6), 65-69. https://doi.org/10.19348/j.cnki.issn1008-5696.2014.06.019
[10] Liu, K. Q. & Fan, H. S. (2016). The interest game in taxi industry and itsdevelopment trend under the "internet plus" paradigm—based on the taxi marketresearch under the influence of Didi taxi in Hefei. Journal of Taiyuan University of Technology (Social Science Edition), 34(2), 55-60.
[11] Cramer, J. & Krueger, A. B. (2016).Disruptive change in the taxi business: the case of uber. American Economic Review, 106(5), 177-182. https://doi.org/10.1257/aer.p20161002
[12] Kim, K., Baek, C., & Leec, J. D. (2018). Creative destruction of the sharing economy in action: the case of uber. Transportation Research Part A: Policy and Practice, 110, 118-127. https://doi.org/10.1016/j.tra.2018.01.014
[13] Bond, A. T. (2015). An app for that: local governments and the rise of the sharing economy. Notre Dame Law Review, 90(2), 77-96.
[14] Lu, J. & Wang, W. (2004). Confirming method of urban taxi quantity. Journal of Traffic and Transportation Engineering, 4(1), 92-95.https: //doi.org/10.3321/j.issn:1671-1637.2004.01.023
[15] Yang, L. Q., Zong, G., & Liu, Y. H. (2014). Novel road network traffic flow simulation model based on O-D estimation. Computer Engineering and Applications, 50(18), 1-7. https://doi.org/10.3778/j.issn.1002-8331.1312-0438
[16] Mistry, P., Neagu, D., Trundle, P. R., & Vessey, J. D. (2016). Using random forest and decision tree models for a new vehicle prediction approach in computational toxicology. Soft Computing, 20(8), 2967-2979. https://doi.org/10.1007/s00500-015-1925-9
[17] Jonathan, V. H. & Alan, B. K. (2016). An analysis of the labor market for uber's driver-Partners in the United States. ILR Review, 71(3), 705-732. https://doi.org/10.1177/0019793917717222
[18] Hu, B. B., Kong, Y. W., Sun, M. G., Dong, X. L., & Zong, G. (2018). Understanding the unbalance of interest in taxi market based on drivers' service profit margins. Plos One, 13(6), e0198491. https://doi.org/10.1371/journal.pone.0198491
[19] Liu, J. Q., Zhu, J. M., Li, Z. H., & Li, J. L. (2015). Matching measure of taxi supply and demand and utility analysis of subsidy schemes in internet plus era. Journal of Shanghai University of Engineering Science, 29(4),378-382. https://doi.org/10.3969/j.issn.1009-444X.2015.04.020
[20] Zeng, Y. J. (2017). The regulation dilemma and regulatory innovation of internetchauffeured car-based on the analysis of role of government. Lanzhou Academic Journal, 8, 189-197.
[21] Yang, Y. J. & Zhao, X. M. (2012). Schedule model of urban taxi quantity based on taxi running information. China Journal of Highway and Transport, 25(5), 120-125. https://doi.org/10.19721/j.cnki.1001-7372.2012.05.018
[22] Ding, H. (2008). Model of taxi planning in urban traffic management. Mathematics in Practice and Theory, 38(6), 94-101.
[23] Hu, X. B., Gao, S., Chiu, Y. C., & Lin, D. Y. (2012). Modeling routing behavior for vacant taxi cabs in urban traffic networks. Transportation Research Record: Journal of the Transportation Research Board, 2284(1), 81-88. https://doi.org/10.3141/2284-10
[24] Zhang, L. X. (2018). An analysis for the identification, measure and regulation of monopoly of online car-hailing platforms, China Price, 12, 25-27.
[25] Li, J. J. (2018). Research on the regulation of the online taxi booking business in China, (Master' sthesis). Retrieved from: http://kns.cnki.net/kns/detail/detail.aspx?FileName= 1019001234.nh&DbName=CMFD2019.
[26] He, J., Li, Y., & Deng, Z. J. (2018). The regulators and solutions of online ride-hailing regulation from the perspective of interest game. Modern Communication, 10, 73-74.
[27] Yang, H., Fung, C. S., Wong, K. I., & Wong, S. C. (2010). Nonlinear pricing of taxi services. Transportation Research Part A: Policy & Practice, 44(5), 337-348. https://doi.org/10.1016/j.tra.2010.03.004
[28] Yuan, C. W. & Wu, Q. Q. (2014). Optimal loading rate model of taxi under different objectives. Journal of Chang 'an University (Natural Science Edition), 34(2), 88-93.
[29] You, L. (2016). Taxi companies operating performance evaluation and development policy in Wuxi with big data environment, (Master's thesis). Retrieved from: http://kns.cnki.net/kns/detail/detail.aspx?FileName=1017116625.nh&DbName=CMFD2018.
Contact information:
Xujun MA, PhD, Associate Professor (Corresponding author) School of Economics & Management, Taiyuan University of Science and Technology, Room 918, No. 66 Waliu Road, Wanbailin District, Taiyuan County, Shanxi Province, 030024 China E-mail: [email protected]