images pdfs may june2014
TRANSCRIPT
7/25/2019 Images Pdfs May June2014
http://slidepdf.com/reader/full/images-pdfs-may-june2014 1/32
May - June 2014
SITRA News 1
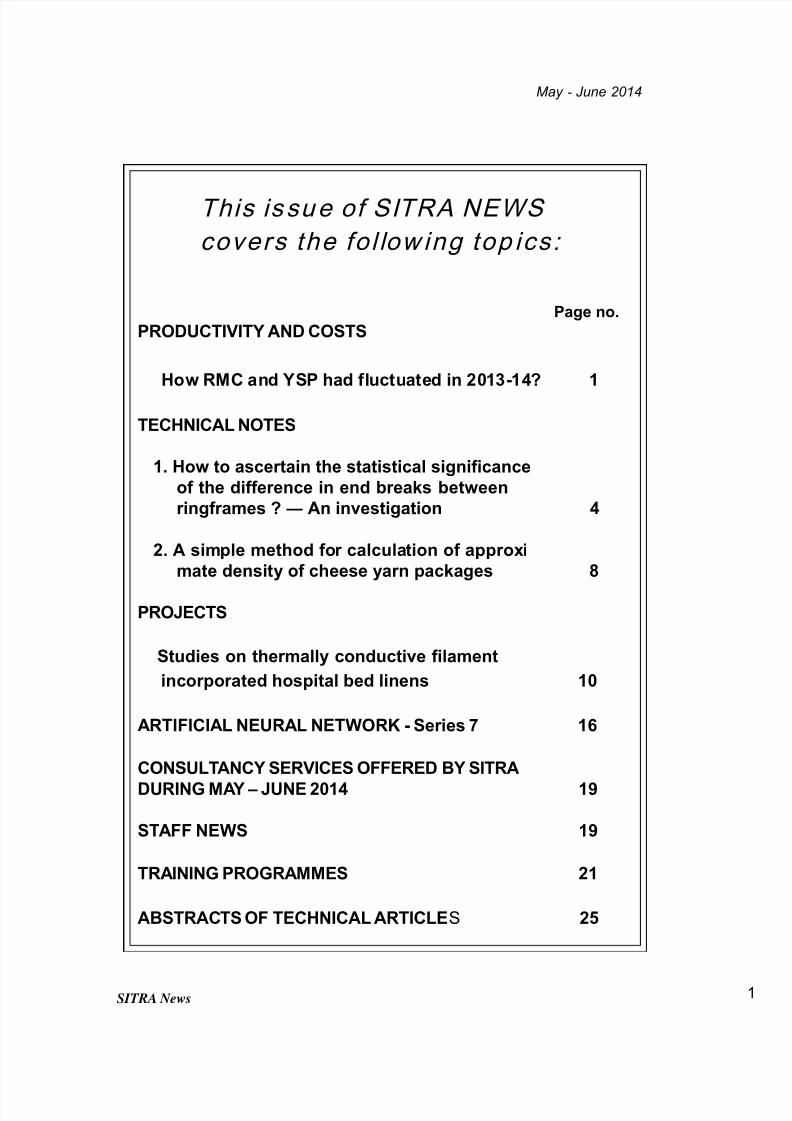
This issue of SITRA NEWS
covers the fol low ing top ics:
Page no.
PRODUCTIVITY AND COSTS
How RMC and YSP had fluctuated in 2013-14? 1
TECHNICAL NOTES
1. How to ascertain the statistical significance
of the difference in end breaks between
ringframes ? ― An investigation 4
2. A simple method for calculation of approxi
mate density of cheese yarn packages 8
PROJECTS
Studies on thermally conductive filament
incorporated hospital bed linens 10
ARTIFICIAL NEURAL NETWORK - Series 7 16
CONSULTANCY SERVICES OFFERED BY SITRADURING MAY – JUNE 2014 19
STAFF NEWS 19
TRAINING PROGRAMMES 21
ABSTRACTS OF TECHNICAL ARTICLES 25
7/25/2019 Images Pdfs May June2014
http://slidepdf.com/reader/full/images-pdfs-may-june2014 2/32
May - June 2014
SITRA News 1
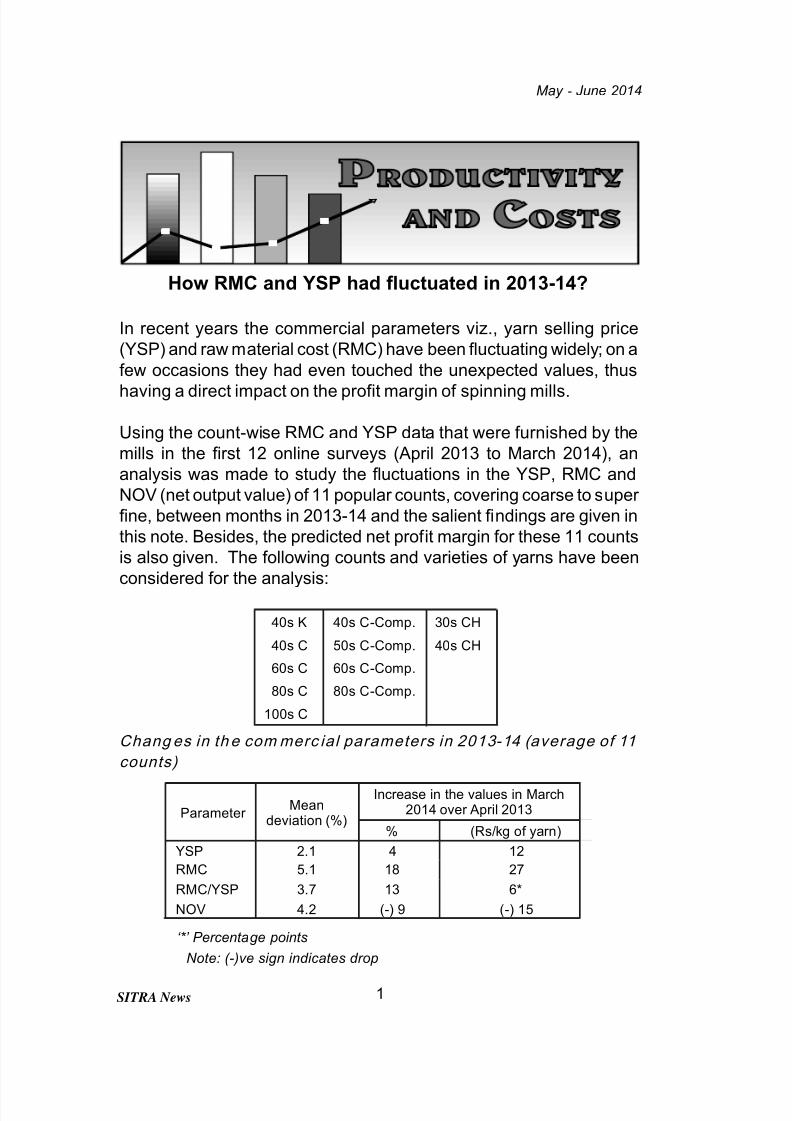
How RMC and YSP had fluctuated in 2013-14?
In recent years the commercial parameters viz., yarn selling price
(YSP) and raw material cost (RMC) have been fluctuating widely; on a
few occasions they had even touched the unexpected values, thus
having a direct impact on the profit margin of spinning mills.
Using the count-wise RMC and YSP data that were furnished by the
mills in the first 12 online surveys (April 2013 to March 2014), an
analysis was made to study the fluctuations in the YSP, RMC and
NOV (net output value) of 11 popular counts, covering coarse to super
fine, between months in 2013-14 and the salient findings are given in
this note. Besides, the predicted net profit margin for these 11 counts
is also given. The following counts and varieties of yarns have been
considered for the analysis:
Chang es in th e commerc ial parameters in 2013-14 (average of 11
counts)
‘*’ Percentage points
Note: (-)ve sign indicates drop
40s K 40s C-Comp. 30s CH
40s C 50s C-Comp. 40s CH
60s C 60s C-Comp.
80s C 80s C-Comp.
100s C
Parameter Mean
deviation (%)
Increase in the values in March2014 over April 2013
% (Rs/kg of yarn)
YSP 2.1 4 12
RMC 5.1 18 27
RMC/YSP 3.7 13 6*
NOV 4.2 (-) 9 (-) 15
7/25/2019 Images Pdfs May June2014
http://slidepdf.com/reader/full/images-pdfs-may-june2014 3/32
May - June 2014
SITRA News 2
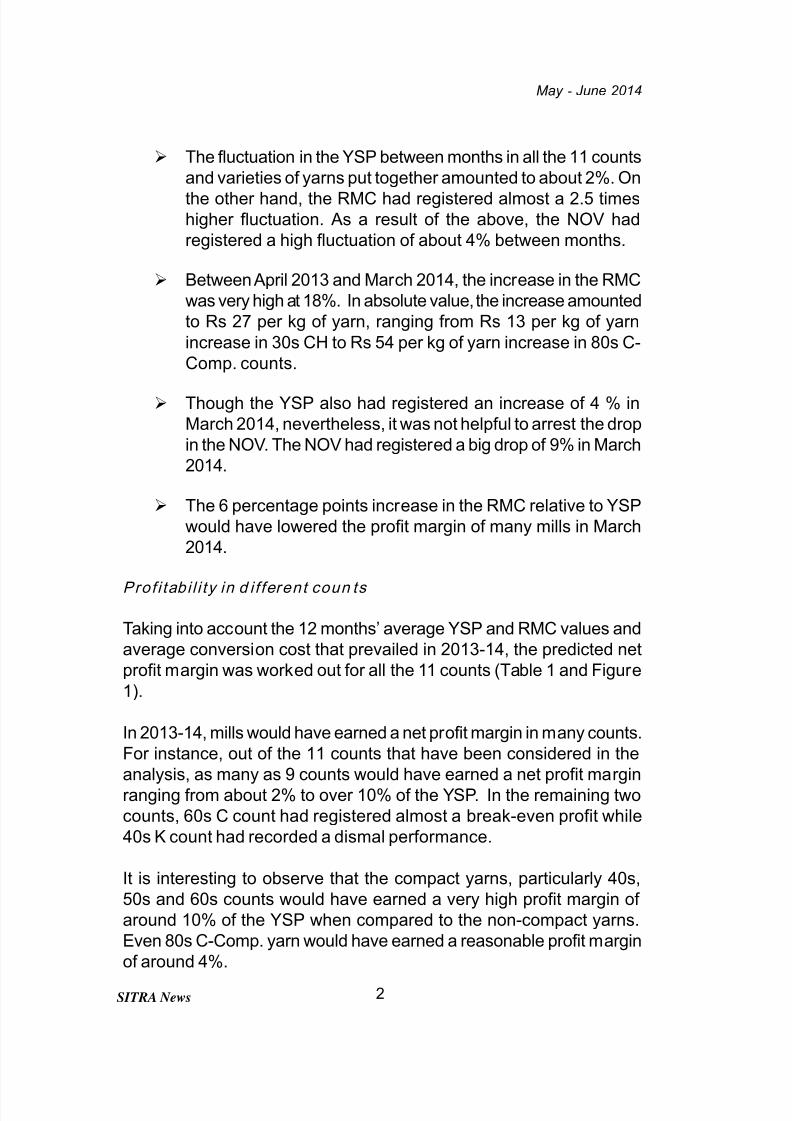
The fluctuation in the YSP between months in all the 11 counts
and varieties of yarns put together amounted to about 2%. On
the other hand, the RMC had registered almost a 2.5 timeshigher fluctuation. As a result of the above, the NOV had
registered a high fluctuation of about 4% between months.
Between April 2013 and March 2014, the increase in the RMC
was very high at 18%. In absolute value, the increase amounted
to Rs 27 per kg of yarn, ranging from Rs 13 per kg of yarn
increase in 30s CH to Rs 54 per kg of yarn increase in 80s C-
Comp. counts.
Though the YSP also had registered an increase of 4 % in
March 2014, nevertheless, it was not helpful to arrest the drop
in the NOV. The NOV had registered a big drop of 9% in March
2014.
The 6 percentage points increase in the RMC relative to YSP
would have lowered the profit margin of many mills in March
2014.
Prof i tabi l i ty in d i f ferent coun ts
Taking into account the 12 months’ average YSP and RMC values and
average conversion cost that prevailed in 2013-14, the predicted net
profit margin was worked out for all the 11 counts (Table 1 and Figure
1).
In 2013-14, mills would have earned a net profit margin in many counts.
For instance, out of the 11 counts that have been considered in the
analysis, as many as 9 counts would have earned a net profit marginranging from about 2% to over 10% of the YSP. In the remaining two
counts, 60s C count had registered almost a break-even profit while
40s K count had recorded a dismal performance.
It is interesting to observe that the compact yarns, particularly 40s,
50s and 60s counts would have earned a very high profit margin of
around 10% of the YSP when compared to the non-compact yarns.
Even 80s C-Comp. yarn would have earned a reasonable profit margin
of around 4%.
7/25/2019 Images Pdfs May June2014
http://slidepdf.com/reader/full/images-pdfs-may-june2014 4/32
May - June 2014
SITRA News 3
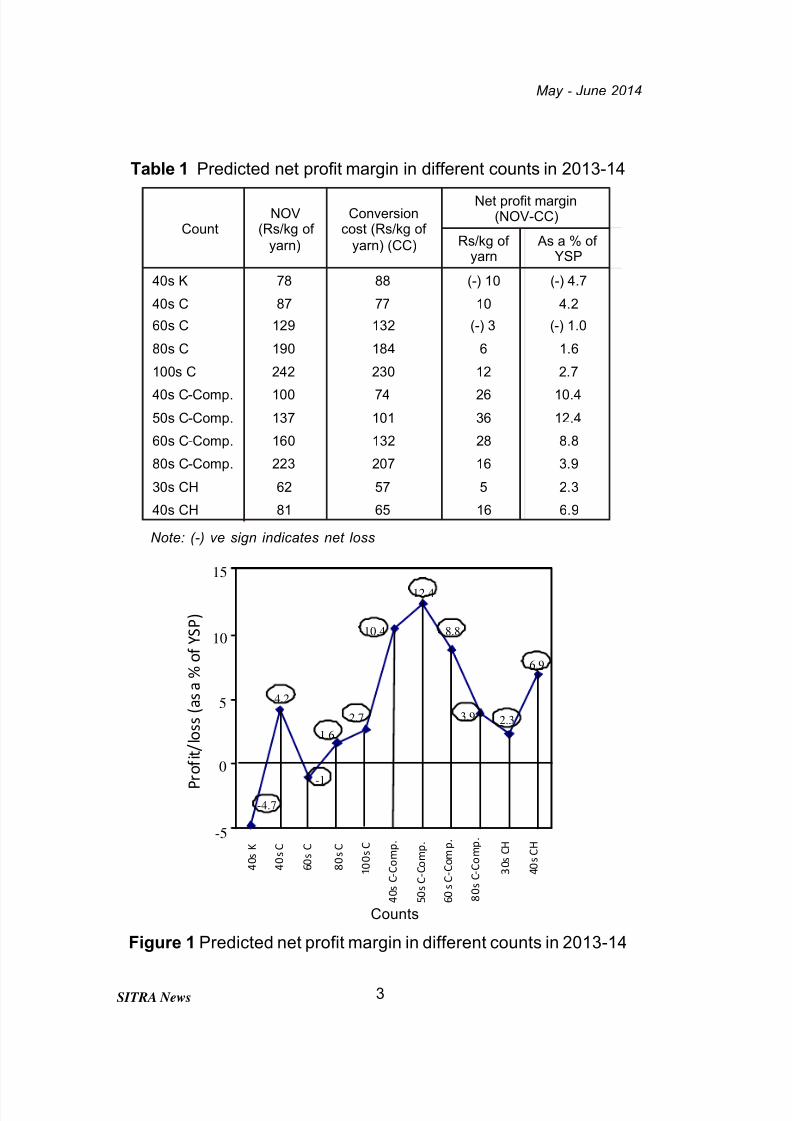
Table 1 Predicted net profit margin in different counts in 2013-14
Note: (-) ve sign indicates net loss
Figure 1 Predicted net profit margin in different counts in 2013-14
CountNOV
(Rs/kg of
yarn)
Conversioncost (Rs/kg of
yarn) (CC)
Net profit margin(NOV-CC)
Rs/kg of yarn
As a % of YSP
40s K 78 88 (-) 10 (-) 4.7
40s C 87 77 10 4.2
60s C 129 132 (-) 3 (-) 1.0
80s C 190 184 6 1.6
100s C 242 230 12 2.7
40s C-Comp. 100 74 26 10.4
50s C-Comp. 137 101 36 12.4
60s C-Comp. 160 132 28 8.8
80s C-Comp. 223 207 16 3.9
30s CH 62 57 5 2.3
40s CH 81 65 16 6.9
8.8
6.9
2.33.9
12.4
-4.7
4.2
-1
1.6
2.7
10.4
-5
0
5
10
15
P r o
f i t / l o s s ( a s a %
o f Y S P )
4 0 s K
4 0 s C
6 0 s C
8 0 s C
1 0 0 s C
4 0 s C - C o m p .
6 0 s C - C o m p .
5 0 s C - C o m p .
8 0 s C - C o m p .
3 0 s C H
4 0 s C H
Counts
7/25/2019 Images Pdfs May June2014
http://slidepdf.com/reader/full/images-pdfs-may-june2014 5/32
May - June 2014
SITRA News 4
References
1. Nagarajan N K, Subash P, Raj Kumar S and Shanmuganandam D Online Survey of Raw Material Cost and Yarn Selling Price
– SITRA publications (12 surveys: April 2013 to March 2014).
2. Sreenivasan J and Shanmuganandam D
An inter-mill study on fibre to yarn conversion cost – 3rd study
Vol.58, No.4, January 2014.
- D.Shanmuganandam
Liaison and Consultation Division
1. How to ascertain the statistical significance of thedifference in end breaks between ringframes ?
― An investigation
Four ringframes were observed for end breaks and the results are
given in Table 1.
Table 1 No. of end breaks in different ringframes
Is there any evidence to conclude that the end breakage rates differ
between machines?
- Total no. of end breaks = 425
RingframeDuration of observation
(spindle hours)No. of end breaks
A 500 50
B 1000 120
C 1000 150
D 800 105
7/25/2019 Images Pdfs May June2014
http://slidepdf.com/reader/full/images-pdfs-may-june2014 6/32
May - June 2014
SITRA News 5
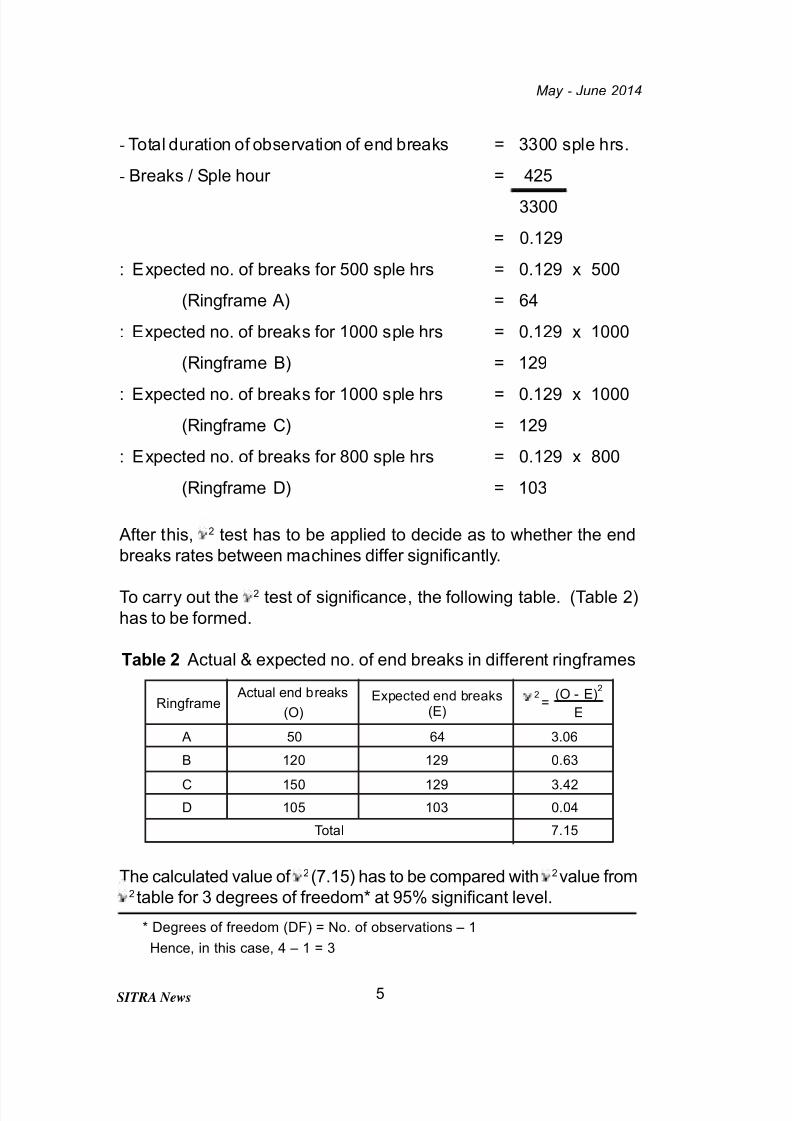
- Total duration of observation of end breaks = 3300 sple hrs.
- Breaks / Sple hour = 425
3300
= 0.129
: Expected no. of breaks for 500 sple hrs = 0.129 x 500
(Ringframe A) = 64
: Expected no. of breaks for 1000 sple hrs = 0.129 x 1000
(Ringframe B) = 129
: Expected no. of breaks for 1000 sple hrs = 0.129 x 1000
(Ringframe C) = 129
: Expected no. of breaks for 800 sple hrs = 0.129 x 800
(Ringframe D) = 103
After this, 2 test has to be applied to decide as to whether the end
breaks rates between machines differ significantly.
To carry out the 2 test of significance, the following table. (Table 2)
has to be formed.
Table 2 Actual & expected no. of end breaks in different ringframes
The calculated value of 2 (7.15) has to be compared with 2value from2 table for 3 degrees of freedom* at 95% significant level.
Ringframe Actual end breaks
(O)
Expected end breaks(E)
(O - E)2
E
A 50 64 3.06
B 120 129 0.63
C 150 129 3.42
D 105 103 0.04
Total 7.15
2=
* Degrees of freedom (DF) = No. of observations – 1
Hence, in this case, 4 – 1 = 3
7/25/2019 Images Pdfs May June2014
http://slidepdf.com/reader/full/images-pdfs-may-june2014 7/32
May - June 2014
SITRA News 6
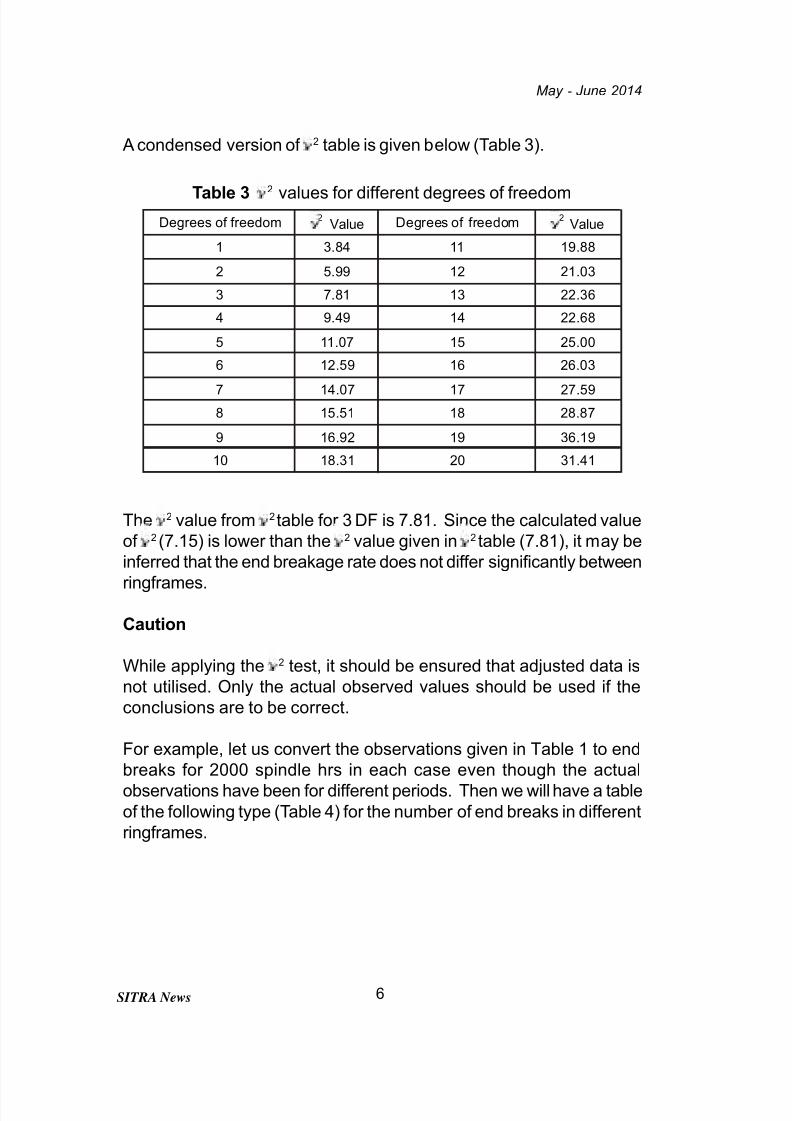
A condensed version of 2 table is given below (Table 3).
Table 3 2 values for different degrees of freedom
The 2 value from 2 table for 3 DF is 7.81. Since the calculated value
of 2 (7.15) is lower than the 2 value given in 2 table (7.81), it may be
inferred that the end breakage rate does not differ significantly between
ringframes.
Caution
While applying the 2 test, it should be ensured that adjusted data is
not utilised. Only the actual observed values should be used if the
conclusions are to be correct.
For example, let us convert the observations given in Table 1 to end
breaks for 2000 spindle hrs in each case even though the actualobservations have been for different periods. Then we will have a table
of the following type (Table 4) for the number of end breaks in different
ringframes.
Degrees of freedom 2Value Degrees of freedom 2
Value
1 3.84 11 19.88
2 5.99 12 21.03
3 7.81 13 22.36
4 9.49 14 22.68
5 11.07 15 25.00
6 12.59 16 26.03
7 14.07 17 27.59
8 15.51 18 28.87
9 16.92 19 36.19
10 18.31 20 31.41
7/25/2019 Images Pdfs May June2014
http://slidepdf.com/reader/full/images-pdfs-may-june2014 8/32
May - June 2014
SITRA News 7
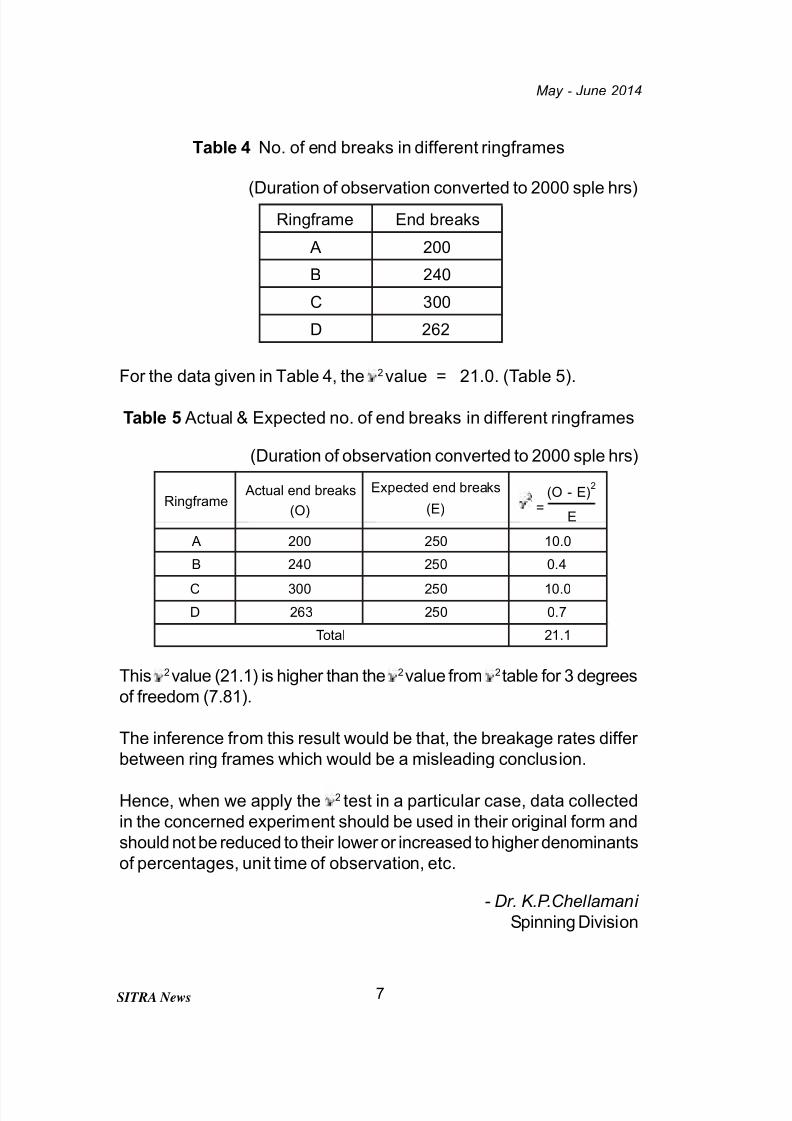
Table 4 No. of end breaks in different ringframes
(Duration of observation converted to 2000 sple hrs)
For the data given in Table 4, the 2 value = 21.0. (Table 5).
Table 5 Actual & Expected no. of end breaks in different ringframes
(Duration of observation converted to 2000 sple hrs)
This 2value (21.1) is higher than the 2value from 2 table for 3 degrees
of freedom (7.81).
The inference from this result would be that, the breakage rates differ
between ring frames which would be a misleading conclusion.
Hence, when we apply the 2 test in a particular case, data collected
in the concerned experiment should be used in their original form and
should not be reduced to their lower or increased to higher denominants
of percentages, unit time of observation, etc.
- Dr. K.P.Chellamani
Spinning Division
Ringframe End breaks
A 200
B 240
C 300
D 262
Ringframe Actual end breaks
(O)
Expected end breaks
(E)2
(O - E)2
E
A 200 250 10.0
B 240 250 0.4
C 300 250 10.0
D 263 250 0.7
Total 21.1
=
7/25/2019 Images Pdfs May June2014
http://slidepdf.com/reader/full/images-pdfs-may-june2014 9/32
May - June 2014
SITRA News 8
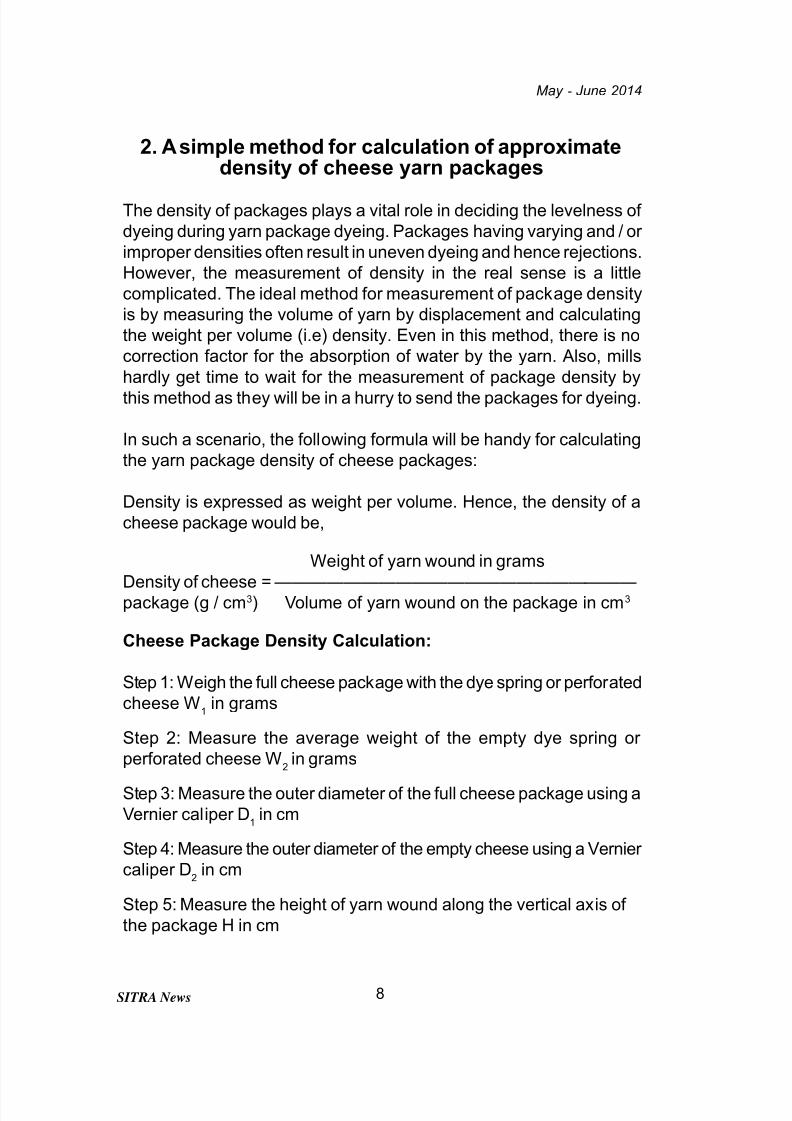
2. A simple method for calculation of approximatedensity of cheese yarn packages
The density of packages plays a vital role in deciding the levelness of
dyeing during yarn package dyeing. Packages having varying and / or
improper densities often result in uneven dyeing and hence rejections.
However, the measurement of density in the real sense is a little
complicated. The ideal method for measurement of package density
is by measuring the volume of yarn by displacement and calculating
the weight per volume (i.e) density. Even in this method, there is no
correction factor for the absorption of water by the yarn. Also, mills
hardly get time to wait for the measurement of package density by
this method as they will be in a hurry to send the packages for dyeing.
In such a scenario, the following formula will be handy for calculating
the yarn package density of cheese packages:
Density is expressed as weight per volume. Hence, the density of a
cheese package would be,
Weight of yarn wound in grams
Density of cheese = —————————————————————package (g / cm3) Volume of yarn wound on the package in cm3
Cheese Package Density Calculation:
Step 1: Weigh the full cheese package with the dye spring or perforated
cheese W1 in grams
Step 2: Measure the average weight of the empty dye spring or
perforated cheese W2 in grams
Step 3: Measure the outer diameter of the full cheese package using a
Vernier caliper D1 in cm
Step 4: Measure the outer diameter of the empty cheese using a Vernier
caliper D2 in cm
Step 5: Measure the height of yarn wound along the vertical axis of
the package H in cm
7/25/2019 Images Pdfs May June2014
http://slidepdf.com/reader/full/images-pdfs-may-june2014 10/32
May - June 2014
SITRA News 9
Step 6: Apply the following formula and calculate the package
density
(W1 – W
2) x 4
Density of cheese yarn package = —————————
π x (D1
2 – D22) x H
Example:
Weight of cheese full package W1
= 1227 g.
Weight of empty cheese W2
= 55 g.
Outer diameter of full cheese package D1
= 18.5 cm
Outer diameter of empty cheese D2
= 6.8 cm
Height of yarn wound on full cheese package H = 14.8 cm
(1227 – 55) x 4
= —————————-— =
π x (18.52 – 6.82) x 14.8
Using the above formula the approximate density of a cheese package
can be calculated within minutes and hence it helps in taking quick
decisions during soft package winding. For better dyeing results,
cheese package density for cotton yarn should be maintained between
0.25 and 0.35g/cm3 or 250 g/l to 350 g/l, depending upon the count of
yarn. The ideal cheese package density for polyester yarn would be
between 0.40 and 0.45g/cm3 or 400 g/l to 450 g/l.
Another variable which decides the uniformity of dyeing within a batch
of cheeses is the length of yarn wound on the cheeses. It is ideal to
have prefixed length counter on winding machines to ensure uniform
diameter of packages on all drums.
- S. Kowsalya and S. Sivakumar
Textile Chemistry Division
Density of
cheese yarn
package
0.3408 g / cm3 or
340.8 g/l
7/25/2019 Images Pdfs May June2014
http://slidepdf.com/reader/full/images-pdfs-may-june2014 11/32
May - June 2014
SITRA News 10
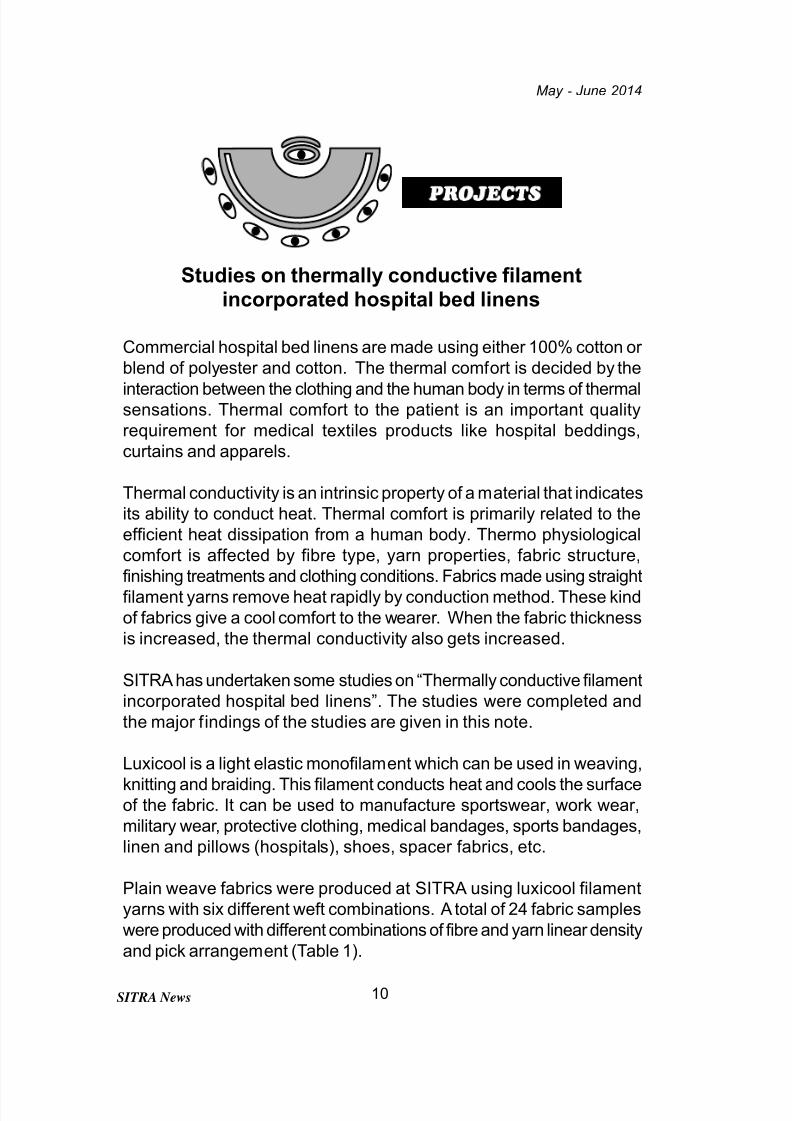
Studies on thermally conductive filamentincorporated hospital bed linens
Commercial hospital bed linens are made using either 100% cotton or
blend of polyester and cotton. The thermal comfort is decided by the
interaction between the clothing and the human body in terms of thermalsensations. Thermal comfort to the patient is an important quality
requirement for medical textiles products like hospital beddings,
curtains and apparels.
Thermal conductivity is an intrinsic property of a material that indicates
its ability to conduct heat. Thermal comfort is primarily related to the
efficient heat dissipation from a human body. Thermo physiological
comfort is affected by fibre type, yarn properties, fabric structure,
finishing treatments and clothing conditions. Fabrics made using straightfilament yarns remove heat rapidly by conduction method. These kind
of fabrics give a cool comfort to the wearer. When the fabric thickness
is increased, the thermal conductivity also gets increased.
SITRA has undertaken some studies on “Thermally conductive filament
incorporated hospital bed linens”. The studies were completed and
the major findings of the studies are given in this note.
Luxicool is a light elastic monofilament which can be used in weaving,
knitting and braiding. This filament conducts heat and cools the surface
of the fabric. It can be used to manufacture sportswear, work wear,
military wear, protective clothing, medical bandages, sports bandages,
linen and pillows (hospitals), shoes, spacer fabrics, etc.
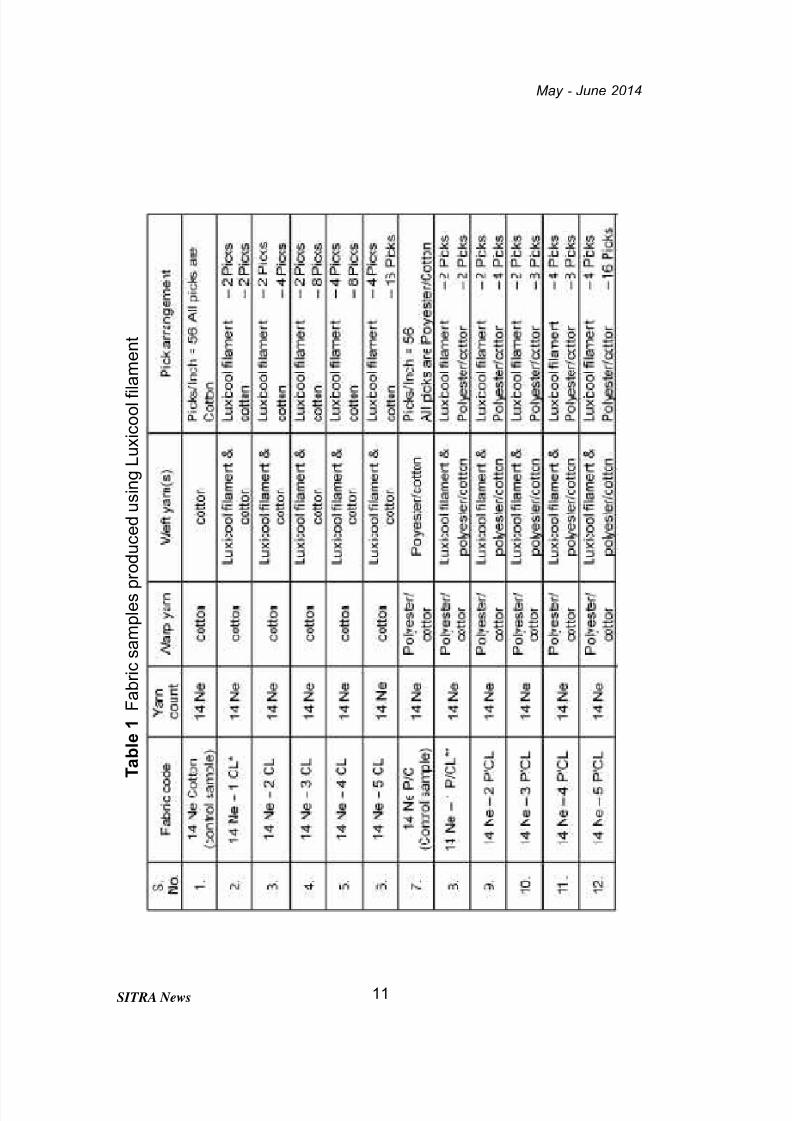
Plain weave fabrics were produced at SITRA using luxicool filament
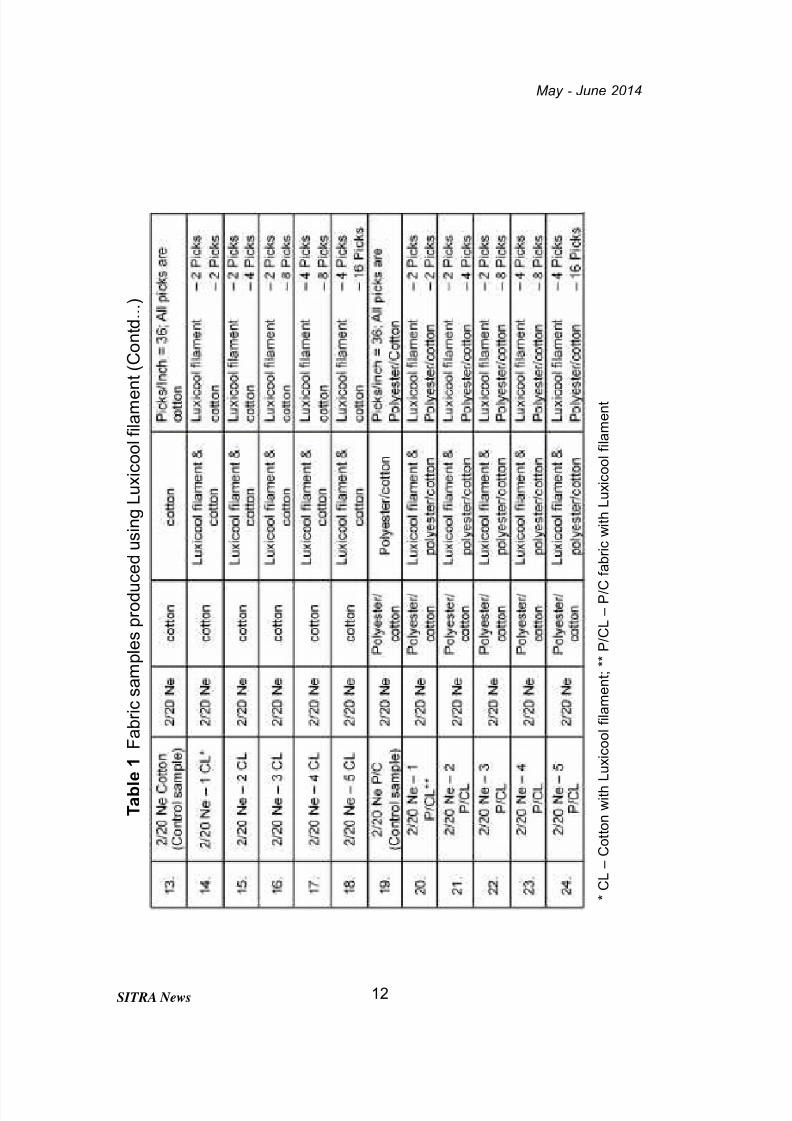
yarns with six different weft combinations. A total of 24 fabric samples
were produced with different combinations of fibre and yarn linear density
and pick arrangement (Table 1).
7/25/2019 Images Pdfs May June2014
http://slidepdf.com/reader/full/images-pdfs-may-june2014 12/32
May - June 2014
SITRA News 11
T
a b l e
1
F a b r i c s a m p l e s p r o d u c e d u s i n g L u x i c o o l f i l a m e n t
7/25/2019 Images Pdfs May June2014
http://slidepdf.com/reader/full/images-pdfs-may-june2014 13/32
May - June 2014
SITRA News 12
T a b l e
1
F a b r i c s a m p l e s p r o d u c
e d u s i n g L u x i c o o l f i l a m e n
t ( C o n t d . . . )
* C L – C o t t o n w i t h L u x i c o o l f i l a m e n t ; * * P / C L – P / C
f a b r i c w i t h L u x i c o o l f i l a m e n t
7/25/2019 Images Pdfs May June2014
http://slidepdf.com/reader/full/images-pdfs-may-june2014 14/32
May - June 2014
SITRA News 13
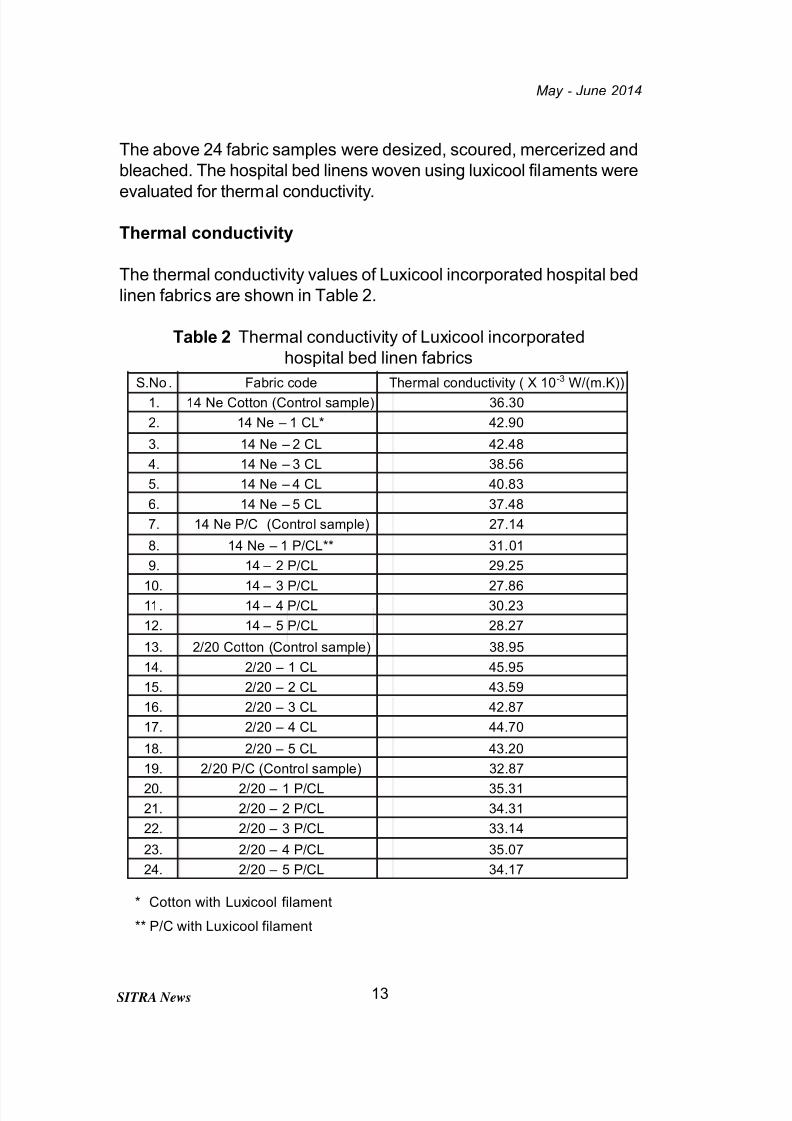
The above 24 fabric samples were desized, scoured, mercerized and
bleached. The hospital bed linens woven using luxicool filaments were
evaluated for thermal conductivity.
Thermal conductivity
The thermal conductivity values of Luxicool incorporated hospital bed
linen fabrics are shown in Table 2.
Table 2 Thermal conductivity of Luxicool incorporated
hospital bed linen fabrics
* Cotton with Luxicool filament
** P/C with Luxicool filament
S.No . Fabric code Thermal conductivity ( X 10-3
W/(m.K))1. 14 Ne Cotton (Control sample) 36.30
2. 14 Ne – 1 CL* 42.90
3. 14 Ne – 2 CL 42.48
4. 14 Ne – 3 CL 38.56
5. 14 Ne – 4 CL 40.83
6. 14 Ne – 5 CL 37.48
7. 14 Ne P/C (Control sample) 27.14
8. 14 Ne – 1 P/CL** 31.01
9. 14 – 2 P/CL 29.25
10. 14 – 3 P/CL 27.86
11. 14 – 4 P/CL 30.23
12. 14 – 5 P/CL 28.27
13. 2/20 Cotton (Control sample) 38.95
14. 2/20 – 1 CL 45.95
15. 2/20 – 2 CL 43.59
16. 2/20 – 3 CL 42.87
17. 2/20 – 4 CL 44.70
18. 2/20 – 5 CL 43.20
19. 2/20 P/C (Control sample) 32.8720. 2/20 – 1 P/CL 35.31
21. 2/20 – 2 P/CL 34.31
22. 2/20 – 3 P/CL 33.14
23. 2/20 – 4 P/CL 35.07
24. 2/20 – 5 P/CL 34.17
7/25/2019 Images Pdfs May June2014
http://slidepdf.com/reader/full/images-pdfs-may-june2014 15/32
May - June 2014
SITRA News 14
Thermal conductivity of luxicool incorporated bed linens is found to be
better by about 20% as compared to commercially available hospital
bed linens (Control sample). Higher values of thermal conductivity arebetter for fabrics meant for hospital bed linens. Relatively higher values
of thermal conductivity were observed for
i) 14 Ne cotton fabrics incorporated with Luxicool filament
(Pick arrangement: cotton – 2 picks
Polyester – 2 picks)
ii) 14 Ne p/c fabrics incorporated with Luxicool filament
(Pick arrangement: cotton – 2 picks
Polyester – 2 picks)
iii) 2/20 Ne cotton fabrics incorporated with Luxicool filament
(Pick arrangement: cotton – 2 picks
Polyester – 2 picks)
iv) 2/20 Ne p/c fabrics incorporated with Luxicool filament
(Pick arrangement: cotton – 2 picks
Polyester – 2 picks)
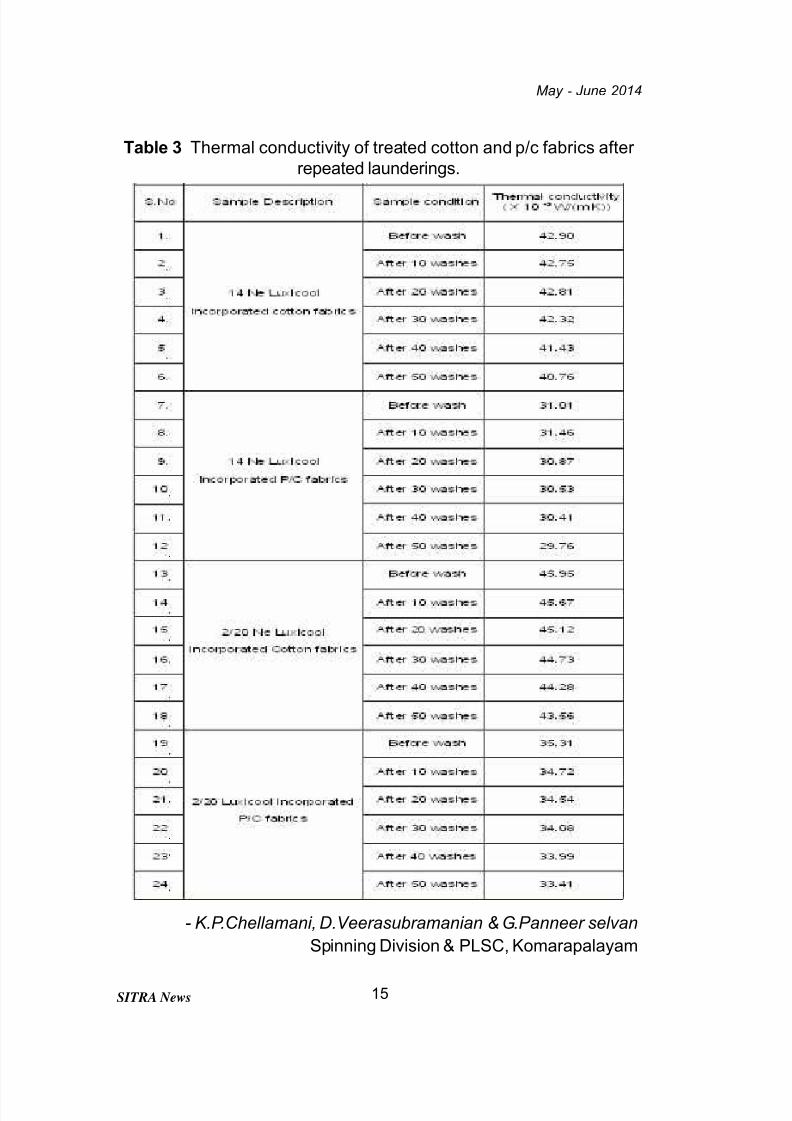
Durability of Luxicool incorporated fabric samples
In order to assess the durability of Luxicool incorporated cotton and p/
c fabrics, the thermal conductivity of those fabrics was evaluated after
different number of washes and the results are given in Table 3.
It is discernible from the table that the thermal conductivity of Luxicool
incorporated cotton and P/C fabrics did not get affected much upto 30
washes or so.
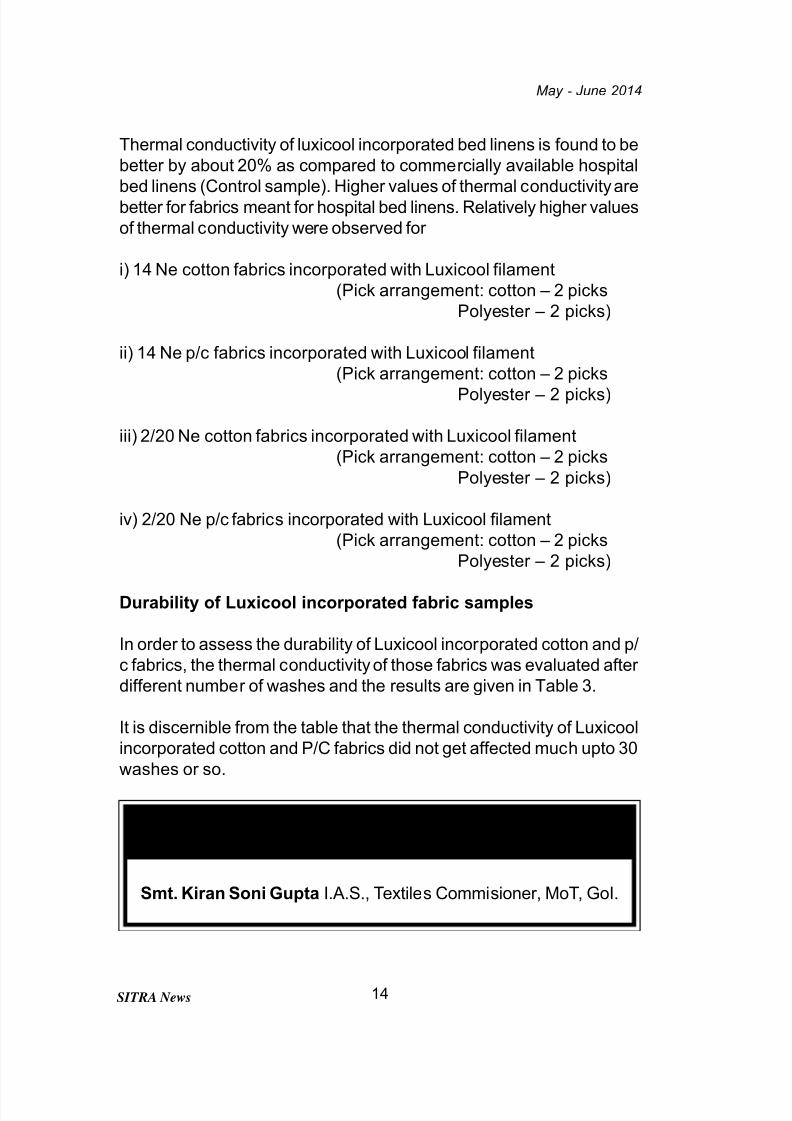
DISTINGUISHED VISITOR
Smt. Kiran Soni Gupta I.A.S., Textiles Commisioner, MoT, GoI.
7/25/2019 Images Pdfs May June2014
http://slidepdf.com/reader/full/images-pdfs-may-june2014 16/32
May - June 2014
SITRA News 15
- K.P.Chellamani, D.Veerasubramanian & G.Panneer selvan
Spinning Division & PLSC, Komarapalayam
Table 3 Thermal conductivity of treated cotton and p/c fabrics after
repeated launderings.
7/25/2019 Images Pdfs May June2014
http://slidepdf.com/reader/full/images-pdfs-may-june2014 17/32
May - June 2014
SITRA News 16
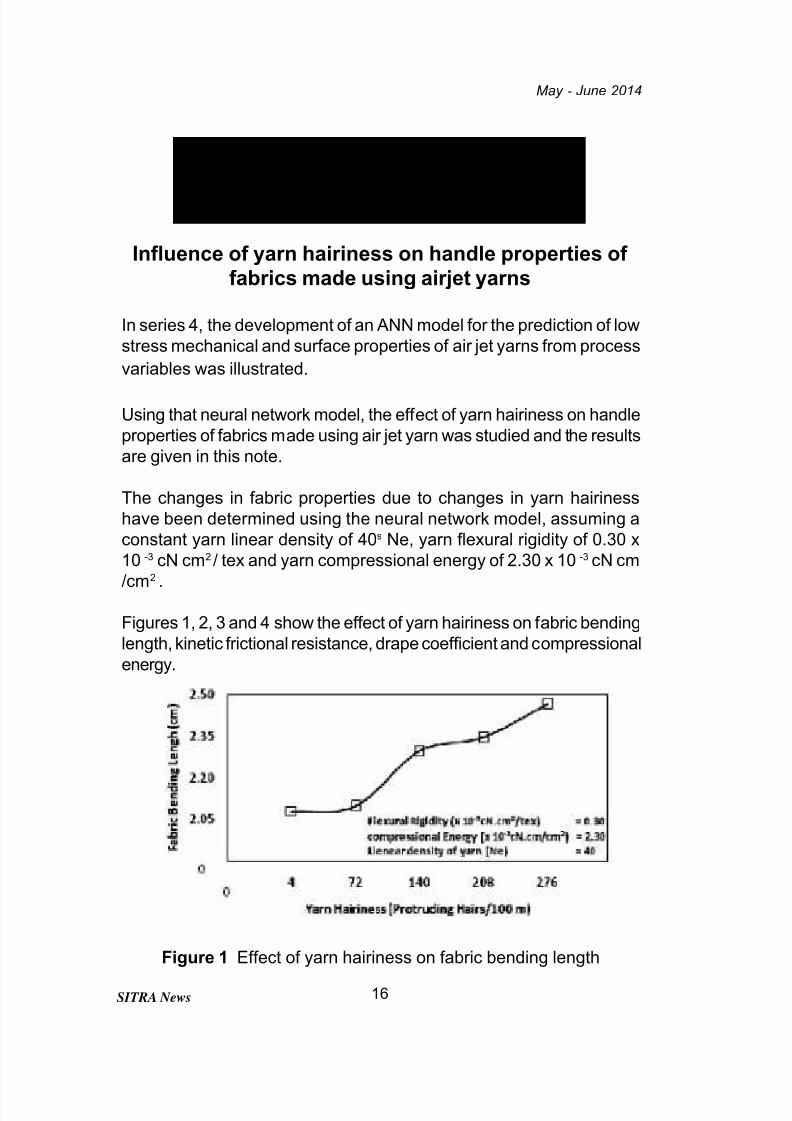
Figure 1 Effect of yarn hairiness on fabric bending length
ARTIFICIAL NEURAL NETWORK
Series 7
Influence of yarn hairiness on handle properties of fabrics made using airjet yarns
In series 4, the development of an ANN model for the prediction of low
stress mechanical and surface properties of air jet yarns from process
variables was illustrated.
Using that neural network model, the effect of yarn hairiness on handle
properties of fabrics made using air jet yarn was studied and the results
are given in this note.
The changes in fabric properties due to changes in yarn hairiness
have been determined using the neural network model, assuming a
constant yarn linear density of 40s Ne, yarn flexural rigidity of 0.30 x
10 -3 cN cm2 / tex and yarn compressional energy of 2.30 x 10 -3 cN cm
/cm2 .
Figures 1, 2, 3 and 4 show the effect of yarn hairiness on fabric bending
length, kinetic frictional resistance, drape coefficient and compressional
energy.
7/25/2019 Images Pdfs May June2014
http://slidepdf.com/reader/full/images-pdfs-may-june2014 18/32
May - June 2014
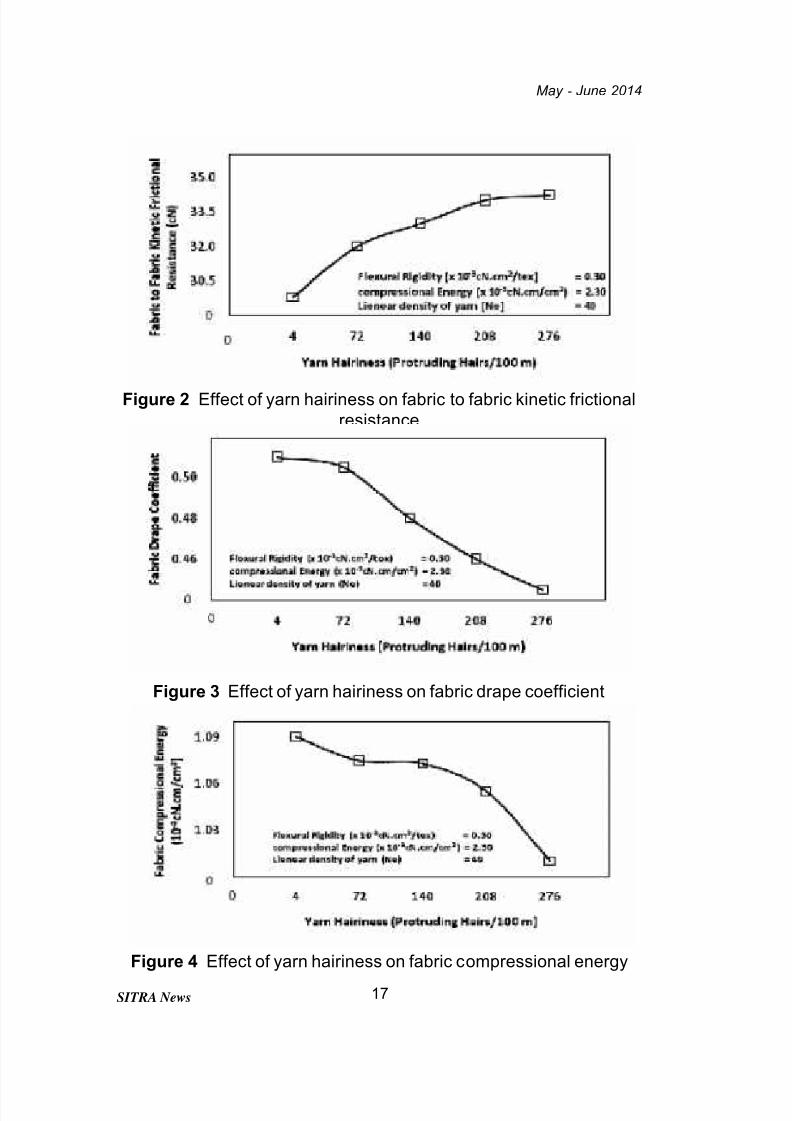
SITRA News 17Figure 4 Effect of yarn hairiness on fabric compressional energy
Figure 3 Effect of yarn hairiness on fabric drape coefficient
Figure 2 Effect of yarn hairiness on fabric to fabric kinetic frictional
resistance
7/25/2019 Images Pdfs May June2014
http://slidepdf.com/reader/full/images-pdfs-may-june2014 19/32
May - June 2014
SITRA News 18
Higher values of yarn hairiness show a tendency, to increase the bending
length and kinetic frictional resistance of fabrics and to decrease the
compressional energy and drape coefficient of fabrics.
With an increase in yarn hairiness, fibre-to-fibre interlacements between
adjacent threads in the fabric will be more, which should make the
fabric more difficult to bend and also increase the kinetic frictional
resistance during yarn-over-yarn or fabric-over-fabric movement.
The greater extent of fibre-to-fibre interlacements between adjacent
threads in the fabric when yarns of higher hairiness are used also
makes the fabric more difficult to compress, which in turn reduces the
fabric compressional energy. With an increase in yarn hairiness, one
would also expect a decrease in effective yarn diameter, which in turn
would increase the shear angle. The relationship between yarn
diameter and shear angle, , is given by :
F – Rd
= tan - 1 ———
W
Where,
F is the force acting on the specimen (gf),
R is the shear experienced by the specimen (gf / cm),
d is the width of the specimen (or diameter of yarn ) (cm)
and
W is the tensioning weight applied on the specimen.
The combined influence of the two opposite factors, i.e, an increase in
bending length and increase in shear angle, resulted in the observed
reduction of drape coefficient with an increase in yarn hairiness.
To be continued…- K.P.Chellamani & M.K.Vittopa
Spinning Division
7/25/2019 Images Pdfs May June2014
http://slidepdf.com/reader/full/images-pdfs-may-june2014 20/32
May - June 2014
SITRA News
Meetings attended
Dr. Prakash Vasudevan , Director, attended the third meeting of Sub-
Committee to identify HSN codes for Technical Textiles at the office of
the Textile Commissioner, Mumbai on 19th June, 2014.
MEDICAL TEXTILES - 11 S.no. Type of study No. of mills
Consultancy services offered by SITRA
during May - June 2014
1. Measures to reduce invisible loss 1
2. Machinery valuation 2
3. Techno-economic viability study 2
4. A study on doffing end breaks in ring frame 1
5. A study on improving yarn recovery 1
6. Weavers work assignment/loom efficiency study 1
7. Weft yarn performance study in Air-jet looms 108. Humidification system study 5
9. Energy audit 1
10. A method for precipitation of PVA in the
combined effluent 1
11. A study on bleaching of cotton terry towel
fabrics with peracetic acid 1
12. Feasibility of setting up a training centre 1
Besides the above major consultancy studies, SITRA also offered
solutions to eight adhoc problems in the area of spinning. Sixty oneinstruments were calibrated, 4 instruments were certified and 241
accessory samples were tested.
19
7/25/2019 Images Pdfs May June2014
http://slidepdf.com/reader/full/images-pdfs-may-june2014 21/32
May - June 2014
SITRA News
Dr. K.P.Chellam ani, General Manager - Projects, attended the following
meetings:
- two Doctoral Committee meeting held at Karpagam University on
30th and 31st May 2014.
- conducted the viva-voce examination of Mr.P.Ganesan, Ph.D.
scholar of Anna University, Chennai at P.S.G.College of
Technology, Coimbatore on 23rd June 2014.
Mr. Sakthi vel Perumalsamy, Head - Centre of Excellence for Medical
Textiles, attended the 11th meeting of Project Approval Committee (PAC)
for Project Management & Monitoring Consultant (PMMC) of Technology
Mission on Technical Textiles (TMTT) on 10th June 2014 at the office of
the Textile Commissioner, Mumbai.
Papers published
1. J .Sreen ivasan and D.Shanm ug anandam “ Fibre to yarn
conversion cost - an analysis”, Indian Textile Journal, May 2014,
Volume 124, No. 8, pp. 29 – 33.
2. D.Rangana t han “Phytochemical analysis of Caralluma
Nilagiriana using GC – MS” Journal of Pharmacognosy and
Phytochemistry, May 2014, ISSN 2278-4136, Vol. 3, Issue 1, pp.
155-159.
3. K.P.Chellamani, D.Veerasub ramanian & M.K.Vittop a , “Inter-
relationship between Deviation rate (DR%) in yarn mass and
variations in yarn tensile characteristics and fabric appearance”,
Journal of the Textile Association, May – June 2014, Volume 74,No. 6, pp. 353 – 359.
4. K.P.Chellaman i, R.S.Vign esh Balaji and D.Veerasub ramanian
“Wound dressings: SITRA’s Contributions”, International Journal of
Emerging Technology & Advanced Engineering, June 2014, Volume
4, No. 6, pp. 177 – 184.
5. K.P.Chellaman i, R.S.Vignesh Balaji and D.Veerasub ramanian
“Quality Evaluation methods for textile substrates based wound20

7/25/2019 Images Pdfs May June2014
http://slidepdf.com/reader/full/images-pdfs-may-june2014 22/32
May - June 2014
SITRA News
dressings”, International Journal of Emerging Technology & Advanced
Engineering, June 2014, Volume 4, No. 6, pp. 811 – 817.
Research Project review
Dr.K.P.Chellamani has reviewed a research project, on behalf of National
Research Development Corporation (NRDC), New Delhi for its suitability
for the Independence Day Prize Award.
New appointment
Mr. P.Prabu B.Tech. has been newly recruited as Scientific Officer inthe Liaison and Consultation Division.
Training programme on “Ratcheting quality in yarn manufacture”
A two-day programme focusing on the above topic was conducted at
SITRA during 16- 17, June 2014. Forty one technicians from 32 mills
attended the programme which covered topics like factors influencing
yarn elongation & yarn hairiness, Roller lapping in spinning, ways and
means of optimizing yarn quality with AFIS data & weak spot analysis,
results of various quality improvement studies at SITRA and the qualityrequirements of yarns expected by weavers & knitters.
Training programme on Low Voltage Switchgear selection and
maintenance
SITRA, in association with Larsen and Toubro Switchgear Training
Centre, Conoor has planned to organise a series of training programmes
on the selection and maintenance of low voltage switchgears. The
TRAINING
21

7/25/2019 Images Pdfs May June2014
http://slidepdf.com/reader/full/images-pdfs-may-june2014 23/32
May - June 2014
SITRA News
programmes are being offered in 5 modules - i) Circuit breakers; ii)
Contactors & OLR; iii) HRC Fuses, Motor Starters & MPCBs; iv) VFDs,
MCBs, ELCBs, DBs; v) Fault level Calculations, Numerical Relays,BBT, MV Switch Gear. The first module on Circuit Breakers was held
on 30th June, 2014. Eighteen persons representing various mills and
other other industires participated in the programme which covered
topics like introduction to switchgears, selection and operation of
MCCBs, and operation and maintenance of ACBs. There was good
apreciation for the programme which, apart from covering theoretical
sessions, provided opportunity to the partcipants to have hands-on
working on model switchgears.
Jobbers Development Programme
At the request of a mill at Udumalpet, SITRA conducted a Jobbers
development Programme highlighting topics such as present textile
scenario, waste reduction, quality improvement etc. Twenty Jobbers
attended the programme.
Maintenance of Air-jet Weaving - Fitters training programme
To upgrade the skills of fitters towards managing new technologies in Air-jet weaving machines, an in-house training programme was
organised. Theoretical and hands-on practical training on the
mechanism of Air-jet weaving machines and their maintenance were
offered during the one week programme. Totally, 5 fitters took part in
the programme.
Fitters training programme for BC, MBC and DNC candidates
To upgrade the skills of fitters towards managing new technologies inshuttleless weaving machines, a training programme was organised.
Theoretical and hands-on practical training on the mechanism of hi-
tech weaving machines and their maintenance were offered during the
one month programme. Totally, 16 fitters took part in the programme.
Pre-employment training and retraining programmes for textile
workers
One out-station mill availed SITRA’s training services for their workers.22
7/25/2019 Images Pdfs May June2014
http://slidepdf.com/reader/full/images-pdfs-may-june2014 24/32
May - June 2014
SITRA News
30 operatives were trained in one batch for the winder jobs in cone
winding. The training programme was conducted in Tamil.
Ancillary labour training
Retraining programmes were conducted to train 9 doffers in a spinning
mill at Coimbatore. The workers were trained to doff full cops and
replenish empty bobbins using both the hands while doffing ring frames.
In every programme, significant improvement was achieved in doffing
time and overall work practices.
55th Joint Technological Conference
The 55th Joint Technological Conference of ATIRA, BTRA, NITRA and
SITRA, conducted by NITRA, was held at PHD House, New Delhi on
10th May, 2014. Shri Sujit Gulathi, I.A.S, Joint Secretary, Ministry of
Textiles, Govt. of India inuguraated the Seminar and delivered the Key
Note Address. The following three papers were presented by SITRA
scientists at the conference which witnnesed a total of 12 papers from
all TRAs:
1. Impact of inter-mill variations in the techno-commercial
parameters on the financial performance of spinning mills -
N.K.Nagarajan & D.Shanmuganandam
2. Tensile & Tearing strength of woven fabrics - some studies -
K.P.Chellamani, D.Veerasubramanian & R.S.Vignesh Balaji
3. Yarn properties influencing fabric handle characteristics of
compact yarn fabrics - K.P.Chellamani, M.K.Vittopa &
R.Pasupathy
CONFERENCES AND SEMINARS
23
7/25/2019 Images Pdfs May June2014
http://slidepdf.com/reader/full/images-pdfs-may-june2014 25/32
May - June 2014
SITRA News
FORTHCOMING TRAINING PROGRAMMESTraining programme on Low Voltage Switchgear
selection and maintenance
SITRA, in association with Larsen and Toubro Switchgear Training
Centre, Conoor is organising training programmes on the selection
and maintenance of low voltage switchgears in different modules. The
first two modules have been completed and following is the schedule
for rest of the three modules :
- HRC Fuses, Motor Starters & MPCBs - 14.08.2014
- VFDs, MCBs, ELCBs, DBs - 30.09.2014
- Fault level Calculations, Numerical
Relays, BBT & MV Switch Gear - 31.10.2014
For further details of the programme, kindly contact :
The Head, Engineering and Energy Division, SITRA.
Training of Trainers Programme
As part of the Integrated Skill Development Scheme (ISDS) of the
Ministry of Textiles, Govt. of India, SITRA is offering various
programmes (as detailed in another section of this SITRA News).
One programme offered under the scheme is “Training of Trainers”,
meant exclusively for Trainers / Jobbers / Master trainers / Maistries,
in spinning mills. Enhancing the skill of this group has become
essential in a scenario where continuous training to operatives is
the norm in the spinning industry. The programme shall be held atSITRA and mills can nominate one or two of the trainers/senior
operative(s) designated for training to attend the programme which
shall be of one month duration. Various topics like work methods of
operatives, scientific recruitment of operatives, records to be
maintained for operative’s assessment and training evaluation will
be covered during the programme.
Mills interested in nominating their personnel for the programme
may contact, “The Training Division”, SITRA.
24
7/25/2019 Images Pdfs May June2014
http://slidepdf.com/reader/full/images-pdfs-may-june2014 26/32
May - June 2014
SITRA News
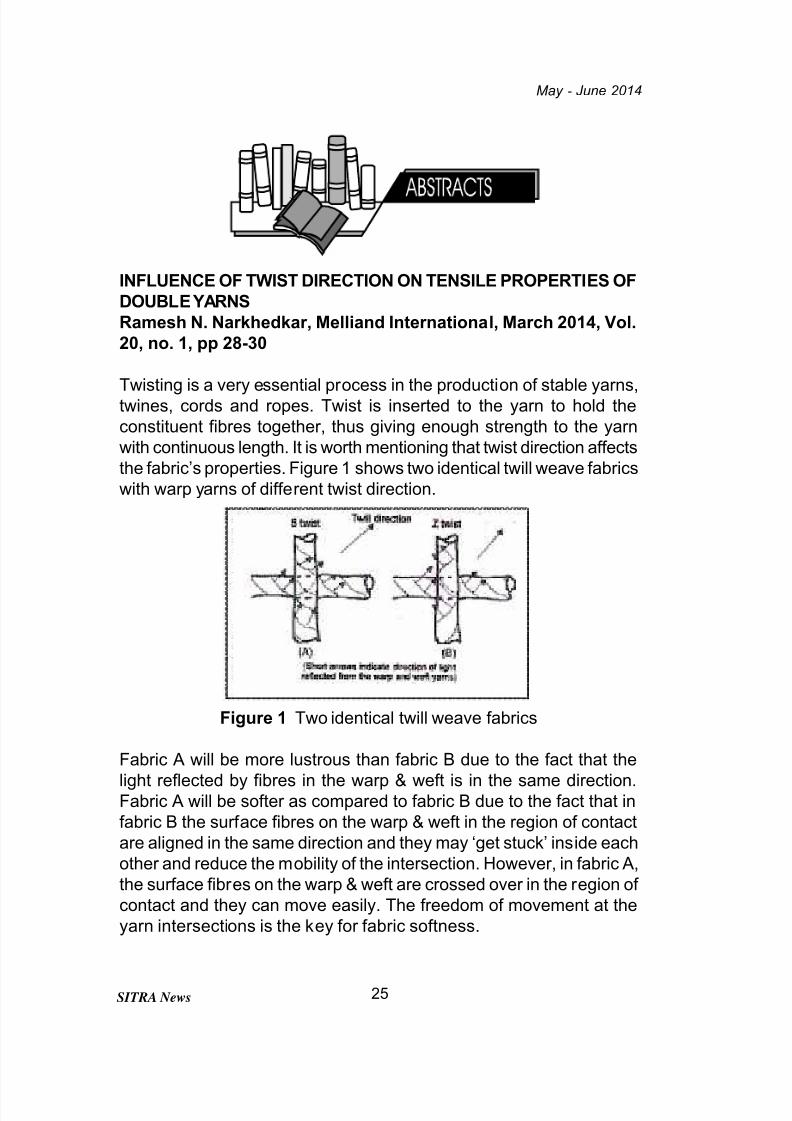
INFLUENCE OF TWIST DIRECTION ON TENSILE PROPERTIES OF
DOUBLE YARNS
Ramesh N. Narkhedkar, Melliand International, March 2014, Vol.
20, no. 1, pp 28-30
Twisting is a very essential process in the production of stable yarns,twines, cords and ropes. Twist is inserted to the yarn to hold the
constituent fibres together, thus giving enough strength to the yarn
with continuous length. It is worth mentioning that twist direction affects
the fabric’s properties. Figure 1 shows two identical twill weave fabrics
with warp yarns of different twist direction.
Figure 1 Two identical twill weave fabrics
Fabric A will be more lustrous than fabric B due to the fact that the
light reflected by fibres in the warp & weft is in the same direction.Fabric A will be softer as compared to fabric B due to the fact that in
fabric B the surface fibres on the warp & weft in the region of contact
are aligned in the same direction and they may ‘get stuck’ inside each
other and reduce the mobility of the intersection. However, in fabric A,
the surface fibres on the warp & weft are crossed over in the region of
contact and they can move easily. The freedom of movement at the
yarn intersections is the key for fabric softness.
25
7/25/2019 Images Pdfs May June2014
http://slidepdf.com/reader/full/images-pdfs-may-june2014 27/32
May - June 2014
SITRA News
The results of a study reported in the article reveal that it is not just the
twist that plays a role in deciding the tensile properties of doubled
yarn but also the direction of doubling twist. The author has conducteda study using 100% cotton fibres and by producing 4 types of yarn
samples (30s Ne – Single & Doubled yarns), the details of which are
given in Table 1.
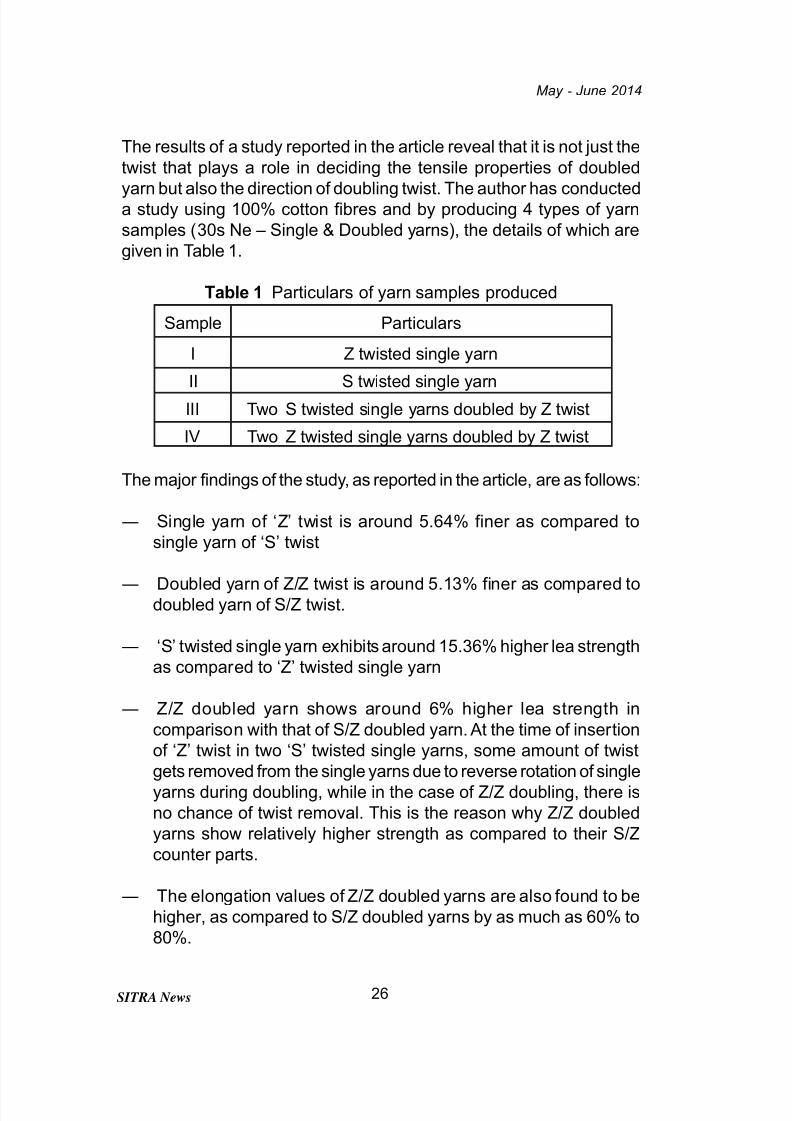
Table 1 Particulars of yarn samples produced
The major findings of the study, as reported in the article, are as follows:
― Single yarn of ‘Z’ twist is around 5.64% finer as compared to
single yarn of ‘S’ twist
― Doubled yarn of Z/Z twist is around 5.13% finer as compared todoubled yarn of S/Z twist.
― ‘S’ twisted single yarn exhibits around 15.36% higher lea strength
as compared to ‘Z’ twisted single yarn
― Z/Z doubled yarn shows around 6% higher lea strength in
comparison with that of S/Z doubled yarn. At the time of insertion
of ‘Z’ twist in two ‘S’ twisted single yarns, some amount of twist
gets removed from the single yarns due to reverse rotation of singleyarns during doubling, while in the case of Z/Z doubling, there is
no chance of twist removal. This is the reason why Z/Z doubled
yarns show relatively higher strength as compared to their S/Z
counter parts.
― The elongation values of Z/Z doubled yarns are also found to be
higher, as compared to S/Z doubled yarns by as much as 60% to
80%.
Sample Particulars
I Z twisted single yarn
II S twisted single yarnIII Two S twisted single yarns doubled by Z twist
IV Two Z twisted single yarns doubled by Z twist
26
7/25/2019 Images Pdfs May June2014
http://slidepdf.com/reader/full/images-pdfs-may-june2014 28/32
May - June 2014
SITRA News
― Appropriate statistical analysis has shown that the differences in
strength & elongation values between the two types of doubled
yarns (Z/Z & S/Z) are statistically significant.
- R.S.Vignesh Balaji
Spinning Division
“EVALUATION OF FIBRE ORIENTATION IN FIBREWEBS”
Dipayan Das, S M Ishtiaque & Shivendra Yadav,
IJFTR, Vol. 39, March 2014, pp. 9-13.
It is well known that the orientation of fibres plays an important role in
deciding the quality of the fibrewebs as well as quality of end products.
In this study, the authors have evaluated the fibre orientation in fibreweb
by means of the Tracer fibre technique and Lindsley technique.
Tracer fibre technique
In this technique, a small proportion of coloured fibres is added to the
stock from which the web is prepared. On immersion in a liquid of the
same refractive index as that of the fibres, the web becomes almost
transparent and the path of the individual coloured fibres can then beclearly seen. Based on the measurement of angle of inclination of
several hundreds to thousands fibres from any of the axes of the web,
a histogram of fibre orientation angles is obtained. Further, an
appropriate analysis of the histogram provides some statistical
characteristic of fibre orientation in fibrewebs. This technique involves
a direct observation of the orientation of certain coloured fibres, present
in very small proportion among the white fibres.
Lindsley technique
In this technique, the estimation of fibre orientation in different fibre
materials is based on weighting of suitable combed-out and cut-out
fringes using a special apparatus. Fibre orientation is derived using
some empirical ratios of fringe weights, namely cutting ratio, combing
ratio and fibre orientation index.
In this study, the authors have used viscose staple fibres of 44 mm cut
length, with 1.5 denier linear density. Using viscose fibres the fibreweb27
7/25/2019 Images Pdfs May June2014
http://slidepdf.com/reader/full/images-pdfs-may-june2014 29/32
May - June 2014
SITRA News
of 35 gsm was prepared by subsequent process of fibre in fibre opening
machine, roller carding machine and cross-lapping machine. The above
two techniques were used to find out the fibre orientation in fibreweb.
In tracer fibre technique, the fibre orientation in fibreweb is represented
as a parameter called “fibre orientation anisotropy” parameter. In
Lindsley technique, the fibre orientation in fibreweb is represented as
a parameter “fibre orientation index”.
The authors have concluded that the co-efficient of correlation between
the tracer fibre technique and Lindsley technique was very high.
- P.Sundaramoorthy
Weaving & Knitting Division
INFLUENCE OF POLYESTER FIBRE SHAPE AND SIZE ON THE
HAIRINESS AND SOME MECHANICAL PROPERTIES OF YARNS
R K Varshney, V K Kothari & Dhamija
Indian Journal of Fibre & Textile Research, March 2014,
Vol.39, pp. 24-32.
It is known that the fineness, length and strength of fibres used for spinning have a direct bearing on the yarn properties viz., tensile
modulus (strength), hairiness, etc. In this paper, the authors have made
an attempt to study the influence of fibre shape and size on the hairiness
and a few mechanical properties of polyester yarns. Determination of
the relative importance of these contributing variables along with level
of yarn twist has also been attempted by the authors to guide the
spinners in selecting the parameters that adequately meet end
requirements.
The possibility of designing a textile product is realized depending on
the way how the translation of fibre properties into its product takes
place and how they influence the yarn characteristics in general.
Variation in fibre form or geometry does influence this translation
efficiency by undergoing a change in its mechanical and surface
characteristics which ultimately effectuate a change in product structure
and properties.
28
7/25/2019 Images Pdfs May June2014
http://slidepdf.com/reader/full/images-pdfs-may-june2014 30/32
May - June 2014
SITRA News
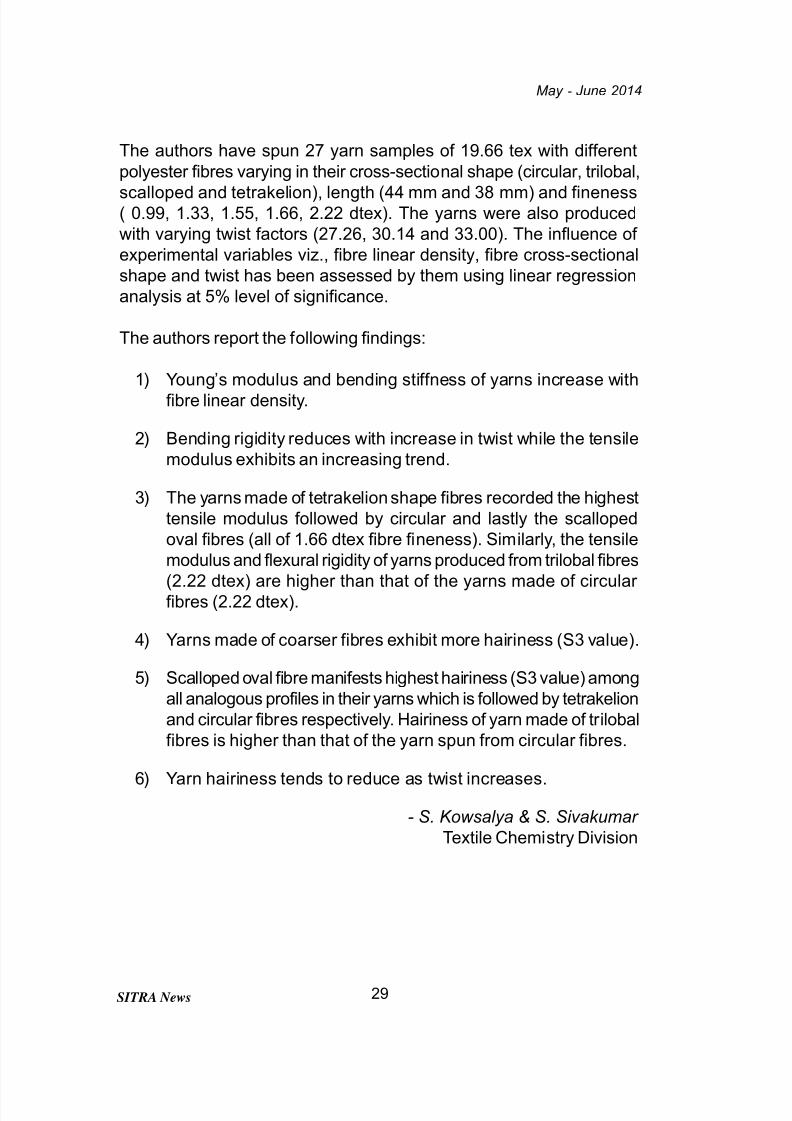
The authors have spun 27 yarn samples of 19.66 tex with different
polyester fibres varying in their cross-sectional shape (circular, trilobal,
scalloped and tetrakelion), length (44 mm and 38 mm) and fineness( 0.99, 1.33, 1.55, 1.66, 2.22 dtex). The yarns were also produced
with varying twist factors (27.26, 30.14 and 33.00). The influence of
experimental variables viz., fibre linear density, fibre cross-sectional
shape and twist has been assessed by them using linear regression
analysis at 5% level of significance.
The authors report the following findings:
1) Young’s modulus and bending stiffness of yarns increase withfibre linear density.
2) Bending rigidity reduces with increase in twist while the tensile
modulus exhibits an increasing trend.
3) The yarns made of tetrakelion shape fibres recorded the highest
tensile modulus followed by circular and lastly the scalloped
oval fibres (all of 1.66 dtex fibre fineness). Similarly, the tensile
modulus and flexural rigidity of yarns produced from trilobal fibres
(2.22 dtex) are higher than that of the yarns made of circular fibres (2.22 dtex).
4) Yarns made of coarser fibres exhibit more hairiness (S3 value).
5) Scalloped oval fibre manifests highest hairiness (S3 value) among
all analogous profiles in their yarns which is followed by tetrakelion
and circular fibres respectively. Hairiness of yarn made of trilobal
fibres is higher than that of the yarn spun from circular fibres.
6) Yarn hairiness tends to reduce as twist increases.
- S. Kowsalya & S. Sivakumar
Textile Chemistry Division
29
7/25/2019 Images Pdfs May June2014
http://slidepdf.com/reader/full/images-pdfs-may-june2014 31/32
May - June 2014
SITRA News
BEE Mandatory Energy Audit for
Designated consumers
SITRA is pleased to inform members that the Accreditation
Advisory Committee of the Bureau of Energy Efficiency (BEE),
Ministry of power, Government of India has recommended and
recognized SITRA as an Accredited Energy Auditor to conduct
mandatory enery audits for deginated consumers. The details
are available on the website of BEE (www.beeeindia.nic.in) and
energy professional website (www.energymanagertraining.com).
Mills are aware that SITRA’s energy audits are already approved
by TNEB, GEDA, KSEB, BEE & PCRA. With a professional
setup comprising a BEE certified Energy Auditor and EnergyManager and multi-disciplinary specialists from Textile,
Mechanical and Electrical Engineering, and equipped with the
latest and sophisticated instruments, the energy audit team of
SITRA is well equipped and qualified to take up Mandatory energy
audits in mils that are conducted in accordance with the
regulations mandated by the Bureau of Energy Efficiency (Manner
and Intervals of Time for Conduct of Energy Audit) Regulations,
2010, vide their notification dt. 27.05.14 for Designated
Consumers (DC) in textile industry.
Mills desirous of availing the above service may send their enquiry
to: The Head - Engineering and Energy Division, SITRA.
New Service offered by SITRA !
30
7/25/2019 Images Pdfs May June2014
http://slidepdf.com/reader/full/images-pdfs-may-june2014 32/32
May - June 2014
New Service offered by SITRA !
Lead auditor certificate in the ISO 50001:2011
Energy Management System (EnMs)
SITRA is offering a consultancy service to textile mills based on
Lead auditor certificate in the ISO 50001:2011 Energy
Management System (EnMS). SITRA‘s energy division has staff
well equipped and who have been certified as Lead Auditors by
Bureau Veritas (I) Ltd., Chennai to conduct audits leading to the
above certification. The scope of the consultancy service that is
being offered to the mills as follows:
> Gap Analysis.
> Energy Audit base line fixing.
> Documentation and manual preparation.
> Internal Audit.
> One day training programme to mill staff.
For furthur details regarding the service, kindly contact,
The Head,Engineering and Energy Division,
SITRA.