image screening based on projection pursuit for statistical image recognition
TRANSCRIPT
Systems and Computers in Japan, Vol. 27, No. 3, 1996 Translated from Denshi Joho Rushin Gakkai Ronbunshi Vol. J78-D-11, No. 6, June 1995, pp. 913-921
Image Screening Based on Projection Pursuit for Statistical Image Recognition
Koichi Arimura and Norihiro Hagita, Members
N'IT Basic Research Laboratories, Atsugi, Japan 243
SUMMARY
A preprocessing method, called image screening, is presented to improve the recognition rate and effi- ciency in statistical image recognition. The problem of detecting a specified object in input images is treated as a two-class classification problem in which the image falls into both a set of subimages in the target object (figure) class and the other set of subimages in the ground class. An image screening algorithm based on projection pursuit selects a candidate set of subimages that is similar to the object class, it rejects the remaining set using screening filters whose design is based on projection pursuit. The feature space for recognition is obtained from the selected subimages. Two kinds of measures to evaluate the performance of image screening are defined. The error rate in image screening is related to the total recognition rate of the system and the rejection rate of the noise image is related to the recognition efficiency. Two kinds of experimentswere conducted, one to detect the eye and mouth areas in a face image and the other to detect the text area in a document image. Experimental results for these two tasks demonstrate that our method improves the recognition accuracy and efficiency.
Key words: Projection pursuit; noise reduction; face image analysis; document image analysis; Bayes discriminant function.
1. Introduction
In statistical image recognition, there are a number of linear transformation algorithms for re- cognizing a specified object in input images [l-51. For example, Turk et al. show the effectiveness of eigen- vectors obtained from a set of face images for detecting faces in images of indoor scenes [2]. Intrator et al. have studied a three-dimensional recognition method based on projection pursuit [4].
In this paper, the problem of detecting a specified object from input images is treated as a two-class classification problem in which the image is classified into two sets: the subimage set contained in the target object (figure) class and the other set contained in the ground class. Nagy [6] demonstrates that using classi- fiers taken from a less-contaminated data set consti- tuting correctly recognized samples improves the recog- nition accuracy compared to using ones taken from the original set which is a mixture of correctly and incor- rectly recognized subimages. Moreover, a homogene- ous set is smaller in volume than the original set. Based on this finding, we have developed a prepro- cessing method, called image screening, which screens a homogeneous data set from a subimage set of an input image.
The learning sample in the ground class is less homogeneous than the one in the figure class. For ex-
60 ISSN0882- 1666/96/ooO3-0060 0 1996 Scripta Technica, Inc.
ample, in the case in which the eye and mouth areas are detected in a face image, learning samples in the ground class, including noses, ears, skin, and other facialfeatures, are more contaminated than ones in the figure class. Therefore, high recognition performance could hardly be achieved using the standard patterns of figure and ground classes obtained from these original samples.
The image screening algorithm selects a candidate set of subimages that is similar to the object class from the original learning set and rejects the other set using screen filters. The filter design is based on two-dimen- sional projection pursuit, which is a linear transforma- tion algorithm. Therefore, using classifiers of the two classes taken from a candidate set containing less- contaminated samples than the original set is expected to improve recognition accuracy. Preprocessing is also expected to help improve recognition throughout, since it eliminates the need for any correlation calculation in the following procedures for the subimages contained in the ground class. Experiments were performed to detect the eye and mouth in a face image and the text area in a document image. The results show that the image-screening algorithm improves the recognition accuracy and throughput for these two detection tasks.
2. Two-dimensional Projection Pursuit
Projection pursuit is a linear transformation algorithm for exploring a data set by mapping it onto a lower-dimensional space [7-91. The projection index plays an important role in finding interesting properties in the data. For instance, principal components anal- ysis, discriminant analysis, and factor analysis turn out to be special cases of projection pursuit with different projection indices [9].
Let Z be a normalized vector of an n-pixel sub- image in an input image such that E{Z - E { Z } } = 0 (the expectedvalue) and E{Z - E { Z } ) ( Z - E { Z } T ) = I (the identity matrix) [8]. Let A be a k X n (k < n) transformation matrix. The basic technique in pro- jection pursuit is to obtain A such that the projection index Q(AZ) is either maximum or minimum. The pro- jection index (k = 1) for principal components analysis and other indices, such as Legendre polynomials, and the one proposed by Friedman and Tukey have also been reported [7-91.
The projection index for PCA is given by:
Q (A z )= E (A (z - E {z }) (z - E { z } ) ~ A } (1)
and
whereA becomes an n-dimensional row vector (k = l), and T denotes the transpose of the matrix [9]. A can be regarded as an index for one-dimensional projection pursuit because it is a row vector that maps n-dimen- sional vector Z to one-dimensional space and thus corresponds to an eigenvector (61. Since we are interested in two-dimensional projection pursuit (k = 2) which has potential for extracting a more informative structure from a sample set than a one- dimensional one [8], we extend the one-dimensional index in Eq. (1) to the two-dimensional (k = 2) one such as
and
(4) a:a,=a2a2=1 T
where A = (ula2) and Z = E{ (2 - E { Z } ) ( Z - E { Z } ) T } = 0. Equation (3) has almost the same properties as PCA due to the first and third terms and somewhat different ones due to the second term. The hybrid optimization strategy proposed by Friedman [8] is used to maximize the Q(A2) given by Eq. (3).
3. Image Recognitlon with Image Screening
Figure 1 schematically shows the image recog- nition process with image screening. We assume that subimages W = {w,} consist of a predefined set, rn x rn (=n) pixels.
3.1. Masking
A subimage W is masked by a two-dimensional Gaussian function g(4 y) with a standard deviation a. The masked subimage 2 = {z,}, given in Eqs. ( 5 ) and (6), removes the effect of the square edge of W [lo]. Our experiments use values of a = 4 and rn = 30.
z q = g (.JY) wIy ( 5 )
g (XIY )= ( x - m / 2 ) 2 + ( y - m / 2 )
2a2 (6) 1
61

S Subimages
I - - - - - - - Preprocessing -------I I I I I
I Masked I Subimage
I
I
I
I I I I ! I
ms ““ I
3.2. Image screening
t- Rejected
Su bi mages (ZR]
Fig. 1. Block diagram of image recognition with image screening.
In the screening process, 2 is classified into screened subimage 2, or rejected subimage ZR using spatial (screening) filters ai (i = 1, 2, ..., L) screening filters are equivalent to the (Ln) pairs of a1 and a2 that maximize Q(AZ) in Eq. (3). One pair (ul, a*),
which maximizes Q(AZ) in Eq. (3), is computed in one iterativecalculation cycle using the hybrid optimization strategy [8]. Therefore, the number of screening filters a; (i = 1, 2, ..., L) has been computed when LP calculation cycles are terminated. The eight filters for n = 900 are obtained from the ground class set in our experiment.
The screening filter space s = (sl, s2, ..., si, ..., sL) can be expressed as si = u72. Screening is performed using a box classifier [ 121 in the space. Since 2 has a higher possibility of being assigned to the figure class when Isi/ is smaller, the tolerance range for si, where 2 is included in the figure class, is obtained from the learning set of subimages contained in the figure class. For example, in the case of detecting eyes in a face image, the a prion’ probability for the figure is less than one for the ground classes. If most samples in the ground class are classified into rejected subimages {ZR} by the image screening algorithm, the following recognition processes for the rejected subimages could be omitted, thereby improving overall throughput in the recognition system.
33. Criterion for image screening
A box classifier is designed under the assumption that the projected values si (i = 1, ..., L) onto ai for a masked subimage 2 are independent of each other. Let&) be the probability density function for si. The value Si (= Isi[) for the upper and lower tolerance limits of each si is obtained from learning samples of the figure class. Si is designed such that
S#
-so Pr pi < S i <S,)= J p ( s i ) d s , = T (7)
where T is a predefined threshold such that T < 1. Then, the Boolean variable 4 is set to equal to one for any masked subimage 2 within the tolerance range [-S, Si] of each+; otherwise, bi = 0. Thus, the L-bit binary B is obtained for an input subimage. An arbitrary number B corresponds to a box in the L-dimensional screen decision space. Let BF be a set of B obtained from the learning samples of the figure class. For B obtained from an arbitrary masked subimage 2, if B E BF, 2 becomes a candidate subimage 2, of the figure class; otherwise, 2 is a rejection subimage 2,.
3.4. Performance measures for image screening
We use two performance measures to evaluate the effect of image screening.
62

(1) Error rate image in screening (e):
(2) Rejection rate of noise images (r):
where NF, KF, NG, and KG, respectively, denote the number of figure class subimages in the masked subimages {Z}, the number of figure class subimages in the rejected subimages {Z,}, the number of ground class subimages in the masked subimages {Z}, and the number of ground class subimages in the rejected sub- images {Z,}. Here, a "noise image" means a subimage contained in the ground class. The measure e is re- lated to the total recognition rate of the system, while r is related to recognition efficiency. When e and r approach zero and one, respectively, the image screen- ing algorithm shows higher recognition accuracy and higher efficiency.
where Q, = (#q rP2 ... +j ... r#y) and denotes the jth feature extraction filter.
One significant property in image screening is that the apriori probability of the figure class in the set of the screened subimages {Z,} tends to be higher than that of the ground class, compared with the ori- ginal set of the subimages (2). Therefore, the Bayes discriminant function dB is used to consider this tendency in the u priori probability of the figure class. That is,
~ , ( F , M , , z , , ) = (F - M ~ ) ~ z ~ ' ( F - M , ) + In 1 ~ ~ 1 - 2 . I ~ P ,
(11)
where h denotes a class. That is, the figure class is assigned to h = 1 and the ground class is assigned to h = 2. Here, Mh, Sh, and Ph, respectively, indicate the mean vector, the covariance matrix, and the a prion' probability of class h.
4. Experiments 3.5. Feature extraction and matching
4.1. Image data The transformation matrix @ (n x L ) for feature
extraction is obtained from a candidate set of sub- images {Z,}. The projection index denoted by Eq. (3) is also used. The L-dimensional feature vector F is given by:
To evaluate image screening performance, we conducted two object detection tasks: detecting the eye and mouth area in a face image, and the text area in a document image, because aprion' probabilitiesof figure and ground classes are different in these tasks. The a pnori probability of the figure class (PF) is lower than
Table 1. Image databases
Image database Face Document
Images for testing 8 3
Image size 128 x 120 pixels 300 x 400 pixels
Contents Right way up English documents frontal faces containing text areas,
tables, figures, line drawings, etc
Subimage size w 30 x 30 pixels 30 x 30 pixels
63

Fig. 2. Examples of test data in facial and document image data sets.
(a) Subimage W (b) Masked subimage Z
Fig. 3. Examples of subimage and masked subimage.
that of the ground class (Pc) in the eye-and-mouth- area detection task, while PF is almost equal to Pc in the text-area detection task.
A face image database [2] is available for the eye- and-mouth-area detection task. Each grayscale image in the database is a right way up frontal face image consisting of 128 x 120 pixels. Eight face images were used to take subimages { W) for learning and another eight face images were used to take subimages for test- ing. On the other hand, the document image database consists of eight grayscale images of text areas, tables, figures, line drawings, etc. Five images were used for learning subimages sampling, and the other three for test subimages sampling. Details of the databases are given in Table 1 and examples of test data in the face and document image data base are shown in Fig. 2. Figure 3 shows examples of a subimage {W) and a masked image (2) for the eye-and-mouth-area detec- tion task.
4.2. Image screening filters
Eight screening filters ui (i = 1, 2, ..., L; L = 8) were designed from the eight face images for learning by referring to the procedure proposed by Hancock et al. [lo], which is to apply principal components analysis to natural scene images to create spatial filters. 1024 subimages consisting of 4 x 4 pixels were randomly taken from the face images, and expanded to 30 X 30 pixels, and then the expanded subimages were masked by a two-dimensional Gaussian function g(x, y) with a standard deviation u = 4 pixels. The eight screening filters {ai} that maximized the projection index Q(AZ) denoted in Eq. (3) were obtained from the masked subimages. Figure 4 shows the first screening filter u1 and seventh u7 and also shows their profiles. The shape of the profile for u1 is similar to the profile of an off-centered bandpath filter and one for u7 is similar to the profile of an edge detector. The profiles are similar to those based on the principal components analysis proposed by Hancock et al. They also dis- cussed the similaritiesin shape between the synthesized filters and the spatial filters in the visual receptive field of monkeys [lo]. The eight screening filters were used for the eye-and-mouth-areadetection task and the test- area detection task.
4.3. Eye and mouth area detection
The first task was to detect the subimages con- taining the eye or mouth area in a face image. The learning and test samples were formed by randomly taking subimages { W) consisted of 30 x 30 pixels from
64

Fig. 4. Examples of screening filters and their profiles.
Table 2. Results for the eye-and-mouth-area detection task
~~
Learning sample Test sample
Error rate in image screening: e 0 % 9 %
Rejection rate of noise images: r 72 % 68 %
65
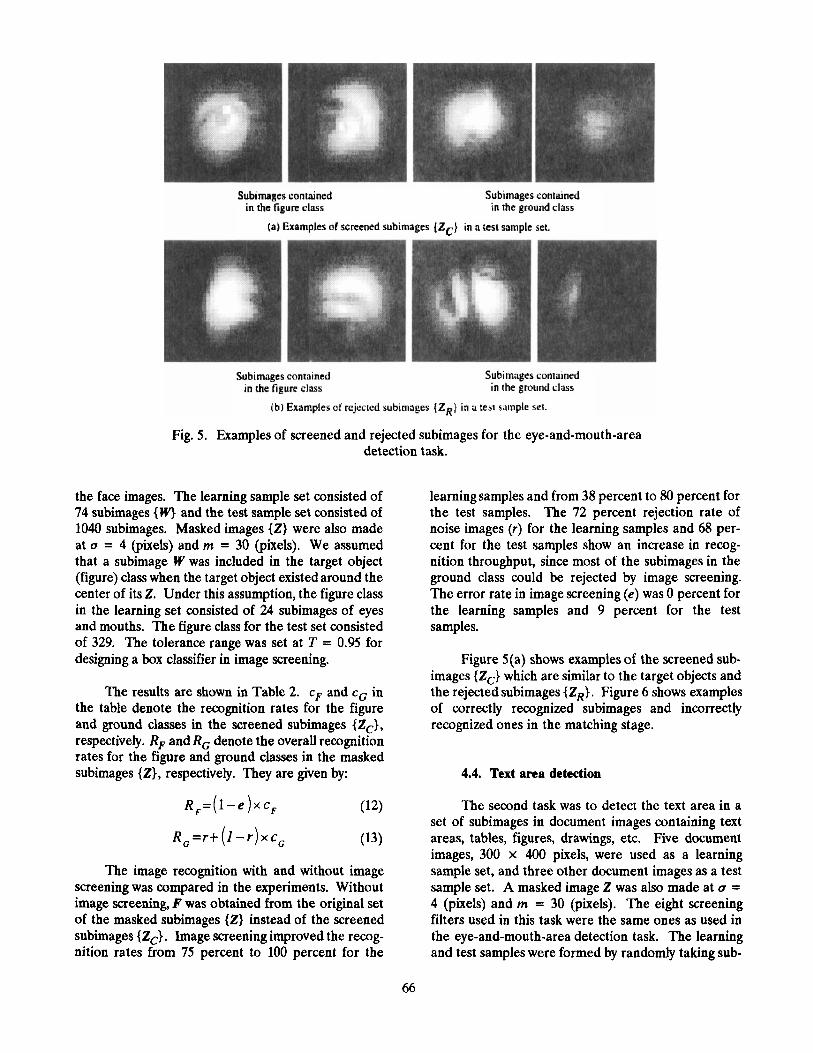
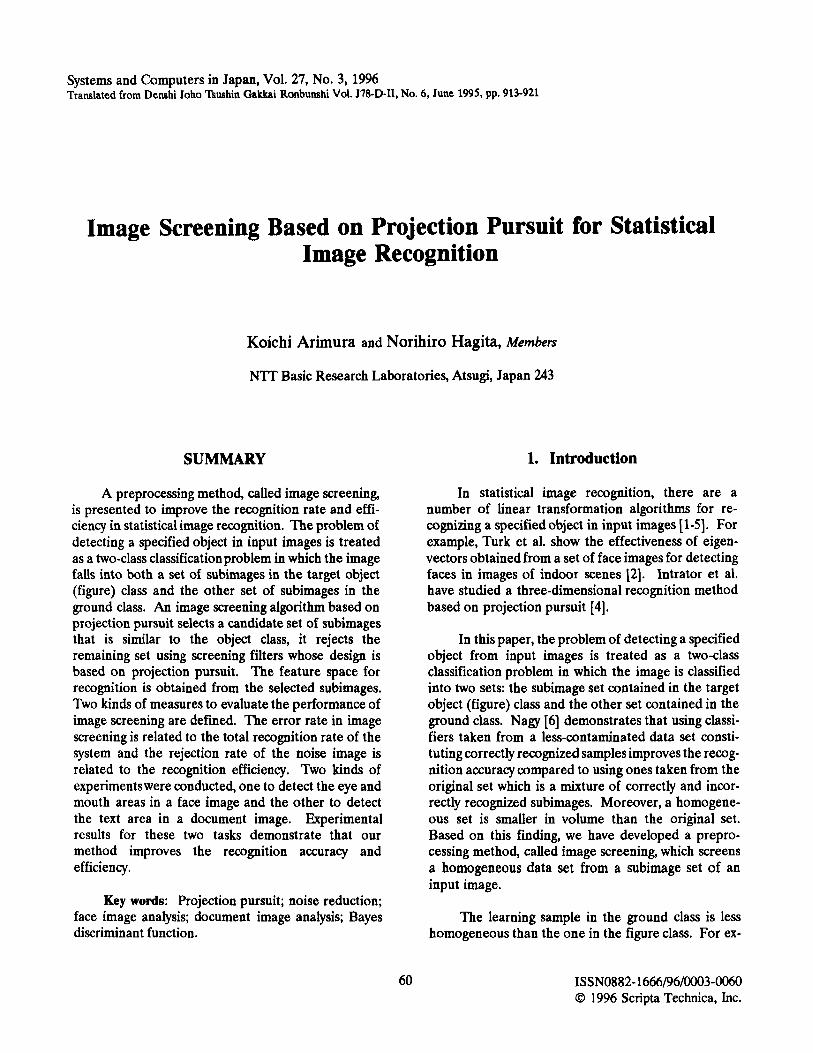
Fig. 5 . Examples of screened and rejected subimages for the eye-and-mouth-area detection task.
the face images. The learning sample set consisted of 74 subimages {W) and the test sample set consisted of 1040 subimages. Masked images (2) were also made at a = 4 (pixels) and m = 30 (pixels). We assumed that a subimage W was included in the target object (figure) class when the target object existed around the center of its 2. Under this assumption, the figure class in the learning set consisted of 24 subimages of eyes and mouths. The figure class for the test set consisted of 329. The tolerance range was set at T = 0.95 for designing a box classifier in image screening.
The results are shown in Table 2. cF and eG in the table denote the recognition rates for the figure and ground classes in the screened subimages {Z,}, respectively. RF and R, denote the overall recognition rates for the figure and ground classes in the masked subimages {Z}, respectively. They are given by:
R , =r+ ( I - r ) x CG
The image recognition with and without image screening was compared in the experiments. Without image screening, F was obtained from the original set of the masked subimages {Z} instead of the screened subimages { Z,} . Image screening improved the recog- nition rates from 75 percent to 100 percent for the
learning samples and from 38 percent to 80 percent for the test samples. The 72 percent rejection rate of noise images (r) for the learning samples and 68 per- cent for the test samples show an increase in recog- nition throughput, since most of the subimages in the ground class could be rejected by image screening. The error rate in image screening (e) was 0 percent for the learning samples and 9 percent for the test samples.
Figure 5(a) shows examples of the screened sub- images {Z,} which are similar to the target objects and the rejected subimages {ZR}. Figure 6 shows examples of correctly recognized subimages and incorrectly recognized ones in the matching stage.
4.4. Text area detection
The second task was to detect the text area in a set of subimages in document images containing text areas, tables, figures, drawings, etc. Five document images, 300 X 400 pixels, were used as a learning sample set, and three other document images as a test sample set. A masked image Z was also made at u = 4 (pixels) and m = 30 (pixels). The eight screening filters used in this task were the same ones as used in the eye-and-mouth-area detection task. The learning and test samples were formed by randomly taking sub-
66

Fig. 6. Examples of recognition results for the eye-and-mouth-area detection task.
Table 3. Results for the text-area detection task.
Ground class 1000 800
Error rate in image screening: e 0 % 4 %
Rejection rate of noise images: r 93 % 85 %
67
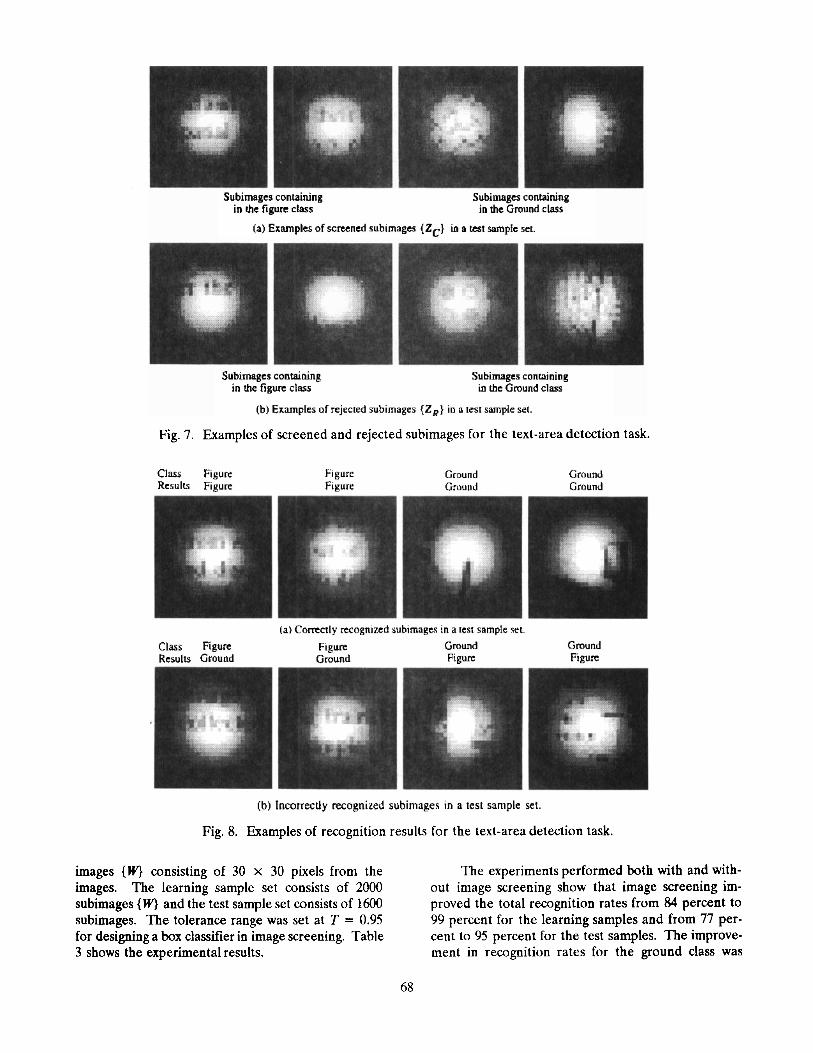
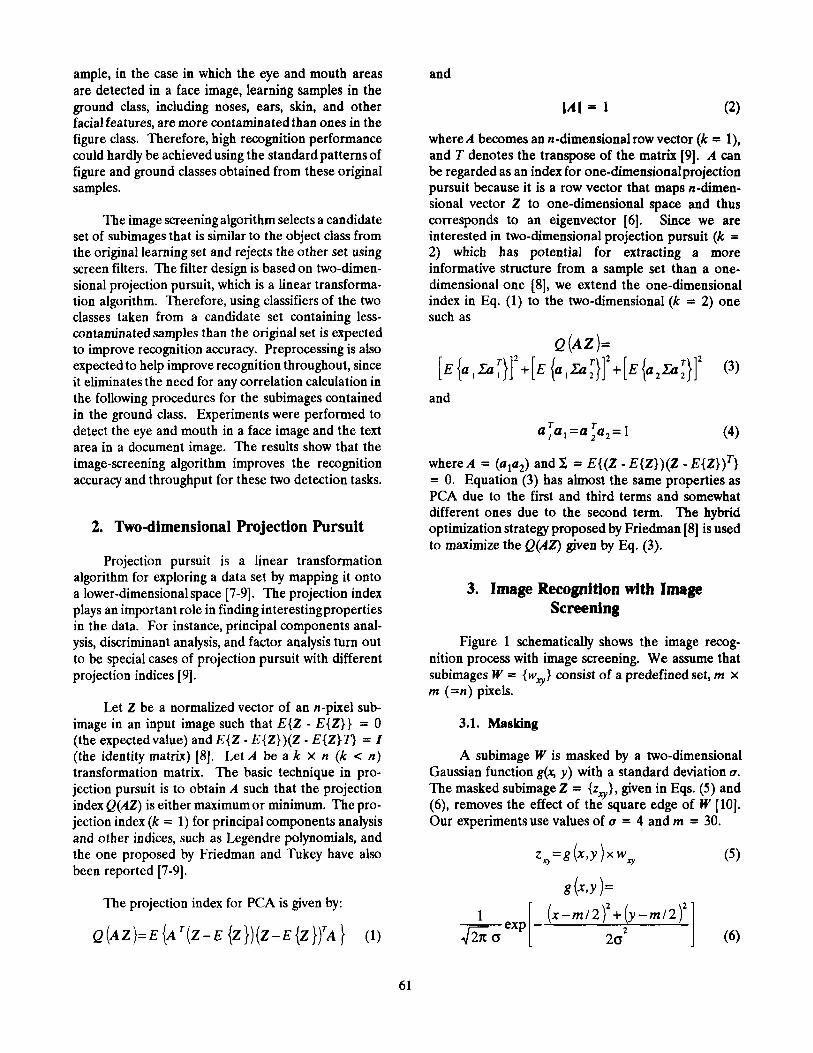
.. Fig. 7. Examples of screened and rejected subimages for the text-area detection task.
Fig. 8. Examples of recognition results for the text-area detection task.
images {W) consisting of 30 x 30 pixels from the images. The learning sample set consists of 2000 subimages { W) and the test sample set consists of 1600 subimages. The tolerance range was set at T = 0.95 for designing a box classifier in image screening. Table 3 shows the experimental results.
The experiments performed both with and with- out image screening show that image screening im- proved the total recognition rates from 84 percent to 99 percent for the learning samples and from 77 per- cent to 95 percent for the test samples. The improve- ment in recognition rates for the ground class was
68
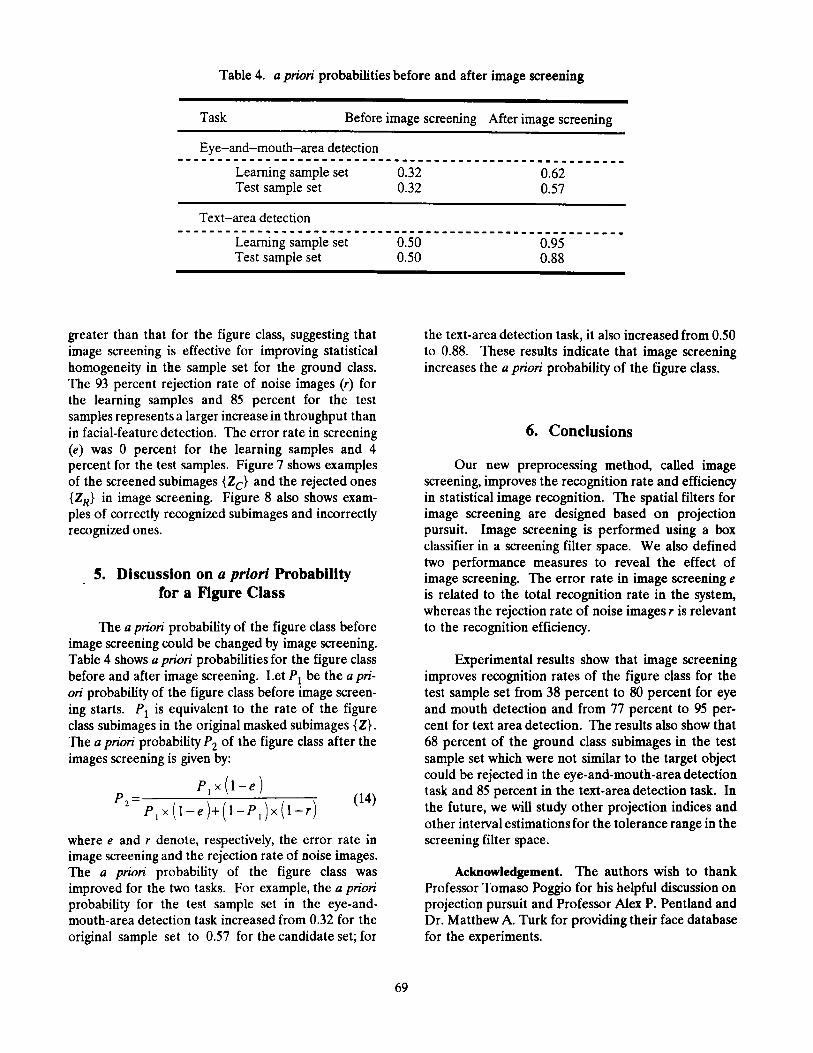
Table 4. u prion' probabilities before and after image screening
Task Before image screening After image screening
Eye-and-mouth-area detection . . . . . . . . . . . . . . . . . . . . . . . . . . . . . . . . . . . . . . . . . . . . . . . . . . . . . . . . Learning sample set 0.32 0.62 Test sample set 0.32 0.57
greater than that for the figure class, suggesting that image screening is effective for improving statistical homogeneity in the sample set for the ground class. The 93 percent rejection rate of noise images (r) for the learning samples and 85 percent for the test samples represents a larger increase in throughput than in facial-feature detection. The error rate in screening (e) was 0 percent for the learning samples and 4 percent for the test samples. Figure 7 shows examples of the screened subimages {Z,} and the rejected ones {Z,} in image screening. Figure 8 also shows exam- ples of correctly recognized subimages and incorrectly recognized ones.
5. Discussion on a prtorl Probability for a Figure Class
The u prion' probability of the figure class before image screening could be changed by image screening. Table 4 shows u prion' probabilities for the figure class before and after image screening. Let P, be the u p i - on' probability of the figure class before image screen- ing starts. PI is equivalent to the rate of the figure class subimages in the original masked subimages (2). The u prion probability P, of the figure class after the images screening is given by:
P , x ( l - e )
P , x ( 1 - e ) + ( 1 - ~ , ) x ( 1 - r ) P , = (14)
where e and r denote, respectively, the error rate in image screening and the rejection rate of noise images. The u prion' probability of the figure class was improved for the two tasks. For example, the u pion' probability for the test sample set in the eye-and- mouth-area detection task increased from 0.32 for the original sample set to 0.57 for the candidate set; for
the text-area detection task, it also increased from 0.50 to 0.88. These results indicate that image screening increases the u pn'on' probability of the figure class.
6. Conclusions
Our new preprocessing method, called image screening, improves the recognition rate and efficiency in statistical image recognition. The spatial filters for image screening are designed based on projection pursuit. Image screening is performed using a box classifier in a screening filter space. We also defined two performance measures to reveal the effect of image screening. The error rate in image screening e is related to the total recognition rate in the system, whereas the rejection rate of noise images r is relevant to the recognition efficiency.
Experimental results show that image screening improves recognition rates of the figure class for the test sample set from 38 percent to 80 percent for eye and mouth detection and from 77 percent to 95 per- cent for text area detection. The results also show that 68 percent of the ground class subimages in the test sample set which were not similar to the target object could be rejected in the eye-and-mouth-area detection task and 85 percent in the text-area detection task. In the future, we will study other projection indices and other interval estimations for the tolerance range in the screening filter space.
Acknowledgement. The authors wish to thank Professor Tomaso Poggio for his helpful discussion on projection pursuit and Professor Alex P. Pentland and Dr. Matthew A. Turk for providing their face database for the experiments.
69
REFERENCES
1. L. Sirovich and M. Kirby. Low-dimensional procedure for the characterization of human face. J. Opt. Soc. Ame. A., 4, 3, pp. 519-524 (Mar. 1987).
2. M. Turk and A. Pentland. Eigenfaces for re- cognition. J. of Cognitive Neuroscience, 3, 1,
3. N. Intrator. Feature extraction using unsuper- vised neural network. Neural Computation, 4,
4. N. Intrator et al. Face Recognition using a Hybrid SupervisedlUnsupervised Neural Net- work. Proc. of 12th Int. Conf. on pattern recognition, 2, pp. 5054 (1994).
5. T. Sakai et al. Computer analysis of photo- graphs of human faces. Trans. I.E.I.C.E. (D),
6. G. Nagy. At the frontiers of OCR. Proc. of the IEEE, 80, 7, pp. 1093-1100.
pp. 71-84 (1991).
pp. 98-107 (1992).
56-D, 4, pp. 226-233 (1973).
7. M. Iwasaki. Projection pursuit: its theory and practice. Bulletin of the computational statistics of Japan, 4, 2, pp. 41-56 (1991).
8. J. H. Friedman. Exploratory projection pur- suit. Jour. the American Statistical Asso- ciation, 82, 397, Theory and Methods (Mar. 1987).
9. P. J. Huber. Projection pursuit. (with discus- sion). Annuals of Statistics, 13,2, pp. 435-475 (1985).
10. P. J. B. Hancock et al. The principal com- ponents of natural images. Network, 3, pp.
11. S. Yamamoto et al. Chinese character recog- nition hierarchical pattern matching-Study of Chinese character recognition. Trans.
12. M. Ichina and J. Sklansky. Optimum feature selection by zero-one integer programming. IEEE Trans. on Sys., Man and Cyber., SMC-
61-70 (1992).
I.E.I.C.E.(D), S - D , 12, pp. 714-721 (1973).
14, 5, pp. 737-746 (Oct. 1984).
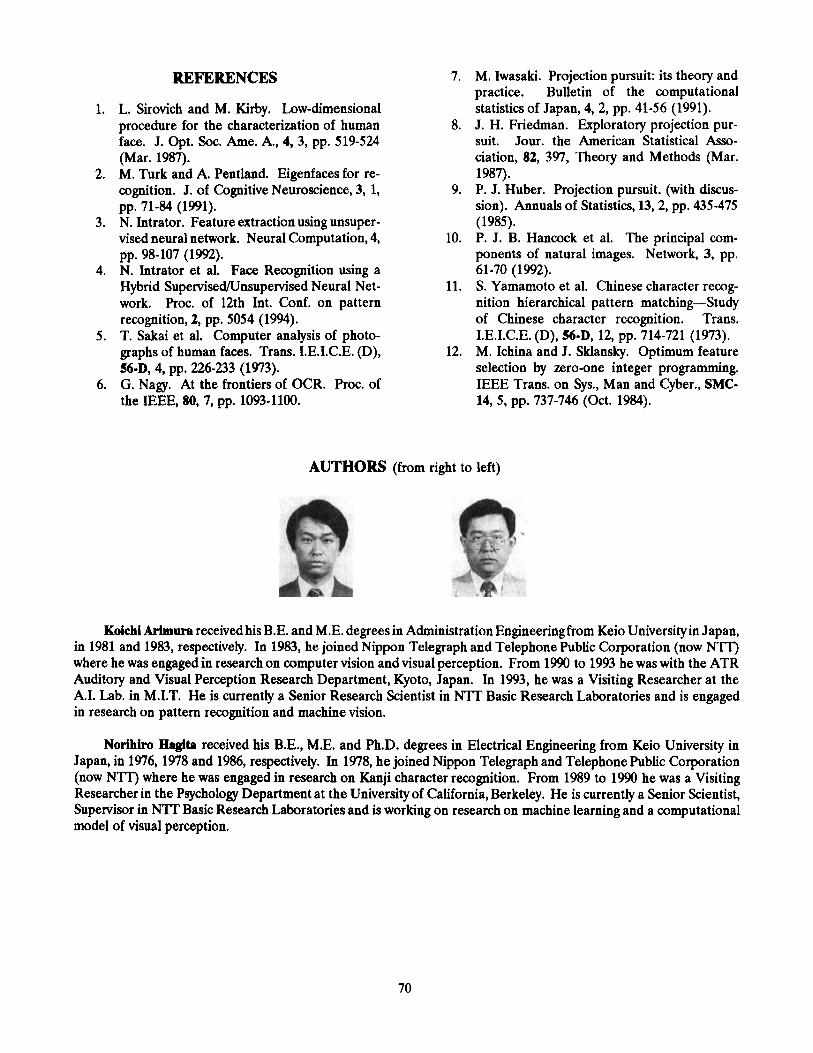
AUTHORS (from right to left)
Koichi Arimura received his B.E. and M.E. degrees in Administration Engineeringfrom Keio University in Japan, in 1981 and 1983, respectively. In 1983, he joined Nippon Telegraph and Telephone Public Corporation (now N'IT) where he was engaged in research on computer vision and visual perception. From 1990 to 1993 he was with the ATR Auditory and Visual Perception Research Department, Kyoto, Japan. In 1993, he was a Visiting Researcher at the A.I. Lab. in M.I.T. He is currently a Senior Research Scientist in "TT Basic Research Laboratories and is engaged in research on pattern recognition and machine vision.
Norihiro Hagita received his B.E., M.E. and Ph.D. degrees in Electrical Engineering from Keio University in Japan, in 1976,1978 and 1986, respectively. In 1978, he joined Nippon Telegraph and Telephone Public Corporation (now N r r ) where he was engaged in research on Kanji character recognition. From 1989 to 1990 he was a Visiting Researcher in the Psychology Department at the University of California, Berkeley. He is currently a Senior Scientist, Supervisor in "IT Basic Research Laboratories and is working on research on machine learning and a computational model of visual perception.
70