illinois tollway’s experience implementing...
TRANSCRIPT

Illinois Tollway’s Experience Implementing Performance Specifications for Concrete
Pavement Construction Steve Gillen – Tollway Deputy Program Manager of Materials
Shreenath Rao – ARA Principal Engineer November 5, 2015

2
Illinois Tollway – Key Statistics
286-mile system comprised of four tollways: Tri-State (I-94/I-294/I-80) Jane Addams Memorial (I-90) Reagan Memorial (I-88) Elgin O’Hare (IL-390) Veterans Memorial (I-355)
Opened in 1958 as a bypass around Chicago to connect Indiana and Wisconsin
Carries more than 1.4 M vehicles per day
User-fee system – no state or federal gas tax dollars used for maintenance and operations

3 © Illinois State Toll Highway Authority 2015
Nearly $6 Billion Committed 99.9% complete • Completed Rebuild & Widen
Projects systemwide • Built 12.5-mile I-355 South
Extension • Converted 20 barrier toll
plazas to Open Road Tolling
Congestion-Relief Program work in 2009 alone

4
Move Illinois Capital Program

5
Move Illinois and Sustainability
Move Illinois will be the "cleanest and greenest" program in the Tollway's history. Minimizes the environmental impact of new
roadway construction by reducing, recycling and reusing materials.
Commits to incorporating renewable energy products including solar panels, wind turbines and geothermal systems
New and existing infrastructure projects including maintenance site reconstruction will seek a recognized green project standards and certification for Leadership in Energy and Environmental Design (LEED)

6
Sustainability Means a Lot at the Tollway
Nearly 1.4 million tons of recycled concrete, asphalt and aggregate in the construction of new roads – enough to build a
nearly 2,700-mile bike path from Boston to San Francisco

7
Three Legs of Sustainability to be Equal

8
Specifications Have Different Risk Profiles
Owner/Designers
Contractor 0
100
Method QC/QA End-Result Performance/ Warranty
Type of Specification

9
Implementation of Performance Specifications Summer to Fall 2013 – Shadow Implementation March 2014 – meeting with Tollway Engineering
Management to get approval to move forward March to May 2014 – Development of specification
framework July 2014 – 1st Meeting with Industry to provide
overview of PRS & present concept/ideas July 2014 – First draft of SP Fall to Winter 2014 – Multiple meetings revising and
changing SP April 2015 – Training on testing and procedures May 2015 to Current – Performance specifications in
effect

10
Shadow Performance Specifications Develop and evaluate like FULL implementation Does not impact contractor pay for the shadow
project Learning and pre-implementation tool

11
Performance Specifications Applied to Larger Concrete Paving Projects Starting in 2015 Project would have at least 10 sublots Will be evaluated and determined by Tollway Pay factors will be different by corridor

12
Steps for Implementation of Performance Specifications
1. Conduct project coordination meetings select location, gather information, develop sampling & testing plan
2. Collect and analyze historical data AQCs, M & R criteria, costs, discount rate, etc.
3. Develop and evaluate pay factors PaveSpec, historical evaluation

13
Steps for Implementation of Performance Specifications
4. Prepare for implementation on project layout of lots & sublots, sampling & testing details 5. Develop Special Provisions followed by meetings, presentations, revisions 6. Conduct field sampling and testing database management, dispute resolution 7. Evaluate PRS results Incentives/disincentives for each lot

Identify AQCs and Target Values
Establish Performance Criteria
Model ME Performance
Design AQC vs. As-Constructed AQC
Compare As-Built and As-Designed
Pay Factor f(ΔLCC) Time
LCC
’s
Design
Constructed
PAVESPEC
M&R Plan
Develop Pay Factors Planning
Pavement Design
OPTIONAL

15 © Illinois State Toll Highway Authority 2015
Pavement Construction, Sampling, and Testing
Incentive and Disincentive Pay
Incorporate Pay Tables Into Specifications & Project Letting
Use Pay Factors

16
First Define Acceptance Quality Characteristics (AQC’s) Measureable More rapid the better Correlate with
performance Prediction models Are under contractor’s
control Can be varied on the project
x

17 © Illinois State Toll Highway Authority 2015
Acceptance Quality Characteristics (AQCs)
Five AQCs Compressive strength Air Thickness Smoothness Dowel Alignment
Each has Target Rejectable level Maximum level
All AQC tests MUST be tested with random sampling
18
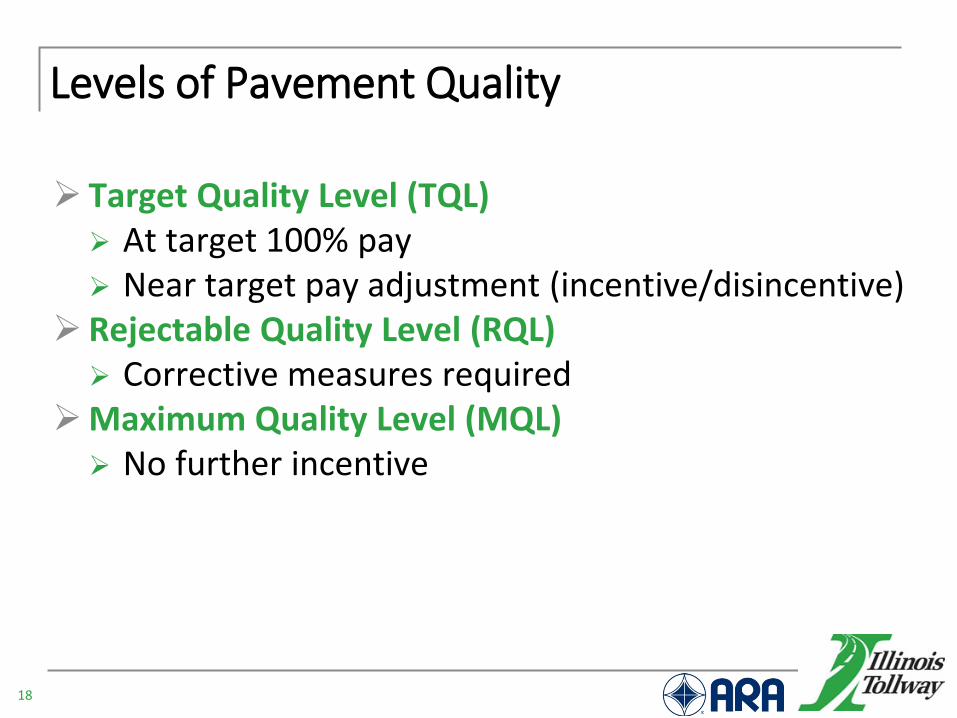
Levels of Pavement Quality
Target Quality Level (TQL) At target 100% pay Near target pay adjustment (incentive/disincentive)
Rejectable Quality Level (RQL) Corrective measures required
Maximum Quality Level (MQL) No further incentive

19
Lots and Sublots
Lot: All mainline concrete Sublot: Division of a lot for testing and
sampling One lane wide and ~1,000 ft. long (Generally 700 –
1,300 ft.) Provisions for pavement blockout Access areas, bridge approach, ramp transition, etc.
Sublot limits marked on plans (by lane) Payment is made on lot basis Rejection is made on sublot basis

20
Non-Conforming Materials
If RQL not met, contractor to develop Corrective Action Plan No incentive/disincentive for a sublot with
non-conforming materials. Accept or reject concrete on a sublot basis.

21
Pavement Type Selection Report (LCCA) is the Construction PRS Basis Traffic Design Reliability & Performance
Criteria Support conditions M & R strategies Costs & other
miscellaneous data

22
Maintenance and Rehabilitation Strategy
Varies as-constructed vs. as-designed

23
Historical AQC Data
Means and Standard Deviations IMIRS (Illinois Materials Inspection and
Reporting System) database Compressive strength, air content Historical QC/QA data over last 2-5 years Smoothness, thickness Other sources National historical dowel alignment data

24
PaveSpec 4.0 Mechanistic-Empirical Models and AQCs
Input
Significantly Impact Distress
Tran
sver
se
“Sla
b”
Cra
ckin
g Tr
ansv
erse
Jo
int
Faul
ting
Tran
sver
se
Join
t Spa
lling
Smoo
thne
ss
Initial Smoothness X X X X PCC Strength X X PCC Thickness X X X X PCC CTE X X X Effective Dowel Diameter* X X
PCC air content X X
PCC mix w/c ratio X X X X
*Computed by measuring dowel alignment & NCHRP 10-69 procedure

25
Pavement ME (MEPDG)
Traffic Climate
Structure/Materials Design Features
General Information
Performance Criteria and Reliability

26
Pavement ME Structural Response Model
ISLAB2000—enhanced 2.5D Finite Element Method
Rapid solution method required to make millions of calculations rapidly Neural network with dimensional analysis and
equivalent system Modified MC-HARP and traditional back-
propagation neural networks

27
Pavement ME Seasonal Variation of Inputs
Time, years
CTB Modulus
Each load application
PCC Modulus
Granular Base Modulus
2 8 6 4 0
Subgrade Modulus
Traffic
AC Modulus
28
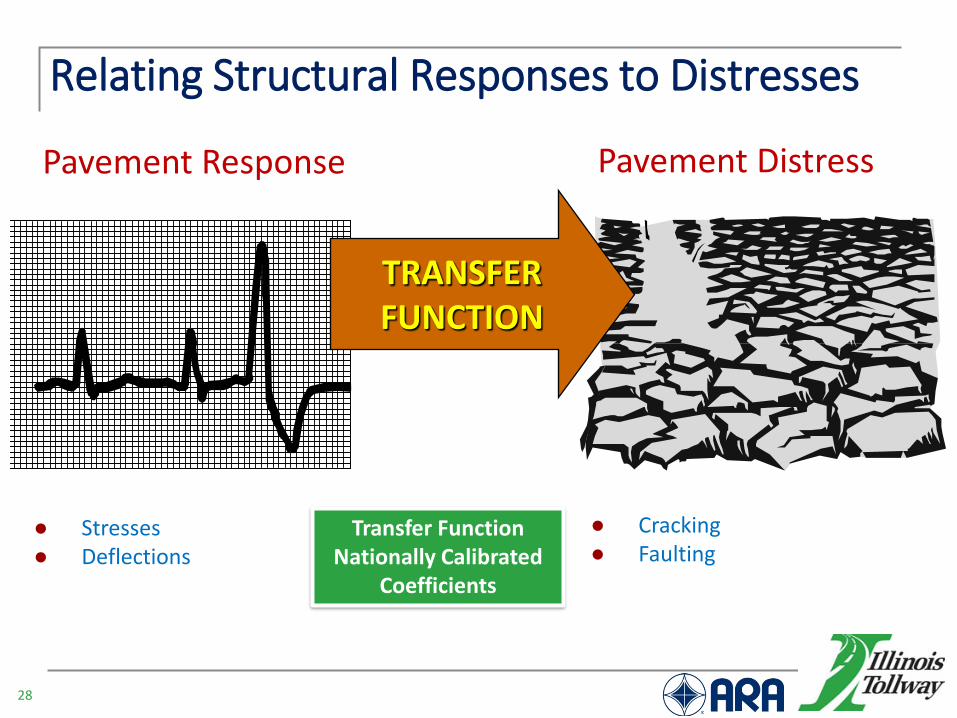
Relating Structural Responses to Distresses
Pavement Response Pavement Distress
TRANSFER FUNCTION
● Stresses ● Deflections
● Cracking ● Faulting
Transfer Function Nationally Calibrated
Coefficients

29
PaveSpec 4.0 Mechanistic-Empirical Models and AQCs
Input
Significantly Impact Distress
Tran
sver
se
“Sla
b”
Cra
ckin
g Tr
ansv
erse
Jo
int
Faul
ting
Tran
sver
se
Join
t Spa
lling
Smoo
thne
ss
Initial Smoothness X X X X PCC Strength X X PCC Thickness X X X X PCC CTE X X X Effective Dowel Diameter* X X
PCC air content X X
PCC mix w/c ratio X X X X
*Computed by measuring dowel alignment & NCHRP 10-69 procedure

30
PaveSpec 4.0

31
PCC Layer Inputs

32
Vehicle Classification Distribution

33
8 Maintenance & Rehab Inputs
34 © Illinois State Toll Highway Authority 2015
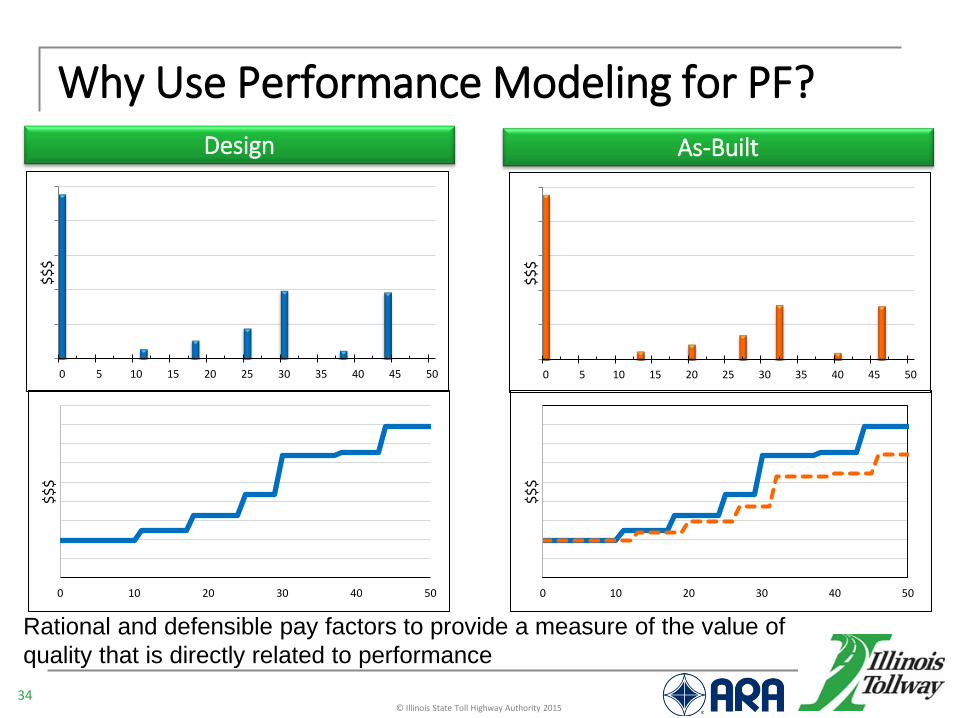
Why Use Performance Modeling for PF? Design As-Built
0 5 10 15 20 25 30 35 40 45 50
$$$
0 10 20 30 40 50
$$$
0 10 20 30 40 50
$$$
0 5 10 15 20 25 30 35 40 45 50
$$$
Rational and defensible pay factors to provide a measure of the value of quality that is directly related to performance

35
28-Day Compressive Strength Test with cylinders (Illinois Modified AASHTO
T22, T23) Process described in IDOT Article 1020.09 Strength Tests 6”x12” cylinders only Two cylinders per sublot
Level Mean (psi) Std. Dev. (psi) Target 5,500 500
Rejectable 4,000 - Maximum 6,500 -

36
Strength Pay Factor Curve
85
90
95
100
105
4,000 4,500 5,000 5,500 6,000 6,500
Pay
Fact
or, %
28-Day Compressive Strength, psi
Std. Dev. = 500 psi
Std. Dev. = 1,000 psi
Std. Dev. = 0 psi

37
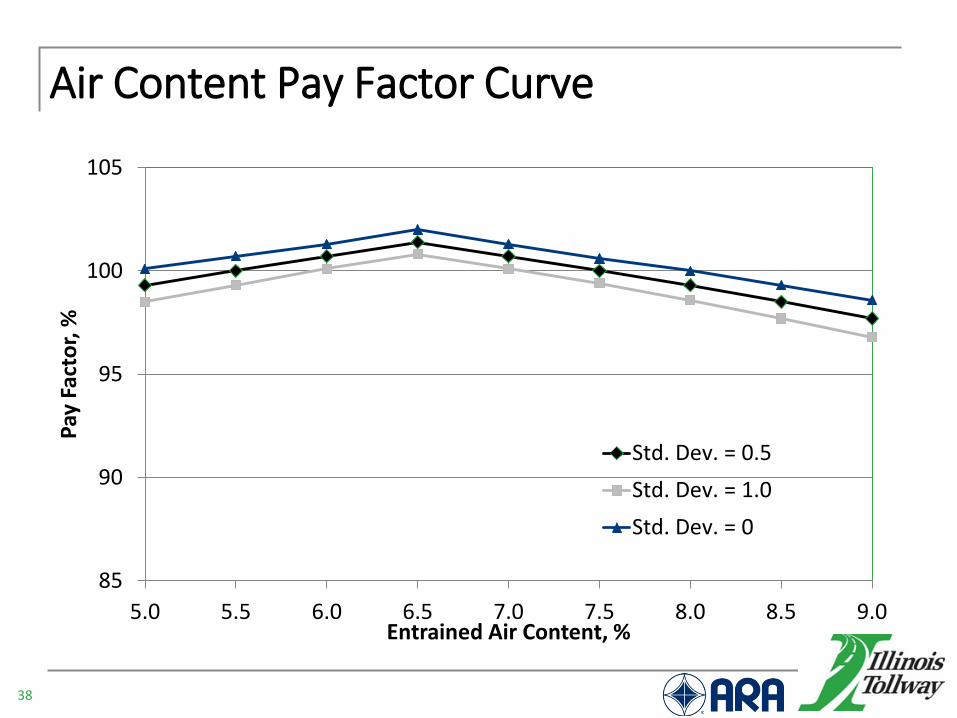
Air Content
Test with pressure meter according to IDOT Article 1020.08 Air Content Computed from average of four tests per sublot Same samples used for strength cylinders + 3 others
Level Mean Content (%)
Std. Dev. (%)
Target 6.5 0.5 Rejectable 5.0 - Maximum 9.0 -
38
Air Content Pay Factor Curve
85
90
95
100
105
5.0 5.5 6.0 6.5 7.0 7.5 8.0 8.5 9.0
Pay
Fact
or, %
Entrained Air Content, %
Std. Dev. = 0.5Std. Dev. = 1.0Std. Dev. = 0

39
Slab Thickness
Test with MIT-Scan T2 meter as described by user manual Random pre-determined locations
Computed from average of four measurements per sublot
Level Mean (in) Std. Dev. (in) Target Plan thickness 0.25
Rejectable Plan thickness - 0.5 - Maximum Plan thickness + 1.0 -

40
Slab Thickness Pay Factor Curve
85
90
95
100
105
12.50 12.75 13.00 13.25 13.50 13.75 14.00
Pay
Fact
or, %
PCC Thickness, in
Std. Dev. = 0.25 inStd. Dev. = 0.50 inStd. Dev. = 0 in

41
Smoothness (IRI)
Test in accordance with ASTM E950 Class I inertial profiler Test and report each wheel path Computed from average of wheel paths
Level Mean (in/mile) Std. Dev. (in/mile) Target 60.0 10.0
Rejectable 80.0 - Maximum 50.0 -

42
Smoothness Pay Factor Curve
85
90
95
100
105
50 55 60 65 70 75 80
Pay
Fact
or, %
IRI, in/mi
Std. Dev. = 10 in/miStd. Dev. = 20 in/miStd. Dev. = 0 in/mi

43
Effective Dowel Diameter (EDD)
Test with MIT-Scan 2 Calculate EDD as described in NCHRP Report 637 Averages of five consecutive joints Rejection on individual alignment criteria Process control separate of PRS
Level Mean (in.) Std. Dev. (in.) Target 1.50 N/A

44
Effective Dowel Diameter Pay Factor Curve
85.0
90.0
95.0
100.0
105.0
1.35 1.40 1.45 1.50
Pay
Fact
or, %
Effective Dowel Diameter, in
Std. Dev. NA
45
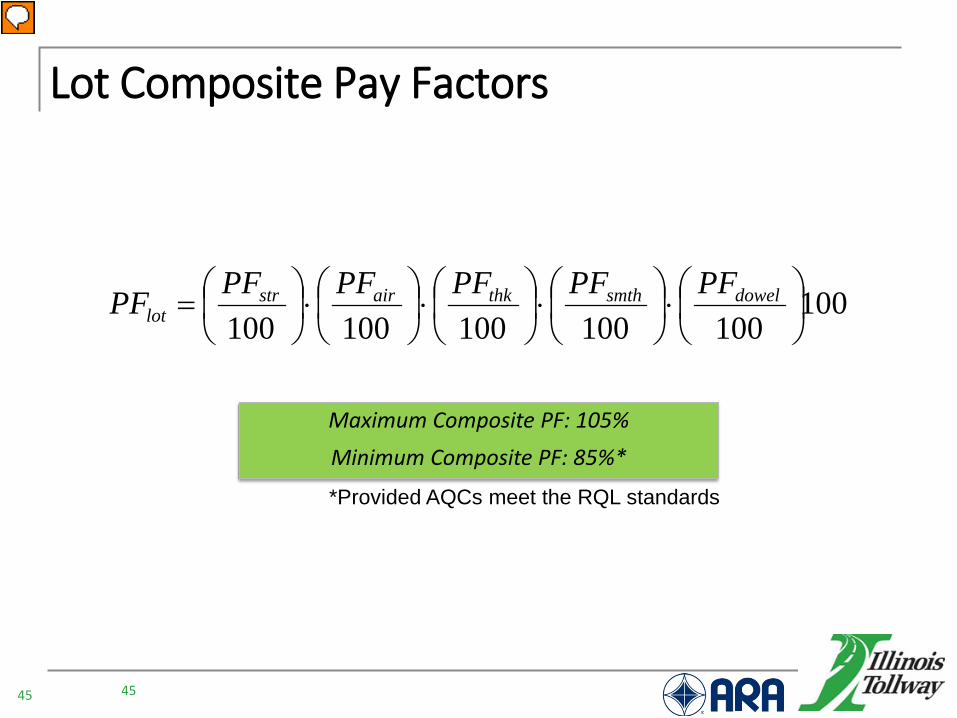
Lot Composite Pay Factors
45
100100100100100100
⋅
⋅
⋅
⋅
= dowelsmththkairstr
lotPFPFPFPFPFPF
Maximum Composite PF: 105% Minimum Composite PF: 85%*
*Provided AQCs meet the RQL standards

46
Spreadsheet to Track Construction Quality Data Will calculate pay factors even with partial data
Data distributed to all through Ebuilder

47 © Illinois State Toll Highway Authority 2015
Performance Specifications Started With Tollway Concrete Material Specs for Patching Back in 2008, hundreds of
long life full depth PCC patches were required on a Chicago area Tollway expressway
CTL Group was hired to come of with a solution to make them fast but long life
Performance Engineered Mixes (PEM’s) and the specifications for them resulted

48
Current Tollway Applications for PEM Specs
Accelerated (HES) weekend patching mixes Rapid Ca Al cement overnight patching mixes Mass concrete PCC mixes for structures HPC bridge deck / approach slab PCC mixes Ternary black rock PCC mixes for composite
pavements Ternary optimized PCC mixes for single lift
pavements

49
Test Method Performance Requirement Time
AASHTO T 22-10 4000 ≤ f’cr ≤ [f’cr + 1500] psi at 14 days 14 days
AASHTO T 119 Slump greater than 3" for 45 minutes after water added to cement 0
ASTM C1581-09a (Ring Test)
Minimum 28 days with no cracking (Exempt if < than 600 lb/yd3 cementitious & > of 1.5 gal/yd3 SRA is used) 28 days
AASHTO T 160-09 (Length Change)
Maximum 0.03 percent after 7 days curing and 21 days drying, zeroed at the start of drying 28 days
AASHTO T 161(A)-08 (Freeze/Thaw Mod.)
Minimum RDM of 80 percent after 300 cycles Exempt if ASTM C457 requirements are met and
aggregate is IDOT Class A+ 74 days typ.
AASHTO T 303 (Alkali Reactivity)
Expansion less than 0.10% at 16 days Exempt if total alkali content from cement is < than 4 lb/yd3 16 days
ASTM C457-11 (Hardened Air)
Spacing factor not exceeding 0.008-in Specific surface not less than 600 in2/in3
Total air content not less than 4.0% 7 days
AASHTO T 277-07 (Cl Penetration) Max 1250 Coulombs after 28 day accelerated curing 28 days
Performance Requirements for HPC Deck Mixes

50 © Illinois State Toll Highway Authority 2015
Success to Date with PEM for HPC Decks Since 2012, 28 HPC bridge
decks placed along I-90. Many more coming this year.
Isolated shrinkage cracks
found on only one of the bridges.
Isolated restraint cracks
found on only 12 of the 28 decks.
Can we make the specs more strict?

51
Recommendations to Agencies on Developing PEM Specifications Reach out to the experts for ideas Collaborate with your local roadbuilders Road and bridge builders associations Local ACPA chapters Train the field staff (for new testing) Most importantly, develop the specs through
the local concrete suppliers and chapter ACI group or NRMCA! Don’t wait for the Professors!

52
All Future Pavement Construction to Use Only Performance Related Optimized Ternary Mixes
Between 2014 and 2026, more than a million cu.
yds. of performance related ternary pavement mixes to be produced for new Chicago expressways.
Mixes will require a minimum of 35% SCM’s except with cold weather placements.
Blended cements allowed. Feed of washed chips to optimize gradation is
mandatory. More than 500,000 cu yds to be placed on I-90 in
2015 & 2016.

53
Summary of 2015 implementation of Performance Specifications at Tollway Applied to nine I-90 reconstruction and widening
projects with 13” JPCP
No. of sublots ranged from 20 to 120 per contract
Approx. 1,443,512 sq. yds. of JPCP to be built under Performance Specifications in 2015 & 2016
Approx. 300k sq. yds. placed to this date.

54
Results to Date as of: 11/02/2015 Percent of Sublots with data (by Contract)
G W J Z A Q X M C
Air 90.0 84.1 64.2 20.0 38.2 20.5 58.8 57.1 60.9 Strength 75.0 66.0 34.2 18.8 8.8 17.8 14.7 35.7 34.8 Thickness 100.0 75.7 56.7 17.5 29.4 20.5 55.9 71.4 52.2 Dowel Diam. 95.0 67.3 60.0 17.5 33.8 17.8 55.9 67.9 43.5 Smoothness 55.0 0.0 1.7 13.8 0.0 8.2 23.5 0.0 4.3
Overall: 37.8 Percent of sublot/data for the pay factor types have some data
Quality Pay Factors by Type and Contract G W J Z A Q X M C Air 100.7 101.1 101.2 101.1 101.5 101.3 101.1 101.0 101.0 Strength 98.9 100.4 100.9 95.4 102.4 99.5 101.8 100.3 98.5 Thickness 101.2 101.3 101.0 101.0 100.7 98.7 101.1 100.9 101.0 Dowel Diam. 99.9 99.9 100.0 99.9 99.9 100.0 99.9 99.8 99.2 Smoothness 99.4 100 100.6 96.9 100 94.4 94.7 100 100 Composite PF 100.08 102.72 103.75 94.30 104.56 93.91 98.44 102.01 99.68
100 Values have no or insufficient sublot data and are only used for the Composite PF calculation

55
Issues Encountered or Lessons Learned
8990919293949596979899
100101102103104105
4,000 4,500 5,000 5,500 6,000 6,500 7,000 7,500 8,000 8,500
2015/2016 FINAL2015 Proposed Revision #1Original SP
Compressive strength limits were the biggest issue - At early age - At 28 days

56 © Illinois State Toll Highway Authority 2015
Issues Encountered or Lessons Learned
Mix Designs More Important
Allow for slight mix design adjustments to be quickly approved (7 days)
Be prepared for many trial batches
Make the Contractor responsible for preparing and delivering compressive strength cylinders
Make sure agency’s labs cure and test properly
Good Measurement Critical

57 © Illinois State Toll Highway Authority 2015
Issues Encountered or Lessons Learned Plan for the hand pours or
manual placements Allow for sublot boundaries to
be adjusted Locations of manual placement
paid for at bid price with no adjustment potential
Minimum properties required to be obtained as measured using QC/QA, not PRS
Smoothness measurements delayed when new pavement is used as a haul road in narrow work zones
Don’t let the contractor sneak in his own QC data

58 © Illinois State Toll Highway Authority 2015
Issues Encountered or Lessons Learned
Possibly account for cold weather placements
Reduce SCM content in mixes
after the need for cold weather protection arrives
Create second lot with compressive strengths and smoothness pay factors eliminated from composite pay factor for all placements afterwards

59
2015 PRS Construction Revision Mix Designs 3-day Strength – reduced to 2500 psi Mix Design adjustments – faster approval (7 days) Pavement PRS Strength Testing Calculation (Third Cylinder) Strength Pay Factor adjusted Dispute response time: revised from 3 to 14 days Blockouts / Handpours defined and preapproved Late Season Paving accounted for
59

60
Benefits to Performance Specifications Improved design-to-construction
communication Develop more rational pay factors Improved and focused testing by all parties Improved understanding of performance by
all Improved quality focus Clearer distinction in roles and
responsibilities Creates a more innovative environment Most importantly – overall cost savings!
60

61
Recommendations to Agencies on Developing PRS Specifications for JPCP Specify most objective procedures for measurement
of quality characteristics to minimize dispute resolution battles with the contractors.
Be prepared for agency to be totally responsible for taking measurements.
Allow for 1 to 3 year warranties to still be used with the promise to the industry to reduce them or eliminate them should PRS show improvements down the road.
Shadow current projects to establish database to base future PRS quality characteristic limits on.
62 © Illinois State Toll Highway Authority 2015
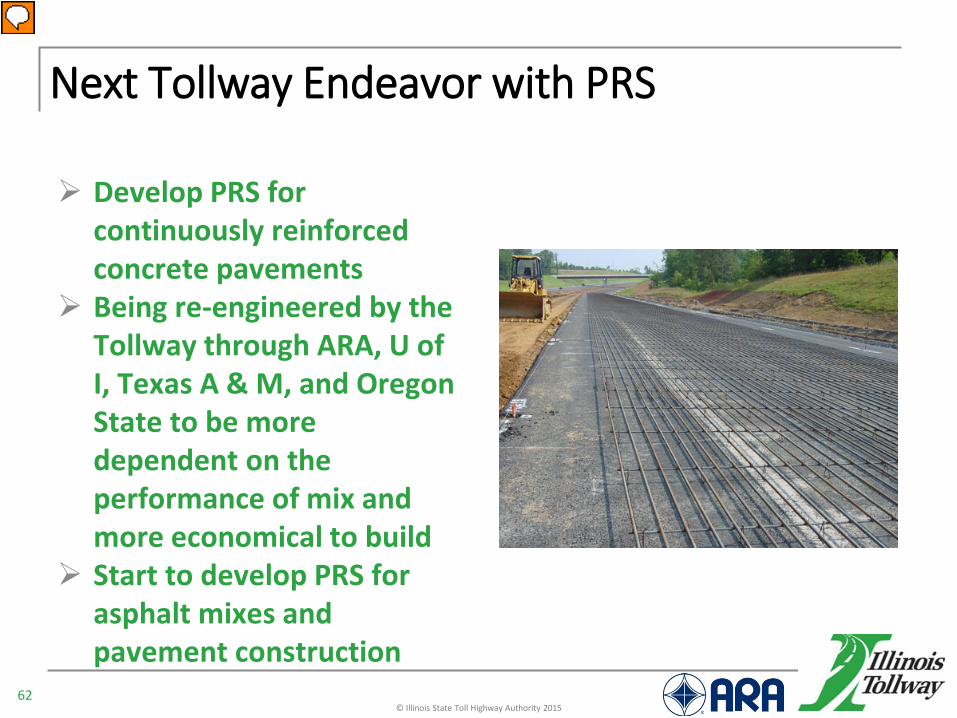
Next Tollway Endeavor with PRS
Develop PRS for continuously reinforced concrete pavements
Being re-engineered by the Tollway through ARA, U of I, Texas A & M, and Oregon State to be more dependent on the performance of mix and more economical to build
Start to develop PRS for asphalt mixes and pavement construction

THANK YOU
63

64
Develop and Deploy Performance-Related Specifications (PRS) for Pavement Construction FHWA DTFH61-13-C-00025
Murthy Guddati, Pat Nolan, Gerry Huber

65
Develop and Deploy Performance-Related Specifications (PRS) for Pavement Construction FHWA DTFH61-13-C-00025
Phase 1 • Development of PRS models and software
•Asphalt and Jointed Plain Concrete Pavements • Guidelines development • Deployment projects and PRS validation
Phase 2 • Sensitivity analysis • Software integration • Inspection and material testing program optimization • PRS refinements
Phase 3 • Pay factor weighting evaluation • Risk evaluation • PRS final refinements
2013 2014 2015 2016 2017
Phase 1
2018
Phase 2
Phase 3

66
Develop and Deploy Performance-Related Specifications (PRS) for Pavement Construction
WHAT WE ARE WORKING ON RIGHT NOW (PCC) Improved durability models for PCC Improvement to PaveSpec 4.0 Speed Analysis Engine Life-Cycle Cost Analysis User Costs Sampling/Testing Details and Lot/Sublot Analysis Incorporation of durability models into PaveSpec Guideline documents

67
Interested in Shadow Implementation?
Contact ARA -- Shree Rao ([email protected]) NCSU -- Richard Kim ([email protected]) FHWA -- Richard Duval ([email protected])