ijc heart & vasculature
TRANSCRIPT

IJC Heart & Vasculature 32 (2021) 100721
Contents lists available at ScienceDirect
IJC Heart & Vasculature
journa l homepage: www. journals .e lsevier .com/ i j c -hear t -and-vascula ture
Diagnostic value of quantitative parameters for myocardial perfusionassessment in patients with suspected coronary artery disease by single-and dual-energy computed tomography myocardial perfusion imaging
https://doi.org/10.1016/j.ijcha.2021.1007212352-9067/� 2021 Published by Elsevier B.V.This is an open access article under the CC BY-NC-ND license (http://creativecommons.org/licenses/by-nc-nd/4.0/).
⇑ Corresponding author at: Department of Cardiology, Hospital Universitari Valld’Hebron, Paseo Vall d’Hebron 119-129, 08035 Barcelona, Spain.
E-mail addresses: [email protected] (A. Ruiz-Muñoz), [email protected] (F. Valente), [email protected] (L. Dux-Santoy), [email protected] (A. Guala), [email protected] (G. Teixidó-Turà), [email protected] (L. Galián-Gay), [email protected] (L. Gutiérrez), [email protected] (R. Fernández-Galera), [email protected] (G. Casas),[email protected] (T. González-Alujas), [email protected] (I. Ferreira-González), [email protected] (A. Evangelista), [email protected] (J. Rodríguez-Palomares).
Aroa Ruiz-Muñoz a,b,c,d, Filipa Valente a,b,c,d, Lydia Dux-Santoy a,b,c,d, Andrea Guala a,b,c,d,Gisela Teixidó-Turà a,b,c,d, Laura Galián-Gay a,b,c,d, Laura Gutiérrez a,b,c,d, Rubén Fernández-Galera a,b,c,d,Guillem Casas a,b,c,d, Teresa González-Alujas a,b,c,d, Ignacio Ferreira-González a,c,d,e, Arturo Evangelista a,b,c,d,José Rodríguez-Palomares a,b,c,d,⇑aVall d’Hebron Institut de Recerca (VHIR), Barcelona, SpainbCIBER-CV, Instituto de Salud Carlos III, Madrid, SpaincDepartment of Cardiology, Hospital Universitari Vall d’Hebron, Barcelona, SpaindUniversitat Autònoma de Barcelona, Barcelona, SpaineCIBERESP, Instituto de Salud Carlos III, Madrid, Spain
a r t i c l e i n f o a b s t r a c t
Article history:Received 3 December 2020Received in revised form 9 January 2021Accepted 14 January 2021
Keywords:Coronary artery diseaseMyocardial ischaemiaCT myocardial perfusion imagingTransmural perfusion ratioDual-energy CT-based iodine imaging
Purpose: To compare performance of visual and quantitative analyses for detecting myocardial ischaemiafrom single- and dual-energy computed tomography (CT) in patients with suspected coronary artery dis-ease (CAD).Methods: Eighty-four patients with suspected CAD were scheduled for dual-energy cardiac CT at rest(CTA) and pharmacological stress (CTP). Myocardial CT perfusion was analysed visually and using threeparameters: mean attenuation density (MA), transmural perfusion ratio (TPR) and myocardial perfusionreserve index (MPRI), on both single-energy CT and CT-based iodine images. Significant CAD was definedin AHA-segments by concomitant myocardial hypoperfusion identified visually or quantitatively(parameter < threshold) and coronary stenosis detected by CTA. Single-photon emission CT and invasivecoronary angiography were used as reference. Perfusion-parameter cut-off values were calculated in arandomly-selected subgroup of 30 patients.Results: The best-performing thresholds for TPR, MPRI and MA were 0.96, 23 and 0.5 for single-energy CTand 0.97, 47 and 0.3 for iodine imaging. For both CT-imaging modalities, TPR yielded the highest areaunder receiver operating characteristic curve (AUC) (0.99 and 0.97 for single-energy CT and iodine imag-ing, respectively, in vessel-based analysis) compared to visual analysis, MA and MPRI. Visual interpreta-tion on iodine imaging resulted in higher AUC compared to that on single-energy CT in per-vessel (AUC:0.93 vs 0.86, respectively) and per-patient (0.94 vs 0.93) analyses.Conclusion: Transmural perfusion ratio on both CT-imaging modalities is the best-performing parameterfor detecting myocardial ischaemia compared to visual method and other perfusion parameters. Visualanalysis on CT-based iodine imaging outperforms that on single-energy CT.� 2021 Published by Elsevier B.V. This is an open access article under the CC BY-NC-ND license (http://
creativecommons.org/licenses/by-nc-nd/4.0/).
1. Introduction
Coronary artery disease (CAD) management has improved overtime; however CAD remains the leading cause of morbidity andmortality in the western world [1]. Computed tomography angiog-raphy (CTA) is considered an accurate, non-invasive method for theanatomical evaluation of luminal narrowing in coronary arteries.Nonetheless, in patients with known CAD, the addition of com-puted tomography (CT) myocardial perfusion imaging may
A. Ruiz-Muñoz, F. Valente, L. Dux-Santoy et al. IJC Heart & Vasculature 32 (2021) 100721
improve the detection of haemodynamically-significant stenosis[2].
CT myocardial perfusion imaging is usually based on visualinterpretation of left ventricular contrast enhancement on bothrest and stress-induced CT images (CTA and CTP, respectively).However, a quantitative approach could avoid the limitations ofsubjective visual estimation [3]. Several parameters such as trans-mural perfusion ratio (TPR) [3–8], myocardial perfusion reserveindex (MPRI) [9] and mean attenuation (MA) have been proposedfor the quantitative analysis of myocardial perfusion. Nevertheless,comparative studies indicating which parameter is more accurateare lacking.
CT myocardial perfusion imaging can be performed using dual-energy CT, allowing mapping of iodine distribution in the myocar-dium that can be used as a quantitative perfusion marker [10].Nonetheless, the benefits of using CT-based iodine images com-pared to native CT scans for quantitative assessment of myocardialischaemia have not been sufficiently studied.
This study aimed (1) to compare and rank the performance ofquantitative perfusion parameters and visual analysis in the evalu-ation of myocardial ischaemia by both single- and dual-energyCTA/CTP images in a cohort of patients with chest pain and (2) toascertain whether the use of dual-energy CT-based iodine imaginghas advantages over analysis with single-energy CT scans in theidentification of myocardial ischaemia.
2. Materials and methods
2.1. Population and study design
Eighty-four consecutive patients with chest pain, a priormyocardial perfusion single-photon emission computed tomogra-phy study, and referred for invasive coronary angiography (ICA)were enrolled in the study. Exclusion criteria were atrial fibrilla-tion, supraventricular arrhythmias, high-grade atrioventricularblock, renal insufficiency (estimated glomerular filtrationrate < 30 mL/min), chronic obstructive pulmonary disease, signifi-cant aortic stenosis, known CAD, coronary percutaneous or surgicalrevascularisation and contraindication to iodinated contrast.
Before ICA, patients were scheduled for cardiac CT, includingdual-energy CTA (rest acquisition) and CTP (stress-induced acqui-sition) (Fig. 1). Monochromatic images generated from the dual-energy CT scan were used as a surrogate of single-energy CT stud-ies. Myocardial perfusion was assessed by visual interpretation andusing three quantitative parameters (TPR, MPRI, and MA) at per-patient and per-vessel levels. Firstly, parameter cut-off values were
calculated from a randomly-selected test group of 30 patients.Qualitative and different quantitative analyses were compared in
a validation group of other 54 patients using SPECT + ICA as refer-ence. The study protocol was approved by the institutional EthicsCommittee and all participants provided written informed consent.
2.2. Imaging protocols
2.2.1. SPECTSPECT studies were carried out according to current recommen-
dations [11], following a single-day stress-rest protocol using atechnetium-99 m radiotracer. Treadmill exercise was performedaccording to the Bruce protocol. Image acquisition was conductedwith an Elscint SP4 nuclear gamma camera with a high-resolutioncollimator and short- and long-axis view images were obtainedand analysed by two experts. By consensus, SPECT was consideredpositive if a perfusion defect was shown in at least two of the threeaxes or in three consecutive views from the same axis with total orpartial reversibility at rest.
2
2.2.2. CTA/CTPPatients underwent a rest coronary CT angiography (CTA) fol-
lowed by a Dipyridamole stress-induced CT study (CTP). For CTA,patients were given sublingual nitroglycerine if systolic bloodpressure was > 100 mmHg, and intravenous beta-blockers (Esmo-lol, 1–3 mg/kg) if heart rate was > 60 bpm. Contrast (Iomeron 400)was administered via a cubital vein, with a flow of 5.5 mL/secondand volume between 80 and 100 mL depending on the patient’sweight. CTP was acquired once Dipyridamole was injected(0.84 mg/Kg over 6 min [12]) into a cubital vein followed by80 mL of iodine contrast (Iomeron 400) at 4.0–5.0 mL/second foreach of the separate, axial, prospectively ECG-triggered acquisi-tions [2]. Then, all patients received intravenous Aminophylline(250 mg/10 mL) to reverse the effect of Dipyridamole.
The scans were acquired on a 64-slice CT scanner (Discovery CT750 High Definition; General Electrics (GE); WI; USA) that includesan x-ray source which can switch energy between 80 and 140 kVpwithin 0.3–0.5 ms, and is complemented by a gemstone detectorwith fast primary speed and low afterglow.
The scanning protocol was adapted to individual body massindex (calculated as weight divided by square of heigh; kg/m2)using Gemstone Spectral Imaging (GSI) presets as previouslyreported in detail [13]. In brief, tube current ranged from 375 to640 mA, while GSI mode with fast tube voltage switching between80 and 140 kVp on adjacent views during a single rotation resultedin a mean tube voltage ranging from 105 to 112 kV. The followingscanning parameters were used in addition: axial scan mode with64 � 0.625 mm, gantry rotation time of 350 ms and temporal res-olution of 175 ms.
From the acquired data, conventional polychromatic imagescorresponding to the 140 kVp tube voltage as well as monochro-matic image sets from the GSI data file (50, 60, 70, 80, 90, 100,120 a 140 keV) were reconstructed using Adaptive Statistical Iter-ative Reconstruction (ASiR) technology [14]. All these data weretransferred to a dedicated workstation (AW VolumeShare5 work-station, General Electrics (GE), WI, USA) to obtain CT-based iodineimages and the short-axis views of the left ventricle (LV) (basal,mid-cavity and apical) on both single-energy CT (Hounsfield Units)and iodine images for the posterior analysis of myocardialperfusion.
2.3. Myocardial perfusion assessment
Myocardial perfusion defect was defined as the concurrentpresence of two conditions: (1) hypoperfusion in the myocar-dium identified through visual or quantitative analysis(parameter < threshold), and (2) a corresponding significantcoronary stenosis with > 50% or > 70% reduction in vessel lumenon CTA. Each myocardial segment was assigned to one major epi-cardial coronary artery - left anterior descending artery (LAD), leftcircumflex artery (LCX) and right coronary artery (RCA) - in accor-dance with previous recommendations [15] and coronarydominancy.
The hypoperfusion in the myocardium was assessed by bothsingle-energy CT and CT-based iodine studies. The LV on CTA (restacquisition) and CTP (stress-induced acquisition) was divided intoequal thirds perpendicular to the long axis using anatomical land-marks and following the published recommendations [15] (Fig. 2).Then the short-axis images of the LV (basal, mid-cavity and apicalsection) were divided into myocardial segments according to the16-AHA segmentation model of the LV [15] and assessed forischaemia both visually and quantitatively by an experiencedobserver (Figs. 1 and 2). More details about AHA-segmentation inAppendices A1.
Coronary stenosis was evaluated on CTA based on the 17 coro-nary segment model according to SCCT recommendations [16].
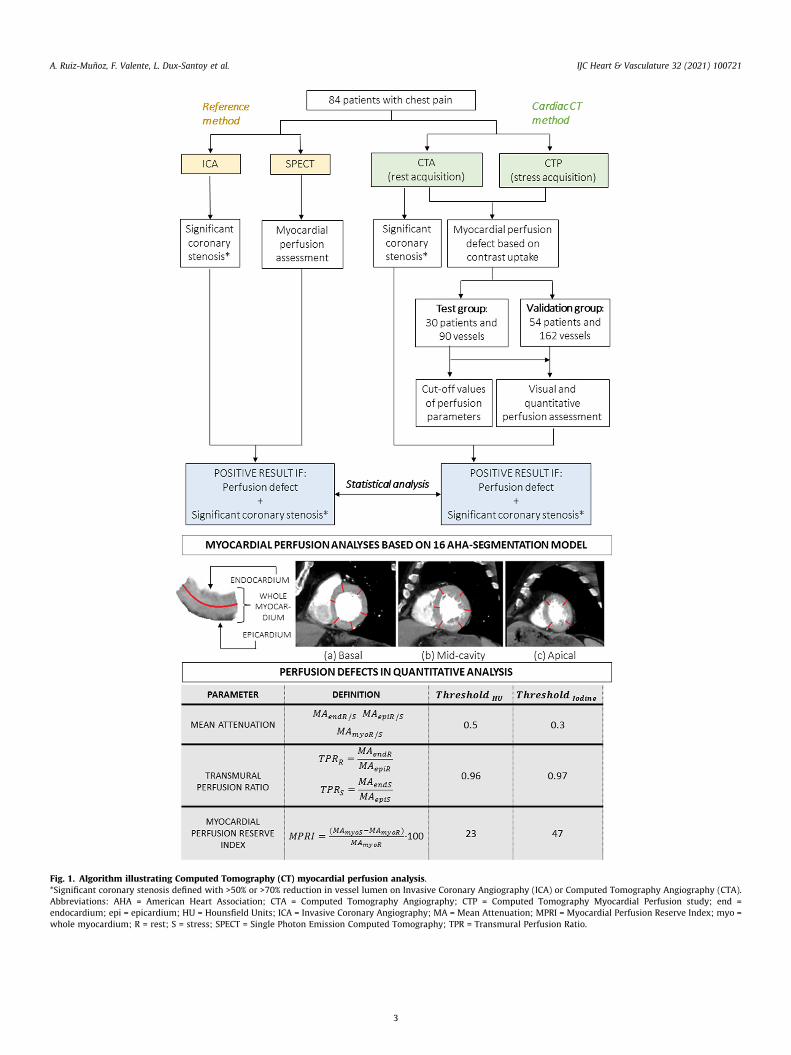
Fig. 1. Algorithm illustrating Computed Tomography (CT) myocardial perfusion analysis.*Significant coronary stenosis defined with >50% or >70% reduction in vessel lumen on Invasive Coronary Angiography (ICA) or Computed Tomography Angiography (CTA).Abbreviations: AHA = American Heart Association; CTA = Computed Tomography Angiography; CTP = Computed Tomography Myocardial Perfusion study; end =endocardium; epi = epicardium; HU = Hounsfield Units; ICA = Invasive Coronary Angiography; MA = Mean Attenuation; MPRI = Myocardial Perfusion Reserve Index; myo =whole myocardium; R = rest; S = stress; SPECT = Single Photon Emission Computed Tomography; TPR = Transmural Perfusion Ratio.
A. Ruiz-Muñoz, F. Valente, L. Dux-Santoy et al. IJC Heart & Vasculature 32 (2021) 100721
3
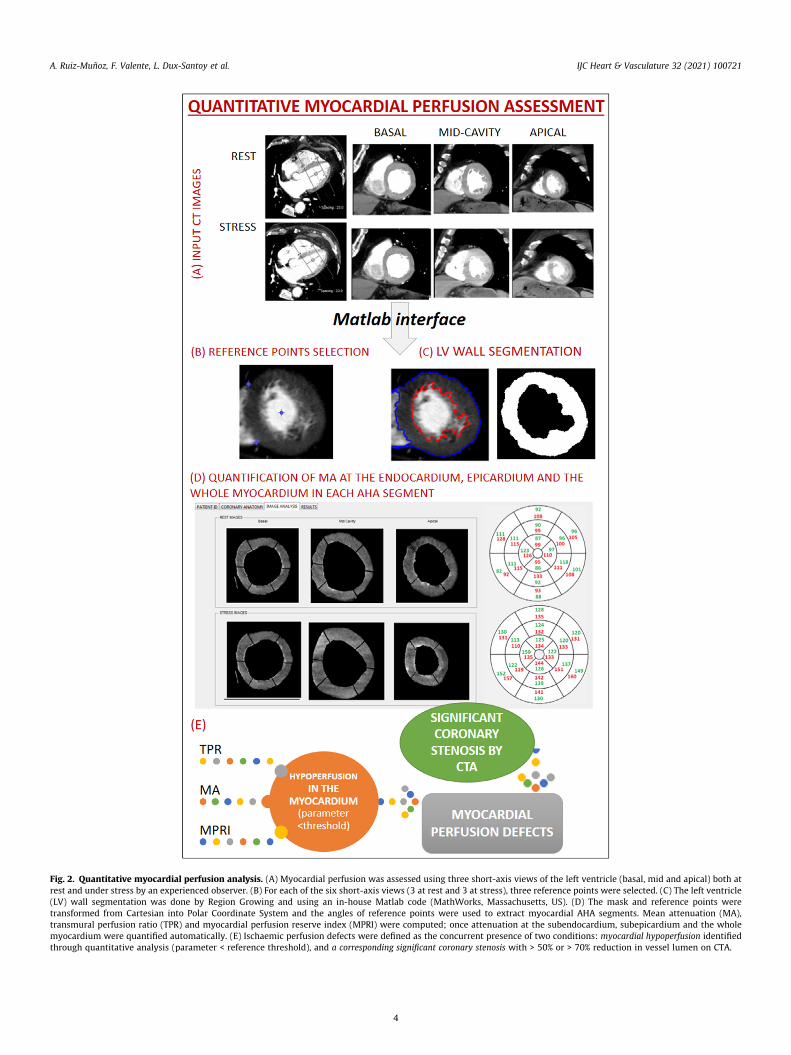
Fig. 2. Quantitative myocardial perfusion analysis. (A) Myocardial perfusion was assessed using three short-axis views of the left ventricle (basal, mid and apical) both atrest and under stress by an experienced observer. (B) For each of the six short-axis views (3 at rest and 3 at stress), three reference points were selected. (C) The left ventricle(LV) wall segmentation was done by Region Growing and using an in-house Matlab code (MathWorks, Massachusetts, US). (D) The mask and reference points weretransformed from Cartesian into Polar Coordinate System and the angles of reference points were used to extract myocardial AHA segments. Mean attenuation (MA),transmural perfusion ratio (TPR) and myocardial perfusion reserve index (MPRI) were computed; once attenuation at the subendocardium, subepicardium and the wholemyocardium were quantified automatically. (E) Ischaemic perfusion defects were defined as the concurrent presence of two conditions: myocardial hypoperfusion identifiedthrough quantitative analysis (parameter < reference threshold), and a corresponding significant coronary stenosis with > 50% or > 70% reduction in vessel lumen on CTA.
A. Ruiz-Muñoz, F. Valente, L. Dux-Santoy et al. IJC Heart & Vasculature 32 (2021) 100721
4
A. Ruiz-Muñoz, F. Valente, L. Dux-Santoy et al. IJC Heart & Vasculature 32 (2021) 100721
Stenosis was considered significant if coronary vessel diameterwas reduced by >50% or >70%, as recommended [2,17].
Diagnostic accuracy of CTA/CTP was evaluated at both per-patient and per-vessel levels with the latter being based on athree-vessel territory model including LAD, LCX and RCA. The per-formance of CTA/CTP was compared with SPECT + ICA, consideredhere as a reference. A perfusion defect was defined if SPECT iden-tified hypoperfusion in a region of the myocardium supplied by astenotic main coronary artery evaluated by ICA (Fig. 1).
2.3.1. Visual assessment
Visual analysis of myocardial perfusion was made in the valida-
tion group. AHA-segments with hypoperfusion were identified ashypoattenuating (darker) areas containing reduced amounts ofcontrast material on stress (reversible ischaemia) or on both restand stress (necrosis) images [3].
2.3.2. Semi-automatic, quantitative assessmentQuantitative myocardial perfusion analysis was made using the
following parameters:
(a) Mean attenuation (MA): mean value of the attenuation ofpixels included in the subendocardium (MAendR/S), subepi-cardium (MAepiR/S), and whole myocardium (MAmyoR/S). Thisparameter was evaluated in both rest (R) and stress (S)images.
(b) Transmural perfusion ratio (TPR): the MA ratio in thesubendocardium relative to the MA of the entire subepi-cardium of any given short-axis slice [3]. This parameterwas evaluated in both rest (R) and stress (S) images.
Table 1Baseline characteristics.
Characteristic Test group Validation group p-Value
N1 Number of subjects 30 54 -N2 Number of vessels 90 162 -Sex (male) 17 (56.7%) 36 (66.7%) 0.145Age (years) 71.0 [60.0;74.0] 71 [62.0;74.5] 0.421Body mass index (kg/m2) 28.0 [25.0;30.75] 28.0 [26.0;30.0] 0.850Hypertension 24 (80.0%) 39 (72.2%) 0.124Diabetes mellitus 12 (40.0%) 17 (31.5%) 0.145Dyslipidaemia 22 (73.3%) 37 (68.5%) 0.372Smoking historyCurrent smoker 4 (13.3%) 4 (7.4%) 0.999Former smoker 5 (16.7%) 12 (22.2%) 0.453Non-smoker 19 (63.3%) 35(64.8%) 0.754Family history of CAD 1 (1.9%) 1 (1.9%) 0.453Angina at presentationNo chest pain 4 (13.3%) 10 (18.5%) 0.643Chest pain 9 (30.0%) 20 (37.0%) 0.488Atypical chest pain 9 (30.0%) 13 (24.1%) 0.582Nonanginal chest pain 3 (10.0%) 3 (5.6%) 0.590Fatigue or dyspnoea on exertion4 (13.3%) 7 (13.0%) 0.999Positive SPECT findings 15 (50.0%) 22 (40.7%) 0.166Coronary stenosis > 50% by
ICA:LAD 11 (36.7%) 17 (31.5%) 0.681LCX 5 (16.7%) 7 (13.0%) 0.643RCA 7 (23.3%) 13 (24.1%) 0.955Coronary stenosis > 70% by
ICA:LAD 5 (16.7%) 8 (14.8%) 0.810LCX 5 (16.7%) 7 (13.0%) 0.643RCA 6 (20.0%) 9 (16.7%) 0.725Radiation dose in CT (mSv) 6.5 [4.9;7.8] 6.4 [4.7;7.9] 0.671Total contrast dose (mL) 170.0 [160.0;180.0]170.0 [167.5;180.0]0.573
Values are reported as N (%) or median [interquartile range].Abbreviations: CAD = Coronary artery disease; CT = Computed Tomography;LAD = left anterior descending; LCX = left circumflex artery; RCA = right coronaryartery; SPECT = single photon emission computed tomography.
5
(c) Myocardial perfusion reserve index (MPRI): the percentageof MA at stress minus MA at rest divided by MA at rest [9].
The quantitative approach which uses short-axis views of theleft ventricle as input images was based on an in-house Matlabcode (MathWorks, Massachusetts, US) that allowed to: (1) selectthree anatomical reference points for automatic AHA segmenta-tion, (2) segment the left ventricle wall semi-automatically, (3)define each AHA segment automatically, (4) measure LV myocar-dial perfusion in each AHA-segment in terms of MA, TPR and MPRIand (5) consider an AHA-segment to be hypoperfused if the corre-sponding CTP parameter was below one established threshold inthis region (Fig. 2). Parameter-specific cut-off values were obtained
from the test group (Fig. 1). For each parameter, a large range ofpossible cut-off values were defined and their performances wereassessed in terms of Youden index in a vessel-based analysis. Thebest threshold was defined as the one with the highest YoudenIndex. Further details on Appendices (A1, A2 and A3).
2.4. Statistical analysis
The Kolmogorov-Smirnov test was used to evaluate distributionnormality. Continuous demographic variables were expressed asmean � standard deviation (SD) if normally distributed and asmedian [first-third] non-adjusted quartiles otherwise. The Mann-Whitney U test was used with non-normal continuous variableswhereas Fisher’s exact test or bivariate logistic regression analysiswas applied for non-normal categorical variables.
Qualitative and quantitative approaches by single-energy CT orCT-based iodine imaging were compared in terms of accuracy, sen-sitivity, specificity, positive and negative predictive values (PPVand NPV, respectively), Youden index and the area under the recei-ver operating characteristic (ROC) curve (AUC). AUC(s) were com-pared using the approach of DeLong et al. [18]. All data arereported with 95% confidence intervals. Epidat (Xunta de Galicia,Spain; OPS-OMS; Universidad CES, Colombia) was used for theanalysis.
3. Results
3.1. Population description
Demographic and clinical characteristics of both test and vali-
dation groups are presented in Table 1. No significant differenceswere observed in patient characteristics and comorbidities. Allpatients completed the CTA/CTP protocol with no complications.
In the validation group, 8 (4.9%) LAD vessels showed significantcoronary stenosis (luminal reduction >70%) by ICA and 4 (2.5%)of these were also associated with at least one positive myocardialsegment on SPECT. Regarding LCX vessels, 7 (4.3%) showed >70%lumen narrowing by ICA and 5 (3%) of these were related to hypop-erfusion by SPECT. Significant stenosis in the RCA was found in 9cases (5.6%), 8 of which (4.9%) were associated with a perfusiondefect by SPECT (Table 1).
3.2. Cut-off values for quantitative perfusion parameters
The cut-off values for perfusion parameters to distinguishnormally-perfused from hypoperfused myocardial tissue were
determined in a randomly-selected test group of 30 patients(Appendices A3). The best-performing thresholds for TPR, MPRIand MA were 0.96, 23 and 0.5 for single-energy CT, and 0.97, 47and 0.3 for iodine images, respectively.

A. Ruiz-Muñoz, F. Valente, L. Dux-Santoy et al. IJC Heart & Vasculature 32 (2021) 100721
3.3. Myocardial perfusion analysis from single-energy CT
The diagnostic performance of CTA/CTP compared with
SPECT + ICA was assessed in the 54 patients forming the validation
group. The number of artefacts (motion artefacts, beam hardening,etc) identified through visual interpretation was minimal: only 3%of myocardial segments, which were excluded from the analyses.
3.3.1. Vessel-based analysisThe vessel-based diagnostic performance of CTA/CTP for
myocardial perfusion assessment with >70% of lumen narrowingto determine significant coronary stenosis and the use of single-energy CT images is shown in Table 2. Visual analysis proved tobe an effective and appropriate approach for detecting perfusiondefects with high performance in terms of accuracy and AUC.
TPR outperformed the visual method and the other quantitativeparameters, thereby providing the highest values of sensitivity,PPV and Youden index (Table 2). TPR resulted in the highest AUC[0.99 (0.98–1.00)] compared to that for the visual analysis [0.86(0.76–0.97); p = 0.025 from Delong‘s test], MPRI [0.95 (0.89–1.01); p = 0.291] and MA [0.98 (0.96–1.00); p = 0.521]. MPRIshowed the lowest sensitivity [94% (79–100)] and AUC [0.95(0.89–1.01)] among the other quantitative parameters, and TPRprovided the highest PPV [81% (62–100)]. Specificity, NPV andaccuracy were similar in all cases, although TPR and MA resultedin the highest Youden index and AUC (Table 2).
The diagnostic performance of per-vessel CTA/CTP strategy witha lumen narrowing of 50% to define significant coronary stenosis isshown in Table A2 (Appendices). Similar results than thoseobtained with the 70% threshold were found: myocardial perfusionassessment was feasible with visual analysis, although quantitativeanalysis with TPR yielded better results than visual interpretation[AUCs: 0.93 (0.86–0.98) vs. 0.86 (0.77–0.95), respectively;p = 0.264]. A case example showing myocardial perfusion assess-ment with TPR, MA and MPRI is shown in Fig. 3 (see Fig. 4).
3.3.2. Patient-based analysisThe patient-based diagnostic performance of CTA/CTP for
myocardial perfusion assessment with 70% coronary stenosis cut-off is shown in Table 3. Ischaemia assessment was feasible throughvisual interpretation of single-energy CT with high specificity, PPV,accuracy and AUC. TPR and MA proved to be the best-performingparameters in terms of sensitivity, Youden index and AUC (Table 3).Two false positives were found: one may be a false-negative ofSPECT and the other one as a result of the inhomogeneous distribu-tion of contrast. Youden index and AUC of TPR and MA were sub-stantially higher compared to visual analysis and MPRI (Table 3).
Table 2Performance of visual and quantitative myocardial perfusion vessel-based analysis by sing
Single-energy CT images
Visual analysis TPR MPRI MA [HU]
Threshold 0.96 23 0.5Sensitivity 76 (53–100) 100 (97–100) 94 (79–100) 100 (97–10Specificity 97 (93–100) 97 (94–100) 97 (93–100) 96 (92–99)PPV 72 (49–96) 81 (62–100) 76 (56–97) 74 (54–94)NPV 97 (94–100) 100 (99–100) 99 (98–100) 100 (99–10Accuracy 94 (91–98) 98 (95–100) 96 (93–100) 96 (93–100Youden Index 0.73 (0.53–0.93) 0.97 (0.95–1.00) 0.91 (0.79–1.02) 0.96 (0.93–0AUC on ROC 0.86 (0.76–0.97) 0.99 (0.98–1.00) 0.95 (0.89–1.01) 0.98 (0.96–1
Values are % (95% confidence interval).Abbreviations: AUC = area under the curve; CTA = Computed tomography angiographMPRI = myocardial perfusion reserve index; PPV and NPV = positive and negative predicperfusion ratio.
6
These results were not affected by the choice of the 50% or the70% coronary stenosis thresholds, the ones with the 50% are shownin Table A3 (Appendices).
3.4. Myocardial perfusion analysis from dual-energy CT-based iodineimaging
Dual-energy CT was only performed in 40 patients out of the 54
included in the validation group.
3.4.1. Vessel-based analysisThe vessel-based diagnostic performance of iodine-based CTA/
CTP strategy for myocardial perfusion assessment with a coronarystenosis threshold of 70% is presented in Table 2. The AUC obtainedwith visual analysis of iodine images were higher than thoseobtained with single-energy CT images [0.93 (0.84–1.02) vs. 0.86(0.76–0.97); p = 0.367].
TPR provided the best performance [AUC: 0.97 (0.95–0.99)]compared with visual method [AUC: 0.93 (0.84–1.02); p = 0.363],MA [AUC: 0.90 (0.81–1.00); p = 0.167] and MPRI [AUC: 0.94(0.87–1.01); p = 0.437] (Table 2). Although specificity and NPVwere similar among all approaches; visual method, MPRI and MAresulted in lower sensitivity, Youden index and AUC compared toTPR (Table 2).
The 70% or the 50% of lumen narrowing to determine significantcoronary stenosis did not affect the CTA/CTP performing results.Visual analysis on CT-based iodine images resulted in higher AUCcompared to that on single-energy CT images [0.89 (0.82–0.97)vs. 0.86 (0.77–0.95); p = 0.564] for the 50% coronary stenosisthreshold. TPR yielded higher Youden index and AUC than visualanalysis and the other quantitative parameters (Table A2Appendices).
3.4.2. Patient-based analysisThe patient-based diagnostic performance of iodine-based CTA/
CTP for myocardial perfusion assessment with 70% of coronarystenosis threshold are shown in Table 3. As in per-vessel analysis,TPR resulted to be the best-performing method. MPRI and MA per-formed the worst in terms of Youden index and AUC.
When a 50% of lumen narrowing was used to define significantcoronary stenosis, TPR resulted in higher sensitivity, Youden indexand AUC compared to MPRI and MA (Table A3 Appendices).
4. Discussion
In patients with or without suspicion of CAD, a single CT exam-ination including CTA and CTP has proven to be effective for detect-
le- and dual-energy CT.
CT-based iodine images
Visual analysis TPR MPRI MA [mg/mL]
0.97 47 0.30) 87 (66–100) 100 (97–100) 93 (77–100) 87 (66–100)
99 (97–100) 94 (89–99) 95 (91–100) 94 (89–99)93 (76–100) 71 (50–93) 74 (51–96) 68 (45–92)
0) 98 (95–100) 100 (99–100) 99 (97–100) 98 (95–100)) 97 (94–100) 95 (91–99) 95 (91–99) 93 (88–98).99) 0.86 (0.68–1.03) 0.94 (0.90–0.99) 0.89 (0.75–1.02) 0.81 (0.63–0.99).00) 0.93 (0.84–1.02) 0.97 (0.95–0.99) 0.94 (0.87–1.01) 0.90 (0.81–1.00)
y; CT = Computed tomography; HU = Hounsfield Units; MA = mean attenuation;tive values, respectively; ROC = receiver-operating characteristic; TPR = transmural
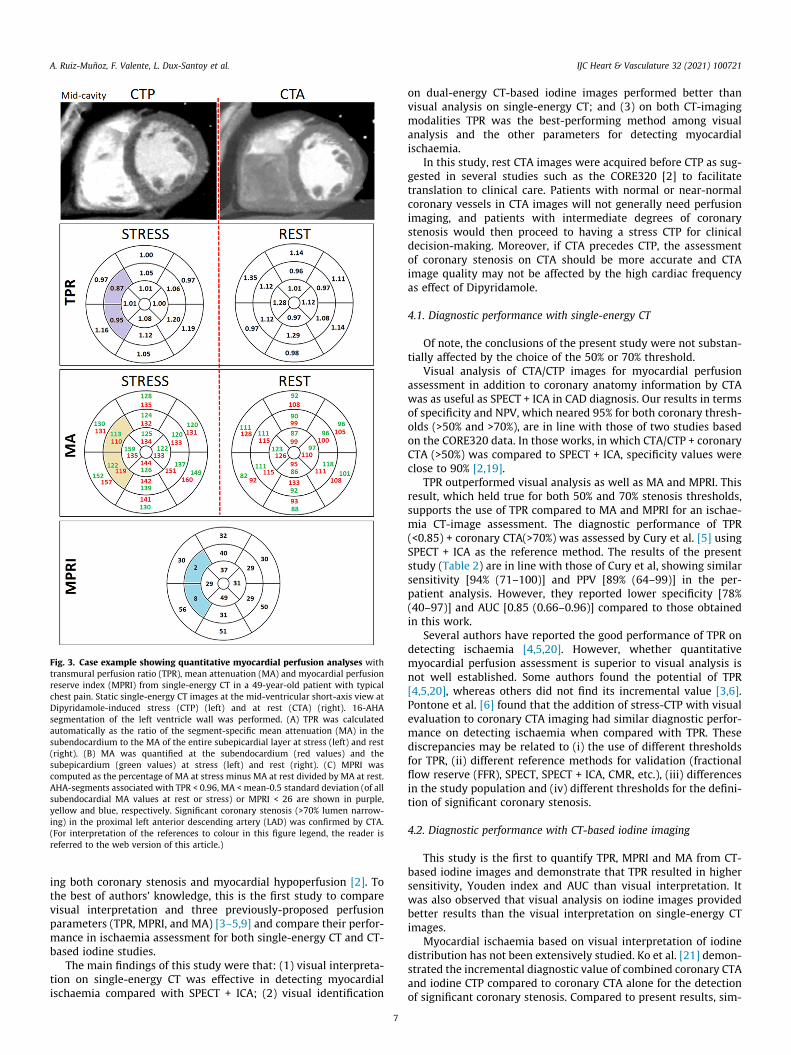
Fig. 3. Case example showing quantitative myocardial perfusion analyses withtransmural perfusion ratio (TPR), mean attenuation (MA) and myocardial perfusionreserve index (MPRI) from single-energy CT in a 49-year-old patient with typicalchest pain. Static single-energy CT images at the mid-ventricular short-axis view atDipyridamole-induced stress (CTP) (left) and at rest (CTA) (right). 16-AHAsegmentation of the left ventricle wall was performed. (A) TPR was calculatedautomatically as the ratio of the segment-specific mean attenuation (MA) in thesubendocardium to the MA of the entire subepicardial layer at stress (left) and rest(right). (B) MA was quantified at the subendocardium (red values) and thesubepicardium (green values) at stress (left) and rest (right). (C) MPRI wascomputed as the percentage of MA at stress minus MA at rest divided by MA at rest.AHA-segments associated with TPR < 0.96, MA <mean-0.5�standard deviation (of allsubendocardial MA values at rest or stress) or MPRI < 26 are shown in purple,yellow and blue, respectively. Significant coronary stenosis (>70% lumen narrow-ing) in the proximal left anterior descending artery (LAD) was confirmed by CTA.(For interpretation of the references to colour in this figure legend, the reader isreferred to the web version of this article.)
A. Ruiz-Muñoz, F. Valente, L. Dux-Santoy et al. IJC Heart & Vasculature 32 (2021) 100721
ing both coronary stenosis and myocardial hypoperfusion [2]. Tothe best of authors’ knowledge, this is the first study to comparevisual interpretation and three previously-proposed perfusionparameters (TPR, MPRI, and MA) [3–5,9] and compare their perfor-mance in ischaemia assessment for both single-energy CT and CT-based iodine studies.
The main findings of this study were that: (1) visual interpreta-tion on single-energy CT was effective in detecting myocardialischaemia compared with SPECT + ICA; (2) visual identification
7
on dual-energy CT-based iodine images performed better thanvisual analysis on single-energy CT; and (3) on both CT-imagingmodalities TPR was the best-performing method among visualanalysis and the other parameters for detecting myocardialischaemia.
In this study, rest CTA images were acquired before CTP as sug-gested in several studies such as the CORE320 [2] to facilitatetranslation to clinical care. Patients with normal or near-normalcoronary vessels in CTA images will not generally need perfusionimaging, and patients with intermediate degrees of coronarystenosis would then proceed to having a stress CTP for clinicaldecision-making. Moreover, if CTA precedes CTP, the assessmentof coronary stenosis on CTA should be more accurate and CTAimage quality may not be affected by the high cardiac frequencyas effect of Dipyridamole.
4.1. Diagnostic performance with single-energy CT
Of note, the conclusions of the present study were not substan-tially affected by the choice of the 50% or 70% threshold.
Visual analysis of CTA/CTP images for myocardial perfusionassessment in addition to coronary anatomy information by CTAwas as useful as SPECT + ICA in CAD diagnosis. Our results in termsof specificity and NPV, which neared 95% for both coronary thresh-olds (>50% and >70%), are in line with those of two studies basedon the CORE320 data. In those works, in which CTA/CTP + coronaryCTA (>50%) was compared to SPECT + ICA, specificity values wereclose to 90% [2,19].
TPR outperformed visual analysis as well as MA and MPRI. Thisresult, which held true for both 50% and 70% stenosis thresholds,supports the use of TPR compared to MA and MPRI for an ischae-mia CT-image assessment. The diagnostic performance of TPR(<0.85) + coronary CTA(>70%) was assessed by Cury et al. [5] usingSPECT + ICA as the reference method. The results of the presentstudy (Table 2) are in line with those of Cury et al, showing similarsensitivity [94% (71–100)] and PPV [89% (64–99)] in the per-patient analysis. However, they reported lower specificity [78%(40–97)] and AUC [0.85 (0.66–0.96)] compared to those obtainedin this work.
Several authors have reported the good performance of TPR ondetecting ischaemia [4,5,20]. However, whether quantitativemyocardial perfusion assessment is superior to visual analysis isnot well established. Some authors found the potential of TPR[4,5,20], whereas others did not find its incremental value [3,6].Pontone et al. [6] found that the addition of stress-CTP with visualevaluation to coronary CTA imaging had similar diagnostic perfor-mance on detecting ischaemia when compared with TPR. Thesediscrepancies may be related to (i) the use of different thresholdsfor TPR, (ii) different reference methods for validation (fractionalflow reserve (FFR), SPECT, SPECT + ICA, CMR, etc.), (iii) differencesin the study population and (iv) different thresholds for the defini-tion of significant coronary stenosis.
4.2. Diagnostic performance with CT-based iodine imaging
This study is the first to quantify TPR, MPRI and MA from CT-based iodine images and demonstrate that TPR resulted in highersensitivity, Youden index and AUC than visual interpretation. Itwas also observed that visual analysis on iodine images providedbetter results than the visual interpretation on single-energy CTimages.
Myocardial ischaemia based on visual interpretation of iodinedistribution has not been extensively studied. Ko et al. [21] demon-strated the incremental diagnostic value of combined coronary CTAand iodine CTP compared to coronary CTA alone for the detectionof significant coronary stenosis. Compared to present results, sim-
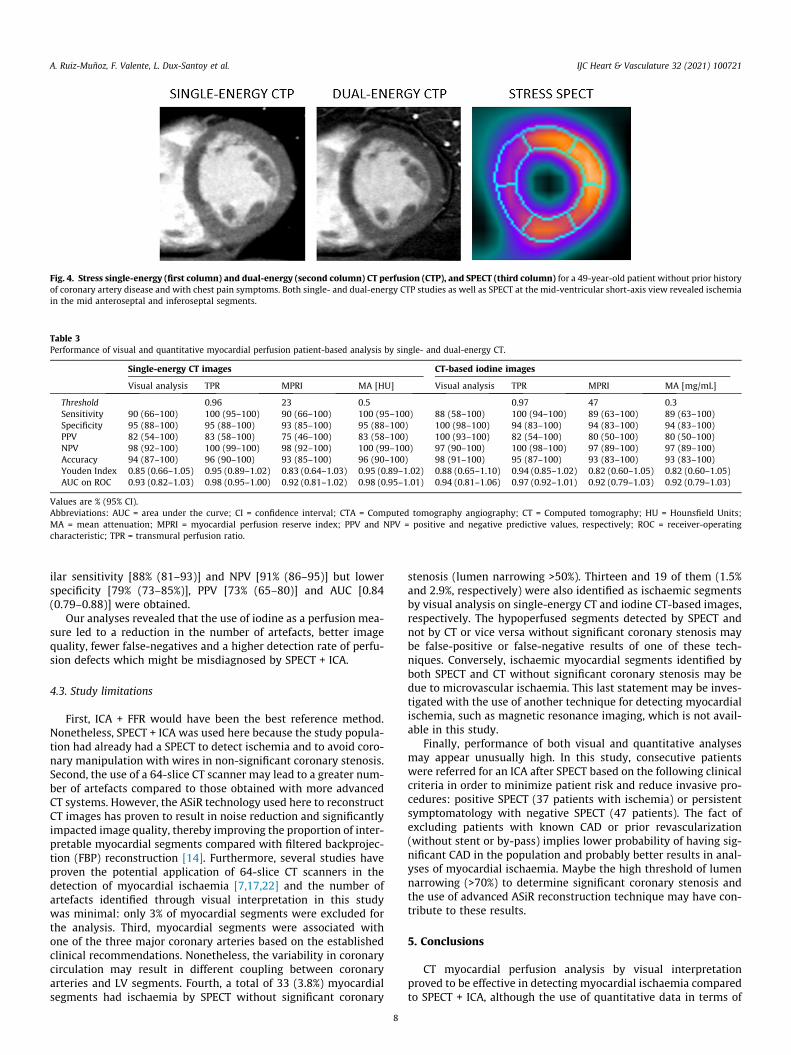
Fig. 4. Stress single-energy (first column) and dual-energy (second column) CT perfusion (CTP), and SPECT (third column) for a 49-year-old patient without prior historyof coronary artery disease and with chest pain symptoms. Both single- and dual-energy CTP studies as well as SPECT at the mid-ventricular short-axis view revealed ischemiain the mid anteroseptal and inferoseptal segments.
Table 3Performance of visual and quantitative myocardial perfusion patient-based analysis by single- and dual-energy CT.
Single-energy CT images CT-based iodine images
Visual analysis TPR MPRI MA [HU] Visual analysis TPR MPRI MA [mg/mL]
Threshold 0.96 23 0.5 0.97 47 0.3Sensitivity 90 (66–100) 100 (95–100) 90 (66–100) 100 (95–100) 88 (58–100) 100 (94–100) 89 (63–100) 89 (63–100)Specificity 95 (88–100) 95 (88–100) 93 (85–100) 95 (88–100) 100 (98–100) 94 (83–100) 94 (83–100) 94 (83–100)PPV 82 (54–100) 83 (58–100) 75 (46–100) 83 (58–100) 100 (93–100) 82 (54–100) 80 (50–100) 80 (50–100)NPV 98 (92–100) 100 (99–100) 98 (92–100) 100 (99–100) 97 (90–100) 100 (98–100) 97 (89–100) 97 (89–100)Accuracy 94 (87–100) 96 (90–100) 93 (85–100) 96 (90–100) 98 (91–100) 95 (87–100) 93 (83–100) 93 (83–100)Youden Index 0.85 (0.66–1.05) 0.95 (0.89–1.02) 0.83 (0.64–1.03) 0.95 (0.89–1.02) 0.88 (0.65–1.10) 0.94 (0.85–1.02) 0.82 (0.60–1.05) 0.82 (0.60–1.05)AUC on ROC 0.93 (0.82–1.03) 0.98 (0.95–1.00) 0.92 (0.81–1.02) 0.98 (0.95–1.01) 0.94 (0.81–1.06) 0.97 (0.92–1.01) 0.92 (0.79–1.03) 0.92 (0.79–1.03)
Values are % (95% CI).Abbreviations: AUC = area under the curve; CI = confidence interval; CTA = Computed tomography angiography; CT = Computed tomography; HU = Hounsfield Units;MA = mean attenuation; MPRI = myocardial perfusion reserve index; PPV and NPV = positive and negative predictive values, respectively; ROC = receiver-operatingcharacteristic; TPR = transmural perfusion ratio.
A. Ruiz-Muñoz, F. Valente, L. Dux-Santoy et al. IJC Heart & Vasculature 32 (2021) 100721
ilar sensitivity [88% (81–93)] and NPV [91% (86–95)] but lowerspecificity [79% (73–85%)], PPV [73% (65–80)] and AUC [0.84(0.79–0.88)] were obtained.
Our analyses revealed that the use of iodine as a perfusion mea-sure led to a reduction in the number of artefacts, better imagequality, fewer false-negatives and a higher detection rate of perfu-sion defects which might be misdiagnosed by SPECT + ICA.
4.3. Study limitations
First, ICA + FFR would have been the best reference method.Nonetheless, SPECT + ICA was used here because the study popula-tion had already had a SPECT to detect ischemia and to avoid coro-nary manipulation with wires in non-significant coronary stenosis.Second, the use of a 64-slice CT scanner may lead to a greater num-ber of artefacts compared to those obtained with more advancedCT systems. However, the ASiR technology used here to reconstructCT images has proven to result in noise reduction and significantlyimpacted image quality, thereby improving the proportion of inter-pretable myocardial segments compared with filtered backprojec-tion (FBP) reconstruction [14]. Furthermore, several studies haveproven the potential application of 64-slice CT scanners in thedetection of myocardial ischaemia [7,17,22] and the number ofartefacts identified through visual interpretation in this studywas minimal: only 3% of myocardial segments were excluded forthe analysis. Third, myocardial segments were associated withone of the three major coronary arteries based on the establishedclinical recommendations. Nonetheless, the variability in coronarycirculation may result in different coupling between coronaryarteries and LV segments. Fourth, a total of 33 (3.8%) myocardialsegments had ischaemia by SPECT without significant coronary
8
stenosis (lumen narrowing >50%). Thirteen and 19 of them (1.5%and 2.9%, respectively) were also identified as ischaemic segmentsby visual analysis on single-energy CT and iodine CT-based images,respectively. The hypoperfused segments detected by SPECT andnot by CT or vice versa without significant coronary stenosis maybe false-positive or false-negative results of one of these tech-niques. Conversely, ischaemic myocardial segments identified byboth SPECT and CT without significant coronary stenosis may bedue to microvascular ischaemia. This last statement may be inves-tigated with the use of another technique for detecting myocardialischemia, such as magnetic resonance imaging, which is not avail-able in this study.
Finally, performance of both visual and quantitative analysesmay appear unusually high. In this study, consecutive patientswere referred for an ICA after SPECT based on the following clinicalcriteria in order to minimize patient risk and reduce invasive pro-cedures: positive SPECT (37 patients with ischemia) or persistentsymptomatology with negative SPECT (47 patients). The fact ofexcluding patients with known CAD or prior revascularization(without stent or by-pass) implies lower probability of having sig-nificant CAD in the population and probably better results in anal-yses of myocardial ischaemia. Maybe the high threshold of lumennarrowing (>70%) to determine significant coronary stenosis andthe use of advanced ASiR reconstruction technique may have con-tribute to these results.
5. Conclusions
CT myocardial perfusion analysis by visual interpretationproved to be effective in detecting myocardial ischaemia comparedto SPECT + ICA, although the use of quantitative data in terms of
A. Ruiz-Muñoz, F. Valente, L. Dux-Santoy et al. IJC Heart & Vasculature 32 (2021) 100721
TPR improves its detection. However, visual interpretation ofmyocardial perfusion on dual-energy CT-based iodine images out-performs visual analysis on single-energy CT, thereby being lessnecessary the use of quantitative methods in this case.
Declaration of Competing Interest
The authors declare that they have no known competing finan-cial interests or personal relationships that could have appearedto influence the work reported in this paper.
Appendix A
A1. AHA segmentation of the left ventricle
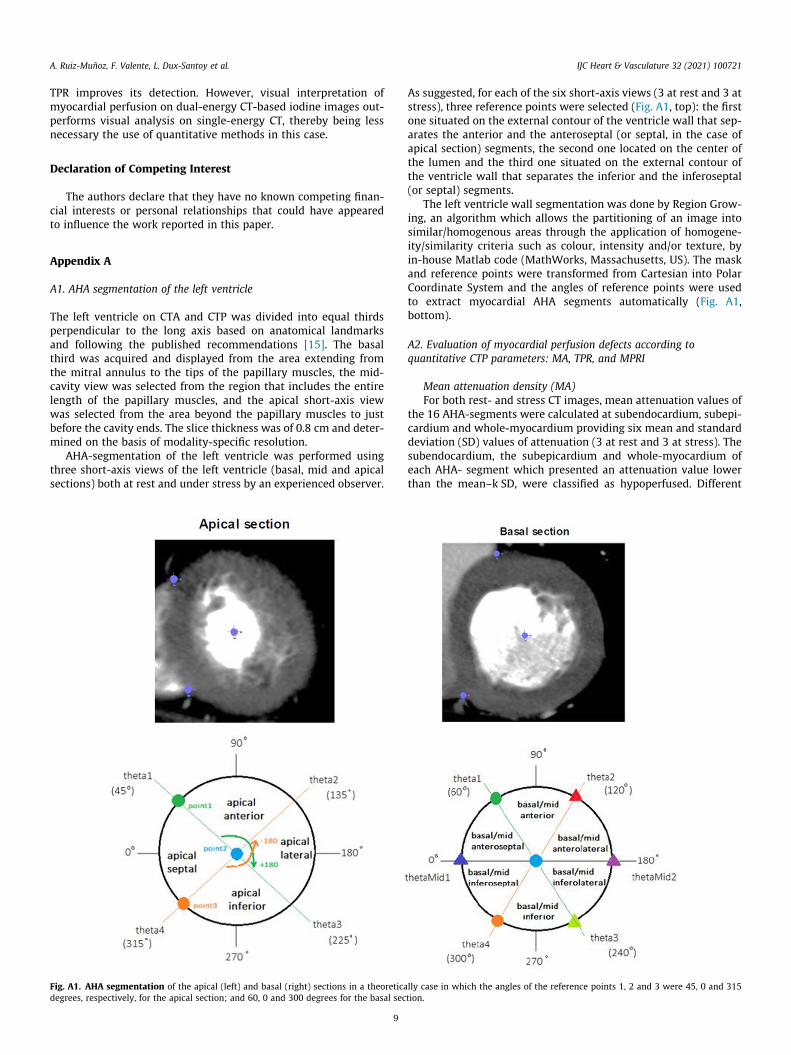
The left ventricle on CTA and CTP was divided into equal thirdsperpendicular to the long axis based on anatomical landmarksand following the published recommendations [15]. The basalthird was acquired and displayed from the area extending fromthe mitral annulus to the tips of the papillary muscles, the mid-cavity view was selected from the region that includes the entirelength of the papillary muscles, and the apical short-axis viewwas selected from the area beyond the papillary muscles to justbefore the cavity ends. The slice thickness was of 0.8 cm and deter-mined on the basis of modality-specific resolution.
AHA-segmentation of the left ventricle was performed usingthree short-axis views of the left ventricle (basal, mid and apicalsections) both at rest and under stress by an experienced observer.
Fig. A1. AHA segmentation of the apical (left) and basal (right) sections in a theoreticadegrees, respectively, for the apical section; and 60, 0 and 300 degrees for the basal sec
9
As suggested, for each of the six short-axis views (3 at rest and 3 atstress), three reference points were selected (Fig. A1, top): the firstone situated on the external contour of the ventricle wall that sep-arates the anterior and the anteroseptal (or septal, in the case ofapical section) segments, the second one located on the center ofthe lumen and the third one situated on the external contour ofthe ventricle wall that separates the inferior and the inferoseptal(or septal) segments.
The left ventricle wall segmentation was done by Region Grow-ing, an algorithm which allows the partitioning of an image intosimilar/homogenous areas through the application of homogene-ity/similarity criteria such as colour, intensity and/or texture, byin-house Matlab code (MathWorks, Massachusetts, US). The maskand reference points were transformed from Cartesian into PolarCoordinate System and the angles of reference points were usedto extract myocardial AHA segments automatically (Fig. A1,bottom).
A2. Evaluation of myocardial perfusion defects according toquantitative CTP parameters: MA, TPR, and MPRI
Mean attenuation density (MA)For both rest- and stress CT images, mean attenuation values of
the 16 AHA-segments were calculated at subendocardium, subepi-cardium and whole-myocardium providing six mean and standarddeviation (SD) values of attenuation (3 at rest and 3 at stress). Thesubendocardium, the subepicardium and whole-myocardium ofeach AHA- segment which presented an attenuation value lowerthan the mean–k�SD, were classified as hypoperfused. Different
lly case in which the angles of the reference points 1, 2 and 3 were 45, 0 and 315tion.
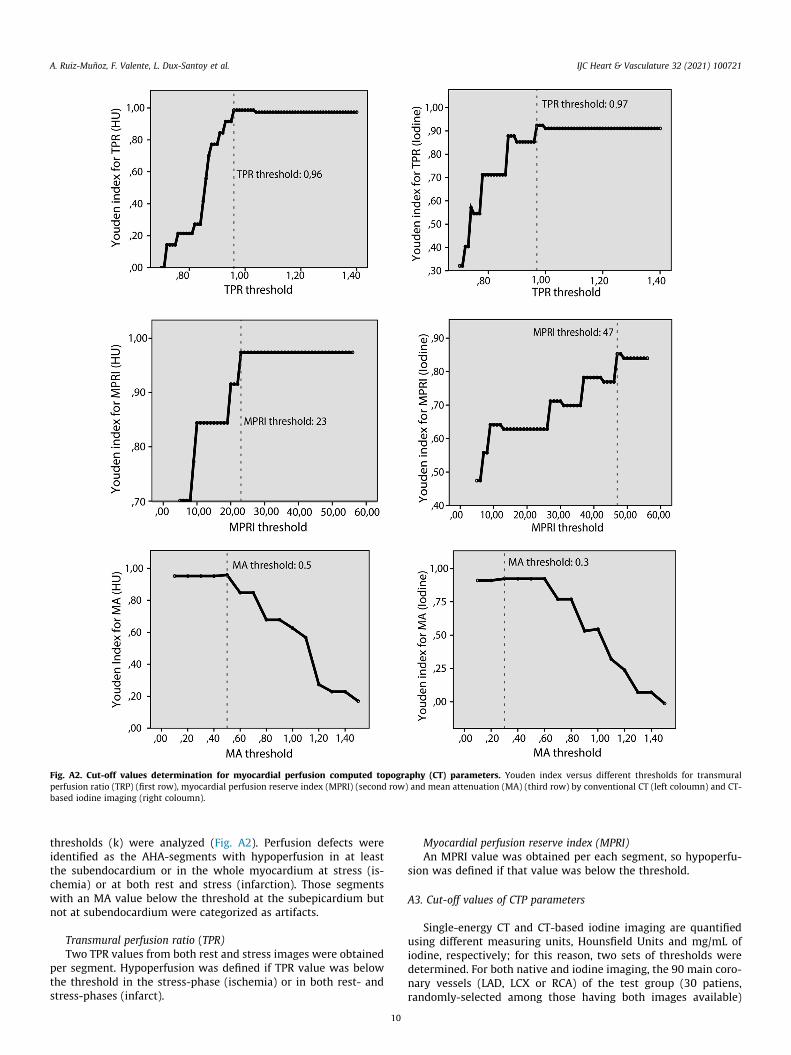
Fig. A2. Cut-off values determination for myocardial perfusion computed topography (CT) parameters. Youden index versus different thresholds for transmuralperfusion ratio (TRP) (first row), myocardial perfusion reserve index (MPRI) (second row) and mean attenuation (MA) (third row) by conventional CT (left coloumn) and CT-based iodine imaging (right coloumn).
A. Ruiz-Muñoz, F. Valente, L. Dux-Santoy et al. IJC Heart & Vasculature 32 (2021) 100721
thresholds (k) were analyzed (Fig. A2). Perfusion defects wereidentified as the AHA-segments with hypoperfusion in at leastthe subendocardium or in the whole myocardium at stress (is-chemia) or at both rest and stress (infarction). Those segmentswith an MA value below the threshold at the subepicardium butnot at subendocardium were categorized as artifacts.
Transmural perfusion ratio (TPR)Two TPR values from both rest and stress images were obtained
per segment. Hypoperfusion was defined if TPR value was belowthe threshold in the stress-phase (ischemia) or in both rest- andstress-phases (infarct).
10
Myocardial perfusion reserve index (MPRI)An MPRI value was obtained per each segment, so hypoperfu-
sion was defined if that value was below the threshold.
A3. Cut-off values of CTP parameters
Single-energy CT and CT-based iodine imaging are quantifiedusing different measuring units, Hounsfield Units and mg/mL ofiodine, respectively; for this reason, two sets of thresholds weredetermined. For both native and iodine imaging, the 90 main coro-nary vessels (LAD, LCX or RCA) of the test group (30 patiens,randomly-selected among those having both images available)
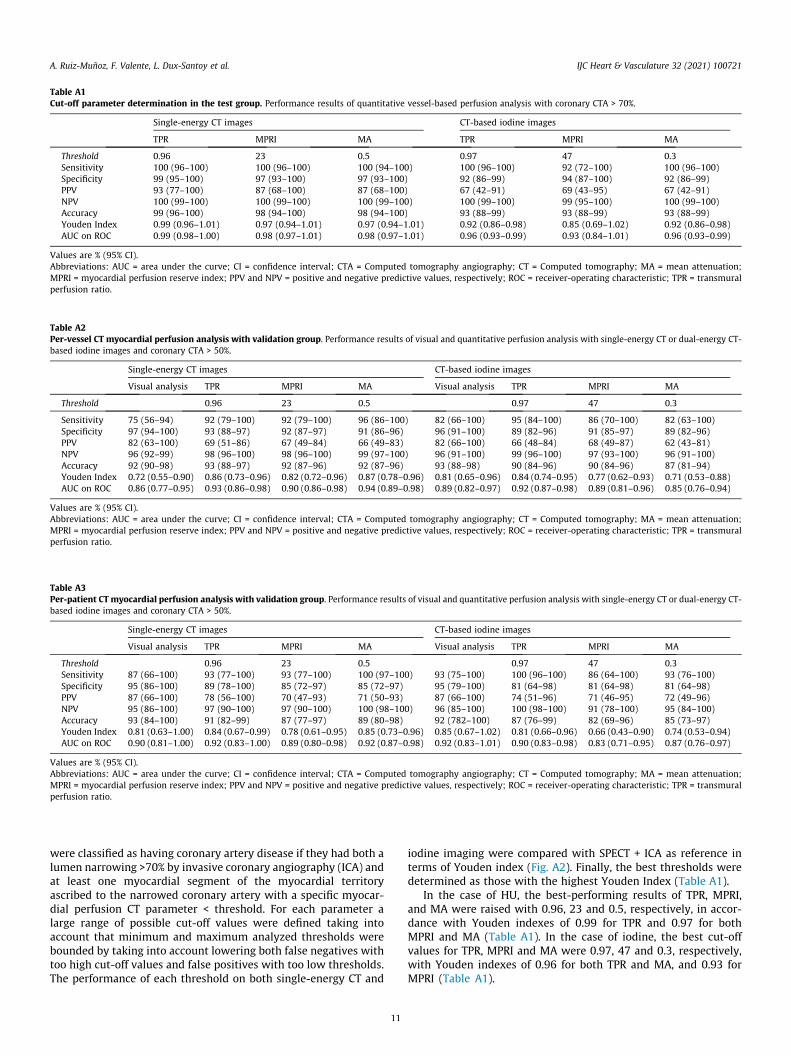
Table A1Cut-off parameter determination in the test group. Performance results of quantitative vessel-based perfusion analysis with coronary CTA > 70%.
Single-energy CT images CT-based iodine images
TPR MPRI MA TPR MPRI MA
Threshold 0.96 23 0.5 0.97 47 0.3Sensitivity 100 (96–100) 100 (96–100) 100 (94–100) 100 (96–100) 92 (72–100) 100 (96–100)Specificity 99 (95–100) 97 (93–100) 97 (93–100) 92 (86–99) 94 (87–100) 92 (86–99)PPV 93 (77–100) 87 (68–100) 87 (68–100) 67 (42–91) 69 (43–95) 67 (42–91)NPV 100 (99–100) 100 (99–100) 100 (99–100) 100 (99–100) 99 (95–100) 100 (99–100)Accuracy 99 (96–100) 98 (94–100) 98 (94–100) 93 (88–99) 93 (88–99) 93 (88–99)Youden Index 0.99 (0.96–1.01) 0.97 (0.94–1.01) 0.97 (0.94–1.01) 0.92 (0.86–0.98) 0.85 (0.69–1.02) 0.92 (0.86–0.98)AUC on ROC 0.99 (0.98–1.00) 0.98 (0.97–1.01) 0.98 (0.97–1.01) 0.96 (0.93–0.99) 0.93 (0.84–1.01) 0.96 (0.93–0.99)
Values are % (95% CI).Abbreviations: AUC = area under the curve; CI = confidence interval; CTA = Computed tomography angiography; CT = Computed tomography; MA = mean attenuation;MPRI = myocardial perfusion reserve index; PPV and NPV = positive and negative predictive values, respectively; ROC = receiver-operating characteristic; TPR = transmuralperfusion ratio.
Table A2Per-vessel CT myocardial perfusion analysis with validation group. Performance results of visual and quantitative perfusion analysis with single-energy CT or dual-energy CT-based iodine images and coronary CTA > 50%.
Single-energy CT images CT-based iodine images
Visual analysis TPR MPRI MA Visual analysis TPR MPRI MA
Threshold 0.96 23 0.5 0.97 47 0.3
Sensitivity 75 (56–94) 92 (79–100) 92 (79–100) 96 (86–100) 82 (66–100) 95 (84–100) 86 (70–100) 82 (63–100)Specificity 97 (94–100) 93 (88–97) 92 (87–97) 91 (86–96) 96 (91–100) 89 (82–96) 91 (85–97) 89 (82–96)PPV 82 (63–100) 69 (51–86) 67 (49–84) 66 (49–83) 82 (66–100) 66 (48–84) 68 (49–87) 62 (43–81)NPV 96 (92–99) 98 (96–100) 98 (96–100) 99 (97–100) 96 (91–100) 99 (96–100) 97 (93–100) 96 (91–100)Accuracy 92 (90–98) 93 (88–97) 92 (87–96) 92 (87–96) 93 (88–98) 90 (84–96) 90 (84–96) 87 (81–94)Youden Index 0.72 (0.55–0.90) 0.86 (0.73–0.96) 0.82 (0.72–0.96) 0.87 (0.78–0.96) 0.81 (0.65–0.96) 0.84 (0.74–0.95) 0.77 (0.62–0.93) 0.71 (0.53–0.88)AUC on ROC 0.86 (0.77–0.95) 0.93 (0.86–0.98) 0.90 (0.86–0.98) 0.94 (0.89–0.98) 0.89 (0.82–0.97) 0.92 (0.87–0.98) 0.89 (0.81–0.96) 0.85 (0.76–0.94)
Values are % (95% CI).Abbreviations: AUC = area under the curve; CI = confidence interval; CTA = Computed tomography angiography; CT = Computed tomography; MA = mean attenuation;MPRI = myocardial perfusion reserve index; PPV and NPV = positive and negative predictive values, respectively; ROC = receiver-operating characteristic; TPR = transmuralperfusion ratio.
Table A3Per-patient CT myocardial perfusion analysis with validation group. Performance results of visual and quantitative perfusion analysis with single-energy CT or dual-energy CT-based iodine images and coronary CTA > 50%.
Single-energy CT images CT-based iodine images
Visual analysis TPR MPRI MA Visual analysis TPR MPRI MA
Threshold 0.96 23 0.5 0.97 47 0.3Sensitivity 87 (66–100) 93 (77–100) 93 (77–100) 100 (97–100) 93 (75–100) 100 (96–100) 86 (64–100) 93 (76–100)Specificity 95 (86–100) 89 (78–100) 85 (72–97) 85 (72–97) 95 (79–100) 81 (64–98) 81 (64–98) 81 (64–98)PPV 87 (66–100) 78 (56–100) 70 (47–93) 71 (50–93) 87 (66–100) 74 (51–96) 71 (46–95) 72 (49–96)NPV 95 (86–100) 97 (90–100) 97 (90–100) 100 (98–100) 96 (85–100) 100 (98–100) 91 (78–100) 95 (84–100)Accuracy 93 (84–100) 91 (82–99) 87 (77–97) 89 (80–98) 92 (782–100) 87 (76–99) 82 (69–96) 85 (73–97)Youden Index 0.81 (0.63–1.00) 0.84 (0.67–0.99) 0.78 (0.61–0.95) 0.85 (0.73–0.96) 0.85 (0.67–1.02) 0.81 (0.66–0.96) 0.66 (0.43–0.90) 0.74 (0.53–0.94)AUC on ROC 0.90 (0.81–1.00) 0.92 (0.83–1.00) 0.89 (0.80–0.98) 0.92 (0.87–0.98) 0.92 (0.83–1.01) 0.90 (0.83–0.98) 0.83 (0.71–0.95) 0.87 (0.76–0.97)
Values are % (95% CI).Abbreviations: AUC = area under the curve; CI = confidence interval; CTA = Computed tomography angiography; CT = Computed tomography; MA = mean attenuation;MPRI = myocardial perfusion reserve index; PPV and NPV = positive and negative predictive values, respectively; ROC = receiver-operating characteristic; TPR = transmuralperfusion ratio.
A. Ruiz-Muñoz, F. Valente, L. Dux-Santoy et al. IJC Heart & Vasculature 32 (2021) 100721
were classified as having coronary artery disease if they had both alumen narrowing >70% by invasive coronary angiography (ICA) andat least one myocardial segment of the myocardial territoryascribed to the narrowed coronary artery with a specific myocar-dial perfusion CT parameter < threshold. For each parameter alarge range of possible cut-off values were defined taking intoaccount that minimum and maximum analyzed thresholds werebounded by taking into account lowering both false negatives withtoo high cut-off values and false positives with too low thresholds.The performance of each threshold on both single-energy CT and
11
iodine imaging were compared with SPECT + ICA as reference interms of Youden index (Fig. A2). Finally, the best thresholds weredetermined as those with the highest Youden Index (Table A1).
In the case of HU, the best-performing results of TPR, MPRI,and MA were raised with 0.96, 23 and 0.5, respectively, in accor-dance with Youden indexes of 0.99 for TPR and 0.97 for bothMPRI and MA (Table A1). In the case of iodine, the best cut-offvalues for TPR, MPRI and MA were 0.97, 47 and 0.3, respectively,with Youden indexes of 0.96 for both TPR and MA, and 0.93 forMPRI (Table A1).
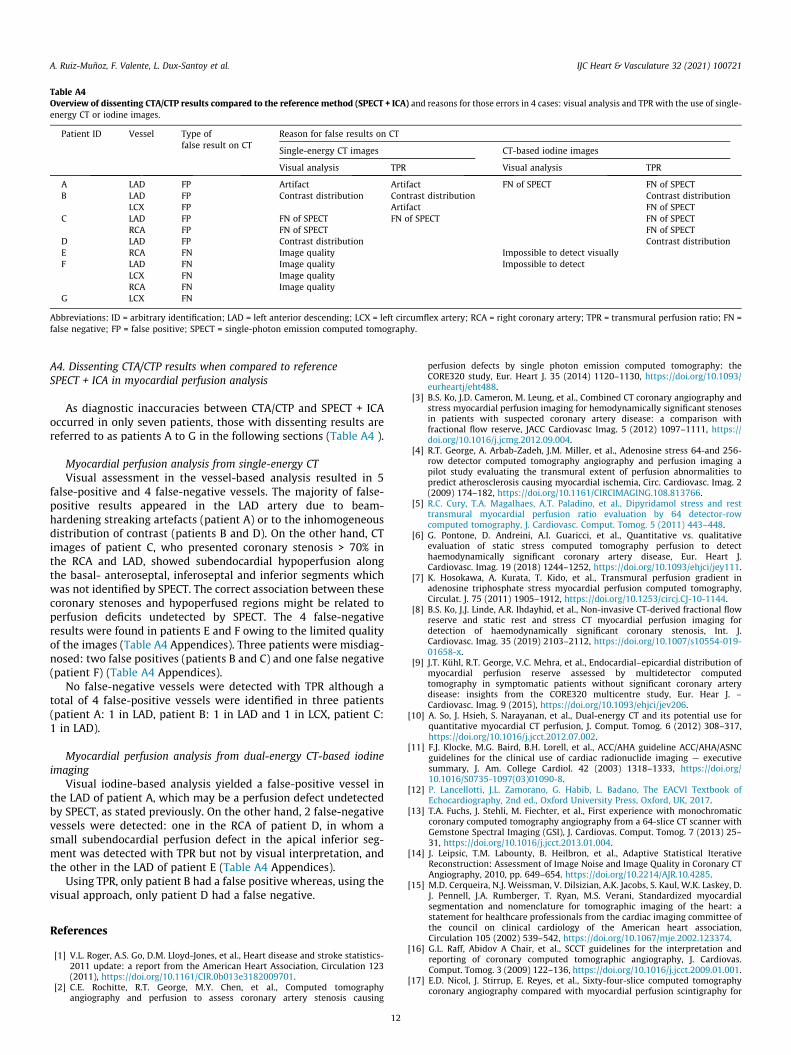
Table A4Overview of dissenting CTA/CTP results compared to the reference method (SPECT + ICA) and reasons for those errors in 4 cases: visual analysis and TPR with the use of single-energy CT or iodine images.
Patient ID Vessel Type offalse result on CT
Reason for false results on CT
Single-energy CT images CT-based iodine images
Visual analysis TPR Visual analysis TPR
A LAD FP Artifact Artifact FN of SPECT FN of SPECTB LAD FP Contrast distribution Contrast distribution Contrast distribution
LCX FP Artifact FN of SPECTC LAD FP FN of SPECT FN of SPECT FN of SPECT
RCA FP FN of SPECT FN of SPECTD LAD FP Contrast distribution Contrast distributionE RCA FN Image quality Impossible to detect visuallyF LAD FN Image quality Impossible to detect
LCX FN Image qualityRCA FN Image quality
G LCX FN
Abbreviations: ID = arbitrary identification; LAD = left anterior descending; LCX = left circumflex artery; RCA = right coronary artery; TPR = transmural perfusion ratio; FN =false negative; FP = false positive; SPECT = single-photon emission computed tomography.
A. Ruiz-Muñoz, F. Valente, L. Dux-Santoy et al. IJC Heart & Vasculature 32 (2021) 100721
A4. Dissenting CTA/CTP results when compared to referenceSPECT + ICA in myocardial perfusion analysis
As diagnostic inaccuracies between CTA/CTP and SPECT + ICAoccurred in only seven patients, those with dissenting results arereferred to as patients A to G in the following sections (Table A4 ).
Myocardial perfusion analysis from single-energy CTVisual assessment in the vessel-based analysis resulted in 5
false-positive and 4 false-negative vessels. The majority of false-positive results appeared in the LAD artery due to beam-hardening streaking artefacts (patient A) or to the inhomogeneousdistribution of contrast (patients B and D). On the other hand, CTimages of patient C, who presented coronary stenosis > 70% inthe RCA and LAD, showed subendocardial hypoperfusion alongthe basal- anteroseptal, inferoseptal and inferior segments whichwas not identified by SPECT. The correct association between thesecoronary stenoses and hypoperfused regions might be related toperfusion deficits undetected by SPECT. The 4 false-negativeresults were found in patients E and F owing to the limited qualityof the images (Table A4 Appendices). Three patients were misdiag-nosed: two false positives (patients B and C) and one false negative(patient F) (Table A4 Appendices).
No false-negative vessels were detected with TPR although atotal of 4 false-positive vessels were identified in three patients(patient A: 1 in LAD, patient B: 1 in LAD and 1 in LCX, patient C:1 in LAD).
Myocardial perfusion analysis from dual-energy CT-based iodineimaging
Visual iodine-based analysis yielded a false-positive vessel inthe LAD of patient A, which may be a perfusion defect undetectedby SPECT, as stated previously. On the other hand, 2 false-negativevessels were detected: one in the RCA of patient D, in whom asmall subendocardial perfusion defect in the apical inferior seg-ment was detected with TPR but not by visual interpretation, andthe other in the LAD of patient E (Table A4 Appendices).
Using TPR, only patient B had a false positive whereas, using thevisual approach, only patient D had a false negative.
References
[1] V.L. Roger, A.S. Go, D.M. Lloyd-Jones, et al., Heart disease and stroke statistics-2011 update: a report from the American Heart Association, Circulation 123(2011), https://doi.org/10.1161/CIR.0b013e3182009701.
[2] C.E. Rochitte, R.T. George, M.Y. Chen, et al., Computed tomographyangiography and perfusion to assess coronary artery stenosis causing
12
perfusion defects by single photon emission computed tomography: theCORE320 study, Eur. Heart J. 35 (2014) 1120–1130, https://doi.org/10.1093/eurheartj/eht488.
[3] B.S. Ko, J.D. Cameron, M. Leung, et al., Combined CT coronary angiography andstress myocardial perfusion imaging for hemodynamically significant stenosesin patients with suspected coronary artery disease: a comparison withfractional flow reserve, JACC Cardiovasc Imag. 5 (2012) 1097–1111, https://doi.org/10.1016/j.jcmg.2012.09.004.
[4] R.T. George, A. Arbab-Zadeh, J.M. Miller, et al., Adenosine stress 64-and 256-row detector computed tomography angiography and perfusion imaging apilot study evaluating the transmural extent of perfusion abnormalities topredict atherosclerosis causing myocardial ischemia, Circ. Cardiovasc. Imag. 2(2009) 174–182, https://doi.org/10.1161/CIRCIMAGING.108.813766.
[5] R.C. Cury, T.A. Magalhaes, A.T. Paladino, et al., Dipyridamol stress and resttransmural myocardial perfusion ratio evaluation by 64 detector-rowcomputed tomography, J. Cardiovasc. Comput. Tomog. 5 (2011) 443–448.
[6] G. Pontone, D. Andreini, A.I. Guaricci, et al., Quantitative vs. qualitativeevaluation of static stress computed tomography perfusion to detecthaemodynamically significant coronary artery disease, Eur. Heart J.Cardiovasc. Imag. 19 (2018) 1244–1252, https://doi.org/10.1093/ehjci/jey111.
[7] K. Hosokawa, A. Kurata, T. Kido, et al., Transmural perfusion gradient inadenosine triphosphate stress myocardial perfusion computed tomography,Circulat. J. 75 (2011) 1905–1912, https://doi.org/10.1253/circj.CJ-10-1144.
[8] B.S. Ko, J.J. Linde, A.R. Ihdayhid, et al., Non-invasive CT-derived fractional flowreserve and static rest and stress CT myocardial perfusion imaging fordetection of haemodynamically significant coronary stenosis, Int. J.Cardiovasc. Imag. 35 (2019) 2103–2112, https://doi.org/10.1007/s10554-019-01658-x.
[9] J.T. Kühl, R.T. George, V.C. Mehra, et al., Endocardial–epicardial distribution ofmyocardial perfusion reserve assessed by multidetector computedtomography in symptomatic patients without significant coronary arterydisease: insights from the CORE320 multicentre study, Eur. Hear J. –Cardiovasc. Imag. 9 (2015), https://doi.org/10.1093/ehjci/jev206.
[10] A. So, J. Hsieh, S. Narayanan, et al., Dual-energy CT and its potential use forquantitative myocardial CT perfusion, J. Comput. Tomog. 6 (2012) 308–317,https://doi.org/10.1016/j.jcct.2012.07.002.
[11] F.J. Klocke, M.G. Baird, B.H. Lorell, et al., ACC/AHA guideline ACC/AHA/ASNCguidelines for the clinical use of cardiac radionuclide imaging — executivesummary, J. Am. College Cardiol. 42 (2003) 1318–1333, https://doi.org/10.1016/S0735-1097(03)01090-8.
[12] P. Lancellotti, J.L. Zamorano, G. Habib, L. Badano, The EACVI Textbook ofEchocardiography, 2nd ed., Oxford University Press, Oxford, UK, 2017.
[13] T.A. Fuchs, J. Stehli, M. Fiechter, et al., First experience with monochromaticcoronary computed tomography angiography from a 64-slice CT scanner withGemstone Spectral Imaging (GSI), J. Cardiovas. Comput. Tomog. 7 (2013) 25–31, https://doi.org/10.1016/j.jcct.2013.01.004.
[14] J. Leipsic, T.M. Labounty, B. Heilbron, et al., Adaptive Statistical IterativeReconstruction: Assessment of Image Noise and Image Quality in Coronary CTAngiography, 2010, pp. 649–654. https://doi.org/10.2214/AJR.10.4285.
[15] M.D. Cerqueira, N.J. Weissman, V. Dilsizian, A.K. Jacobs, S. Kaul, W.K. Laskey, D.J. Pennell, J.A. Rumberger, T. Ryan, M.S. Verani, Standardized myocardialsegmentation and nomenclature for tomographic imaging of the heart: astatement for healthcare professionals from the cardiac imaging committee ofthe council on clinical cardiology of the American heart association,Circulation 105 (2002) 539–542, https://doi.org/10.1067/mje.2002.123374.
[16] G.L. Raff, Abidov A Chair, et al., SCCT guidelines for the interpretation andreporting of coronary computed tomographic angiography, J. Cardiovas.Comput. Tomog. 3 (2009) 122–136, https://doi.org/10.1016/j.jcct.2009.01.001.
[17] E.D. Nicol, J. Stirrup, E. Reyes, et al., Sixty-four-slice computed tomographycoronary angiography compared with myocardial perfusion scintigraphy for

A. Ruiz-Muñoz, F. Valente, L. Dux-Santoy et al. IJC Heart & Vasculature 32 (2021) 100721
the diagnosis of functionally significant coronary stenoses in patients with alow to intermediate likelihood of coronary artery disease, J. Nucl. Cardiol. 15(2008) 311–318, https://doi.org/10.1016/j.nuclcard.2008.02.017.
[18] E.R. DeLong, D.M. DeLong, D.L. Clarke-Pearson, Comparing the areas under twoor more correlated receiver operating characteristic curves: a nonparametricapproach, Biometrics 44 (1998) 837–845, https://doi.org/10.3847/0067-0049/227/2/20.
[19] T.A. Magalhaes, S. Kishi, R.T. George, et al., Combining coronary angiographyand myocardial perfusion by computed tomography in the identification offlow-limiting stenosis – the CORE320 study: a coronary CTA/myocardial CTPintegrated analysis, Am. J. Cardiol. 116 (2016) 379–383, https://doi.org/10.1016/j.amjcard.2015.04.051.Predictors.
13
[20] J.J. Linde, J.T. Kühl, J.D. Hove, et al., Transmural myocardial perfusion gradientsin relation to coronary artery stenoses severity assessed by cardiacmultidetector computed tomography, Int. J. Cardiovasc. Imag. 31 (2014)171–180, https://doi.org/10.1007/s10554-014-0530-9.
[21] S.M. Ko, M.G. Song, H.K. Chee, et al., Diagnostic performance of dual-energy CTstress myocardial perfusion imaging: direct comparison with cardiovascularMRI, Am. J. Roentgenol. 203 (2014) W605–W613, https://doi.org/10.2214/AJR.14.12644.
[22] G.M. Feuchtner, F. Plank, C. Pena, et al., Evaluation of myocardial CT perfusionin patients presenting with acute chest pain to the emergency department:comparison with SPECT-myocardial perfusion imaging, Heart 98 (2012) 1510–1517, https://doi.org/10.1136/heartjnl-2012-302531.